 1 Current Path
Feedback welcome
Our aim is to use the best data to inform our analysis. See our Technical page for information on the IFs forecasting platform. We appreciate your help and references for improvements via our feedback form.
In this theme, we discuss and analyse Africa’s development trajectory since independence and then present a forecast to 2043, the end of the third ten-year implementation plan of the African Union’s Agenda 2063. It assumes that no major transformative shifts or shocks would occur, i.e. Africa would proceed under a “business-as-usual” trend.
Our forecasts indicate that, on the current economic development trajectory, the growing divergence between Africa and the rest of the world, using a measure such as average GDP per capita, is likely to increase. Progress is being made in Africa, but at a slower pace compared to other regions, with significant variations from country to country.
This context sets the scene for the ambitious improvements modelled in our sectoral scenarios, as discussed in the THEMATIC drop-down menu. Each theme deals with a specific sector. Collectively, these themes cover all key aspects relating to Africa's development, ranging from demographics to the potential to leapfrog. The Combined scenario then presents Africa’s development potential. Elsewhere, in the theme on Africa in the World, we model and discuss how global developments could impact Africa in various scenarios. Other themes deal with employment, climate, energy and gender.
Please see the Technical page for more information about the International Futures (IFs) modelling platform we use for the modelling of the various sectors and scenarios.
Summary
We begin this page with an introduction explaining what the Current Path is and explore Africa’s Diversity as the basis of our assessments.
- The “Current Path” is a baseline forecast assuming no major transformative changes, highlighting historical trends and relationships between key parameters. It provides a foundation for modelling interventions in different sectors and then to compare their impact. The Current Path is unique to each country. It initialises from individual country-level data and is affected by the set of relationships between the various sectors relevant to that country.
- Africa is home to 54 sovereign countries, 1.4 billion people, 3 000+ languages and diverse climates, ranging from deserts to rainforests. Economic disparity is large, with the World Bank classifying the continent as consisting of 22 low-income, 24 lower-middle-income, eight upper-middle-income, and one high-income (Seychelles) country.
- Challenges from colonial legacies, artificial borders and governance issues are juxtaposed with rising potential through the implementation of the African Continental Free Trade Area (AfCFA) and digital innovation.
Next, we assess the current trends in economic size, population and growth rates.
- Africa’s share of the global economy remains at about 3% despite population growth to 2.3 billion by 2043.
- Rapid population growth outpaces economic opportunities, leaving many reliant on the informal sector.
- Africa’s GDP per capita lags significantly behind global averages and continues to decline relatively.
The subsequent sections discuss challenges including poverty, inequality and foreign investment.
- Extreme poverty rates are declining (29% in 2023 to 18% by 2043) but absolute numbers remain high due to population growth and relatively modest economic expansion.
- Africa will miss the 2030 Sustainable Development Goal (SDG) to reduce extreme poverty to below 3%, with Central Africa most affected. North Africa has, however, eliminated extreme poverty.
- High inequality across Africa, particularly in wealth distribution, slows poverty reduction and exacerbates instability. Southern Africa is the most unequal globally, while North Africa benefits from high levels of basic services traditionally provided by the state.
- State-led development efforts in much of Africa failed due to Cold War conflicts, colonial legacies and the 1970s economic crisis. Efforts to assist, such as Structural Adjustment Programs (SAPs) that prioritised austerity over development, worsened poverty and underdevelopment.
- Aid declined after 1990 due to shifting geopolitical priorities but revived post-2000 with global initiatives like the Millenium Development Goals (MDGs). These had mixed success, often being poorly tailored for Africa, while the SDGs and the African Union Agenda 2063 set the current development focus.
- Africa’s strongest growth (1994–2008) stemmed from a commodities boom rather than from economic diversification and improvements in productivity.
- Nearly half of African countries rely on commodities, exposing economies to price volatility and governance challenges.
- Renewable energy demand boosts interest in African resources but climate change exacerbates vulnerabilities.
- In the meanwhile Africa continues to have high debt levels due to perceptions of risk, poor governance and instability.
- Governance challenges and rapid urbanisation drive instability, exacerbated by organised crime and weak state presence.
The following sections highlight key findings from the associated Sectoral Forecasts which are modelled in separate themes on the website to explore both likely outcomes (the Current Path) and ambitious scenarios. We also discuss the change in African narratives .
- In time, Africa’s youthful population presents a potential demographic dividend but realising that depends on investments in health, education and infrastructure, alongside managing rapid urbanisation and migration.
- Agriculture remains underperforming while manufacturing is stagnating. The service sector dominates but is largely informal. Diversification and regional trade integration are critical for economic transformation.
- Closing Africa’s US$100 billion annual infrastructure gap is vital for competitiveness. Renewable energy and digital innovation offer transformative opportunities, especially for the continent’s tech-savvy youth.
- Improved governance and better financial management are essential for attracting investment, reducing corruption and accelerating development. Africa needs more capital, hence the importance of Foreign Direct Investment (FDI), remittances and aid to bridge its large funding gaps.
- Africa faces a dilemma: It must balance rising energy demands, end energy poverty and decarbonising for global climate goals, despite its vast fossil fuel and critical mineral reserves essential to close the energy production-demand gap.
- External perceptions of Africa are shifting, driven by its rapid population growth, cultural movements and emerging voices that emphasise Africa’s potential over dependency narratives.
We end this page with a conclusion that sets the scene for the modelling and forecasts contained in various themes. Africa’s current growth trajectory is inadequate to meet its developmental goals. Strategic investments in health, education, renewable energy, governance and regional integration are essential for unlocking the continent’s potential. Further, empowering women, leveraging digital innovation and addressing climate resilience are critical priorities. Trade and eventually political integration are key to to drive sustainable growth, reduce poverty and enhance Africa’s global influence.
All charts for Current Path
- Chart 1: Population distribution map for Africa
- Chart 2: Regional Economic Community membership
- Chart 3: GDP per capita for Africa and the rest of the world, 1960-2043
- Chart 4: Size of African economy and population as a % of the world's, 1960-2043
- Chart 5: Extreme poverty, using US$2.15 threshold, 1990-2043
- Chart 6: Gini index by African country, 2023
- Chart 7: Foreign aid,1960-2043
- Chart 8: Commodity dependence in Africa, 2021
- Chart 9: Government debt as a % of GDP, 1990-2023
- Chart 10: Fatalities from armed conflict per million people, 2000-2023
- Chart 11: Average urbanisation rate 2020 to 2050
- Chart 12: Demographic dividend and youth bulge, 1960-2043
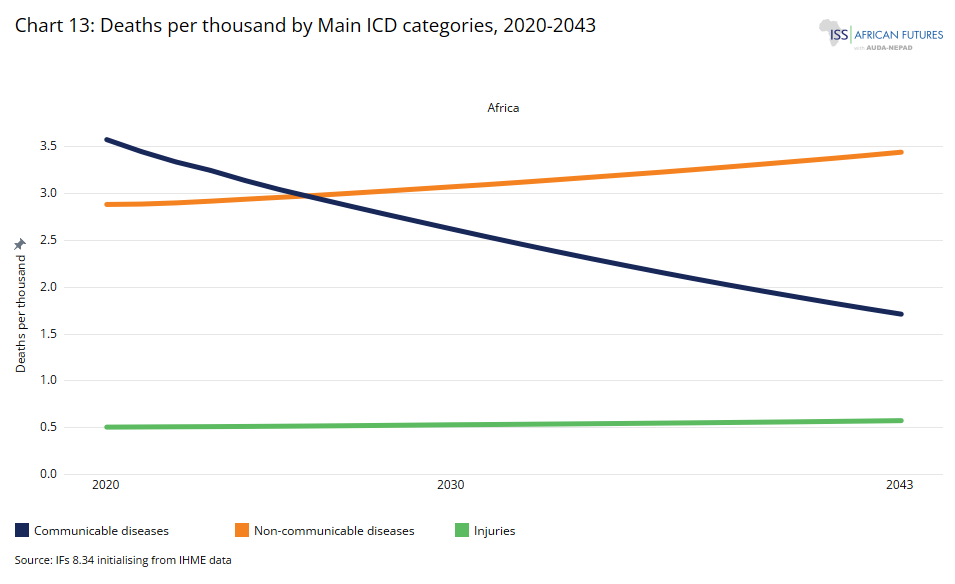
- Chart 13: Deaths per thousand by Main ICD Categories, 2020-2043
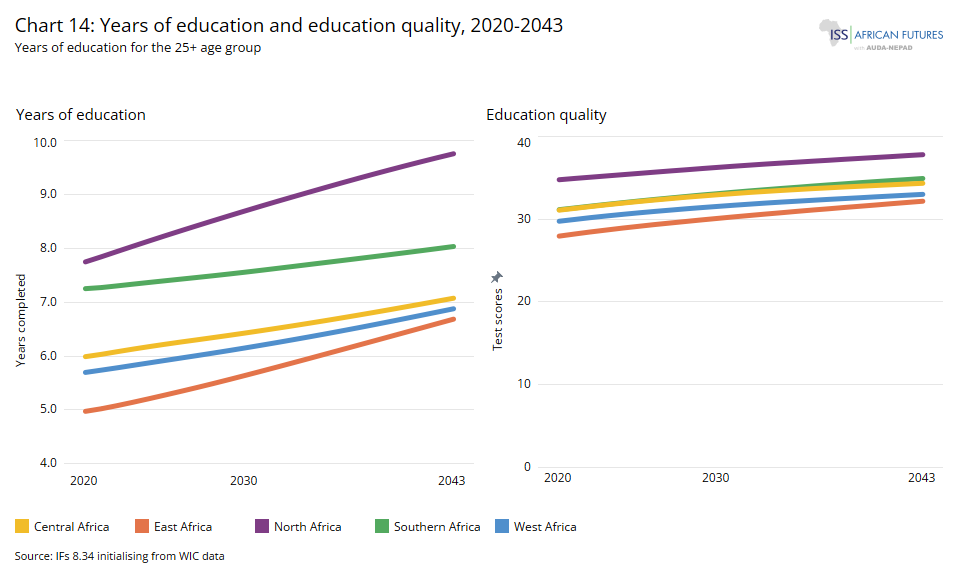
- Chart 14: Years of education and education quality, 2020-2043
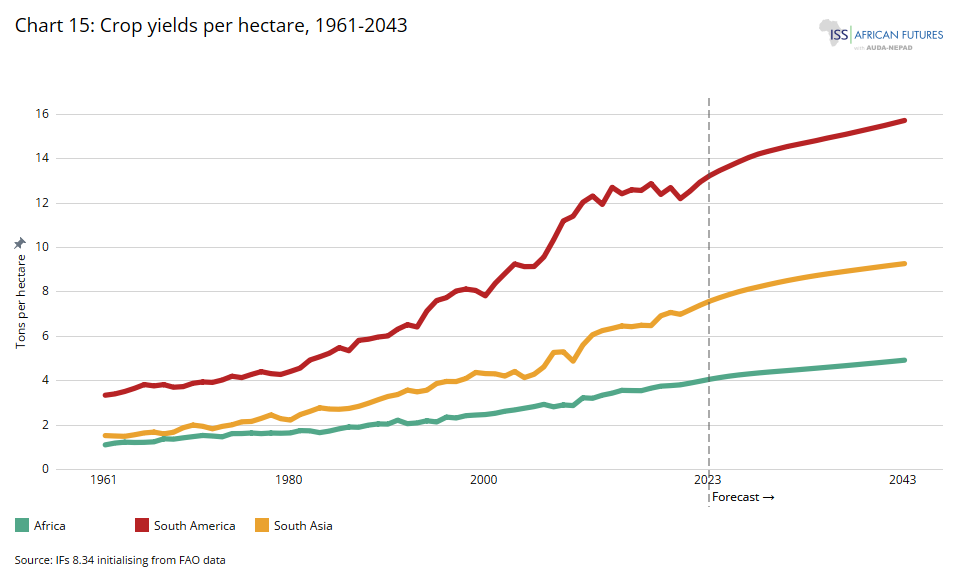
- Chart 15: Crop yields per hectare, 1961-2043
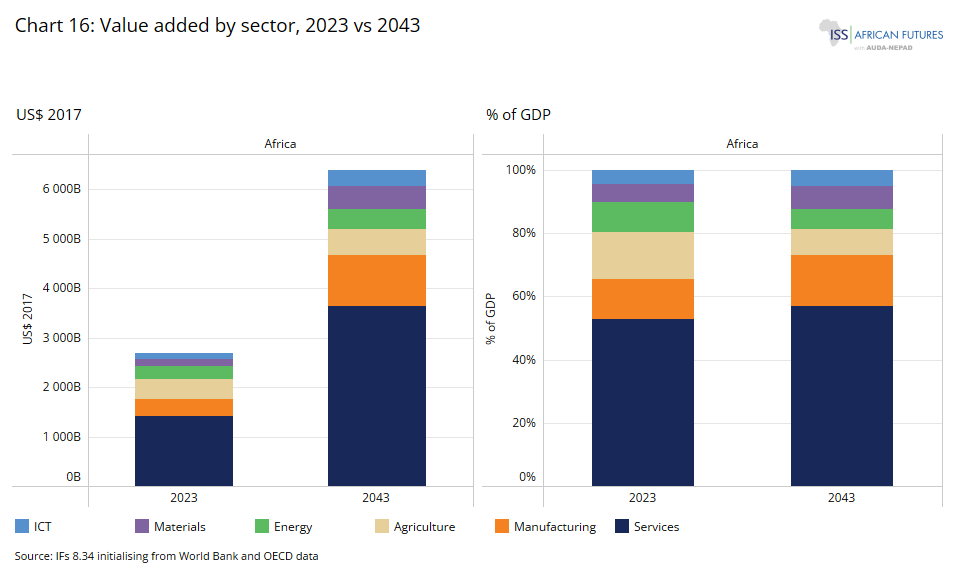
- Chart 16: Value-added by sector, 2023 vs 2043
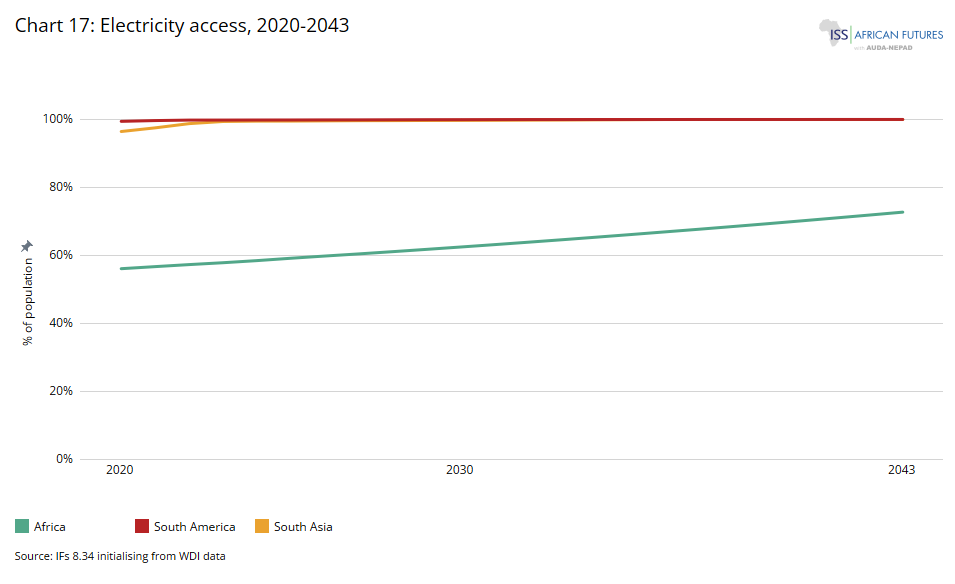
- Chart 17: Electricity access, 2020-2043
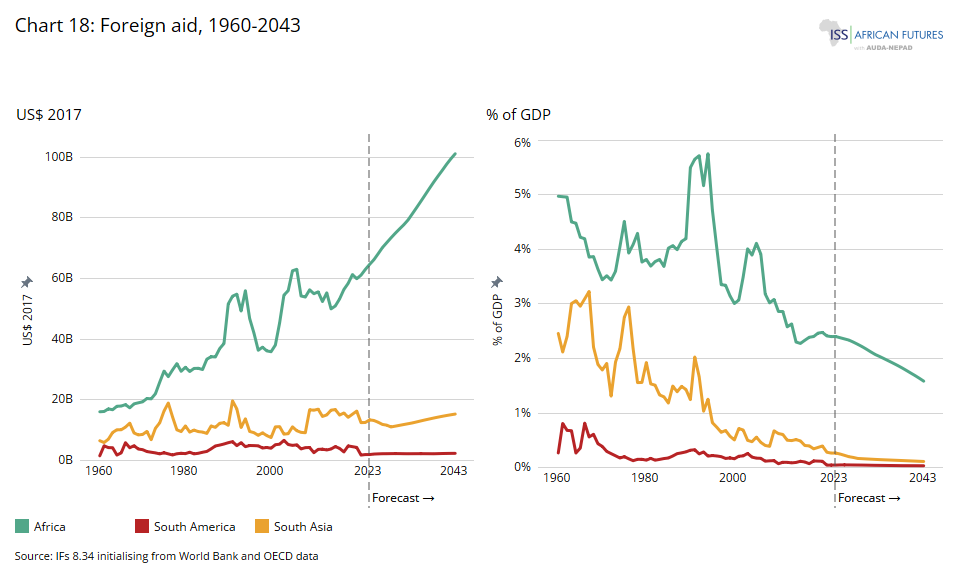
- Chart 18: Foreign aid, 1960-2043
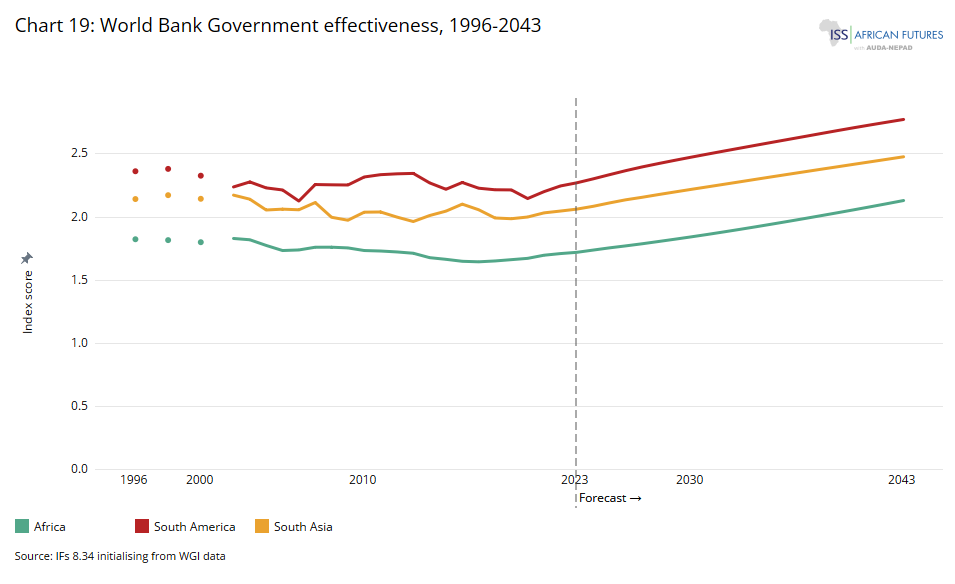
- Chart 19: World Bank government effectiveness, 1996-2043
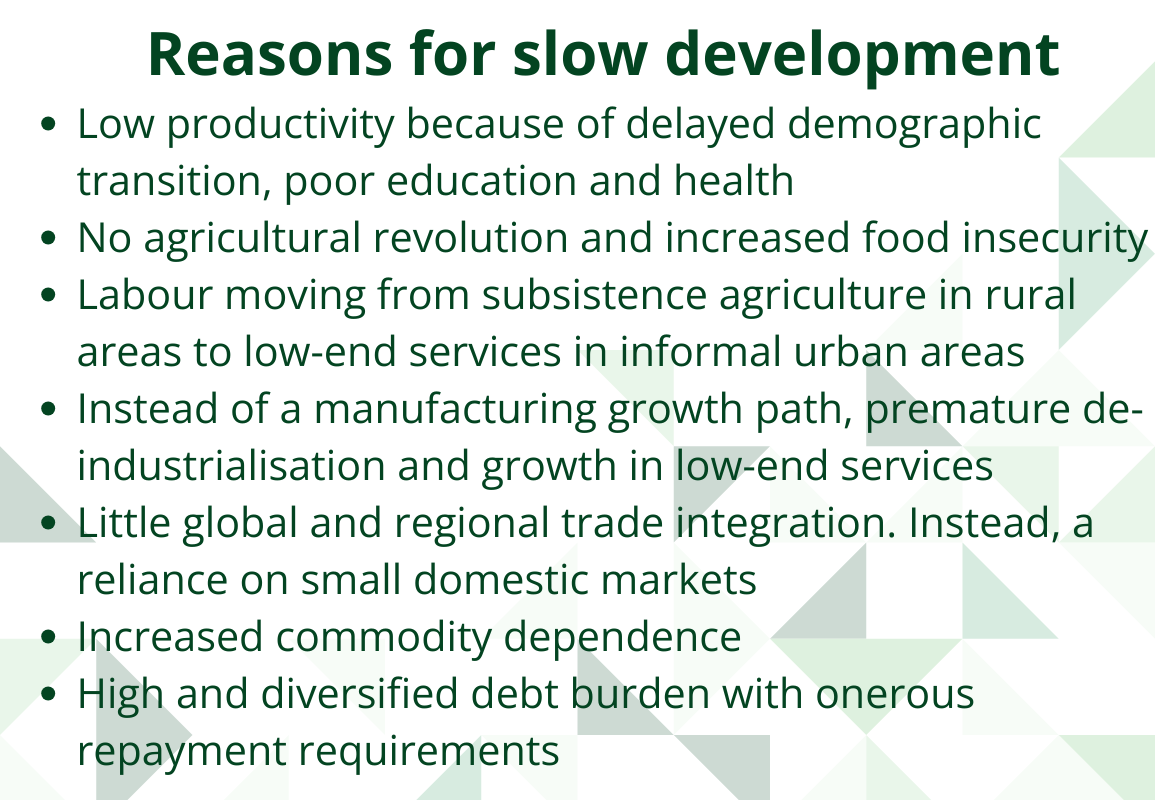
- Chart 20: Summary reasons for slow development in Africa
The Current Path on this website represents the default forecast for African countries' development, using the International Futures (IFs) forecasting platform hosted and developed by the Frederick S Pardee Institute for International Futures at the University of Denver, United States. For details about IFs, visit the Technical page.
The Current Path is based on recent conditions and policy trends and assumes that no major transformative shifts or disruptions would occur. It uses historical data from a large number of global data providers to project future outcomes in areas like demographics, education, the economy and human development under a “business-as-usual” scenario. The forecasts are based on the integrated relationships between parameters such as urbanisation and growth based on from peer-reviewed academic literature.
In the Current Path, African countries would develop in line with historical trends, meaning that the continent would experience the same number of droughts, years of bountiful agricultural potential and demand for its commodity exports that it has experienced in recent years, but within a global context including the effects of climate change and slower economic growth following the rise in global tensions compared to before the 2007/8 global financial crisis. Ongoing data imports into updated versions of the IFs software steadily capture these trends.
The Current Path is not a linear forecast, but a dynamic representation of the future that benefits from the integrated nature of the IFs forecasting platform and the interrelated effect of national level forecasts for 193 countries globally.
Whereas the various thematic pages on this website take a sectoral or issue-specific approach to Africa (such as health or work/employment), the geographic pages present the future of a particular country or group (such as Nigeria or the Southern African Development Community).
Setting out the Current Path is important since it allows us to measure the impact of improvements in particular sectors on a business-as-usual future for each country, such as in agriculture, and the effect that these have on challenges and opportunities. It serves as a baseline for comparing the impact of the modelling done in each of the sectors for each country which we refer to further below, such as in demographics and health, as well as the impact of particular policies such as the advancement of more gender equity.
By recognising the varied political, economic, social, technological, and governance landscapes across Africa, the Current Path - and the comparison to our sectoral scenarios - provides insights on the comparative impact of interventions in different sectors, although there is inevitably a requirement for a comprehensive approach to development. It empowers policymakers to envision a “business-as-usual” future compared to transformative pathways in different sectors, offering opportunities to shape sustainable growth and human development across Africa’s complex and dynamic environment.
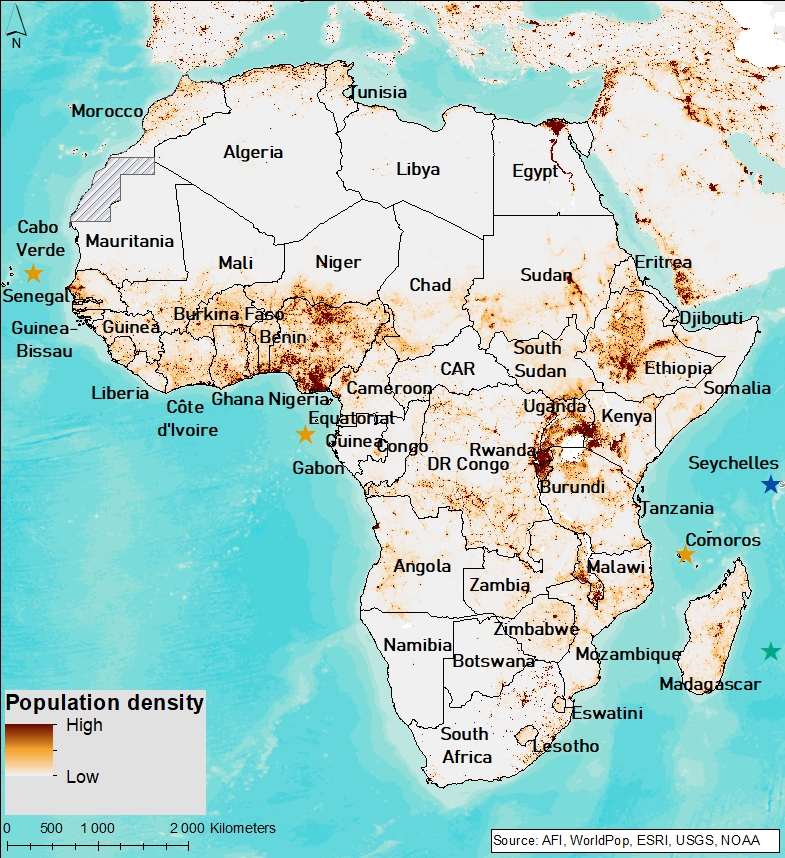
Chart 1 shows a population distribution map for Africa.
Africa is a continent of profound diversity. Home to 54 sovereign countries (55 if Western Sahara/Sahrawi Arab Democratic Republic is included) of which 46 are considered to be in sub-Saharan Africa. With a 2023 population exceeding 1.4 billion people (Chart 1), more than 3 000 languages are spoken in Africa, most of which have roots in seven major language families.
Using the 2024/5 income classification of the World Bank, Africa has 22 low-income countries, 24 lower-middle-income countries, eight upper-middle-income countries and one high-income country, Seychelles.
Africa is the world's most tropical continent, with the equator dividing it in two - a symmetrical division with half of the continent lying north and half lying south of the equator. Around this stable equatorial region, the climate further afield varies widely, ranging from hot deserts to icy glaciers, and from rainforests to grassy plains. The central part of Africa has a wet tropical climate with heavy rainfall, while regions like the Sahel (Burkina Faso, Chad, Eritrea, Mali, Mauritania, Niger, Nigeria, Senegal and South Sudan) experience longer dry periods and occasional droughts. The Sahara Desert in the north has little to no rainfall, whereas the Kalahari Desert in the south receives a little summer rainfall due to cool and moist air masses from the Atlantic ocean. The northern and southern edges of the continent have a Mediterranean climate characterised by hot dry summers and moist winters.
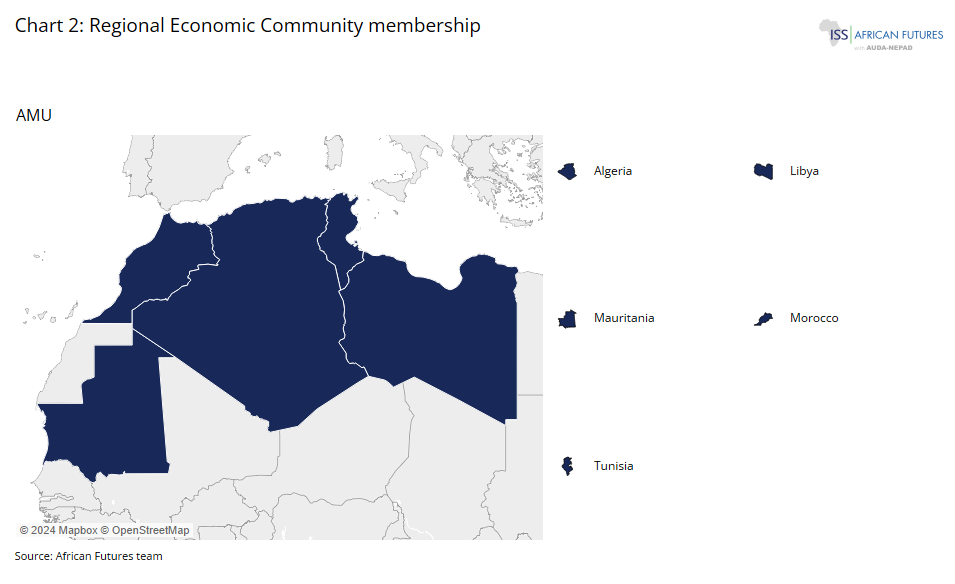
Central to Africa's economic narrative are its regional economic communities (RECs), as depicted in Chart 2. The African Union recognises eight, the Southern African Development Community (SADC), the East African Community (EAC), the Economic Community of West African States (ECOWAS), the Intergovernmental Authority on Development (IGAD), the Economic Community of Central African States (ECCAS), the Arab Maghreb Union (AMU), the Common Market for Eastern and Southern Africa (COMESA) and the Community of Sahel-Saharan States (CEN-SAD). The RECs should play crucial roles in facilitating economic cooperation, trade, and regional integration, fostering a spirit of unity and collective growth and we model and forecast the development potential of each. However, some, such as CEN-SAD and AMU, are effectively moribund, others, such as IGAD, hamstrung by conflict or disputes amongst members while ECOWAS is faced with the potential withdrawal of some of its members following a spate of coups in the region.
All African states are members of the African Union (AU) which drives the continent's agenda for peace, security, political integration, economic growth and sustainable development. Its flagship initiative, the African Continental Free Trade Area (AfCFTA), operational since 2021 (but still in the early stages of full implementation), aims at fostering economic integration and boosting intra-African trade, creating the world's largest free trade area when considering the number of countries involved. This monumental effort seeks to catalyse economic growth, enhance competitiveness, and lift millions out of poverty by boosting intra-African trade, diversifying exports away from commodity goods and attracting investment.
It is ironic that Africa’s status as the origin of the human species constrained its subsequent development. Once homo sapiens left the continent, they multiplied and developed, competed and multiplied. Thousands of years later, Africa’s high disease burden meant that it was unable to gain the population densities that eventually drove development elsewhere. Even today, the continent is more rural compared to other regions and its infectious disease burden is still the highest globally. The most important impact was that Africa did not require agricultural production to sustain a large population and without growth in agriculture, other development did not follow.
Instead, Africa eventually served as a source of slaves and riches for successive centuries that fueled development elsewhere. Up to the 14th century development in Africa largely tracked Europe but then, as population numbers and densities increased elsewhere, did not in Africa. The indigenous, Arab, European and Transatlantic slave trades, from the mid-7th century to the 19th century, had a devastating impact on the African continent. Slavery and imperialism meant that African societies remained more dispersed and mobile than others, allowing the continent to be colonised and divided. To compound the growing divergence, the subsequent Industrial Revolution spurred growth and development in Europe and subsequently in the United States, but not in Africa which rapidly fell behind which was eventually colonised, most famously occurring with the 1884/5 Berlin Conference when it was partitioned into spheres of influence for various European powers, ignoring existing African boundaries and kingdoms. Although colonialism was relatively brief, it left an indelible imprint.
Decolonisation and independence marked a period of struggle for African nations as they sought to reclaim sovereignty and build cohesive states amidst the challenges left by colonial rule. The Cold War added further complexity, turning Africa into a battleground for superpower rivalries, exacerbating conflicts and shaping governance models.
More than half a century after the end of colonialism, most African states continue to struggle with their artificial origins - the African state being an external imposition and not having been established as a result of domestic processes that would have forged national identities.
Political instability, conflict and governance issues pose substantial obstacles to development given the extent to which the continent served as a pawn in global politics. Moreover, today climate change, to which Africa has contributed little, impacts threaten agriculture, water resources and livelihoods, exacerbating food security concerns and displacement.
In the 21st century Africa continues to face ongoing challenges but also significant opportunities such as its recent membership of the Group of 20. African voices in the media, the digital revolution and cultural movements are transforming Africa’s role in global affairs, enhancing its influence and fostering greater unity across the continent.
The African Futures and Innovation program focuses on producing tailored, data-driven forecasts for each African country and region across multiple sectors. On this website we provide:
- Individual forecasts and scenario reports for each African country,
- regional reports for North Africa, sub-Saharan Africa and Africa as a whole,
- reports for all eight Regional Economic Communities,
- a report that compares the four country income groups, and
- seventeen thematic and impact reports, such as on Education, Work/Jobs and Africa in the World.
In the next section we start with a brief review of economic size, using Gross Domestic Product (GDP). It is the total monetary or market value of all the finished goods and services produced within a country's borders in a specific time period. GDP is a comprehensive measure of a nation’s overall economic activity and is often used to compare the economic performance of different countries. The forecasts of GDP used on this website include estimates as to the contribution of the informal sector which may be modelled or initialised from official data.
Then, we review GDP per capita and extreme poverty, two useful macro-indicators of economic progress at national level and discuss the relationship relating to inequality and the contribution made by trade and globalisation.
In this discussion we review trends since 1960, generally considered the start of Africa’s independence period, and use 1990, 2023 and a forecast to 2043 (our forecast horizon, which is the end of the third 10 year implementation plan of the African Union Agenda 2063) as key data points, where possible.
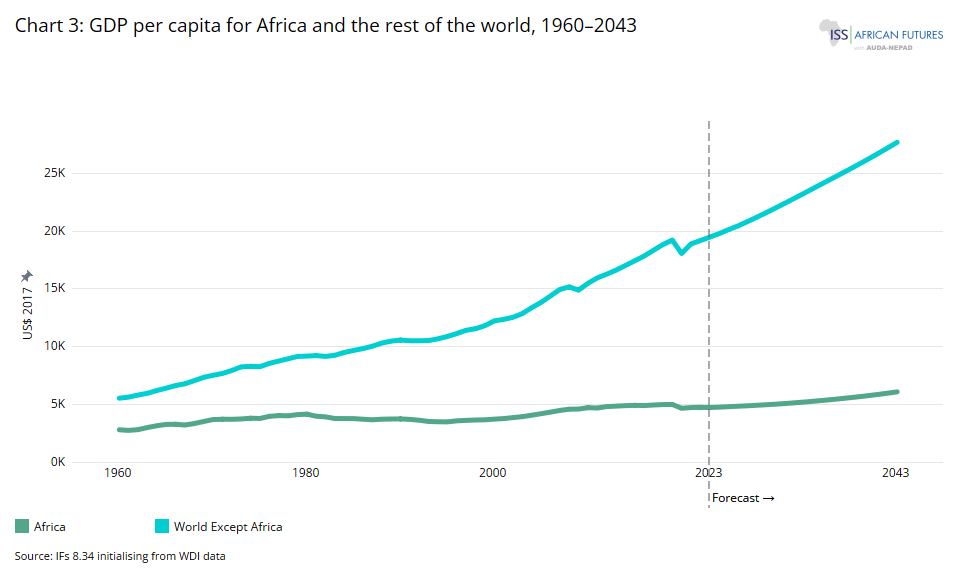
Chart 3 shows the gross domestic product (GDP) per capita for Africa and the rest of the world, from 1960 to 2043.
In absolute numbers, the increase in the absolute size of the African economy is impressive. In 1960, it was US$319 million, and, by 1990, it had increased to US$939 billion and to US$2.7 trillion in 2023. On the Current Path, it will grow to US$6.4 trillion in 2043. But Africa's share of the global economy has remained stagnant at around 3% from 1960 to the present day, despite the continent's population nearly doubling from 283 million (9% of the global population) in 1960, to 1.47 billion (16%) in 2023 and likely to 2.3 billion in 2043 (25%). The total African economy will marginally increase to 3.3% of the world economy by 2043, although its share of the global population is much larger. This contrasts with regions like East Asia, which saw its share of global economic output increase from about 9% in 1960 to over 25% today, with further growth anticipated.
For several decades, South Africa had the largest economy in Africa, followed by Nigeria and Algeria, but in 1990, the Egyptian economy replaced Algeria as the third-largest economy, and the Nigerian economy is now the largest, measured in market exchange rates. By 2043, Nigeria, Egypt, South Africa, Ethiopia and Kenya will constitute the five largest economies in Africa. In contrast to these large countries, the economies of 21 countries were below US$10 billion each in 2023, offering little opportunity for attracting large inflows of foreign direct investment or the growth of businesses, given the limited market size.
The contribution of the informal economy ranges from 54% of GDP in Zimbabwe, followed by Tanzania at 45%. As expected, Seychelles has the smallest informal sector, contributing less than 9% to GDP, given its status as Africa’s only high-income economy. The size of the informal sector and the size of the labour force engaged in that sector are difficult to measure, and data needs to be treated with care, even in those countries with well-established national statistics departments.
Nigeria, Ethiopia, Egypt and the Democratic Republic of Congo (DR Congo) are the most populous countries in Africa. Nigeria had a population of more than 200 million people in 2023, while the other three had populations of more than 100 million people. In 2043, Nigeria’s population size will overtake the United States to become the country with the third-largest population in the world. Most African countries have much smaller populations. In 2023, the continent includes 21 countries, each with a population below 10 million. Comoros, Cape Verde, Sao Tome and Principe, and Seychelles had fewer than a million people each in 2023.
In the Current Path, the African economy will grow at an average of about 4.4% from 2024 to 2043, while the population increases at a rate of 2.2%, resulting in slow per capita income growth at an average of only 1.3%, translating into modest reductions in poverty, discussed separately below. Growth in the size of the labour force generally outstrips the supply of formal employment, leading to a dependence on the informal sector for survival.
Similar to real GDP, GDP per capita (using purchasing power parity) is a blunt measure of development progress. It often comes in for criticism because it does not take the quality of life or the distribution of economic output among the population into account. But it remains popular given its simplicity and reliance upon readily available data. It also allows for easy comparisons between different countries and regions.
In 1960, GDP per capita in Africa was about half of the average in the rest of the world. More than half a century later, in 2023, it had declined to only 28% of the average in the rest of the world. It will likely further decline to 27% over the next two decades. In absolute terms, the gap is forecast to increase from US$12 080 in 2023 to US$16 391 in 2043, as shown in Chart 3.
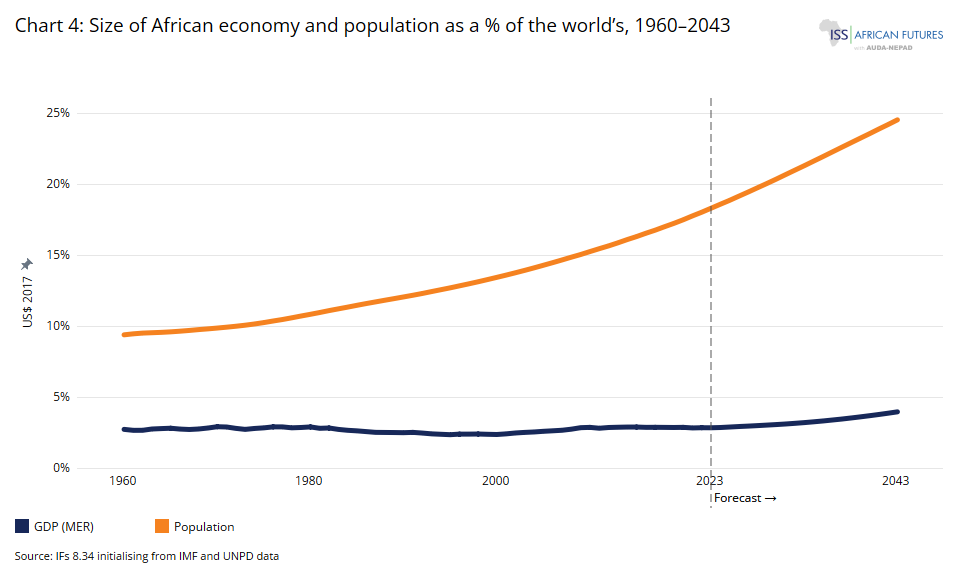
Chart 4 depicts the size of the African economy and population as a percentage of the world's, from 1960 to 2043.
Africa's comparative developmental performance has been dismal even when considering other developing regions around the world, such as South America[x] and South Asia.[x] In 1960, the GDP per capita of Africa was more than double that of South Asia and 44% of South America. But by 2023, Africa had lagged behind these regions, putting its GDP per capita at only 73% of South Asia and 32% of South America’s GDP.
The challenge of the growing divergence between Africa and the rest of the world is reflected in Africa’s marginal role in the global economy (Chart 4). In 1960, Africa accounted for 3% of the global economy. Sixty years later, that share remains unchanged, even though Africa’s share of the global population has almost doubled. By 2043, Africa’s population will account for a quarter of the world’s population but represent just 4% of the global economy.
There are, of course, significant country variations. Some countries, such as the DR Congo and Zimbabwe, through poor governance, have seen a generational loss of wealth and prosperity. In contrast, Botswana’s current GDP per capita is 20 times larger than it was in 1960 and Equatorial Guinea has similarly seen a large increase due to its oil wealth, much of it going to a single family.
The increasing divergence between the trend in GDP per capita in Africa versus the average for the rest of the world correlates with many other indices of human development or well-being, such as average levels of education and various health measures.
Compare this to East Asia[1Consisting of China, Hong Kong, Japan, North Korea, South Korea, Mongolia and Taiwan.], a region that increased its share of global economic output from about 7% in 1960 to more than 26% today and is set to increase that portion to 29% by 2043. However, East Asia’s share of the global population has shrunk from 27% in 1960 to 21% in 2023. It will decline to below 17% by 2043, pointing to its much more productive economies.
Historically, Africa's economic structure has been heavily oriented towards the export of raw materials and natural resources, largely a legacy of colonial policies designed to serve the needs of imperial powers, but also because of poor policies and bad domestic governance. This reliance on exporting unprocessed goods (and the extent to which Africans allowed these arrangements) limited the development of local industries and value chains, restricting economic diversification and the continent's ability to capture added value from its natural resources. As a result, African economies have often been vulnerable to fluctuations in global commodity prices, impacting growth and development. In addition, countries that receive a large portion of their income from resources suffer from a “resource curse”, where natural resource wealth consolidates elite bargains in weakly institutionalised contexts through exacerbating inequality (driving down median income levels). These rents also fund the suppression of civil liberties and undermine citizens’ abilities to hold their governments accountable. As a result, Africa’s high levels of commodity dependence negatively affect democracy.
The fact that much of Africa’s recent growth since 1996 was enabled by the commodities supercycle instead of the more productive (re)structuring of its economies has therefore taken the continent backwards in terms of governance and the quality of growth.
What made this commodities cycle so powerful was that the prices for oil, base metals and agricultural produce all started to increase at roughly the same time. It was, therefore, generally a stronger and more uniform up and down than previous supercycles, lifting economic growth across all regions in the world, including in Africa, resulting in rapid growth until the 2007/08 global financial crisis. Shortly thereafter, the Arab Spring caused a brief spike in oil prices.
In recent years, COVID-19 has had a particularly devastating impact on well-being. On average, Africans will only recover to their 2019 pre-pandemic income levels in 2027. The rest of the world did so in 2022. Thus, COVID-19 cost the continent eight years of income growth, with many people still scrambling to make ends meet. Starved of vaccines and with limited financial means to alleviate its impact, Africa recovered more slowly from the impact of COVID-19 than other regions and the slow recovery is fueling instability.
We, therefore, find ourselves in a situation where things are improving in Africa but more slowly than in other comparable developing regions, such as South America and South Asia.
Something drastic is needed to change this rather dismal forecast. Doing more of the same will not lead to tangible progress. Some health indicators — such as declining rates of infant mortality, improvements in life expectancy and so on — show that Africa is experiencing a broad-based improvement in human well-being and is even catching up with global averages to some extent. However, this is largely because rapid improvements at lower levels of development are easier to achieve, while continued improvements in rich countries are more difficult at their much higher levels. On most other well-being indicators, the gap between Africa and the rest of the world is either static or widening.
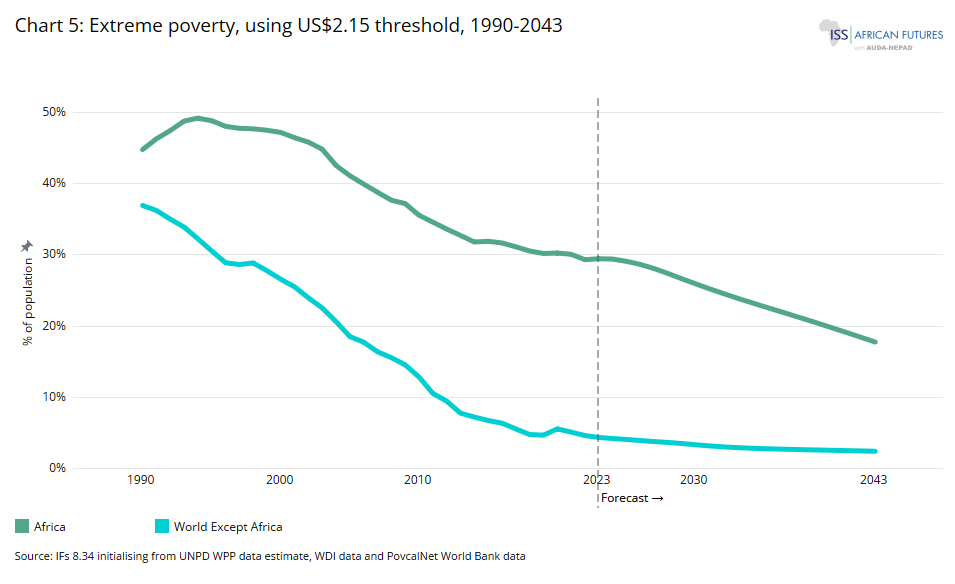
Chart 5 shows extreme poverty from 1990 to 2043, using the US$2.15 threshold.
Due to Africa’s rapid population growth, modest rates of economic growth and relatively high levels of inequality, the absolute number of extremely poor people in Africa has steadily increased since 1960 and is likely to continue to do so for several years before slowly starting to decline. However, despite the increase in absolute (headcount) poverty, the percentage of people living in extreme poverty in Africa has declined since the early 1990s largely due to the growth associated with a global boom in commodities prices. Although economic growth on the continent slowed after the 2007/08 financial crisis and contracted sharply in 2020 owing to the COVID-19 pandemic, it has generally been robust enough to reduce the portion of Africans living in extreme poverty but not enough to reduce the absolute number.
Even before the recent war in Ukraine and the associated food supply and global growth implications detracted from current prospects, it was already clear that Africa would miss the SDG goal of eliminating extreme poverty (meaning the rate is below 3%) by 2030 by a considerable margin. In this, the widening gap between Africa and the rest of the world again becomes painfully clear. Things are improving in Africa but much slower than elsewhere. Actually, by 2030, Mozambique, Madagascar, Malawi, the Central African Republic, Burundi, the DR Congo and Lesotho are all likely to still have more than 50% of their populations living in extreme poverty (using the US$2.15 monetary poverty line).
In general, higher economic growth rates translate into higher rates of poverty reduction, but high levels of inequality limit the extent to which that can occur. If too large, wealth, income and consumption inequalities also constrain economic growth. They hinder educational opportunities, human capital formation and intergenerational mobility. A growing economy must increase the number of formal-sector jobs and the amount of money in circulation to provide more revenues to the government to invest in infrastructure, health and education (and hence improve the quality of its human capital), as well as for use in more direct measures of poverty alleviation such as through welfare programmes.
Of course, poverty does not look the same everywhere:
- It differs between and within countries. For example, in the eastern parts of DR Congo poverty looks quite different from that experienced in Mali or South Africa.
- It differs according to location. Rural Uganda's poverty differs from that in the capital city of Kampala.
- Poverty is different between men and women, and poverty among adults differs from that experienced by children. For example, since women tend to be disproportionately responsible for household chores and caregiving, poverty restricts girls’ time to stay in school. It also determines whether families can afford school fees, purchase supplies, or guarantee that their children can attend school when their help is needed at home, either to help generate income or to take care of household tasks.
- Different regions also use diverse measures to reflect poverty more accurately in their member states. For example, the European Union typically uses a relative poverty line set at 50% or 60% of the national median income.
As average income is quite a blunt instrument to view poverty, new approaches and definitions have been suggested and in widespread use. For example, the Multidimensional Poverty Index (MPI), is focused on tangible goods and services without which people might be defined as poor.
That being said, using the US$2.15 monetary extreme poverty threshold, 29% of Africa’s total population was considered extremely poor in 2023 — a ratio that will decline to 26% by 2030 and to 18% by 2043. Owing to rapid population growth the absolute numbers only change modestly. By 2043, 409 million Africans will live in extreme poverty compared to 437 million in 2023. By contrast, in 2043, extreme poverty in the rest of the world will only number 174 million, having declined by almost half from 292 million people in 2023.
Chart 5 presents extreme poverty in Africa from 1990, with a forecast to 2043. The user can toggle between absolute numbers and per cent of the population for different regions and countries. North Africa has effectively eliminated extreme poverty with the result that most extremely poor Africans live in Sub-Saharan Africa which is by far the region with the largest burden of extremely poor people globally.
Within the sub-Saharan region, Central Africa has the highest extreme poverty rate (average at 49% in 2023), followed by Southern Africa, Western Africa and Eastern Africa which has the lowest at 33%.
Eight African countries had extreme poverty rates above 50% in 2023, with Madagascar recording a 78% rate. Other countries with high rates include South Sudan, Burundi, Malawi and Mozambique, all above 70%.
Although the percentage of people living in extreme poverty has declined since the early 1990s, the absolute number continues to rise. The COVID-19 pandemic exacerbated the situation, pushing about 30 million more Africans into extreme poverty in 2020.
The continent's inability to reduce extreme poverty is attributed to factors such as over-reliance on natural resources, low asset ownership, restricted access to public services, bad governance, corruption and high-income inequality. High fertility rates also mean that economic growth translates into smaller per capita income increases. However, with the right policy interventions, significant reductions in extreme poverty could be achieved over the next two decades as we model in various themes on the website.
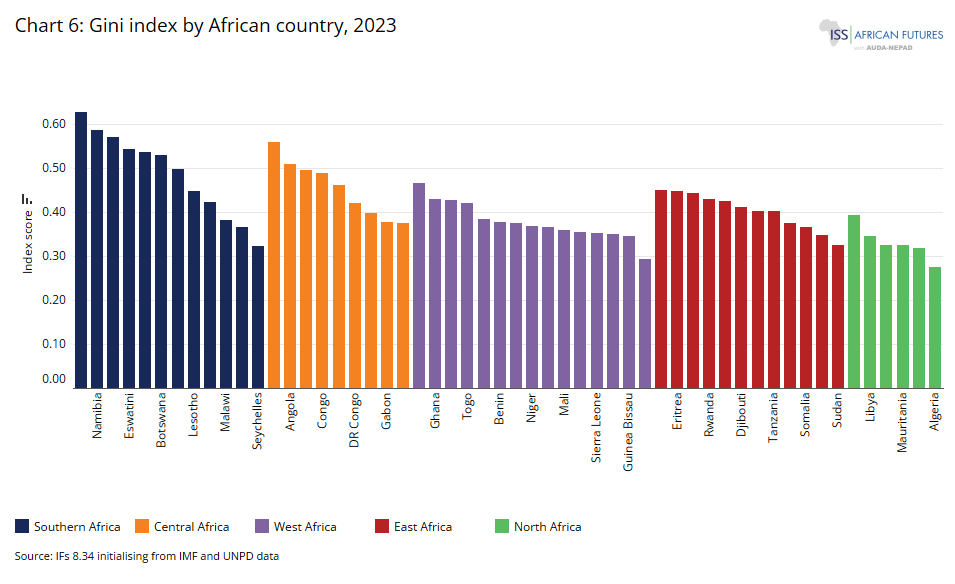
Chart 6 depicts the Gini index by African country for 2023.
In addition to modest economic growth, an important reason for Africa’s slow reduction in poverty is its relatively high levels of inequality.
The most widely used measure to express income distribution is the Gini index, which ranges from 0 to 1. A score of 0 corresponds to complete equality (i.e. everyone earns the same), whereas 1 represents complete inequality (i.e. all the income accrues to only one person in society). Being a summary measure of income distribution, the Gini index does not identify whether a change in inequality is triggered by shifts at the bottom, middle or top of the income distribution. In addition, it is based on survey data that is often unsuited to capturing very high or very low incomes. This challenge is particularly acute in many developing countries, which generally do not have much information on income distribution.
When comparing regions according to the Gini index (Chart 6), North Africa is significantly more equal than any other African subregion — largely a function of the central role that the state has played in providing all kinds of services and subsidies, often on the back of oil or gas income. Southern Africa is the most unequal region globally. Central, West and East Africa are somewhere between Southern and North Africa.
Another common way to measure inequality is the distribution of wealth such as done by the World Inequality Database that provides data on income inequality, average wealth and wealth inequality, often presented by gender. For example, in Europe the share of wealth held by the top 10% stood at 60.5% in 2022. This number is quite modest when compared to most other regions such as that 95% of net personal wealth in Sub-Saharan Africa is held by the top 10% and 78% in the Middle East and North Africa (MENA). In Latin America, generally considered the most unequal region globally, the number is “only” 78%. These are horrendous numbers and an important explanation of slow poverty reduction and instability in Africa.
Inequality is a complex phenomenon, well illustrated by the Freedom and Dignity Revolution (the Tunisian name for the so-called Arab Spring or Jasmine Revolution) that occurred in North Africa, despite its relatively high levels of development compared to the rest of the continent and low levels of inequality.
The promise of the Arab Spring has not alleviated the deep frustration among the citizenry. Tunisia is the only country in North Africa that transitioned to democracy but is now increasingly fragile. The progress in education, women’s rights and general positive macroeconomic indicators since independence several decades ago conceal deep frustration in a populace weaned on large state subsidies of petrol, water, food and a vast array of state-owned enterprises that now consume large amounts of revenue, fuel corruption and limit opportunity. Special interest groups constrain political, social and economic opportunity. The impact is to confine the vast majority of the population to dependence. It is no surprise that frustration continues to simmer. With little economic growth expected and an increasingly authoritarian leadership, the potential for violent disruption is high.
These concerns and caveats aside, countries with low levels of inequality, such as Ethiopia, with a stronger bureaucracy can generally grow rapidly and translate that growth into extraordinary reductions in poverty should it benefit from capable, developmental leadership as happened with Prime Minister Meles Zenawi. This is until his unexpected demise, a subsequent leadership transition and its ethnic divisions rise to the fore, as happened in Tigray in 2020. Much more is required than economic growth, of course.
For example, in the early 1960s, GDP per capita in Ghana was more than three times above Botswana. Since then Botswana has consistently grown its economy more rapidly than Ghana to the extent that GDP per capita was roughly similar in 1973. A decade later, in 1983, the GDP per capita of Botswana was three times higher than that of Ghana, fully reversing the situation from the early 1960s. The reason is that the average growth rate for Botswana from 1961 to 1999 was 10.1%, whereas for Ghana it was only 2.5%. However, because Botswana has higher levels of inequality, poverty reduction in the two countries does not differ as much as expected. From 1970 to 1996, poverty in Botswana declined by 25 percentage points and by 14 percentage points in Ghana (using the US$2.15 poverty line).
Whereas Botswana is generally an island of stability and good governance in its region, Ghana has suffered from a series of coups, significant political instability and high levels of corruption for much of its independent history.
In recent history, development efforts in and for Africa have evolved through various phases, reflecting shifts in global economic policies, governance models and the continent’s own aspirations. In the early post-independence era, many African countries sought rapid progress and adopted state-led development models, focusing on early industrialisation, infrastructure development and the nationalisation of key industries. These efforts were influenced by the prevailing economic ideologies of the time and the need to assert economic sovereignty after colonial rule.
However, by the 1970s, little had come of these efforts. Instead, Africa had hosted numerous proxy wars sponsored by the opposing sides of the Cold War and former colonial overlords and had also suffered from the oil and debt crises. Southern Africa and the Horn were particularly challenged: Portugal still retained its various colonies, such as Angola and Mozambique, and Namibia was under the control of apartheid South Africa, which, in alliance with Rhodesia (today Zimbabwe) violently resisted efforts at majority rule. The continent was seriously affected by the proxy war that pitted the former Union of Soviet Socialist Republics, China and their allies against the US, UK and others from the West.
The Horn of Africa also played a significant role in the Cold War, becoming a proxy battleground for the United States and the Soviet Union during the Ogaden War (1977-1978) and the Ethiopian Civil War (1974-1991). The conflicts fueled ethnic tensions and exacerbated existing conflicts, as did the support provided to Western, Soviet and Chinese allies in Africa.
In an effort to regain agency in the face of externally imposed constraints on economic and political development, African countries agreed in 1980 to implement the Lagos Plan of Action. By and large, the intention was to establish a self-reliant regional African economy, with greater independence from the global economy and ultimately to establish an African Economic Community.
The Plan required a commitment to regional cooperation, the appetite for which disappeared shortly after it was adopted. At a 1991 meeting of African Ministers of Trade at the UN’s Economic Commission for Africa (UNECA), the participants noted that African governments had largely failed to incorporate the plan into their national development frameworks and that it lacked effective monitoring and follow-up mechanisms for its implementation. Similarly, regional schemes aligned with the plan found little success, as the various Regional Economic Communities (RECs) all lacked the supranational authority to monitor or enforce compliance with the plan or related instruments.
The Lagos Plan of Action was arguably a pan-Africanist response to the economic problems of Africa, with the underlying assumption that Africa’s economic problems arose primarily from the structure of the international economic system. Independence from this system was thus the answer. Instead, the view from organisations such as the World Bank and the International Monetary Fund (IMF) was that Africa’s economic problems arose primarily from the internal structures of their economies, particularly ineffective and corrupt governance structures. This would subsequently inform the Bretton Woods Institutions’ conceptualisation of their Structural Adjustment Programmes (SAPs) in the wake of Africa’s debt crises in the early 1980s.
Accordingly, the World Bank and the IMF — the two global financial institutions mandated to respond to under-development — created loan packages for highly indebted poor countries that required them to reduce spending on health and education in favour of debt repayment and the liberalisation of the economy through privatisation and other means.
These measures were not new. The World Bank and the IMF had been attaching conditionalities to their loans since the early 1950s, and their policy prescriptions inevitably closely aligned with the free-market economics dominant in the US, where their secretariats are located and who is the largest contributor to both.
In return for budget and balance of payments support, the Bank and the Fund required African governments to adhere to an agreed set of policy reforms to achieve macroeconomic stability. Perhaps the most significant impact of these SAPs was the demand for the devaluation of many of Africa’s overvalued currencies to more reasonable levels. But it also included other requirements, such as capital account liberalisation, which subsequently facilitated illicit financial flows and easy entry for multinational companies with little or no requirements for local knowledge transfers.
The negative impact of the curbs on government expenditure in key sectors such as health and education, their impact on poverty and their lack of focus on agriculture would resonate for many years and earn both institutions the enduring enmity of many Africans in what has been described as an effective ‘race to the bottom’. The associated reforms painfully impacted large populations in the recipient countries and offered African leaders, activists and academics a ready target in externalising the reasons for slow development.
The conditionalities, generally known as the Washington Consensus, put an effective end to national industrial policies that countries as diverse as Ethiopia, Ghana, Kenya, Mauritius, Mozambique, Nigeria, Senegal and Tanzania had tried to implement, albeit with limited success. Consequently, industrialisation as a development option for Africa was replaced by trade liberalisation, deregulation, the free market and a small state.
The Washington Consensus shifted the development framework away from the state as the main engine and instigator of growth to a reliance on markets and the private sector for resource allocation. The state's role subsequently became limited to policymaking and regulatory functions, based on many African states’ inability, in the view of the Bank and the Fund, to effectively deliver public goods and to limit the abuse of funds.
Whereas development elsewhere had been facilitated through an active role for the state, including clear industrial policy, the corruption of and mismanagement by African governments now presented the continent with an impossible situation. It had to develop without the guiding hand of the government and dependent on the benefits of trade liberalisation at an early stage of development. The inevitable results — lack of industrialisation, poor growth and unequal development — soon became clear.
Unable to rapidly improve productivity and with a fast-growing and youthful population, per capita average income levels in Africa peaked in 1980 and subsequently declined until 1994 as trade shocks and economic crises took their toll. The percentage of people living in poverty in Africa followed suit and steadily increased.
As these initiatives unfolded, the United Nations Secretary-General, Javier Pérez de Cuéllar, appointed the World Commission on Environment and Development in 1983, also known as the Brundtland Commission, named after its chairwoman, Gro Harlem Brundtland, the Prime Minister of Norway. The purpose was to chart and agree on a common sustainable development pathway at a time of deep pessimism about the environment and Africa’s development prospects. Its report, titled ‘Our Common Future’, which was released in October 1987, popularised the notion of ‘sustainable development’ by establishing a clear relationship between economic growth, the environment and social equality. It eventually led to the 1992 Earth Summit in Rio de Janeiro, Brazil.
The Brundtland Report and the broader context within which the debates around poverty occurred also had a wider impact. Among other things, it led to deep introspection by the World Bank and the IMF about the effectiveness of their SAPs.
The impact of the Brundtland Report and the Earth Summit continues to resonate several decades later, first with the eight MDGs, adopted at the UN Millennium Summit in 2000, and more recently with the Sustainable Development Goals 2030, adopted by the UN General Assembly in 2015.
In the meanwhile, the rolling economic crises in the 1980s and a reliance on tariffs for a good part of government revenue spurred intra-Africa trade protectionism. Furthermore, the SAPs provided African governments with easier access to finance than the more abstract and difficult-to-realise benefits of continental cooperation offered by the plan while undercutting its ‘collective self-reliance’ intentions.
Between 1980 and 1990, Africa lost considerable ground — in development terms, it was actually moving backwards. The average income per person decreased by about 12% and declined by a further 2% in the early 1990s.
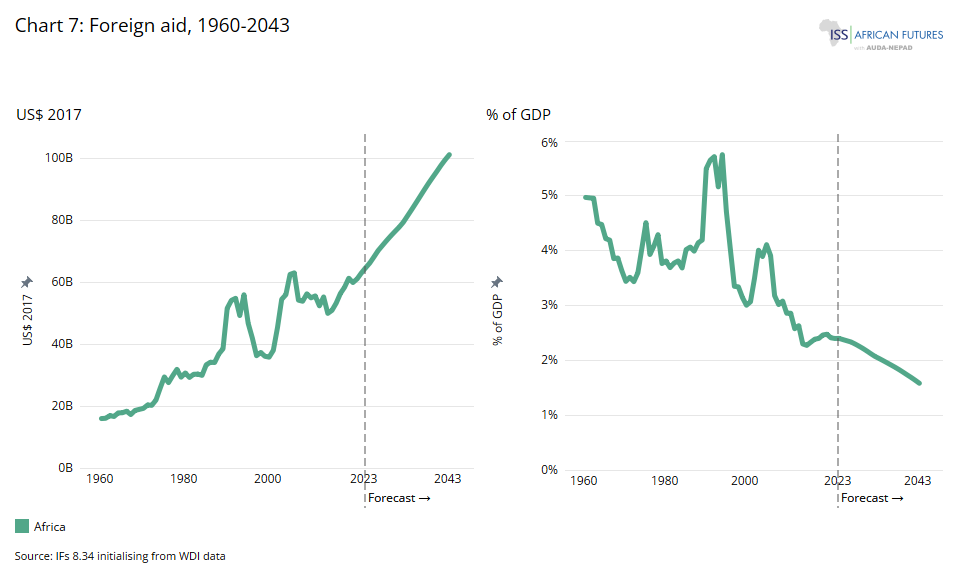
Chart 7 shows the influx of foreign aid to Africa from 1960 to 2043.
An important tool for assisting in achieving the global vision of sustainable development within both the MDGs and SDGs was international cooperation and solidarity, including the provision of overseas development assistance (aid). However, instead of increasing (when measured in constant dollars), aid levels steadily declined from their peak in 1990 to the Millennium Summit in New York a decade later. Kenya, Somalia, Sudan and the former Zaïre (now the DR Congo) experienced some of the largest declines. These trends are reflected in Chart 7 which includes a forecast on aid to 2043.
One of the reasons for the decline of aid from 1990 was a prolonged recession that began in Japan, a major aid provider, in 1991. A second reason was the resource pull exerted by transition economies in South Asia, steadily diverting attention away from Africa. But the most important reason was that the dissolution of the Soviet Union freed Western countries from the need to prop up African governments as part of the efforts to confront the Soviet bloc in Africa during the Cold War. With the collapse of the Berlin Wall, Africa lost much of its previous geostrategic relevance and hence the external motivation to assist.
From 1989 onwards, the focus of development assistance from the West — which several African states had become addicted to — now shifted to the importance of democracy, good governance and anti-corruption as part of the efforts to correct some of the egregious misuses of public money and abuse of power by a worrying number of African governments.
Western development partners subsequently invested in civil service reform and efforts to improve public financial management and helped to set up anti-corruption watchdogs and public audit bodies. Multiparty elections, decentralisation and other methods to encourage greater citizen participation were equally popular. In the process, democracy became associated with liberal economic policies that envisioned a small state and a dominant role for the private sector, trade and open markets in development. The problem is that poor countries need an activist, developmental state if they are to engineer an escape from poverty. Today, African civil society organisations, local NGOs and grassroots movements are increasingly influential in advocacy and accountability efforts. These groups emphasize local agency and help shape reform agendas that align with community priorities and sustainable development.
By 1999, the IMF had replaced its SAPs with the Poverty Reduction and Growth Facility and placed poverty alleviation at the heart of its efforts. The following year, the World Bank admitted that the poor are better off without structural adjustment. Writing for the African Development Bank, John Page notes that ‘structural adjustment had taken place without producing structural change’.
Aid only started to regain momentum with the 2000 UN Millennium Summit in New York. It was substantially bolstered by the support of international celebrities such as Bono and Bob Geldof, who campaigned for greater awareness about poverty and the acquired immunodeficiency syndrome (AIDS) crisis and helped to raise funds for relief programmes in Africa.
In addition, the post-2000 momentum was marked by various initiatives, such as the Report of the Commission for Africa, spearheaded by UK Prime Minister Tony Blair and the European Consensus on Development.
The 2005 World Summit in New York subsequently called for increased aid transfers to help achieve the MDGs of halving poverty and hunger by 2015.
While progress was made on the MDGs, many goals were not achieved in Africa. In retrospect the MDGs were poorly tailored for the continent and set unrealistically ambitious goals. Even before the 2015 deadline for the MDGs, governments began to look at the post-MDG development framework and what would ultimately become the Sustainable Development Goals (SDGs).
Cooperation for Africa’s development is now largely framed by the SDGs and, since 2013, by Agenda 2063. However, it is clear that Africa will not meet most of the SDG aspirations. In its planning for the second ten-year implementation plan of Agenda 2063 (2024 to 2033), the AUDA-NEPAD agency set different and achievable goals (using the IFs modelling platform also used on this website).
Eventually, it was the commodities boom, and not a grand plan, that changed Africa’s prospects. From 1994 until 2008 (when the financial crisis hit), Africa experienced its most sustained period of growth since independence in the 1960s — an average of 4.6% per annum. During this period, average per capita income increased by 35%. However, the share of Africans living in extreme poverty decreased by only about five percentage points, partly owing to the high levels of inequality on the continent and rapid population growth.
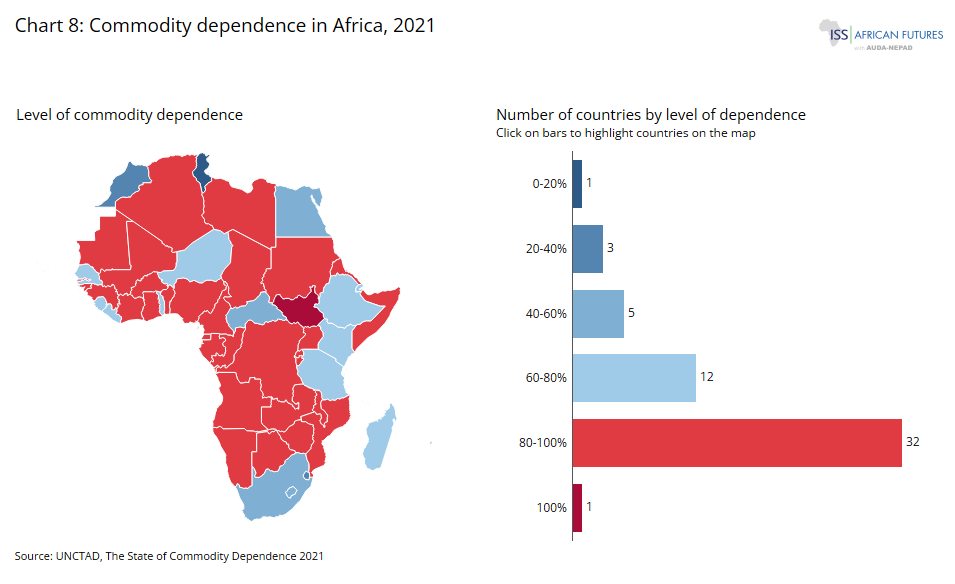
Chart 8 shows the commodity dependence in Africa for 2021.
In its 2023 report ‘The State of Commodity Dependence’, the UN Conference on Trade and Development (UNCTAD) noted that in 2019-2021, 101 out of 189 countries depended on commodity exports with close to half of all commodity-dependent countries being in Africa. Africa was also the region with the highest commodity dependence, with commodity exports constituting 90% by value of all merchandise exports, closely followed by South America. COVID-19 and subsequent global shocks have led to a period of extreme commodity price volatility, further exacerbating the current account balances of many African countries.
While the number of commodity-dependent countries in Africa has steadily increased (Chart 8), it generally remained static elsewhere, contributing to the relative decline in Africa’s competitiveness. The extent to which African countries depend on commodities when measured by the value of exports has also increased, deepening the crisis.
In addition to the general decline in commodity prices that follows the restructuring of China’s economy, oil and gas exporters have been affected by the sharp decline in oil prices that has accompanied the shale revolution in the US.
Today it is well established that commodity dependence leads to slow and poor-quality growth over long time horizons. Extreme commodity dependence is closely associated with poor governance. Supporters of the ‘resource curse’ hypothesis argue that heavy dependence on energy resources such as oil or gas impedes rather than accelerates economic growth and investment. It may also hinder the broadening of the economic base by impeding value added in agriculture and manufacturing, as well as the development of the various institutions of good government.
Some of the severe risks that single-commodity exporters face include:
- Exposure to price volatility, as occurred, for example, in 2014 and again early in 2020 with the collapse of the oil price.
- A decline in the contribution from other economic sectors — the so-called Dutch disease.
- An increased likelihood of undemocratic government as governing elites essentially focus on competition for control over the income stream from a single commodity and not by diverse sectors such as agriculture, manufacturing and services.
- The prevalence of a rentier state, where the state is not accountable to citizens but to special interest groups aligned with the commodity income.
- Pressures to spend within a short-term horizon to maintain support and also to align with the surge in commodity incomes.
- A greater likelihood of low-quality institutions — the sum impact of all of the above.
The result is an ‘observable correlation between resource abundance and political corruption.’
To date, Botswana is the only African country that has successfully and sustainably developed its resources sector (diamonds) to the general benefit of its population. Yet, it too struggles to spread its commodity-led growth beyond a small, privileged elite in a country that has the third highest level of inequality globally and declining attraction of natural diamonds.
The result of the resource curse is that resource-poor economies generally outperform resource-rich countries, with South Korea, Japan and Taiwan often cited as the best examples of the former and Nigeria, Angola and Equatorial Guinea as examples of the latter. South Korea has virtually no commodity reserves of significant value. In 1962, the country exported mostly raw materials such as fish, rice, iron ore and unprocessed silk. Today it boasts a well-diversified export portfolio that includes electronics, cars, ships and other high-end machinery.
Nigeria’s main exports in 1962 were crude petroleum and assorted agricultural products — mostly groundnuts, soybeans and cocoa beans. In 2019, crude petroleum and liquified petroleum gas accounted for almost 60% of Nigeria’s total exports by value. In 1962, the GDP per capita in South Korea was about half that of Nigeria; in 2018, it was seven times more. Similarly, Africa’s two richest countries (in terms of GDP per capita), Mauritius and Seychelles, have almost no reliance on commodities, growing instead through their service sectors.
Managed well, commodities can play a powerful role in development. Norway famously makes excellent use of its oil and gas reserves for development, saving much of the proceeds in a sovereign wealth fund. Although politically difficult, managing spending and planning for the future are key to making the most of national commodity endowments.
Several African countries have attempted to use their resource booms by saving some of the associated revenue in sovereign welfare funds, including Angola, Mauritania, Botswana, Chad, Gabon and Equatorial Guinea. After the 2008 financial crisis, Nigeria attempted something similar in the form of an excess crude account.
Although such savings have been associated with better macroeconomic management, they are also regularly undermined by subsequent over-withdrawals from the funds and political interference in their governance. Of all Africa’s many resource-rich countries and the many sovereign wealth funds established, Botswana’s Pula sovereign wealth fund arguably stands alone in attaining sustained improvements in macroeconomic management, thanks to excellent governance and management but has been severely depleted in recent years.
Eventually, growth in India could reignite deep and broad demand for commodities and there are some indications of a turnaround as liquid natural gas, iron ore, copper, rice and soybeans started to surge early in 2021 as the economies of high-income countries (and China) rebounded after the initial impact of the COVID-19 pandemic. Then Russia’s invasion of Ukraine in February 2022 saw oil and gas prices again spike as Europe struggled to balance its desire to assist the government of President Zelensky against Russian aggression while simultaneously paying Russia almost a billion dollars a day for oil and gas.
Today the global energy transition to renewables plays an important role in the demand for copper, cobalt, platinum, nickel and lithium — all important for batteries, generating power from solar and wind and the manufacture of hydrogen fuel cells.
The impact of climate change has exacerbated Africa's commodity dependence issues by reducing agricultural yields in regions prone to drought and desertification, like the Sahel, and increasing resource scarcity, which limits economic options and accelerates migration.
Adaptation strategies, like climate-smart agriculture and sustainable mining practices, are essential to reduce Africa's vulnerability to resource-based income fluctuations and environmental degradation.
Meanwhile, the Lagos Plan of Action and the African Economic Community initiatives had largely fallen by the wayside. It was followed by the Abuja Treaty that was signed in 1991 which aimed to reconcile pan-Africanist development ambitions with the liberalisation orthodoxy of the time, moving away from the focus on market integration in favour of collaboration, expansion and diversification of production across regions. Although Abuja inspired marginal reforms in some of the continent’s RECs and led to the establishment of the African Economic Community (EAC), it faced similar challenges, including reluctant cooperation from member states and subsequently also failed in its ambitions.
More recently the Abuya Treaty was eclipsed by the establishment of the New Partnership for Africa’s Development (NEPAD) in 2001. NEPAD departed from the Lagos Plan of Action with a greater focus on political reform as a core component of development. Efforts to improve the efficiency and accountability of member states were also strengthened by the institution of the African Peer Review Mechanism (APRM) according to which Africans would commit to peer review and self-monitoring. While remaining Africa-centred and led, NEPAD eschewed regional isolationism. It embraced global partnerships and has since been integrated into the AU as its core development agency, now named AUDA-NEPAD.
NEPAD focuses on enhancing economic integration, promoting sustainable growth and eradicating poverty. Initially, it focussed on a limited number of locomotive states with more joining over time. It sought to foster partnerships between African governments, the private sector, civil society and global partners to implement development projects across various sectors, including infrastructure, education, healthcare and agriculture. Embracing Fourth Industrial Revolution technologies like artificial intelligence and blockchain, its proponents argue, could accelerate industrialisation by creating new digital industries and improving efficiency in existing sectors.
NEPAD continues to play a role in advocating for policies that support Africa's long-term development goals in particular to monitoring and planning for the African Union’s Agenda 2063 that was launched in 2013 (also see the About section). Agenda 2063 is the strategic framework for the socio-economic transformation of the continent over the next 50 years. Its aspirations include a prosperous Africa based on inclusive growth and sustainable development, an integrated continent, politically united, based on the ideals of Pan-Africanism and the vision of Africa's Renaissance, and an Africa of good governance, democracy, respect for human rights, justice and the rule of law.
Climate resilience initiatives are also becoming central to development goals, as Agenda 2063 includes provisions for environmental sustainability, adaptation to climate change and conservation efforts to protect biodiversity.
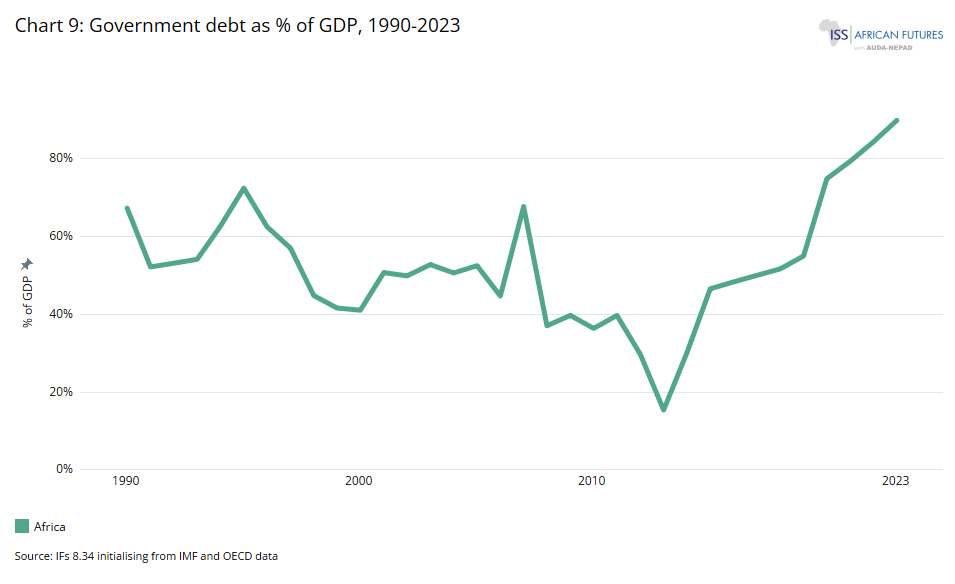
Chart 9 presents African government debt as a percentage of GDP, from 1990 to 2023.
Debt dependency has played a significant role in shaping Africa's economic landscape, often constraining the continent's development prospects.
After independence, many African nations sought to accelerate their development through borrowing from international creditors, including Western banks, the International Monetary Fund (IMF) and the World Bank. The funds were aimed at financing infrastructure projects, industrialisation efforts and social programs. However, punitive interest rates, mismanagement, corruption and global economic shocks, including oil crises and fluctuating commodity prices, meant that many countries found themselves trapped in cycles of debt. Poor governance and limited institutional capacity to transparently manage debt funds to date continue to undermine development, making governance reform essential for debt sustainability and economic autonomy.
The situation was exacerbated in the 1980s and 1990s by the implementation of Structural Adjustment Programs (SAPs), which, while intended to promote economic stability and growth through liberalisation and austerity measures, often led to increased poverty and reduced access to essential services for the population. The debt crisis impeded African governments' expenditure, curtailing their ability to invest in critical sectors such as health, education, and infrastructure development. This has hampered sustainable development and economic autonomy.
In 1995, public debt for Africa’s lower-middle-income countries peaked at 97% of GDP. The following year, public debt for low-income Africa was at 174% of GDP. In response, the IMF, the World Bank and other creditors began the Heavily Indebted Poor Country (HIPC) Initiative in 1996. The HIPC was reviewed and comprehensively expanded in 1999 and complemented by the Multilateral Debt Relief Initiative (MDRI), a debt relief proposal initially advanced by the Group of Eight (G8) countries in 2005.
As the HIPC programme matured, the international community focused on strengthening the links between debt relief and progress in implementing poverty reduction strategies and macroeconomic and structural reform programmes. As a result, public debt among low-income African countries declined to 15% of GDP in 2013 and 11% among lower-middle-income countries the following year.
The problem with this approach is that the medicine was killing the patient. Structural reform required that governments constrain their expenditure, meaning that they had to cut back on the provision of services such as housing, education and security. The reductions inevitably reduced economic growth and poverty increased. Lower economic growth exacerbated high debt/GDP ratios as African countries could not grow out of their high debt levels.
With the decline in commodity prices after 2011, levels of debt again started to increase, which hit Angola, Chad, the Republic of the Congo, Niger, Nigeria and Zambia particularly hard. Other factors also contributed, such as internal conflict (Burundi), the impact of epidemics such as Ebola (in Liberia and Sierra Leone) and corruption (Mozambique and The Gambia). Finally, a larger liquidity crunch, delays in the start of natural resource production and weaknesses in revenue administration negatively affected debt levels in Benin, Cameroon, Djibouti, Ethiopia, Ghana, Kenya, Senegal, São Tomé and Príncipe, Rwanda, Togo, Uganda and Zimbabwe.
By 2016, according to the IMF, public debt rose above 50% of GDP in 22 countries, up from ten countries in 2013.
In a wide-ranging study on the relationship between debt and growth, Carmen Reinhart and Kenneth Rogoff concluded that ‘when external debt reaches 60% of GDP, annual growth declines by about 2%’. For almost two decades since the mid-1980s, Africa’s low- and lower-middle-income countries consistently had average debt levels above 60% of GDP. Yet, this period coincided with Africa's most rapid period of economic growth since independence, pointing to the challenge of using fixed debt levels such as 60% of GDP as a reliable guide to debt sustainability.
Based on the dataset from the Boston University Global Development Policy Center on Chinese loans to Africa (CLA) and AidData's Global Chinese Development Finance Dataset, there was a significant accumulation of Chinese loan commitments to African countries from the establishment of Forum on China-Africa Cooperation (FOCAC) in 2000 until 2016. However, these loans have seen a sharp decline from 2016 to 2023. Subsequent FOCAC meetings post-2015 have placed greater emphasis on trade rather than debt-financing for infrastructure development in Africa as in the past. Exact information is complex to decipher as Chinese and Western national banks do not release comprehensive data. However, it seems that interest-bearing loans from the Chinese government, banks, and contractors went from almost nothing in 2000 to US$143 billion in 2017, representing about a third of Africa’s overall debt of around US$365 billion. The trend is ongoing. Chinese lending now dwarfs World Bank loans to Africa. In response, successive US administrations sought to characterise Chinese loans as ‘debt-trap diplomacy’ — arguing that China is seeking to use debt for strategic leverage to eventually gain control over strategic state assets such as rail and harbours. The reality is more complex. The majority of Chinese funding agencies are state-owned, with the Export-Import Bank of China (Exim Bank) and the China Development Bank (CDB) being the primary sources of funding. Additionally, most Chinese loans show some level of concessionality when measured against the OECD's Official Development Assistance (ODA) concessionality threshold of 25%, compared to loans from Western private financiers.
The primary reason for the preference of Chinese loans in developing countries is that Chinese lending agencies tend to overlook institutional quality and debt sustainability thresholds during their pre-lending assessments, unlike the World Bank and IMF.
To cushion the economic and social impacts of the subsequent COVID-19 pandemic, several African governments announced fiscal stimulus packages that averaged about 3% of GDP, financed partly by debt. The average debt-to-GDP ratio, which had somewhat stabilised at around 60% of GDP at the end of 2019, was increasing rapidly when, in April 2020, the G20 countries, the IMF and the World Bank announced the Debt Service Suspension Initiative, potentially available for 73 eligible countries, including 40 in sub-Saharan Africa. The IMF also approved six months of debt service relief for 25 low-income countries, including 19 in Africa, and approved additional funding support for several as well. China’s participation was a big step forward but without the involvement of a private creditor, which holds the majority of African debt, the DSSI proved too little too late as, in November 2020, Zambia became the first African country to default on its debt.
Almost simultaneously, in neighbouring Angola, falling oil prices placed immense pressure on the country as its previous system of using oil to pay for debt came under pressure. Oil-backed loans then already accounted for two-fifths of Angola’s external debt, most of it to China, which agreed to provide deferment over and above that promised under the G20 DSSI. In Kenya, China agreed to a six-month debt repayment holiday worth US$245 million in January 2021, shortly before a critical deadline when a US$1.4 billion loan from the China Exim Bank to build the Nairobi-to-Naivasha standard gauge railway would have come due.
In sum, China has probably taken more aggressive assistance measures to assist Africa during COVID-19 than much of the West, providing restructuring and postponing debt repayments to Angola, Zambia and Ethiopia in rapid succession in 2020. However, it has not offered substantive debt cancellation.
The administration of US President Joe Biden agreed, in April 2021, to allocate US$650 billion in Special Drawing Rights (or emergency credit) via the IMF. Given its large IMF shareholding, US support was crucial. However, only a limited amount (around US$33 billion) will flow to Africa. Having stimulated their domestic economies with several trillion dollars, several G7 members agreed to donate their Special Drawing Rights to low-income countries.
China is now Africa’s largest official bilateral lender, owning at least 12% of the continent’s outstanding debt. Africa’s fortunes are increasingly tied to China, which is also its single largest trading partner, although trade with the EU-group is larger. Looking to the future, China could opt to be a majority shareholder in some key assets of countries with high debt levels as an alternative to repaying maturing debt.
China’s spectacular growth rates are also set to steadily decline (probably to below 4% per annum by 2033) as its population ages, and it no longer runs a regular trade surplus. The growth slowdown and the efforts for the restructuring of the Chinese economy towards a consumption-based economy, will decrease its demand for commodities such as iron ore, oil and gas from Africa.
Recent years have already seen a decline in Chinese official sector lending to African governments (so-called sovereign debt by the two ‘policy banks’, China Exim Bank and China Development Bank). As debt levels increased the so-called ‘hidden debt’ from state-owned Chinese commercial banks such as the Bank of China, the Industrial and Commercial Bank of China and the China Construction Bank rose. For example, whereas Zambia (before its September 2021 elections) admitted to a sovereign debt of US$3.4 billion, research by AidData indicated that Zambia actually owed US$6.6 billion to 18 different Chinese creditors once the hidden debt component was included.
Hidden debt differs from sovereign debt, which central government institutions directly own, as it is a debt between a Chinese commercial bank and, often, a special-purpose vehicle specifically created to ‘hold’ the debt in the African country requiring the loan. Such debt is still guaranteed by the respective African government but indirectly. Hidden debt does not appear on public balance sheets. According to AidData, the average annual underreporting of repayment liabilities to China is equivalent to 5.8% of GDP.
What makes this trend alarming is not only the extent of the debt, including the lack of public reporting but the nature of collateral (such as profits from the port of Mombasa) and the steep terms. ‘A typical loan from China has a 4.2% interest rate and a repayment period of less than 10 years. By comparison, a typical loan from an OECD-DAC lender like Germany, France or Japan carries a 1.1% interest rate and a repayment period of 28 years,’ writes AidData. Accordingly, it seems that ‘Beijing has used debt rather than aid to establish a dominant position in the international development finance market.’
By 2024 it is clear that Africa's debt has shifted from concessional financing to more expensive and short-term commercial debt, with Eurobonds accounting for 44% of Africa's total debt, up from 14-17% previously. In 2010 debt service payments amounted to US$17 billion. In 2024 the continent will pay several times that amount at US$74 billion.
The continent must be able to sustain higher debt levels and benefit from more concessional financing.
According to the Organisation for Economic Co-operation and Development (OECD), a 30% to 50% debt threshold range is a reasonable target for emerging economies, including Africa’s 46 low-income and low-middle-income economies. The OECD further recommends that a prudent debt target should average 15 percentage points below the debt threshold since exogenous events, such as COVID-19 or Russia’s invasion of Ukraine, could push up interest rates. Domestic developments such as unrest or a coup can cause countries to lose market confidence and increase their borrowing costs. Therefore, according to the OECD, most African countries can only sustain debt levels of 15% to 35% of GDP, which is significantly below requirements.
Five matters are crucial in considering the debt-to-GDP ratio. The first is how much the debt costs, i.e. the interest rate at which the debt is incurred. A 2023 report by UNCTAD reveals that Africa pays four times more for borrowing than the US and eight times more than the wealthiest European countries.
The second is the currency in which the debt is held. Currency depreciation regularly increases the public debt stock in many African countries because a significant portion of the debt is in foreign currency. For instance, with the COVID-19 pandemic, on average, exchange rate depreciations increased public debt in Sub-Saharan Africa by ten percentage points of GDP by the end of 2022.
Third, what is the economic growth rate? An expanding economy offsets debt repayments by increasing in size, thus reducing the size of the debt as a portion of GDP. After Africa's debt peaked at 26% of GDP at the height of the COVID-19 pandemic in 2020, it declined to 24% two years later as modest economic growth resumed.
Fourth, how vulnerable is the borrower to exogenous effects? A single-commodity-based economy is, for example, very vulnerable to price swings. In contrast, a diversified economy where agriculture, manufactured goods and service exports contribute to earnings is much more resilient.
Finally, prudent financial management is essential. Is the money loaned put to productive use?
Africa’s post-COVID debt levels have now become victim to the rise in tensions between the US and China with each side using debt and its capital contribution to organisations such as the World Bank as a cudgel with which to beat the other, demanding haircuts and resisting first-mover concessions. Africa’s voice and interests are often quite peripheral in this emerging great power game.
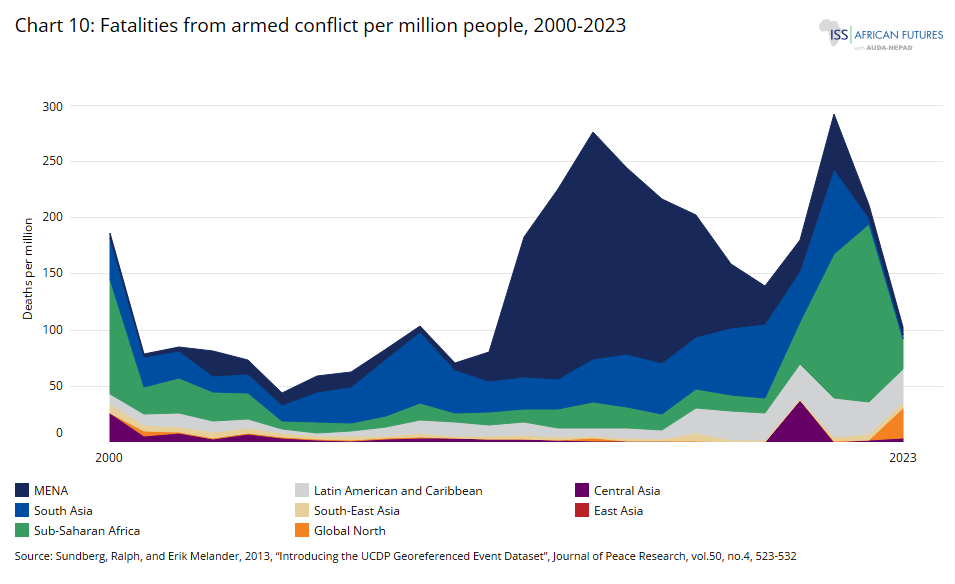
Chart 10 shows fatalities from armed conflict per million people in Africa, from 2000 to 2023.
A more crowded world will inevitably evidence more fatalities from violence since a larger population almost inevitably translates into more violence in absolute terms. This is particularly true in Sub-Saharan Africa given its rapid population growth, large youth bulge and rapid rates of urbanisation (Chart 11).
The collapse of the Soviet Union in 1990 and the associated end in global tension led to an initial peace dividend as tensions declined. The US dominated globally and its hegemony appeared assured. But since 2005 the world has experienced a general increase in the fatality burden with a particularly large increase in the Middle East and North Africa from 2011 to 2019 (mostly in Syria and in 2021 Yemen), and in Sub-Saharan Africa from 2019 to 2022. The increase in the latter group is almost entirely due to the civil war in Ethiopia.
State-based violence[x] is the category of armed conflict that is responsible for the most growth in the conflict burden (average across all regions), although there is also some growth in the fatality burden from non-state fatalities. Governments are therefore increasingly responsible for (more) fatalities than fighting between non-government groups, which the UCPD refers to as non-state violence. The reasons are not necessarily more deadly actions by governments but could reflect the enhanced ability of the government to enforce stability with more resources.
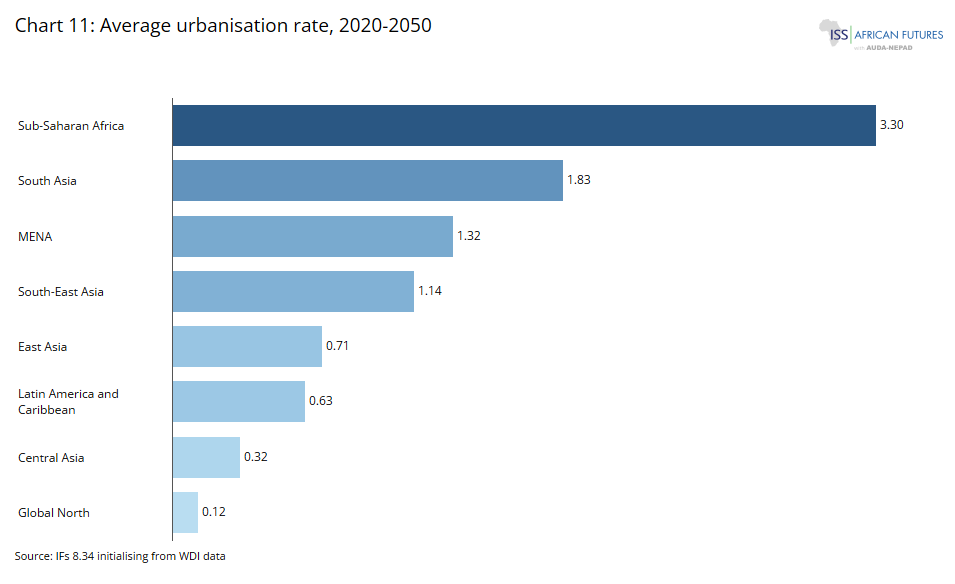
Chart 11 presents the average urbanisation rate 2020 to 2050.
Since 2013, sub-Saharan Africa has been the region with the most state-based armed conflicts with wars in Ethiopia, Sudan, Somalia, Burkina Faso and Nigeria where governments are fighting terrorism.
Releasing their annual data update in July 2024, the UCDP team summarised the situation as follows:
Analysis of non-state conflict data spanning the past decade reveals that it comprises the ten most violent years on record. Organized crime groups have predominantly fueled this escalation. Unlike rebel groups, organized crime groups do not have political goals and are primarily motivated by economic gain. Conflicts between these groups tend to intensify around drug smuggling routes and in urban areas, driven by shifts in alliances and leadership dynamics among the actors.[x]
Rather than seeking to replace a government, the UCDP finds that ‘organised crime groups tend to establish parallel governance structures in areas of limited state presence, often through co-option, intimidation, and bribery of political actors and state institutions to facilitate their illicit activities.’ In Sub-Saharan Africa, the DR Congo, Nigeria, South Africa and Kenya are considered to have the highest rates of criminality, while Sao Tome & Principe, Rwanda, Seychelles and Comoros have the lowest.
If rapid urbanisation is a potential indicator of high levels of organised criminal violence, Chart 11 compares a forecast of the average urbanisation rate for the 25 years from 2025 for each region. It points to the challenges that are likely to be encountered particularly in Sub-Saharan Africa and to a lesser extent in South Asia and the MENA region with urbanisation rates in these three regions significantly higher than elsewhere. With its rapidly urbanising and growing population, it seems inevitable that Sub-Saharan Africa will be more violent (i.e. experience an increase in fatality rates per million people) than any other region. Within sub-Saharan Africa, the countries with the most rapid rates of urbanisation are Uganda, Tanzania, Mali, Burundi, Somalia, Ethiopia, DR Congo, Niger, Mozambique, Burkina Faso, Chad, Angola, Madagascar, Zambia, Malawi and Mauritania - all with annual rates of urbanisation above 4%.
Against the background of Africa’s historical development trajectory and key challenges since independence that were discussed in the preceding sections, separate themes on this website provide context and explore Africa’s likely and possible trajectory in different economic sectors. These themes are Demographics, Agriculture, Health and WaSH, Education, Manufacturing, the AfCFTA, Leapfrogging, Financial Flows, Large Infrastructure and Governance. Each theme presents the Current Path for that sector and includes a scenario to explore what could be possible in an ambitious, positive scenario that is benchmarked against countries at similar development levels. The modelling is done at an individual country-level. The Combined theme then consists of the combination of the eight associated sectoral scenarios (some themes share scenarios). The comparisons are across key development indicators, including economic size, GDP per capita and effect on poverty reductions. Where appropriate, comparisons extend to levels of education, infant mortality, life expectancy, etc.
Four subsequent themes explore the impact of the various sectoral scenarios on employment, the effect of climate change, examine Africa’s likely energy transition and the impact that gender equity has on development. Additionally, we review the impact of global scenarios on Africa’s overall developments in the theme called Africa in the World
Chart 12 presents the demographic dividend and youth bulge for Africa, from 1960 to 2043.
The story of Africa’s youthful population is well known. Whereas the median age in Africa is 20 years, the average for the rest of the world is 35 years and even higher in a region such as the EU (45 years). Because of this, Africa only enters a potential demographic window of opportunity shortly after mid-century, although regions and countries obviously differ from one another (Chart 12). For example, North Africa enters a potential dividend much earlier, in 2029, and sub-Saharan Africa will only do so in 2055. At that point, the ratio of working-age persons to dependents will be 1.7 to one (the minimum ratio for a demographic dividend) and Africa’s larger labour force (aged 15 to 64 years) relative to children and the elderly will accelerate economic growth although other factors such as education also play a role. As associated rural-urban migration accelerates, driven by search for employment and opportunities, cities are expanding rapidly. This shift requires infrastructure development to prevent informal settlements, improve service delivery and support economic stability in urban areas. Overarching migration, both internal and cross-border, has economic implications that are shaping labour markets, remittance flows and urban growth patterns. Managing migration flows effectively can boost economic development, support demographic transitions and create opportunities in urban hubs.
The contribution that labour makes to economic growth is very important for Africa, which does not have deep pockets of capital and does not benefit from high levels of technology — the other two sources of productivity improvements. Africa’s developmental future will be shaped by many factors, but particularly by how effectively high-fertility countries such as Niger, Chad, Somalia, DR Congo, Mali and Nigeria can transition from their current high fertility and youthful population to a more balanced age structure that supports sustained economic growth and development.
Africa's declining youth bulge will also play a role. In 2023, 45% of Africa’s adult population was in the age bracket 19 to 29 years which is higher and declining more slowly than in other regions to 41% in 2043. The average for the rest of the world is much lower at 28%, 35% in India and 21% in China, which is ageing rapidly. The EU only has 19%. As this shift progresses it will slowly reduce political volatility. Generally, a youth bulge below 40% indicates greater stability and enhanced prospects for democracy.
The role of governance in shaping a stable future is essential, particularly by ensuring youth inclusion in decision-making. With almost half of Africa's population under 25, creating platforms for political participation and economic empowerment of the youth is critical.
To fully harness the demographic dividend, Africa must implement strategic reforms and investments that improve the quality of its growing labour force, particularly by investing in its health and WaSH systems. That includes the provision of clean water, sanitation and better hygiene. For example, only 53% of sub-Saharan Africa’s population has access to improved sanitation (65% in 2043) and 36% to piped water (49% in 2043). Additionally, there have been reductions in mortality rates associated with both communicable and non-communicable diseases. Life expectancy will increase, while infant mortality is expected to decrease significantly. Interventions aimed at providing basic infrastructure and reducing the incidence of diseases like HIV/AIDS and malaria are expected to yield substantial health benefits. Much more needs to be done, however.
Chart 13 shows deaths per thousand people by Main ICD Categories, from 2020 to 2043.
The continent is also facing an emerging challenge of non-communicable diseases, leading to a "double burden of disease" during which it still experiences high rates of infectious diseases in addition to a growing non-communicable disease burden (Chart 13). This epidemiological transition in Africa is happening at lower levels of income and urbanisation compared to the history in other regions, further straining the already limited healthcare resources.
In addition to better health and WaSH, the second investment in improved human capital is in education, generally considered the foundation of human development and self-actualisation. Education allows people to lead a self-determined existence, increase professional performance and improve health. Investments in education aligned to employment demand increase the talent in the labour pool, raise productivity and boost economic growth and incomes. The potential for social stability depends heavily on governance that is inclusive, transparent and responsive to diverse community needs, particularly in resource management and political reform.
Chart 14 depicts the years of education and education quality in Africa, from 2020 to 2043.
Education in Africa faces several significant challenges such as the large annual influx of children into educational systems that are already struggling with overcrowding and inefficient use of resources. Many African countries also face difficulties in retaining students within the education system, which affects overall educational attainment. In the Current Path, the gap in educational attainment between Africa and other developing regions is expected to widen (in the case of South Asia) or modestly decline (in the case of South America), particularly at higher education levels - pointing to the need for much more determined efforts in this sector. This divergence is influenced by economic growth rates, the use of non-African languages as the medium of instruction, and often, government inefficiencies.
The quality of education varies widely across the continent, and there is a growing trend towards private education. Gender parity in education and the balance between vocational and academic teaching are also important considerations. In 2023, the mean years of education for the 25-years and older age group in North and Southern Africa was 8 and 7 years, respectively. Looking to 2043, North Africa will continue to improve its education endowment on the Current Path (to 9.7 years), while the improvement in Southern Africa will only be to 7.9 years, with Mozambique doing particularly poorly (Chart 14).
Chart 15 presents African crop yields per hectare, from 1961 to 2043.
Agriculture plays a central role in many African economies, accounting for more than 60% of the labour force yet, contrary to most other regions, Africa has yet to experience a modern agricultural revolution. Generally, lack of investment and land reform, the continued use of traditional farming methods, ineffective agricultural policies, fragmented agricultural supply chains, and lack of access to fair markets, modern equipment, financial services and essential information have left Africa with the lowest agricultural yields in the world (Chart 15). In 2023, average crop yields in Africa were at 4.3 tons per hectare and will modestly increase to 5.9 tons by 2043. Crop yields per hectare in Africa are therefore low and improving more slowly than in other developing regions such as South America and South Asia. Today, Africa is the most food-insecure region globally in spite of its huge potential. In the Current Path, Africa’s agricultural import bill will likely grow from US$51 billion in 2023 to US$188 billion in 2043.
African countries with large agricultural sectors also mainly export raw commodities such as cocoa, coffee and cashew nuts with little value addition and limited diversification. Successive efforts such as the Comprehensive Africa Agricultural Development Programme (CAADP) have had limited impact.
Emphasising food self-sufficiency and focusing on indigenous crops well suited to the local climate and conditions is an essential step for a successful agricultural transition. Investing in critical enablers such as irrigation, infrastructure, support for smallholder farmers, and agricultural research is also crucial. Further, climate resilience is increasingly urgent for African agriculture, which must adapt to extreme weather patterns. Investments in climate-smart agriculture and indigenous crops are key to ensuring food security and environmental sustainability.
Africa has also not been able to industrialise. Since independence, the contribution of manufacturing to sub-Saharan Africa’s GDP has been either stagnant or declining and the trend as from the 1970s is that African economies have experienced a limited form of structural transformation from low-productivity agriculture to low-end services, with manufacturing and industrial development never truly taking off despite the continent’s manufacturing potential (exemplified by its fast-growing internal markets, abundant raw materials and large labour force). In fact, the slow growth of manufacturing in Africa has given way to the notion that Africa is de-industrialising. Thus, Africa’s share of global manufacturing has declined from about 3% in the 1970s to less than 2% currently - largely reflecting the declining contribution that the African economy makes to the global economy. North Africa is the most industrialised region on the continent, with a manufacturing sector contributing 22% to GDP in 2023.
Chart 16 shows the value-added by sector in Africa, for 2023 versus 2043.
Manufacturing production on the continent is also heavily concentrated in low-technology products such as food, textiles, clothing and footwear.
Whereas manufacturing is often called the automatic escalator that lifts countries to higher productivity levels, Africa appears to be embarking on a low-productivity, service and commodity escalator (Chart 16).
Currently, Africa’s service sector (i.e. lending, recreation, tourism, transport, food) constitutes the most significant economic sector by value and is significantly larger than any other sector, including agriculture and manufacturing. Much of it is, however, of low value and often part of the informal economy, meaning it does little in the structural transformation of African economies to higher productivity.
With limited exceptions, most African countries are not part of global value chains and do not benefit from the benefits of the associated knowledge transfer. For example, considering exports plus imports (generally a good indicator of the extent of globalisation), the average for Africa in 2023 was 47% of GDP compared to an average of 55% for the Rest of the World. By 2043 these percentages will be 57% and 62%, respectively. The key requirement in improving these low levels is the full implementation of the African Continental Free Trade Area that will boost intra-African trade from its low levels, attract multinationals (given the opportunity of larger markets) and facilitate higher value trade.
In terms of digitalisation and leapfrogging, Africa lags behind the rest of the world but has clear potential. Currently, the average internet penetration in sub-Saharan Africa is 25%, which is half the global average. The rapid adoption of new technologies (such as mobile money and broadband via satellite coverage) will provide lots of opportunities for Africa’s tech-savvy, youthful population. Africa’s tech hubs, such as Kenya’s Silicon Savannah and Nigeria’s booming startup ecosystem, exemplify the continent's potential for technological innovation. These hubs are catalysing advancements in fintech, agritech and healthtech, offering models for scaling digital infrastructure and creating high-value jobs.
Chart 17 depicts African electricity access from 2020 to 2043.
Rapid growth in broadband internet access can spur economic transformation but it requires progress with electricity access which is possible when investing in renewable, off-grid energy solutions to provide electricity to rural areas that currently trail behind. In 2043, rural electricity access was below 10% in Liberia, Burkina Faso, Angola, Equatorial Guinea, Mauritania, Mozambique, Malawi, South Sudan, Sierra Leone, DR Congo, Burundi, CAR and Chad. By 2043 only the CAR should still be at below 10% on the Current Path, reflecting rapid progress even on the Current Path (Chart 17).
Infrastructure investment in Africa has been steadily increasing over the past 15 years, predominantly funded by national governments, with China playing a particularly important complementary role. Investing in infrastructure projects, both basic and advanced, has the potential to result in substantial improvement in economic growth, employment and poverty reduction. Better rail, road and port infrastructure would enable Africa to engage more effectively in global markets and drive economic growth, particularly as part of regional trade
Historical deficits due to underinvestment and poor maintenance persist, however. This is partly a legacy of colonialism, which left Africa with fragmented infrastructure but, until recently, little subsequent investment in maintenance or new building has accentuated the challenge, causing the continent to lag behind the rest of the world.
In early 2022, the AfDB estimated Africa’s infrastructure investment gap to be more than US$100 billion per year, affecting Africans' living conditions and the continent’s global competitiveness. A separate AfDB report estimates that inadequate water and sanitation infrastructure is costing the continent about 5% of GDP and that high transport costs add 75% to the price of Africa’s goods.
Africa needs lots of finance to fund its infrastructure requirements. It has the world’s most rapidly growing population that requires more schools, hospitals, roads, harbours, railway lines and other infrastructure every year. Instead the continent has experienced rising debt and limited fiscal space while many countries need fiscal stimulus to ignite growth. In addition to more domestic revenue, spending efficiently and adopting growth-enhancing reforms, Africa needs more aid and foreign direct investment, to increase remittance inflows and curb illicit financial outflows. We examine these four components in the financial flows theme and model the impact of ambitious improvements in inward financial flows on indicators such as extreme poverty, growth and average incomes. Africans must be able to afford much higher debt levels (at least 50% to 60% of GDP), which is only possible at very low concessional rates. This means someone somewhere needs to offset the additional risk premium as Africans work to improve stability and reduce risk through better governance.
Chart 18 presents the influx of foreign aid, from 1960 to 2043.
Aid flows, which were once the largest share of capital inflows in the 1980s, have decreased as a percentage of GDP however, but are still significant, especially in low-income and fragile states. Whereas aid accounted for 2.5% of Africa’s GDP in 2023 (Chart 18), it will decline to 1.6% in 2043 as African economies become larger and aid amounts stagnate. Remittances follow roughly the same trendline but the potential and story of FDI holds significantly greater promise. On the Current Path, FDI will increase from 2.7% of GDP in 2023 to 3.6% of GDP in 2043.
Nothing less than a global compact, the entire restructuring of IFIs and a significant amount of funding from rich countries are required to unlock the huge amounts of private capital required for Africa’s development. In addition, the African private sector can be a critical driver for economic diversification, job creation and growth. Strengthening governance and reducing corruption will help attract more foreign direct investment, allowing Africa to build more robust financial systems and foster resilience.
Chart 19 shows the World Bank index for government effectiveness in Africa in comparison to South America and South Asia, from 1996 to 2043.
Governance is a critical factor in the continent's development. While the quality of governance in Africa has essentially remained unchanged for more than a decade, better governance can significantly accelerate poverty reduction and improve macroeconomic outcomes. A 2022 study by the IMF found that the governance dividend for the average sub-Saharan African country is two to three times larger than the rest of the world. Poor governance and higher corruption are associated with lower growth, worsened fiscal performance, higher inflation, and lower levels of development in sub-Saharan Africa. The push for democracy, while important, is not a solution to Africa's development challenges without stability and more state capacity.
Sub-Saharan Africa struggles with government capacity weakened by neo-patrimonialism, while North Africa faces a significant democratic deficit. The challenges are summarised when viewing the World Bank government effectiveness measure.
Four subsequent themes explore Africa’s energy transition, the impact of climate change, the future of employment and gender and development. A final theme examines how global developments facilitate or constrain Africa’s development.
In recent years, the narrative surrounding Africa — both within the continent and globally — has undergone a significant transformation. Historically, Africa has been frequently depicted through a narrow and often negative lens of stereotypes, focusing predominantly on issues such as poverty, conflict and disease. These portrayals were largely shaped by colonial legacies, skewed media representations and a lack of diverse voices from within the continent. However, this storyline is shifting, driven by a confluence of factors that are reshaping how Africa is perceived and understood on the global stage.
A key driver of this change is the emergence of African voices in media and storytelling. A growing number of African journalists, filmmakers, writers and artists are now telling their own stories, presenting a more nuanced and diverse picture of the continent. These voices are critical in reframing Africa as a continent of rich cultures, vibrant economies and resilient communities, moving away from the reductive depictions that have long dominated the global discourse.
The digital revolution and the rise of social media have further accelerated this shift. Digital platforms have democratised storytelling, providing African content creators with a global stage to share their experiences and perspectives without the filter of traditional Western media. This has enabled a more authentic and varied portrayal of African life, showcasing the continent’s complexities and dynamism.
Cultural movements such as Afrofuturism and a resurgence of Pan-Africanism have also played pivotal roles in reshaping Africa’s narrative. Afrofuturism, which blends African culture with technology and speculative fiction, has gained prominence as a way of envisioning Africa’s future potential. Similarly, Pan-Africanism has reemerged as a powerful force, promoting unity, cultural pride and self-reliance across the continent. These movements celebrate African identity and offer counter-narratives to the often one-dimensional portrayals in mainstream media. Africa's cultural influence is expanding through music, film, fashion and art, reaching global audiences and reshaping perceptions. This cultural diplomacy strengthens Africa's international relationships and enhances its ability to project influence. The global popularity of African culture also opens up new avenues for cultural exchange and collaboration, further integrating Africa into the global cultural fabric.
The changing narrative is also evident in global media, where African stories and perspectives are gaining representation. International platforms like Netflix are investing in African content, and African films and series are reaching a global audience. This increased visibility is helping to normalise African cultures and experiences in the global imagination, further dismantling the outdated stereotypes that have long prevailed.
Further, educational and cultural exchanges between Africa and the rest of the world are fostering mutual understanding and respect. These exchanges are crucial in breaking down misconceptions and promoting a more accurate and respectful understanding of Africa's diverse realities.
Africa’s economic landscape is rapidly evolving with countries like Nigeria, Kenya and South Africa emerging as significant tech hubs. This economic transformation is gradually altering the global perception of Africa, from a continent characterised by dependency to one that is increasingly defined by entrepreneurship, innovation and potential.
As the portrayal of Africa moves away from outdated stereotypes and towards a more balanced and nuanced understanding, the continent is increasingly recognised as a significant player in the international arena. This evolving perception is not merely a matter of image; it carries tangible effects on Africa's geopolitical influence, economic partnerships and diplomatic engagements.
The changing narratives are empowering African nations to assert themselves more confidently on the global stage. Its leaders are gaining greater leverage in institutions such as the G20 and BRICS. This shift is evident in multilateral forums where African voices are becoming more prominent, advocating for issues such as climate change, global trade reform and peacekeeping initiatives. The continent’s growing assertiveness is also reflected in its ability to shape regional and global agendas, including through platforms like the African Union and its engagement with global powers.
A more positive and diverse narrative around Africa is attracting increased foreign investment and fostering stronger economic partnerships. As global investors and corporations recognise the opportunities presented by Africa’s emerging markets, they are more likely to engage in long-term investments in infrastructure, technology and industry. This influx of investment is not only crucial for economic growth but also enhances Africa's strategic autonomy, reducing its dependency on aid and enabling it to negotiate from a position of strength.
African nations are increasingly seen as equal partners rather than aid recipients, leading to more balanced and respectful international relationships. This shift encourages collaboration on a wide range of global issues, from health and education to technology and climate change. However, this also presents challenges, as African countries must navigate the complexities of a global system that still harbours remnants of the old perceptions. The challenge lies in ensuring that the new narratives are not just superficial changes but reflect genuine shifts in power dynamics and mutual respect.
Finally, the changing narratives are also impacting internal dynamics within Africa. As African nations and people embrace a more positive and empowered view of themselves, there is a growing sense of continental unity and identity. This Pan-African sentiment is fostering greater cooperation among African states, as seen in initiatives like the African Continental Free Trade Area (AfCFTA), which aims to create a single market for goods and services across the continent. A united Africa, confident in its identity and potential, is better positioned to engage with the world on its terms.
The evolving narratives about Africa have significant strategic implications for the continent’s role in global affairs. As Africa reshapes its image and asserts its place on the world stage, it will play an increasingly important role in shaping the future of politics, economics, and culture.
While the narrative on Africa is changing, much of the African economy is still characterised by low productivity, mainly because of its poor human capital endowment — a delayed demographic transition, poor education and poor health. Instead of transitioning from agriculture to manufacturing to services, the growth trajectory that delivered the most rapid improvements in general well-being in other regions, the African transition is from subsistence agriculture to low-end services in informal urban areas.
The general shift in Africa seems to be that labour is moving from subsistence agriculture in rural areas to informal jobs in the urban service sector, which is only marginally more productive. Investment and jobs are often limited to capital-intensive commodity enclaves, such as in northern Mozambique’s gas fields, with little or no forward or backward linkages into the surrounding economy. The few jobs created by these megaprojects do little to provide employment or to build local value chains. They provide jobs for a few expatriates and generate significant revenue streams for governments, but do not contribute to broader welfare improvements in the economy. Yet, commodity-based enclave development is often the norm in commodity-rich countries.
In fact, Africa is becoming even more dependent on low-value commodity exports for its foreign exchange earnings and seems to be experiencing premature deindustrialisation. Most African economies are not integrated into global or even regional value chains and therefore rely on small domestic markets that do not attract foreign direct investment. The result is increased commodity dependence and a high and diversified debt burden with onerous repayment requirements.
Africa needs to seize the opportunity offered by renewable energy and the promise of the Fourth Industrial Revolution to rapidly improve productivity growth and provide more jobs. But how can that be achieved in a global economic environment where Africa is becoming more, not less, dependent on the export of commodities? And all of this while Southeast Asia constrains the growth of the manufacturing sector as its position as the world’s factory on top of the challenge of climate change? To kick-start all of the above and recover from the lingering impact of COVID-19 and subsequent slow global growth, many poor African countries again require debt relief similar if not larger to that provided during the 2005 Multilateral Debt Relief Initiative. Low agricultural productivity and high levels of inequality in Africa amidst rapid population growth contribute to the slow rate of poverty reduction. Strategic investment in infrastructure, renewable energy and education is critical if Africa is to harness a demographic dividend for sustainable development. Equally crucial is improving health systems, which directly impact productivity, life expectancy and economic participation. Prioritising health infrastructure and addressing both communicable and non-communicable diseases will create a healthier, more resilient workforce that is capable of supporting and benefiting from Africa's economic growth.
Climate resilience must also be a core part of Africa’s development strategy. Investing in sustainable practices and adapting to climate change will safeguard livelihoods, protect biodiversity and support long-term economic stability across the continent.
For the continent to fully realise the potential of its youthful population, the promise of technological innovation and high levels of entrepreneurial energy that could drive transformation, strong governance and regional cooperation will be essential. Effective policies that prioritise inclusivity, transparency and accountability can improve social stability, attract foreign investment and bolster public trust in transformative initiatives. Empowering women and ensuring gender equity in education, employment and entrepreneurship will be essential to unlocking Africa’s full economic potential. As women increasingly contribute to Africa’s workforce, they can drive more inclusive and sustainable growth.
The digital revolution, particularly through mobile technology, is rapidly reshaping economies and opening new opportunities in business, education and healthcare. Expanding digital literacy and internet access will be key in reducing the digital divide. By equipping young Africans with digital skills, the continent can foster a generation of innovators capable of driving tech-driven solutions in sectors like agriculture, healthcare and education.
Africa's future hinges on effectively managing its vast natural resources, ensuring that these assets contribute to economic diversification and industrialisation. Value addition in sectors like agriculture and mining will be crucial for transforming natural resources into high-value exports. Policies that incentivise local processing, innovation and skill development in these industries can shift Africa’s role from a raw material supplier to a leader in manufacturing and technology-based exports.The strategic exploitation of these resources, coupled with industrialisation efforts, will be central to building resilient economies that can withstand global market fluctuations. Beyond resources, Africa's potential lies in leveraging regional integration frameworks like the AfCFTA to reduce trade barriers, expand markets and foster resilience through intra-African trade. By building interconnected economies, Africa can reduce reliance on external markets and strengthen regional value chains.
Initiatives like the African Union's Agenda 2063 articulate a vision for an integrated, prosperous and peaceful continent driven by its citizens. Achieving this vision will require strategic policy reforms, commitment to sustainability and partnerships that empower African leadership on the global stage. By aligning national goals with Agenda 2063’s long-term vision, Africa can progress toward a future that is not only prosperous but also globally influential. Global partnerships, particularly in financing and technology transfer, remain critical to unlocking Africa’s development potential. Collaborative international efforts are needed to support Africa’s infrastructure needs, ensure equitable access to technology and create sustainable pathways for long-term growth.
Endnotes
Consisting of China, Hong Kong, Japan, North Korea, South Korea, Mongolia and Taiwan.
Page information
Contact at AFI team is Jakkie Cilliers
This entry was last updated on 29 March 2026 using IFs 8.34.
Donors and sponsors


Reuse our work
- All visualizations, data, and text produced by African Futures are completely open access under the Creative Commons BY license. You have the permission to use, distribute, and reproduce these in any medium, provided the source and authors are credited.
- The data produced by third parties and made available by African Futures is subject to the license terms from the original third-party authors. We will always indicate the original source of the data in our documentation, so you should always check the license of any such third-party data before use and redistribution.
- All of our charts can be embedded in any site.
Cite this research
Jakkie Cilliers (2026) Africa Current Path. Published online at futures.issafrica.org. Retrieved from https://futures.issafrica.org/thematic/01-africas-current-path/ [Online Resource] Updated 29 March 2026.