 ECOWAS
Feedback welcome
Our aim is to use the best data to inform our analysis. See our Technical page for information on the IFs forecasting platform. We appreciate your help and references for improvements via our feedback form.
This page explores the establishment, growth, and projections for the Economic Community of West African States (ECOWAS), founded on 28 May 1975 through the Treaty of Lagos. ECOWAS consists of 15 countries and is one of the eight regional economic communities (RECs) recognised by the African Union.
The assessment discusses the region's demographics, economic sectors and various development scenarios with a forecast horizon to 2043. The analysis also highlights the importance of governance and infrastructure improvements for economic and social development. It further addresses challenges such as energy demand and poverty, suggesting that strategic initiatives across all sectors could greatly benefit the region's prosperity and stability. It emphasises the potential impacts of these scenarios on GDP, GDP per capita, life expectancy, education, industrialisation, and poverty reduction, inequality and carbon emission.
For more information about the International Futures modelling platform that we use for the development of the various scenarios, please see About this Site.
Executive Summary
We begin this page with an introductory assessment of the region's context looking at current population distribution, society structure, climate and topography. According to the 2023 World Bank country income group classification, ECOWAS is composed of seven lower-middle-income countries and 8 low-income countries. Seven countries in the Community belong to the West African Economic and Monetary Union (WAEMU) which uses the CFA as its currency while the remaining countries continue to hold on to their national currencies.
This section is followed by an analysis of the Current Path forecast for ECOWAS which informs the region’s likely current development trajectory to 2043. It is based on current geopolitical trends and assumes that no major shocks would occur in a ‘business as usual’ future.
We also provide an overview of the region’s Vision 2050 plan: “ECOWAS of the Peoples: Peace and Prosperity for All”.
- The total population of ECOWAS increased from 180.8 million in 1990 to 393.4 million in 2019, making it the third most populous REC on the continent. By 2043, the total population will be 765.1 million.
- GDP increased from US$190.0 billion in 1990 to US$633.1 billion in 2019. By 2043, the region’s GDP will more than triple to US$2.0 trillion.
- In 2019, the informal sector represented 37.8% of the region’s GDP, equivalent to US$279.6 billion. The size of the informal sector will decline to 31.5% of GDP.
- The average GDP per capita increased from US$2 693 in 1990 to US$4 145 in 2019, compared to Africa’s average of US$5 289. By 2043, the average GDP per capita of ECOWAS will be US$5 754, below Africa’s average of US$6 450.
- In 2019, 27% of ECOWAS’ population lived below the extreme poverty line of US$2.15, in line with the average for Africa as a whole. By 2043, the extreme poverty rate of 16%, still tracking the African average.
- Because of the large Nigerian oil and gas sector, in 2019, total energy production in ECOWAS exceeded energy demand by 690 million BOE. However, the region becomes a net energy importer from 2041 as demand outpaces production. Oil is the dominant type of energy produced in ECOWAS. By 2043, gas will be the main energy produced complemented by oil, hydro and a growing share of other renewables, such as wind and solar.
The analysis then proceeds to compare progress on the Current Path with eight sectoral scenarios . These are Demographics and Health; Agriculture; Education; Manufacturing; the African Continental Free Trade Area (AfCFTA); Large Infrastructure and Leapfrogging; Financial Flows; and Governance. Each scenario is benchmarked to present an ambitious but reasonable aspiration in that sector.
- The Demographics and Health scenario will reduce the infant mortality rate from 59.1 deaths per 1 000 births in 2019 to 29.2 deaths by 2043, three deaths fewer than in the Current Path forecast. The scenario pushes the ratio of the working-age population to dependants to 1.54-to-1 which is still below the ratio of 1.7-to-1 that would see ECOWAS enter a potential demographic window of opportunity.
- The average net agricultural import in ECOWAS was 5.7% in 2019, below the average of 9.0% for Africa. The Agricultural scenario will reduce agricultural import dependency to 7.9% of total demand by 2043 instead of the 32% of total demand in the Current Path forecast.
- In 2019, the mean years of education attained by adults between 15 and 24 years of age stood at 7.3 years, below Africa’s average of 7.9 years. In the Education scenario, the mean years of education will rise to 7.6 years compared to the Current Path forecast of 6.6 years, and the average of 6.9 years for Africa. By 2043, the scenario further increases average test scores for primary and secondary school students by 29.3% and 21.5%, respectively.
- ECOWAS makes substantial progress in industrialisation in the Manufacturing scenario. By 2043, the share of the manufacturing sector in GDP is about 22.5% (US$81.2 billion) which is about 2.2% above the Current Path forecast.
- In the African Continental Free Trade Area (AfCFTA) scenario, ECOWAS’ trade deficit will constitute about 0.8% of GDP by 2043 instead of the 3.8% of GDP projected on the Current Path.
- Based on the impact of the Large Infrastructure and Leapfrogging scenario, 81.3% of ECOWAS’ population will have access to electricity by 2043, compared to 73.6% in the Current Path forecast. About 63.5% of households in the region will use modern fuel for cooking in the scenario, compared to the Current Path forecast of 54.8% by 2043.
- Government revenue will increase to US$366 billion in 2043, representing 17.8% of GDP, in the Financial Flows scenario. Compared to the Current Path, the scenario improves government revenue by an additional US$16.5 billion.
- In the Governance scenario, ECOWAS' score on the governance security index will be about 5.2% above the Current Path. Furthermore, the country’s capacity and inclusion scores will be a 15% and 17% improvement, respectively, above the Current Path forecast by 2043.
In the third section, we compare the impact of each of these eight sectoral scenarios with one another, and subsequently with a Combined Agenda 2063 scenario (the integrated effect of all eight scenarios).
In our forecasts, we measure progress on various dimensions such as economic size (in market exchange rates), gross domestic product per capita (in purchasing power parity), extreme poverty, carbon emissions, the changes in the structure of the economy, and selected sectoral dimensions such as progress with mean years of education, life expectancy, the Gini coefficient or reductions in mortality rates.
- By 2043, the Governance scenario will have the greatest impact on GDP per capita, through improved security, capacity and inclusion. The AfCFTA and Infrastructure scenarios will also have a significant impact on GDP per capita. Enhanced trade openness, technological diffusion and competition that can drive economic growth and employment, and good governance, which can inspire investor confidence, attract foreign direct investment and spur economic growth in ECOWAS.
- The Education scenario has the largest potential to reduce extreme poverty, followed by the Manufacturing and Agriculture scenarios.
- ECOWAS’ GDP will increase to US$3.3 trillion in the Combined Agenda 2063 scenario, equivalent to an additional US$2 trillion compared to the Current Path forecast.
- In the Combined Agenda 2063 scenario, GDP per capita will increase to US$8 476 by 2043, which will be 47.3% higher than the forecast on the Current Path.
- The structure of the ECOWAS economy will undergo significant transformation in the Combined Agenda 2063 scenario. By 2043, the service sector will still be the largest contributor to GDP at 56.9%, followed by the manufacturing sector with a share of 23.7%. The share of the agriculture sector will decline to 8.6%.
- In the Combined Agenda 2063 scenario, both the number and portion of poor people will significantly decline. By 2043, only about 5.2% of ECOWAS’ population will be living in extreme poverty, meaning 80.7 million more people could be lifted out of poverty.
- Total carbon emissions will rise to 325 million tons of carbon in the Combined Agenda 2063 scenario. This is 28.4% higher than in the Current Path forecast.
We end this page with a summarising conclusion offering key recommendations for decision-making.
ECOWAS faces significant challenges, including threats of withdrawal by member countries, security issues, governance problems, economic stagnation, and the impacts of climate change. The analysis suggests that current progress is insufficient to overcome structural challenges without aggressive interventions. To improve its development trajectory, ECOWAS must undertake targeted socio-economic policy interventions across all sectors focusing on security, anti-corruption, economic diversification, regional trade, energy sustainability and education quality.
All charts for ECOWAS Development Futures
- Chart 1: Political map of ECOWAS
- Chart 2: Population Structure in Current Path, 2019–2043
- Chart 3: Population density per hectare: 2019 vs 2043
- Chart 4: Urban and rural population in Current Path, 2019 vs 2043
- Chart 5: GDP (MER) in the Current Path, 1990–2043
- Chart 6: Size of the informal economy as % of GDP and % of total labour, 2019 vs 2043
- Chart 7: GDP per capita in Current Path, 1990–2043
- Chart 8: Extreme poverty in Current Path, 2019–2043
- Chart 9: Energy production by type in Current Path, 1990-2043
- Chart 10: Regional Development Plan of ECOWAS
- Sectoral approach to development
- Chart 11: Infant mortality rate in Current Path and Demographics and Health scenario, 2019–2043
- Chart 12: Demographic dividend in the Current Path and Demographics and Health scenario, 2019–2043
- Chart 13: Import dependence in the Current Path and Agriculture scenario, 2019–2043
- Chart 14: Mean years of education in Current Path and Education scenario, 2019–2043
- Chart 15: Value-add by manufacturing sector in Current Path and Manufacturing scenario, 2019–2043
- Chart 16: Trade balance in Current Path and AfCFTA scenario, 2019–2043
- Chart 17: Cookstoves usage in Current Path and Large Infrastructure and Leapfrogging scenario, 2019–2043
- Chart 18: Mobile and fixed broadband access in Current Path and Large Infrastructure and Leapfrogging scenario, 2019–2043
- Chart 19: Government revenue in Current Path and Financial Flows scenario, 2019–2043
- Chart 20: Composite governance index in Current Path and Governance scenario, 2019–2043
- Chart 21: GDP per capita in Current Path and scenarios, 2019–2043
- Chart 22: Poverty in Current Path and scenarios, 2019–2043
- Chart 23: GDP (MER) in Current Path and Combined scenario, 2019–2043
- Chart 24: GDP per capita in Current Path and Combined scenario, 2019–2043
- Chart 25: Value added by sector in Current Path and Combined Agenda 2063 scenario, 2019–2043
- Chart 26: Life expectancy in Current Path and Combined scenario, 2019–2043
- Chart 27: Poverty in Current Path and Combined scenario, 2019–2043
- Chart 28: Domestic Gini in Current Path and Combined scenario, 2019–2043
- Chart 29: Carbon emissions in Current Path and Combined scenario, 2019–2043
- Chart 30: Conclusion and Recommendations
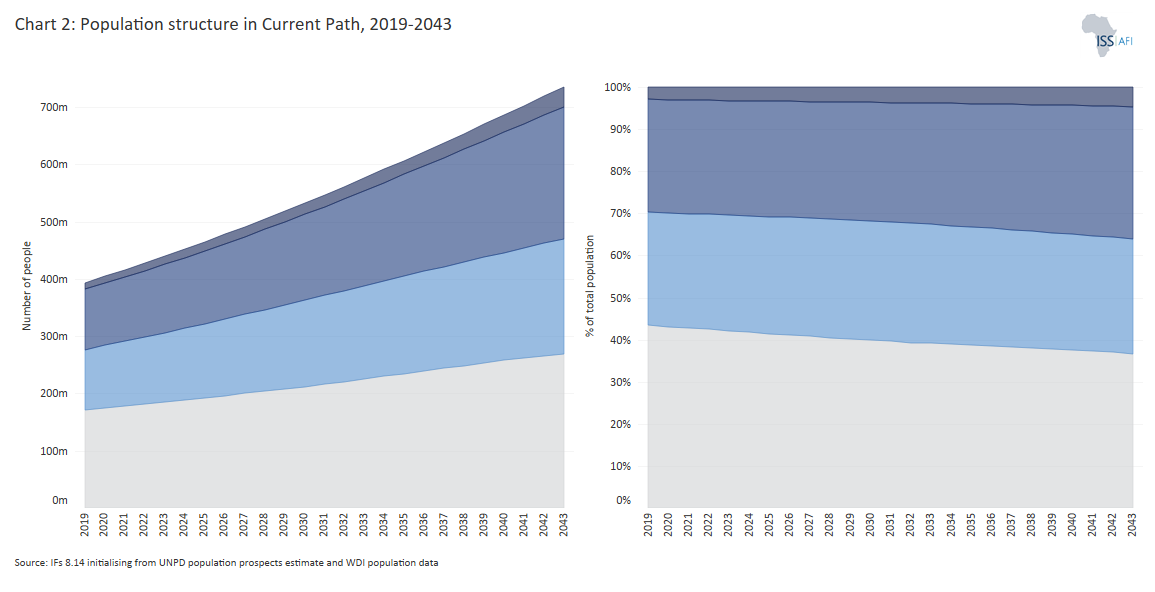
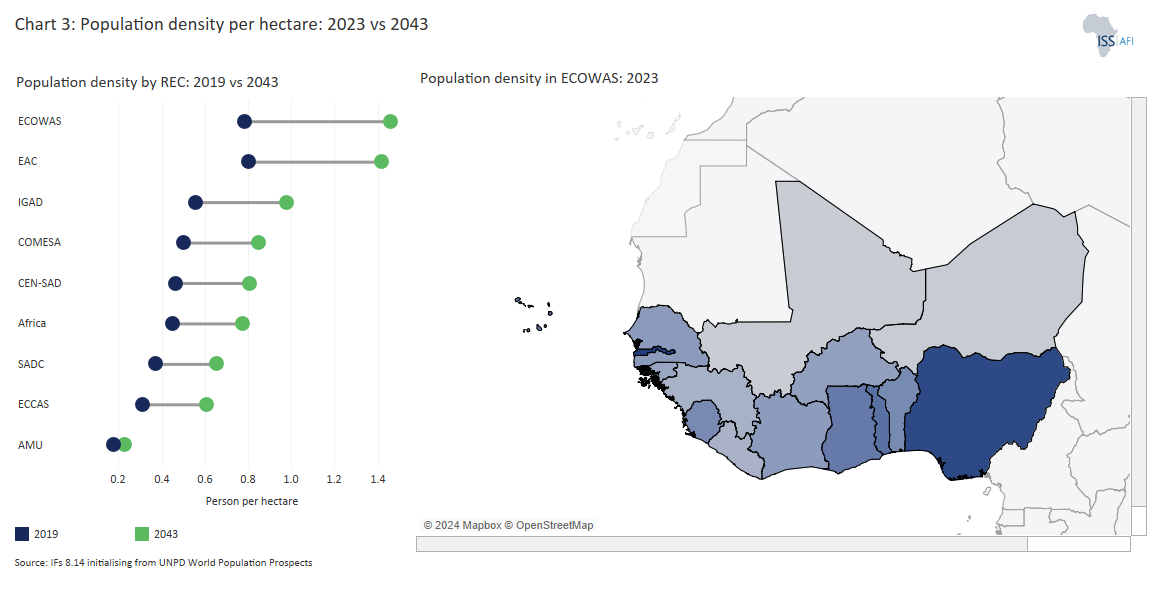
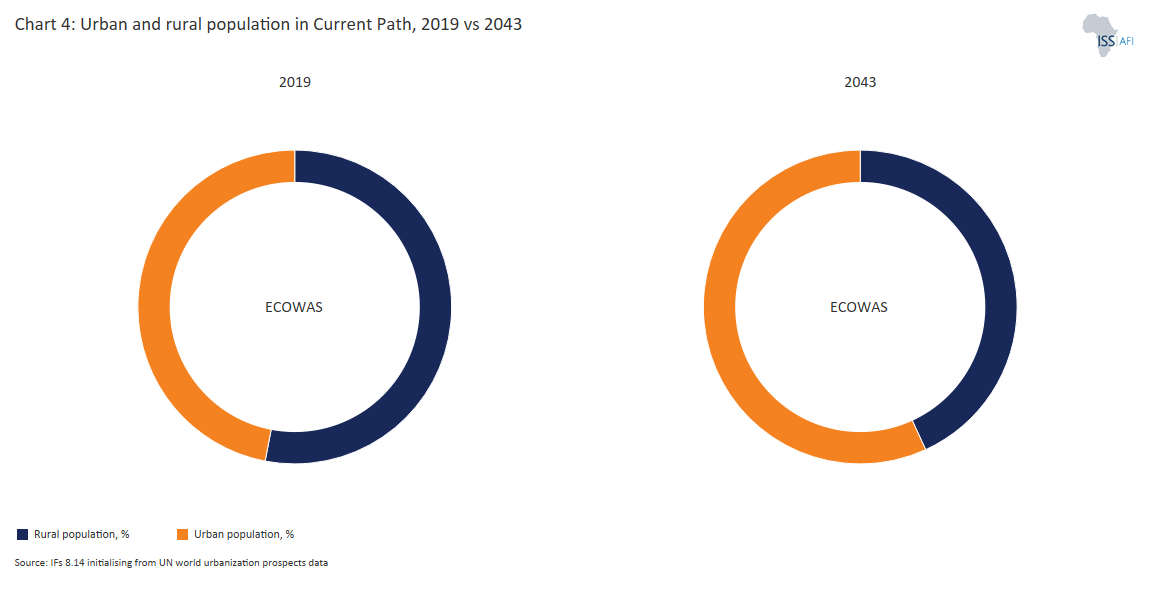
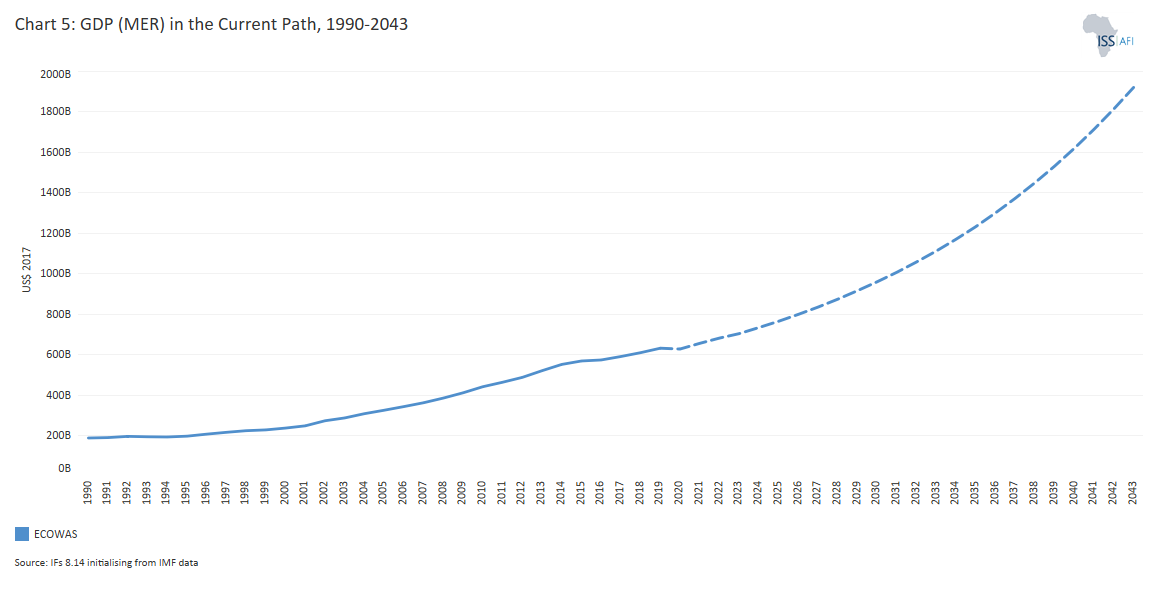
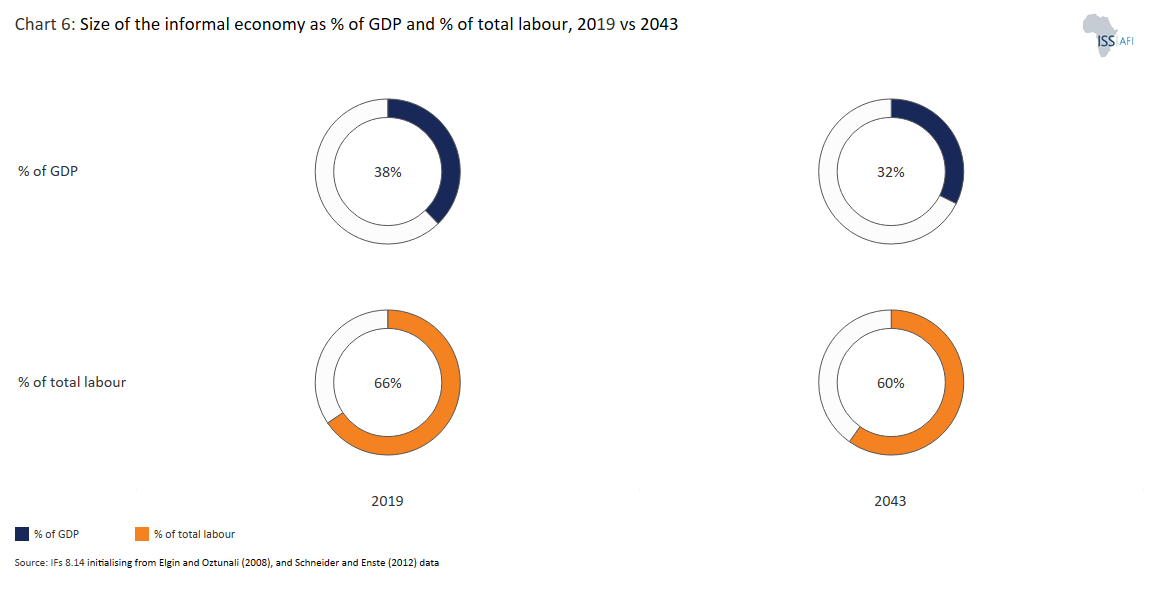
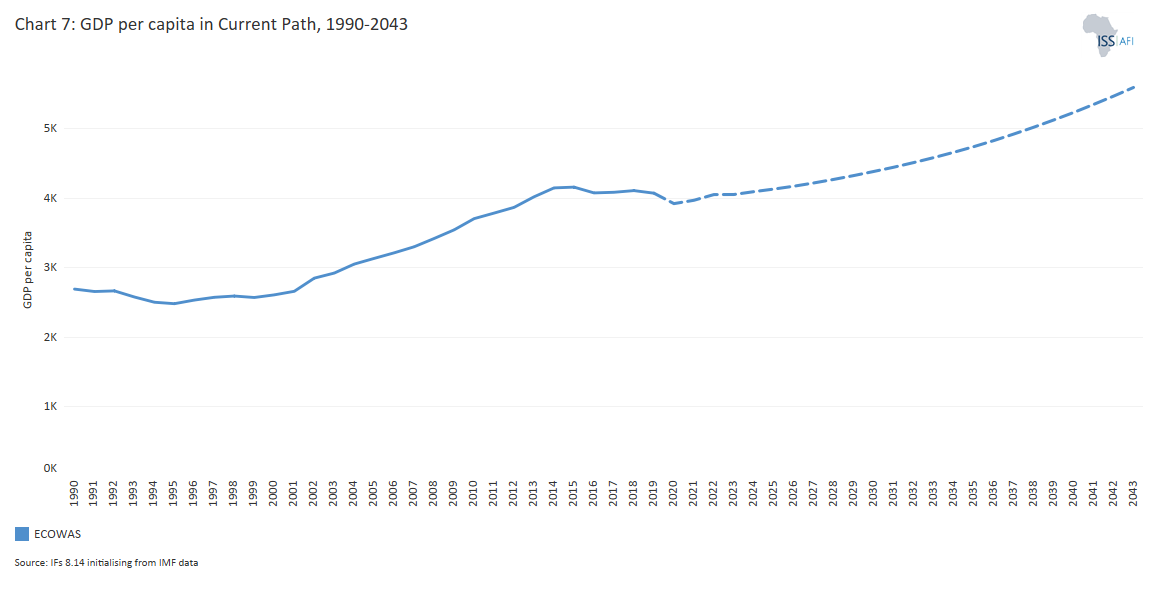
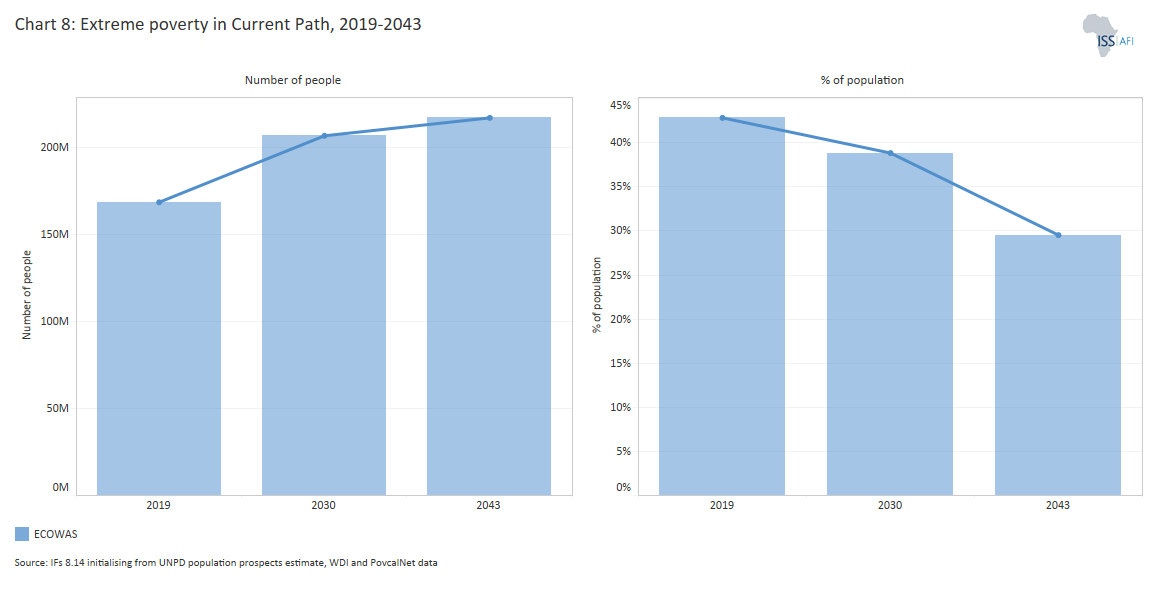
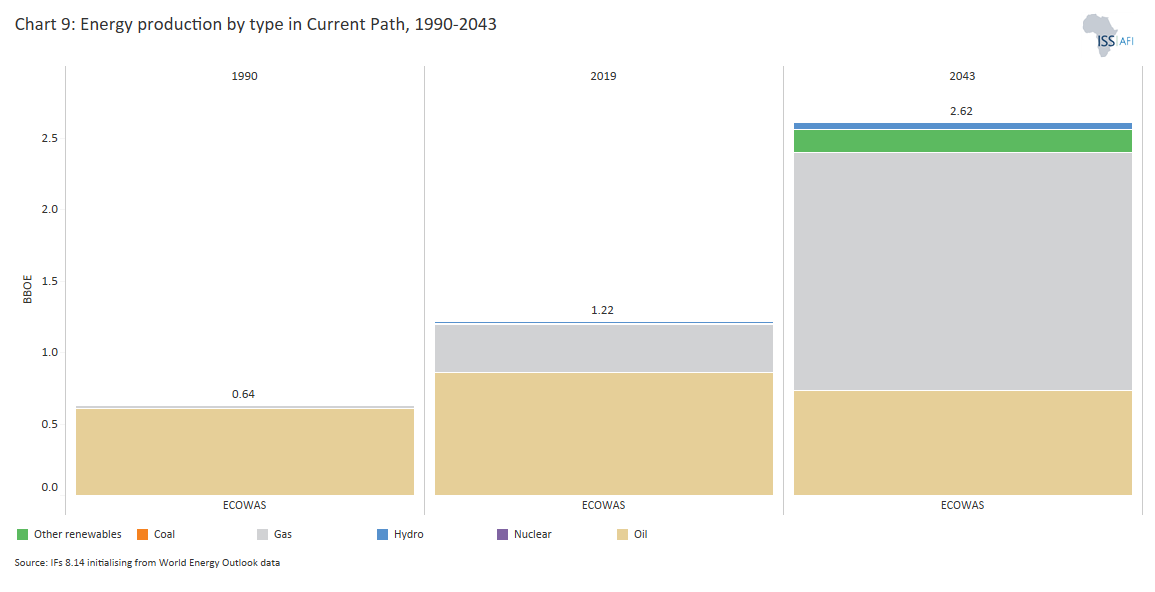


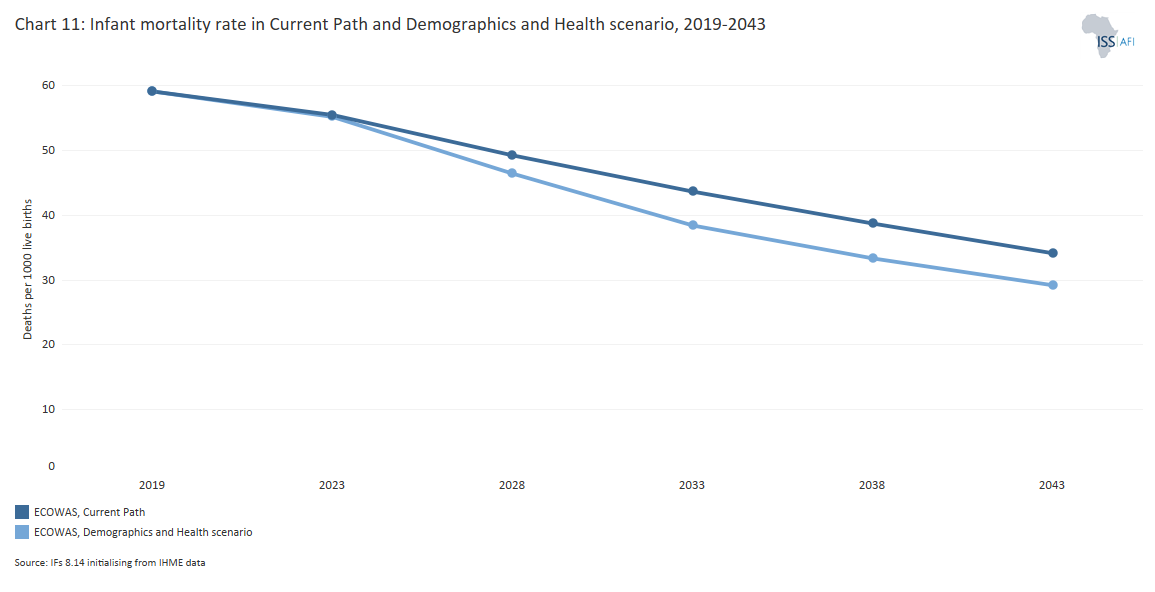
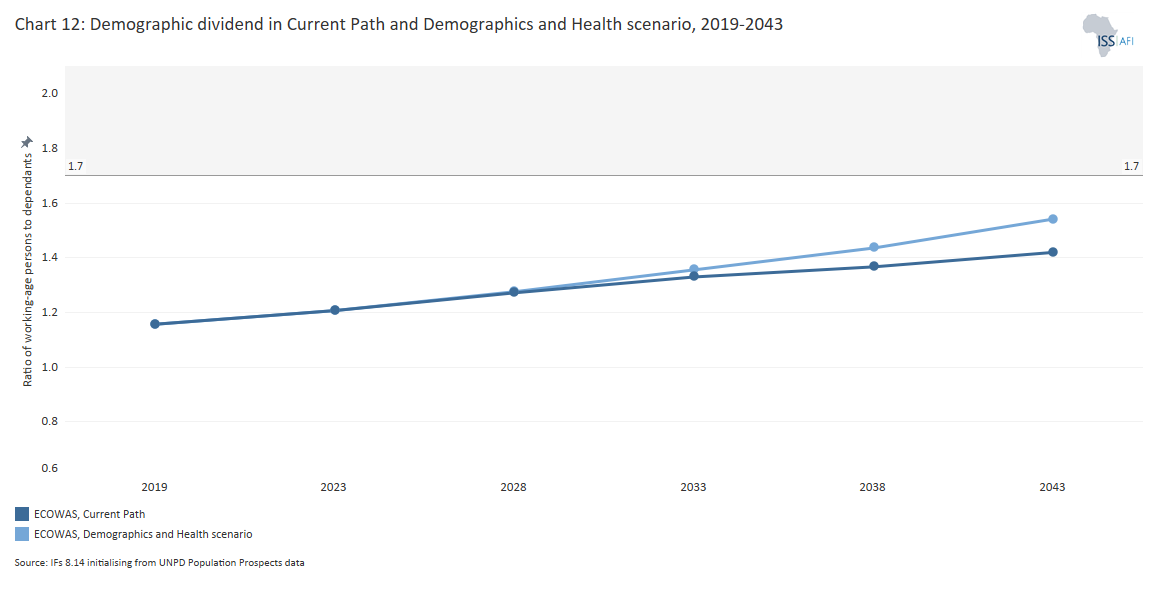
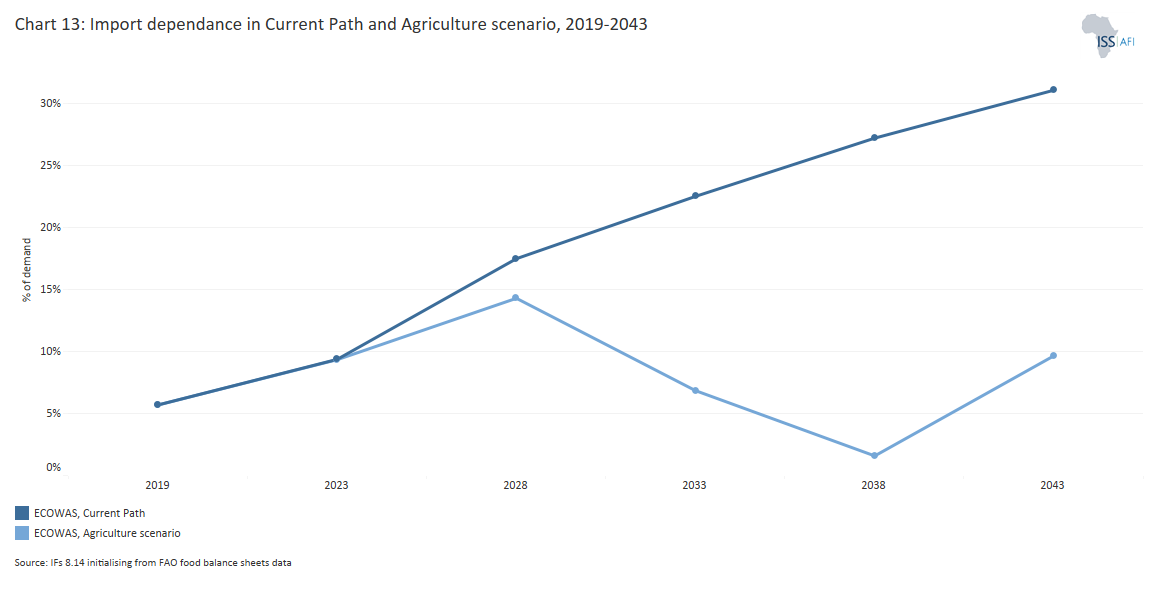
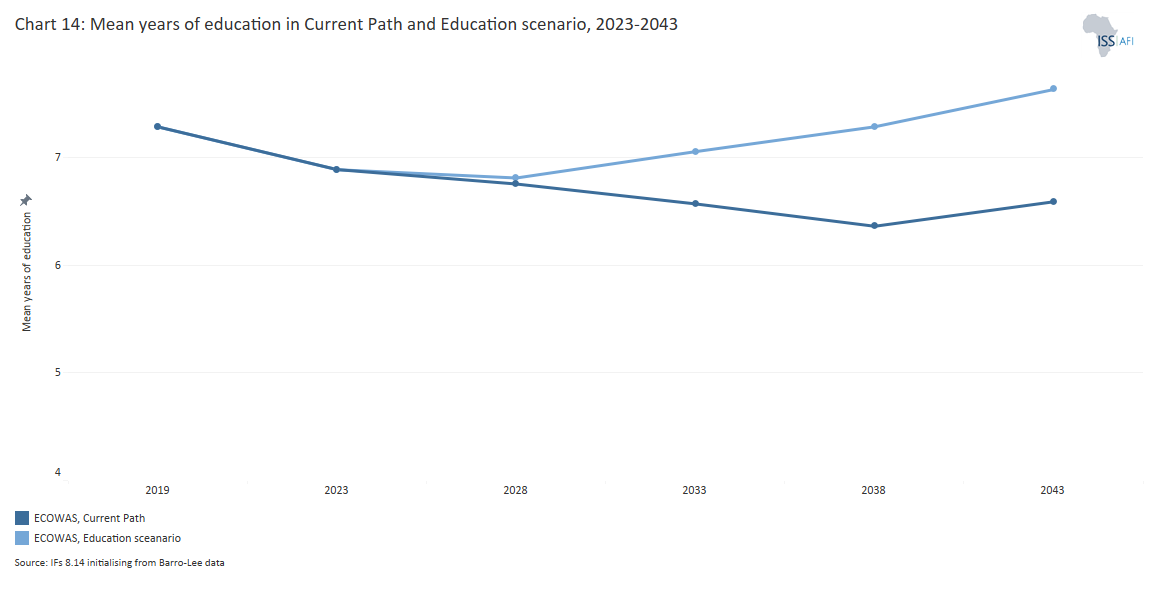
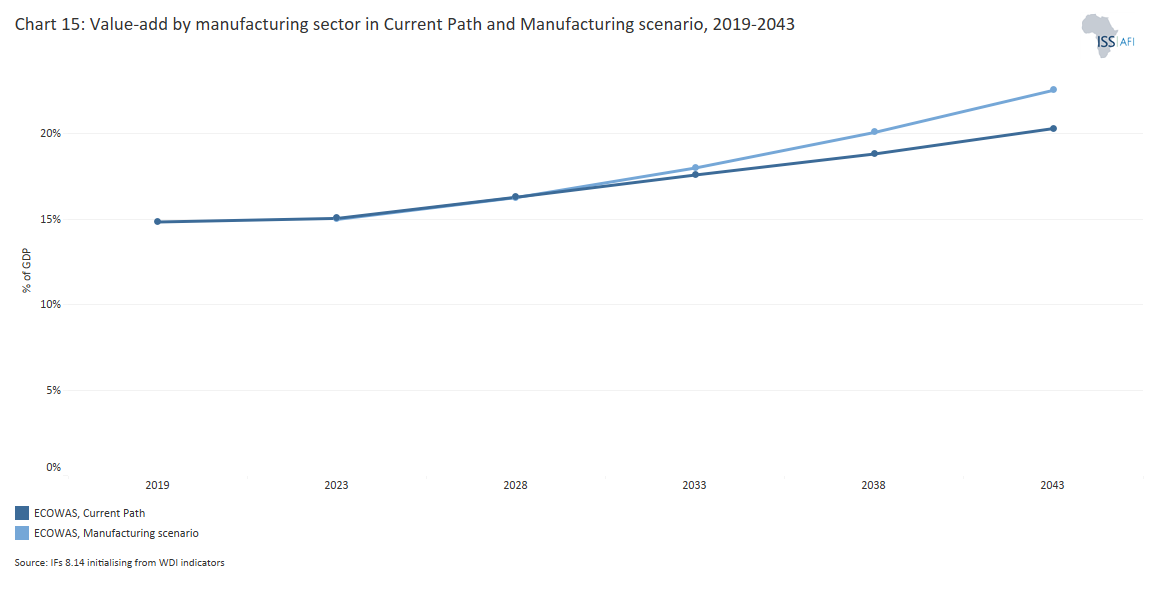
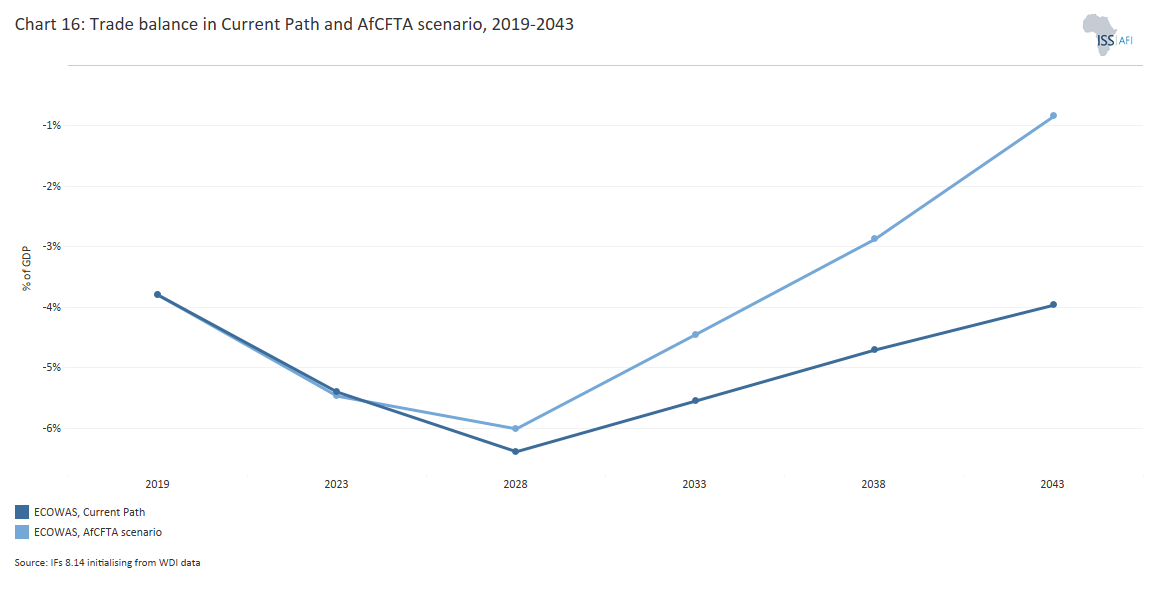
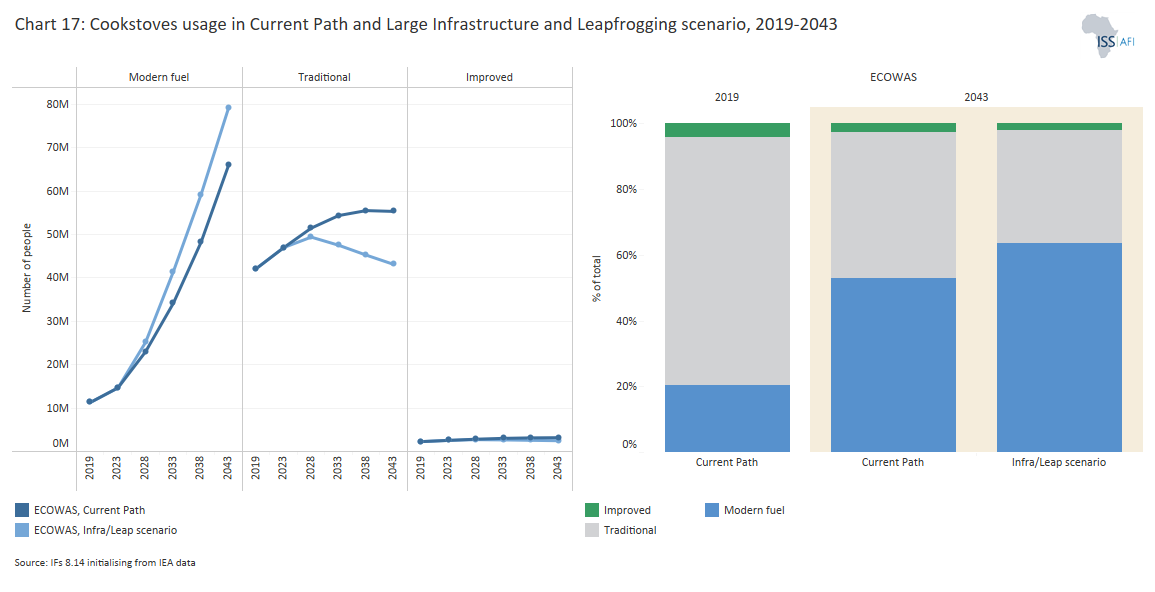
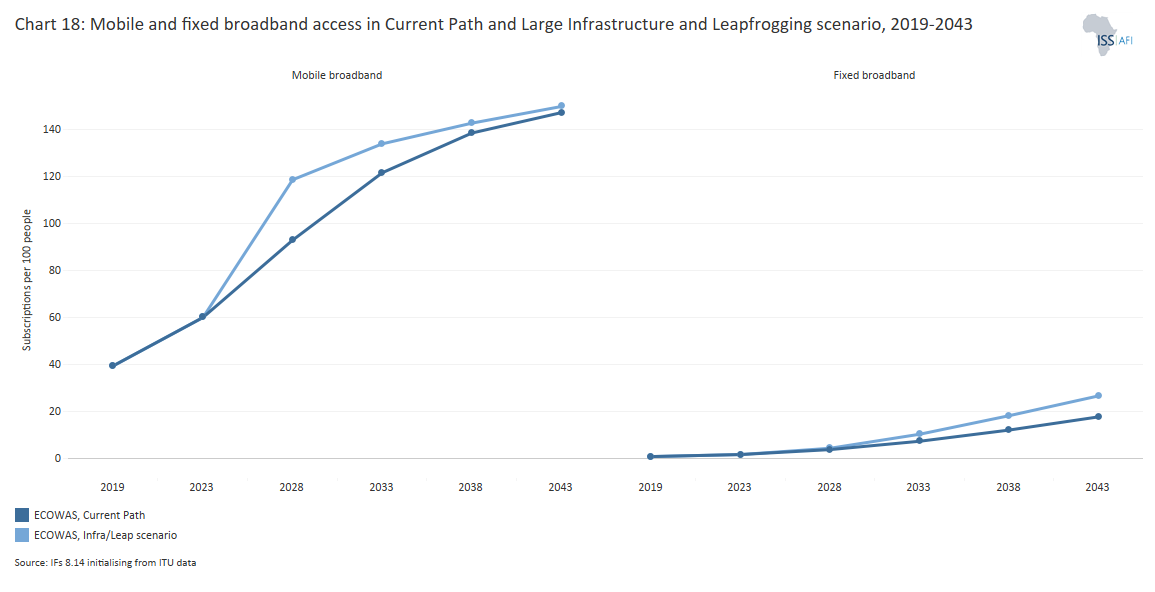
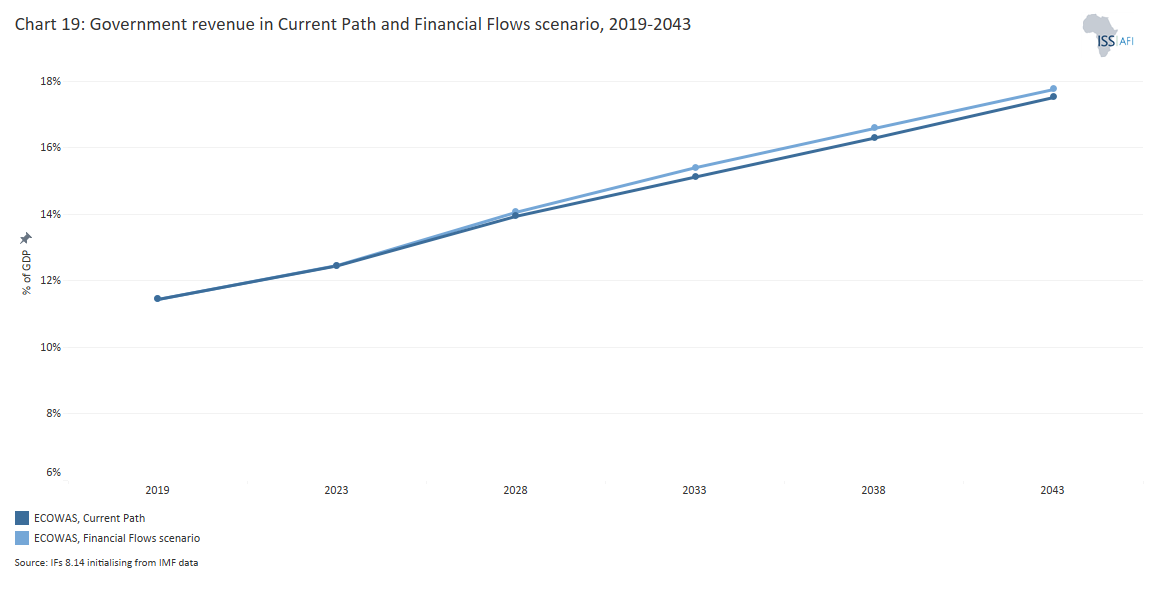
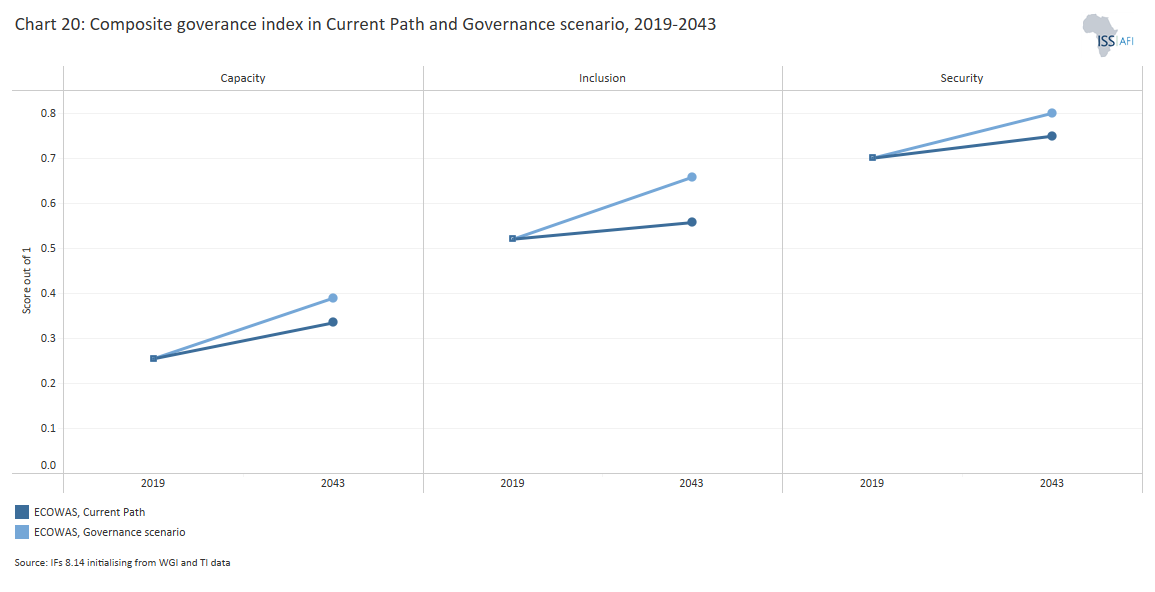
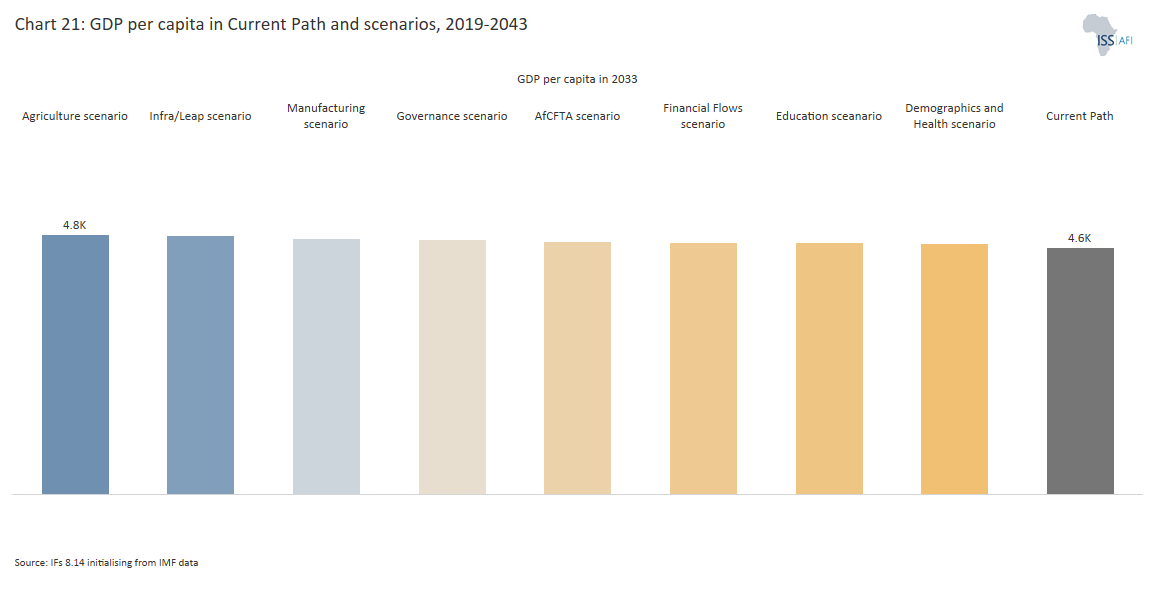
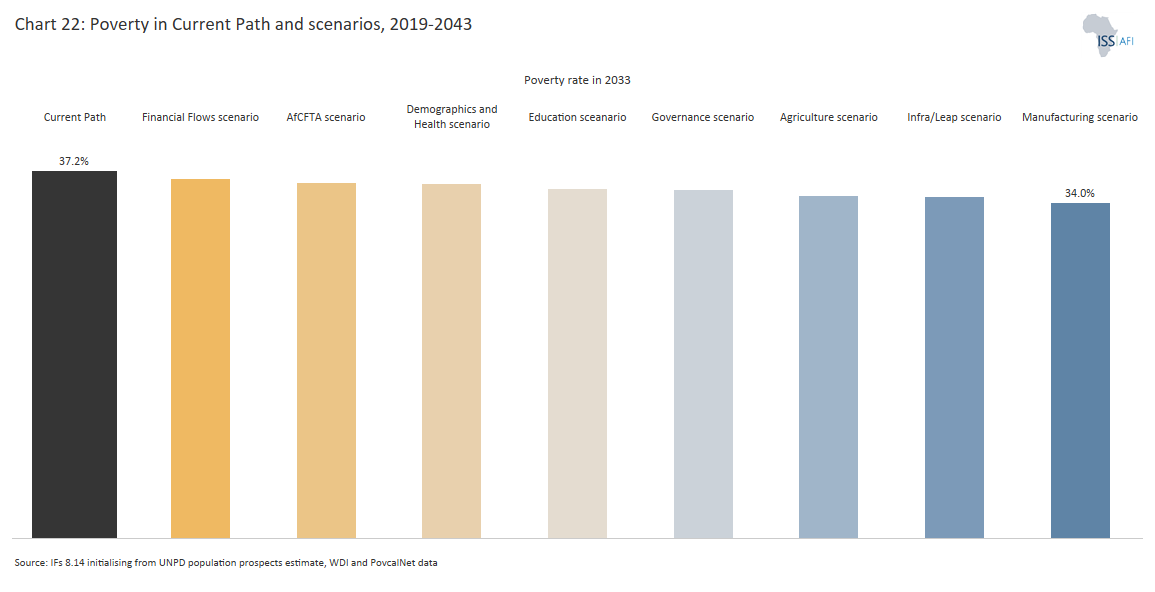
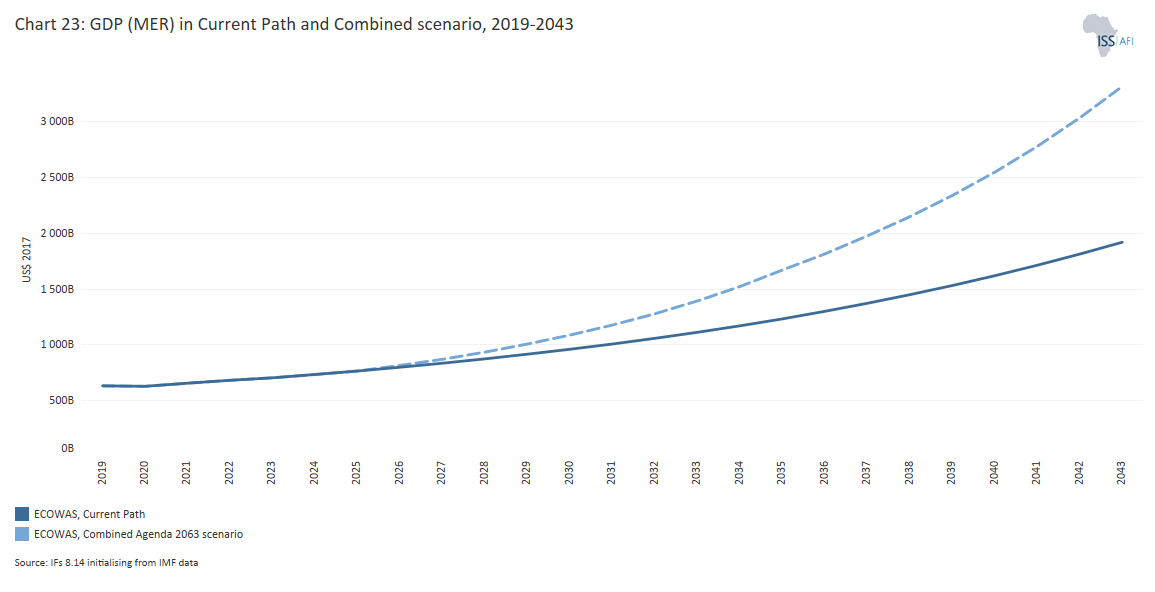
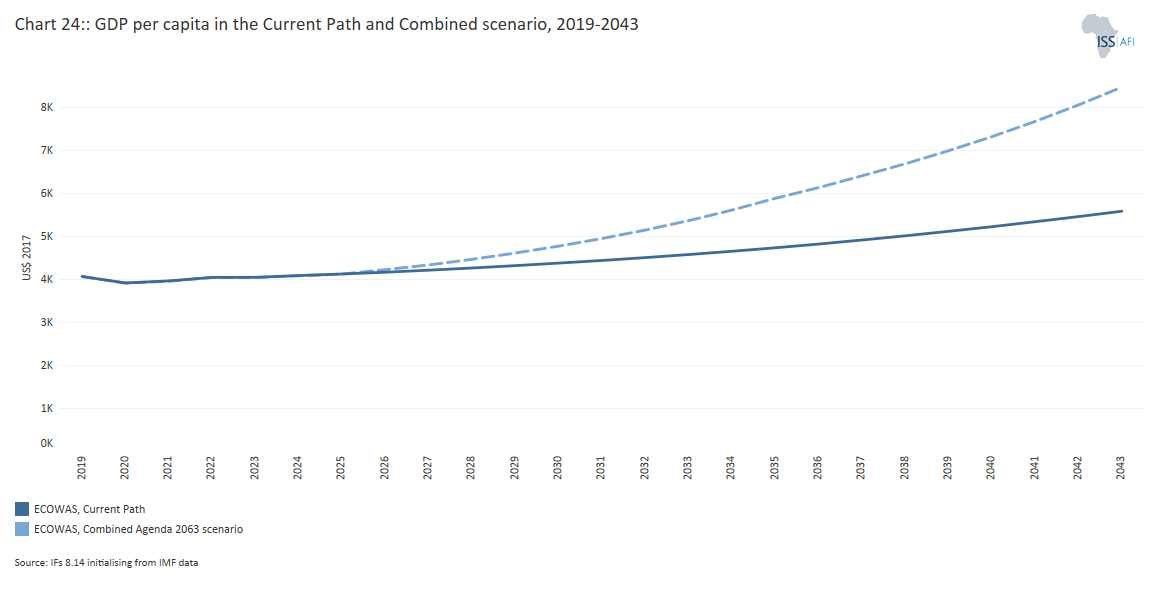
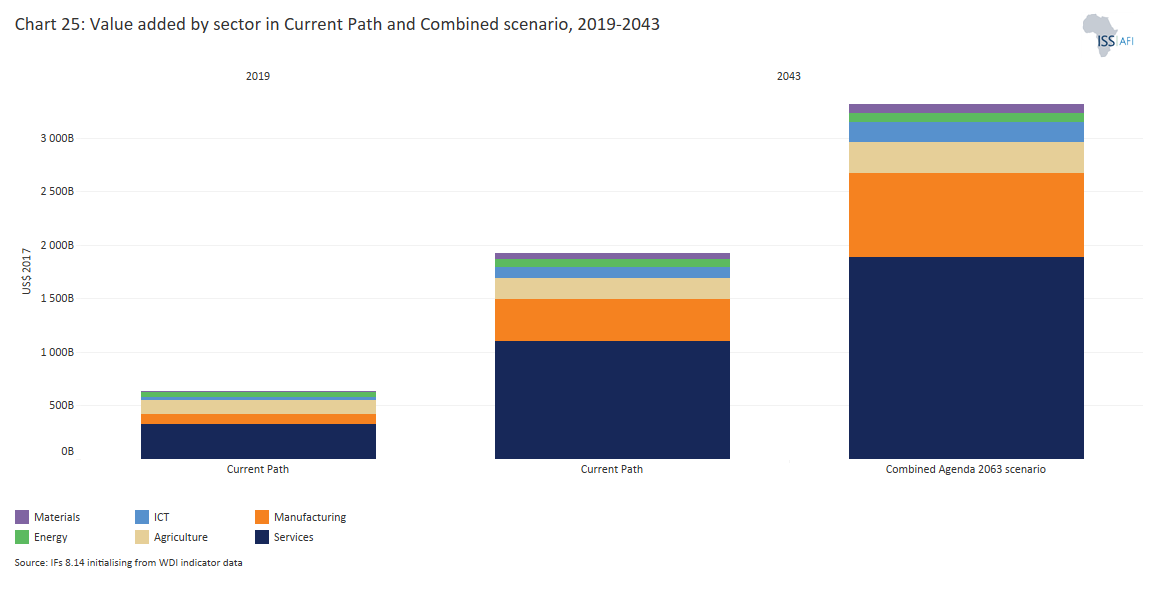
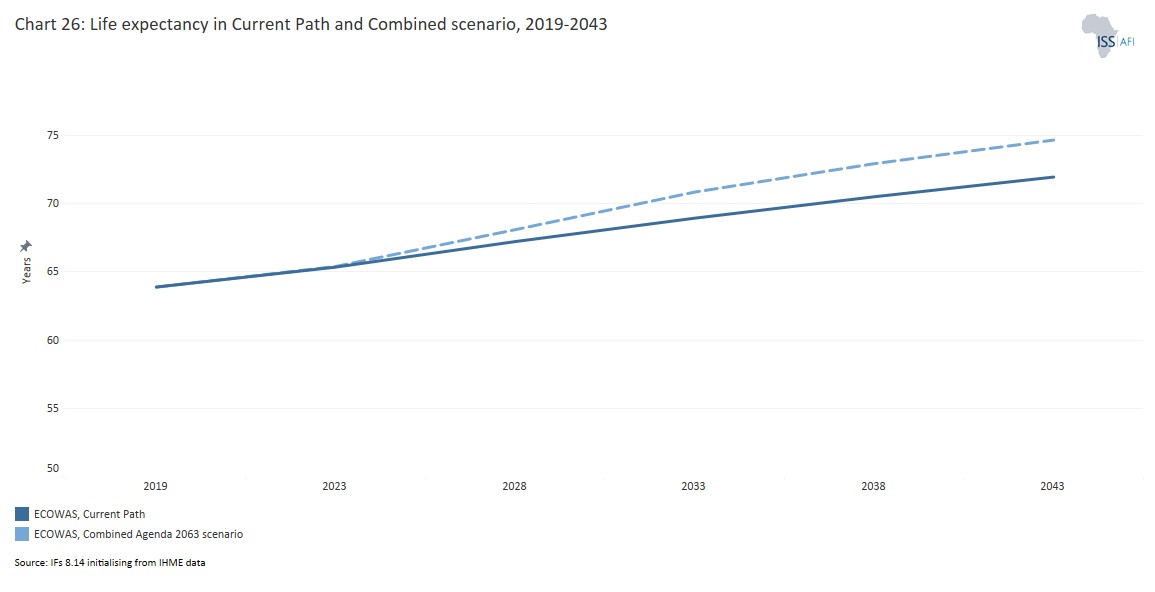
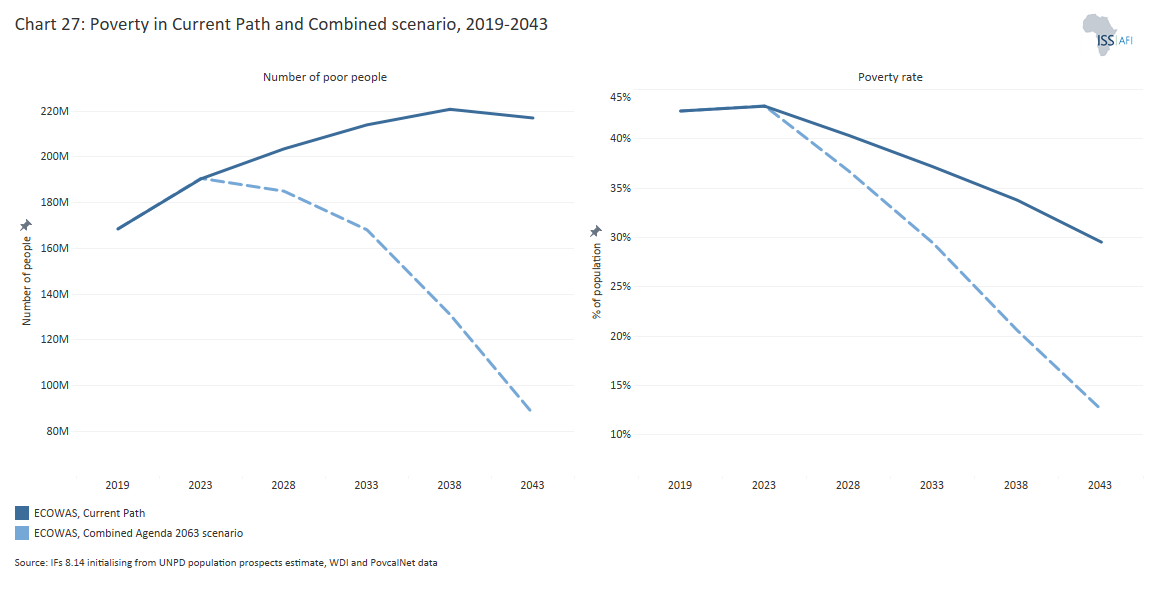
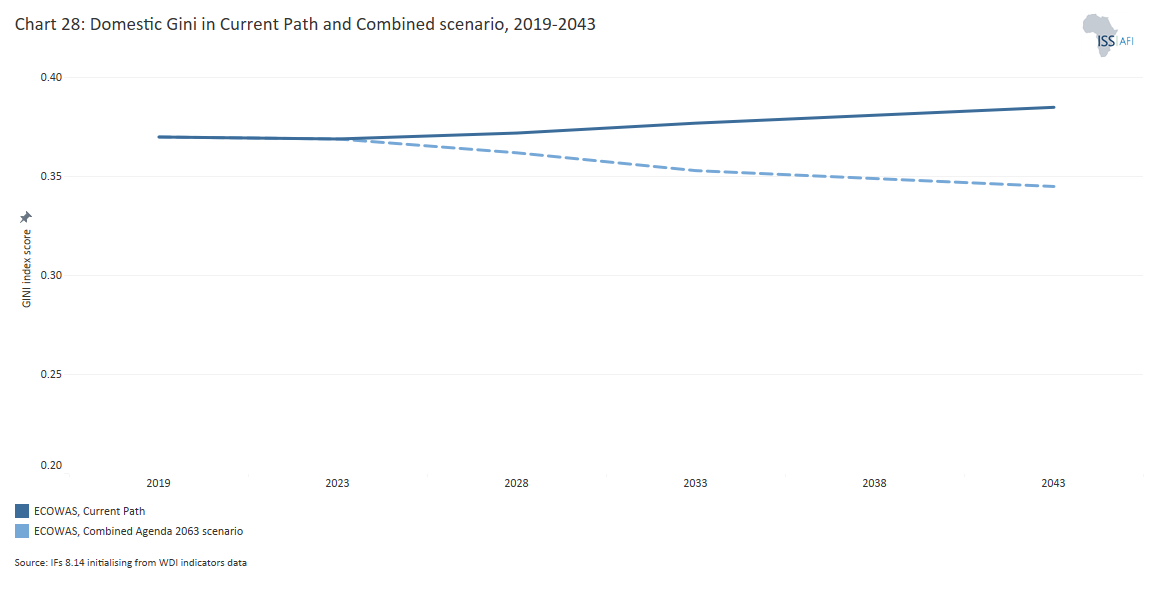
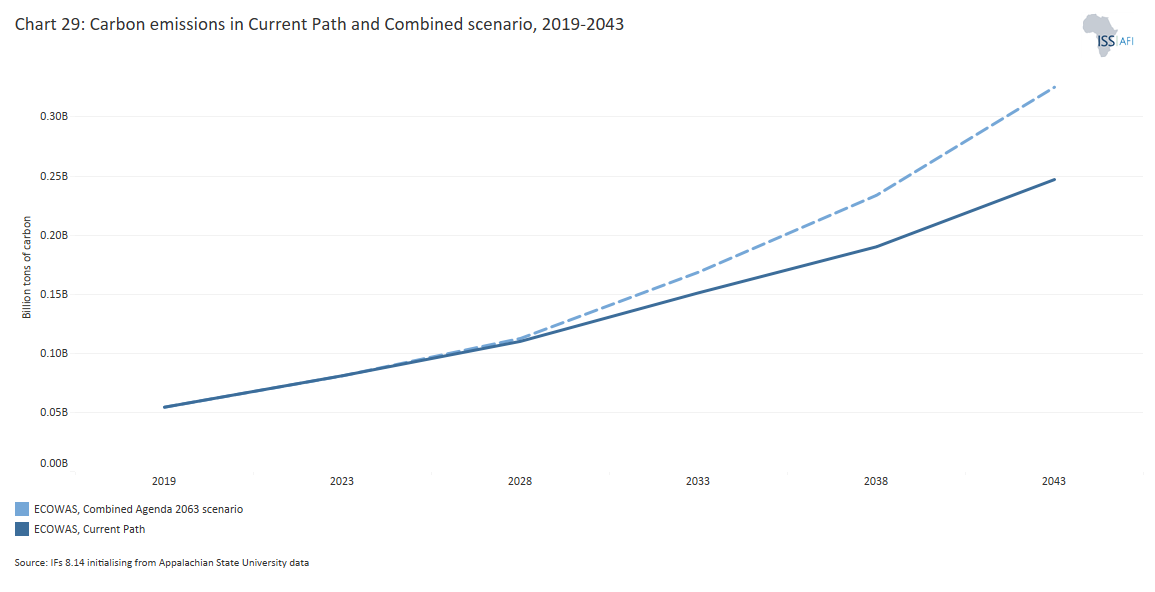
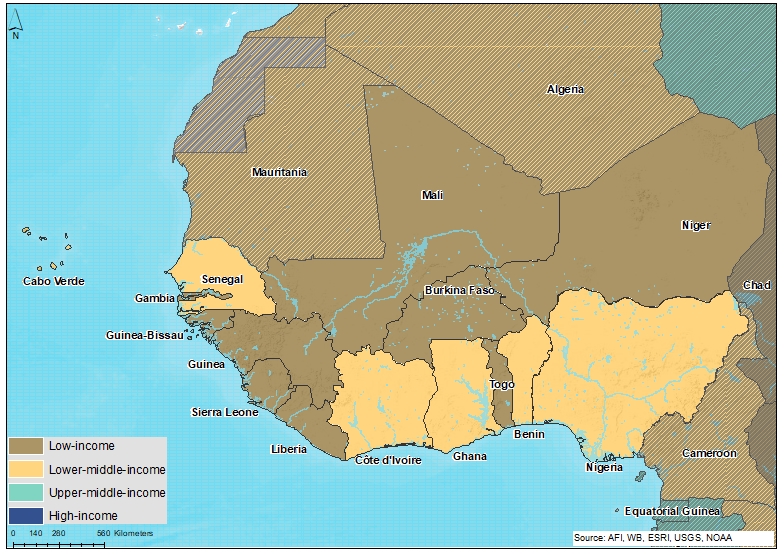
Chart 1 is a political map of ECOWAS.
The Economic Community of West African States (ECOWAS) was established on 28 May 1975 via the Treaty of Lagos, with the mandate to promote economic integration. It was formed to create a single trade bloc through economic cooperation. Its vision, as summarised in the ECOWAS Treaty, is “promoting co-operation and integration, leading to the establishment of an Economic Union in West Africa to raise the living standards of the peoples, and to maintain and enhance economic stability, foster relations-among Member States and contribute and contribute to the progress and development of the African Continent”.
Subsequently, in 1993, the Lagos Treaty was revised to focus more on regional integration, specifically in the areas of peace, security, conflict prevention, and resolution.
ECOWAS is one of the eight regional economic communities (RECs) recognised by the African Union with a total landmass of 5 112 903 km2. It consists of 15 member states (see Chart 1). According to the 2023 World Bank country income group classification, ECOWAS is composed of six lower-middle-income countries (Benin, Cabo Verde, Côte d’Ivoire, Ghana, Nigeria, and Senegal) and nine low-income economies (Burkina Faso, The Gambia, Guinea, Guinea-Bissau, Liberia, Mali, Niger, Sierra Leone and Togo). Eight countries in the Community (Benin, Burkina Faso, Côte d'Ivoire, Guinea-Bissau, Mali, Niger, Senegal, and Togo) belong to the West African Economic and Monetary Union (WAEMU), which uses the CFA as its currency (though there are again efforts to change this) whilst the remaining countries continue to hold on to their national currencies.
Burkina Faso, Niger, and Mali are landlocked countries.
The region is endowed with vast deposits of natural and mineral resources including petroleum ( Côte d’Ivoire, Niger, Nigeria, Senegal, Ghana), gold (Ghana, Mali, Burkina Faso, Guinea), diamonds (Guinea, Sierra Leone, Ghana), uranium (Guinea, Mali, Nigeria, Senegal), phosphate (Senegal, Togo), manganese (Burkina Faso, Togo, Ghana, Côte d’Ivoire), salt (Senegal, Ghana, Guinea, Cabo Verde) and more. The region also boasts about 11% of global dense tropical forests, although it has lost about one-third of its mangrove forests in the last 25 years.
The region's climate can be divided into two zones: the Sahel and the Gulf of Guinea. Annual temperature is above 28∘C, and annual rainfall ranges from 200 mm in the North to over 2 000 mm in the South.
Since its formation, the Community has steadily progressed in advancing its vision. To some extent, it succeeded in creating a “borderless” region to facilitate trade and integration among member countries. Citizens of member countries generally enjoy free movement through the ECOWAS identity card. Based on the 2023 African Visa Openness Report, citizens of 10 member countries (Benin, Burkina Faso, Côte d’Ivoire, The Gambia, Liberia, Mali, Niger, Senegal, Togo and Guinea) do not require visas to travel to any country in the region. The remaining five countries require a visa on arrival.
However, there are still significant challenges that impede the vision of ECOWAS. It faces a widespread threat of terrorism and general insecurity. Outbreaks of health pandemics such as Ebola and COVID-19 worsened developmental outcomes. The Sahel countries (Mali, Niger, Burkina Faso and Nigeria) face an imminent danger of climate change. Moreover, the vision of regional integration through economic and monetary union with a single currency (the ECO) has yet to be manifested. The region also faces numerous developmental challenges, such as recurring power outages and inadequate and poor health and transport infrastructure. Other challenges include tariff and non-tariff barriers, skill deficiencies and a high unemployment rate, especially among the youth.
Recent governance and geopolitical development also undermine the region's peace, security and integration. Already, three member countries (Burkina Faso, Mali and Niger) under military leadership have proposed a separate confederation and officially communicated their decision to exit the regional bloc effective Janaury 2025 given the “illegal, illegitimate, inhumane and irresponsible sanctions” levied against them after the unconstitutional changes in government. This is after accusing the leadership of ECOWAS of deviating from its founding principles and also failing to help them combat terrorism and insecurity.
ECOWAS: Current Path
Download to pdfChart 2 presents the population structure to 2043 in the Current Path .
The total population of ECOWAS increased by 118% from 180.8 million in 1990 to 393.4 million in 2019, making it the third most populous REC on the continent, after the Community of Sahel-Saharan States (CEN-SAD) and the Common Market for Eastern and Southern Africa (COMESA). The population of Nigeria (about 203.3 million in 2019) makes up more than half of the total population of ECOWAS. Nigeria is followed by Ghana and Côte d'Ivoire, with populations of about 31.5 million and 26.2 million people, respectively. The least populous member countries are Cabo Verde (577 000), Guinea-Bissau (1.9 million) and The Gambia (2.5 million). By 2043, the total population of ECOWAS will be 765.1 million, still lower than those of CEN-SAD and COMESA.
In 2019, the proportion of the ECOWAS population younger than 15 was 43.4%, a slight shift from the 1990 figure (45.4%) which suggests that the youthful population structure has not changed much. The population growth rate of 2.8% is the third highest, after the Economic Community of Central African States (ECCAS) and the East African Community (EAC). The average median age for ECOWAS was 18 years in 2019, lower than the EAC and ECCAS. The median age ranges from 15.4 years (Niger) to 26.6 years (Cabo Verde). Indeed, only Ghana and Cabo Verde have a median age above 20 years. By 2043, the median age of the region will be 22 years, which will still be higher than that for ECCAS and EAC.
ECOWAS has the fourth highest youth bulge among the RECs in Africa, after the Intergovernmental Authority on Development (IGAD), the EAC and ECCAS. It was about 47.5% in 2019 and will decline to 42.3 in 2043 which is still high. Within ECOWAS, countries with a higher youth bulge include Niger (50.7%), Guinea (50.4%), Mali (50.2%) and Burkina Faso (49.1%). Cabo Verde, Ghana, Togo and Liberia have lower youth bulges (40.6%, 43.1%, 45.6% and 45.9%, respectively). While a large youth bulge can usher in youth activism and positive political changes in the region, it can also increase the likelihood of criminal violence, conflicts and instability when the needs of the youth, such as employment, are not met. In 2020, the unemployment rate among young people aged between 15 and 24 in the region was at 11.9% - a number that would be much higher if 'employment’ in the informal sector was excluded. It is not surprising that the countries with the highest youth bulge in the region have all witnessed military coups in the last three years. The Current Path forecast shows that by 2043, the proportion of people younger than 15 will decline to 36.4%, while the proportion of people between 15 and 65 years will rise to 58.9% as fertility rates slowly decline.
Chart 3 presents a population density map.
The population of ECOWAS is settled on a total land area of 6.14 million km2. The population density of the subregion was 0.78 people per hectare in 2019, which is the highest among the RECs and greater than the average for Africa (0.45 people per hectare). The Gambia, Nigeria and Togo have the greatest population densities, at 2.48, 2.23 and 1.52 people per hectare, respectively. Countries with the lowest population densities in the region are Liberia (0.52 people per hectare), Niger (0.19 people per hectare) and Mali (0.17 people per hectare).
The population of West Africa is unequally distributed across the region. Settlement patterns in ECOWAS are mostly dependent on climatic factors, soil fertility and economic opportunities. Thus, the population is densely concentrated in arable regions such as the Peanut Basin of western Senegal, the Niger–Nigeria border region, central Burkina Faso and south-western Chad owing to the favourable climatic conditions and high soil fertility. The riverine plains of the Senegal and Niger rivers also have high settlements as a result of the availability of perennial water for irrigation farming. In addition, there are dense coastal settlements because of the economic opportunities in these areas. In contrast, the northern part of ECOWAS is sparsely populated owing to the arid nature of the area.
Chart 4 compares urban and rural populations in the Current Path and the Demographics and Health scenario.
The majority of the ECOWAS population lives in rural areas, although the rate differs between member states. As of 2019, 53.0% of the total population resided in rural areas – a decline from about 70% in 1990. This is lower than the average of 57% for Africa and the other RECs, except for the Arab Maghreb Union (AMU). ECOWAS has a faster urbanisation rate than the continent’s other RECs or Africa as a whole. Because of rapid urbanisation, there is a growing trend of slums in urban centres partly due to poor urban planning. According to the UN Economic Commission for Africa (UNECA), 47% of urban populations in the region live in slums with living conditions worse than in rural areas.
Generally, urbanisation ought to increase economic growth but this has not been the case in the region. Growth in urban centres has not been accompanied by proportional growth in GDP. Six member countries had less than half of their populations living in rural areas, ranging from Nigeria and Côte d'Ivoire (both at 48.8%), Liberia, Ghana, The Gambia and Cabo Verde at 33.8%. However, Niger (83.5%), Burkina Faso (70.0%) and Guinea (63.5%) all had a high proportion of their populations living in rural areas in 2019. On the Current Path, by 2043, 57.6% of the population of ECOWAS will reside in urban centres, above the average for Africa and other RECs (except for the AMU). This high urbanisation rate will come with associated unintended consequences, such as pressure on urban amenities.
Chart 5 presents the size of ECOWAS’ economy from 1990 and includes a forecast to 2043 including the associated growth rate.
Most countries in ECOWAS rely on primary commodity exports with little or no added value. For instance, Nigeria's economy largely depends on exporting its oil, while Ghana and Côte d’Ivoire rely significantly on cocoa, gold and other mineral exports. As a result, their economies are susceptible to international commodity price fluctuations and shocks.
In 2019, ECOWAS had the fourth largest economy among Africa’s RECs with a GDP of US$633.1 billion, representing about 25.5% of the continent’s total economy. This constituted an increase of 233.2% from 1990 when GDP was at US$190.0 billion. This is dominated by Nigeria (GDP of US$391.4 billion in 2019 constituting 61.8% of the total) and the smallest economies are Guinea-Bissau, The Gambia and Cabo Verde, each representing less than 0.5% of the Community total.
The ECOWAS economy grew at 3.6% in 2019. However, the COVID-19 pandemic greatly affected the region, hampering growth. It was projected to grow at 4% in 2020, yet contracted by almost 1%. The pandemic caused contractions in six of its member states (Mali, Nigeria, Sierra Leone, Guinea Bissau, Liberia and Cabo Verde) in 2020. According to an Oxfam report, the West African region lost about US$48.7 billion in GDP and working hours, which is equivalent to 7 million jobs, in 2020.
Inflation in the region is relatively low compared to other parts of the continent, primarily due to the pegged exchange regime of the WAEMU. Notwithstanding, the annual inflation rate in the region rose from 9.7% to 17% (average from 2014-2020), mainly because of higher inflation rates in non-WAEMU countries (Ghana, Sierra Leone and Nigeria). This high inflation rate was primarily caused by increases in food and energy prices after COVID-19 and worsened following Russia’s invasion of Ukraine. This was accentuated by the restrictive monetary policies implemented in advanced economies resulting in tight global financial market conditions.
The region suffers from high public debt levels. The average public debt-to-GDP ratio increased from 37.1% in 2019 to 49.3% in 2022. This increase is driven by the widening fiscal deficit, weak domestic currencies and low economic growth. The ratio is particularly high in non-oil exporting countries, with the debt-to-GDP ratio reaching 73% in 2022. For instance, in Cabo Verde it reached 137.1% in 2022. On the other hand, it was low (37% in 2022) for the oil-exporting countries due to the surge in oil prices thereby increasing revenues.
A large part of external debt stems from growing appetite for Eurobond in ECOWAS. For instance, Ghana, Nigeria, Côte d’Ivoire, Senegal and Benin have all issued Eurobonds over the past decade. As a result, all countries in the region are at risk of debt distress. In 2022, Ghana, The Gambia, Sierra Leone, and Guinea Bissau were classified as high risk, with the remaining countries at moderate risk. In fact, Ghana defaulted on its debt in December 2022 and embarked on debt restructuring. All these challenges are hampering economic recovery and growth in the region. Moreover, economic sanctions imposed by ECOWAS on Burkina Faso, Niger, Guinea and Mali that were involved in military takeovers also affected their economic activities.
Nonetheless, the region has an optimistic outlook with economic growth to rebound to 4.2% in 2024. This is partly due to most countries signing onto an IMF support programme. Currently, nine countries (Senegal, Benin, Niger, Liberia, Sierra Leone, the Gambia, Ghana, Côte d’Ivoire and Cabo Verde) are on IMF-supported programmes.
Long term growth prospects are positive reflecting economic potential. The GDP of ECOWAS will have more than tripled by 2043, reaching about US$2.0 trillion, equivalent to an increase of 214.5% over that period. This will increase the share of ECOWAS in Africa’s economy to about 29.2% by 2043. The GDP increase will largely be driven by the expected growth in Nigeria, although its share will decline to 53.6% of the total ECOWAS economy by then.
Chart 6 presents the size of the informal economy as a per cent of GDP and in absolute terms, as well as the per cent of total non-agriculture labour involved in the informal economy.
ECOWAS has a large informal economy. The World Economic Forum estimated that the informal sector in ECOWAS constitutes about 80% of total employment and 90% of all new jobs. About 60% of self-employment is also in the informal sector. This sector consists of small enterprises and large firms with organised networks. The majority of young people work in the informal sector with poor employment conditions and little social security. The unfavourable business climate in the region and the inability to enforce regulation hinder the activities and formalisation of the sector.
In 2019, the informal sector represented 37.8% of the region’s GDP, equivalent to US$279.6 billion. As a percentage of GDP, the informal sector was larger than the average for Africa (26.1%) and the largest among the RECs. The size of the informal sector varies among member states, ranging from as high as 42.1% of GDP in Benin to 29.4% in Ghana. A major implication of the large informal economy is the low tax-to-GDP ratio. Based on its unregulated nature, the government is unable to derive the needed tax revenue from the sector. For instance, Cabo Verde which has the lowest informal sector in the region also had the highest tax-to-GDP ratio of 24% while Nigeria with one the biggest informal sectors had a tax-to-GDP ratio of 2.8% in 2022.
On the Current Path, the size of the informal sector will decline to 31.5% of GDP, seven percentage points higher than the average for Africa and the highest amongst all RECs. Benin, Nigeria, Côte d’Ivoire, Liberia and Guinea Bissau will have an informal sector representing more than 30% of their GDP in 2043. Other countries’ informal sectors are expected to be smaller (e.g. Cabo Verde’s will account for 17.6% of GDP by 2043).
With regard to the labour force, the proportion of people employed in the informal sector in ECOWAS averaged 65.6%, which is lower only compared to ECCAS (68.6%) and the EAC (72.3%). Only Cabo Verde (35.7%) and Ghana (49.4%) have less than 50% of its labour force employed in the informal sector, while the proportion is very high in countries such as Mali (81.8%) and Benin (74.9%). Although this proportion across ECOWAS will decline to 59.1% by 2043 on the Current Path, it will still be the region with the highest informal employment in Africa. It will range from 71.5% in Mali to 28.7% in Cabo Verde and will hinder government revenue mobilisation efforts as activities in the sector are largely untaxed. Also, having more people work in the informal sector instead of the formal sector can increase poverty as there is evidence to show that informal workers are often exploited and earn lower wages with little or no social protection.
Chart 7 presents average GDP per capita from 1990 and includes the Current Path forecast to 2043.
The average GDP per capita in ECOWAS increased from US$2 693 in 1990 to US$4 145 in 2019, representing an increase of 53.9% over that period. In 2019, the region’s GDP per capita constituted 83.2% of Africa’s average of US$5 289. It was the fourth highest among the RECs after AMU, CEN-SAD, COMESA and the Southern African Development Community (SADC). GDP per capita in member countries varied from US$7 793 (Cabo Verde) US$1 656 (Sierra Leone).
The higher GDP per capita in Nigeria can be attributed to the country’s large oil reserves. In Ghana and Côte d’Ivoire it is a result of natural resources such as cocoa, gold and, in recent years, notable oil reserves. In Cabo Verde, a buoyant tourism sector coupled with a relatively small population size explains the higher GDP per capita. In contrast, Niger, Liberia, and Sierra Leone are poorer countries, in part because of civil wars and instability. The average GDP per capita of ECOWAS will be US$5 754 by 2043. This will still be below Africa’s average of US$6 450 and the averages for AMU, CEN-SAD, COMESA and SADC.
Chart 8 presents the number of people living in extreme poverty, also expressed as a per cent of the population.
In 2022, the World Bank updated its poverty lines to 2017 constant dollar values as follows:
- The previous US$1.90 extreme poverty line is now set at US$2.15, also for use with low-income countries.
- US$3.65 in 2017 values (previously US$3.20 in 2011 values).
- US$6.85 in 2017 values. (previously US$5.50 in 2011 values)
- The Bank has not yet announced the new poverty line in 2017 US$ prices for high-income countries.
Monetary poverty only tells part of the story, however. In addition, the global Multidimensional Poverty Index (MPI) measures acute multidimensional poverty by measuring each person’s overlapping deprivations across 10 indicators in three equally weighted dimensions: health, education and standard of living. The MPI complements the international $2.15 a day poverty rate by identifying who is multidimensionally poor and also shows the composition of multidimensional poverty. The headcount or incidence of multidimensional poverty is often several percentage points higher than that of monetary poverty. This implies that individuals living above the monetary poverty line may still suffer deprivations in health, education and/or standard of living.
The ECOWAS region has high levels of poverty among its population. According to the 2016 Multidimensional Poverty Assessment, about 65.3% of people considered multidimensionally poor in sub-Saharan Africa are living in West Africa. This is mainly driven by the high poverty numbers in Nigeria which also has the continent's largest population. Similarly, based on the 2021-2022 Human Development Index, only Cabo Verde and Ghana are ranked in the medium human development countries, while the remaining countries were ranked below the averages for sub-Saharan Africa.
In 2019, the number of people who lived below the poverty line of US$2.15 was about 106.8 million, constituting 27.2% of the total population. This makes ECOWAS the REC with the third lowest poverty rate after AMU (0.7%) and CEN-SAD (21.2%), and pitches it below Africa’s average of 31.2%. Poverty levels differ substantially among member countries. Niger has the largest extreme poverty rate in the region with half of its citizens living below the US$ 2.15 poverty line. This is followed by countries such as Nigeria, Burkina Faso, Liberia, Togo and Sierra Leone with at least a quarter of citizens living in extreme poverty. Cabo Verde has the lowest poverty rate in the region (3.4%), followed by Senegal and Côte d’Ivoire, with poverty rates of 9.2% and 11.1%, respectively.
The absolute number of poor people in the region will increase to 117.1 million by 2043 although this translates into a decrease in the proportion of people living below US$2.15 a day to 16%, almost at par with Africa’s average. By 2043, extreme poverty among member countries will range from 30.6% in Liberia to 1.2% in Senegal and Côte d’Ivoire. Cabo Verde, Guinea, Benin, Mali and Ghana will all have rates below 10% by 2043. By this measure, ECOWAS will improve its position relative to other economic communities.
Chart 9 compares energy production in the Current Path forecast in six types, namely oil, gas, coal, hydro, nuclear and other renewables. The data is converted into million or billion barrels of oil equivalent (BOE) to allow for comparisons between different sources. Note that energy production could be for domestic use or export.
In 2019, the total energy production in ECOWAS was equivalent to 1.1 billion BOE. Total energy demand was 410 million BOE meaning excess energy of 690 million BOE was available, translating into a net export of 3% of GDP. In the Current Path forecast, ECOWAS becomes a net energy importer from 2041. Total energy demand will outgrow production so that by 2043 it will be equivalent to 1.1 billion BOE.
Since 1990, oil has been the dominant type of energy produced in the region. In that year, total production was 630 million BOE, constituting 95% of total energy production. By 2019 it was 758 million BOE in 2019, representing 72% of total energy production.
Energy production in the region is enabled by the large oil reserves in Nigeria, which, in 2019, accounted for about 85% of the total. The remaining production came from Ghana, Côte d’Ivoire and Niger, constituting 8.8%, 2.2% and 1.3%, respectively. The region exports significant amounts of unrefined oil and gas and then imports the refined products. However, the establishment of the Dangote Petroleum Refinery, which is Africa’s biggest oil refinery, will refine up to 650,000 barrels per day. This will drastically reduce the imports of refined products. Rather, it is expected to meet Nigeria’s demand for refined products and allow export of the rest.
The production of gas has increased significantly between 1990 and 2019, going up from 22 million BOE (equivalent to 3.5% of total energy production) to 280 million BOE (26.7% of total energy production). Nigeria contributes about 83.7% of total gas production. Other significant sources include Côte d’Ivoire (5.6%), Ghana (2.9%), Guinea (2.1%) and Burkina Faso (1.3%). The production of hydro and coal will constitute just 1.1% and 0.6%, respectively. Ghana, Nigeria and Côte d’Ivoire are significant sources of hydro in the region, constituting 29.4%, 28.3% and 19.6%, respectively of total production in the region.
By 2043, gas will be the dominant energy source in the region, with an output of 1.7 billion BOE (63.3% of total energy production). This will be complemented by oil production, reaching 749 million BOE and constituting 28% of total energy production. Hydro is expected to contribute 2% of total energy production with most of the existing hydropower projects based in Ghana (Akosombo Dam) and Nigeria (Kainji, Jebba and Shiroro dams). Other renewables will contribute the remaining 6.1%.
ECOWAS has been embarking on an energy transition as part of its commitment to reduce dependency on fossil fuels. The increase in the share of renewables reflects this effort. With huge solar (1 956 GW) and wind (106 GW) energy potentials, the majority of renewable energy will be derived from these two sources. Senegal has already constructed a 158 megawatt wind farm while Niger is constructing a 250MW wind farm. The World Bank supported Regional Emergency Solar Power Intervention Project (RESPITE) for Liberia, Sierra Leone and Togo will substantially increase solar energy production in the region. Other innovative projects include the wave energy project in Ghana, wave-powered desalination in Cabo Verde, thorium exploration in Nigeria, biogas programmes in Senegal and biofuel plant construction in Senegal and Mauritania.
By 2043, Nigeria’s share of ECOWAS’s total oil production will slightly increase to 85.4%, while Ghana’s will decline to 3.5%. Similarly, Nigeria’s share in gas production will increase to 92.5%, while that of Côte d’Ivoire and Guinea will decline to 1.6% and 1.9%, respectively. This means that even by 2043, Nigeria will rely heavily on its oil and gas sectors for energy production and government revenues, ultimately increasing its share of fossil fuel production. With its new Petroleum Industry Act (PIA, 2021), the country is embarking on 20 new gas projects to address energy needs at both national and regional levels and increase its gas reserves from 200 trillion cubic feet (tcf) to 600 tcf. It has already signed an MoU with Equatorial Guinea to supply natural gas to the Punta Europa gas processing facility.
Ghana and Nigeria will be the main producers of energy from other renewables, contributing 72.8% of the total by 2043 (Ghana: 53.4%, Nigeria: 19.4%). In the case of Ghana, various efforts are being made to transition to renewable energy. It currently boasts several renewable energy sources, including the Volta River Authority at Kaleo/Lawra and Navrongo, Bui Solar Farm, BxC Solar, and Meinergy, among others. With the launch of its Energy Transition and Investment Plan, which aims to achieve net zero energy-related carbon emissions by 2060 through low-carbon solutions, Ghana is set to embark on more renewable energy projects.
In pursuit of its Vision and objectives, the ECOWAS Authority of Heads of States and Government developed and implemented a Vision 2020 plan. The plan was adopted in 2007 and aimed to create a “borderless, peaceful, prosperous and cohesive region built on good governance and where people have the capacity to access and harness the enormous resources through the creation of opportunities for sustainable development and environmental preservation”. Under Vision 2020, the region has made good progress in managing political crises, resolving conflicts and consolidating peace and democracy until the recent coups. Further, there was progress in advancing the common market, especially with the coming into reality of the free movement of people and Common External Tariff (CET) as part of the formation of a customs union in 2015, among others.
With the expiration of the Vision 2020 and the need to consolidate the successes and gains made under it, the Community developed and is currently implementing its Vision 2050 plan; “ECOWAS of the Peoples: Peace and Prosperity for All”. It is to be implemented alongside other continental and global goals and frameworks. Key among these are the African Union’s Agenda 2063, the United Nations Sustainable Development Goals, the 2015 Paris Climate Agreement, the African Continental Free Trade Area, Addis Ababa Action Agenda on financing for development and the 2020 Global Compact for Safe, Orderly and Regular Migration.
The aspirations of the Vision 2050 is reflected in five developmental themes:
- Demography, human capital, social development and migration;
- Environment and Natural Resources;
- Governance, Security and Peace;
- Economic growth, employment, structural transformation and private sector development; and
- Economic and monetary integration, economic infrastructure, energy and partnership.
The overarching vision is to achieve “a fully integrated Community of peoples, living in a peaceful and prosperous region, with strong institutions and respect for fundamental rights and freedoms, striving for inclusive and sustainable development”. This was developed based on an optimistic baseline scenario, Africa's Torch, with four key underpinning assumptions. These include:
- an environment of enhanced security and consolidated peace;
- good governance, strong and credible institutions that respect the rule of law and fundamental freedoms;
- a fully integrated and globally competitive region in the context of sustainable development; and
- an ECOWAS region with quality human capital and human development.
Accordingly, Vision 2050 is anchored on five main pillars, namely:
- Peace, Security and Stability
- Governance and Rule of Law
- Economic Integration and Interconnectivity
- Transformation, Inclusion and Sustainable Development and
- Social Cohesion
Each of these pillars is further broken down into strategic objectives and orientations to guide the development and implementation of successive Medium-Term Strategic Frameworks. Aside from these, there are critical issues that are considered cross-cutting to enable the successful implementation and the attainment of the overall goals and objectives of the Vision. These include issues of women-gender, youth employment, digitalisation, climate change-resilience and capacity building.
The eight sectoral scenarios as well as their relationship to the Current Path forecast and the Combined Agenda 2063 scenario are explained in more detail separately. Please read more on the website’s About Page.
The Demographics and Health scenario envisions ambitious improvements in child and maternal mortality rates, enhanced access to modern contraception, and decreased mortality from communicable diseases (e.g., AIDS, diarrhoea, malaria, respiratory infections) and non-communicable diseases (e.g., diabetes), alongside advancements in safe water access and sanitation. This scenario assumes a swift demographic transition supported by heightened investments in health and water, sanitation, and hygiene (WaSH) infrastructure.
Visit the themes on Demographics and Health/WaSH for more detail on the scenario structure and interventions.
Chart 11 presents the infant mortality rate in the Current Path and the Demographics and Health scenario.
In this scenario, we assume a more rapid demographic transition and increased investments in better health and water, sanitation and hygiene (WaSH) infrastructure.
The infant mortality rate is the probability of a child born in a specific year dying before reaching the age of one. It measures the child-born survival rate and reflects the social, economic and environmental conditions in which children live, including their health care. It is measured as the number of infant deaths per 1 000 live births and is an important marker of the overall quality of the health system in a country.
In 2019, the infant mortality rate in ECOWAS was 59.1 which means that for every 1 000 infants who were born about 59 died. This is higher than the average of 46.9 for Africa and also the highest among all RECs. Sierra Leone, Mali and Nigeria have the highest infant mortality rates (74.8, 69.4 and 63.9 deaths per 1 000 live births, respectively). The rate is lowest in Senegal, The Gambia and Cabo Verde (34.5, 33.3 and 17.1 deaths per 1 000 live births, respectively).
In the Demographic and Health scenario, infant mortality in the region will decline to 29.2 deaths per 1 000 live births, which will be slightly above Africa’s average of 25.6, yet lower than the 32.2 in the Current Path forecast. Nigeria (38), Sierra Leone (27.2) and Liberia (23.3) will have the highest infant mortality rates in the Demographic and Health scenario by 2043, while rates are lowest for Senegal (12.4), The Gambia (11.4) and Cabo Verde (8.4). The Demographic and Health scenario will have the greatest impact on Sierra Leone, Guinea and Liberia, where the infant mortality rates will drop by 13.5, 9.9 and 9.6 deaths per 1 000 live births, respectively. Niger, Cabo Verde and Nigeria will experience the smallest reductions in this scenario, namely a drop of 1.9, 1.7 and 0.6 per 1 000 live births, respectively.
Chart 12 presents the demographic dividend in the Current Path and in the Demographics and Health scenario.
Demographers typically differentiate between a first, second and even a third demographic dividend. We focus here on the contribution of the size of the labour force (between 15 and 64 years of age) relative to dependants (children and the elderly) as part of the first dividend. A window of opportunity opens when the ratio of the working-age population to dependents is equal to or surpasses 1.7.
In 2019, the ratio of the working-age population to dependents for ECOWAS was 1.2:1 which means that for every 1.2 persons of working age one dependent was supported. This was lower than the ratio of 1.26:1 recorded for Africa and the third lowest ratio among the RECs, after ECCAS (1.08:1) and EAC (1.12:1). ECOWAS has a relatively high number of dependent populations compared with other RECs which constrains the rate of economic growth. At 1.82:1, the AMU has the highest ratio since the median age of its population is the highest amongst all RECs.
Cabo Verde has the highest ratio of working-age population to dependents (about 2.05:1). The country is, therefore, the only ECOWAS member state that has entered a potential demographic window of opportunity, followed by Ghana and Sierra Leone (1.43:1 and 1.31:1, respectively). The ratio is worst in Burkina Faso, Mali and Niger (1.11:1, 0.99:1 and 0.95:1, respectively). In these countries, their large youthful populations mean that economic growth has to be particularly rapid if it is to translate into income growth.
The Demographic and Health scenario will increase this ratio to 1.54:1 by 2043 for the region, meaning it will not enter a potential demographic window of opportunity even by then. The ratio will be slightly below the average of 1.56:1 for Africa but 0.11 higher than on the Current Path. The impact of the scenario among member countries will differ, with ratios ranging from 2.1:1 (Cabo Verde) to 1.3:1 (Niger).
The countries that will experience the greatest change in their ratio as a result of the Demographic and Health scenario are Burkina Faso, Togo and Ghana, which would be on the cusp of entering a potential demographic window of opportunity in a subsequent decade. Niger and Benin will see the smallest change in their ratios. Because the contribution that labour makes to economic growth is particularly important at lower levels of development, the slow demographic transition in these countries serves as an important drag on income growth.
The Agriculture scenario envisions an agricultural revolution that ensures food security through ambitious yet feasible increases in yields per hectare, thanks to improved management, seed, and fertiliser technology, as well as expanded irrigation and equipped land. Efforts to reduce food loss and waste are emphasised, with increased calorie consumption serving as an indicator of self-sufficiency and prioritising it over food exports. Additionally, enhanced forest protection signifies a commitment to sustainable land use practices.
Visit the theme on Agriculture for our conceptualisation and details on the scenario structure and interventions.
Chart 13 presents import dependence in the Current Path forecast and the Agriculture scenario.
The agricultural sector is an important source of livelihood for ECOWAS. It employs about 60% of the active labour force and provides jobs to 290 million people in the region, making it the largest employer. However, the potential of the sector is threatened by the devastating impacts of climate change. Agriculture has also been unattractive for various reasons, especially to young people who associate it with poverty and suffering. Low investment in the sector, mainly lack of infrastructure such as storage facilities and roads hampers progress. Problems with the land tenure system and land accessibility in most of the region constraints agricultural activities. Moreover, the adoption and use of outmoded and rudimentary agricultural tools are still prevalent.
Despite its high agricultural potential, food insecurity in the region is increasing. Between 2014 to 2017, food insecurity rose by almost 9 percentage points (from 20.7% to 29.5%). Cases of malnutrition are also worsening. As of 2015, 14.2% of the people in the region were affected by undernutrition. This is an increase of 42.2% from 2018 to 2021, the highest on the continent. The average net agricultural import as percentage of total agricultural demand in ECOWAS was 5.7% in 2019, below the average of 9.0% for Africa. It was also below the averages for AMU, CEN-SAD, COMESA and IGAD.
Agricultural imports differ significantly across member countries. For example, Cabo Verde imports 64% of its agricultural demand, followed by The Gambia and Liberia, which import 55.1% and 21.4% of total demand, respectively. In contrast, Niger and Burkina Faso have relatively low food import dependence at 4.1% and 3.3% of total demand, respectively. Only Côte d’Ivoire produced enough for its domestic consumption, with a surplus equivalent to 0.7% of total demand in 2019. Because food security is important for national development, Cote d’Ivoire is better placed than other countries in ECOWAS to feed its population and provide it with sufficient nutrients.
The food insecurity in the region is worsened by the impacts of climate change and natural disasters and the lasting effect of COVID-19 pandemic. According to the UN, more than 25 million people in the region could not meet basic food needs. This represents a 35% increase compared to the situation in 2020. In conflict areas such as the Lake Chad Basin, Liptako-Gourma and the Sahel Region, the problem is worse.
In the Current Path forecast, net agricultural imports in the ECOWAS region will grow to 32% of total demand by 2043. At this rate, it will be above the average of 29.5% for Africa and will be the highest among the RECs, signalling a growing food insecurity. This situation is mitigated in the Agriculture scenario so that by 2043, net agricultural imports will be 7.9% of total demand. This is lower than the average of 34.5% for Africa. In the Agriculture scenario, Ghana and Côte d’Ivoire will all become net exporters of agricultural products equivalent to about 13.2% and 4.1% of total demand, respectively. Other countries in the region will continue to depend on agricultural imports, with The Gambia and Cabo Verde importing a little over 65% of their total demand by 2043.
The Agriculture scenario will reduce agricultural import dependency by 34.2% of total demand in Côte d’Ivoire, 27.1% in Benin and 26.0% in Senegal. This suggests that these countries have the potential to become food-sufficient if the right policies are implemented to benefit their agricultural potential. Countries that will experience the smallest reduction in agricultural import dependency are Cabo Verde, The Gambia and Niger, with reductions equivalent to 4.2%, 4.3% and 5.8% of total demand, respectively. These are countries with limited agricultural potential due to small arable lands and unfavourable climates.
The Education scenario represents reasonable but ambitious improved intake, transition and graduation rates from primary to tertiary levels and better quality of education at primary and secondary levels. It also models substantive progress towards gender parity at all levels, additional vocational training at the secondary school level and increases in the share of science and engineering graduates.
Visit the theme on Education for our conceptualisation and details on the scenario structure and interventions.
Chart 14 presents mean years of education in the Current Path forecast and the Education scenario for the 15 to 24-year age group.
The average years of education in the adult population aged 15 to 24 is a good first indicator of how the stock of knowledge in society is changing.
Access to education in ECOWAS has increased significantly over recent years, largely due to the implementation of free basic education in most member countries. Adults aged between 15-24 years received 7.3 years of education in 2019. This is below the average of 7.9 years for Africa. ECOWAS recorded the third lowest duration among the continent's RECs after IGAD and ECCAS. The mean years of education for men was 7.5 years compared with 7.0 years for women, meaning that, on average, men will attain slightly longer education compared with women. Among member countries, Ghana, Togo and Cabo Verde have the highest mean years of education, with averages of 10.0, 9.6 and 8.9 years, respectively. These are all countries with free compulsory primary and secondary education which have contributed to high enrolments. Guinea Bissau, Mali and Niger have the lowest means, at 5.7, 5.3 and 4.5 years, respectively.
In the Education scenario, the mean years of education in ECOWAS will rise to 7.6 years which will be higher than the Current Path forecast of 6.6 years and the average of 6.9 years for Africa. The Education scenario also reduces the gender gap between men and women in ECOWAS. By 2043, Cabo Verde will have the highest mean years of education (9.0 years), followed by Ghana (8.1 years) in the scenario. Countries with the lowest mean years of education will be Burkina Faso (6.9 years), Niger (6.8 years) and Senegal (6.7 years). Compared with the Current path forecast, countries that will benefit most from the Education scenario are Niger, Guinea and Liberia with improvements of 1.8 years, 1.7 years and 1.4 years of education, respectively. Ghana, Gambia and Guinea Bissau will benefit least in the Education scenario.
Although most member countries have made significant progress towards the attainment of universal access to education, the issue of quality remains a challenge. The low quality in the region can be attributed to the limited resources and capacities coupled with the difficulties of overcoming cultural and social barriers. According to UNESCO, all countries in the region have less than 4% of young people enrolled in technical and vocational courses. Further, there are issues with the quality of their training and suitability for the labour market.
An important measure of the quality of education is the test scores of students. In 2019, the average test score for primary learners in the ECOWAS was 30.0, which was slightly below Africa’s average of 30.9 and only higher than in IGAD. Ghana, Nigeria and Cabo Verde have the highest test scores for primary learners in the region, at 34.5, 32.5 and 31.9, respectively. Guinea Bissau, Niger, and Burkina Faso have the lowest test scores for primary learners, at 25.2, 24.7 and 21.5, respectively.
In the Education scenario, the average test score for primary learners is set to increase to 42.8, which is above both the Current Path forecast of 33.1 and Africa’s average of 34.3. It will range from 50.0 in Cabo Verde to 30.7 in Burkina Faso among member countries. Compared to the Current Path forecast, The Gambia, Nigeria and Ghana will record the greatest improvement in the scenario while Benin, Senegal and Burkina Faso will record the least improvement.
In 2019, the average test score for secondary learners in the region was 38.5, close to the average of 39.2 for Africa. It was only higher than in IGAD. Nigeria, Cabo Verde and Togo have the highest test scores for secondary learners, averaging 41.8, 41.3 and 38.6, respectively. The countries with the lowest performance in the region are Burkina Faso (33.5), Mali (32.5) and Niger (31.9).
In the Current Path forecast, the average test score is 40.4 for secondary learners. In the Education scenario, the average test score for secondary learners will improve to 49.1 by 2043, which will be higher than the average of 41.5 for Africa by then. Cabo Verde will fare best, with a score of 59.5, followed by Togo and Gambia, with scores of 54.5 and 51.5, respectively. Mali, Burkina Faso and Niger will record the lowest performance in the region, with test scores of 44.9, 42.9 and 40.5, respectively. Compared with the Current Path forecast, countries that will record the greatest improvements are Cabo Verde, Togo and Sierra Leone, while Liberia, Burkina Faso and Niger will record the smallest improvements in average test scores.
In the Manufacturing scenario, reasonable but ambitious growth in manufacturing is envisaged through increased investment in the sector, in research and development (R&D), and through improved government regulation of businesses. This is aimed at enhancing total labour participation rates, particularly among females where appropriate, and is accompanied by increased welfare transfers to unskilled workers to mitigate the initial rises in inequality typically associated with a low-end manufacturing transition.
Visit the theme on Manufacturing for our conceptualisation and details on the scenario structure and interventions.
Chart 15 presents the contribution of the manufacturing sector to GDP in the Current Path forecast and in the Manufacturing scenario[1The IFs platform uses data from the Global Trade and Analysis Project (GTAP) to classify economic activity into six sectors: agriculture, energy, materials (including mining), manufacturing, services and information and communication technologies (ICT). Most other sources use a threefold distinction between only agriculture, industry and services, with the result that data may differ.].
The manufacturing sector in West Africa primarily produces low-end manufacturing goods such as food and beverages, textile and clothing. Irregular power supply, unfriendly business environment/regulations, corruption, inadequate access to finance, lack of skilled human capital, poor infrastructure and in some countries insecurity are some factors that hinder the activities of the sector.
The three largest contributors to the economy in ECOWAS are services, agriculture and manufacturing. The services sector dominates across the region, having contributed about 51.6% to GDP in 2019 (translating to US$326.4 billion) with few exceptions (Liberia, Mali and Sierra Leone). The growing internet penetration and mobile banking expansion also account for an increasing share of the services sector. The contribution of the services sector ranges from 74.4% in Cabo Verde to 40.9% in Guinea. The Gambia, Senegal, Nigeria, Burkina Faso, Côte d’Ivoire, Ghana, Nigeria, Benin and Guinea-Bissau all have service sectors that contributed more than 50% to GDP in 2019.
Agriculture contributed 21.1% to GDP in 2019, equivalent to US$133.4 billion, while the manufacturing sector’s contribution amounted to US$93.9 billion, representing 14.3% of GDP. The contribution of agriculture to GDP varies substantially between member countries, ranging from 39.9% in Sierra Leone to 6.5% in Cabo Verde; in Côte d’Ivoire, Senegal, Ghana and Togo the agriculture sector contributes less than 20% to GDP. The manufacturing sector contributed more than 20% to GDP only in Côte d’Ivoire, Togo and Senegal in 2019, with contributions as low as 4.3% in Liberia and 8.2% in Sierra Leone and Cabo Verde.
The energy sector contributed 6.5% to the GDP of the region while the ICT and materials sectors contributed to 4.7% and 1.4%, respectively. Cabo Verde had the largest share of ICT in the region at 7.6%, whilst Niger had the lowest at 3.4% in 2019. Guinea and Liberia had a relatively large materials sector, accounting for almost 9.2% and 7.2% of GDP in 2019.
Consistent with the structural transformation of the economy, the contribution of the service sector is expected to increase in absolute and relative contribution. By 2043, the contribution of the service sector in the region will balloon to about US$1.3 trillion, representing 58.4% of GDP. This will be driven by the growth in services in Cabo Verde (78.5%), The Gambia (70.9%) and Nigeria (61.5%). The contribution of agriculture to GDP will decline to 8.7% (equivalent to US$194.8 billion), while that of manufacturing will rise to 21% (US$469.2 billion). The manufacturing sector will contribute 27.6% and 26.4% of GDP in Côte d’Ivoire and Mali, respectively, but only 8% in Liberia and Cabo Verde. Only Sierra Leone will have agriculture as a substantial contributor to the economy (about 24.6%) by 2043; in other countries, agriculture’s contribution will range from 3.2% (Cabo Verde) to 12.5% (Guinea Bissau).
Guinea-Bissau will have the highest contribution of ICT to GDP (7.6%), whereas Sierra Leone is expected to have the lowest contribution from this sector (3.5%). Guinea and Liberia will still have the highest contribution of materials to GDP (16.2% and 18.7%), whereas in Nigeria and Cabo Verde, it will be less than 1%. The sector will contribute less than 2% to the economies of The Gambia, Guinea-Bissau, Mali and Cabo Verde. The contribution of energy will be highest in Nigeria at 9.2%. Ghana, The Gambia and Sierra Leone will have their energy sectors contributing slightly above 3% to GDP. On the other hand, Mali, Togo, Senegal and Benin will have the lowest contribution from the energy sector.
In the Manufacturing scenario, all sectors are expected to increase in size compared with the Current Path forecast in 2043. The service sector will be the leading contributor to GDP in ECOWAS by 2043, and its contribution will be about US$75 billion larger in the Manufacturing scenario than in the Current Path forecast. As a percentage of GDP, the contribution of the service sector will contribute 56.9% to GDP, which will be slightly below the Current Path by 2043. The manufacturing sector, which is the second largest contributor to GDP, will contribute an additional US$81.2 billion to GDP in the scenario. This corresponds to a share of 22.5% to GDP, which is about 2.2 percentage points above the Current Path forecast. The contribution of agriculture will increase modestly (US$1.5 billion) by 2043, although in relative terms, its contribution of 8.9% will decline to 0.7 percentage points below the Current Path forecast. ICT will contribute an additional US$7.8 billion to GDP in the scenario by 2043. The contribution of energy and materials to GDP in the scenario will be an extra US$610 million and US$4.4 billion by 2043.
Sectoral contribution to GDP differs across member countries. Nigeria will experience the largest absolute increase in the service sector in the Manufacturing scenario, adding US$38.8 billion. This will be followed by Côte d’Ivoire and Niger, with contributions of US$12.2 billion and US$5.2 billion, respectively. The smallest increase in absolute terms from the service sector will be experienced by Liberia, Cabo Verde and Guinea-Bissau, with contributions below US$510 million. Only Mali will witness a decline in the absolute value of its service sector. Nigeria, Côte d’Ivoire and Ghana will experience the largest contributions from manufacturing, valued at US$33.6 billion, US$14.6 billion and US$9.8 billion, respectively. Manufacturing will contribute least in Liberia, Guinea Bissau and Cabo Verde, with values of US$143 million, US$115 million and US$107 million, respectively. Agriculture’s contribution in the Manufacturing scenario will range from US$358 billion in Nigeria to US$2 million in Cabo Verde.
The AfCFTA scenario represents the impact of fully implementing the African Continental Free Trade Agreement by 2034. The scenario increases exports in manufacturing, agriculture, services, ICT, materials and energy. It also includes an improvement in multifactor productivity growth emanating from trade and a reduction in tariffs for all sectors.
Visit the theme on AfCFTA for our conceptualisation and details on the scenario structure and interventions.
Chart 16 compares the trade balance in the Current Path forecast with the AfCFTA scenario.
Intra-regional trade in ECOWAS, albeit low, is improving. In 2019, the region recorded an improvement of 12% in intra-regional trade. However, several factors still impede trade among member countries. The poor transportation networks increase the cost and time of travel between countries. Numerous border and customs clearances, roadblocks, and checkpoints make travel difficult across the region. Moreover, the common external tariffs and the ECOWAS trade liberalisation scheme have not yet been fully operationalised. These, coupled with the high duties and taxes and burdensome bureaucratic procedures, make traders resort to informal instead of formal cross-border exchanges. Informal unrecorded cross-border trade in the region is huge. For agricultural products, for example, the value of informal trade exceeds formal trade. For instance, the Accra-Ouagadougou corridor is estimated to record an average of 17 500 tons of cereals and 96 000 heads of livestock in informal trade annually, equivalent to US$5.5 million and US$68 million, respectively.
In 2019, the total export value of ECOWAS was US$123.9 billion, representing 19.6% of GDP while its total imports were valued at US$157.8 billion, constituting 24.9% of GDP. Exports in the region are increasingly becoming diversified. According to the FERDI Export Concentration Index, ECOWAS scores have declined from 0.63 in 2006 to 0.46 in 2020, depicting an improvement over the years. The main export of ECOWAS is oil, largely from Nigeria, which accounts for 75% of its exports. Other notable exports include cocoa and cocoa food processing (mainly from Ghana and Côte d’Ivoire), precious stones, cotton, wood and wood products, fish and shellfish, edible fruit, plastics and rubbers among others.
Nigeria, the economic giant in the region, accounts for over two-thirds (77%) of total exports, followed by Côte d’Ivoire, which accounts for 10%. Exports from Ghana, Senegal and Mali constitute 4%, 2% and 1.7%, respectively. Benin, Burkina Faso, Guinea, Niger and Togo also contribute 1% each of total export. The major export destinations are America, Europe and Asia, which receive 40%, 23% and 16% of the total. In terms of imported commodities, fuel constitutes the largest representing 24% of total imports, in spite of its status as a net exported commodity. The region also imports large quantities of vehicles, machinery and electrical appliances, cereals, fish and seafoods, plastics, pharmaceutical products and more. Imports to Nigeria are the largest, accounting for 41%, followed by Ghana, accounting for 18%. Import to WAEMU countries represents 36% of the total, while the remaining five countries account for the rest.
As a result of exports exceeding imports, the total trade deficit of the region stood at 5.4% of GDP, above the average of 4.4% for Africa. Among the RECs, it is the fourth lowest after ECCAS, AMU and SADC. All ECOWAS member countries recorded a trade deficit, with the exception of Côte d’Ivoire which recorded a surplus of 1.5% of GDP in 2019. The deficit ranges as high as 43.2% of GDP to as low as 1.9% in Ghana. In the AfCFTA scenario, ECOWAS trade balance improves such that by 2043 it will record a deficit of only 0.8% of GDP. This will be three percentage points lower than the average of 3.8% of GDP in the Current Path and average for Africa.
In the AfCFTA scenario, only Benin, Guinea and Nigeria will have a trade surplus by 2043 of about 3.3%, 1.6% and 0.1% of GDP, respectively. The remaining countries will all have trade deficits, ranging from 0.4% of GDP in Burkina Faso to 17.7% of GDP in The Gambia. The countries that will experience the most significant improvements in trade balance compared to the Current Path forecast are Guinea and Benin, with 6.4 and 5.9 percentage points, respectively. It shows that a lot can be done to improve regional trade, including removing regulatory restrictions and building the appropriate infrastructure to facilitate the free movement of goods and services. The creation of ECO (common currency) will further facilitate regional trade.
The Large Infrastructure and Leapfrogging scenario involves ambitious investments in road and renewable energy infrastructure, alongside improved electricity access and accelerated broadband connectivity. It emphasises the adoption of modern technologies to enhance government efficiency and the rapid formalisation of the informal sector, incorporating significant investments in major infrastructure projects like rail, ports, and airports, while highlighting the positive impacts of renewables and ICT.
Visit the themes on Large Infrastructure and Leapfrogging for our conceptualisation and details on the scenario structure and interventions.
Chart 17 presents cookstove usage in the Current Path forecast and the Large Infrastructure and Leapfrogging scenario.
In 2019, 52.5% of the ECOWAS population had access to electricity. This was below the average for Africa (55.1%) and the fourth highest among the RECs after AMU (95.3%), CEN-SAD (63.5%) and COMESA (53.6%). Access is disparate with 82.1% of urban residents having access to electricity compared with only 28.5% of rural dwellers. Countries with high electricity access rates in the region are Cabo Verde (91.4%), Ghana (83.4%) and Senegal (70.4%). At the bottom are Sierra Leone, Niger, and Burkina Faso with 22.7%, 18.5% and 17.6%, respectively. To improve electricity access, the region has established the West African Power Pool (WAPP) and the ECOWAS Regional Electricity Authority (ERERA) structures for regulating electricity. It has also promoted renewable energy through the ECOWAS Centre for Renewable Energy and Energy Efficiency (ECREE). However, low production and high cost of access to electricity remain a challenge.
The relatively low electricity access rate in the region, particularly in the rural areas, reflects the widespread use of cookstoves that predominates. The scenario distinguishes between three types of cooking stoves: traditional, improved and modern. In 2019, 75.6% of households in the region used traditional stoves such as firewood or charcoal for cooking, making it the fourth highest region on the continent after EAC (87.2%), IGAD (85.9%) and ECCAS (80%). A similar trend is observed in most countries in Africa with an average of 61% of households using traditional cookstoves. Among member countries, only Cabo Verde had less than half (31%) of its households relying on traditional cookstoves in 2019. Indeed, Burkina Faso, Liberia, Togo, Guinea, Sierra Leone and Guinea Bissau had at least 90% of households using traditional stoves for cooking. The high rate of traditional cookstove usage raises concern about pollution and carbon emissions in the region and its negative impacts on the health of these households.
About 4.1% of households in ECOWAS used improved cookstoves while 20.3% used modern stoves for cooking. Cabo Verde had 68% of households using modern fuel for cooking making it the highest in the region. This was followed by Senegal and Nigeria at 48.6% and 25.6%, respectively. As access to electricity in urban and rural areas increases, more households will switch from traditional cookstoves to improved and modern fuel stoves, such as electric and gas cookers.
Based on the Infrastructure and Leapfrogging scenario, 81.3% of people residing in ECOWAS will have access to electricity by 2043, compared to 73.6% in the Current Path forecast. Consequently, the proportion of households that will use modern fuel for cooking in the region will rise to 63.5% by 2043 instead of 54.8% in the Current Path. It will also be higher than the average of 58.5% for Africa by 2043. This will reduce the use of traditional cookstoves to 34.5% of households in the scenario compared to 42.7% in the Current Path. Among member countries, only Guinea Bissau (32.4%), Sierra Leone (30.3%), Liberia (29.8%) and Niger (25.9%) will have less than half of households using modern fuel for cooking in the scenario. Cabo Verde, Senegal and Côte d’Ivoire will have at least 80% of households using modern fuel for cooking. The countries that will witness the greatest switch to modern fuel in the scenario compared to the Current Path are Guinea, Burkina Faso, Togo and Mali with more than 10 percentage points. Cabo Verde and Senegal, which already have very high usage of modern fuel cookstoves among households, will witness minimal improvement at 2.6 and 5.3 percentage points, respectively, by 2043.
This development will reduce health-related challenges and carbon emissions arising from the use of traditional cookstoves in these countries. However, countries such as Niger, Sierra Leone, Guinea Bissau and Liberia will still have over 60% of the population using traditional cookstoves by 2043 due to their low electricity access rates.
Chart 18 presents access to mobile and fixed broadband in the Current Path and the Large Infrastructure and Leapfrogging scenario.
Fixed broadband includes cable modem internet connections, DSL internet connections of at least 256 KB/s, fibre and other fixed broadband technology connections (such as satellite broadband internet, ethernet local area networks, fixed wireless access, wireless local area networks, WiMAX, etc.). In 2019, the total number of fixed broadband subscriptions in ECOWAS averaged 0.2 subscriptions per 100 people. It was the lowest among the RECs and far below the average of 1.5 subscriptions per 100 people in Africa. These fixed broadband subscriptions ranged from about 3.5 per 100 people in Cabo Verde to 0.002 per 100 people in Sierra Leone.
In the Infrastructure and Leapfrogging scenario, fixed broadband subscriptions will increase to 26.8 per 100 people by 2043, which will be above the average of 21.6 per 100 people for Africa. It means that compared with the Current Path forecast, the Leapfrogging scenario could improve fixed broadband subscriptions by an additional 8.7 per 100 people. Cabo Verde, Benin and Guinea will have the highest subscription rate for fixed broadband by 2043 in the scenario at 44.8, 39 and 36.9 subscriptions per 100 people, respectively. Niger, Nigeria and Liberia's subscription rate of 16.4 per 100 people will be the lowest in the region in the scenario. Countries that will experience the largest increase in subscriptions in the scenario are Cabo Verde, Benin and Sierra Leone, with gains of, respectively, 15.2, 12.7 and 12.2 subscriptions per 100 people compared with the Current Path forecast. The Gambia, Côte d’Ivoire and Mali will see the smallest growth compared with the Current Path forecast.
Mobile broadband refers to wireless internet access delivered through cellular towers to computers and other digital devices. The growth of mobile broadband on the continent has been more rapid than fixed broadband. By 2019, the average mobile broadband subscription for ECOWAS was 39.2 subscriptions per 100 people, slightly above the average of 38.6 subscriptions per 100 people for Africa. Among the RECs, it was only lower than the rates in AMU and CEN-SAD at 77.4 and 42.8 subscriptions per 100 people. Ghana had the highest number of mobile broadband subscriptions in 2019 at 96.4 per 100 people. It was followed by Cabo Verde and Côte d’Ivoire. Nigeria, Liberia and Sierra Leone had the lowest subscription rates at 5.0, 8.0 and 14.3 per 100 people, respectively.
Between 2024 and 2033, the Infrastructure and Leapfrogging scenario will lead to a substantial improvement in access to mobile broadband such that ,by 2033, it would contribute an additional 12 subscriptions per 100 people compared with the Current Path forecast. In the long term, the two forecasts converge so that, by 2043, the difference will be just two subscriptions per 100 people. At 150 subscriptions per 100 people in the Infrastructure and Leapfrogging scenario, ECOWAS will have more subscriptions than the average of 141.0 for Africa by 2043. Côte d’Ivoire, Guinea Bissau and Ghana will have the highest mobile subscription rates, while Togo, Liberia and Niger will have the lowest rates.
Niger benefits the most from the Infrastructure scenario, gaining an additional 14 subscriptions over the Current Path forecast. This is followed by Sierra Leone and Guinea, gaining 6.6 and 5.1 subscriptions per 100 people, respectively. Nigeria, Guinea Bissau, Ghana, Mali, Cabo Verde, Benin, The Gambia, Senegal and Burkina Faso will benefit least in the scenario, all gaining less than 1 subscription per 100 people.
The Financial Flows scenario represents a reasonable but ambitious increase in inward flows of worker remittances, aid to poor countries and an increase in the stock of foreign direct investment (FDI) and additional portfolio investment inflows. We reduce outward financial flows to emulate a reduction in illicit financial outflows.
Visit the theme on Financial Flows for our conceptualisation and details on the scenario structure and interventions.
Chart 19 presents government revenues in the Current Path and Financial Flows scenario.
The ECOWAS region receives high volumes of financial flows. In 2021, FDI inflows to ECOWAS represented 16.6% of total inflows to Africa, valued at US$83 billion. Most FDI to the region went to Nigeria (US$4.8 billion), Ghana (US$2.6 billion), Senegal (US$1.4 billion) and Côte d’Ivoire (US$1.4) accounting for 80% of total inflows. The large inflows to Nigeria are due to the resumption in oil investment and gas expansion projects as well as large commercial and residential real estate projects. In the case of Ghana, the inflows were a result of the projects in the extractive sector such as the construction of US$850 million gold mines by Newmont Corp and a cement factory by Ciment d’Afrique. These FDI inflows together with other external inflows, such as aid and remittances, increase government revenue through corporate and income taxes, royalties and indirectly through value-added tax.
In 2019, the government’s total revenue in ECOWAS amounted to US$72.4 billion, equivalent to 11.4% of GDP which was the lowest among the RECS and far below the average of 20% of GDP for Africa. Among member countries, it ranged from 29% of GDP in Liberia to just about 8% of GDP in Nigeria. Aside from Nigeria, which depends heavily on revenue from its oil production, all countries in the region rely on taxes as the main source of government revenue. The tax to GDP ratio is largest in Cabo Verde at 24% and lowest in Nigeria (2.8%) which to an extent reflects the levels of formalisation of the economy in these countries.
In the Financial Flows scenario, government revenue will rise to US$366 billion in 2043, representing 17.8% of GDP still below the average of 22.8% for Africa. Compared to the Current Path, the scenario can improve government revenue by an additional US$16.5 billion by 2043. Liberia, Cabo Verde and Mali will have the highest government revenue to GDP ratios at 32.8%, 30% and 26.6%, respectively. Guinea (19.3%), Ghana (19.3%) and Nigeria (14.5%) will record the lowest government revenue to GDP ratios in the scenario by 2043. Nigeria’s low ratio is particularly concerning since it translates into low levels of expenditure on health, education, security and infrastructure, amongst others.
In 2019, the region scored 0.70 on the Governance Security Index, which was second highest among the RECs after AMU, and above Africa’s average of 0.69. Cabo Verde, Ghana and Senegal had the highest scores (0.01, 0.78 and 0.77, respectively). This points to a relatively higher level of stability in these countries although, since 2023, Senegal has been experiencing political tension and insecurity associated with the decision to postpone its general elections initially scheduled for February 2023. Niger, Nigeria and Mali had the lowest scores (0.66, 0.66 and 0.67, respectively). These are countries with histories of either political instability, war or threat of violent extremism and terrorism.
The ECOWAS region has had its fair share of instability due to political upheaval, civil wars (Liberia, Sierra Leone, Guinea Bissau, Côte d’Ivoire), religious clashes (Benin, Nigeria, Mali) or coups d’état (The Gambia, Niger, Togo, Guinea) and terrorist attacks or violent extremism. Since 2000, the region has witnessed a decline in civil war. Despite this decline, other security threats are emerging in the region. Terrorism has become the leading security challenge for many countries in the area. It has spread to Burkina Faso and Côte d’Ivoire from the initially affected countries in the Sahel (Mali and Niger) and Nigeria. Other coastal countries, such as Ghana, are also living in fear of terror attacks. In the past three years, terror attacks in the region have risen by 400%. In the first six months of 2023, 1 800 terrorist attacks caused the deaths of over 4 600 people. Further, the region is battling with money laundering, human, drug and arms trafficking, cybercrime, as well as cross-border insecurity.
In the Governance scenario, ECOWAS’ score on the government security index will improve to 0.80 by 2043, which will be higher than the Current Path forecast of 0.76 and the average of 0.75 for Africa. In this scenario, Cabo Verde, Ghana and Senegal will still have the highest scores, while Liberia, Togo and Guinea-Bissau will have the lowest scores. Nigeria, Côte d’Ivoire and Mali recorded the largest improvement in the scenario of 0.06, 0.052 and 0.042, respectively. Ghana (0.02), Togo and Cabo Verde (both 0.18) recorded the least improvement in the scenario relative to the Current Path.
The score of ECOWAS on the government capacity index in 2019 was 0.26 which was lower than Africa’s average of 0.30 but higher than the averages for IGAD, EAC and ECCAS. The high performing member countries in this regard are Cabo Verde (0.50), Senegal (0.39) and Ghana (0.35). Sierra Leone, Nigeria and Guinea Bissau are the worst performing member countries on the government capacity index with scores of 0.23, 0.21 and 0.16, respectively, in 2019. The low performance on this index is not surprising given the widespread corruption and low levels of government revenues. For instance, only Cabo Verde is ranked highly (3rd) in Africa on the 2023 Transparency International Corruption Perception Index. All other countries in the region are in the red zone scoring below 50%. This is also reflected in the low tax revenue ratios among many member countries.
In the Governance scenario, the score of ECOWAS on the governance capacity index will reach 0.39 by 2043. This will be a 15% improvement over the Current Path forecast and 4.6% above the average for Africa. Cabo Verde, Senegal and Ghana will continue to extend their lead in the scenario by scoring 0.65, 0.52 and 0.49, respectively, by 2043. Sierra Leone, Nigeria and Guinea Bissau will still be the worst performers in the region. The greatest improvement in the scenario over the Current Path is recorded in Cabo Verde, Senegal and The Gambia while the lowest improvements are recorded in Guinea, Guinea Bissau and Togo.
Although it performs poorly on the government capacity index, ECOWAS is more inclusive than most RECs. In 2019, its governance inclusion score of 0.52 was above Africa’s average of 0.48 and almost at par with SADC which is the highest among the RECs. This high score is mainly boosted by high performance in a few countries such as Cabo Verde (0.68), Ghana (0.60) and Sierra Leone (0.57). These have been stable democracies over several years, with periodic elections leading to successful changes in government. Despite this, the quality of democratic governance across the region largely remains poor except in Cabo Verde. Although there are periodic elections, the credibility and quality is questionable in most cases. The weak governance in the region is manifested in the many coups that have plagued the region in recent years. Mali, Niger, Guinea, and Burkina Faso have all had military coups in the last three years. Frequent disputes about the electoral process, election results, and constitutional amendments are all challenges that the region is grappling with. These democratic challenges have had severe political and institutional ramifications and are threatening the stability of the region. Guinea (0.48), Côte d’Ivoire (0.43) and Togo (0.29) are the least inclusive countries in the region.
By 2043, the ECOWAS score on government inclusion will reach 0.66 in the Governance scenario, which will be 17.5% more than the Current Path and 21.8% above Africa's average. Among the member countries, Cabo Verde, Guinea Bissau and The Gambia will have the highest score in the scenario by 2043. Nigeria, Côte d’Ivoire and Togo will be the worst performers in the region. The Gambia, Niger and Guinea will witness the highest improvement in the scenario over the Current Path while Togo, Ghana and Cabo Verde will witness the lowest improvement.
Chart 21 presents a stacked area graph of the contribution of each scenario to GDP per capita. The cumulative impact of better education, health, infrastructure, leapfrogging, etc. means an additional benefit in the integrated IFs forecasting platform that we refer to as the synergistic effect.
The scenario with the greatest impact on GDP per capita by 2043 is the Governance scenario, followed by the AfCFTA and Infrastructure and Leapfrogging scenarios. In the Governance scenario, ECOWAS’ GDP per capita will increase to US$6 125 which will be US$371 or 6.4% more than the Current Path forecast. In the AfCFTA scenario, ECOWAS’ GDP per capita will be US$350 or 6.1% more than the Current Path forecast while the Infrastructure and Leapfrogging scenario will contribute US$335 (5.8%) by 2043. This means that the region needs to address its numerous governance challenges and ensure that member countries ratify and fully implement the continental free trade agreement to realise its development potential. It must invest in both physical and digital infrastructure which is key to development to catalyse its growth potential. The scenarios with the least impact on GDP per capita are the Financial Flows and the Demographic and Health scenarios - the latter because the region does not enter a demographic window of opportunity by 2043, meaning its impact is delayed.
The AfCFTA, Education, Governance, Financial Flows, Manufacturing and the Infrastructure and Leapfrogging scenarios have the greatest impact on GDP per capita in Côte d’Ivoire, Ghana and Cabo Verde. In the Agriculture scenario, Nigeria, Sierra Leone and Liberia will achieve the highest improvements in GDP per capita over the Current Path by 2043. The Demographics and Health scenario is most effective at raising GDP per capita above the Current Path in Côte d’Ivoire, Ghana and Senegal.
Chart 22 presents the impact of each scenario on extreme poverty by 2043. The user can select the number of extremely poor people or the per cent of the population.
The scenarios with the greatest potential to reduce extreme poverty by 2043 in ECOWAS are the Education, Manufacturing and the Agriculture scenarios. In the Education scenario, there will be 20.5 million fewer extremely poor people compared to the Current Path forecast. Education is an important tool to reduce extreme poverty. Increasing access and quality of education equips people with the requisite skills to either start a business or acquire a job which increases their income and ultimately improves their living standards. Indeed a recent report by UNESCO confirms that if students in low-income countries have at least basic reading skills, 171 million people can escape extreme poverty. The Manufacturing and the Agriculture scenarios have the potential to reduce extreme poverty in the region by 19.7 million and 17.1 million people, respectively. The impact of the manufacturing scenario in poverty reduction can be explained by its potential to provide jobs due to its forward and backward linkages with the agriculture and services sector. It means that countries in the region can reduce extreme poverty by aggressively pursuing a low-end manufacturing growth path that includes investment in research and development and promoting trade. However, such a growth path needs to be accompanied by social transfers to unskilled labourers due to its potential to displace such workers at initial stages. In the case of the agriculture sector, its impact on poverty is not surprising given that it employs over 60% of the active labour force in the region. As such, an agricultural revolution that increases production can reduce food insecurity in the region and increase incomes of many households, especially rural populations.
Different scenarios have different impacts among member countries. The AfCFTA scenario reduces extreme poverty quicker in Niger, Ghana and Sierra Leone while the Agriculture scenario reduces extreme poverty rates quickly in Sierra Leone, Liberia and Niger. Extreme poverty rates decline faster in Liberia, Niger and Nigeria in the Demographic and Health scenario. In the Education scenario, Niger, Nigeria and Liberia achieve the greatest reduction in extreme poverty whereas in the Financial Flows scenario, it is Liberia, Sierra Leone and Guinea Bissau. The Governance and the Manufacturing scenarios have the potential to reduce extreme poverty quickly in Liberia, Niger and Sierra Leone while Infrastructure reduces poverty quicker in Liberia, Sierra Leone and Guinea Bissau.
Chart 23 compares the size of the economy in the Current Path with the Combined Agenda 2063 scenario at market exchange rates (MER).
The Combined Agenda 2063 scenario consists of the combination of all eight sectoral scenarios, namely Governance, Demographics and Health, Education, Infrastructure/Leapfrogging, Agriculture, Manufacturing, AfCFTA and Financial Flows.
The GDP of ECOWAS will increase from US$633.1 billion in 2019 to US$3.3 trillion by 2043 in the Combined Agenda 2063 scenario. This represents an increase of 424% within this period. The size of the ECOWAS economy will be 66.5% larger in the Combined Agenda 2063 scenario than in the Current Path forecast at almost US$2 trillion. The large increase will be driven by Nigeria’s economy, which will account for 53.1% of total GDP in the region by 2043 followed by Côte d’Ivoire and Ghana at 13.2% and 11.2%, respectively. Liberia records the largest improvement in the Combined Agenda 2063 scenario with the economy growing by 152% more than the Current Path forecast. This is followed by Sierra Leone and Niger with 98.6% and 90.4% improvement. Nigeria, The Gambia, Benin and Cabo Verde will see the smallest relative changes in GDP from the Combined Agenda 2063 scenario, with gains in Gambia (64%), Benin (59.2%) and Cabo Verde (58.4%).
By 2043, the Combined Agenda 2063 will increase ECOWAS’ GDP per capita to US$8 476. This represents an increase of 47.3% compared with the Current Path forecast. The Combined Agenda 2063 scenario could therefore improve GDP per capita by an extra US$2 722. The average GDP per capita for ECOWAS in the Combined Agenda 2063 scenario will also be 16% higher than the average of US$7 310 for Africa in the same year.
The dramatic impact of the Combined Agenda 2063 scenario on GDP per capita shows that a policy push across all sectors is necessary to achieve sustained growth and development in the region. By 2043, Cabo Verde, Côte d’Ivoire and Ghana will have the highest GDP per capita in the Combined Agenda 2063 scenario with income levels of US$15 830, US$14 900 and US$12 960, respectively. Guinea Bissau (US$3, 883) Niger (US$3 863) and Sierra Leone (US$3 833) will have the lowest GDP per capita in the region.
Countries that will witness the greatest improvement over the Current Path in the Combined Agenda 2063 scenario are Côte d’Ivoire, Ghana and Cabo Verde with gains of US$5 154, US$4 331 and US$4 272, respectively. GDP per capita will increase least in Niger (US$1 512), Sierra Leone (US$1 492) and Guinea Bissau (US$1 254).
Chart 25 presents the change in the economy's structure, comparing the Current Path forecast with the Combined Agenda 2063 scenario from 2019 to 2043.
In the Combined Agenda 2063 scenario, the service sector’s contribution to GDP will be US$732 billion larger than in the Current Path forecast for 2043, equivalent to 56.9% of GDP. Manufacturing will overtake agriculture as the second largest contributor, adding US$380.9 billion to the regional economy above the Current Path to constitute 23.7% of the ECOWAS economy in the scenario. The agriculture sector will also contribute US$94.2 billion more in the scenario than in the Current Path equivalent to 8.6% of GDP. ICT will contribute US$78 billion above the Current Path, accounting for 5.6% of GDP in the scenario. The contributions of materials and energy will account for 2.5% and 2.8%, respectively, translating to US$32.2 and US$8.1 more than in the Current Path by 2043.
In the Combined Agenda 2063 scenario, the service sector in Cabo Verde will contribute 81.6% to GDP, the largest contribution in the region, while that of Mali will be the lowest at 35.2% of GDP. At 45.1%, Mali’s manufacturing sector will be the largest in the region while Liberia’s contribution of 6.8% to manufacturing in the scenario will be the lowest. The contribution of agriculture to GDP in the scenario will range from 20.4% in Liberia to a paltry 2.7% in Cabo Verde by 2043. The ICT sector in Liberia will be largest in the region contributing 7.1% while the energy sector in Nigeria (6%) and the material sector in Liberia (19.5%) will be the largest in the region.
Chart 26 compares life expectancy in the Current Path forecast with the Combined Agenda 2063 scenario.
In 2019, the average life expectancy for people in the ECOWAS region was 63.9 years, which was lower than the average of 65.1 years for Africa. It was the fifth highest among the RECs (after AMU, CEN-SAD, COMESA and IGAD). On average, females in ECOWAS live about 3 years longer than males. Among member countries, life expectancy was highest in Cabo Verde (73.7 years) and The Gambia (67.4 years) and lowest in Sierra Leone (59.1 years) and Guinea-Bissau (58.9 years). In the Current Path forecast, life expectancy in the region will increase to 72.3 years by 2043. However, the Combined Agenda 2063 scenario leads to a greater increase such that, by 2043, the average life expectancy in ECOWAS will be around 74.7 years, higher than the average of 71.7 years for Africa in the same year.
In the Combined Agenda scenario, Cabo Verde will still have the highest life expectancy in the region at 79.7 years. This will be followed by Nigeria and Ghana at 75.5 years and 75.2 years, respectively. Togo, Sierra Leone and Guinea will have the lowest life expectancies (72 years, 70.6 years and 68.3 years, respectively). The largest increase in life expectancy between the Current Path and Combined Agenda 2063 scenario will occur in Guinea, Sierra Leone and Liberia which will see averages increase by 3.4, 3.1 and 2.9 years, respectively. The smallest increments will be seen in Benin, Senegal and The Gambia with life expectancies lengthening by only 1.3, 1.1 and 0.9 years, respectively.
The Combined Agenda 2063 scenario will lead to a reduction in both the number and proportion of people living in extreme poverty by 2043. The number of poor people living on less than US$2.15 per day will decline from 106.8 million in 2019 to 36.4 million in 2043. This corresponds to a reduction from 27.2% of the population to 5.2%. Compared with the Current Path forecast, 80.7 million fewer people will live in extreme poverty in the Combined Agenda 2063 scenario, constituting a decline in poverty rate of 22 percentage points. The considerable reduction in the Combined Agenda 2063 scenario shows that a concerted policy push across sectors could significantly reduce poverty in ECOWAS.
Among member states, Liberia, The Gambia, Cote D’Ivoire and Senegal will have eliminated extreme poverty rates, with just less than 1% of the population living in extreme poverty by 2043. Sierra Leone, Togo, Burkina Faso, Guinea Bissau and Nigeria will still have over 5% of their population living below the extreme poverty line. The largest reduction in poverty rate will be seen in Liberia (29.6 percentage points), followed by Niger and Sierra Leone (19.1 and 17.6 percentage points, respectively). It means that in the long term, Sierra Leone, Niger and Liberia stand to benefit the most if the various policy interventions underpinning the Combined Agenda 2063 scenario are implemented. In contrast, the poverty rate will decline by only 1.5, 1.1 and 1.1 percentage points, respectively, in Cabo Verde, Senegal and Côte d’Ivoire in the Combined Agenda 2064 scenario. This is mainly because these countries already have very low extreme poverty rates.
Chart 28 compares the Gini coefficient in the Current Path forecast with the Combined Agenda 2063 scenario.
Inequality has increased in all countries in the region since 2000. According to OXFAM, the wealthiest 1% in the region owns more than the rest of the population. The Gini coefficient is the standard measure of the level of inequality in a country.[2A higher score depicts greater inequality while a lower score shows a more equal country. ] In 2019, ECOWAS’ Gini coefficient was 0.37 compared to the average of 0.40 for Africa. This makes ECOWAS the third most equal region among the RECs. Among member states, it ranges from 0.47 in Burkina Faso to 0.30 in Guinea. The Manufacturing scenario has the greatest potential to reduce income inequality in ECOWAS followed by the Education and Agriculture scenarios.
On the Current Path, income inequality in ECOWAS will increase with a Gini coefficient of 0.38 by 2043. This reflects the lack of commitment by governments in West Africa to policies and measures to reduce inequality. In the Combined Agenda 2063 scenario, inequality in ECOWAS will be slightly lower than the Current Path forecast with a Gini coefficient of 0.35 by 2043. This means that rapid economic growth in the scenario will not be sufficiently inclusive. Among member countries, Burkina Faso (0.46) will continue to be the most unequal country in the region followed by Togo and Cabo Verde at 0.44. Niger (0.31), Guinea (0.29) and Liberia (0.27) will be the least unequal countries. The greatest reduction in inequality occurs in Liberia, Niger and Gambia while the lowest reduction occurs in Guinea Bissau, Cabo Verde and Togo.
Chart 29 compares carbon emissions in the Current Path forecast with the Combined Agenda 2063 scenario.
In 1990, ECOWAS emitted a total of 15.4 million tons of carbon from fossil fuels. This increased to 54.4 million tons in 2019, representing an increase of 253.2% and constituting about 14.2% of total emissions in Africa. Among member countries, Nigeria was the highest emitter of carbon (35 million tons; 64.8% of total emissions) because of its economy size and large oil and gas sectors. Nigeria is followed by Ghana (8.7% of the region’s emissions) and Côte d’Ivoire (6.0%).
Despite being a small emitter of carbon, adverse climate change is having a devastating impact on ECOWAS, including migration, food insecurity and loss of productivity equivalent to 8% of GDP. In the past forty years, these climate change impacts have exposed the region's vulnerability. The coastal regions are threatened by rising sea levels and temperatures. Recurrent droughts, floods and storms are threatening other parts of the region. It is projected that the arid lands in West Africa lying south of the Sahara Desert, the Sahel, will suffer the most significant effects of climate-induced conflicts, mainly due to competition over declining fertile land and grazing land. Guinea Bissau, Mali, Liberia and Niger rank among the most vulnerable countries to climate change and environmental hazards globally.
By 2043, total carbon emissions will have more than quadrupled to 253 million tons in the Current Path forecast. In the Combined Agenda 2063 scenario, the region will emit 325 million tons of carbon by 2043, which is 28.4% above the Current Path forecast. Governments in ECOWAS should adopt mitigating strategies, such as using its high renewable energy deposits, to reduce carbon emissions.
The Governance, Manufacturing and AfCFTA scenarios are the most carbon-intensive as they involve high growth (Governance), aggressive manufacturing of low-end manufacturing goods (Manufacturing) and trade (AfCFTA) that will imply more fossil fuel usage. The Financial Flows, Large Infrastructure and Leapfrogging and the Demographics and Health scenarios are the least carbon-intensive for ECOWAS. In the Combined Agenda 2063 scenario, Nigeria will reduce its share of carbon emission in the region to 61.6% (although still high) and Ghana to 4.8% while Côte d’Ivoire increases its share to 9.3%. The higher emissions in Nigeria reflect the country’s expected economic growth and the huge volumes of oil and gas it will utilise. The reduction in the shares of countries like Ghana in emission rates can be attributed to moving from conventional energy sources to other renewables. Emissions in Liberia, The Gambia, Guinea Bissau and Cabo Verde will contribute less than 1% to the region’s emission.
Despite remarkable progress at regional integration, the challenges that confront ECOWAS are enormous, including the insecurity that threatens stability. Other governance challenges, particularly with election quality and credibility as well as corruption, continue to plague the region. The inability of member states to transform their economies, diversify their exports, reduce poverty and inequality whilst improving living standards poses danger for ECOWAS. These challenges are worsened by the impacts of climate change.
The analysis shows that while the region has made progress and will continue to make progress on the Current Path, it is not transformative enough to address the structural challenges. Without aggressive interventions, ECOWAS will not achieve its targets of inclusive and sustainable development that would translate into peace and prosperity for all its citizens by 2050.
Thus, rigorous and targeted socio-economic policy interventions in the areas of demographics and health, education, agriculture, infrastructure, manufacturing, trade, financial flows and governance need to be undertaken to improve the region’s current development trajectory.
Specifically the region should:
- Address the numerous security challenges by improving its joint security taskforce through the operationalisation of the ECOWAS Standby Force Unit to fight terrorism and violent extremism. Security services in member countries should collaborate and partner regarding intelligence gathering and information sharing to be more effective in combating the various security threats.
- The Commission should sanction member states which breach their constitution or amend it to their advantage, as would be the case during military takeovers. Similarly, the Commission should go beyond the election observer report to sanction leaders that commit election fraud and other electoral offences to inspire confidence in electoral processes. For instance, leaders who are alleged to commit electoral fraud should not be eligible to contest for chairmanship of the Commission.
- ECOWAS leaders should improve their commitment to fighting corruption through institutional reforms and provision of resources to anti-corruption institutions and agencies in their countries.
- Leaders should ensure proper natural resource management and value addition to improve revenues from these resources.
- Diversify the ECOWAS economy from the traditional agriculture and commodity exports to other sectors such as tourism and creative arts. This will increase revenues and reduce vulnerability to international commodity fluctuations and external shocks.
- Ensure that all barriers hindering free movement of people and goods are removed to promote regional trade and integration through the full operationalisation of the ECOWAS trade liberalisation scheme.
- Ratify and ensure the full implementation of the continental free trade agreement.
- Pursue the ECOWAS vision of monetary union through the creation of the ECO to facilitate trade among member countries.
- Commit to joint infrastructure projects to reduce the cost and time of travel among member countries and facilitate connectivity and accessibility across the region.
- Ensure the rapid formalisation of the economy to improve government revenue. This can be achieved by reducing the cost of internet access and various bottlenecks associated with business registration and regulations.
- Rely on its huge renewable energy sources such as solar, wind, hydro to gradually phase out reliance on fossil fuel for its energy needs. This will help promote growth while ensuring that environmental concerns are addressed. ECOWAS should implement its white paper on the West African Power Pool and, through the ECOWAS Regional Electricity Regulatory Authority, promote a regional electricity market to facilitate energy exchange.
- Address land tenure issues through land reformation policies to enhance security of tenure to promote large scale farming.
- Provide incentives to young farmers and facilitate commercial agriculture.
- Invest in agriculture by providing and improving storage facilities, fertilisers, seedlings and irrigation facilities to increase agricultural yield.
- Implement targeted free education and school feeding programmes at basic levels to increase enrolment.
- Improve the quality of education alongside offering vocational and technical training as opposed to the singular focus on academic teaching so evident across many countries in the region.
- Address youth unemployment through youth empowerment programmes, vocational training and entrepreneurial skill acquisition programmes.
- Improve the business environment to attract FDI into different sectors.

Endnotes
The IFs platform uses data from the Global Trade and Analysis Project (GTAP) to classify economic activity into six sectors: agriculture, energy, materials (including mining), manufacturing, services and information and communication technologies (ICT). Most other sources use a threefold distinction between only agriculture, industry and services, with the result that data may differ.
A higher score depicts greater inequality while a lower score shows a more equal country.
Page information
Contact at AFI team is Enoch Randy Aikins
This entry was last updated on 28 May 2026 using IFs v8.16.
Reuse our work
- All visualizations, data, and text produced by African Futures are completely open access under the Creative Commons BY license. You have the permission to use, distribute, and reproduce these in any medium, provided the source and authors are credited.
- The data produced by third parties and made available by African Futures is subject to the license terms from the original third-party authors. We will always indicate the original source of the data in our documentation, so you should always check the license of any such third-party data before use and redistribution.
- All of our charts can be embedded in any site.
Cite this research
Enoch Randy Aikins (2026) ECOWAS Development Futures. Published online at futures.issafrica.org. Retrieved from https://futures.issafrica.org/geographic/recs/ecowas/ [Online Resource] Updated 28 May 2026.