 3 Demographics
Feedback welcome
Our aim is to use the best data to inform our analysis. See our Technical page for information on the IFs forecasting platform. We appreciate your help and references for improvements via our feedback form.
This theme explores how Africa’s slow demographic transition constrains its development outcomes, given the low ratio of its working-age population to dependents, which is particularly pronounced in Sub-Saharan Africa. It then discusses the structure of a Demographics and Health scenario and its potential impact on key development outcomes.The scenario includes rolling out modern contraceptives, reducing mortality from communicable and non-communicable diseases, and improving water and sanitation infrastructure. The effect of the scenario is a more productive labour force, meaning more working-age people relative to dependants. Additionally, the analysis examines the broader social and political benefits of demographic shifts, such as reduced political turbulence and an increased likelihood of liberal democracy, providing a comprehensive view of how progressive demographics can unlock Africa's growth potential. Aspects relating to female empowerment and education, two important drivers of fertility, are discussed as part of the themes on gender and education.
Please see the Technical page for more information about the International Futures modelling platform we use for our forecasts and scenarios.
Summary
This theme starts with an overview of Africa’s demographic transition and the concept of the demographic dividend, explaining how shifts in population structure influence economic growth and development outcomes.
- The demographic dividend can be assessed through several indicators, including the ratio of working-age people to dependents, fertility rates and median age.
The theme then examines current demographic trends and projections across the African continent. It outlines patterns in fertility, mortality and dependency, assesses the role of urbanisation, and considers when different countries may enter a potential demographic window of opportunity in a business-as-usual scenario or Current Path.
- Due to persistently high fertility rates, most sub-Saharan African countries remain decades away from achieving their first demographic dividend, when a rising share of working-age people can support faster economic growth.
- A favourable demographic dividend contributed significantly to the economic expansion of today’s high-income economies and to the rapid growth of East Asia, while sub-Saharan Africa’s demographic transition has been later and slower.
- Sub-Saharan Africa’s demographic transition is uneven and shaped by low levels of urbanisation and high dependency ratios, though there are large differences across countries and regions.
- Lower fertility rates are closely associated with improvements in human capital, particularly better health outcomes and higher educational attainment.
Moving beyond the Current Path, the theme then explores the implications of a Demographics and Health scenario in which faster progress in health, fertility decline and investments in the provision of basic infrastructure for safe water and sanitation accelerate income growth, better human capital outcomes and poverty reduction. Slower population growth in Africa also impacts global population trends, with additional benefits including lower long-term carbon emissions.
Reducing Africa’s high dependency structure is central to unlocking the economic, social and political benefits associated with demographic change.
The separate theme on Health and WaSH presents the impact of the same Demographics and Health scenario on life expectancy and infant mortality, among others. The various geographic reports on this website present the impact of the Demographics and Health scenario for every African country and region, as well as for regions such as Central Africa and the Southern African Development Community (SADC). These can be accessed from the GEOGRAPHIC drop-down menu at the top of this page.
The theme concludes with a set of policy recommendations.
All charts for Demographics
- Chart 1: Population in regions, 1950-2100
- Chart 2: Life expectancy in North Africa, sub-Saharan Africa and the European Union, 2020-2050
- Chart 3: Comparing GDP per capita, economic and population growth rate, and total fertility rates, 2000-2050
- Chart 4: The five stages of the demographic transition
- Chart 5: Population pyramid by gender and 5-year age group, 2025 vs 2050
- Chart 6: Rates of urbanisation. 2025 vs 2050
- Chart 7: Number of African urban agglomerations by size, 2000-2050
- Chart 8: Different Categories of the Demographic Dividend
- Chart 9: Conceptualisation of the first demographic dividend.
- Chart 10: Demographic dividend by global income group, 1960-2100
- Chart 11: Number of years from 2025 until a country enters a demographic window of opportunity
- Chart 12: Demographics and Health scenario
- Chart 13: Number of African countries in which the disease type was among the top five, 2022
- Chart 14: Demographic dividend in selected regions, Current Path vs Demographics and Health scenario, 2000-2075
- Chart 15: Human Capital Distribution, Current Path vs Demographics and Health scenario, 2050
- Chart 16: Population forecast in Africa and the World, Current Path vs Demographics and Health scenario, 2000-2100
- Chart 17: Human Capital Distribution in the European Union, 2025 vs 2050
- Chart 18: Comparing GDP per capita, economic and population growth rates for Africa and European Union, 2025-2050
- Chart 19: Development metrics in Current Path vs Demographics and Health scenario, 2025-2050
- Chart 20: Stability and Democracy forecast based on demographics in Current Path and Demographic and Health scenario, 2025 vs 2050
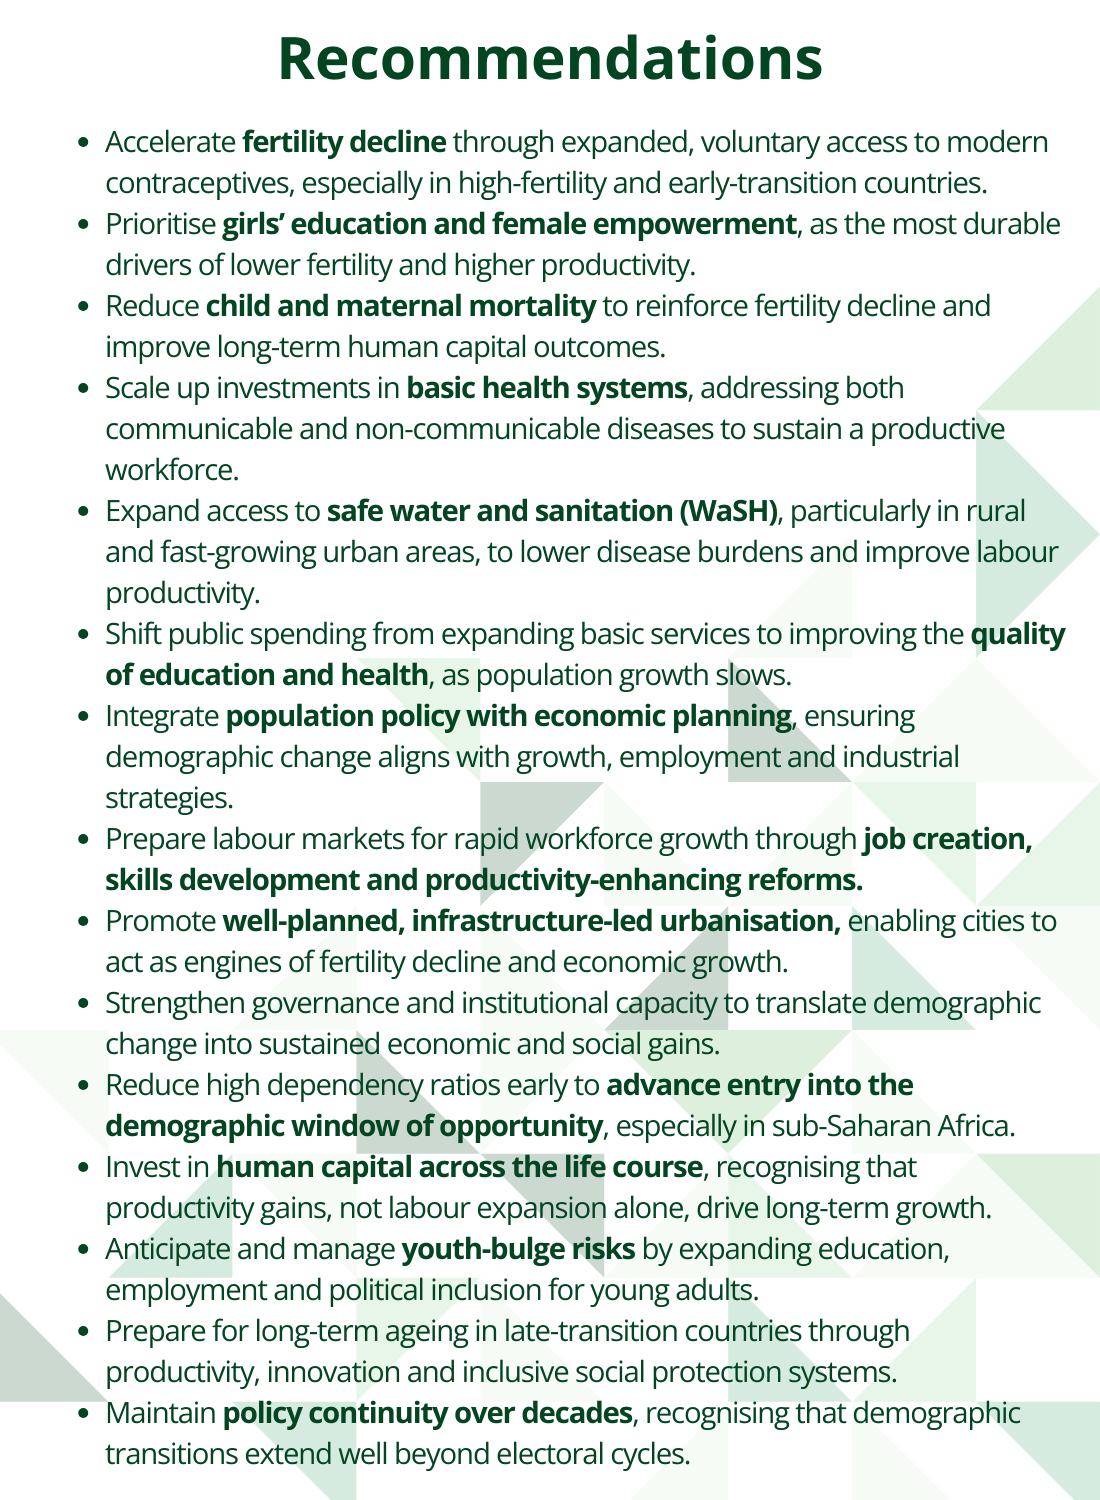
- Chart 21: Recommendations.
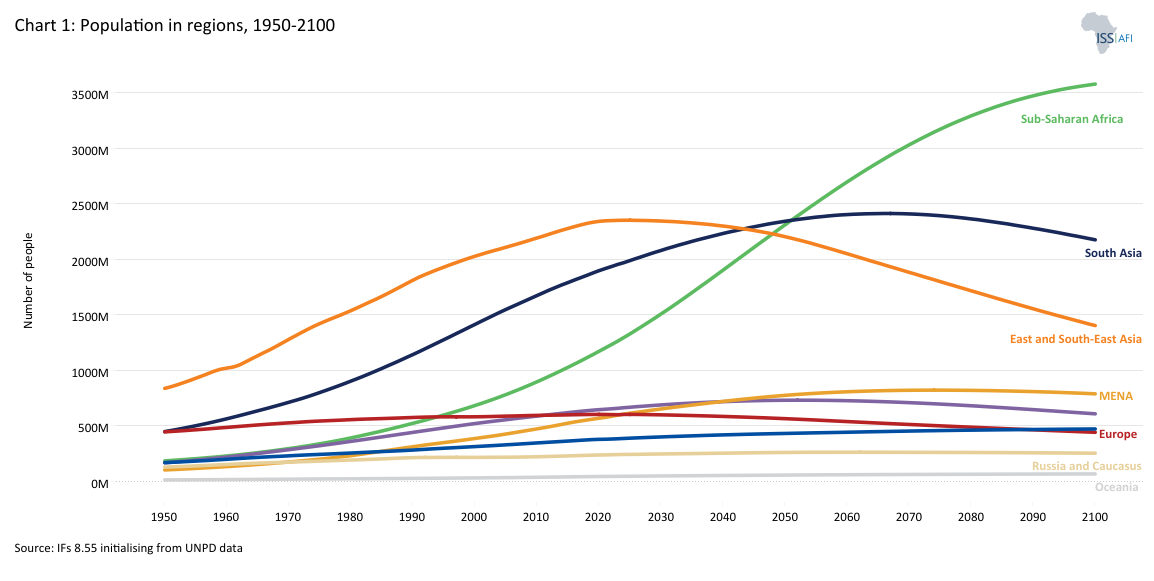
Africa’s population is growing rapidly. From 284 million in 1960, the continent’s population had increased to 482 million by 1980 and to 830 million by 2000. In 2025, the continent had 1 552 million people, and its population is projected to reach 2.586 billion in 2050 and 3.850 billion in 2100. This accounts for 27% and 39% of the global population, respectively, which is expected to peak at around 10.156 billion by approximately 2076, then slowly decline thereafter.
Chart 1 presents the history and forecast of regional populations worldwide over a century and a half, spanning the 75 years of history from 1950 to 2025 and a 75-year forecast to the end of the century. Note that North Africa is part of the Middle East and North Africa region (MENA).
While population growth has slowed or reversed across most regions, Africa’s continues to rise. Europe’s population has already begun to decline, and Asia’s is expected to peak around 2055. Africa’s population, by contrast, is projected to double from 1.5 billion in 2025 to 3 billion by 2061, before gradually stabilising.
This shift will dramatically alter the global labour balance. By 2040, Africa’s working-age population (15-64 years) will exceed that of India and China combined, positioning the continent as the world’s largest potential labour force. If harnessed effectively through education, health and job creation, this demographic expansion could underpin Africa’s rise as the next major global growth pole.
Africa’s growth dynamics are driven by its exceptional population momentum. In 2025, the average total fertility rate (TFR) in Africa was 4 births per woman of reproductive age—almost double the global average, although declining. By 2050, it should be at 2.8 births, still significantly higher than any other region globally.
In 2025, 47.6 million children were born in Africa compared to 84.7 million in the rest of the world. Births outside Africa (i.e. in the world excluding Africa) are expected to fall to 74.4 million in 2050, while those in Africa are projected to rise to 56.6 million. At this point, they will start to level off and eventually decline, expected to fall below replacement level, which is a fertility rate of 2.1 births per woman, by around 2035. At the 2.1 rate, populations stabilise as mortality and migration remain relatively constant—meaning population size neither grows nor shrinks significantly. Below the 2.1 rate, populations eventually start to decline. Rates differ widely, of course, depending on income, education, location (urban vs. rural), sector (formal vs. informal), access to modern contraceptives and other factors. For example, fertility rates in African capitals such as Addis Ababa are already below replacement level, while rates in rural Ethiopia are around six or more children per woman. Only four African countries had below-replacement numbers in 2025: Seychelles, Tunisia, Cabo Verde and Mauritius. Meanwhile, the averages in Chad and Somalia remained above six births per woman.
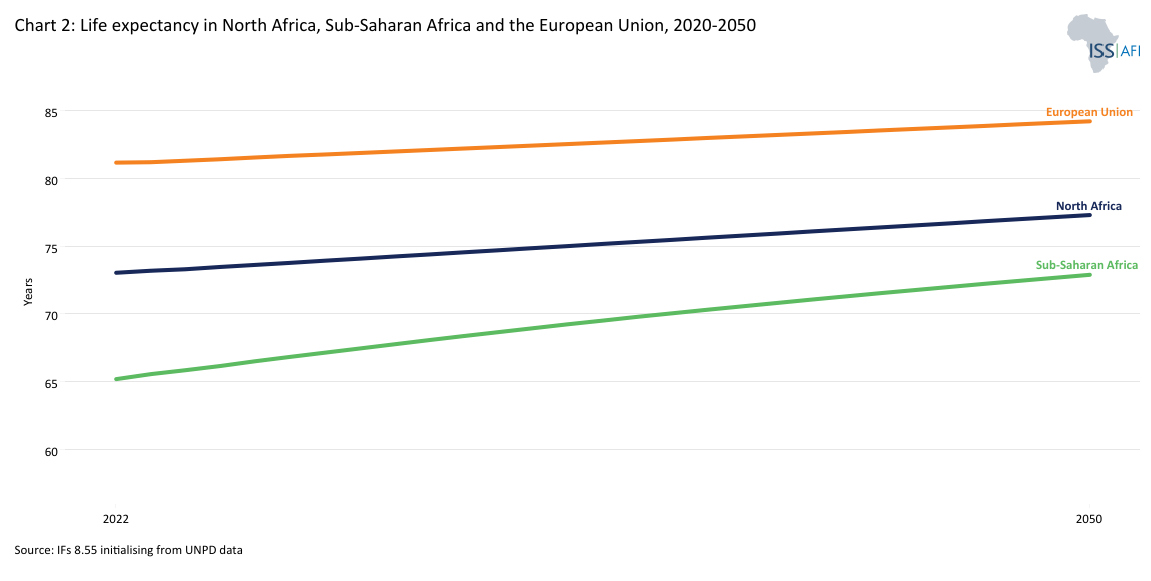
In addition to TFR and a host of other demographic indicators, it is also important to briefly consider changes in life expectancy, which in Africa is significantly lower than in most other regions, at 65.15 years in 2025, with females living almost two years longer than men. The average life expectancy in Singapore is 85.1 years compared to 53 years in Lesotho, the lowest rate globally due to the lingering effect of HIV/AIDS.
Chart 2 depicts life expectancy in North Africa, sub-Saharan Africa and the European Union from 2020 to 2050. Similar to most development indicators, life expectancy in North Africa (at 73.5 years) is significantly higher than in other regions of Africa, but still almost eight years shorter than in the European Union on the other side of the Mediterranean Sea, reflecting the large disparities in human development indicators between these neighbouring regions.
In many low-income economies, a significant portion of the population is active in subsistence agriculture or informal activities where productivity (output per worker) is very low. In these early stages of development, economic growth is driven largely by transferring large pools of low-productivity workers into more productive jobs and by basic improvements in labour utilisation and skills. Thus, in developing regions such as Africa, the larger and more productive the labour pool relative to dependants (children and the elderly), the faster the economy can grow.
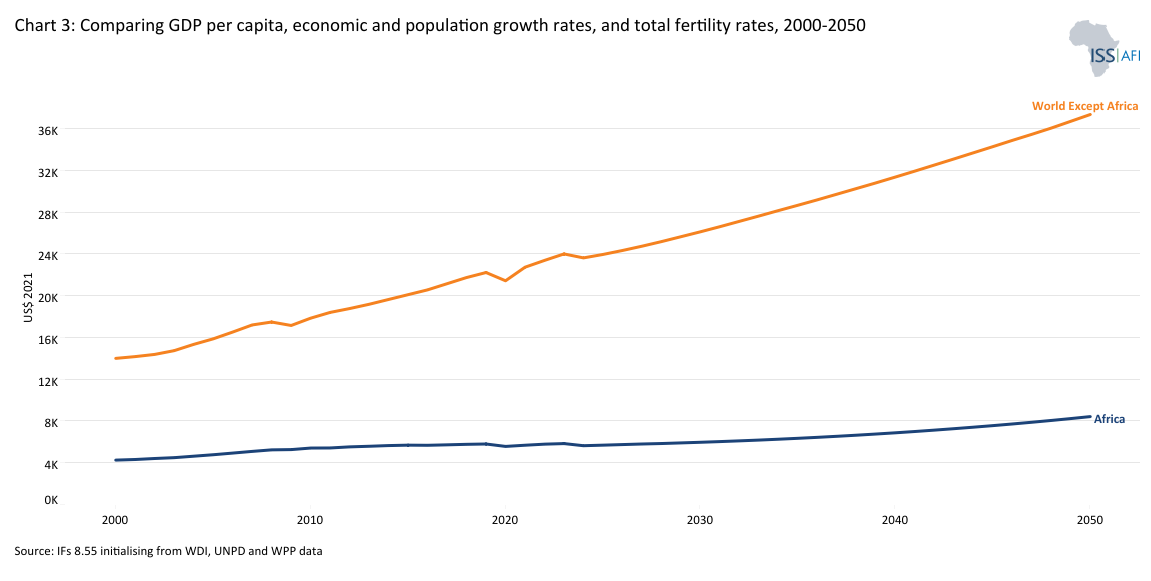
The average annual growth rate of the African economy from 2000 to 2025 was 3.8%. Because Africa has a young and rapidly growing population (meaning the proceeds of growth have to be shared among more people), this translates into an average improvement of only 1.2% in gross domestic product per capita in purchasing power parity (GDP per capita in PPP). Meanwhile, average economic growth rates in the rest of the world (i.e. the world except Africa) over the same period were slightly lower, at 2.9%. However, because populations there grew more slowly (at an average annual rate of 0.9%), GDP per capita grew much more rapidly, at 2.2% per annum.
Chart 3 shows the impact comparison of GDP per capita, economic and population growth rates and total fertility rates from 2000 to 2050. The Current Path forecast is that the African economy will expand by a healthy 5% from 2026 to 2050, compared to the 2.6% average for the rest of the world (i.e., the world excluding Africa). Largely due to rapid population growth (2.2% per annum in Africa compared to only 0.24% in the rest of the world), it will translate into GDP per capita growth of only about 1.6% per annum in Africa, similar to the average rate of expansion in the rest of the world, despite Africa’s more rapid economic growth. Things are improving in Africa, but the pace is generally slower than elsewhere, leaving the continent behind in key measures, such as average GDP per capita.
For Africa to start narrowing the GDP per capita gap with the global average, growth rates in Africa would need to average significantly higher. To this end, various themes on the AFI website model the potential improvements through better education, a manufacturing transition, and more.
From a demographic point of view, the most effective way to improve development outcomes for sub-Saharan Africa is to advance the point at which the region enters a demographic dividend, which will enhance the contribution that labour makes to economic growth while simultaneously pursuing other productivity improvements, such as better education, health, trade integration and a manufacturing transition. North Africa is much further along in its demographic transition than sub-Saharan Africa, hence the focus on the latter. While advantageous from a development perspective, it is important to maintain fertility rates at above 2.1 children in the long term to avoid the type of population contractions evident in Europe and Asia.
To understand what Africa’s population growth means for development, it helps to first examine the various stages of the typical demographic transition.
The demographic transition describes how societies move from high fertility and mortality (or death) rates to low fertility and mortality rates as they develop.
Modernisation and prosperity are closely tied to lower fertility and urbanisation. As countries become more prosperous, their fertility rates tend to decline. In fact, no country has modernised socially and economically while maintaining high fertility and a predominantly rural population. Countries with high child mortality tend to have high fertility, currently most evident in Central Africa. Then, reduced child mortality sets off a virtuous cycle as more children survive and parents choose smaller families. Smaller families, in turn, improve maternal and child health and education. Female education has the most powerful long-term effect on reducing fertility, but the most powerful short-term impact is generally a result of access to modern contraceptives.
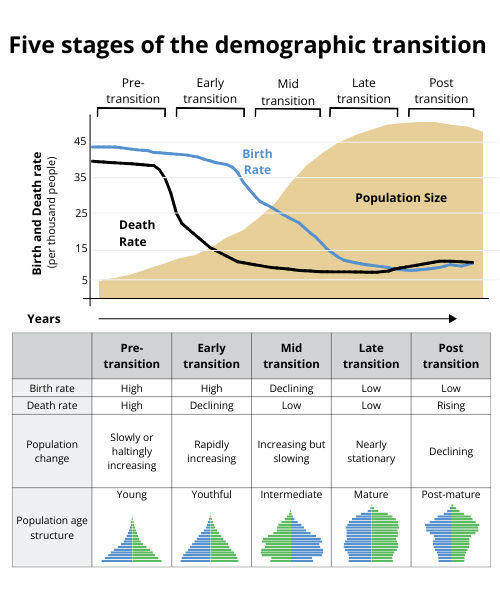
Chart 4 shows the five stages of the demographic transition. Different African countries are at varying stages of this transition as part of a gradual process unfolding over long time horizons, each with distinct population structures and policy implications.
Stage 1 (Pre-transition) - High fertility and high mortality: At this stage, both birth and death rates are high, keeping population growth low and volatile. Most of Africa was in this stage until the mid-20th century. High child mortality, poor sanitation, limited access to healthcare and food insecurity constrained population growth. Only a few fragile or conflict-affected states remain close to this pattern today.
Stage 2 (Early transition) - Mortality decline: Improvements in the provision of adequate food, sanitation, vaccination and healthcare reduce mortality—especially among children—while fertility remains high. This triggers rapid population growth. Much of sub-Saharan Africa entered this stage between the 1950s and 1980s. Chad, Somalia, the DR Congo, the Central African Republic and Niger are still here today, with fertility rates around 6 births per woman.
Stage 3 (Mid-transition) - Fertility decline: As education expands, child survival improves and urbanisation increases, fertility begins to fall. Families choose to invest more in fewer children, and the dependency ratio starts to improve. Many countries, including Tanzania, Ghana, Zambia and Senegal, are in this middle stage, with fertility rates between 3 and 5 births per woman. This phase marks the onset of a potential first demographic dividend, explained in more detail below.
Stage 4 (Late transition) - Low fertility and low mortality: Both fertility and mortality stabilise at low levels, slowing population growth and gradually ageing the population. Countries such as Morocco, Tunisia, Mauritius and South Africa are in this late-transition stage. Here, the demographic window of opportunity is open: the working-age population is large relative to the number of dependants, and with facilitating government policies, productivity gains can translate into sustained income growth.
Stage 5 (Post-transition) - Rising death rates and low birth rates: Fertility falls below replacement level (around 2.1 births per woman), leading to population ageing and, eventually, decline. This stage characterises much of Europe and East Asia today. No African country has reached this stage, although some small islands and North African states are approaching it.
Africa’s demographic transition is highly uneven but steadily progressing. The average fertility rate in North Africa was 2.6 children per woman in 2025, followed by Southern Africa at 3.6 children, East Africa at 4 children, West Africa at 4.3 children and Central Africa at 5.5 children. The median age varies from under 17.4 years in Central Africa to 19.3 years in West Africa, 19.6 years in East Africa, 22 years in Southern Africa and 27.6 years in North Africa. On the Current Path (or business-as-usual) forecast, by 2050, these numbers would be:
- North Africa TFR of 1.8 children, with a median age of 34.5 years
- Southern Africa TFR of 2.5 children, with a median age of 26.6 years
- East Africa TFR of 2.7 children, with a median age of 25.2 years
- West Africa TFR of 3 children, with a median age of 24.1 years
- Central Africa TFR of 5.6 children, with a median age of 21.1 years
The reason why the high TFR in West Africa is not translating into a lower median age compared to East Africa is that infant and child mortality rates in West Africa are the highest amongst the five African regions. Mortality rates from various disease categories, such as other communicable diseases, respiratory infections and malaria, are also higher in West than in East Africa. As a result, average life expectancy in West Africa is lower than in East Africa, but not as low as it is in Central or Southern Africa.
As of 2028, life expectancy in Central Africa will be the lowest amongst the five sub-regions in Africa, having been overtaken by Southern Africa as it recovers from the impact of the HIV/AIDS pandemic.
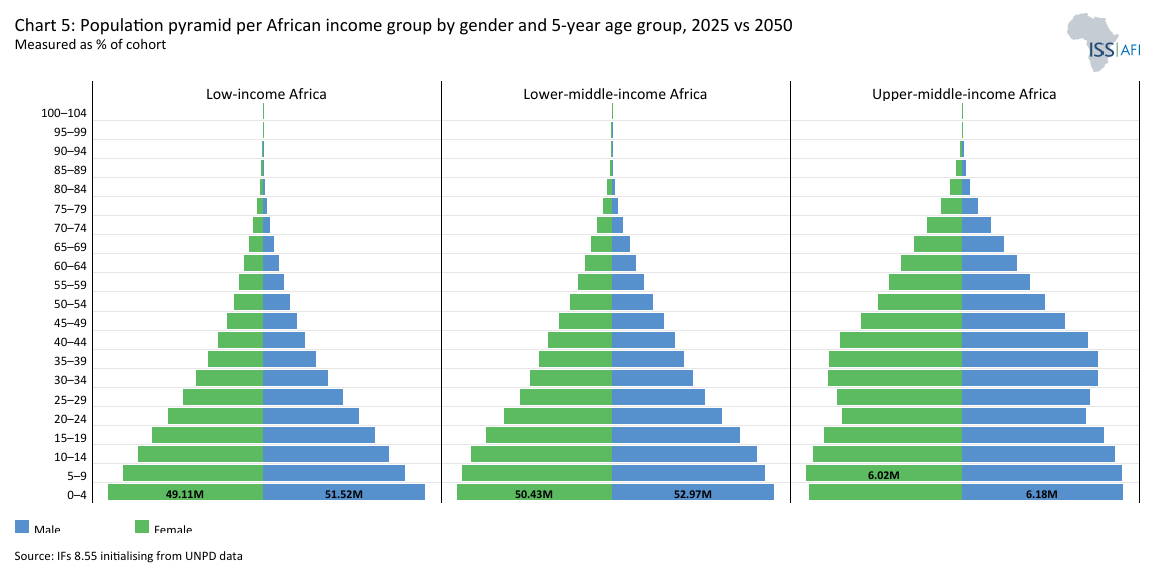
Chart 5 displays the population pyramid by income group for each five-year cohort in the selected geography for 2025 versus 2050. The data is expressed as a percentage of the total population and can be changed to totals. The data is for the Current Path forecast, and expressed as a percentage of the total cohort.
Understanding where each country sits along this demographic continuum—and where it will sit in the future—is critical to designing realistic, sequenced policies to advance and ultimately capitalise on the demographic dividend.
The relationship between fertility and productivity lies at the core of the demographic transition. As fertility rates decline, families have fewer dependants to support, allowing for more investment in each child’s health, education and future earnings potential. At the same time, a smaller share of children in the total population increases the relative size of the labour force, enabling faster economic growth—provided that the expanding workforce is healthy, skilled and productively employed. Should a country have a very young population, such as Niger, it spends most of its education, health and infrastructure spending on building additional schools, hospitals and other infrastructure to meet the growing demand. Once the population matures, some of that expenditure can shift towards better (and possibly eventually fewer) schools, improved health facilities and infrastructure. This is an important dynamic: governments with more mature population structures can spend more of their budgets on improving the productivity of the existing population, leading to greater output and higher rates of economic growth.
The same dynamic holds at the family level. High fertility rates constrain household and public resources. Families with many children must divide their limited income among them, reducing the amount available to spend on nutrition, schooling and healthcare per child. Some children may even not be able to complete schooling if sufficient funds are not available.
When fertility declines, these constraints begin to ease. Parents can invest more per child, girls are more likely to stay in school and maternal health outcomes improve. Public spending can shift from quantity to quality—fewer pupils per teacher, more secondary and tertiary education and better health systems. This creates a virtuous cycle in which lower fertility results in improved human capital and to higher productivity over time.
The demographic transition alters the composition of the population. A smaller youth cohort and a growing share of working-age adults expand the pool of potential workers, while rising education and health levels, resulting from increased funding for improvements in each sector, enhance their productivity. In the long term, productivity gains rather than labour expansion drive income growth.
For countries at early- or mid-transition stages, this means that reducing fertility is not an end in itself but a catalyst for broader transformation. The combination of a healthier, better-educated population and more employment opportunities can shift economies from dependency-driven growth to productivity-driven development.
Lower fertility enables more women to enter and remain in the labour force, particularly where education, norms and job opportunities are available. In Africa, female participation rates remain high in informal and subsistence work but low in formal, well-paid sectors. Expanding women’s access to education, finance and decent jobs not only reduces poverty but also amplifies the economic benefits of fertility decline. Each additional year of female education is associated with lower fertility and higher household income, strengthening the link between gender equality and productivity.
Fertility reduction alone cannot guarantee growth, although it is likely to contribute, as explained in the preceding paragraphs. Productivity depends on complementary investments in education, health, infrastructure and good governance. Countries that combine population policies with economic reforms—encouraging investment, innovation and inclusive labour markets—are better able to translate demographic change into sustainable development gains. Lower fertility creates the conditions for growth, but investments in human capital and opportunity turn that potential into real prosperity.
Each year, urban Africa grows by an estimated 24 million people. As a result, Africa’s urban population is projected to double from approximately 711 million in 2025 to more than 1.4 billion by 2050, with most growth expected to occur in small and medium-sized cities.
Historically, urbanisation has been a catalyst for growth and development, closely linked to the demographic dividend. As people move from rural to urban areas, or remain in urban areas, fertility rates tend to decline, household sizes shrink, and access to healthcare, education and employment improves. These shifts reinforce one another, accelerating the demographic transition and supporting more productive economies. Smaller living spaces, higher living costs and exposure to new lifestyles increase the perceived value of investing in fewer children. As the share of people living in cities grows, these behavioural shifts gradually extend to peri-urban and even rural communities, accelerating fertility decline at the national level.
The theme on Health and WaSH explains that it is easier to provide safe water, improved sanitation and basic infrastructure within an urban setting, where bulk services such as clean water, improved sanitation and household electricity can be provided to people in denser settlements than to a population spread out across large rural areas—but that is only possible if urbanisation proceeds at a pace that allows authorities to preposition the associated infrastructure.
Upgrading infrastructure in existing urban areas is a complex and expensive undertaking. Initial phases of urbanization therefore typically raise productivity because cities concentrate labor, reduce transaction costs, and facilitate innovation.Generally cities provide better access to education, healthcare and family planning services, all of which contribute to lower fertility rates. Urban women typically have fewer children than their rural counterparts, largely due to higher levels of education, later marriage and increased participation in the workforce. In countries such as Ethiopia, Ghana and Tanzania, fertility rates in capital cities are now close to replacement level. At the same time, those in rural areas remain above five or six births per woman.
According to an OECD analysis, urbanisation has accounted for about one-third of per capita GDP growth in Africa over recent decades. Urbanisation concentrates labour, infrastructure and services, creating conditions for innovation, entrepreneurship and economies of scale. When managed effectively, cities become engines of job creation and productivity growth, enabling countries to capitalise on their demographic dividend. The structural shift of economic activity toward urban areas (i.e. from agriculture) has been a major driver of national income gains through increased labour productivity, more skilled and higher-value employment, and enhanced access to markets and regional value chains. The relationship is complex and non-linear, however. Very high levels of urbanisation the may act as a drag on economic growth, particularly at rates exceeding 70%, as infrastructure bottlenecks, traffic congestion and service delivery gaps arise,which may explain why Latin America and the Caribbean, with the highest percentage of its population residing in urban areas (83%), struggle to benefit from high urbanisation rates. It is likely that the infrastructure and institutional setting typically associated with higher levels of urbanisation make all the difference.
In 2025, Africa's average urbanisation rate stood at 46%, with Gabon at 90% and Burundi at 15%. These rates are significantly lower than the global average of 59%, indicating potential for substantial growth. Only South Asia, which includes rural countries such as Sri Lanka, Nepal and Afghanistan, had lower levels of urbanisation in 2025 than sub-Saharan Africa. As a result, rates of urban population growth in sub-Saharan Africa (at 3.7% in 2025) are significantly higher than in other regions of the world.
East Africa is the most rural part of the continent. It will likely remain so, with levels of urbanisation currently more than 25 percentage points lower than in North Africa, the most urban region. Along with Central Africa, East Africa is experiencing the fastest rates of urbanisation.
Currently, Gabon, Libya, Djibouti, São Tomé and Principe, Algeria, Equatorial Guinea, Botswana and Tunisia are the most urbanised countries in Africa, with urbanisation rates of over 70%. Malawi, Rwanda, Niger and Burundi are technically the least urbanised, with less than 20% of their populations considered urban. However, population density in Rwanda and Burundi is the second- and third-highest on the continent, meaning that the distinction between urban and rural is often an administrative decision with little resonance on the ground.
Population density is therefore an important additional consideration, and Africa has several countries with exceptionally low densities, such as the Central African Republic, Mauritania, Botswana, Libya, Namibia and the Sahrawi Arab Democratic Republic (Western Sahara), all of which had average densities of less than one person per hectare in 2025. The island of Mauritius has the greatest average density, at 6.4 persons per hectare, followed by Rwanda and Burundi, mentioned previously.
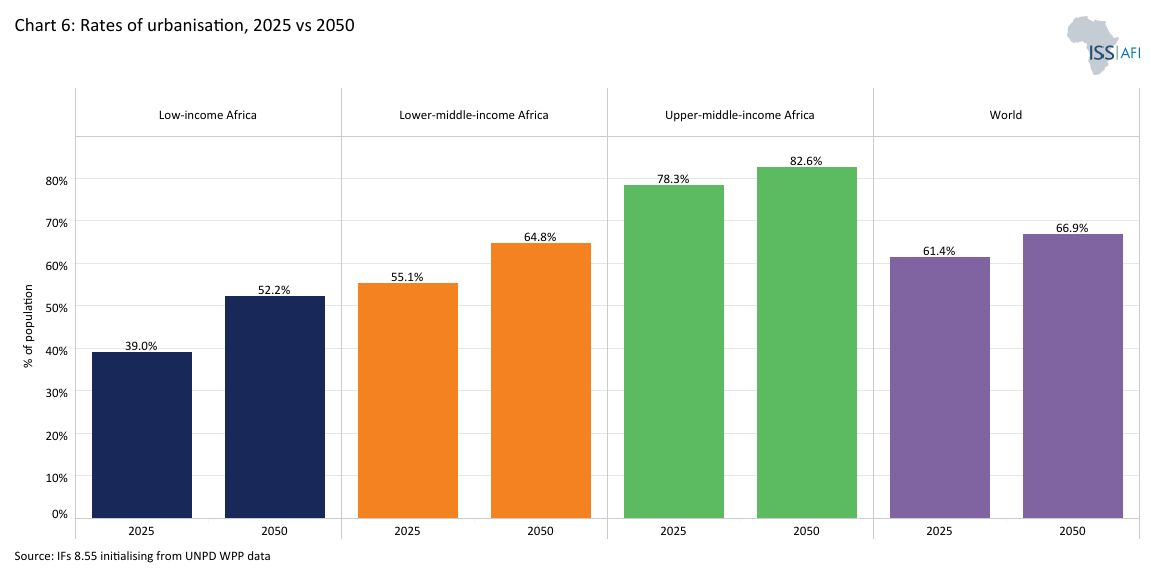
Without the productivity benefits of a larger share of its population eventually concentrated in urban areas. The associated drag of very high fertility rates means that, African countries with a large component of their population in rural areas will struggle to grow incomes, even as subsequent high urban growth rates are likely to challenge the authorities' ability to manage it. Chart 6 depicts urbanisation rates for different regions in 2025 and 2050.
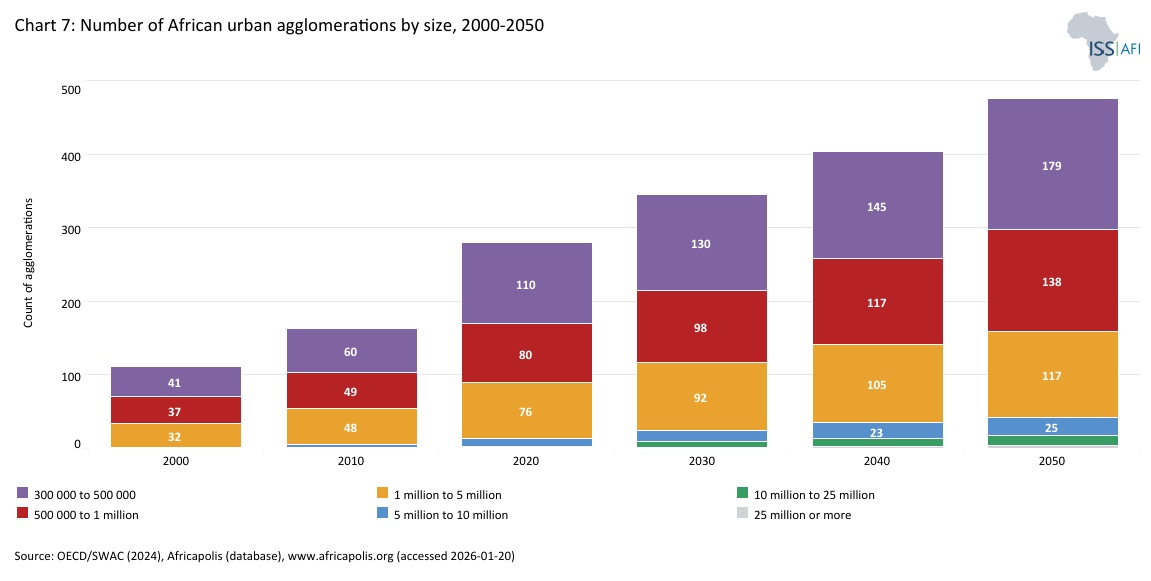
The management of its urban areas will present African leadership with many challenges, including political ones. Urbanisation has powerful socio-political implications. It has become an essential consideration in explaining political change, where urban areas are often the first to turn away from supporting the governing party, as evident in cities as diverse as Algiers, Addis Ababa, Harare and Cape Town. As elsewhere, African urbanites tend to be more politically engaged than rural residents, reflecting higher levels of education and access to media and information. Inevitably, it is in the larger cities that support first goes to opposition parties. Chart 7 shows the number of urban agglomerations by size, ranging from 300 000 to 25 million or more, highlighting how the number of urban centres are likely to grow rapidly.
Africa’s urban growth, therefore, presents both challenges and opportunities. If well-planned, it can accelerate fertility decline, improve access to education and employment opportunities, and create hubs of innovation that drive long-term development, requiring preparatory investment and planning.
The concept of a demographic dividend is well established in demography and population studies. It typically refers to the temporary economic opportunity that arises from changes in the ratio of the working-age population to the dependent population, which includes children below 15 years of age and the older population, 65 years and above, the latter generally considered the retirement age. The actual retirement age is now being increased in most developed economies as governments respond to lower fertility rates and population ageing, as well as the fact that young adults are entering the labour market much later, often still in the education system until their early twenties.
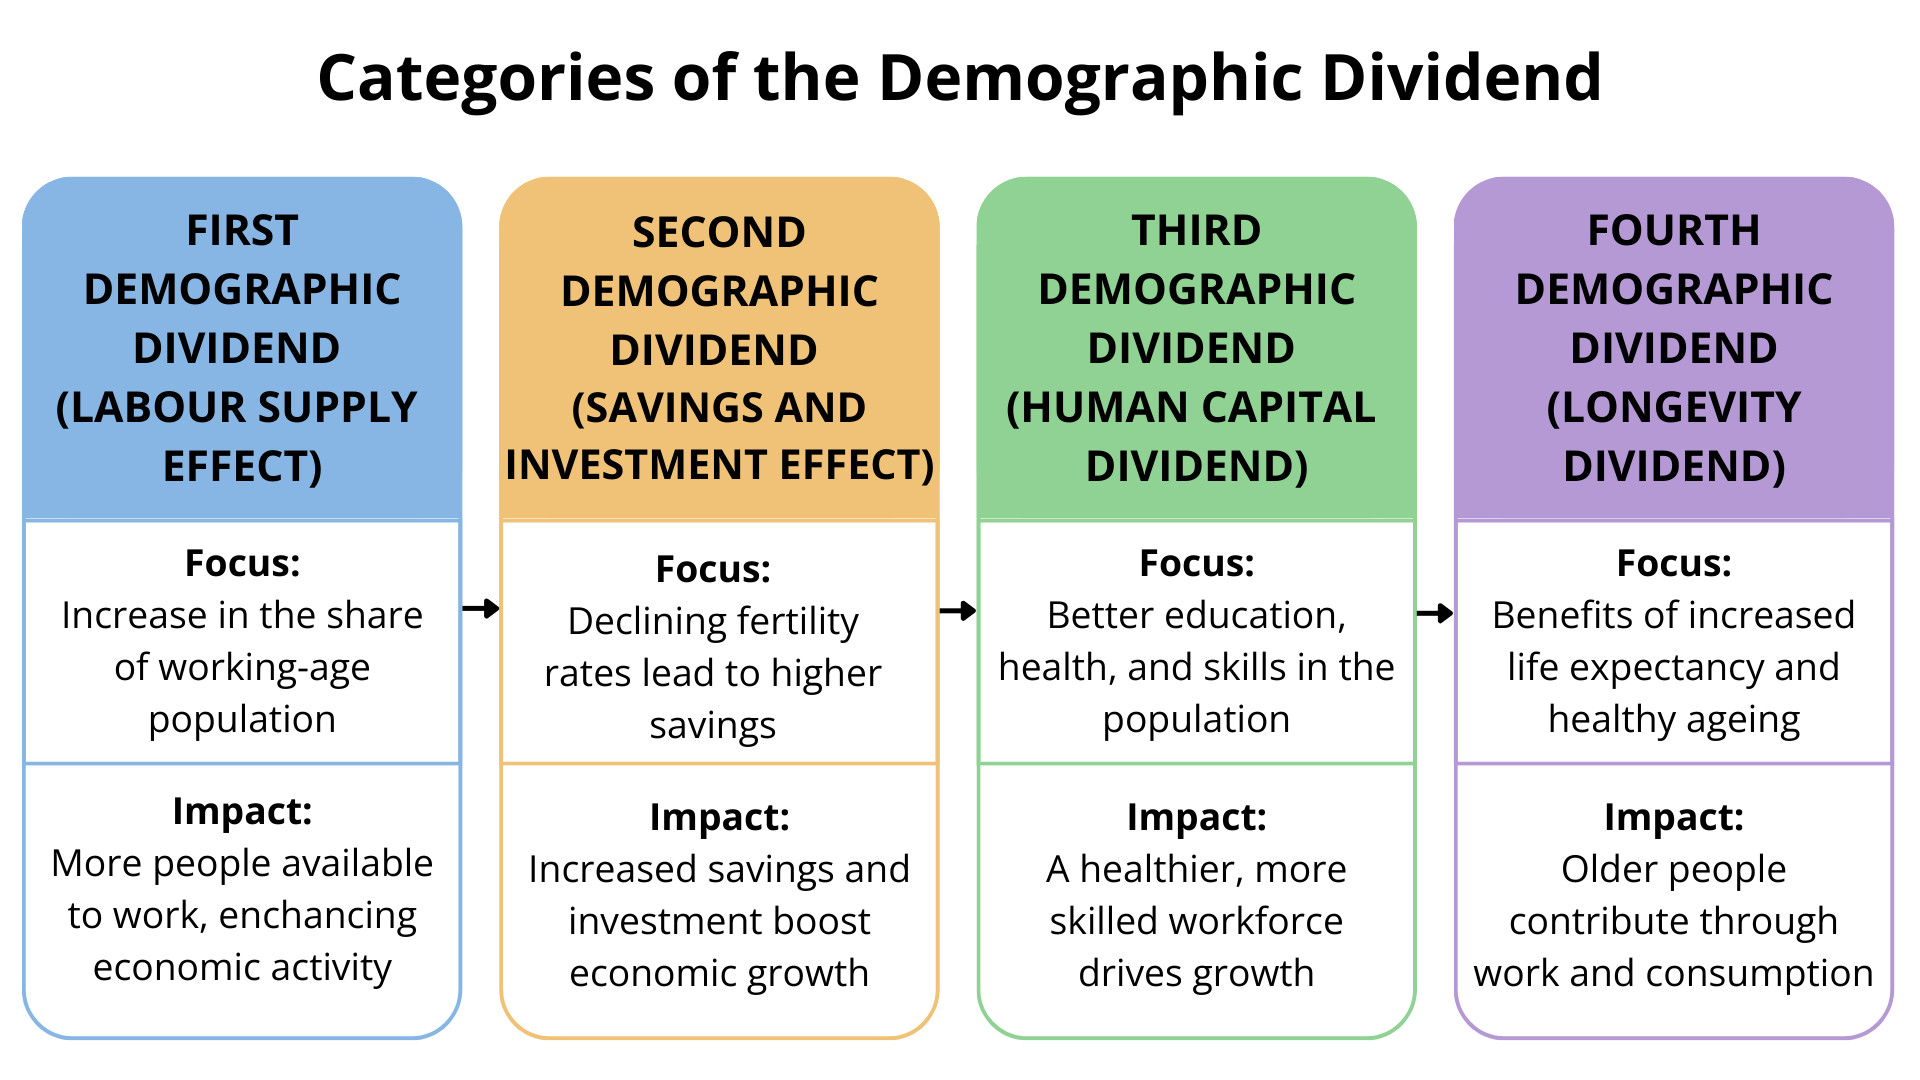
Chart 8 presents the four categories of the demographic dividend, with the first category being the most important for Africa. The first dividend occurs when the share of people of working age (15 to 64 years) increases relative to dependants, thereby increasing the contribution that a larger labour force makes to economic growth. Because the labour force grows faster than the dependent population, it accelerates income growth. However, beyond the structural shift in expenditure discussed previously (such as investing in existing schools rather than building new ones), the income growth is not automatic. It must be supported by policies that improve health, education, job creation and governance. A second dividend may follow when older workers accumulate assets for retirement. In high-income societies, a third may arise if older adults remain healthy and remain productive. A final dividend can follow, with longevity, during which people remain economically active into old age.
Having a large working-age population is not enough; it must also be productive and engaged. Productivity depends on people being healthy, well-nourished and adequately educated, as well as on the availability of decent employment opportunities.
These ratios can be misleading, however, as retirement age, education duration and women’s labour participation vary widely. Teenagers in rural Sudan, who leave school early to work on farms, contribute differently than urban South Koreans, for example, who remain in education into their mid-twenties. Therefore, the size of the labour force (a definition that includes persons active in the formal and informal sector) does not perfectly align with the working-age population (which is simply an age cohort), as many are still studying, unemployed or in informal work. Yet, the essential relationship holds: the balance between workers and dependants remains a key driver of development. For many Africans, having a “job” still means surviving in the informal sector without security or benefits. Employment, explored in a separate theme on this website, remains the crucial link between demographic potential and realised economic growth.
Even so, smaller families bring important social benefits: fewer schools are needed, teacher-pupil ratios improve and both parents and governments can invest more in each child’s education. Later, once population growth falls below replacement level, economies can stagnate, but not necessarily. Japan and Singapore, where life expectancy exceeds 85 years, demonstrate how sustained investment in technology and capital can sustain growth despite ageing.
Overall, demographic change shapes development outcomes not in isolation, but through its interaction with productivity, human capital and institutions.
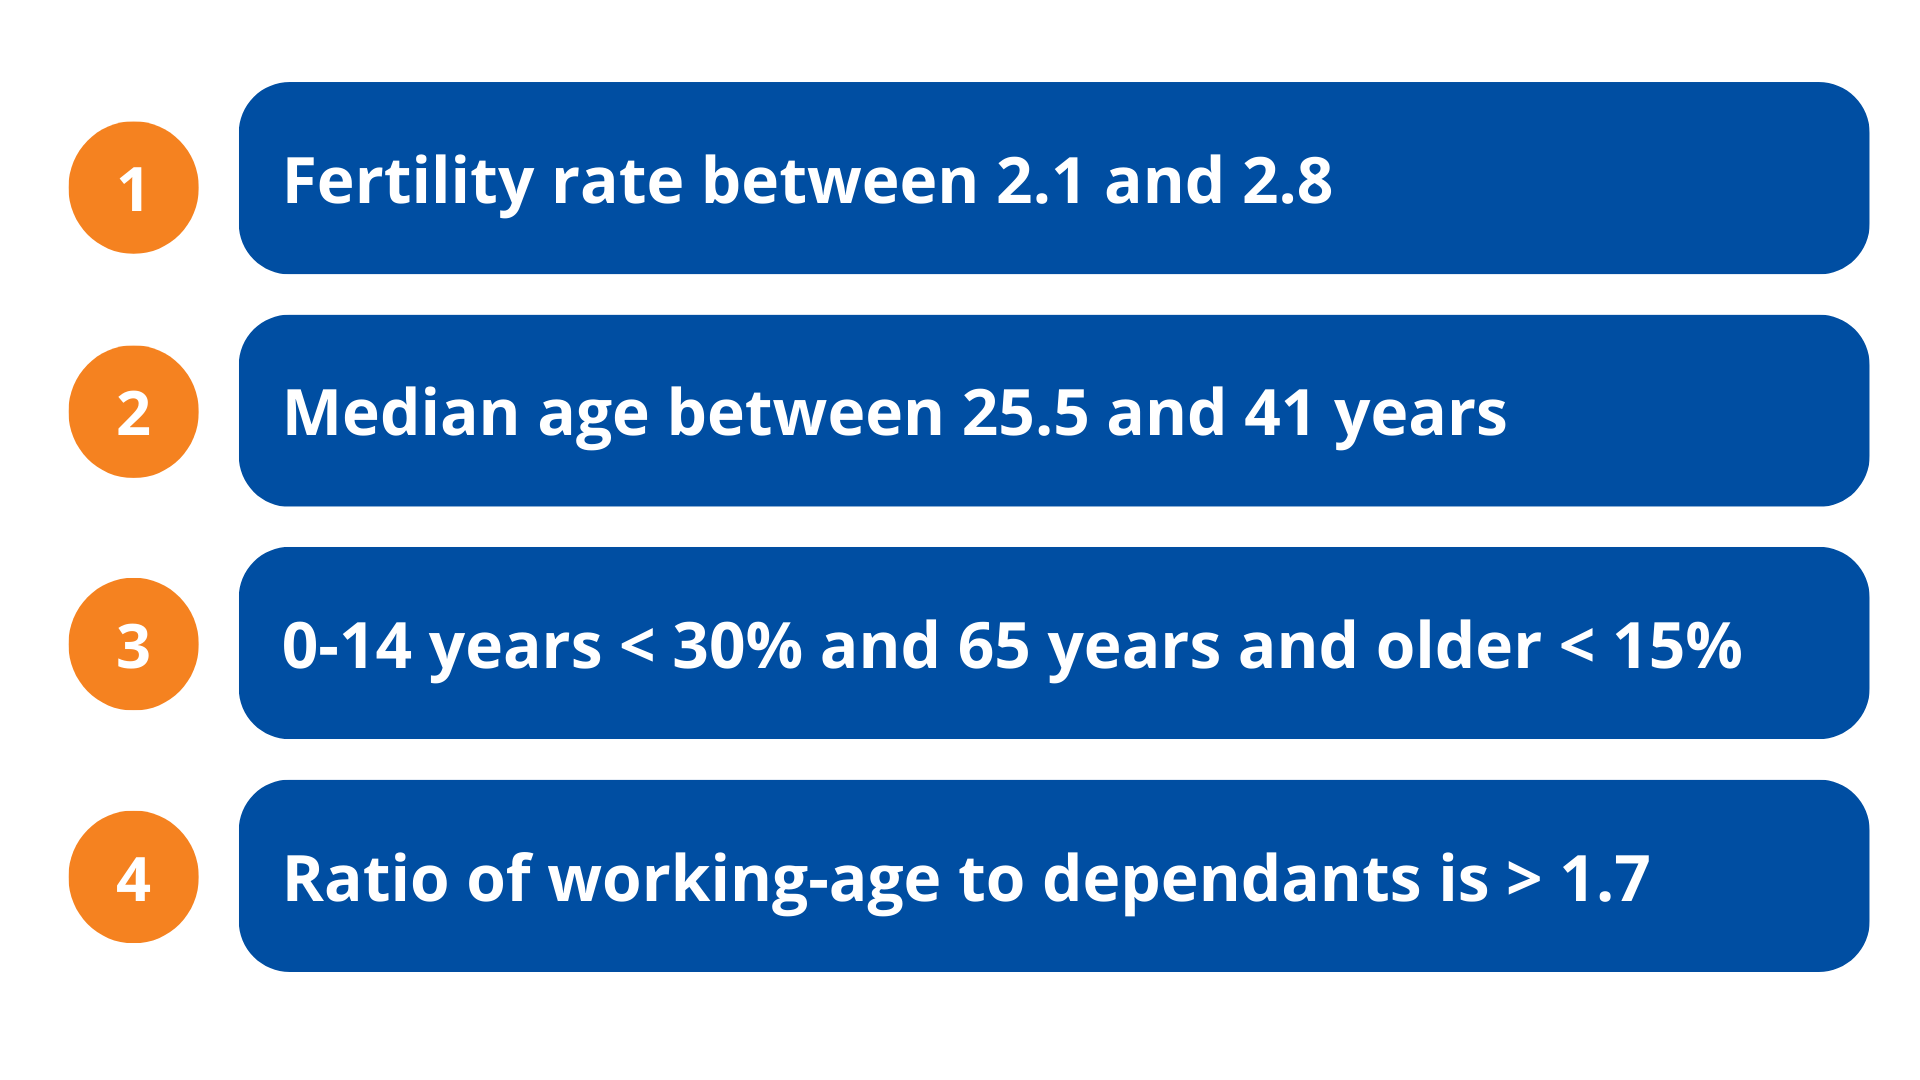
The measure used extensively in this theme is the ratio of working-age people aged 15 to 64 to dependants, children and elderly people. When the ratio of working-age people to dependants reaches 1.7-to-one (1.7:1), countries generally enter the first demographic dividend. The ratio is similar to calculating the working-age population as a percentage of the total population, which, if it exceeds 62%, is equivalent to the 1.7:1 ratio. Demographers also use fertility rates as an indicator of a demographic dividend. Typically, a country enters a first demographic dividend with a total fertility rate of 2.8 children per fertile woman and exits at rates of below 2.1 children.
Chart 9 depicts the various conceptualisations of the first demographic dividend.
A similar measure is the dependency ratio, which represents the proportion of dependants (children below 15 years of age are less than 30%, and those 65 years and older are below 15% of the total population). For all practical purposes, the dependency ratio is the inverse of the demographic dividend. When the dependency ratio falls below 0.6, the demographic window generally opens.
The median age is another useful indicator. It divides a population into two halves, with one half being younger and the other half being older. When a country’s median age lies between 25.5 and 41 years, it generally has a large enough working-age population to sustain income growth and support its dependants.
Each of these measures captures a similar dynamic: the shift in population structure that opens a first demographic window of opportunity, when countries can experience faster growth due to the larger contribution that labour makes to economic growth.
The level at which countries achieve their peak demographic dividend—and how long they stay there—can have a significant impact on prosperity over long time horizons. The longer a country remains within this positive demographic dividend window and the higher the ratio, the better.
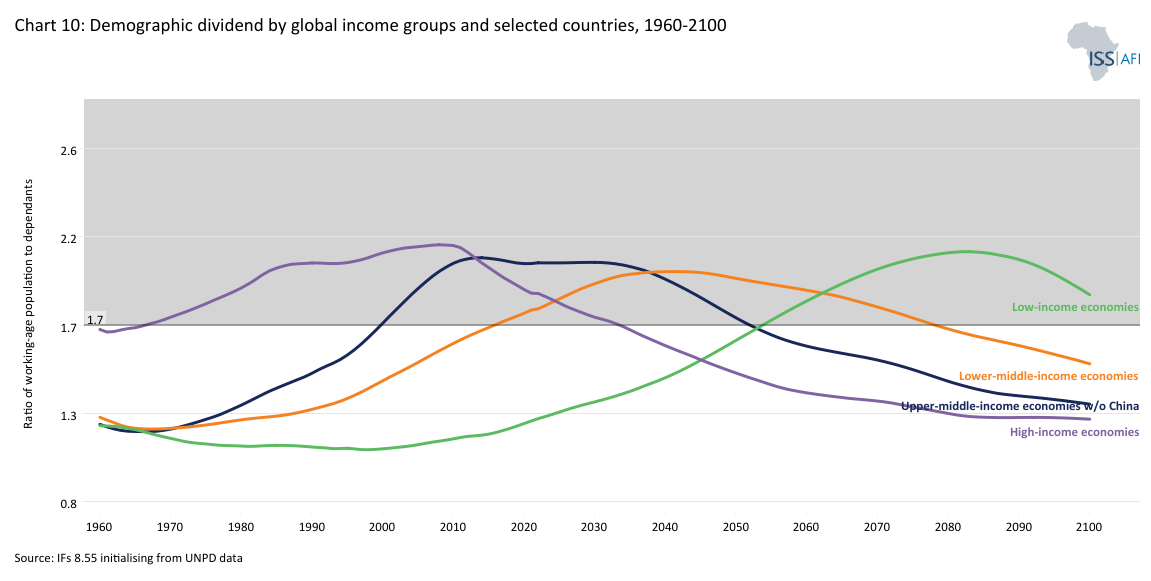
Chart 10 enables users to display the ratio of working-age persons to dependants for selected countries and groups from 1960 to 2100. A few interesting observations:
- On average, high-income countries entered the demographic window of opportunity in 1966, whereas upper-middle-income countries entered in 2000 and lower-middle-income countries in 2016. Low-income countries are expected to enter the window in 2054. China, currently an upper-middle-income country, is excluded from its peer group given the size of its population, which skews the average.
- Separately selecting China and the Asian Tiger economies (Hong Kong, Singapore, South Korea and Taiwan), countries that have grown more rapidly than others in modern history, provides an important explanation for that growth, namely the much higher peak at 2.8:1 and 2.7:1, respectively, which is significantly higher than the average for their peer groups. At these rates, the size of the potential labour force relative to dependants is large, implying a more productive population structure.
- The benefit of a continually growing pool of working-age people is evident in the US, where the ratio did not peak as swiftly and as high as the levels of China and the Asian Tigers but increased gradually and then remained in modest positive territory (i.e. above 1.7:1) for an extended period. This has led to steady economic growth and productivity improvements, which eventually earned it high-income status and sustained wealth growth.
On average, countries remain in this fortunate demographic window of opportunity for 54 to 59 years, during which the level of their peak dividend makes quite a difference, and then exit. At this point, they need to invest in technology to offset the decline in the relative size of their working-age population. For example, India will spend around 58 years in the demographic high-growth phase, having attained a ratio of 1.7:1 working-age persons per dependant in 2008. However, while China experienced a peak demographic dividend ratio of 2.7:1, India is likely to peak lower at around 2.3:1. By this metric, India could experience a modest income growth catch-up with China, but only in the second half of the 21st century, but is unlikely to attain the same rates of economic growth despite the rapid ageing of the Chinese population at that point.
The four countries that, by mid-century, are expected to have the largest total populations globally are China, India, Nigeria and the US. By around 2044, Nigeria’s population is expected to surpass that of the US, making it the country with the third-largest population globally, after India and China. However, Nigeria is only expected to progress to a 1.7:1 ratio by about 2058 in the Current Path. It is expected to peak 30 years later (i.e. around 2092) at a ratio of 2:1 and to exit the favourable demographic window early in the next century. Given this long-term horizon, it is virtually impossible to speculate responsibly about Nigeria’s long-term future growth prospects, as the region is expected to experience significant impacts from climate change amid rapid technological advances. However, what is certain is that current demographic forecasts predict only moderate income growth, and even then, this is expected to occur much later than for most others.
These examples illustrate how timing, peak levels and duration interact differently across countries. For individual countries, the duration of the demographic dividend depends on the speed of fertility decline, the pace of economic transformation and the rate of increase in life expectancy. Countries that sustain moderate fertility (i.e. not below 2.1 children) while expanding employment and human capital can enjoy a longer and more productive window.
In most sub-Saharan African countries, the ratio of working-age persons to dependants declined until the 1980s and sometimes also into the 1990s, meaning that the contribution that labour could make to economic growth was declining. As a result, it was the commodities boom, rather than a more productive population structure, that led to limited economic growth during this period. Ratios have started to improve in the 21st century but, on average, Africa is still largely in the early stages of its demographic dividend (the average ratio in 2025 was a mere 1.4:1), with only 11 countries having entered a potential demographic window of opportunity, namely Mauritius, Seychelles, Cabo Verde, Libya, South Africa, Tunisia, Morocco, Djibouti, Botswana, Algeria and Egypt. Most others remain at an earlier stage, where rapid population growth continues to offset gains in income per capita.
By 2050, 33 African countries are expected to have achieved the 1.7:1 ratio, reflecting the extent to which Africa is progressing through its demographic transition. Reflecting its higher development status, North Africa achieved an average rate of 1.7:1 in 2005; however, it has not been able to fully benefit from its large working-age population due to economic policies and approaches, which contributed, among other factors, to the Arab Spring a few years later.
On average, on the Current Path, the other four African regions will enter a potential demographic window of opportunity as follows:
- Southern Africa in 2046,
- East Africa in 2048,
- West Africa in 2055, and
- Central Africa in 2062.
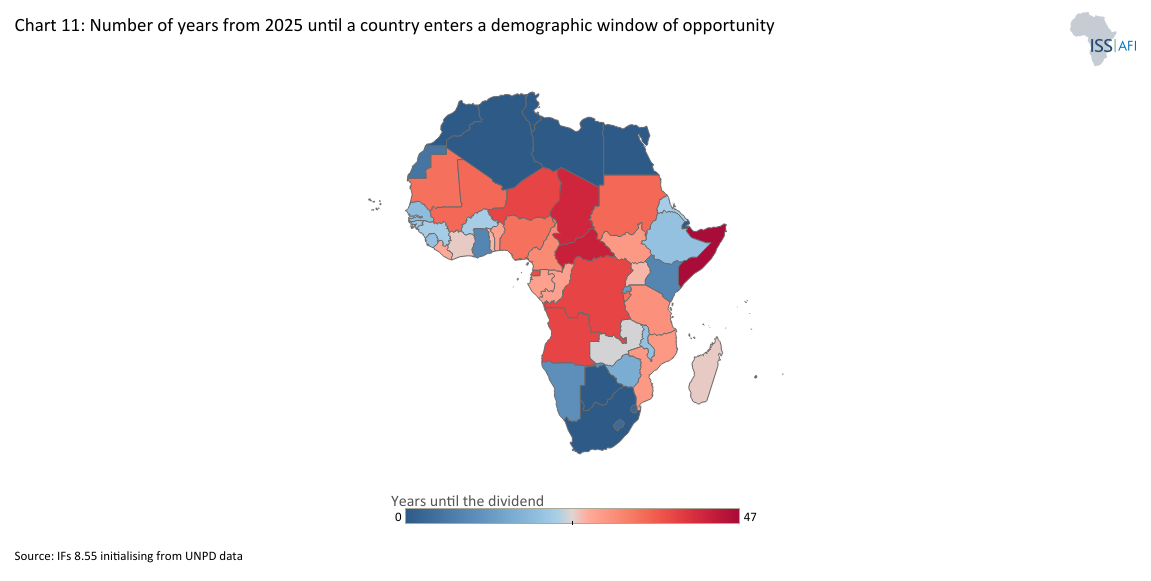
Africa’s slow demographic transition is diverse, with some countries beginning to benefit earlier than others. Chart 11 provides a snapshot of the year in which African countries have entered, or will enter, their demographic window of opportunity on the Current Path, counting from 2025.
A different way to express the 1.7:1 metric is that 67% of the population of sub-Saharan Africa will be of working age by 2075, whereas the average for the rest of the world is expected to be 59%. The eight percentage-point difference suggests that sub-Saharan Africa will grow faster than global averages. However, because the region is expected to achieve a relatively low worker-to-dependant ratio, its Current Path rate of growth is likely to be modest. None of this is good news for a continent that aspires to catch up with global income averages. Because Africa’s population growth is rapid, the continent’s demographic dividend will emerge more slowly and extend well into the second half of the 21st century. This extended window offers an opportunity to build resilience and prosperity—if it is supported by strong health, education and employment systems that allow the growing workforce to reach its full potential.
For Africa, the challenge is twofold: to advance the demographic transition by reducing fertility and improving health and education, and to capitalise on the transition by ensuring that the expanding working-age population has the skills and opportunities to thrive. How effectively countries manage this dual task will determine whether population growth becomes a burden or a dividend.
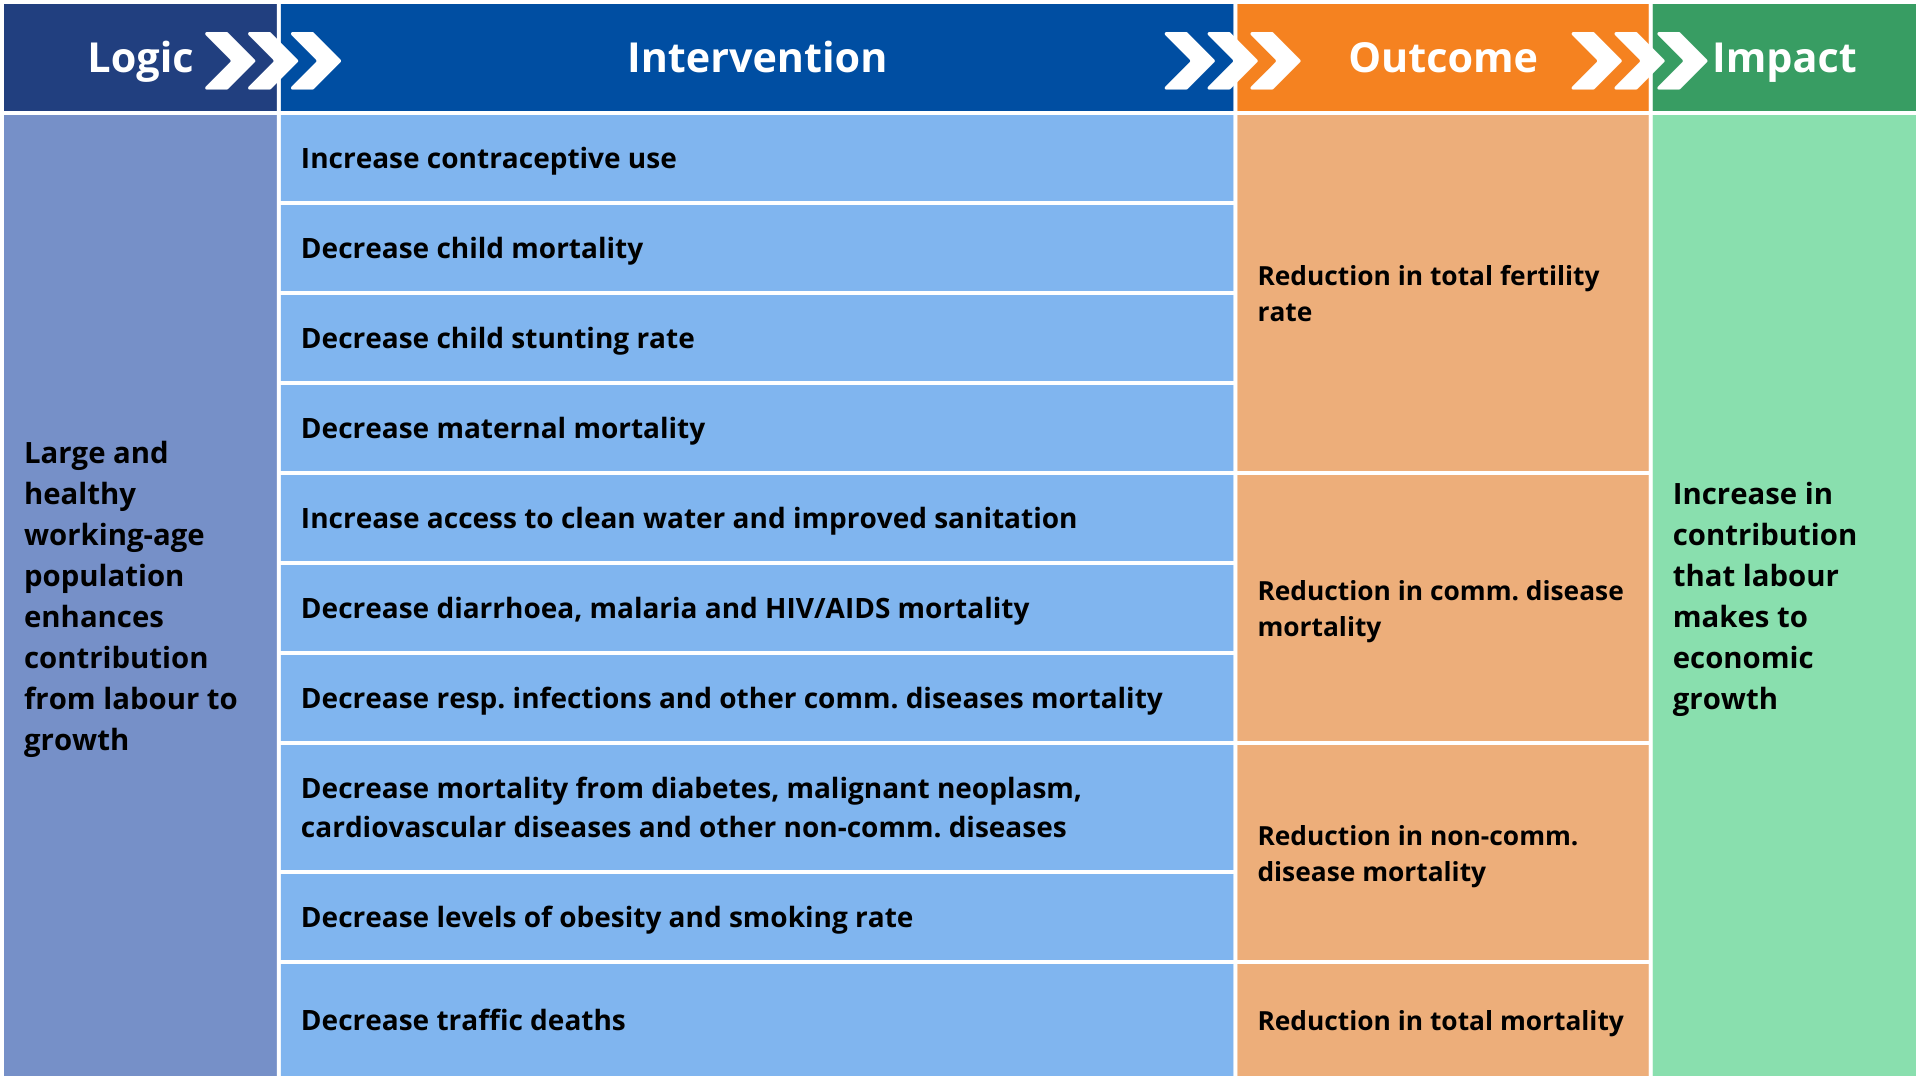
The Demographics and Health Scenario models the combined impact of accelerated fertility decline and improvements in health and WaSH infrastructure across Africa. Chart 12 depicts the structure and logic of the scenario. It explores how a faster demographic transition can enhance human development and economic growth relative to the Current Path. The empowerment of women and the impact of better education, both important contributors to reduced fertility rates, are not included in this scenario but modelled and discussed separately in the scenarios/themes on Gender and Education.
The scenario consists of the following individual country-level interventions, benchmarked to reflect reasonable but ambitious targets for countries at similar levels of development and continentally compared to South America and South Asia, the other regions with development indicators most similar to Africa:
- The first intervention is the large-scale rollout of modern contraceptives. Since total fertility rates in North Africa are already low, the increases in sub-Saharan Africa are more aggressive. In 2025, only 33% of fertile women in sub-Saharan Africa were using modern contraceptives, ranging from 85% in Seychelles to 1% in South Sudan. The average rate in North Africa was 59%. By 2050, the scenario is expected to increase average usage to 75% in sub-Saharan Africa, 24 percentage points above the Current Path, and 85% in North Africa. Rates in South America were 79% in 2025 and 64% in South Asia, increasing to 93% and 83%, respectively, by 2050.
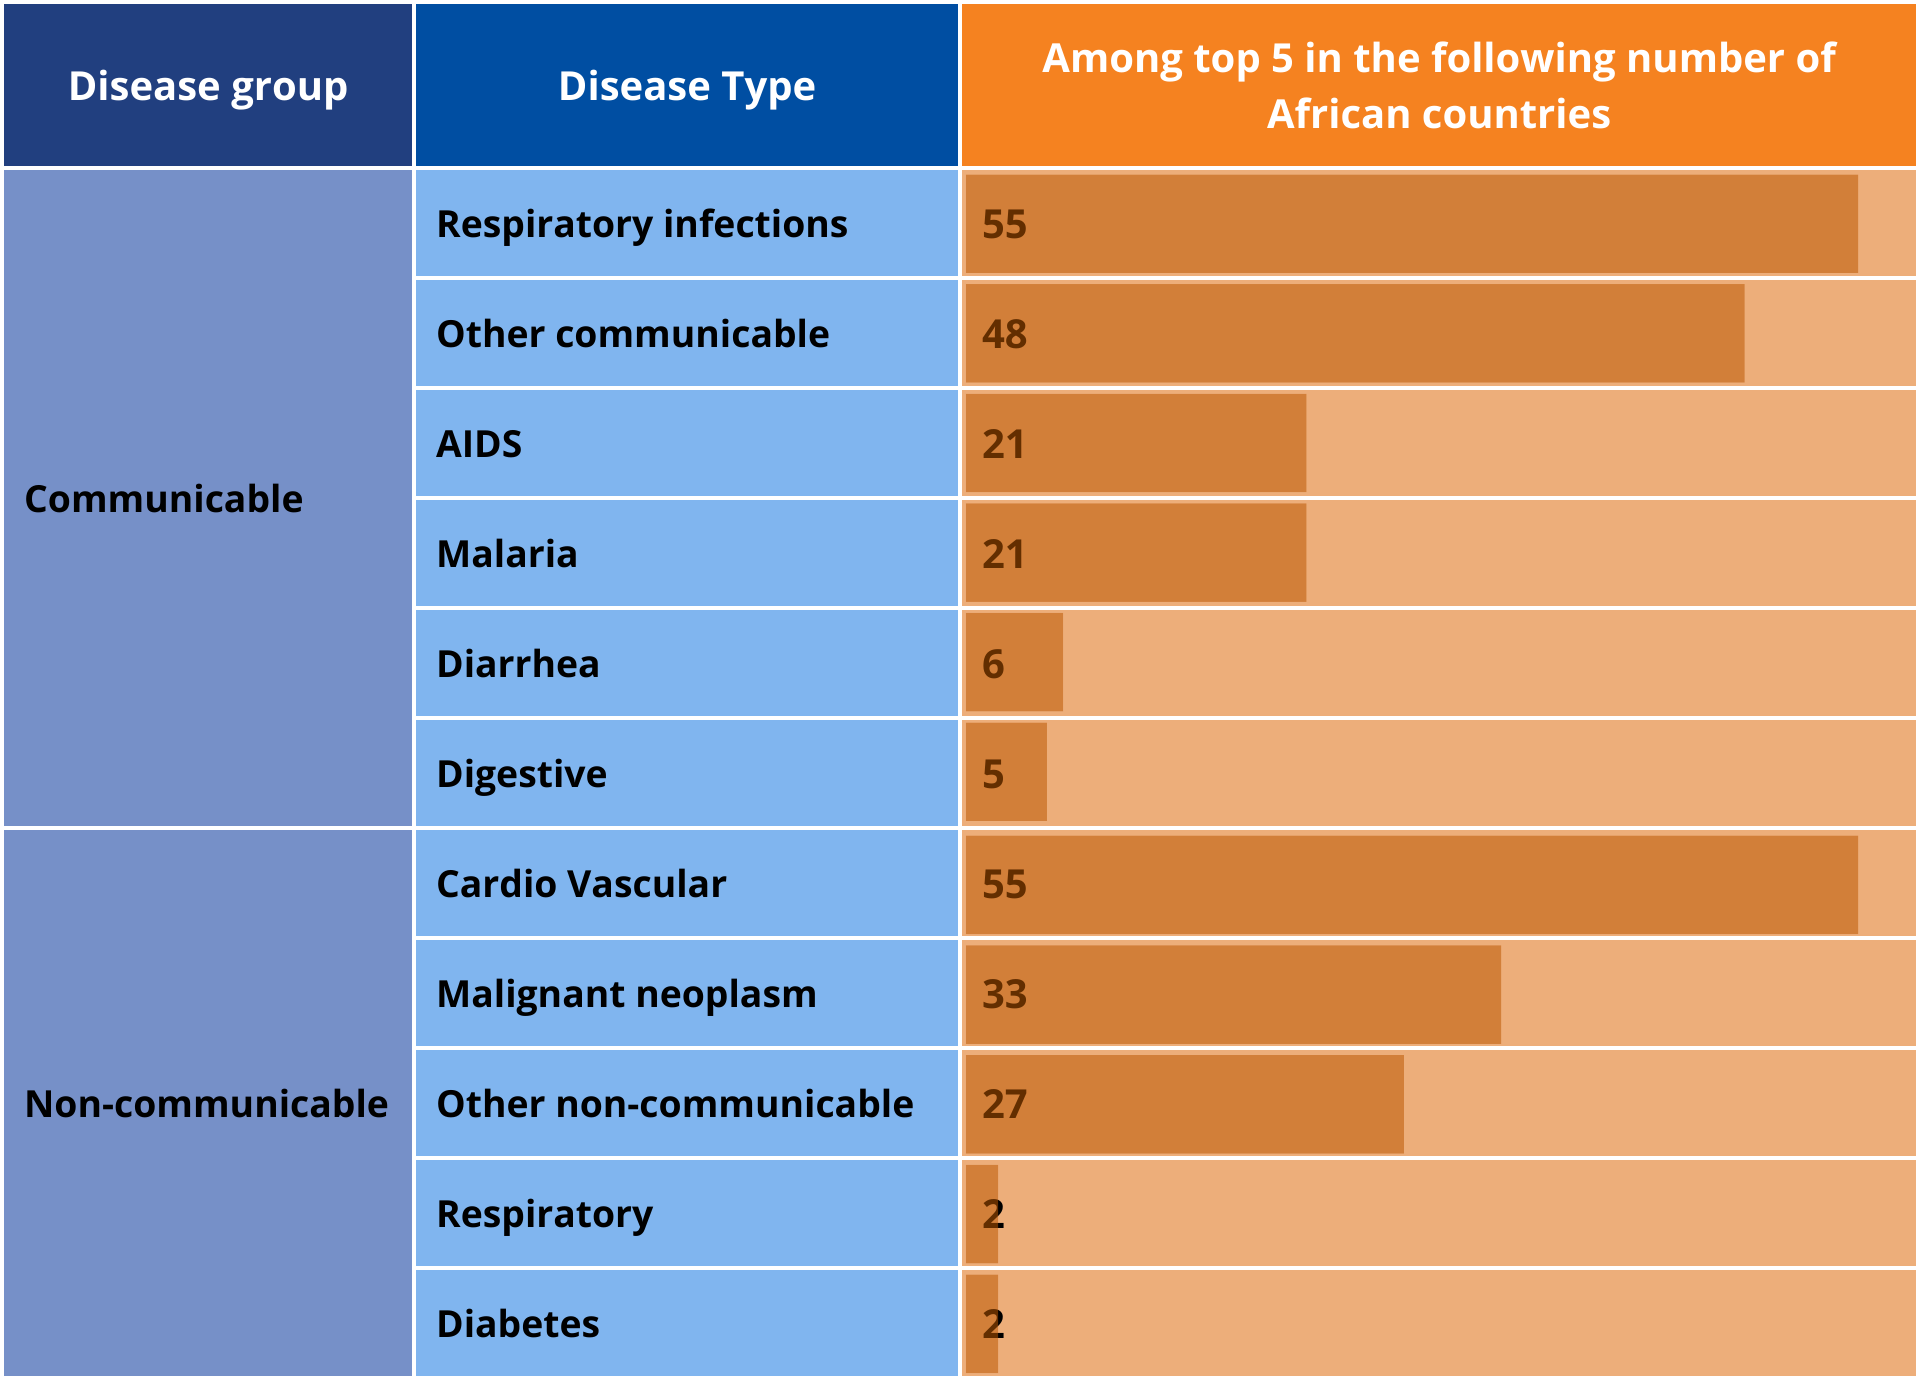
- The next intervention is a reduction in the incidence of mortality from AIDS, diabetes, malignant neoplasm, diarrhoea, respiratory infections, respiratory diseases, cardiovascular diseases, digestive diseases, malaria, other communicable diseases and other non-communicable diseases in the most highly affected countries. The interventions reduce mortality rates for the top five disease types in each African country by 20 percentage points below the Current Path. Deaths from respiratory infections (which include COVID-19) and cardiovascular disease are among the top five causes of death in all African countries, followed by other communicable diseases, malignant neoplasms and other non-communicable diseases. Chart 13 summarises the number of African countries in which the disease type ranked among the top 5 in 2022 (the last year of data coverage), which was used as a benchmark for the intervention. The high prevalence of non-communicable diseases, cardiovascular in particular, reflects the extent to which Africa is experiencing a double burden of disease, as explained in the theme on Health.
- A separate intervention is done in the nine countries where the HIV infection rate is above 1% of the population, also reducing the rate by 20% below the Current Path.
- The next intervention involves the more rapid provision of safely managed water and sanitation, which addresses the drivers of Africa’s high communicable disease burden, as well as indirectly improving productivity through the benefits of a generally healthier workforce. In the scenario, average urban access rates in sub-Saharan Africa increase from 45% in 2025 to 74% in 2050, almost nine percentage points above the Current Path. Rural rates increase from 17% in 2050 to 45%, compared with 35% on the Current Path. Taken together, the average access rate for sub-Saharan Africa increases from 29% in 2025 to 61%, rather than 51%. Total access rates in North Africa (i.e. including both rural and urban areas) are already at 78% in 2025, and are projected to increase to 92% by 2050.
- The final health-related intervention reduces under-five stunting rates by 20% below the 2050 Current Path in the 39 African countries where the rate was above 20% in 2021, the latest year of data available. The intervention accelerates the decline in the Current Path. Whereas Africa had 30 million stunted children in 2025, that number declines to only 12.8 million in 2050, some 3.2 million below the Current Path forecast for the year. Burundi, Eritrea, Niger and the DR Congo had the largest rate of stunted children in 2025. By 2050, Burundi will still have the highest rate, now followed by Lesotho, Malawi and the CAR, but all with significantly lower rates than in the Current Path.
- Improvements in health care are not free. To this end, a final intervention increases health spending by 5%, resulting in an additional US$18.9 billion continentwide. Additional infrastructure spending peaks at US$4.7 billion per annum in 2037.
Each intervention ramps up over 10 years, starting in 2027, and is then maintained at that level.
The pace and scale of impact of the scenario vary across countries and subregions. North Africa, already at an advanced stage of its demographic transition, experiences modest additional gains as fertility stabilises near or below replacement level. Central and West Africa achieve the largest improvement in the ratio of working-age persons to dependants.
While the scenario is ambitious, it is grounded in real-world interventions that have proven feasible in several countries, particularly in key areas such as family planning and infrastructure expansion. The scenario assumptions, therefore, are not abstract targets, but are built on empirical benchmarks drawn from best-performing countries at similar income levels. For instance, the projected increase in contraceptive use is based on the progress seen in countries like Ethiopia and Malawi. Access to safely managed water and sanitation reflects progress in Ghana and Kenya. These comparisons suggest that while ambitious, the modelled trajectory is grounded in what has been done before—under challenging but comparable conditions.
The subsequent progress mirrors historical improvements in South America and South Asia. While strides have been made, particularly in AIDS-related mortality, Africa will likely fall short of global health benchmarks, highlighting the need for sustained investment and policy focus.
Impact of the Demographics and Health Scenario
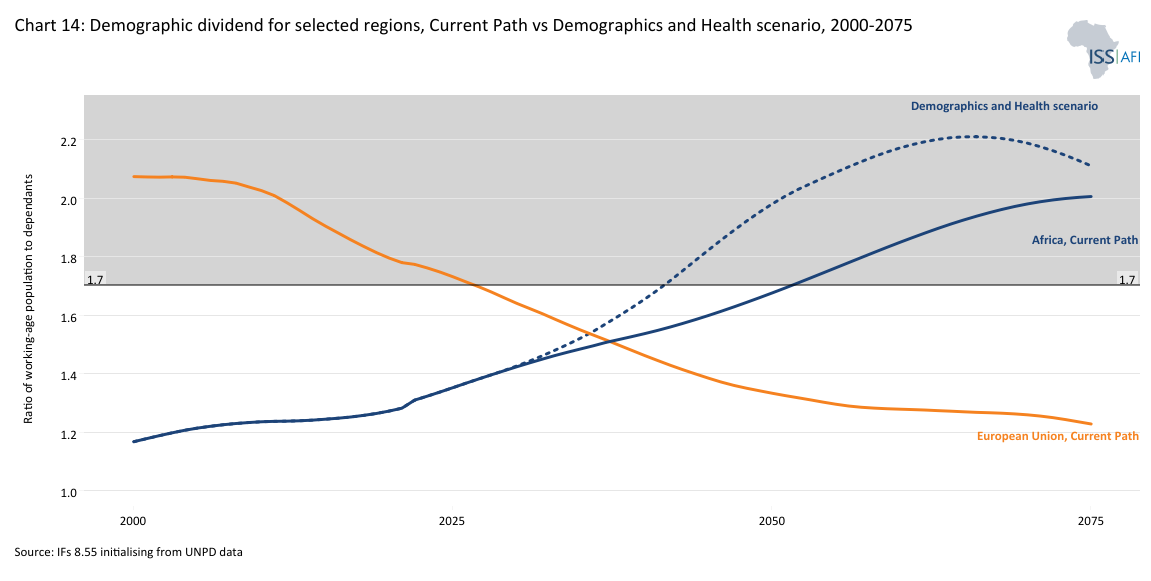
Download to pdfChart 14 presents the demographic dividend for selected regions from 2000 to 2075. The default compares the ratio of working-age persons to dependants in the Current Path and in the Demographics and Health scenario for Africa with the Current Path forecast for the EU27. The divergence in trends between these two regions is one of the most impactful long-term factors shaping future relations between them.
The Demographics and Health scenario will accelerate Africa’s fertility decline, slowing population growth and in turn, population size. In 2025, the average TFR in Africa was 4 children. Instead of the Current Path forecast of a TFR of 2.8 births per woman in Africa in 2050, the number will be 2.1 (2.3 in sub-Saharan Africa and 1.7 in North Africa). By comparison, the fertility rate in the neighbouring EU is stagnant at 1.4 children per fertile woman, translating into a steady population decline and likely, a stagnant or smaller economy.
The scenario has two positive effects:
- The first is that almost 84 million fewer African children will be born from 2025 to 2050 (cumulatively), which means that more money will be available to invest in the education and health of a smaller cohort of pupils and students, thereby enhancing productivity.
- Second, because it will change the ratio of working-age persons to dependants, the scenario will improve the productivity structure of Africa’s population by increasing the percentage of workers in the total population.
For these two reasons, the continent will start to benefit from a more productive demographic structure even before achieving the 1.7:1 ratio. However, it will take several years before the drag on economic growth from labour declines.
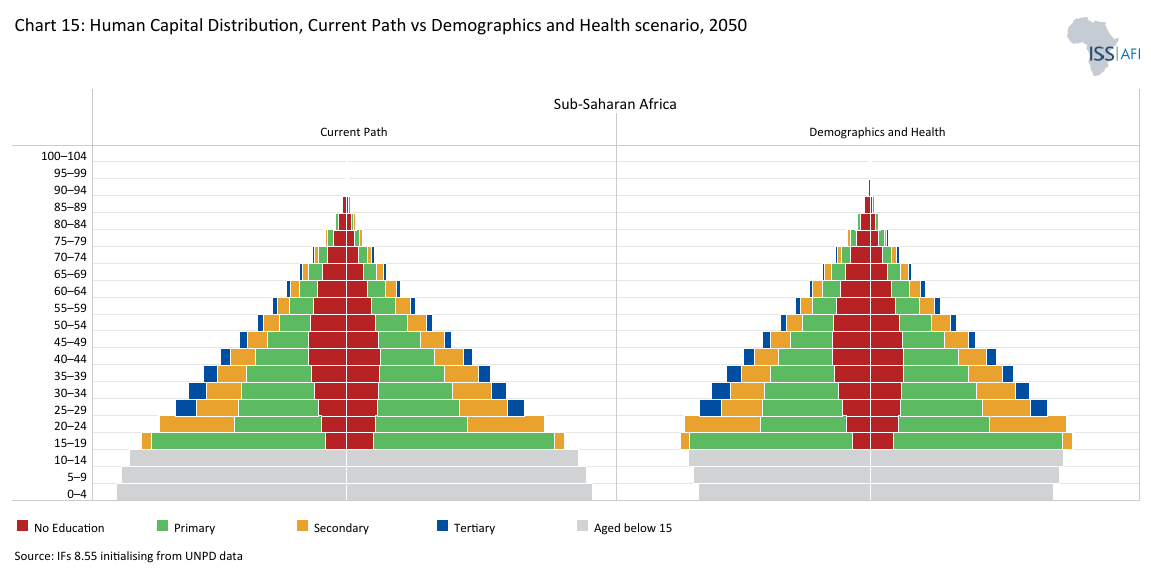
In the Demographics and Health scenario, Africa will have a more mature population structure, with the start of a distinctive bulge appearing in the age cohorts below 20 years, compared with the more youthful structure seen in the Current Path, complemented by higher percentages of persons with primary, secondary and even tertiary education.
Chart 15 compares the human capital distribution in Africa in 2050 between the Current Path and the Demographics and Health scenario. Rapid progress is expected in Africa by 2050, both in educational attainment and in progress towards a demographic dividend, characterised by a sharp decline in the number of children and an improvement in the contribution that labour makes to growth. Note that the display is for absolute numbers and notthe percentage of persons per cohort.
By 2050, more Africans (as a percentage of the total) will be able to enrol and complete their education, since more funds will be available to spend on the smaller number of students. Mean years of education will increase, particularly for the younger cohorts, and education quality will also improve, given the larger pots of money available for fewer students.
All these effects are a function of reduced fertility and improved health, and separate themes model the impact of better Education and technology. Over time, the result is a more productive labour force, more rapid economic growth and higher living standards.
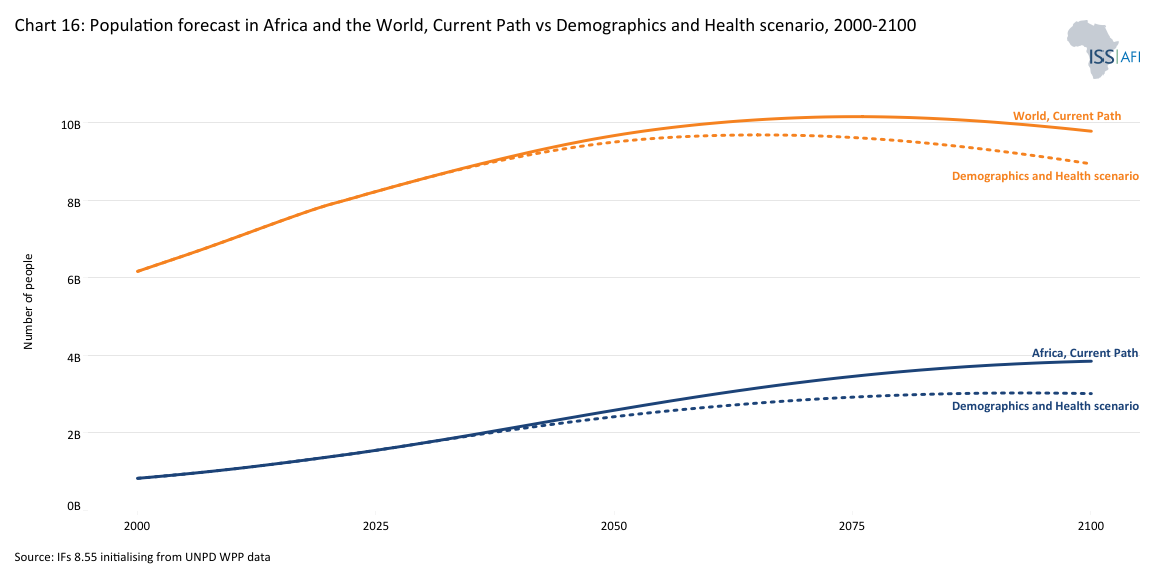
The introduction has already noted that, according to the Current Path, Africa’s population is projected to reach 2.586 billion in 2050 and 3.850 billion in 2100, accounting for 27% and 39% of the global population, respectively. It will then still be several years away from its peak. By contrast, in the Demographics and Health scenario, Africa would have 167 million fewer people in 2050 compared to the Current Path, and 836 million fewer in 2100, having stabilised and started to decline, which is a significant difference.
Chart 16 shows the population forecast for Africa and the World in the Current Path and the Demographics and Health scenario from 2000 to 2100. According to the Current Path, the global population is expected to peak at around 10.156 billion around 2076. In the Demographics and Health scenario, the peak is expected to occur a decade earlier, at approximately 9.685 billion people, with positive implications for global sustainability.
By 2050, average life expectancy in Africa in the Demographics and Health scenario is projected to be 75.3 years (compared to 73.4 years in the Current Path), having closed much of the gap with life expectancy in the rest of the world (i.e. the world except Africa), which is forecast at 79.5 years.
In the Demographics and Health scenario, Africa enters its potential demographic dividend in 2042, a decade earlier than on the Current Path, and peaks at a higher ratio of 2.2:1 instead of 2:1, with all the attendant welfare and economic benefits, although these benefits are realised considerably later. By contrast, the rate in the rest of the world declines to below 1.7:1 by 2053, implying that labour will be a drag on economic growth rates thereafter, but with the potential for Africa to serve as a source of labour.
To the north of Africa, the EU27 is already experiencing demographic decline. It is expected to exit a potential window in 2027, implying slow economic growth that will require additional capital investment and labour-saving technology to maintain GDP per capita growth. By 2050, the size of Africa’s labour force (i.e. the economically active population in the formal and informal sectors) will have increased from 616 million in 2025 to 1 180 million people by 2050 in the scenario (marginally below 1 188 million on the Current Path). The EU’s labour force will have declined from 223 million to 200 million by 2050. While Africa’s labour force is expected to increase by 564 million, the EU's is projected to decline by 23 million.
However, due to the low rates of increase in formal-sector employment (57% of Africa’s 2025 labour force depended on the informal sector, declining to 49% by 2050), many Africans will likely remain in the informal sector. Some of these dynamics are explored in the Work/Jobs theme.
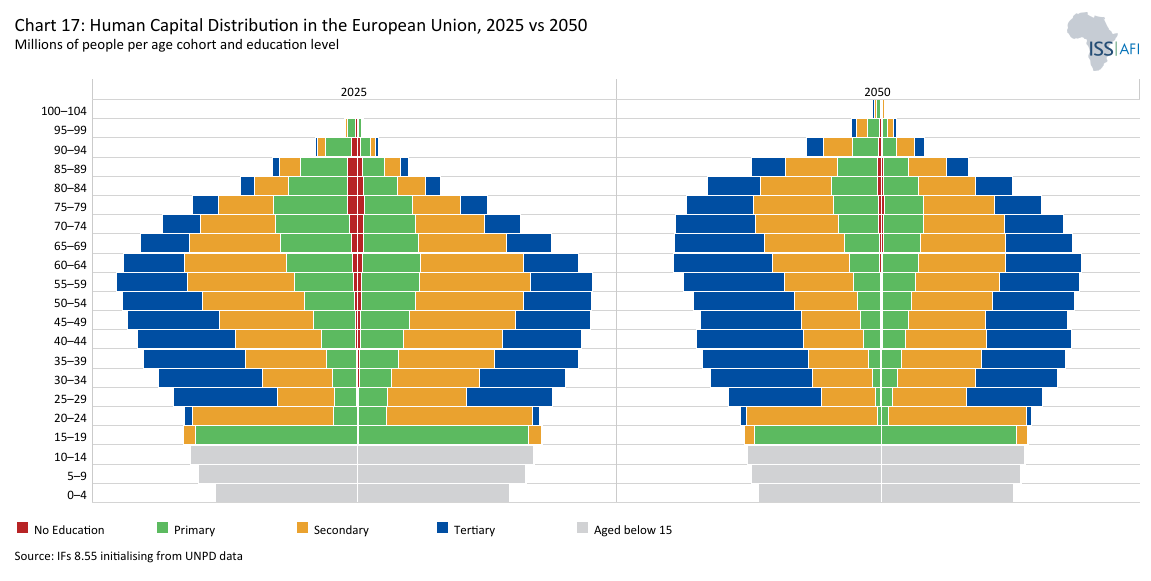
Leaving aside issues of populism and xenophobia for the moment, Africa has the potential to compensate the EU and other regions for the decline in the size of its neighbours' labour forces. Although the African labour force generally has less education than their compatriots in the EU and a higher disease burden, this can be ameliorated with early action. To this end, Chart 17 provides a snapshot of the human capital distribution in the EU for 2025 and 2050 in millions of people.
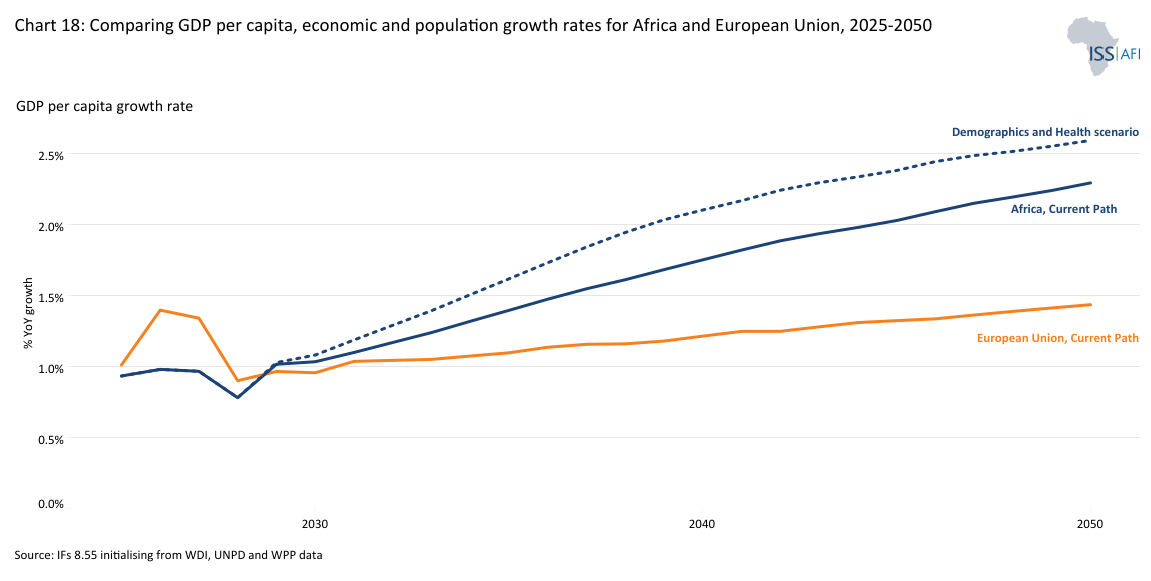
Chart 18 presents a forecast of population growth rates, economic growth rates and rates of growth in GDP per capita (in PPP) from 2025 to 2050 for Africa and the EU on the Current Path and in the Demographics and Health scenario. According to the Current Path, Africa’s GDP per capita growth will average 1.6% per annum to 2050; however, it could reach 1.8% in the Demographic and Health scenario. The difference of two percentage points may not sound impressive, but bear in mind that the African economy will be US$131.1 billion larger in 2050 when comparing the Current Path and the Demographic and Health scenario, despite its population being 167.3 million smaller. As a result average GDP per capita in 2050 will be US$493 higher. That is a large increase considering that the African population will still number more than 2.4 billion people in the scenario.
Of course, Africa needs much higher growth rates to start closing the gap with the rest of the world. To this end, various themes on the website model the potential improvements through better education, a manufacturing transition, and more.
With a rapidly expanding workforce and a growing consumer market, the African continent has the potential to become a significant economic hub—but success will depend on strategic investments in infrastructure, education, governance and innovation to drive sustainable and inclusive growth.
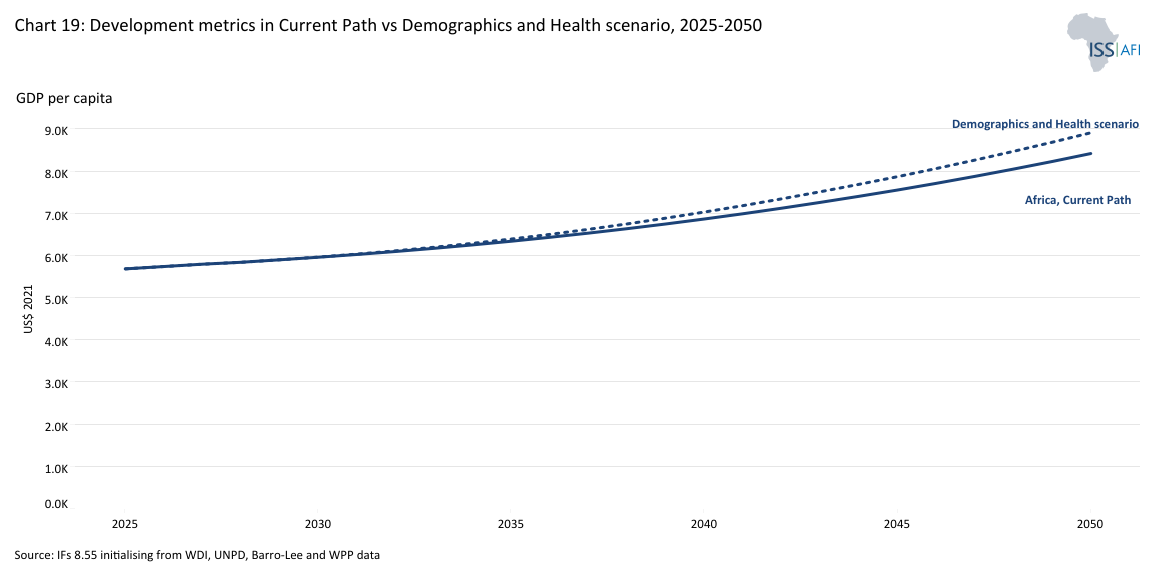
The impact of the Demographics and Health scenario is a smaller, healthier, wealthier and better-educated population. In 2050, Africa's average GDP per capita would be US$387 higher than in the Current Path. Also, the average African in the 15-24-year age group would have almost a year more education compared to the Current Path. Africa would gain 119 million years of life due to lower levels of premature death or disability, and average life expectancy would increase by two years. Furthermore, 48 million fewer Africans would be considered extremely poor in 2050, with the most significant reductions in DR Congo, Nigeria and Madagascar—a remarkable testament to the contribution that family planning and better healthcare can make to Africa’s reduction of poverty. Although Africans would spend more on health and WaSH infrastructure in this scenario, the costs are eventually offset by faster growth.
Chart 19 allows the user to compare the impact of the scenario with the Current Path for each African country and region in five dimensions, namely the increase in GDP per capita (in PPP), increase in economic size (in MER), rate of extreme poverty, mean years of education for the 15-24 age group and population size from 2025 to 2050.
By accelerating fertility decline and improving health, African countries can realise measurable gains in growth and well-being, but only if complementary investments sustain this progress.
Africa’s growing demographic weight will reshape global trade, migration and investment patterns. Labour shortages in ageing economies—especially in Europe and parts of Asia—are likely to increase demand for young workers from Africa, potentially boosting remittances and cross-regional economic ties. By the late 21st century, the world’s demographic centre of gravity will have shifted decisively southward. Africa’s relative youth and expanding workforce contrast with the ageing populations of high-income regions, where dependency ratios are rising steeply. This divergence will shape global demand, innovation and investment flows.
At the same time, a larger youth population at home will require massive job creation and skills development. Without sufficient opportunities, demographic pressure could fuel instability or irregular migration. Managing this balance—between domestic absorption and international mobility—will be central both to Africa’s demographic strategy ato global stabilike.
In the Current Path, the average median age in Africa in 2050 will be about 25.5 years and 28 years in the Demographic and Health scenario, compared to 46 in Europe and 42 in East Asia. These age gaps will influence global consumption patterns and market opportunities, with Africa representing an increasingly dynamic base of consumers and producers. If Africa’s demographic potential is harnessed, the continent could provide the human capital and demand needed to sustain global economic dynamism in an ageing world. If it is not, the consequences will be felt far beyond its borders.
The world’s demographic future is interconnected. Africa’s capacity to translate its growing population into prosperity will affect global growth, sustainability and security. Partnerships that expand education, green infrastructure, digital access and health systems are therefore not acts of aid but investments in a shared global future.
As societies transition from large youthful populations to large elderly populations, mostly good things happen. Amongst others, young societies are more prone to ideological extremism and political violence. Older populations are less so. Often, major changes in older societies are typically peaceful rather than violent; however, the heavy burden of providing expensive social services such as medical care to an elderly population eventually strains public finances, as seen in countries like Japan, South Korea and much of Europe.
Even a society’s political regime is generally tied to its age structure: very young societies typically have authoritarian government, and if they try to democratise, it is almost always unstable, while societies with older populations are, with few exceptions, stable democracies, although that too comes with risks evident with the rise of populism in Europe and North America.
To be more precise, three age groups can be considered: young, intermediate and mature, which provides a slightly more granular approach than the dependency ratio used previously.
Young in this context refers to a median age of 25.5 years or below (roughly equivalent to a ratio of 1.7 working age to every dependant and lower), meaning that a young country would have a population where half of its people are younger than 25.5 years of age and half are older than that. Forty-six African countries, ranging from Egypt (with a median age of 25.4 years) to the CAR (with a median age of 15.7 years), fell into this category in 2025, with some on the cusp of moving to the next group. These societies generally have authoritarian governments, and if they have some democratic institutions, they are often unstable. This group will almost certainly experience an ongoing and elevated risk of internal conflict, as well as a high risk of intermittent or persistent revolutionary conflict. This is not unique to Africa, but generally holds throughout the world, though there are always exceptions to these general findings. On the Current Path, 35 African countries would have a median age of 25.5 years or less in 2050.
Societies with a median age of 25.5 to 35.5 years, i.e., the intermediate group between those with a youthful or mature population, tend to be in a process of transition, also in respect of governance, with most having mixed regime types. They exhibit some democratic characteristics, such as regular elections; however, these may not be entirely free and fair, and incumbent elites often manipulate their constitutions to extend their stay in power, generally referred to as anocracies or mixed regimes (mixed in the sense of having both autocratic and democratic characteristics).
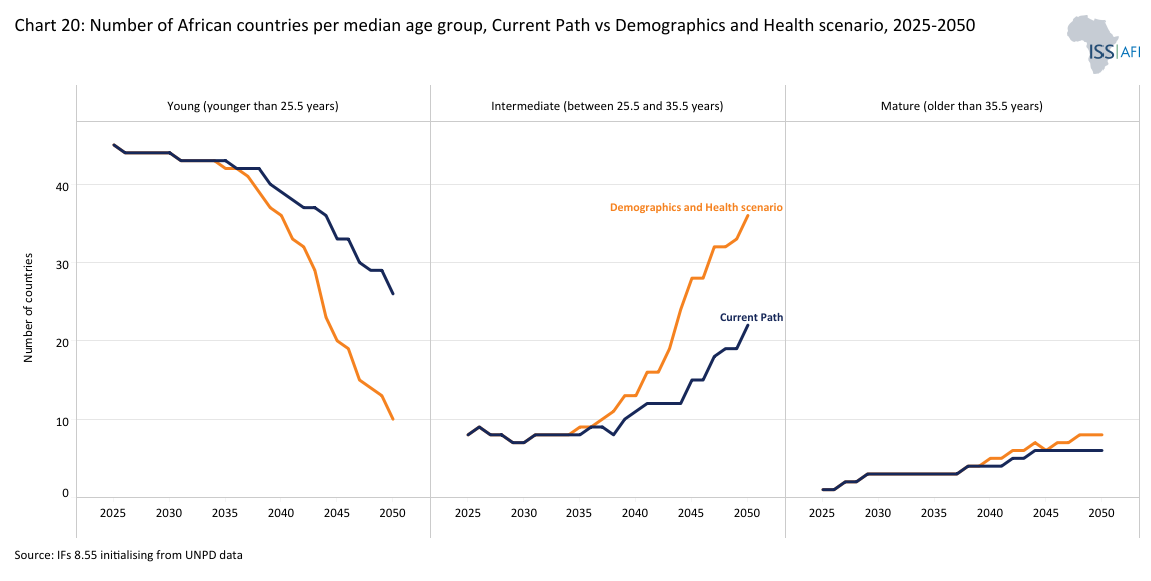
Societies with a median age of 35.5 years and older (equivalent to a ratio of 2 working-age persons to every dependant) are generally stable democracies. This is the ‘mature’ category. Mauritius is the only African country currently in that age group. On the Current Path, six African countries are projected to have a median age above 35.5 years in 2050, while an additional 23 countries are expected to be in the intermediate age bracket of 25.5 to 35.5 years.
Chart 20 presents the number of African countries in the young, intermediate and mature catetories in the Current Path and the Demographics and Health scenario from 2025 to 2050.
In the Demographics and Health scenario, eight countries would be in the mature group, an additional 37 would be in the intermediate group and the remaining 10 would be in the young group.
A different way to consider the relationship between population structure and a country's median age is to examine the concept of a youth bulge, typically measured as the size of the cohort of young adults aged 15 to 24 relative to the total adult population aged 15 years and older. Generally better-educated, risk-taking young adult males are amenable to political mobilisation in an environment where alternative options for economic and social mobility are limited, as was the case in North Africa during the Arab Spring at the end of 2010. If this cohort accounts for 40% or more of the total adult population, it would indicate a greater risk of large-scale violence. In criminology, this is known as the “age-crime curve”: individual-level analyses often show that crime (especially violent and property crime) peaks in late adolescence/young adulthood (roughly ages 15 to 29) and declines as people age, underpinning concerns that youth bulges may increase social instability. The potential for violence declines significantly once that portion declines to 34% or less (equivalent to a median age of 30 years). The relationship therefore is an inverted U-shape starting at low levels in late childhood, rises sharply during adolescence, peaks in the late teens to early twenties, and then declines through adulthood into later life. Peak offending rates typically occur between ages 15 and 19.
In 2025, seven African countries had a youth bulge of less than 34%; by 2050, this would increase to 11 on the Current Path and to 13 in the Demographics and Health scenario.
Until fertility rates are significantly reduced, even the most impressive economic growth rates will not be sufficient to substantially reduce poverty and improve livelihoods in Africa. Although trends are heading in the right direction, much more urgent action is needed to accelerate the demographic transition in the continent's many low- and lower-middle-income countries. To this end, the Demographics and Health scenario models the potential impact and contribution that could be made in this regard.
Africa’s demographic transition is well underway, but the pace and inclusiveness of change vary widely. The continent’s ability to turn its growing working-age population into a foundation for prosperity depends on how effectively governments align health, education, economic and governance reforms. Each is discussed in a separate theme elsewhere on this website. Advancing the demographic transition does not guarantee a demographic dividend. Without appropriate policies that increase productivity growth and institutional capacity, faster demographic change can coexist with persistent unemployment and social pressure.
Africa’s demographic transition will unfold over decades, outlasting the duration of political cycles. Many of the investments needed to advance and capitalise on demographic change, such as education, yield results only over the long term, while political incentives tend to prioritise shorter horizons. This mismatch complicates the sequencing of reform and the continuity of public investment. Leaders will need to work hard to maintain focus on the importance of a more rapid demographic transition.
By improving reproductive health, extending life expectancy and investing in human capital, countries can unlock faster and more inclusive growth. The Demographics and Health scenario reveals that demographic change is not inevitable and can be influenced by the implementation of appropriate policy interventions. Countries that combine fertility decline with progress in education, health and job creation will achieve higher productivity, greater social resilience and an improved quality of life for their citizens. Those who fail to accelerate the transition risk prolonged dependency and missed opportunities for economic transformation.
Policy coherence is vital. Investments in health and education must align with economic strategies that create jobs and expand opportunities for women and youth. Countries that coordinate these efforts—not integrating population policy with economic planning—are more likely to transform their demographic potential into sustainable development gains.
Africa’s demographic transition is reshaping the continent’s development prospects and the world’s population balance. Over the next three decades, Africa will determine whether its growing youth population becomes a foundation for prosperity or a source of pressure. The direction depends on how quickly countries can lower fertility rates, expand education, improve health, and create jobs that keep pace with population growth.
In the meantime, many African cities are expanding faster than their infrastructure, housing and labour markets can absorb. The result is often informal employment, congestion, and inadequate public services—conditions that can limit the economic potential of a young and growing population. To harness the full potential of urbanisation, governments need to integrate population and spatial planning. Investments in infrastructure, public transportation, affordable housing and essential services are crucial for making cities inclusive and productive. Strengthening local governance and data systems can also improve how cities anticipate and manage demographic change.
The stakes extend beyond the continent. In an ageing world, Africa’s success will underpin global economic dynamism, innovation and sustainability. The coming decades will test whether governments and partners can convert population growth into human progress—through education, health, governance and opportunity.
Finally, Africa’s demographic transition is progressing unevenly. While some countries are approaching the demographic window of opportunity, others are decades away from it. These differences reflect variations in fertility, education, health, governance and economic structure, and they shape each country’s ability to benefit from its demographic change.
Early-transition countries: still high fertility and dependency
In Niger, Chad, Somalia and the Democratic Republic of the Congo, fertility rates remain above six children per woman, and child mortality is still high. The combination of large youth populations and limited access to reproductive health services, education and employment opportunities keeps dependency ratios elevated. Rapid population growth in these countries continues to offset gains in income per capita, and most remain far from entering the first demographic dividend.
In such contexts, policy priorities must focus on reducing child mortality, expanding girls’ education and improving access to voluntary family planning. These interventions are crucial for accelerating fertility decline and initiating the demographic transition.
Mid-transition countries: approaching the demographic window
Countries such as Kenya, Ghana, Rwanda and Senegal have made significant progress in reducing fertility, now standing at between three and four births per woman. Expanding education, urbanisation and access to health services are driving this shift. Dependency ratios are declining, and the share of the working-age population is rising.
These countries are entering the early stages of their demographic window, where the potential for accelerated economic growth begins to emerge. However, success depends on their ability to absorb new labour market entrants. Expanding manufacturing, improving agricultural productivity and strengthening education and skills systems are key to converting demographic change into productivity gains.
Late-transition countries: capitalising on the dividend
A few African countries—Mauritius, Seychelles, Tunisia, Morocco, Algeria, South Africa and Cabo Verde—are already benefiting from a maturing age structure. Their fertility rates have stabilised below three births per woman, dependency ratios are low and median ages range from the late 20s to mid-30s. These countries are positioned to capitalise on their demographic dividend, provided productivity gains are sustained, and labour markets remain inclusive.
However, they also face emerging challenges linked to ageing populations and the need to sustain productivity growth. Strengthening innovation, deepening capital markets and building inclusive social protection systems will be essential to maintain momentum as their demographic window gradually narrows. The demographic future is not predetermined. It is a choice shaped by investment, leadership and inclusion. Seizing the dividend will demand patience, persistence and vision; missing it will have consequences for generations. The window of opportunity is open—but not indefinitely.
Page information
Contact at AFI team is Jakkie Cilliers
This entry was last updated on 7 June 2026 using IFs v8.55.
Donors and sponsors


Reuse our work
- All visualizations, data, and text produced by African Futures are completely open access under the Creative Commons BY license. You have the permission to use, distribute, and reproduce these in any medium, provided the source and authors are credited.
- The data produced by third parties and made available by African Futures is subject to the license terms from the original third-party authors. We will always indicate the original source of the data in our documentation, so you should always check the license of any such third-party data before use and redistribution.
- All of our charts can be embedded in any site.
Cite this research
Jakkie Cilliers (2026) Africa Demographics Forecast. Published online at futures.issafrica.org. Retrieved from https://futures.issafrica.org/thematic/03-demographic-dividend/ [Online Resource] Updated 7 June 2026.