 Mali
Mali
Feedback welcome
Our aim is to use the best data to inform our analysis. See our Technical page for information on the IFs forecasting platform. We appreciate your help and references for improvements via our feedback form.
This page presents a comprehensive analysis of Mali. The analysis outlines the nation's extensive socio-economic challenges and opportunities, examining various developmental paths through 2043. It highlights Mali’s significant economic growth potential rooted in its rich natural resources, while also noting enduring development challenges related to inequality, governance, and a continued reliance on commodity exports, particularly gold and cotton. Various scenarios consider the impacts of improvements in sectors like governance, agriculture, education and manufacturing. The analysis aims to provide policymakers and researchers insights to guide Mali towards a more prosperous future.
For more information about the International Futures modelling platform we use to develop the various scenarios, please see About this Site.
Executive Summary
We begin this page with an introduction and context to Mali.
Mali is a low-income country in north-west Africa. The country has been a member of the Economic Community of West African States (ECOWAS) since 1975 but decided in January 2024 to withdraw from the organisation, together with Burkina Faso and Niger, with whom it formed the Confederation of Sahel States in August 2024.
- The desert nation of Mali is characterised by its Sahelian climate — a transitional zone between the arid Sahara desert in the north of Africa and savannas to the south. The country is divided into three natural zones: the cultivated Sudanese zone in the south, the semi-arid Sahelian zone in the centre, and the arid Saharan zone in the north. The desert covers 30% of the country, and 59% of the country is classified as having annual rainfall of less than 400 mm. The result is a challenging environment with the country characterised by drought, desertification and the overexploitation of natural resources under the pressure of a rapidly growing population.
The introductory section is followed by an analysis of the Current Path for Mali which informs the region’s likely current development trajectory to 2043, mostly comparing Mali with its low-income peers in Africa. It is based on current developmental trends and assumes that no major shocks would occur in a ‘business-as-usual’ future.
- Mali is the fifth most populous country in West Africa and the 19th most populous in Africa. The total population increased from 9.2 million in 1990 to 23.8 million in 2023 and by 2043, it will be 41.5 million. In terms of population structure, Mali has a youthful and dependent population. In 2023, 46.2% of Malians were under the age of 15, 51.1% of whom were in the 15–64 age group (working age), and 2.6% were 65 years and older.
- Mali has urbanised more rapidly over the years such that the urban population stood at 45.2% in 2023, making it the ninth most urbanised country among low-income African countries instead of the 13th in 1990. On the Current Path, Mali will achieve parity in urban–rural settlement by 2030; and by 2043, 24.0 million Malians, constituting almost 57.8% of the population, will live in urban areas.
- The Malian economy revolves around the export of major traditional raw materials such as cotton and gold. The country’s GDP, measured in market exchange rates (MER), grew from US$4.5 billion in 1990 to US$18.6 billion in 2023, making it the fifth largest in West Africa after Nigeria, Ghana, Côte d'Ivoire and Senegal. The average GDP growth rate during this period stood at 4.3% per annum, above the average of 3.9% for low-income countries in Africa. By 2043, GDP will more than triple to US$53.0 billion with an average growth of 5.4% between 2024 to 2043.
- Mali has a large informal sector that is vital to its economy. In 2023, the size of the informal sector was approximately 33% of GDP, which is above the average of 29.3% for its income peers in Africa reflecting the extent of poverty and a challenging development context. In the Current Path, the size of the informal sector will decline slightly to 29.3% of GDP by 2043.
- Mali has the sixth-highest GDP per capita among the low-income countries in Africa. Its GDP per capita of US$2 127 in 2023 (in purchasing power parity) was 17% lower than the group average of US$1 814. By 2043, Mali’s GDP per capita will rise to US$3 059, indicative of a slower growth in GDP per capita.
- Mali currently ranks 188th on the United Nations World Human Development Index with a score of 0.410. In 2023, 3.4 million Malians, representing 14.2% of the population, lived below the poverty line of US$2.15 per day, far below the average of 41.5% for low-income countries in Africa. By 2043, the poverty rate of 5.6% (equivalent to 3.2 million Maliians) means that Mali will miss the Sustainable Development Goal 1 target, which can only be met in 2051.
The next section compares progress on the Current Path with eight sectoral scenarios. These are Demographics and Health; Agriculture; Education; Manufacturing; the African Continental Free Trade Area (AfCFTA); Large Infrastructure and Leapfrogging; Financial Flows; and Governance. Each scenario is benchmarked to present an ambitious but reasonable aspiration in that sector.
- Mali’s rapidly growing population constrains potential improvements in income. The Demographics and Health scenario will reduce the infant mortality rate from 64.1 deaths per 1 000 births in 2023 to 21.5 deaths by 2043, 7 deaths fewer than in the Current Path. The scenario pushes the ratio of the working-age population from its current ratio of 1.3 working-age persons to one dependants to 1.5 to one by 2043, close to the ratio of 1.7 to one that is required to enter a potential demographic window of opportunity.
- In 2023, Mali’s net import of crops stood at 1.4% of total crop demand, which was less than the average of 9.1% for low-income countries in Africa. Mali will reduce its import dependency on crops so that by 2043, the net import of crops will reach 10.2% in the Agriculture scenario.
- In 2023, the mean years of education attained by adults between 15 and 24 years in Mali stood at 5.8 years — slightly below the average of 5.9 years for low-income countries on the continent. In the Education scenario, the mean years of adult education will rise to 9.0 years by 2043, 1.9 years more than the Current Path. By 2043, the scenario further increases average test scores for primary and secondary school students by 34.4% and 42.5%, respectively significantly closing the gap with its income peers.
- In the Manufacturing scenario, Mali makes substantial progress in industrialisation such that, by 2043, the share of the manufacturing sector in GDP is about 29% equivalent to US$16.5 billion. This will be about 11 percentage points of GDP above the Current Path valued at US$7.5 billion. As a result, the manufacturing sector will become the second-largest contributor to GDP, surpassing the contribution of agriculture.
- In the African Continental Free Trade Area (AfCFTA) scenario, Mali’s trade deficit will constitute about 6.5% of GDP by 2043 instead of the 6.9% of GDP on the Current Path. Also, the sum of Mali's exports and imports as a percentage of GDP will reach 123.3% by 2043.
- Based on the Large Infrastructure and Leapfrogging scenario, 80% of Malians will have access to electricity by 2043. As a result, 47.3% of households in Mali will use modern fuel for cooking in the Large Infrastructure and Leapfrogging scenario. The scenario will further lead to a larger increase in fixed broadband access, so that, by 2043, subscriptions will likely be at 24 per 100 people compared to 5.6 subscriptions on the Current Path.
- In 2023, the government’s total revenue in Mali amounted to US$4.1 billion, equivalent to 22% of GDP — higher than the average of its income-group peers in Africa. Compared to the Current Path, the Financial Flows scenario will improve government revenue in Mali by an additional US$1.4 billion by 2043.
- Generally, Mali performs better on governance indices than its income peers in Africa. Mali’s score on the composite governance index of 0.46 in 2023 was 5.3% higher than the average for its income peers in Africa. In the Governance scenario, Mali's score on the composite governance index will improve to 0.65, which is about 23.3% above the Current Path by 2043.
In the third section, we compare the impact of each of these eight sectoral scenarios with one another and subsequently with a Combined scenario (the integrated effect of all eight scenarios). In our forecasts, we measure progress on various dimensions such as economic size (in market exchange rates), gross domestic product per capita (in purchasing power parity), extreme poverty, carbon emissions, the changes in the structure of the economy, and selected sectoral dimensions such as progress with mean years of education, life expectancy, the Gini coefficient or reductions in mortality rates.
- The scenario with the greatest impact on GDP per capita in Mali by 2043 is the Governance scenario, followed by the Agriculture and Manufacturing scenarios. In the Governance scenario, Mali’s GDP per capita will witness an increase of US$312 or 10.2% more than the Current Path. The AfCFTA and Manufacturing scenarios further raise GDP per capita by an additional US$196 and US$190 by 2043.
- The Governance scenario also has the largest potential to reduce extreme poverty, followed by the Agriculture and Manufacturing scenarios. The Governance scenario has the potential to reduce extreme poverty in Mali by an additional 940 000 people compared to the 2043 Current Path. Similarly, the Manufacturing and Agriculture scenarios can lift about 880 000 and 570 000 people out of extreme poverty, respectively.
- In the Combined scenario, Mali’s GDP will rise to US$83.3 billion exceeding the Current Path of US$53 billion. Similarly, in the Combined scenario, GDP per capita will increase to US$4 284 by 2043. This will be US$1 225 more than the Current Path.
- By 2043, the services sector will still be the largest contributor to GDP at 40.1%. The manufacturing sector will be the second-largest contributor to GDP in the scenario by 2043 with a share of 30.8%. The share of the agriculture sector will decline to 17.2%.
- By 2043, the size of the informal sector in Mali will decline to 23.3% of GDP, valued at US$19.4 billion. At this rate, the contribution of the informal economy will be lower than the Current Path at 29.6% (valued at US$15.7 billion). Likewise, the size of the informal labour sector will constitute 51.4% of the total labour force instead of 72.1% in the Current Path by 2043.
- In 2023, the average life expectancy at birth in Mali was 63.7 years, which was about 2.6 years lower than the average for the country’s income-group peers in Africa. In the Combined scenario, life expectancy will increase to 68.7 years in 2030 and 74.8 years by 2043, which will be 2.4 years more than the country’s Current Path in the same year.
- In the Combined scenario, both the number and portion of people facing poverty will significantly decline. By 2043, only about 0.4% of Malians equivalent to 150 000 people will be living in extreme poverty, meaning 2.2 million more people could be lifted out of poverty.
- Given its small economy, Mali releases little greenhouse gases. In 2023, Mali released about 2.4 million tons of carbon from fossil fuel use. In the Combined scenario, Mali’s total carbon emissions will rise to 8.4 million tons — 17.7% higher than what is estimated in the Current Path in the same year.
- The Combined scenario shows an increase in energy demand, creating a larger energy deficit, with solar energy becoming the dominant energy source, surpassing oil and gas. By 2043, the excess demand for energy in the scenario of 18.3 million barrels of oil equivalent (BOE) will be twice the Current Path. The share of solar energy in total energy production in the country will rise significantly to constitute 61% and become the leading contributor.
We end this page with a summarising conclusion, offering key recommendations for decision-making.
Mali has made significant progress in advancing human development and its economic growth prospect is higher than many of its African income-peers, but offset by its rapidly growing population. Widespread poverty and inequality persist, public debt is increasing and the unemployment rate, particularly among the youth, remains high, while average incomes are growing at a slower pace. The informal sector dominates a significant portion of the economy, depriving the government of potential revenue. The macroeconomic fundamentals of the Malian economy remain fragile, with an economic structure that is still largely agrarian and untransformed, relying heavily on the export of traditional raw materials like gold and cotton. As a result, economic growth is highly volatile, driven by weather conditions, fluctuations in international commodity prices and external shocks. Therefore, a comprehensive and targeted set of socio-economic policy interventions across demographics, health, education, agriculture, infrastructure, manufacturing, trade, financial flows and governance is necessary to redirect the country’s current development trajectory towards a more sustainable and inclusive path. At the core of this multisectoral approach is the need to strengthen governance systems, with a particular focus on revitalising agriculture and manufacturing. Development assistance continues to play a key role in supporting progress and improving livelihoods, calling for strong partnerships with international development actors.
All charts for Mali Development Futures
- Chart 1: Political map of Mali
- Chart 2: Population structure in the Current Path, 2020–2043
- Chart 3: Population distribution map, 2022
- Chart 4: Urban and rural population in the Current Path, 1990-2043
- Chart 5: GDP (MER) and growth rate in the Current Path, 1990–2043
- Chart 6: Size of the informal economy in the Current Path, 2020-2043
- Chart 7: GDP per capita in Current Path, 1990–2043
- Chart 8: Extreme poverty in the Current Path, 2020–2043
- Chart 9: Relationship between Current Path and scenarios
- Chart 10: Mortality distribution in the Current Path, 2023 and 2043
- Chart 11: Infant mortality rate in Current Path and Demographics and Health scenario, 2020–2043
- Chart 12: Demographic dividend in the Current Path and the Demographics and Health scenario, 2020–2043
- Chart 13: Crop production and demand in the Current Path, 1990-2043
- Chart 14: Import dependence in the Current Path and Agriculture scenario, 2020–2043
- Chart 15: Progress through the education funnel in the Current Path, 2023 and 2043
- Chart 16: Mean years of education in the Current Path and Education scenario, 2020–2043
- Chart 17: Value-add by sector as % of GDP in the Current Path, 2020 and 2043
- Chart 18: Value-add by the manufacturing sector in the Current Path and Manufacturing scenario, 2020–2043
- Chart 19: Exports and imports as % of GDP in the Current Path, 2000-2043
- Chart 20: Trade balance in the Current Path and AfCFTA scenario, 2020–2043
- Chart 21: Electricity access: urban, rural and total in the Current Path, 2000-2043
- Chart 22: Cookstove usage in the Current Path and Large Infra/Leapfrogging scenario, 2020–2043
- Chart 23: Access to mobile and fixed broadband in the Current Path and the Large Infra/Leapfrogging scenario, 2020–2043
- Chart 24: FDI, foreign aid and remittances as % of GDP in the Current Path and in the Financial Flows scenario, 1990-2043
- Chart 25: Government revenue in the Current Path and Financial Flows scenario, 2020–2043
- Chart 26: Government effectiveness score in the Current Path, 2002-2043
- Chart 27: Composite governance index in the Current Path and Governance scenario, 2023 and 2043
- Chart 28: GDP per capita in the Current Path and scenarios, 2020–2043
- Chart 29: Poverty in the Current Path and scenarios, 2020–2043
- Chart 30: GDP (MER) in the Current Path and Combined scenario, 2020–2043
- Chart 31: Value added by sector in the Current Path and Combined scenario, 2023 and 2043
- Chart 32: Informal sector in the Current Path and Combined scenario, 2020–2043
- Chart 33: Life expectancy in the Current Path and Combined scenario, 2020–2043
- Chart 34: Domestic Gini in the Current Path and Combined scenario, 2023 and 2043
- Chart 35: Carbon emissions in the Current Path and Combined scenario, 2020–2043
- Chart 36: Energy demand and production by type in the Current Path and Combined scenario, 2020-2043
- Chart 37: Policy recommendations
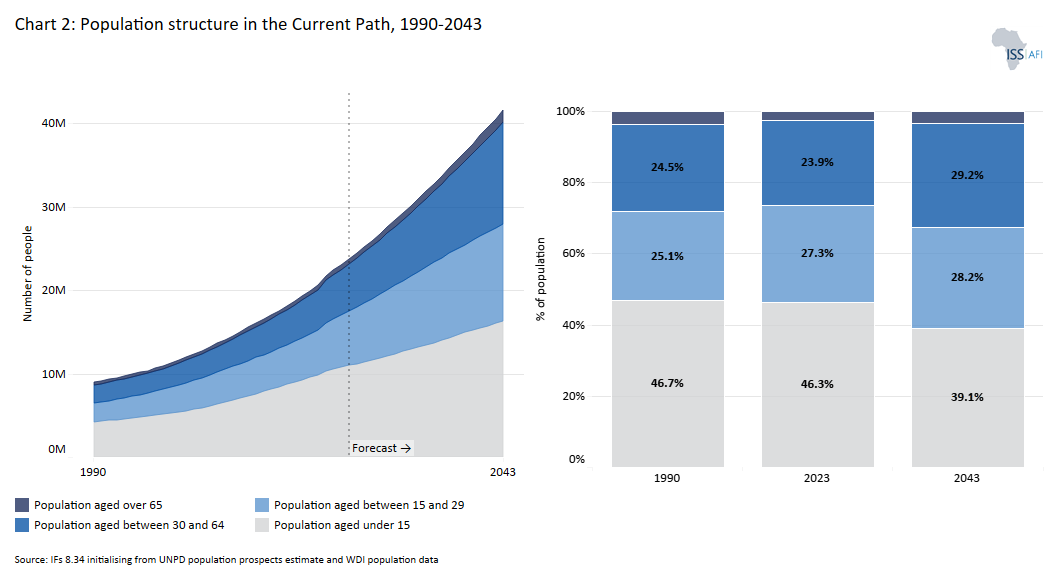
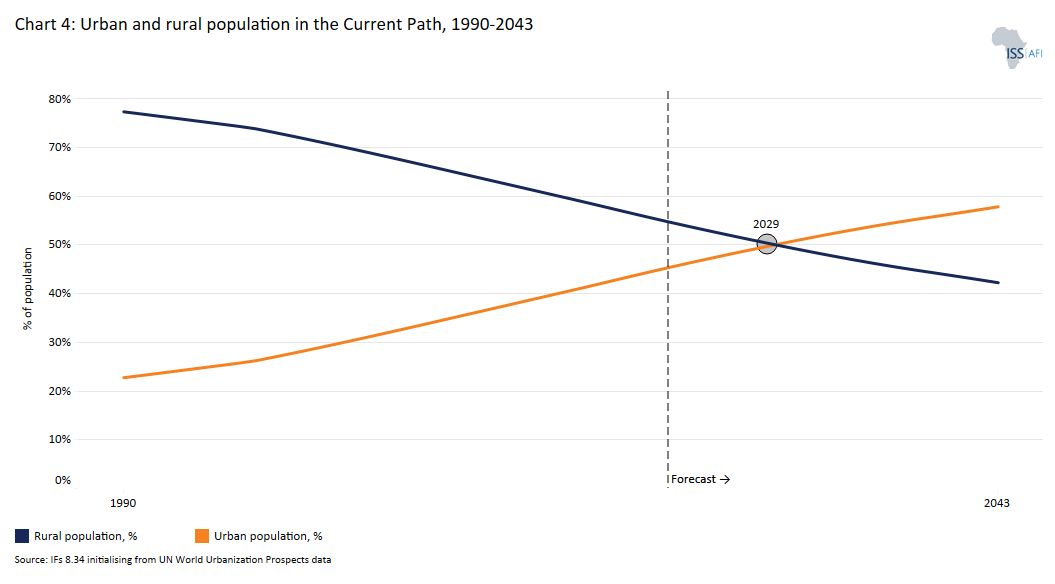
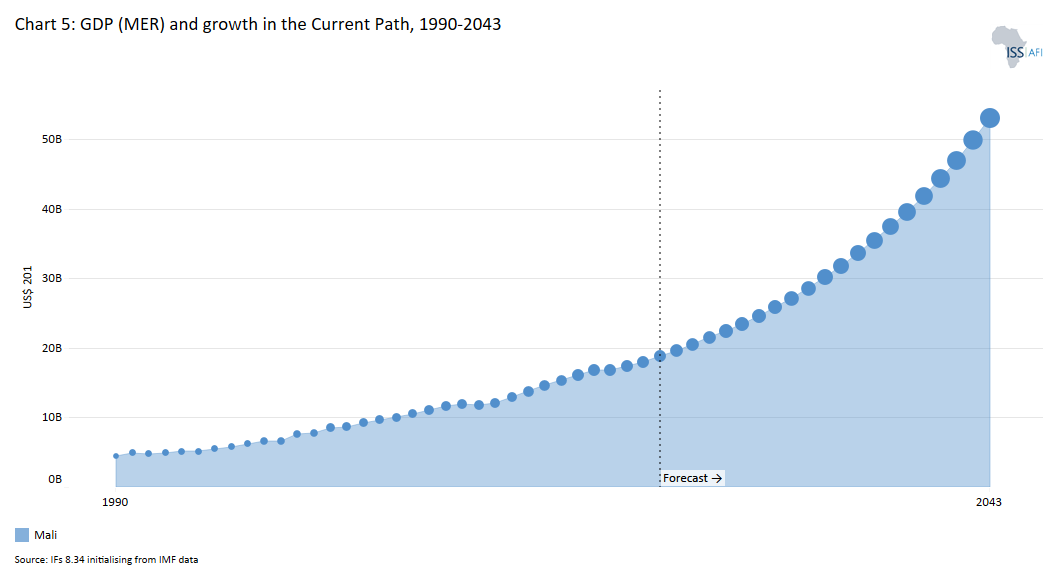
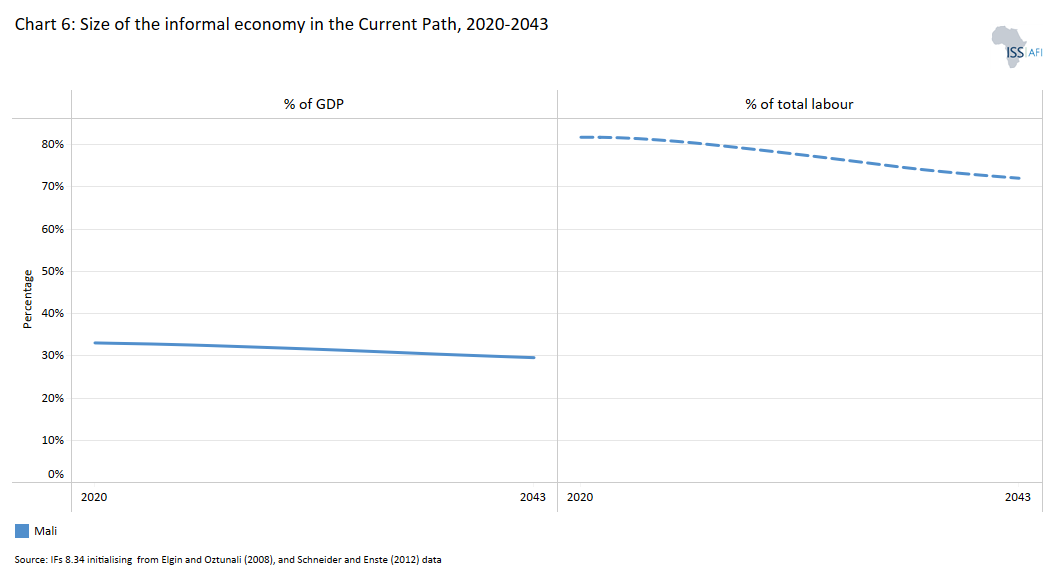
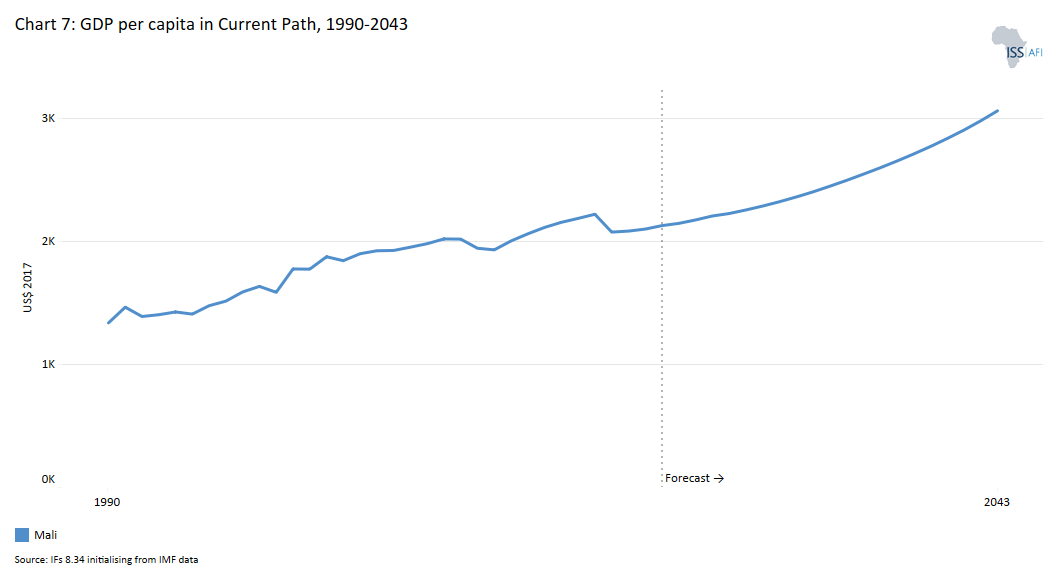
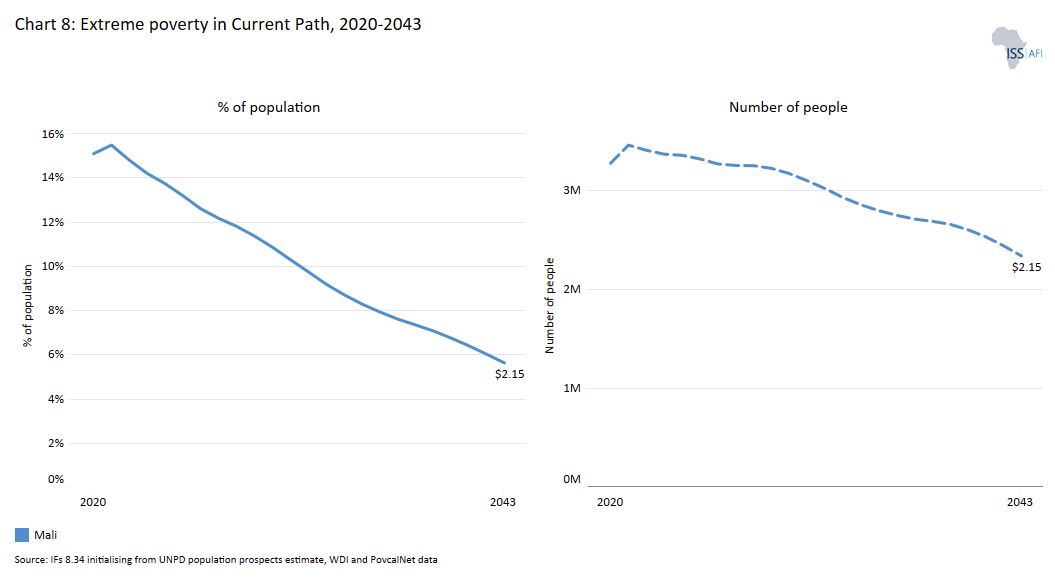
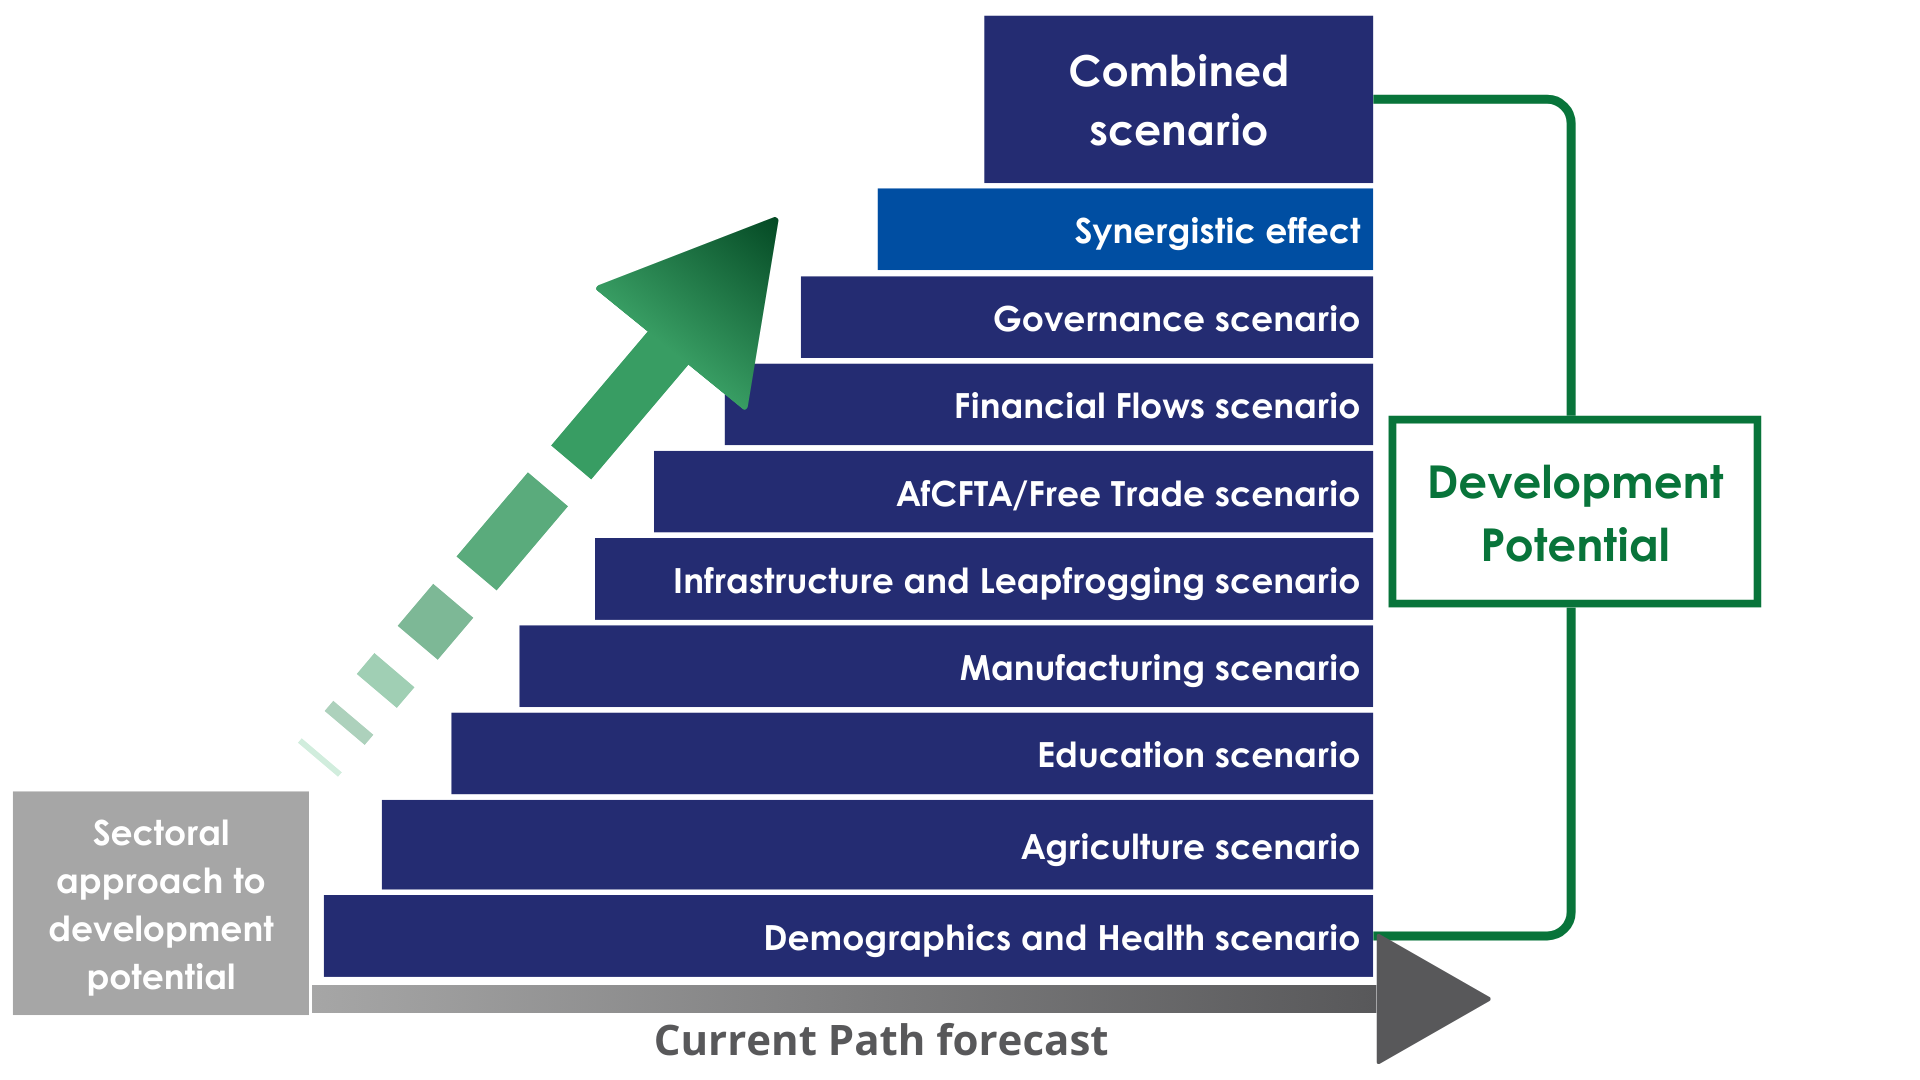
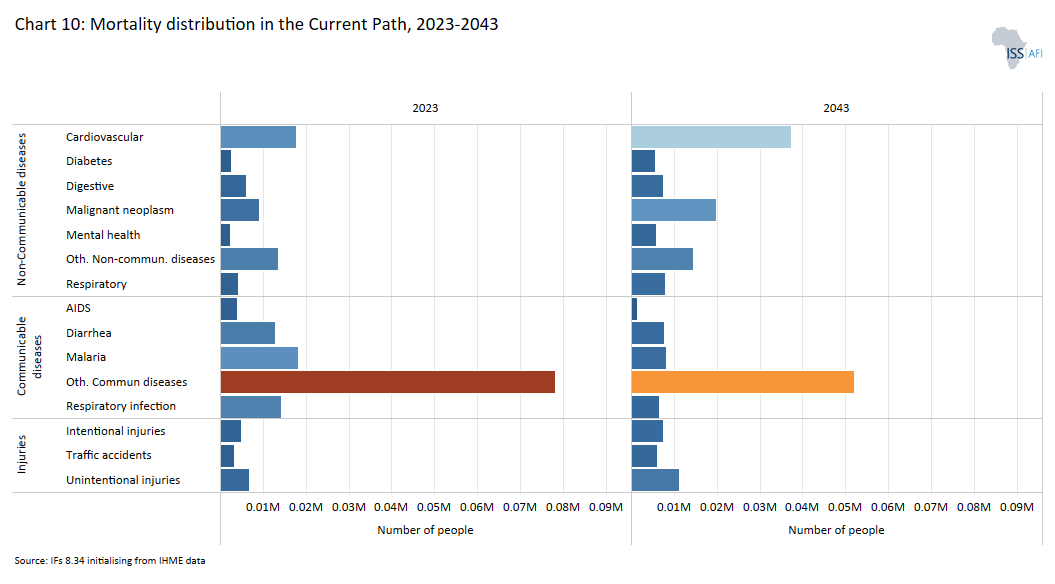
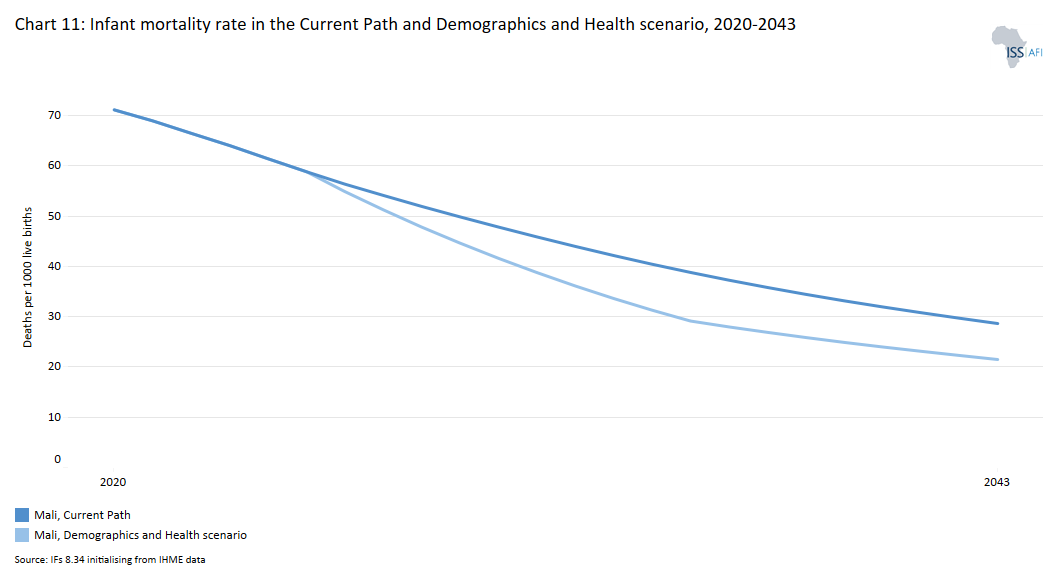
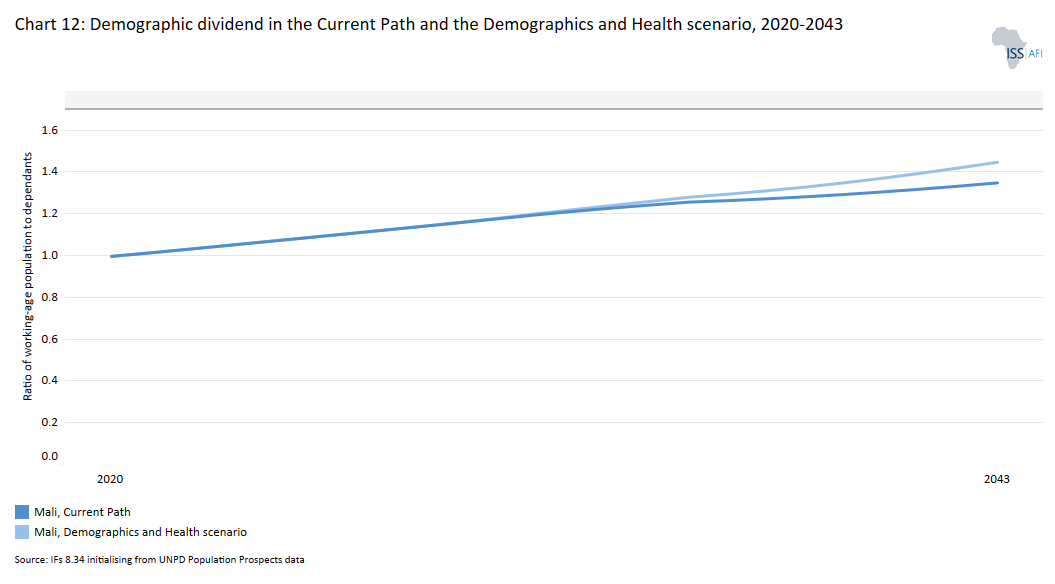
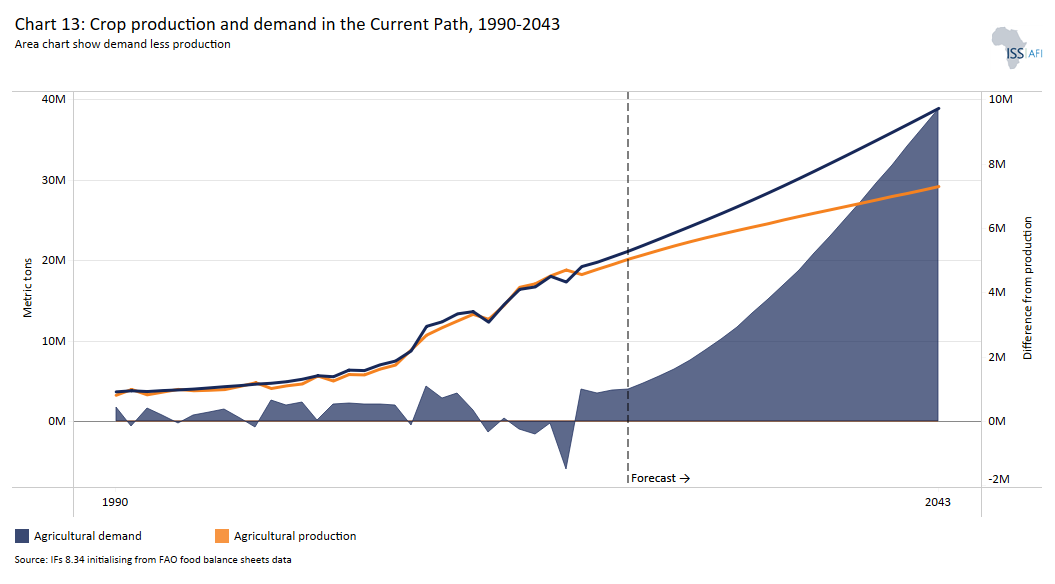
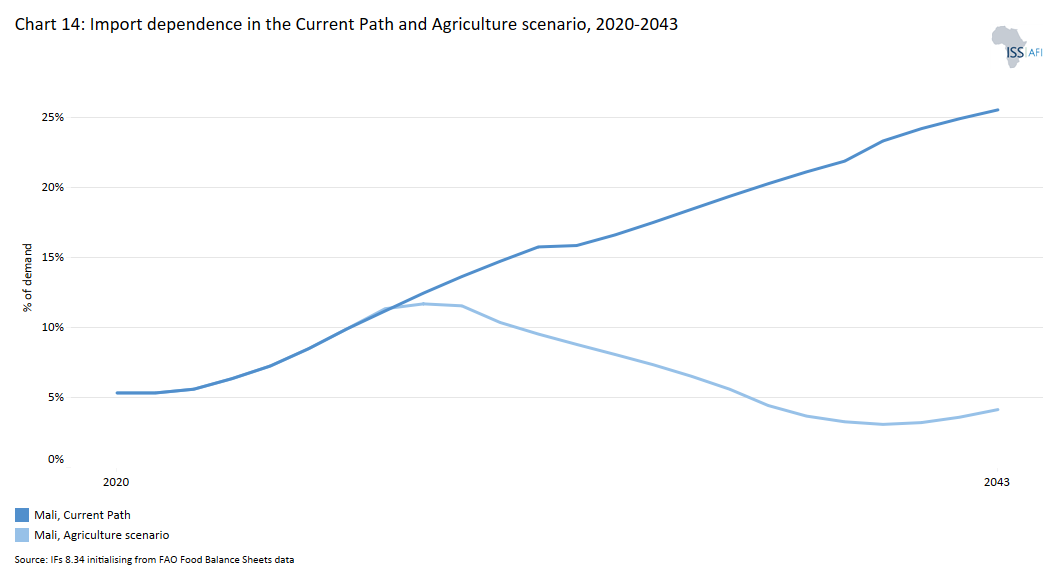
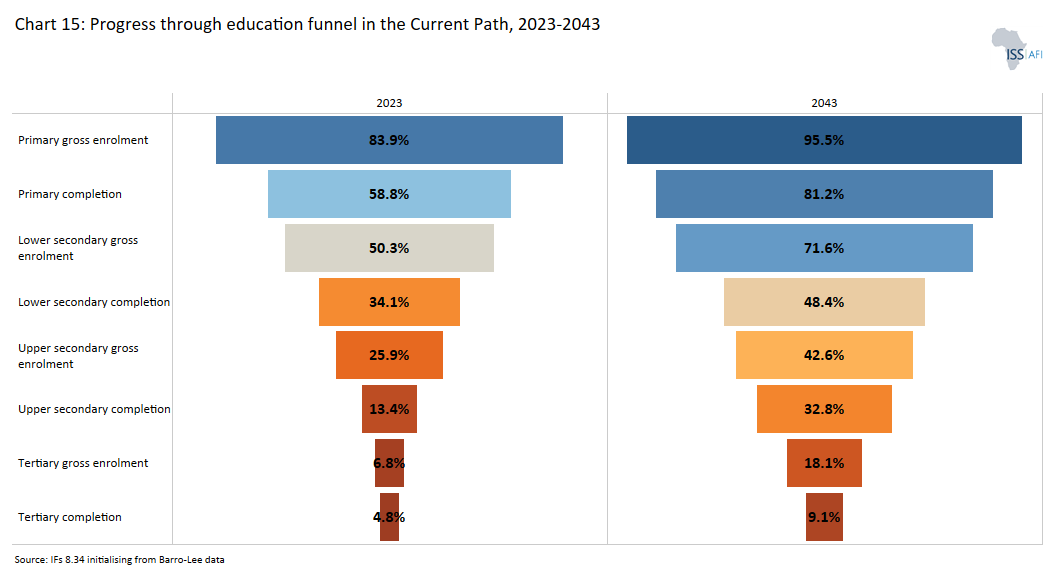
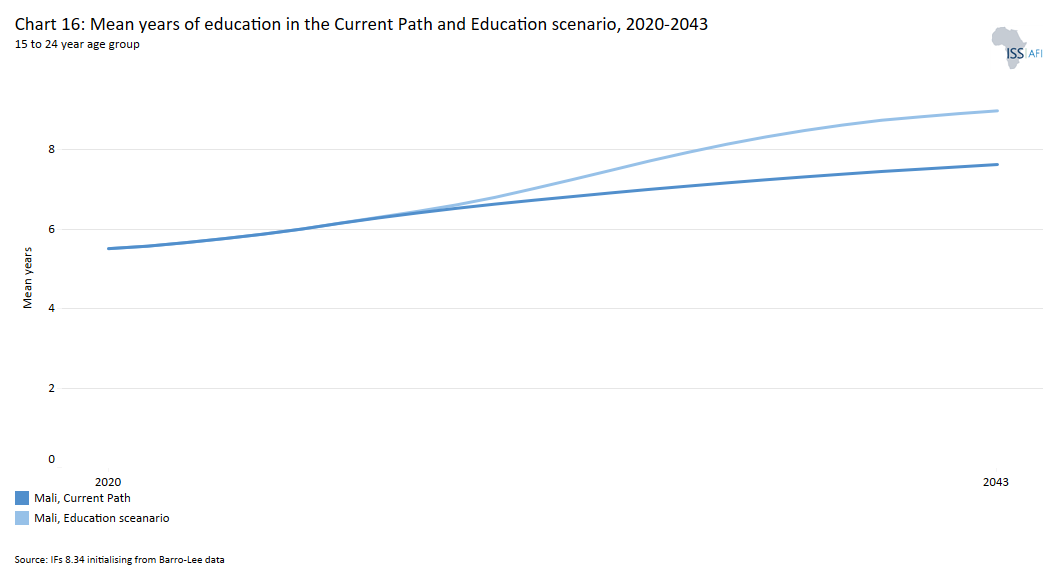
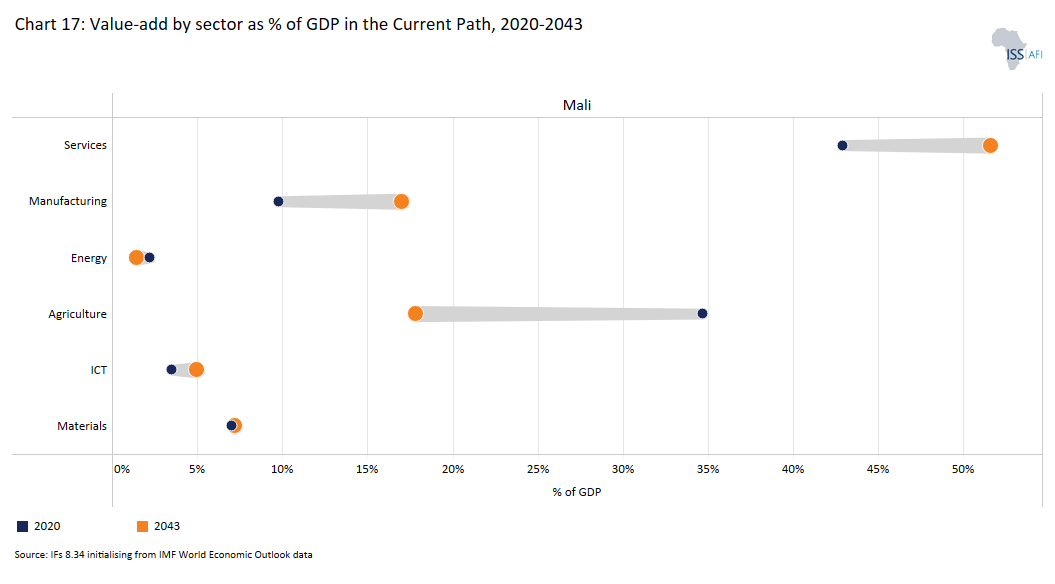
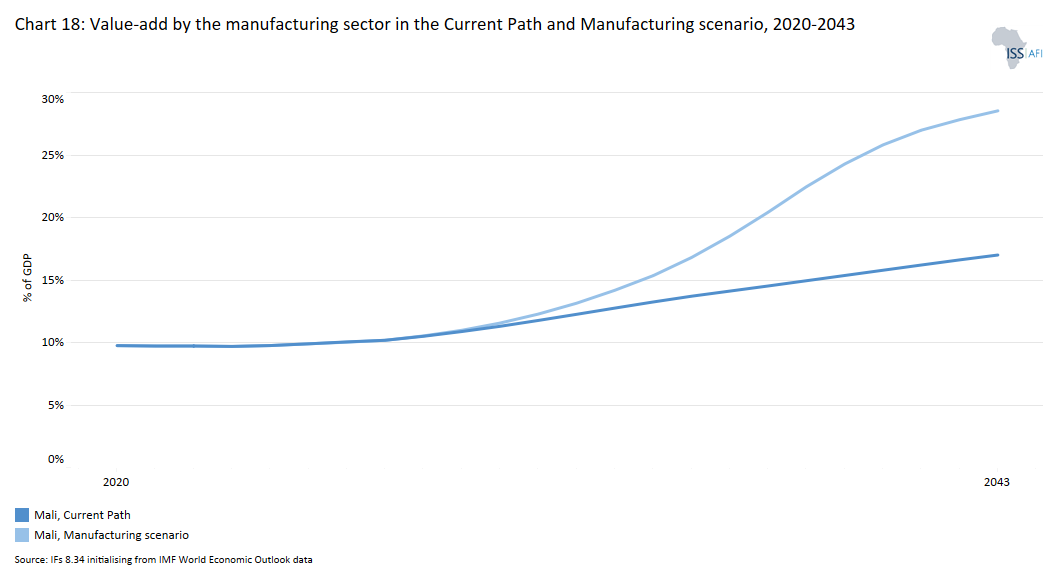
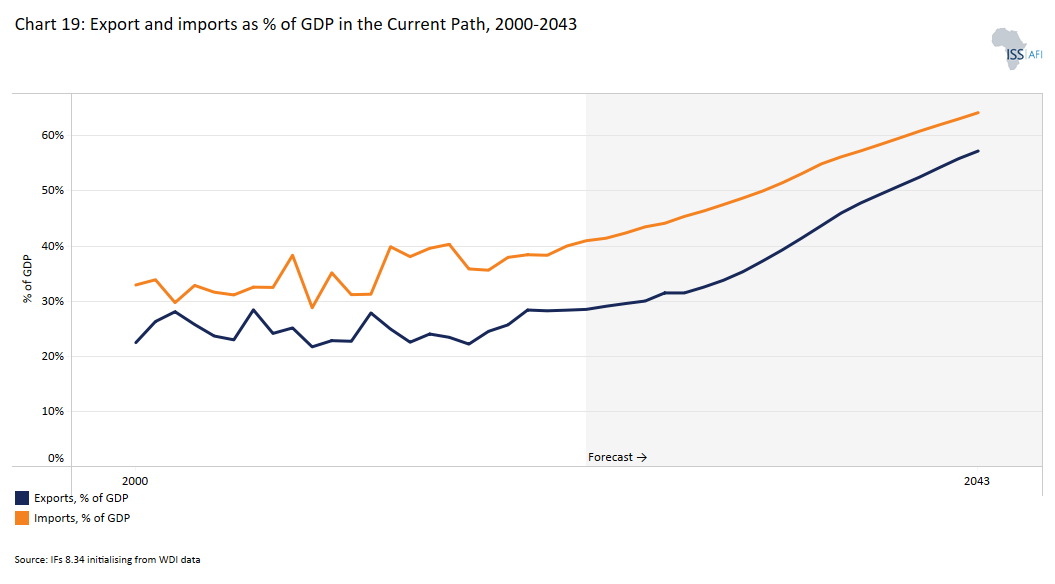
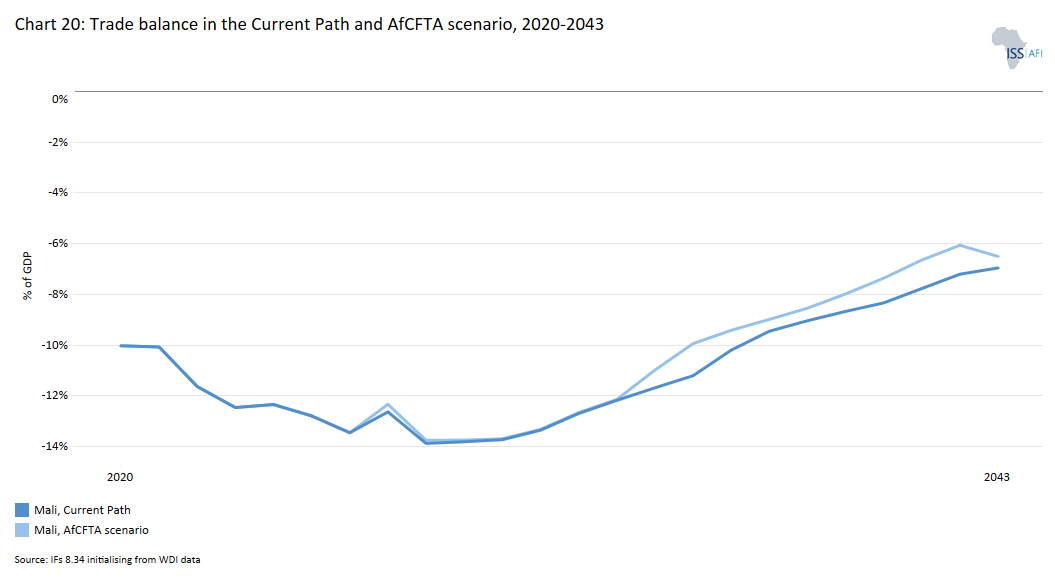
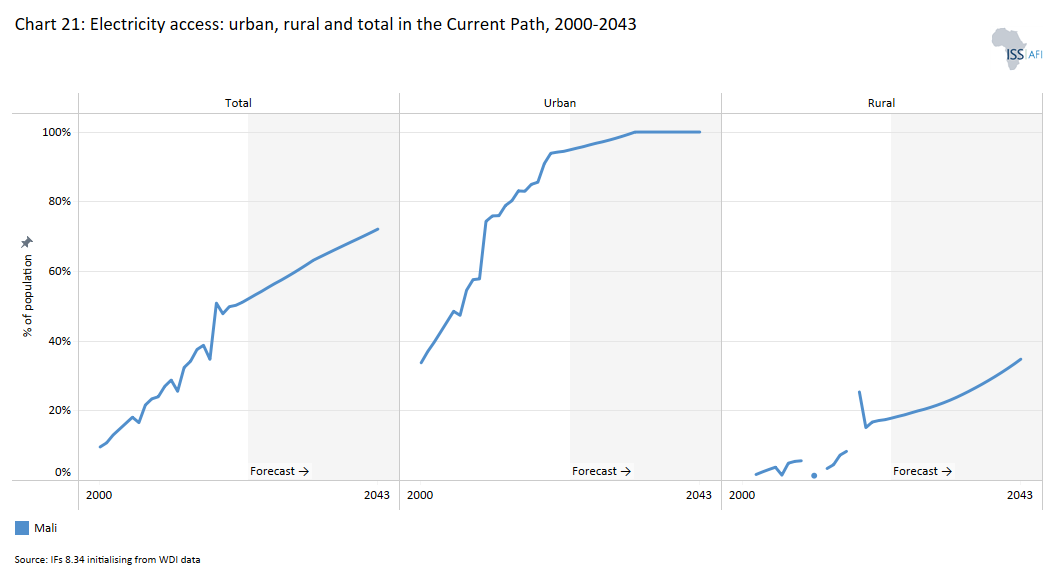
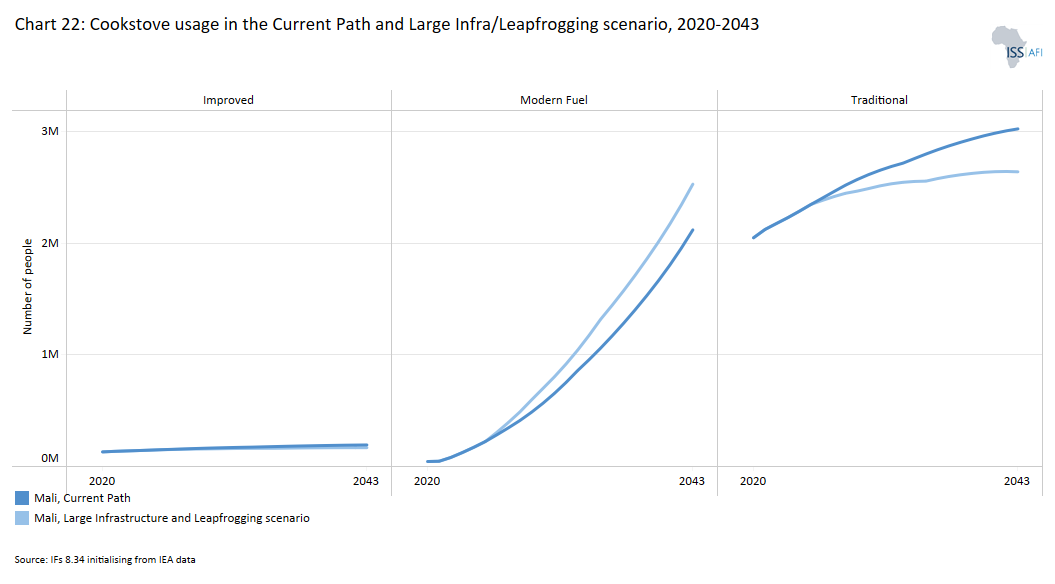
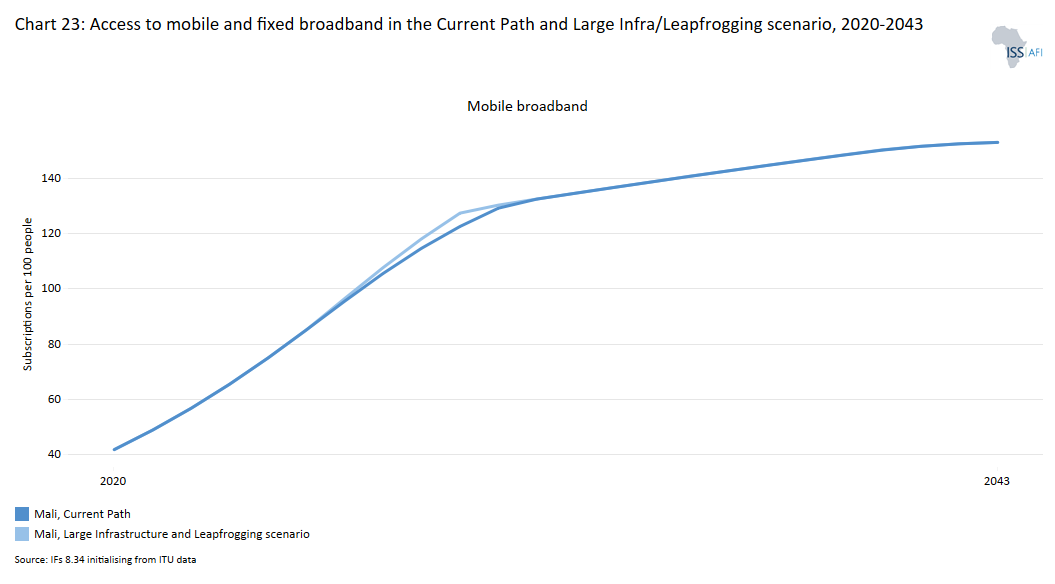
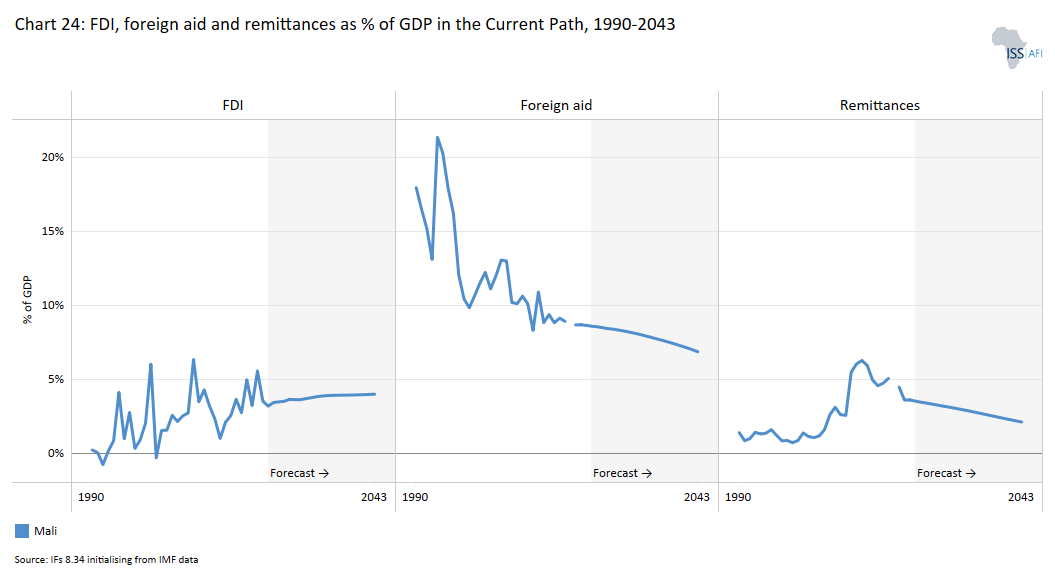
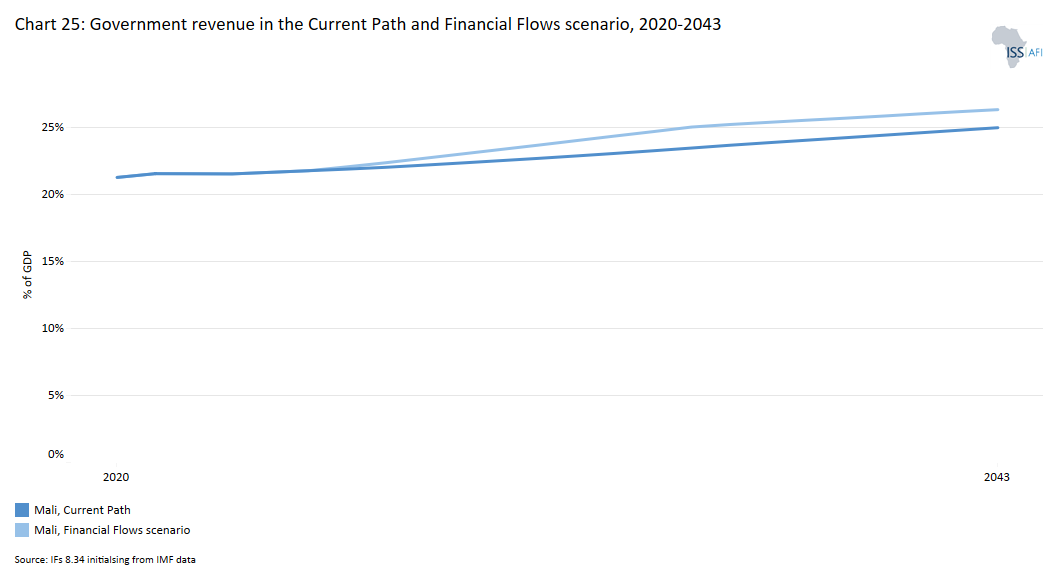
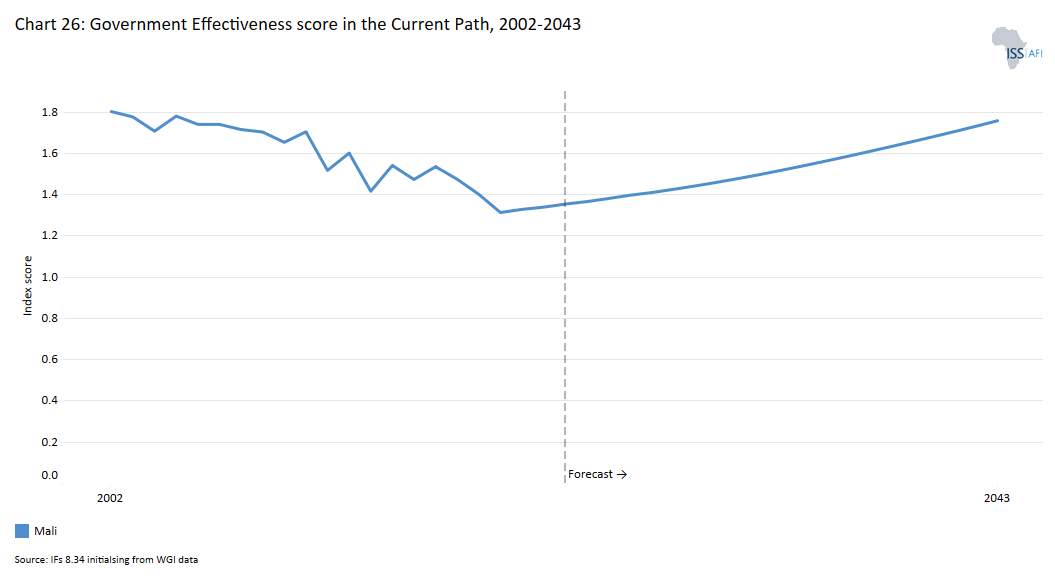
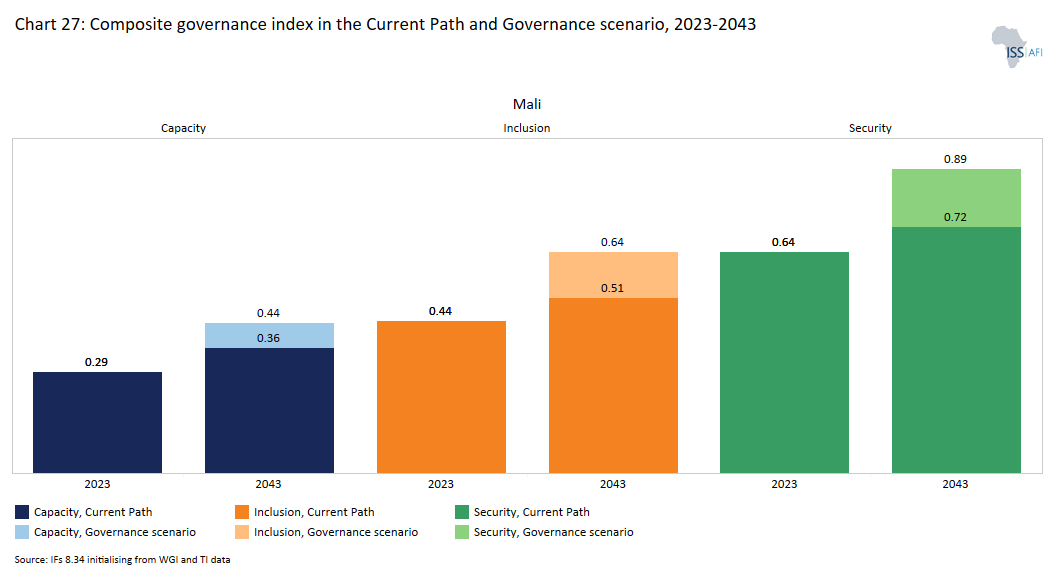
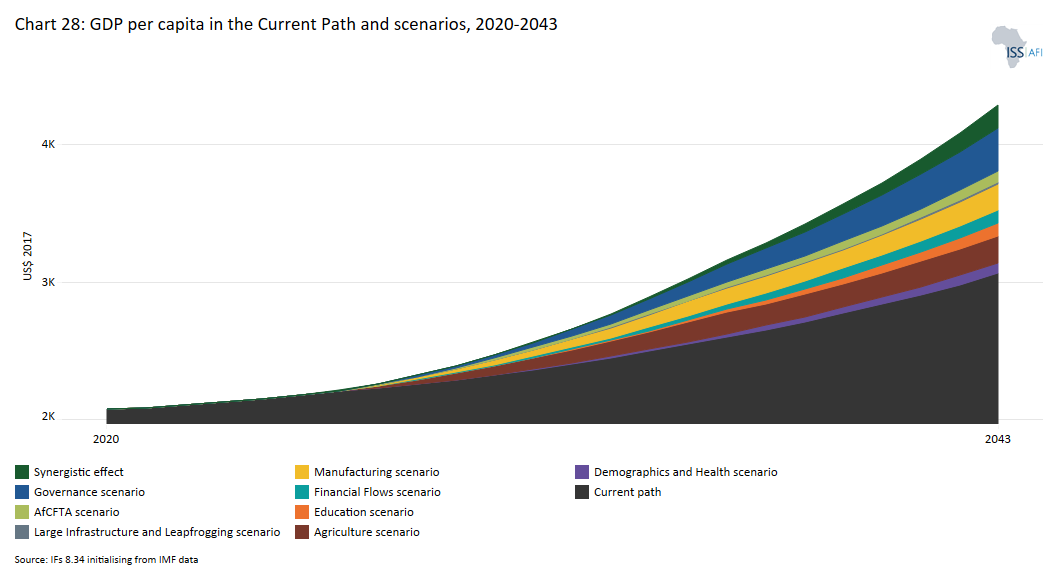
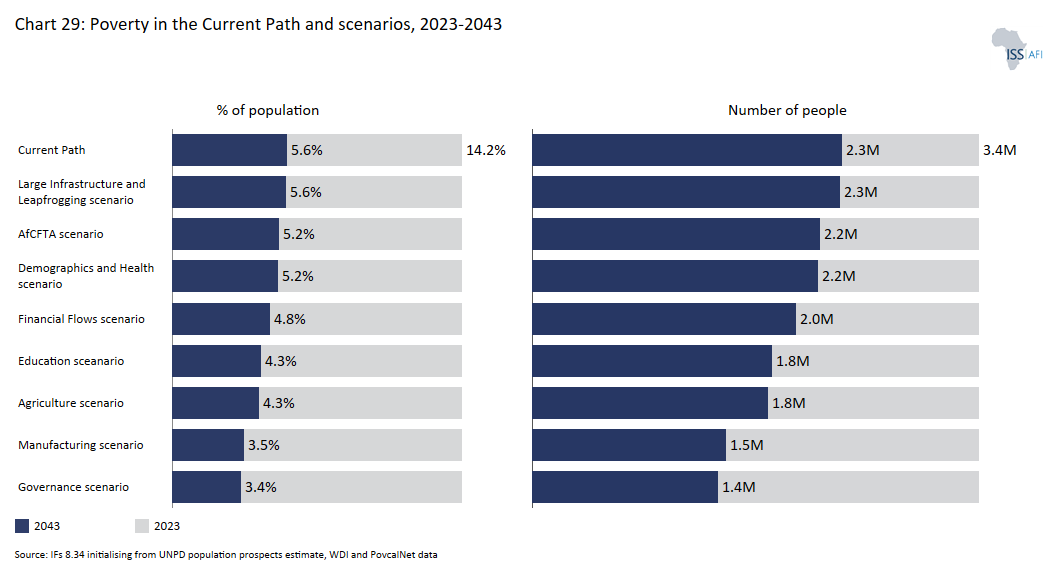
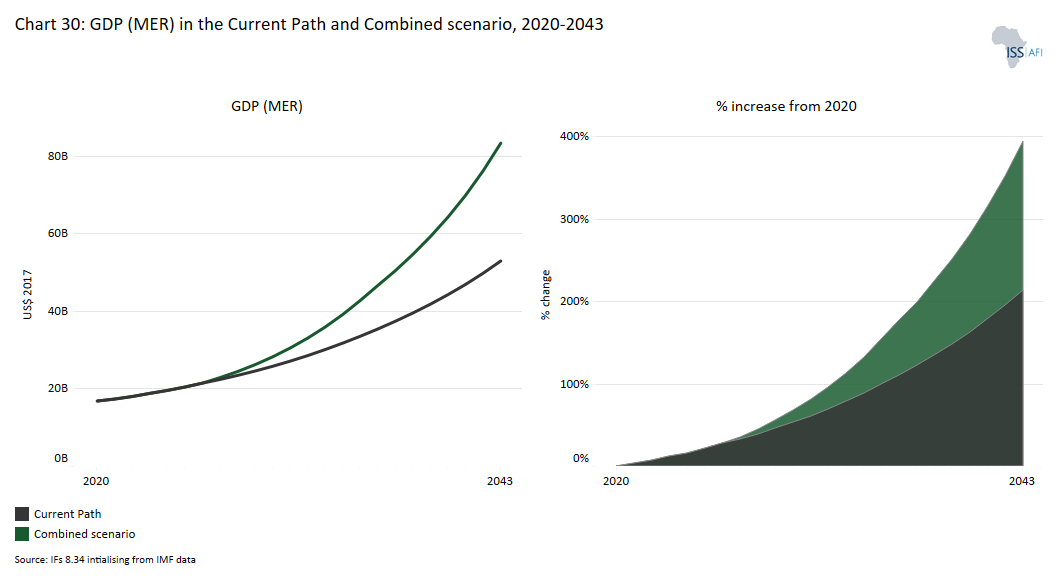
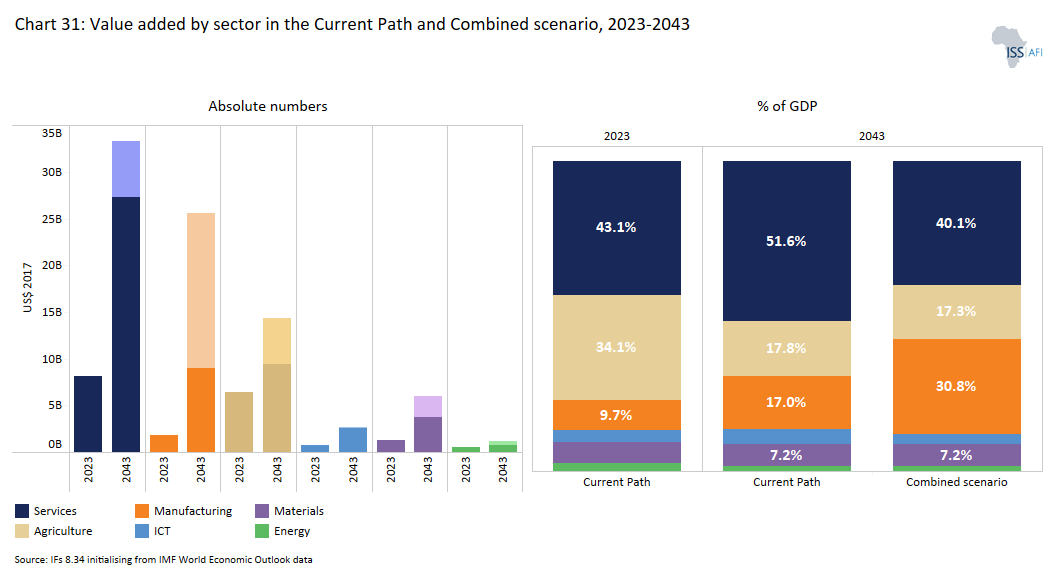

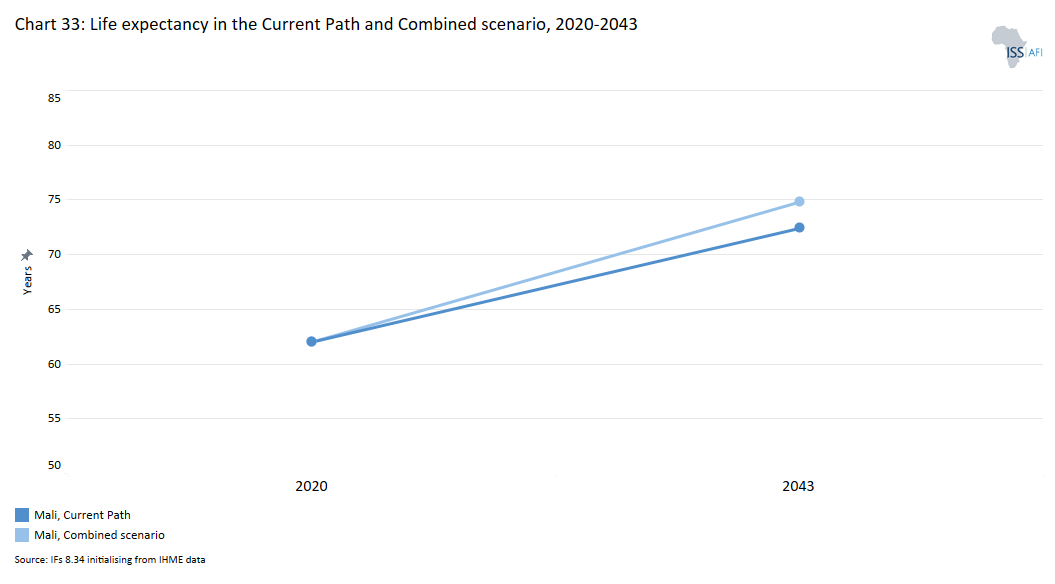
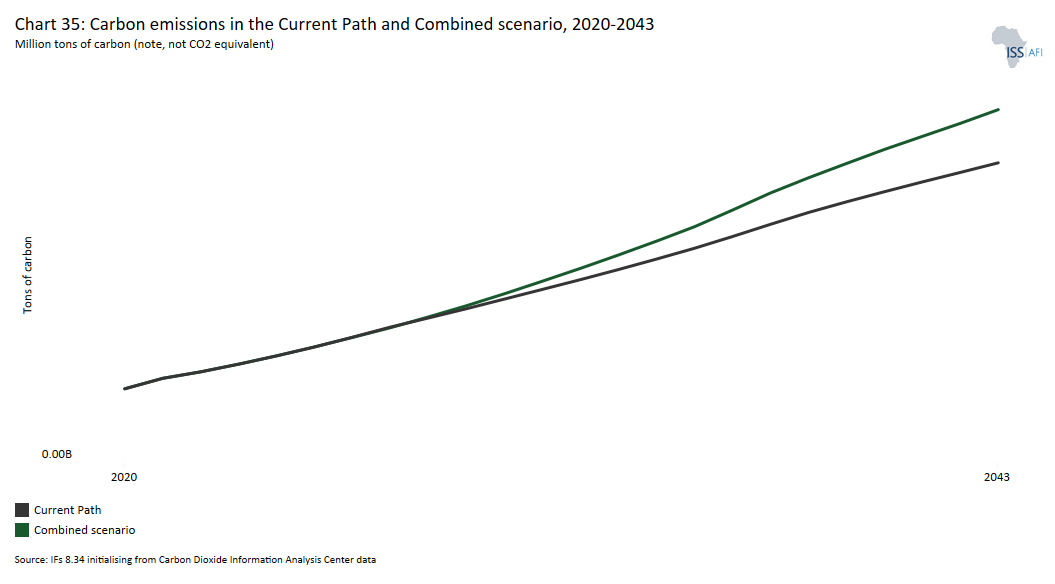
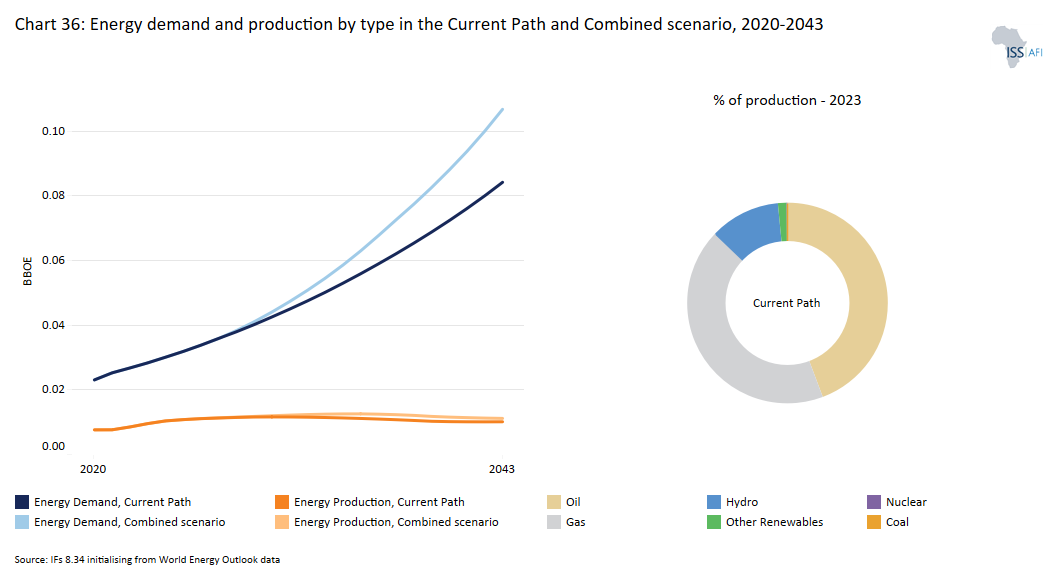
Chart 1 is a political map of Mali.
Mali is a low-income country in north-west Africa. The country has been a member of the Economic Community of West African States (ECOWAS) since 1975, but its military leadership following the 2020 coup decided in January 2024 to withdraw from the organisation, together with Burkina Faso and Niger, with whom it formed the Confederation of Sahel States in August 2024. The country however remains a member of the West African Economic and Monetary Union (WAEMU, or UEMOA in French). Mali is also a member of the Community of Sahel–Saharan States (CEN-SAD), which has had minimal activity following the turmoil in Libya, where its secretariat was initially based, although it has now been relocated to Chad.
The desert nation of Mali is characterised by its Sahelian climate — a transitional zone between the arid Sahara desert in the north of Africa and savannas to the south. The country is divided into three natural zones: the cultivated Sudanese zone in the south, the semi-arid Sahelian zone in the centre, and the arid Saharan zone in the north. The desert covers 30% of the country, and 59% of the country is classified as having annual rainfall of less than 400 mm. As a result, the country is characterised by drought, desertification and the overexploitation of natural resources that are under the pressure of a rapidly growing population.
The Sahel region has historically been highly porous. Ancient trans-Saharan trade routes facilitated cross-border trade and a transhumance lifestyle for hundreds of years, predating the French colonial period. This way of life is now under dire threat. Climate change is having a devastating impact on the Sahel countries. The Intergovernmental Panel on Climate Change (IPCC) notes that the Sahel has ‘experienced the most substantial and sustained decline in rainfall recorded anywhere in the world within the period of instrumental measurements during the 1980s.’ Environmental degradation and violent conflict have displaced millions of people and will continue to worsen the environmental crisis in the area. Furthermore, the Sahel countries will experience some of the most severe climate change impacts globally as early as 2030. These impacts range from increasingly variable rainfall, rising temperatures and more frequent droughts to prolonged heatwaves.
Mali gained independence in 1960, with President Modibo Keïta as the first president of a socialist one-party state. However, the 1968 military coup led by Lieutenant Moussa Traoré truncated Keïta’s presidency. A new constitution in 1979 paved the way for a fresh election, which was won by President Moussa Traoré and ushered the country into its second republic. A military coup in March 1991 ousted the Traoré administration and replaced it with a transitional committee led by Amadou Toumani Touré who organised the country’s first democratic elections in 1992. These elections saw the victory of Alpha Oumar Konaré, who was re-elected for a second term in 1997. Touré, the author of the 1991 putsch, would return to power, winning presidential elections in 2002 and re-election in 2007.
In January 2012, the National Movement for the Liberation of Azawad (MNLA) started the fifth rebellion in the country’s history, taking control of two-thirds of the country's territory. Since its independence, the country has been struggling against irredentist movements from the Tuareg communities in the north, who periodically re-emerge (1963, 1986, 1990, 2006, 2012) and call for autonomy.
The fifth rebellion prompted military officers in Bamako to overthrow President Touré’s government in March 2012, citing his inability to deal with the Tuareg rebellion.
Under pressure from ECOWAS, the coup leaders ceded power the following month to an interim civilian government led by then President of the National Assembly Dioncounda Traoré as leader.
However, the crisis in the north provided an opportunist context for the occupation of these regions by violent extremist groups (Al Qaeda in the Islamic Maghreb Movement for Oneness and Jihad in West Africa, Ansar Dine), who ousted the MNLA rebels in June 2012. Despite the intervention of French operation Serval/Barkhane, ECOWAS and the deployment of the United Nations Multidimensional Integrated Stabilization Mission in Mali (MINUSMA) from 2013 onwards to tackle the jihadist threat, terrorist attacks expanded from 2015 onwards to central Mali, then towards Burkina, Niger and the coastal countries of West Africa.
The signing of a preliminary agreement between the government and MNLA rebels in June 2013 paved the way for the organisation of general elections in September 2013, with the support of MINUSMA. Ibrahim Boubacar Keïta won the election and Keïta was re-elected in June 2018. However, rising violence and insecurity in northern and central Mali and poorly organised 2020 parliamentary election results triggered nationwide protests, ultimately leading to Keïta's ouster as military officers removed him from power in August 2020.
A transitional government has since ruled over Mali, with Colonel Assimi Goïta declared Head of State by the Constitutional Court in May 2021. Also, the National Transition Council replaced the National Assembly until the country returned to constitutional rule. The military regime drastically overhauled Mali’s external relations, ending its longstanding bilateral cooperation with France in 2022 and moving closer to Russia. The French military, which had been supporting Mali’s counterterrorism efforts since 2013 through operations Serval and Barkhane, was requested to depart and, in 2023, Mali also requested the withdrawal of the MINUSMA.
Meanwhile, various efforts and consultations have occurred between the government, political parties and civil society organisations to return to constitutional rule. A new constitution, approved through a referendum in June 2023, paved the way for the announcement of general elections to restore constitutional rule. Under a timetable agreed upon with ECOWAS, national legislative elections were tentatively scheduled for October and November 2023, while presidential elections were scheduled for February 2024. However, the elections were indefinitely suspended by the military government junta in September 2023, citing technical difficulties. After it was sanctioned by ECOWAS in response to the coup, Mali announced its withdrawal from ECOWAS and formally exited the Community on 29 January 2025. Together with Burkina Faso and Niger, it formed the Confederation of Sahel States (CSS) in August 2024. Although the CSS is still part of WAEMU and uses the West African Franc (CFA), it has announced its intention to create a common currency to end the use of the CFA.
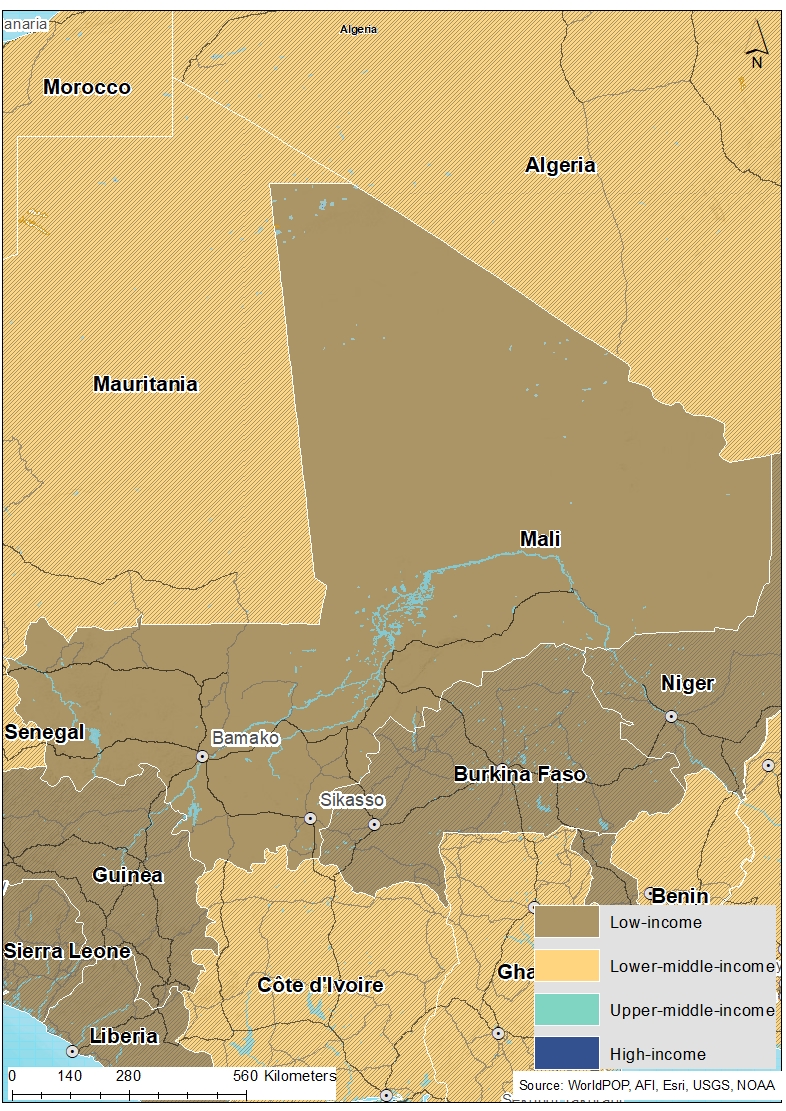
Chart 2 presents the Current Path of the population structure, from 2020 to 2043.
Mali’s population has more than doubled between 1990 and 2023, growing from 9.2 million to 23.8 million people. This makes Mali the fifth most populous country in West Africa and the 19th most populous in Africa. In 2023, the country had the seventh-highest population growth rate in Africa at 3.3%, up from 2.6% in 1990. This rapid population growth places significant pressure on government finances, as the government must increase its spending on essential social services, including education, healthcare and other amenities, to accommodate the growing population.
Mali’s fertility rate fell from 7.1 children per woman in 1987 to 6.3 in 2018, and further to 5.5 children per woman in 2022. Despite this decline, it remains the fourth-highest rate in the world. Several factors contribute to this, including the widespread occurrence of early childbearing, limited levels of women's education and empowerment, persistent poverty, reliance on informal and subsistence lifestyles, low urbanisation and extremely limited family planning. As a result of this high fertility rate, 46.2% of Malians were below the age of 15 years in 2023 while 51.1% were in the age group 15–64 years (working age) and 2.6% were 65 years and older. Comparing this with the structure in the 1990s reveals that Mali’s population structure has not fundamentally changed over the past three decades. The high dependency ratio significantly affects the government's ability to generate the necessary revenue for development, as there are fewer individuals in the working-age population. On a household level, families with more dependants can typically save less, which reduces overall domestic savings. This, in turn, limits the capital available for investment, impeding economic growth.
Mali has the 7th-largest youth bulge (the ratio of its population aged between 15 and 29 to the total adult population) in Africa and the second highest in West Africa, after Niger. The country’s youth bulge stood at about 50.8% in 2023 — a rise from 47.2% in 1990 and above the average of 45.3% for Africa and 47.5% for West Africa. Likewise, the median age for Mali in 2023 was 16.6 years — a slight increase from 15.4 years recorded in 1990 and lower than West Africa and Africa’s median ages of 18.8 and 20.6 years, respectively. This makes Mali the country with the second-lowest median age in West Africa after Niger and 5th lowest in Africa after Niger, Central African Republic, Somalia and Chad.
The large youth population in Mali presents both opportunities and challenges. On one hand, it can lead to youth activism and drive positive political change in the country. On the other hand, if the needs of the youth are not adequately addressed, it can increase the risk of criminal violence, conflict and instability. A major concern is the rising youth unemployment and underemployment, as the government struggles to provide employment for the growing youth population. For example, youth unemployment in Bamako is 32%, well above the national average of 12%. With over 300 000 young Malians entering the labour market each year, the security crisis could worsen if sufficient job opportunities are not created. However, the country can harness the potential of its youthful population by making substantial investments in education and training, equipping young people with the skills they need, and creating opportunities through both government initiatives and private sector involvement.
The structure of Mali’s population will not change much across the forecast horizon to 2043. Although the country’s population growth rate will decline to 3.0% in 2030 and 2.4% by 2043, the total population will rise to 29.2 million in 2030 and double to 41.5 million by 2043 on the Current Path. By then, the median age will increase to 17.8 years in 2030 and 20.3 years in 2043, while the youth bulge will rise to 51.3% in 2030 before eventually declining to 46.3% by 2043. The proportion of people under the age of 15 will slightly decline to 43.3% in 2030 and 39.1% in 2043. Consequently, the share of the working-age population and the population aged 65 and older will increase to 54.0% and 2.7% in 2030 and 57.4% and 3.5%, respectively, by 2043. Despite these shifts, the rapid population growth will continue to place pressure on development and limit improvements in average income, as the government will face significant challenges in addressing the needs of its rapidly expanding, youthful population.
Chart 3 presents a population distribution map for 2023.
Spanning 1.24 million km2, Mali is the eighth-largest country in Africa, comparable to the sizes of Angola and South Africa. This, coupled with its small total population makes it technically one of the most sparsely populated countries in Africa. In 2023, Mali was the most sparsely populated country in West Africa and the 11th most sparsely populated country in Africa. Mali's population density is estimated to be about 0.2 people per hectare, which is about 2.5 times lower than the average of 0.5 people per hectare for Africa and 4 times lower than West Africa’s average of 0.88 people per hectare.
The majority of Malians live in the less arid southern half of the country, which is more suitable for agriculture thanks to the Niger River and is home to nearly all of Mali’s sizable cities. This includes cities like Sikasso with over 445 000 people, Mopti with 200 000 people and Koutiala with over 160 000 people. Conversely, the north of the country has faced continuous depopulation fuelled by desertification, insecurity, instability and the attraction of urban life in the south.
In the Current Path, Mali’s population density will reach 0.24 people per hectare, less than half the average of 0.60 for Africa in 2030. By 2043, this will increase to 0.34 people per hectare, although that will still be significantly lower than the average of 0.78 and 1.4 people per hectare for Africa and West Africa, respectively.
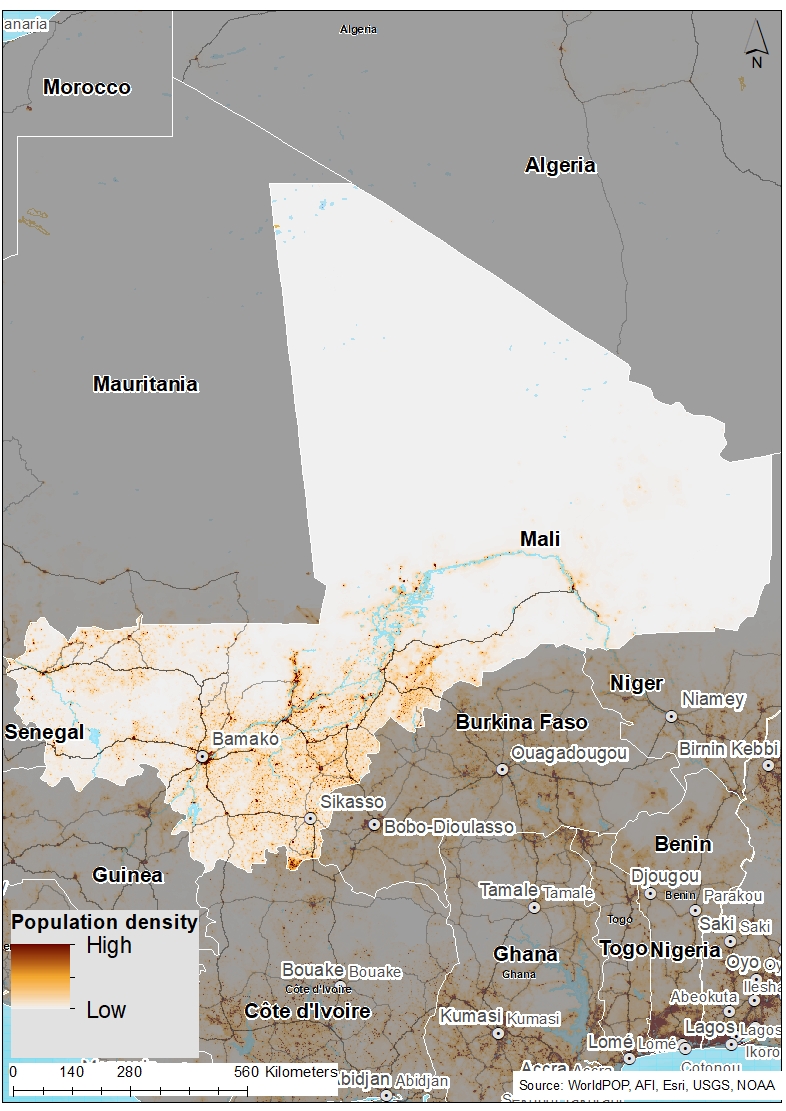
Chart 4 presents the urban and rural population in the Current Path, from 1990 to 2043.
Mali’s population is predominantly rural. In 1990, over two-thirds of Malians lived in rural areas — slightly below the average for low-income countries in Africa. However, Mali has urbanised more rapidly than its income peer group in Africa over the years. As a result, by 2023, 13.0 million Malians, equivalent to 54.8% of the population, lived in rural areas. This was below the 67.4% average of low-income countries in Africa. Consequently, the urban population stood at 45.2% in 2023, making Mali the ninth most urbanised country among low-income African countries, instead of the 13th in 1990.
Urban growth is the result of population increases of people already living in urban areas as well as rural-urban migration. In the case of Mali, rural-to-urban migration is a significant driver of urbanisation. Many rural residents are moving to urban areas in search of better employment opportunities, improved housing and access to essential services such as healthcare, security and education. Bamako, the capital city, is the largest urban centre with over three million inhabitants and is considered one of Africa’s fastest-growing cities. Other factors influencing urbanisation in Mali include the commercialisation and transformation of agriculture. As the economy shifts from subsistence farming to commercial agriculture, there is a growing demand for labour in urban areas like Koulikoro, particularly in agro-industries and processing plants, which further encourages rural residents to migrate to cities.
On the Current Path, Mali will achieve parity in urban-rural settlement by 2030; and by 2043, 24.0 million Malians, constituting almost 57.8% of the population, will live in urban areas. This will be far above the average of 41.4% projected for low-income countries in Africa.
The rapid urbanisation in Mali, particularly in Bamako, has several significant implications. It places considerable strain on public infrastructure, resulting in overcrowded roads, inadequate public transportation and limited access to essential services like healthcare and education. The growing urban population can also lead to increased demand for housing, driving up housing costs and contributing to the development of slums with poor living conditions. Additionally, rapid urbanisation raises environmental concerns, including heightened pollution in urban areas. It thus requires careful planning and investment in sustainable development to ensure positive outcomes.
Chart 5 presents GDP in market exchange rates (MER) and growth rate in the Current Path, from 1990 to 2043.
The Malian economy is the fifth largest in West Africa (after Nigeria, Ghana, Côte d'Ivoire and Senegal) and among the low-income countries in Africa (after Ethiopia, Sudan, DR Congo and Uganda). Its GDP measured in market exchange rates (MER) more than quadrupled from US$4.5 billion in 1990 to US$18.6 billion in 2023. Within this period (between 1990 and 2023), Mali’s GDP grew at an average of 4.3% per annum, above the average of 3.9% for low-income countries in Africa. The relatively stronger performance compared to its income peers can be attributed to rapid population growth in addition to the implementation of several medium-term plans, such as the Strategic Plan for Economic Recovery and Sustainable Development (CREDD 2019-2023). Additionally, various internationally supported economic reform programs have contributed by promoting economic development and improving quality of life. These include initiatives like the Structural Adjustment Programmes, the Aid Effectiveness, the Highly Indebted Poor Country (HIPC) initiative, the Poverty Reduction Strategies, the Millennium Development Goals (MDGs), the Sustainable Development Goals (SDGs), and the African Union Agenda 2063.
Despite this relatively strong performance above its income peers, the fundamentals of the Malian economy remain weak and the economic structure is still agrarian and untransformed. Mali’s economy is centred on the export of traditional raw materials such as cotton and gold, while much of its processed and finished goods are imported. Efforts to promote more value-added industrialisation remain at an early stage. For instance, in 2020, gold accounted for 82.9% and cotton for 6.7% of exports. The implication of this is that economic growth is highly volatile and mainly driven by weather patterns, international commodity price fluctuations and external shocks. For instance, its exceptional growth of 15% in 2001 was largely driven by the global commodity boom or supercycle in the early 2000s (1999 to 2001) due to high demands from then-emerging economies like China. Similarly, the country’s strong economic growth in recent years, averaging about 5.7% from 2014 to 2019 before COVID-19 has mainly been driven by the large commodity exports of gold and agriculture (mainly cotton) within the period.
On the other hand, in periods where the country had experienced severe drought such as in the early 2000s and in 2010/2011, the economy contracted. For instance, the negative growth rate of 0.8% recorded in 2012 was due to the severe drought in previous years. Aside from this, global or external shocks also significantly worsen domestic vulnerability and lead to adverse economic conditions. Key among them is the 2007 global financial crisis which caused economic growth to dip in those years. In recent years, Mali’s economic growth was further disrupted by the COVID-19 pandemic in 2020. The restrictive measures and protocols instituted to control the virus curtailed economic activities, resulting in the GDP shrinking by 1.2% in 2020 — the largest drop since 1992. The economic contraction was accentuated by political instability in the country arising from the 2020 coup. However, the GDP recovered and grew by 3.1% in 2021, mainly due to the recovery of the services and agriculture sectors. GDP growth dropped to 1.8% in 2022 as a result of the combined effect of ECOWAS sanctions, high food inflation and parasite infestations affecting cotton production as well as the negative impact of the Russian invasion of Ukraine on commodity prices. Such volatility in economic growth further hinders development, job creation and poverty reduction.
Annual inflation reached an all-time high of 13.9% in August 2022, mainly driven by high food inflation. This was due to the displacement of farmers arising from the persistent insecurity, ECOWAS sanctions and increased global food prices. Huge public spending is also resulting in a large fiscal deficit and public debt largely financed by external borrowing. Public debt stood at about 55.9% of GDP by the end of 2023, with external debt constituting about 25.9% of total debt in 2022. This is 37.3% larger than the 40.7% recorded in 2019 prior to COVID-19. The increase in expenditure within this period is accounted for by the large COVID-19 expenditure, high wage bills and security spending.
Regardless, the economy has began to show signs of recovery, with economic growth in 2024 estimated at 3.5% and annual average inflation estimated at 2.1% in the same period.
To build a resilient economy, Mali needs to address its structural long-term economic vulnerabilities. These include its undiversified export basket dominated by gold and cotton, which exposes the economy to commodity price and climatic shocks, rising foreign debt and a large informal sector. Also, over-reliance on the agriculture sector, in addition to its low-productivity informal service sector and a limited manufacturing sector concentrated in agro-industries and cotton ginning, remains a structural weakness in the economy.
However, in the medium term, insecurity and the ongoing political transition present potential risks to the economy, as the military has yet to transfer power to civilian rule and restore the country to multiparty democracy and constitutional governance. This is particularly important given that the country’s recurring insecurity and political instability have historically worsened economic conditions. Also, an ECOWAS withdrawal that is not properly negotiated could disrupt the free movement of goods and people and thereby trade with non-WAEMU countries (Nigeria, Ghana and Sierra Leone, for example).
With the removal of the ECOWAS sanctions in July 2022, the economy is expected to bounce back as Mali still has strong growth potential. The country faces an optimistic future with economic growth projected to rebound to 4.0% in 2024 and 4.9% by 2026. Inflation is projected to fall to 1.2% due to reduced import costs and increased agricultural production. The government now faces the difficult job of reviving its economic growth record and translating such gains into poverty and inequality reductions as well as addressing long-term development needs. Achieving sustainable development requires Mali to build a resilient economy that is less dependent on external volatility or shocks, particularly the global commodity cycle.
On the Current Path, Mali’s GDP will reach US$25.8 billion and 2030 and more than triple to US$53.0 billion by 2043. The average growth rate within this period is estimated at 5.4%, meaning that the economy of Mali has the potential to grow quicker than it has in the past, although its high population growth will impede income growth. In the long term, the country needs to rethink its economic development strategy to focus on economic diversification and value-addition to its main commodities. Its huge natural resource deposits, together with its agricultural and renewable energy potential, are opportunities that can be used to grow and transform the economy.
Chart 6 presents the size of the informal economy as per cent of GDP and per cent of total labour (non-agriculture), from 2020 to 2043. The data in our modelling are largely estimates and therefore may differ from other sources.
The informal sector serves as a lifeline to many people, especially unskilled labourers, who cannot secure employment in the formal sector. According to the International Labour Organization (ILO), informal employment is often associated with income insecurity, unsafe work conditions, and limited access to the rights and benefits accorded to the formal sector. The lack of workplace safeguards can impact workforce participation rates and limit the contribution to the economy by lower-waged workers.
The informal sector in Mali, like in many African countries, is large, serving as a source of livelihood for the majority of the population, especially women and young people. Informal enterprises in Mali are typically small-scale businesses, including artisans, shopkeepers and service providers, which are often unregistered and lack access to formal credit and markets. The sector offers a more flexible entry point for individuals, allowing them to engage in economic activities without the formal requirements of registration and taxation.
According to the ILO, 73% of the economically active population in Mali works in the informal sector, with about one-third of these workers being young people between the ages of 15 and 35 years. Women, also account for 79.6% of non-agricultural employment, compared to 62.9% for men. In 2023, about 81.5% of total labour in Mali works in the informal sector, making it the fifth largest among the low-income countries in Africa. A significant proportion of informal workers are employed in the agriculture sector. In the Current Path, the proportion of informal labour share will decline to 78.4% in 2030 and 72.1% in 2043 far above the average for its income peers in Africa.
Over the years, the share of the informal sector to GDP has grown rapidly compared to the formal sector. The contribution of the informal sector to total value added by the service sector increased from less than 40% in 1980 to over 60% in 2015. It currently contributes about 98% of all value added in the primary sector, mainly agriculture. In 2023, the size of the informal sector in Mali was approximately 33% of GDP above the average of 29.3% for its income peers in Africa. Despite this large contribution to GDP, the informal sector in Mali faces numerous challenges that hinder the growth of businesses in the sector. Many businesses are reluctant to transition to the formal economy due to the complexity, cost and burdensome compliance with tax regulations and bureaucratic procedures. Additionally, many informal workers lack formal education or business training, which limits their productivity and makes it difficult for them to move into formal employment. Poor infrastructure further hampers business operations, creating obstacles for informal enterprises to thrive or expand.
As part of efforts to address these challenges, Mali has introduced a new registration system for micro and small enterprises to streamline the transition of informal workers into the formal economy. Additionally, initiatives like the National Fund for Youth Employment aim to integrate young workers into the labour market through targeted programs that provide training and support. Efforts are also being made to improve access to credit for informal businesses, which could encourage them to formalise their operations if they see clear benefits. Furthermore, programmes focusing on enhancing skills development among informal workers, particularly through vocational training that meets market demands, are essential for improving employability and productivity.
In the Current Path, the size of the informal sector will decline slightly to 31.8% of GDP in 2030 and 29.3% of GDP by 2043.
While the large informal sector in Mali provides employment and income opportunities, particularly for the poor and vulnerable, its activities can also hinder economic growth. The widespread informality deprives the government of essential revenue, as many businesses in this sector do not pay taxes. Most individuals employed in the informal sector are in vulnerable positions, lacking job security and social protection (such as pensions and health insurance), and often receiving lower wages. Given these challenges, it is in the country’s best interest for the government to implement incentives that encourage businesses in the informal sector to formalise their operations. This can be achieved through measures such as tax education, tax incentives, simplified business registration requirements, and creating a more enabling business regulatory environment.
Chart 7 presents GDP per capita in the Current Path, from 1990 to 2043, compared with the average for the Africa income group.
Despite its limitations, GDP per capita is generally used to measure the standard of living and is the most widely used and accepted indicator to compare welfare among countries. Using the purchasing power parity (PPP) measure for this analysis, Mali’s GDP per capita of US$2 127 in 2023 is the sixth-highest GDP per capita among the low-income countries in Africa, and it is 17% higher than the group average of US$1 814 for low-income countries in Africa. This figure represents a tremendous improvement of about 59.1% from the US$1 337 it recorded in 1990 when it was the eighth highest among the low-income countries group in Africa. However, this growth is insufficient to drive a faster transformation in livelihoods. The slow pace of GDP per capita growth is primarily attributed to high population growth, which hampers progress in reducing poverty and improving human development indicators.
By 2030, Mali’s GDP per capita will rise to US$2 320 above the average of US$2 084 for low-income countries in Africa. In the long run, Mali will lose ground on its income-group peers as GDP per capita will reach US$3 059 by 2043, placing it eleventh among low-income African countries. At this rate, the country’s GDP per capita will be slightly higher than the average of US$2 986 for its income-group peers in Africa.
Slower growth in GDP per capita can have several implications. First, it can lead to slower poverty reduction and limited improvements in living standards in Mali. Additionally, slow GDP per capita growth may imply that the benefits of economic growth are not evenly distributed or broadly shared which can worsen inequality in the country. It may also constrain government revenue, limiting the ability to invest in critical areas such as education, healthcare and infrastructure.
Chart 8 presents the rate and numbers of extremely poor people in the Current Path from 2020 to 2043.
In 2022, the World Bank updated the poverty lines to 2017 constant dollar values as follows:
- The previous US$1.90 extreme poverty line is now set at US$2.15, also for use with low-income countries.
- US$3.20 for lower-middle-income countries, now US$3.65 in 2017 values.
- US$5.50 for upper-middle-income countries, now US$6.85 in 2017 values.
- US$22.70 for high-income countries. The Bank has not yet announced the new poverty line in 2017 US$ prices for high-income countries.
Like many low-income countries in Africa, poverty in Mali is widespread. As a low-income country, Mali uses the US$2.15 benchmark for extreme poverty. In 1990, 7.9 million Malians, representing 86.3% of the population, lived below the poverty line of US$2.15, far above the average of 66.6% for low-income countries in Africa. Over the past three decades, the country’s effort at poverty eradication has yielded some results as the poverty rate declined to 14.2% in 2023 — far below the average of 41.5% for low-income countries in Africa — but still corresponds to 3.4 million Malians living below the poverty line of US$2.15 in 2023.
Efforts to combat poverty in Mali have been diverse, encompassing national strategies, international collaborations and community-level initiatives. The Malian government has developed several Poverty Reduction Strategy Papers (PRSPs) to guide its poverty alleviation efforts, with the most recent one focusing on increasing public spending on programmes aimed at reducing poverty and improving access to essential services such as education and healthcare as long-term solutions to poverty. Additionally, since the early 1990s, Mali has implemented governance reforms to decentralise administration, allowing local governments to take a more active role in addressing poverty. This approach empowers communities to identify specific needs and develop context-sensitive solutions.
Mali has also forged partnerships with international organisations such as the World Bank and the IMF, securing funding and technical support for poverty reduction initiatives, which are vital for sustainable development. Furthermore, collaborations with organisations such as the United States Agency for International Development (USAID) have focussed on improving youth social and economic behaviours, increasing agricultural productivity and fostering community-based organisations, creating synergies across the health, education and economic sectors. Access to microfinance is another key initiative aimed at empowering poor families, enabling them to invest in small businesses and improve their livelihoods. This provides a crucial safety net during periods of economic hardship.
Despite these efforts, Mali faces significant challenges in poverty alleviation as poverty still persists. To appreciate the full incidence of poverty, one must look beyond monetary poverty as it only tells part of the story. The Human Development Index (HDI), which measures the average achievement of countries in three main areas: health, knowledge and standard of living, is one such measure. Mali’s HDI score of 0.410 in 2022 ranks 188 out of 193 countries globally, constituting a drop compared to the 0.434 it recorded in 2019. The global Multidimensional Poverty Index (MPI) also measures acute multidimensional poverty by measuring each person’s overlapping deprivations across 10 indicators in three equally weighted dimensions: health, education and standard of living.
The MPI complements the international US$2.15 a day poverty rate by identifying who is multidimensionally poor and also shows the composition of multidimensional poverty. The headcount or incidence of multidimensional poverty is often several percentage points higher than that of monetary poverty. This implies that individuals living above the monetary poverty line may still suffer deprivations in health, education and/or standard of living. According to the 2023 UNDP Multimensional Poverty Index, about 68.3% of Malians were considered to be multidimensionally poor with an intensity of deprivation estimated to be 55%. An extra 15.3% of the population was considered to be vulnerable to multidimensional poverty. Aside from these, inequality is also prevalent in Mali with more poor people in the rural areas. Also, about 90% of the poor people in the country are concentrated in the densely populated areas of the southern part of Mali.
The cause of poverty in Mali is multifaceted. It includes lack of education, poor governance, malnutrition and widespread conflict due to terrorism and political instability. Also, the ypically large family size (average household size in 2019 was 8.2 people), coupled with increased drought, food shocks and outdated agricultural practices, has severely raised the cost of living in the country. In recent years, the effect of the COVID-19 pandemic in addition to the security crisis has increased poverty levels particularly from 2020 to 2022. These issues intensify pressure on resources and public services, hindering effective poverty reduction.
On the Current Path, Mali’s progress in reducing poverty rates will be slower so that by 2030, 10.9% of the population, equivalent to 3.2 million people will be living in extreme poverty. This means that Mali will require significant policy shifts in order to meet SDG 1, of eliminating extreme poverty. Projections indicate that by 2043, Mali is still likely to fall short of achieving SDG 1, with an estimated 5.6% of the population expected to remain below the international extreme poverty threshold of US$2.15 per day.
The eight sectoral scenarios as well as their relationship to the Current Path and the Combined scenario are explained in the About Page. Chart 9 summarises the approach.
Chart 10 presents the mortality distribution in the Current Path for 2023 and 2043.
The Demographics and Health scenario envisions ambitious improvements in child and maternal mortality rates, enhanced access to family planning, and decreased mortality from communicable diseases (e.g., AIDS, diarrhoea, malaria, respiratory infections) and non-communicable diseases (e.g., diabetes), alongside advancements in safe water access and sanitation. This scenario assumes a swift demographic transition supported by heightened investments in health and water, sanitation, and hygiene (WaSH) infrastructure.
Visit the themes on Demographics and Health/WaSH for more detail on the scenario structure and interventions.
Mali's health sector has made significant progress in recent years, although several challenges remain. For instance, expanding the healthcare infrastructure and placing medical personnel in rural regions have increased access to high-quality healthcare services in Mali. The Malian National Statistics Office (INSTAT) and ICF (2019) report notes improvements in maternal and child health outcomes, including decreased maternal mortality rates and increased vaccine coverage. A 2020 World Health Organization study emphasised the need to strengthen disease surveillance and response systems to effectively manage and prevent outbreaks. It also stressed the importance of improving healthcare infrastructure, expanding access to hygienic conditions, and ensuring clean water to prevent the spread of infectious diseases.
The country faces various health challenges due to its inadequate healthcare infrastructure, however. Malnutrition, exacerbated by the security crisis, is widespread, particularly among children, with around 21% of children under five years old classified as underweight. Mali's infant, child and maternal mortality rates continue to be among the highest in sub-Saharan Africa. This is mainly due to the poor availability and uptake of family planning in the country, early childbearing, high rates of female genital mutilation, infrequent use of skilled birth attendants and a paucity of emergency obstetrical and neonatal care. Furthermore, the country also has one of the lowest densities of healthcare workers, especially in the rural areas, limiting its capacity to provide essential health services. Like many African countries, Mali has historically experienced high mortality rates from communicable diseases. Persistent challenges include high maternal and child mortality, the world’s highest adolescent fertility rate, low child immunisation coverage and widespread malnutrition. The country also faces a significant burden from infectious diseases such as tuberculosis, malaria and diarrhoea, while the prevalence of non-communicable diseases is on the rise which are typically more expensive to treat.
Our modelling uses the International Classification of Disease (ICD) to differentiate between three broad categories of diseases: communicable, non-communicable and injuries, as well as 15 subcategories of mortality and morbidity. In 1990, communicable diseases caused about 121 000 deaths — representing about 75% of total deaths in that year. This was followed by non-communicable diseases that caused 32 600 deaths (20.2% of total deaths) and injuries that caused 7 710 deaths (4.8% of total deaths). By 2023, deaths from communicable diseases had steadily declined to 127 360, although this was still 64.4% of all deaths. Deaths from non-communicable diseases and injuries rose to 55 500 (equivalent to 28.1% of all deaths) and 14 800 (equivalent to 7.5% of all deaths), respectively. According to the WHO, the leading causes of death in Mali include malaria, lower respiratory infections, diarrhoeal diseases, preterm birth complications, birth asphyxia and birth trauma, stroke and Ischaemic heart disease. Indeed, malaria alone caused 88 500 deaths in 2021 followed by lower respiratory infections with 83 800 deaths.
On the Current Path, this trajectory will continue till about 2039 when Mali is projected to achieve its epidemiological transition: the point where deaths from non-communicable diseases outweigh deaths from communicable diseases. By 2043, non-communicable diseases will be the highest cause of death in Mali causing 98 750 deaths in the country (about 49.5% of all deaths). The transition to deaths from non-communicable diseases as the main cause of mortality will inevitably increase health sector costs as they are more expensive to treat. By then, deaths from communicable diseases will rapidly decline to 75 980, constituting 38.1% of all deaths, while deaths from injuries will constitute the remaining 12.4%.
Access to improved, safe and treated water, such as piped water, and proper sanitation is crucial in preventing the spread of communicable diseases. Poor water sources and inadequate sanitation are linked to diseases such as diarrhoea, which disproportionately affect children. It is estimated that over 20% of deaths in Mali are attributed to poor water, sanitation and hygiene (WASH) conditions. Many wells remain uncovered and untreated, posing contamination and health risks.
Mali has implemented various initiatives to ensure access to hygienic facilities and clean water, particularly in urban areas. Organisations like World Vision are actively working to address Mali’s water and sanitation challenges. Their efforts include drilling new boreholes to ensure reliable access to clean water, conducting community programs that raise awareness about good hygiene practices. Despite these efforts, Mali continues to face significant challenges in water supply and sanitation due to the uneven distribution of water resources across the country, making access difficult, particularly for rural populations. This situation negatively impacts public health, especially among vulnerable groups such as children.
Mali has made significant advancements towards the attainment of SDG 6.1 of universal access to safe drinking water. In 2023, 20.7 million Malians (constituting 86.9% of the population) had access to improved water supply. Out of this, 12.1 million people (about 50.8% of the population) had access to a piped water supply in the country. On the Current Path, Mali’s progress will lag as the population with access to improved water will be 87.1% in 2030, meaning that the country will miss the SDG target in this area. By 2043, access to improved water will increase to about 90.5%, of which piped water will constitute almost 55% of connections.
Regarding sanitation, about 5.9 million Malians (47.9% of the population) had access to improved sanitation in 2023, twice the average for its income-group peers in Africa. At 16.7%, the share of the population with access to shared sanitation is slightly above the average of Africa’s low-income group of 15.%. This means that more than one-third of the Malians resort to unimproved sanitation including inadequate waste management and the absence of proper toilet facilities, which poses major health and environmental risk to the country. On the Current Path, the proportion of the population with improved access to sanitation will rise to 50.3% in 2030 and 60.1% by 2043. This means that Mali will lag behind in achieving SDG target 6.2 of ensuring access to adequate and equitable sanitation and hygiene for all and an end to open defecation. Consequently, the share of the population with unimproved sanitation access will fall to 32.9% in 2030 and 24.4% in 2043 while the use of shared sanitation will constitute 16.8% of the population in 2030 and 15.5% by 2043.
Chart 11 presents the infant mortality rate in the Current Path and in the Demographics and Health scenario, from 2020 to 2043.
The infant mortality rate refers to the probability that a child born in a specific year will not survive to their first birthday. It measures the child-born survival rate and reflects the social, economic and environmental conditions in which children live, including their health care. It is measured as the number of infant deaths per 1 000 live births and is an important marker of the overall quality of the health system in a country.
In 2023, the infant mortality rate in Mali was 64.1 deaths per 1 000 live births — a drop by more than half of the rate in 1990. However, this was 47.6% higher than the average of 43.4 deaths for low-income countries in Africa. The major causes of infant mortality in Mali include preterm birth which constitutes 30% of all deaths, neonatal asphyxia constitutes 28% of deaths and sepsis/tetanus constitutes 21% of deaths. Other causes include acute respiratory infections and congenital anomalies.
There is a disparity in infant mortality in Mali as babies born in rural areas and poorer households are less likely to survive. For instance, the UNICEF estimates show that Mali records 38 deaths per 1 000 live births for babies born in rural areas compared to 27 deaths per 1 000 live births for babies born in urban centres. Similarly, poorer households record 39 deaths per 1 000 live births of babies compared to richer households that record 30 deaths. The disparity largely reflects access to improved healthcare services for richer and urban households which are usually not available to poorer and rural households. Another important factor explaining the disparity in infant mortality is the educational attainment of the mother. Estimates show that children born to less educated mothers in Mali are 2.1 times less likely to survive during their first month compared to those born to educated mothers. This highlights the urgent need for Mali to invest in girls' education to help reduce these preventable deaths.
On the Current Path, the infant mortality rate will decline further, reaching 47.8 and 28.6 deaths per 1 000 live births by 2030 and 2043, respectively. It means that Mali will fall short of achieving the SDG target of 12 deaths per 1 000 live births even by 2043 and is only lieklety to achieve this by 2066 in the Current Path.
The Demographics and Health scenario will reduce Mali’s infant mortality rate to 41 deaths per 1 000 births in 2030 and 21.5 deaths per 1 000 births by 2043. This is seven deaths fewer than in the Current Path and two fewer deaths than the Current Path average of low-income countries in Africa in 2043. Although this does not meet the SDG target, it pushes Mali close to the SDG target emphasising the need for the country to invest in access to improve healthcare service.
Chart 12 presents the demographic dividend in the Current Path and in the Demographics and Health scenario, from 2020 to 2043.
The dividend is the window of economic growth opportunity that opens when the ratio of working-age persons to dependents increases to 1.7 to 1 and higher.
We explain the different conceptualisations relating to a demographic dividend in a separate theme.
The demographic dividend is the economic growth generated by changes in the population structure. It generally materialises when the ratio of the working-age population to dependants is at least 1.7 to one, meaning that for every dependant, there are 1.7 persons of working age. When there are fewer dependants to take care of, it frees up resources for investment in both physical and human capital formation. Studies have shown that about one-third of economic growth during the East Asia economic ‘miracle’ can be attributed to the large worker bulge and a relatively small number of dependants. However, the growth in the working-age population relative to dependants does not automatically translate into rapid economic growth unless the labour force acquires the needed skills and is absorbed by the labour market. Without sufficient education and employment generation to successfully harness their productive power, the growing labour force (especially those in urban areas) could increasingly become frustrated with the lack of job opportunities leading to social tension and even the emergence of civil instability.
In 2023, the ratio of the working-age population to dependants in Mali was one to one, which means that on average, for every dependant in Mali, there was only one person of working age (15–64 years of age). This is lower than the 1.2 to one average for low-income countries in Africa. The high dependency rate in Mali can be attributed to the high fertility rate as discussed previously. On the Current Path, Mali will likely not achieve the minimum ratio of 1.7 working-age persons for each dependant required for the materialisation of the demographic dividend, or demographic gift, even by 2043. Indeed, based on the Current Path, Mali is likely only to achieve this minimum ratio by 2059.
The Demographics and Health scenario pushes the country close to this target such that by 2043, the ratio of the working-age population to dependants will be 1.5 to one in the scenario instead of the 1.3 to one as in the Current Path (on par with the average for its income-group peers in Africa by 2043). This underscores the importance of investing in education and expanding decent opportunities for Mali’s growing population, to ensure that demographic trends contribute positively to inclusive and sustained growth.
Chart 13 presents crop production and demand in the Current Path from 1990 to 2043.
The Agriculture scenario envisions an agricultural revolution that ensures food security through ambitious yet feasible increases in yields per hectare, thanks to improved management, seed, fertiliser technology, and expanded irrigation and equipped land. Efforts to reduce food loss and waste are emphasised, with increased calorie consumption as an indicator of self-sufficiency and prioritising it over food exports. Additionally, enhanced forest protection signifies a commitment to sustainable land use practices.
Visit the theme on Agriculture for our conceptualisation and details on the scenario structure and interventions.
Mali has ideal circumstances for agricultural development as it has a sizable area of arable land and an abundance of water supplies from the Niger and Senegal rivers. Agriculture and agro-pastoralism are the main economic pillars of Mali: nearly 80% of Malians work in the agriculture sector. According to the International Trade Administration (ITA), the Malian government dedicates about 12% of its national budget to the agricultural sector and subsidises cotton. Cotton is one of Mali's essential agricultural products, accounting for a significant portion of its exports. Other agricultural commodities, such as rice, corn, millet, sorghum and wheat, make up the majority of Mali's agricultural output.
Over the years, the government has made efforts to improve agricultural productivity by encouraging foreign and national private investors to undertake agricultural activities in the lands of the Office du Niger (an irrigation scheme). In addition, the government has been investing in irrigation infrastructure, aiming to enhance water accessibility and to minimise the impact of climate change. Government and NGO training programmes and extension services connect farmers to contemporary agricultural methods, enhanced seed varieties, effective water management strategies and financial access. Also, through funding, rural infrastructure and fostering integration with regional and global markets, efforts are being undertaken to increase market access.
Nonetheless, the sector is confronted with numerous challenges. Although the country has important and underexploited agricultural potential, especially in the southern and central regions, climate change and vulnerability to droughts and desertification pose significant threats to agricultural productivity and food security. The sector's potential for growth is also hampered by a lack of infrastructure, including storage facilities, irrigation systems and transportation, making it difficult for farmers to access markets and avoid post-harvest losses. Furthermore, traditional farming practices and a lack of access to modern technology and high-quality inputs like seeds and fertiliser continue to result in low output.
In 1990, Mali’s average crop yield of 1.7 metric tons per hectare was 36% higher than the average of 1.3 tons for its income-group peers in Africa. However, by 1996, the average yield per hectare in Mali had fallen below its income-group peers in Africa. The decline can be attributed to changing weather patterns, especially since agriculture production in the country is rainfed and, thus, susceptible to climate change. This trend continued except for 2016 and 2017 when Mali overtook its income-group peers in Africa. By 2023, the average crop yield per hectare of 2.6 metric tons in Mali was 8.9% lower than the average of low-income countries in Africa. This ranks Mali 13th in the low-income group but equates to less than half the yield per hectare in Rwanda and Malawi. On the Current Path, yield per hectare will rise to 2.9 and 4 metric tons per hectare by 2030 and 2043 respectively—still below the average of low-income African countries.
Total agriculture production[1The data on agricultural production and demand in the IFs forecasting platform initialises from data provided on food balances by the Food and Agriculture Organization (FAO). IFs contains data on numerous types of agriculture but aggregate its forecast into crops, meat and fish, presented in million metric tons.] in 1990 stood at about 4 million metric tons. Of this, 3.3 million metric tons, representing 82.5%, were crops, with the remainder constituting meat production. By 2023, total agricultural production had grown to 21.7 million metric tons. Of this, crop production constituted about 93%, equivalent to 20.2 million metric tons, meat production 6.5%, and fish production constituted the remainder of the total production. Mali faces also huge agriculture loss and waste estimated at 30.3% of total production. This is largely due to post-harvest losses for crops, estimated at 10.3% of production. Such losses are a result of pest and disease infections, spoilage and the lack of adequate and effective storage facilities. Transmission losses for crops, which are mainly due to poor transportation networks also accounts for 16.6% of production.
In terms of demand, the total demand for agricultural products in Mali has always been more than the total production. Total demand stood at about 4.5 million metric tons in 1990, of which 3.7 million metric tons, equivalent to 83% of total demand, were for crops. The remaining demand was for meat (685 000 tons) and for fish (73 000 tons). Comparing this to the total production (about 4 million metric tons) in the same year reveals that Mali had excess demand for agricultural products in that year of about 490 450 metric tons. Since then, domestic demand has rapidly outgrown production, and by 2023, agricultural demand exceeded domestic production by 1.2 million metric tons, despite the increase in production. Of the total demand of 22.9 million tons, 92.4% is for crops (21.2 million tons). The remaining demand is mainly for meat (1.5 million tons), and the lowest demand is for fish (240 000 tons).
Despite the projected increase in domestic production, reaching 25.9 million metric tons in 2030 and 33.3 million metric tons in 2043, it will not be enough to meet domestic demand that will rapidly grow to 29.2 million metric tons and 37.6 million metric tons in the same period, respectively. As a result, excess demand for agricultural products will reach 3.2 million metric tons in 2030 and 10.4 million by 2043. This highlights the need for strengthened efforts to enhance domestic agricultural production, as Mali may face growing pressure on food security in the future if current trends continue. The World Bank estimates that about 1.4 million people faced severe food insecurity between June and August 2024. Notwithstanding this expected rising food insecurity, many agricultural subsectors, including biofuels, shea butter, mangoes, peanuts and cashews, are still entirely untapped and present a unique opportunity for investors. Modernising Mali's poultry and cattle production and transformation industries also serve as potential avenues for improvement and growth.
Chart 14 presents the import dependence in the Current Path and the Agriculture scenario, from 2020 to 2043.
With total agricultural demand outgrowing domestic production, Mali is likely to rely on imports to meet its domestic demand. In 2023, Mali’s net import of crops stood at 1.4% of total crop demand, which was less than the average of 9.1% for low-income countries in Africa. In the Current Path, net crop imports will grow rapidly in Mali to 14.8% and 26.2% of total crop demand by 2030 and 2043, respectively. This suggests a growing level of national food insecurity; however, it can also be as a result of changes in dietary preferences among Malians.
In the Agriculture scenario, yield per hectare will increase to 5.4 metric tons by 2043 — a 35% improvement compared to the projections of the Current Path and the average of low-income countries in Africa. The improvement in yields will lead to an improvement in total agricultural production. In the Agriculture scenario, total crop production will increase to 26.2 million tons, almost 2.5 million metric tons, or 10.5%, more than the Current Path by 2043. By 2043, crop production in Mali will rise by 32.2% over the Current Path to 38.6 million tons in the Agriculture scenario by 2043. The projected increases in crop production in the Agriculture scenario reduce the import dependency of crops in the country compared to the Current Path. By 2030, the net import of crops will decline to 10.2 in the Agriculture scenario instead of 14.8% in the Current Path. This reduction in import dependence will continue so that by 2043 net crop import will be 3.4% of total demand far below the projected Current Path average of 26.2%. This implies that Mali has the potential to reduce its food import and become food-sufficient if significant steps are taken to revamp the agricultural sector.
Efforts towards improving yield per hectare such as the adoption of modern technology, improved seed, fertiliser and expanded irrigation facilities as well as provision of storage facilities can improve agriculture potential of the country.
Chart 15 depicts the progress through the educational system in the Current Path, for 2023 and 2043.
The Education scenario represents reasonable but ambitious improvements in intake, transition, and graduation rates from primary to tertiary levels and better quality of education at primary and secondary levels. It also models substantive progress towards gender parity at all levels, additional vocational training at the secondary school level, and increases in the share of science and engineering graduates.
Visit the theme on Education for our conceptualisation and details on the scenario structure and interventions.
Mali has a 6-3-3 education system, which consists of six years of elementary education, three years of lower-secondary school and three years of upper-secondary education. Like many countries in the region, Mali allocates a significant share of its resources to education. However, outcomes remain uneven, in part due to systemic inefficiencies and challenges related to governance and accountability within the sector. The Malian government’s spending on education is boosted by support from non-governmental and international organisations. For example, the Global Partnership for Education provides the country with financial assistance and technical support to improve its education system.
The education system can be viewed as a long funnel where children enter at the primary level and exit after completing tertiary-level education. However, the education funnel in Mali, like many sub-Saharan African countries, is leaky with various cracks along the way. Many children enter the system at the mouth of the funnel, but few complete the entire journey — from primary to secondary school and then university — to eventually graduate with a tertiary or equivalent education at the other end. In 2023, the gross enrolment rate for primary school students in Mali was 83.9%, a remarkable increase from 27.3% in 1990 but still far lower than the average of 108.3% of low-income countries in Africa. Comparing this to the net enrolment rate of 63.9% in the same period leads to two important conclusions. First, a significant number of children in Mali who are of school-going age are not in school (reflected in the low net number). Secondly, many classrooms in Mali are likely to be crowded by older students (reflected in the high gross number).
In the Current Path, Mali's gross enrolment rates will reach 88.9% and 95.5% in 2030 and 2043, respectively. In the same period, the net enrolment rate will be 68.5% in 2030 and 75.7% by 2043. At this rate of progress, the country will still lag behind the average of its income-group peers in Africa. The gross primary completion rate stood at almost 58.8% in 2023, indicating that a sizable number of children who enrolled did not complete the last grade of primary school in Mali. Although this rate is low, it is close to the average of the country’s African income-group peers at 61%. On the Current Path, Mali’s progress in ensuring more children complete primary school will be slower as it will reach 71.4% in 2030 slightly below the average of 73.8% for its income peers in Africa. By 2043, the primary completion rate in Mali will rise to 81.2% — this is almost on par with the average of African low-income countries at 83.6%.
Of those who complete primary-level education, it is expected that some will transition immediately to the lower-secondary level, some will enrol in the lower-secondary level after some years out of school and some will never enter the lower-secondary level, to, thereafter, potentially progress through to the upper secondary and tertiary levels. In Mali, more students transition from primary level to lower-secondary level than they do from lower-secondary level to upper-secondary level. In both cases, the rates are lower than Mali’s income-group peers in Africa: gross enrolment for lower- and upper-secondary levels in the country stood at 50.3% and 25.9%, respectively, in 2023, compared to 65.3% and 29.7%. In the Current Path, Mali's progress in gross enrolment for lower and upper secondary will rise to 61.9% and 32.8%, respectively, in 2030. By 2043, gross enrolment for the lower-secondary level will rise to 71.6%, while that of the upper-secondary level will rise to 42.6%. This indicates a significant drop in student retention from lower to upper secondary education.
Completion rates drop acutely from 34.6% in the lower-secondary level to a mere 16.9% in the upper-secondary level, indicative of a rapid contraction in the educational funnel. In the Current Path, lower- and upper-primary completion rates will modestly rise to 39.3% and 20.7%, respectively, almost at par with the average for low-income countries in Africa. Even by 2043, only 48.4% of students are expected to complete their lower-secondary education compared to 32.8% in upper-secondary level. Challenges are even more pronounced at the tertiary level. In 2023, only 6.8% of people within the age group were enrolled in tertiary institutions in Mali, and this will only improve to about 10% in 2030 and 18.1% by 2043 on the Current Path. Worryingly, only 4.8% of the relevant age group in Mali graduated from a tertiary institution with at least a first degree in 2023. This will steadily rise to 5.8% in 2030 and 9.1% by 2043, although it will still be lower than the average rates in other low-income African countries. In summary, the bottleneck at the lower-secondary level contracts even further at upper-secondary and tertiary levels.
Enrolments in vocational training and science and engineering education, which are crucial to the future of work, are quite encouraging. Mali's high youth unemployment rates and the growing demands of the labour market have led to increased efforts to promote technical and vocational education and training (TVET), with a focus on aligning skills with market needs. The emphasis on vocational education is largely due to Mali's rapidly growing youth population. This demographic requires job creation and vocational training to equip young people with the skills necessary for employment. Also, a significant portion of Mali's workforce is employed in low-skilled jobs, mainly within agriculture and the informal economy. As the demand for skilled labour grows across various industries, there is an increasing need for vocational education to enhance employability and entrepreneurship opportunities for young people. The National Employment and Training Observatory (ONEF) plays a key role in forecasting labour market skill needs, ensuring that vocational training aligns with economic demands and promoting a responsive TVET system that links business skill requirements with educational programmes.
Mali’s TVET aims to address the qualifications and skills gap by offering specialised training that aligns with current market demands, thus enhancing job prospects for young graduates. Efforts to improve vocational education include the ReCaFoP Project, funded by NUFFIC and led by the KIT Royal Tropical Institute. This aims to enhance vocational training capacity in Mali by strengthening organisational capacity, improving teacher training, developing curricula and upgrading infrastructure. The World Bank has also made significant investments in Mali's TVET sector through projects designed to improve education and training programmes. These initiatives focus on building institutional capacity, providing basic skills training and creating job opportunities within small and medium-sized enterprises (SMEs). Recent legislative efforts in Mali aim to strengthen the TVET framework, enhance institutional coordination and improve education quality, though challenges remain in fully implementing these reforms. Additionally, initiatives are being implemented to ensure equal access to technical and vocational education for girls, empowering them and addressing gender disparities in education.
In 2023, about 37.2% of upper-secondary school students were enrolled in vocational training programmes in Mali and set to remain so even by 2043. This is far above the average rate of 24.7% for low-income countries in Africa and the third highest in the group, only below the rates in Ethiopia and Rwanda. At the tertiary level, in 2023, 17% of tertiary graduates in Mali enrolled in science and engineering programs, which is high by comparative standards. In the Current Path, Mali’s progress rate will stagnate so that, even by 2043, it will still record 17% of tertiary students enrolling in science and engineering.
There is still a large gender gap in education. Despite efforts by women at the local level to increase female enrolment, schools are not challenging stereotypes about girls. In 2023, 91 females were enrolled in primary school for every 100 males in Mali compared to the 94 females to 100 males average of low-income countries. At the secondary level, there were only 91 females enrolled in lower-secondary schools for every 100 males in Mali, as opposed to the average of 87 females for every 100 males in low-income Africa. The ratio worsens notably at higher levels of education. At tertiary level, there were 53 female students for every 100 male students, compared to the average of 84 female students for every 100 male students for Mali’s income-group peers on the continent.
The education system in Mali is confronted with enormous challenges regarding the quality of education. For instance, thousands of school-age children in pastoral communities in northern Mali lack access to education. Also, threats from armed groups against schools and the destruction of school infrastructure and equipment have led to a shortage of teachers in affected areas and a breakdown in the pedagogical support system due to massive population displacements. While the 12 years of insecurity have forced the education sector partners to be resilient by developing teaching solutions adapted to population displacement, the overall state of the education system remains concerning. As a result, displaced families and in security-affected areas are experiencing significant problems, which decreases the overall level of enrolment. The government directive aimed at schools in the south to indiscriminately accept relocated students has resulted in overcrowding and diminished educational quality.
In some schools, a single classroom can often accommodate up to 300 children due to the lack of teachers and infrastructure. In such circumstances, students cannot learn and become disinterested in learning. In addition, Mali's lack of skilled teachers, inadequate textbooks and poor learning conditions all negatively impact learning outcomes for the children who attend school. As a result, most fifth graders struggle to acquire fundamental reading and mathematics skills, for example. Emergency education in crisis zones is also highly underfunded and unsafe. Mali has had 1 in 10 of its schools remain closed since 2022 because of a shortage of facilities and instructional supplies attributed to insecurity and a funding crisis.
Using the average test score as a proxy for quality of education, Mali’s performance has lagged behind its income peers in Africa. In 2023, the average test score for primary in Mali stood at 25.8 out of 100 slightly below the average of 28.5 for its income-group peers in Africa. At the secondary level, average test score stood at 33.9 out of 100 which was also lower than the 37.5 recorded for low-income African countries.
In the Current Path, this trend will continue as Mali’s performance will continue to trail that of its income group in Africa. Thus, although Mali has tried to improve its education system, significant challenges still need to be addressed. These challenges include limited access to education, particularly for girls and those in rural areas, and low-quality and inadequate resources. The ongoing security situation further exacerbates these challenges, which, if not addressed, can reduce the human capital stock and affect the productivity of labour in the country.
Chart 16 presents the mean years of education in the Current Path and in the Education scenario, from 2020 to 2043, for the 15 to 24 age group.
The average years of education in the adult population aged 15 to 24 is a good first indicator of how the stock of knowledge in society is changing. In 2023, the mean years of education attained by adults between 15 and 24 years in Mali stood at 5.8 years — slightly below the average of 5.9 years for low-income countries on the continent. On average, females received one year more schooling than males. In the Current Path, the average Malian between the ages of 15 and 24 years will have received 6.6 years of education in 2030 and 7.6 years by 2043. In the Education scenario, the mean years of adult education will rise to 6.8 years in 2030 and 9.0 years by 2043. At this rate, it will be 1.9 years more than in the Current Path by 2043. The Education scenario further increases average test scores for primary students to 29.3 in 2030 and 34.4 in 2043, compared to the Current Path of 27.1 and 29.9, respectively, in the same period. At the secondary level, the average test scores for students in Mali will rise to 38.1% in 2030 and 42.5% in 2043 more than the Current Path and the average of low-income countries in Africa. It means that the Education scenario has the potential to improve the quality of education (reflected in the test scores) in Mali above that of its income-group peers in Africa.
Chart 17 presents the value-add by sector as share of GDP in the Current Path, for 2023 and 2043.
In the Manufacturing scenario, reasonable but ambitious growth in manufacturing is envisaged through increased investment in the sector, research and development (R&D), and improved government regulation of businesses. This aims to enhance total labour participation rates, particularly among females where appropriate and is accompanied by increased welfare transfers to unskilled workers to mitigate the initial rises in inequality typically associated with a low-end manufacturing transition.
Visit the theme on Manufacturing for our conceptualisation and details on the scenario structure and interventions.
The manufacturing sector is crucial for the productive transformation of a country’s economy towards sustained high growth, employment creation and improved prosperity. It has backwards and forwards linkages with other sectors, such as the agriculture and the service sectors.
The manufacturing sector in Mali accounts for a relatively small share of its GDP. However, it plays a significant role in employment generation. According to the International Labour Organization’s estimates, the industrial sector in Mali accounted for about 10% of total employment in 2021. The manufacturing subsector in Mali includes textiles, agricultural tools, cosmetics, batteries, paint, plastics, processed foods, cement, cigarettes and beverages.
The sector faces several difficulties that limit its development and productivity, including inadequate transportation networks, unstable power supplies and limited access to financing. The sector also lacks access to modern technology and innovative practices, which hurt its ability to compete in the global market. Finally, because of a lack of financial resources, outdated equipment and unskilled labour, productivity levels in the manufacturing sector have remained relatively low.
Initiatives are underway to encourage the expansion and development of Mali's manufacturing industry. The Malian government has put in place several programmes and policies to entice investment in the industrial sector. These include tax breaks, financial aid and the construction of industrial parks to support manufacturing operations. Furthermore, commercial and industrial cooperation within the area has been made possible because of Mali's membership in regional economic organisations like the ECOWAS. Additionally, through training initiatives, access to financing and technology transfer projects, the government and foreign organisations are supporting small and medium-sized enterprises in the manufacturing sector.
The three largest contributors to GDP in Mali are the services, agriculture and manufacturing sectors. In 2023, the services sector in Mali contributed US$8.2 billion to the economy, equivalent to 43.9% of GDP. This is followed by the contribution of the agriculture sector valued at US$6.5 billion, equivalent to about 35% of GDP. The manufacturing sector, contributed US$1.8 billion, representing 9.8% of GDP in 2023. In the same period, the materials sector (which includes mining) US$1.3 billion equivalent to 6.9% of GDP while the contributions of the information and communications (ICT) and energy sectors were valued at US$652.5 million, (3.5% of GDP) and US$457.1 million (2.5% of GDP), respectively.
On the Current Path, the services sector will extend its dominance in the economy with its contribution to GDP expected to reach 47.5% in 2030. By 2043, the service sector will almost quadruple in size to US$27.3 billion by 2043 (51.6% of GDP). Although the contribution of the agricultural sector to GDP will decline, it will continue to remain the second largest contributor over the forecast period and it will grow in size. Its contribution will be valued at US$7.5 billion (equivalent to 29% of GDP) in 2030 and US$9.4 (equivalent to 17.8% of GDP). The contribution of manufacturing to GDP in Mali will increase to constitute 11.9% (valued at US$2.9 billion) of GDP in 2030 and 17% (valued at US$9.0 billion) of GDP by 2043 almost at par with agriculture. The material sector in Mali will still be the fourth-largest contributor to GDP with a share of 6.3 in 2030 and 7.2% of GDP in 2043. The energy sector will contribute 2.1% to GDP in 2030 and decline to 1.4% by 2043. At this rate, it will be lower than the contribution of ICT which will reach 3.8% in 2030 and 4.9% by 2043.
The relative decline of the agricultural sector and the rapid expansion of the manufacturing sector reflect the anticipated structural transformation of the Malian economy. While this shift has the potential to drive rapid economic growth and create jobs, it also risks increasing inequality, particularly as a significant portion of Mali’s population, especially the poor and vulnerable groups, depend on agriculture for their livelihoods. Therefore, the transition to a larger manufacturing sector must be accompanied by social protection measures, such as welfare transfers to displaced workers, to ensure that the country achieves inclusive growth and shared prosperity while safeguarding the well-being of the poor and vulnerable.
Chart 18 presents the contribution of the manufacturing sector to GDP in the Current Path and in the Manufacturing scenario, from 2020 to 2023. The data is in US$ and % of GDP.
In the Manufacturing scenario, Mali makes substantial progress in industrialisation compared to the Current Path. By 2043 the share of the manufacturing sector in GDP is about 29% (US$16.5 billion) — about eleven percentage points of GDP above the Current Path. It means that an aggressive manufacturing transition can add extra US$7.5 billion to the economy of Mali.
Industrialisation is a complex and long-term process that requires strong, collaborative relationships between the state, which provides support and guidance and the private sector. For firms to thrive, they need a government with a clear economic vision and strategy, efficiently providing supportive infrastructure and services, and a regulatory environment that fosters entrepreneurship. Additionally, firms require a government that facilitates the acquisition of new technology and access to emerging markets and economic activities. Given this, it is crucial for Mali to pursue an ambitious manufacturing transition by increasing investment in the sector, promoting research and development (R&D), and creating an enabling environment for the private sector through government regulation that empowers and enables the sector. In this process, the government should also focus on increasing female labour participation, which currently lags nearly 18 percentage points behind male participation, by supporting education, training and affirmative policies. To mitigate the potential rise in inequality that often accompanies a transition to low-end manufacturing, the government should also expand welfare transfers to unskilled workers.
Chart 19 depicts exports and imports as a percentage of GDP, from 2000 to 2043, in the Current Path and in the AfCFTA scenario.
The AfCFTA scenario represents the impact of fully implementing the African Continental Free Trade Agreement by 2034. The scenario increases exports in manufacturing, agriculture, services, ICT, materials and energy exports. It also includes improved multifactor productivity growth from trade and reduced tariffs for all sectors.
Visit the theme on AfCFTA for our conceptualisation and details on the scenario structure and interventions.
Historically, Mali’s economy is more open[2Trade openness measures the extent to which a country is engaged in the global trading system. This is calculated using the sum of the total exports and the total imports over the total GDP.] to trade compared to its income-group peers in Africa. In 1990, the sum of Mali’s exports and imports stood at 46.6% of GDP, which was above the average of 26.6% for low-income countries in Africa. By 2023, trade openness in Mali had jumped to 70.4% of GDP — far above the 43.8% average for low-income countries. On the Current Path, this trend will continue as the sum of Mali’s exports and imports will reach 81.3% of GDP in 2030 and 121.5% of GDP by 2043 far exceeding the average rates for its income-peers in Africa.
Over the years, efforts have been made to improve the country’s trade. Mali is a member of the WAEMU, whose purpose is to reduce trade barriers by creating a common market. It has a customs union with a common external tariff. As a result, it benefits from the Trade and Investment Framework Agreement (TIFA), which offers the framework and principles for trade and investment negotiations between the WAEMU and the US. Mali is a member of the World Trade Organization and also signed the AfCFTA agreement in March 2018 to promote intra-African trade. Mali has also eliminated export duties and taxes on many products and established free zones to boost exports. In addition, the country has relatively low customs duties averaging around 10%, with few legal and regulatory trade barriers.
However, there are still factors that constrain trade. Inadequate infrastructure, such as roads, remains a constraint to economic integration in the country as well as the high costs of energy and telecommunications, which act as a disincentive to trade in the country. Despite enjoying the preferential treatment granted to developing countries, the country exports only a small number of products, which are usually raw materials that are generally subject to zero or very low most-favoured-nation import duties in the importing countries. Also, Mali's manufacturing sector remains undeveloped. Although the country has substantial potential in the textile and agri-food industries, the damaging escalation of import duties does not favour the development of this sector. In recent years, economic sanctions, such as the trade and financial embargo and border closure imposed on the country in early 2022 by ECOWAS and WAEMU, have negatively affected trade in Mali. Although these sanctions have been lifted, the decision by Mali to leave ECOWAS will impact negatively on its intra-regional trade, especially with non-UEMOA countries.
In 1990, the total export volume in Mali stood at US$691.3 million, constituting 15.7% of GDP, far above the average of 9.3% for its income-group peers. Since then, exports from Mali have grown rapidly. By 2023, Mali’s exports stood at US$5.3 billion, equivalent to 28.9% of GDP, far exceeding the average of 16.3% for low-income African countries. Gold is a major export of Mali accounting for 96% of total exports in 2022. Mali is also one of the largest exporters of cotton in Africa although only accounting only about 2% of total export in the same year. Other significant exports include oily seeds, rough wood and refined petroleum. Mali also trades in transportation, financial, insurance and cultural and recreational services. Although the country aims to become self-sufficient in cereal production and a leading cereal exporter in the West African region, it is yet to achieve this vision, despite significant progress. Almost two-thirds of total exports from Mali are destined for the United Arab Emirates, 16.7% for Switzerland. This reveals a significant shift in export destinations from previous years which had South Africa, Bangladesh and Côte d'Ivoire as its main export destinations. Other notable export destinations include Australia, China and Turkey. On the Current Path, total exports in Mali will reach 33.8% of GDP, equivalent to US$8.7 billion, in 2030 and 57.3% of GDP valued at US$30.3 billion. It will be almost twice the average for low-income group peers in Africa.
In terms of imports, Mali’s total imports grew from US$1.3 billion, equivalent to 30.9% of GDP in 1990 to US$7.7 billion, representing 41.5% of GDP, in 2023. At that rate, Mali’s total imports as a proportion of GDP were higher than the estimated average of 27.5% for low-income African countries in the same year. The country imports large volumes of refined petroleum (representing 32% of total imports). Other top imports of Mali are broadcasting equipment, packaged medicaments, light pure woven cotton and broadcasting equipment. Imports from Côte d'Ivoire and Senegal account for 24% and 18.6% of total imports into the country respectively. This is followed by imports from China, France and Burkina Faso. In the Current Path, total imports to Mali will reach US$12.3 billion (47.5% of GDP) in 2030 and US$34 billion (64.2% of GDP) by 2043. The high import volumes coupled with the lower exports result in a trade deficit.
Chart 20 presents the trade balance in the Current Path and in the AfCFTA scenario, from 2020 to 2043 as a percentage of GDP.
Mali has a chronic deficit in its trade balance since exports only cover about half of imports. Like most African countries, it imports large volumes of mostly finished or processed goods. Its export quantities are small, and most of it is raw materials, with little or no value addition occurring within the country. This results in low export revenues and higher import expenditures. Mali’s trade deficit in 2023 constituted 12.3% of GDP, which was above the average of 10.3% for low-income African countries. In the AfCFTA scenario, the sum of Mali’s exports and imports as a percentage of GDP will reach 85.3% in 2030 and 123.3% by 2043 slightly above its Current Path.
Throughout the forecast period, the AfCFTA scenario leads to a faster improvement in Mali’s trade balance than the Current Path. By 2043, Mali’s trade deficit in the Current Path will constitute about 6.9% of GDP, whereas, in the same year, the AfCFTA scenario will mitigate this situation leading to a slightly lower deficit of 6.5% of GDP. This is almost at the same level as the average for its income-group peers in Africa. Although the impact on reducing trade deficit is limited, Mali will benefit from the AfCFTA. The full implementation of the AfCFTA will improve competitiveness, particularly in growing the country’s manufacturing sector. It fosters greater trade openness, promoting the diffusion of technology within countries and enhancing productivity and innovation. As a result, resources are directed to their most efficient uses, leading to welfare gains and lower consumer prices. Additionally, it could boost Mali’s exports by providing access to a much larger market and strengthen the manufacturing sector through increased competition. Consequently, the AfCFTA has the potential to drive faster economic growth, create more jobs in key sectors and reduce poverty.
Chart 21 presents the Current Path of access to electricity for urban, rural and the total population from 2000 to 2043.
The Large Infrastructure and Leapfrogging scenario involves ambitious investments in road and renewable energy infrastructure, improved electricity access and accelerated broadband connectivity. It emphasises adopting modern technologies to enhance government efficiency and incorporates significant investments in major infrastructure projects like rail, ports, and airports while highlighting the positive impacts of renewables and ICT.
Visit the themes on Large Infrastructure and Leapfrogging for our conceptualisation and details on the scenario structure and interventions.
Modern infrastructure can improve productivity, augment healthy lifestyles, boost educational outcomes and facilitate government effectiveness. In this study, we focus on both physical and digital infrastructure, including roads, electricity access and ICT. Although Mali has made significant strides in improving the quality and quantity of basic infrastructure, the country’s infrastructure stock is limited and aged. The Africa Infrastructure Development Index (AIDI) consists of four composite indicators — transport, electricity, ICT, and water supply and sanitation needs. According to 2024 AIDI, Mali (with a score of 19.2) ranked 36th in infrastructure development. This reflects the infrastructure deficit in the country.
Physical infrastructure, such as roads and railways, is a critical driver of economic growth and an important component of development. It facilitates the movement of people, goods and services, promotes intra-country trade and serves as an enabler of social service provision such as education and health. Over the years, Malian authorities have continued to make efforts to improve the road network in the country. The creation of a second-generation road fund in 2000 and the inception of a Road Maintenance Executing Agency contributed to improving road infrastructure in the country. In 2023, the total length of roads in Mali was estimated to be 108 694 km of which only 9 130 km, equivalent to 8.4% was paved. The low per cent is below the average of 12.7% for low-income countries in Africa. On the Current Path, the total road network in Mali will increase to 121 962 km in 2030, of which only 12.2% will be paved. By 2043, the total road network will rise to 136 254 km by which paved roads as a percentage of total roads will constitute 22.7% still below the average of 34.8% in Africa’s low-income countries.
Electricity production in Mali is mainly generated from hydraulic power comprising 55% of electricity production, and diesel accounts for 45%. In 2023, 52.2% of the people in Mali had access to electricity. This was above the average of 37.8% of low-income countries in Africa. Similar to the trend observed in most low-income countries in Africa, an overwhelming 94.9% of urban residents, but only 17.9% of rural dwellers, had access to electricity in 2023, reflecting the disparity in favour of urban areas. This low access to electricity particularly hinders economic growth and reduces quality of life.
To improve access to electricity, the Malian government is working to expand its renewable energy resources, particularly solar and hydroelectric power, through initiatives aimed at developing solar mini-grids and hybrid systems for remote communities. As a result, solar capacity in the country has increased significantly, growing from 16 MW in 2013 to 100 MW in 2022, thereby improving energy access for thousands of people. Additionally, decentralised solar mini-grids have been implemented to address rural electrification challenges, fostering local socio-economic development and supporting the achievement of SDG goal 7.1 by providing electricity to remote areas. To further encourage investment in the energy sector, the Malian government has established a legal framework to promote Public-Private Partnerships (PPPs), focusing on attracting private investment for rural electricity generation and distribution. The Malian Agency for Rural Electrification (AMADER) plays a key role in facilitating these partnerships. Furthermore, Mali collaborates with international organisations such as the World Bank and the African Development Bank to secure financing for large-scale energy projects, addressing structural challenges within the sector.
Despite these efforts, significant challenges persist. The country's electricity grid is outdated and overloaded, struggling to meet increasing power demand. The state utility, Energie du Mali (EDM), operates inefficiently and relies heavily on subsidies, resulting in financial losses that limit investment in necessary infrastructure upgrades. The cost of energy generation exceeds the price at which it is sold. For example, the average production cost is approximately US$0.24 per kWh, while consumers pay about US$0.16 per kWh, placing a strain on the national budget. Furthermore, frequent brownouts and load shedding occur due to a mismatch between the rising demand (about 10% per year) and the insufficient supply. Many businesses are forced to rely on expensive diesel generators, further exacerbating financial pressures.
On the Current Path, access to electricity will reach 59.9% and 72.1% of the population by 2030 and 2043, respectively, which will be above the average for Mali’s income-group peers (estimated at 44.3% in 2030 and 58.8% in 2043). The disparity in electricity access in favour of urban residents will continue such that, by 2033, all urban residents in Mali will have access to electricity, a trend that will continue till the end of the forecast. However, only 21.6% of Malians living in rural areas will have access to electricity and even by 2043, this will marginally increase to 34.8% of rural dwellers. This suggests that the government needs to intensify its rural electrification projects to bridge the gap in electricity access among rural-urban dwellers. With an estimated 800 MW of hydroelectric power, potentially unlimited solar energy and over 300 MW of biomass, the country can fully tap into this renewable energy potential to increase production and access.
Aside from physical infrastructure, technological advancement is essential for economic growth. Technology improves productivity and reduces the transaction costs and bottlenecks associated with doing business. It can also enable firms to adopt more efficient technologies, improving productivity and driving economic growth. The Malian government has developed a comprehensive strategy (the Mali Numérique 2020 strategy, officially titled Stratégie Nationale de Développement de l’Économie Numérique) to strengthen its digital economy, focusing on six key pillars: expanding digital infrastructure, promoting local digital industries, enhancing e-governance and public services, developing digital content, improving human capital through education and training, and ensuring digital security. The strategy aims to position Mali as a regional leader in digital growth.
In accordance with the Mali Numérique 2020 strategy, significant investments are being made to increase broadband access across the country, with the goal of achieving 50% mobile internet penetration and providing high-speed connectivity to underserved communities. These efforts are vital for stimulating economic activity and improving access to information. Organisations like iCodeVillage are empowering youth through coding and digital skills training, stimulating entrepreneurship, particularly among young women, by equipping them with the skills needed to navigate the digital economy. Moreover, the Bamako Digital Complex Support Project, funded by the African Development Bank, aims to expand Mali's use of ICT to boost productivity and competitiveness across various sectors. This project emphasises the importance of integrating ICT into economic activities.
Owing to these investments, mobile broadband subscriptions in Mali are high. For instance, the number of people with access to a mobile line grew by 300% between 2004 and 2007, allowing Mali to catch up with its income-group peers and positioning the country among the best performers in West Africa. In 2023, Mali had a mobile broadband subscription rate of 65.8 per 100 people, almost double the average of 36.2 for low-income countries on the continent. On the Current Path, mobile broadband subscriptions will rise to 129 per 100 people in 2030 and 153 per 100 people in 2043— 20% above the average of its income-group peers. However, Mali’s progress in fixed broadband access, like many other African countries, has lagged. In 2023, the total number of fixed broadband subscriptions in the country was estimated at about 1.8 per 100 people — slightly below the average of 1.9 per 100 people in low-income Africa. In the Current Path, fixed broadband subscriptions will rise to 6.1 per 100 people in 2030 and 21.9 per 100 people by 2043, above the average of 18.4 subscriptions per 100 people for low-income African economies.
The Mali Numérique project initiative includes partnerships with major tech corporations, such as Huawei, to enhance digital infrastructure. Key components of the project include the installation of 1 000 kilometres of fibre optic cables and the creation of a Tier 3 data centre to centralize government data. Despite this, only a quarter of the Malian population had access to the Internet in 2023. Although this was higher than the average usage of 17.9% in low-income countries, it is half of what exists in Gambia, which is the highest among the low-income countries. Also, on the Current Path, Mali’s progress will lag behind its income-group peers so that it will reach 21.7% in 2030 and, in 2043, the proportion of people with access to the Internet in Mali will almost be on par with the average for its income-group peers in Africa at 22%. Currently, Mali’s low internet service penetration worsens inequality, limits access to essential services and restricts the country's potential for economic growth and development in an increasingly digital world.
Chart 22 presents the number of people using cookstoves in the Current Path and in the Large Infrastructure and Leapfrogging scenario, from 2020 to 2043.
Our modelling distinguishes between three types of cooking stoves: traditional, improved and modern. In 2023, 89.3.5% of households in Mali used traditional stoves with firewood or charcoal for cooking, while 5.7% used improved cooking stoves and 5.0% used modern stoves for cooking. This means that an overwhelming majority of people in Mali, therefore, still rely on traditional stoves for cooking, which contributes to pollution and carbon emissions and negatively impacts the health of these households. A similar trend is observed in most low-income countries in Africa with 88% using traditional cookstoves.
As access to electricity in urban and rural areas increases, more households will likely switch from traditional cooking stoves to improved and modern fuel stoves, such as electric and gas cookers. Based on the Infrastructure scenario, it is projected that 62.7% and 80% of Malians will have access to electricity by 2030 and 2043, respectively. Also, all Malians living in urban areas will have access to electricity in the scenario as early as 2030 and the portion of people with access to electricity in rural areas will improve to 25.9% in 2030 and 48.9% by 2030 in the scenario instead of 34.8% in the Current Path.
As a result, 47.3% of households in Mali will use modern fuel for cooking in the Large Infrastructure and Leapfrogging scenario in 2043. This will be higher than the average for the country’s income-group peers at 34.3%, and the 39.7% in the Current Path by 2043. Clearly, this will reduce health-related diseases and carbon emissions arising from the use of traditional cookstoves in the country.
Chart 23 presents the percentage of the population and number of people with access to mobile and fixed broadband in the Current Path and in the Large Infrastructure and Leapfrogging scenario, from 2020 to 2043. The user can toggle between mobile and fixed broadband.
In the Infrastructure scenario, access to fixed broadband will rise to 6.5 per 100 and 24 per 100 people subscriptions by 2030 and 2043, respectively. This will be above the average of 18.4 for low-income African countries in 2043. In the case of access to mobile broadband, due to the aggressive performance of the Current Path forecast, reaching 153 subscriptions by 2043, the Large Infrastructure scenario has only a marginal impact. The scenario will peak at 156 subscriptions per 100 people by 2038 and remain so till 2043 — higher than the average of 127.6 for Africa’s low-income countries in the same period.
Chart 24 presents the trends in FDI, aid and remittances in the Current Path and in the Financial Flows scenario as a percentage of GDP, from 1990 to 2043.
The Financial Flows scenario represents a reasonable but ambitious increase in inward flows of worker remittances, aid to poor countries and an increase in the stock of foreign direct investment (FDI) and additional portfolio investment inflows. We reduce outward financial flows to emulate a reduction in illicit financial outflows.
Visit the theme on Financial Flows for our conceptualisation and details on the scenario structure and interventions.
FDI inflows to Mali, like most low-income countries, are historically low. In 1990, the total FDI inflow to Mali was equivalent to a paltry 0.2% of GDP — on par with the average for low-income countries in Africa. By 2023, FDI inflows to Mali reached 3.2% of GDP slightly below the average of 3.9% of GDP for low-income African countries. The majority of the FDI received by Mali is destined for oil extraction, gold exploitation, the textile industry, telecommunication, infrastructure and financial intermediation and comes from France, China, the US, Canada and India. Mali was ranked 148 out of 190 countries in the World Bank’s Ease of Doing Business Report. This reflects the difficult business environment and the numerous obstacles to investing in Mali. The country’s fragile political situation, persistent insecurity, especially in the northern part, and underdeveloped business environment are the main reasons for the low FDI in the country. Other factors that may hinder foreign investment in Mali include governance-related challenges, the impact of economic sanctions, and infrastructure gaps. Businesses in Mali have to grapple with corruption in procurement processes, land administration, various tax payments and complex customs procedures.
Prior to the coups, the government put in place various measures to attract more FDI. This is to be achieved by encouraging competitiveness and private sector participation in all sectors of the economy, with particular attention given to sectors such as agribusiness, fishing and fish processing, livestock and forestry, mining and metallurgical industries, and tourism and hospitality industries.
There have also been efforts to undertake financial and economic reforms, such as improving fiscal transparency and reducing corruption to attract FDI. In this vein, the government committed to improving public financial management practices and increasing tax revenue by strengthening revenue collection agencies, ensuring tax compliance and reducing fraud in tax administration. On the Current Path, FDI inflows are expected to marginally decline to 3.7% in 2030 before rising to reach 4.0% of GDP by 2043. However, this will still be below the Current Path average of 4.7% for low-income countries on the continent by 2043.
Historically, Mali received relatively more foreign aid than other low-income African countries. In 1990, the total aid received by Mali constituted 18.0% of GDP, compared to 12.7% received by other low-income African countries in the same period. By 2023, total aid as a percentage of GDP stood at 8.7%, equivalent to US$1.6 billion. This was close to the average of 8% for other low-income countries in Africa. Mali received aid from diverse donor sources. For instance, in 2022, US bilateral foreign assistance to support the country’s development amounted to US$148 million. Likewise, the European Union has contributed over €506 million since 2012 to address urgent humanitarian needs and support long-term development initiatives. A large proportion of aid received by Mali is spent on food, basic essential goods or emergency shelter, health and nutrition and education, among others. Foreign aid is also channelled towards promoting agricultural growth, ensuring food security and building resilience against climate change impacts.
On the Current Path, foreign aid will decline to 8.2% of GDP in 2030 and 6.9% of GDP in 2043, although the absolute amount will increase to US$3.6 billion by 2043. However, this will still be higher than the average of 5.1% of GDP for other low-income countries in Africa. The projected decline in aid to Mali reflects both expectations of economic growth and shifts in donor engagement in response to the current political context. Governance arrangements are often a consideration for continued support, particularly among Western partners and multilateral institutions. Given the critical role aid plays in Mali’s economy, especially in sectors such as education, healthcare and humanitarian assistance, a sharp decline in aid over the medium term could have devastating effects on the economy and exacerbate poverty.
Remittances serve as a lifeline for many families in Mali, not only supporting immediate consumption but also facilitating long-term investments that contribute to the country's development. Historically, remittances in Mali are high compared to its income-group peers in Africa. According to the UNDP, Mali is the fourth-largest recipient of remittances in West Africa after Nigeria, Ghana and Senegal. In 1990, total remittances inflow to Mali was valued at US$61.5 million, equivalent to 1.4% of GDP, which was almost twice the average rates for its income peers in Africa. By 2023, this has grown rapidly so that Mali received US$665 million in remittances, constituting 3.6% of GDP, well above the average of 2% for low-income African countries. It could mean that there are more Malian migrants in the diaspora (most of the Malian diaspora are in France, Spain and Italy) than its income-group peers, or that Malian migrants have sent relatively higher remittances home than in other low-income countries.
A large portion of remittances is used to meet daily household needs, including food, clothing and healthcare, which enhances living conditions and reduces poverty for recipient families. Additionally, families often allocate remittance income toward educational expenses such as school fees, uniforms and supplies, thus improving access to education for children in both rural and urban areas. Remittances also help cover healthcare costs, enabling families to afford medical treatments and insurance, which is crucial given the limited healthcare facilities in many regions. Some recipients use their remittance funds to invest in agricultural activities, such as purchasing seeds, tools and livestock, thereby boosting food security and economic resilience in rural communities. Funds are frequently directed toward building or renovating homes and improving living conditions and infrastructure within communities. A portion of remittances is also invested in small businesses, supporting local economic development and creating jobs. On the Current Path, remittances to Mali will increase to US$794.5 million (3.1% of GDP) in 2030 and US$1.1 billion (2.1% of GDP), exceeding the average of 0.8% of GDP projected for low-income countries.
Chart 25 presents government revenue in the Current Path and in the Financial Flows scenario, from 2020 to 2043. The data is in US$ 2017 and % of GDP.
Wagner's law postulates that public expenditure increases as national income rises. It is, therefore, reasonable to expect that government revenues will increase as a per cent of GDP in the Financial Flows scenario compared to the Current Path. Chart 25 indicates that higher financial inflows in the form of FDI, aid and remittances have increased government revenue. For instance, increased FDI means higher GDP growth, which in turn increases revenues accrued to the government through corporate and income taxes, royalties and indirectly through value-added tax. In 2023, the government’s total revenue in Mali amounted to US$4.1 billion, equivalent to 22% of GDP — higher than the average of its income-group peers in Africa. Similarly, Mali’s revenue without aid, estimated at 11.4% of GDP, is above the average of 9.7% for low-income countries in Africa.
In the Financial Flows scenario, government revenue will rise to US$15.0 billion in 2043, representing 26.3% of GDP above the average of 20.0% for low-income countries in Africa in the same year. Compared to the Current Path, the Financial Flows scenario will further improve government revenue in Mali by almost an extra US$242 million in 2030 and US$1.4 billion by 2043. This highlights the need for the government of Mali to implement targeted policies aimed at attracting more financial flows, particularly foreign direct investment (FDI), into the country. The increased government revenue could then be used to support public spending, especially in addressing the needs of the growing population and investing in key sectors that drive economic growth.
Chart 26 presents the Current Path of government effectiveness comparing the country to the average for the Africa income group, from 2002 to 2043.
This scenario assumes better governance: stability, capacity, and inclusion. It measures a state’s progress using the average of these three indices. To this end, it includes an index (0 to 1) for each dimension, with higher scores indicating improved outcomes. It is also include additional component of social transfers to unskilled labour and increase in tax on skilled labour.
Visit the theme on Governance for a full conceptualisation and details on the scenario structure and interventions.
To emulate the sequential evolution of governance over time, our modelling draws on the establishment of nation-states in the Westphalian tradition that first created a security community (through internal oppression and war with others), built capacity (largely through the collection of taxes and the establishment of a coercive social contract) and then, in time, became more inclusive and eventually, democratic. Traditionally, these transitions occurred sequentially with progress in one dimension providing a basis for the next. The composite ‘governance triangle’ measures a state’s progress using the average of these three indices. To this end, it includes an index (0 to 1) for each dimension, with higher scores indicating improved outcomes.
Generally, Mali performs better on governance indices than most African countries. Its score on the composite governance index of 0.46 in 2023 was 5.3% higher than the average for its income peers in Africa. A further disaggregation into the three dimensions of the triangle (i.e. security, capacity and inclusion) shows that the country performed slightly better across all these three indexes compared to its income peers until recently when its score on democracy dipped due to the military takeovers in 2020 and 2022.
Mali’s score of 0.67 for 2023 on the governance security index is slightly higher than the average of 0.63 for low-income countries in Africa. This is despite Mali’s history of insecurity, political instability and the threat of terrorism and rebel groups. For instance, since 2012, Mali has experienced political instability, with three coups in March 2012, August 2020 and May 2021 truncating the democratic processes in the country. The country’s stability is also continuously threatened by internal armed conflict and attacks on civilians by security forces, rebel and militant groups leading to the displacement of people and loss of lives and livelihoods. In 2022 alone, the clashes between the Islamic State in the Greater Sahara and Jama’at Nasr al-Islam wal Muslimin led to the displacement of over 30 000 Malians to Ménaka, in eastern Mali.
Violence in the country has escalated since 2015, with various attacks linked to al-Qaeda and Islamic State leading to the deaths of thousands of people and displacement of over six million people. Despite the presence of the UN peacekeepers, French troops and others, including the recent deployment of the former Wagner private military company from Russia, the number of terror attacks and Malians joining insurgent groups in the country has steadily risen over the years. In June 2023, the interim government asked the UN peacekeeping mission known as MINUSMA, which has been in the country since 2013, to leave as a result of mistrust between the government and the mission. The UN Security Council subsequently voted to terminate the mission and completed its withdrawal in December 2023. On the Current Path, it is projected that Mali’s score on the governance security index will reach 0.66 in 2030 and 0.72 by 2043, compared to the average of 0.70 for low-income African countries, by 2043.
Regarding governance capacity, Mali’s score in 2023 of 0.29 was about 24.5% higher than the average of low-income Africa. The most important reason is that government revenue as a percentage of GDP for Mali (without aid) was 13.0% of GDP, exceeding the average of 8.2.% of GDP of low-income countries in Africa. Despite the progress in government capacity, the country is still lagging behind in several aspects of governance capacity such as fighting corruption. It currently ranks 136th out of 180 countries globally on the 2023 Transparency International Corruption Perception Index (CPI) with a score of 28. This is a seven-point decline from its peak of 35 in 2015. Most of the corruption cases occur through procurement. Corruption permeates every state institution in the country, creating mistrust among the public. The 2019 global corruption barometer reports that 60% of Malians (almost double what was recorded in 2015) believed corruption has increased in the last 12 months. The high level of corruption is likely to weaken government effectiveness in the country.
Similarly, the country’s performance on the World Bank government effectiveness index is below that of its peers. This index captures perceptions of the quality of public services, the quality of the civil service and the degree of its independence from political pressures, the quality of policy formulation and implementation, and the credibility of the government's commitment to such policies. Its score of 1.35 in 2023 is slightly below the average for low-income countries in Africa. On the Current Path, Mali’s progress on the governance capacity index will be slower than the average for its income-group peers reaching 0.31 compared to 0.25 in 2030. By 2043, its score of 0.34 will be slightly above the average for low-income countries in Africa estimated at 0.32.
Unlike the security and capacity index, Mali’s performance on the Governance Inclusion Index is slightly lower than its income-group peers in Africa. In 2023, Mali's score of 0.442 on the inclusion index, was almost at par with the average for its income-group peers on the continent. The main reason for the poor performance on the inclusion is backsliding on its democratic score since the 2020 coup. For example, Mali’s score on the V-Dem Electoral Democracy Index declined from 0.52 in 2018 to 0.23 in 2023, reflecting ongoing delays in the transition back to constitutional governance. Another reason for the poor performance on the inclusion index is the low women representation and inclusion in the country. The 2020 Gender Inequality Index also ranked Mali 184th globally with gender-based violence and inequality still prevalent in the country. Historically, female representation in government has been low in Mali and consistently below the 30% global benchmark. For instance, women’s representation in the national parliament has declined since its peak of 12% in the 1990s. Between 2010 and 2013, only 9.5% of seats in the national parliament were occupied by women.
The marginalisation of women in government led to the enactment of the 2015 Gender Quota Law that requires at least 30% of females in nominated or elected positions. As a result, the 2020 elections witnessed the highest female representation of 29% in the national parliament. Even with the quota rule, women are still underrepresented in almost all political spheres. Women make up 23.6% of the national government, 1% and 5% of interim administration at the regional and district levels, respectively. Also, only 6% of the National Council for Security Sector Reforms, 3% of the National Commission on Disarmament, Demobilization and Reintegration and 20% of the Truth, Justice and Reconciliation Commission are women. On the Current Path, Mali will progress slowly on the Governance Inclusion Index to reach 0.45 in 2030 and 0.51 by 2043, but will still be slightly below the average of low-income countries in Africa.
Chart 27 presents security, capacity and inclusion index for the Current Path versus the Governance scenario, for 2023 and 2043.
In the Governance scenario, Mali's score on the governance security index will improve to 0.73 in 2030 and 0.89 by 2043; at which point it will be about 23% above the Current Path by 2043 and about the average of low-income Africa in the same year. Governance capacity will also improve in the Governance scenario, with its score increasing to 0.65 in 2030 and 0.70 by 2043, constituting a 59.4% improvement above the Current Path in 2043. In terms of inclusion, the Governance scenario will improve Mali’s score on the Governance Inclusion Index to 0.54 in 2030 above the Current Path of 45.3. By 2043, Mali’s score on inclusion will be 22% above the Current Path and the average of low-income countries in Africa in 2043.
Chart 28 presents GDP per capita in purchasing power parity (PPP) in the Current Path and each of the eight sectoral scenarios, plus the synergistic effect and the Combined scenario. The data is from 2020 with a forecast to 2043.
The scenarios with the greatest impact on GDP per capita in Mali by 2030 will be the Agriculture scenario, followed by the Manufacturing and Governance scenarios. In the long run, however, governance becomes the most powerful tool to improve average incomes followed by the Agriculture and Manufacturing scenarios. Thus, it is quite clear that both in the medium and long term, Mali has to prioritise improved governance, investment in agriculture and a manufacturing transition to quickly increase average incomes and improve the standard of living.
In the Governance scenario, the GDP per capita for Mali will rise to US$2 345 in 2030 slightly above the Current Path. By 2043, GDP per capita in the Governance scenario will rise further to US$3 371, representing a 10.2% increase over the Current Path for that year. It means that the Governance scenario can raise GDP per capita in Mali by an additional US$312 by 2043. Good governance and political stability can undoubtedly inspire investor confidence in the economy and attract more FDI into Mali, which can lead to growth. Likewise, good governance characterised by adherence to the rule of law, reduced corruption and improved transparency and accountability can lead to more rapid economic growth. Therefore, it suggests that if authorities in Mali can reduce the levels of insecurity in the country and promote good governance, the country will be set on a path of sustained economic growth.
In the Agricultural scenario, Mali’s GDP per capita (PPP) will increase to US$3 252 by 2043, which represents an increase of US$196 (or 6.3%) compared to the projections on the Current Path in the same year. The impact of the Agriculture scenario demonstrates the importance of the agricultural sector to economic growth in Mali. The sector is crucial to the economy, serving as a primary source of income and employment for many Malians, especially for rural populations. Its forward linkage with the manufacturing sector means that it also drives economic growth by supplying industries with raw materials, generating income, fostering trade, and creating jobs in related industries such as food processing, transportation and retail. Consequently, it is no surprise that in Mali, there is a strong correlation between agricultural yields and economic performance, with the sector making a significant contribution to the country’s GDP.
In the Manufacturing scenario, Mali’s GDP per capita will increase to US$3 249 by 2043, representing an increase of US$190 or 6.2% more than the Current Path. According to economist Nicolas Kaldor's "engine of growth" hypothesis, manufacturing is the driving force behind economic growth. It has historically been the largest source of employment due to its backward and forward linkages with other sectors, and it plays a key role in transforming productivity structures across the economy. Therefore, it is no surprise that a strong manufacturing sector leads to significant improvements in GDP per capita. A thriving manufacturing sector is essential for achieving sustained economic growth and greatly enhancing the standard of living for the population in Mali.
Chart 29 presents poverty in the Current Path and for each scenario, from 2020 to 2043. The user can select the number of extremely poor people or the percentage of the population.
In the medium term (by 2030), the Agriculture scenario followed by the Governance and the Financial Flows scenarios has the greatest impact on poverty reduction. By 2043, the Governance, Manufacturing, Agriculture and Education scenarios are most effective at poverty reduction. This suggests that while financial flows, particularly aid, may be impactful in reducing poverty in the medium term, in the long run, it is not sustainable, mainly because the contribution of aid declines as the economy grows in spite of volume increase.
Because it includes additional social grants, the Governance scenario has the largest impact on poverty reduction in Mali. In this scenario, 1.4 million people will live below the extreme poverty line of US$2.15 by 2043, constituting 3.4% of the population. This will be 2.2 percentage points lower than the Current Path and equivalent to a reduction of about 940 000 people living in extreme poverty. Improved governance plays a critical role in ensuring that public resources are used efficiently and effectively to address the needs of the population, thereby contributing meaningfully to poverty reduction.
The Manufacturing scenario has the second-largest potential to reduce extreme poverty in Mali. In this scenario, the number of poor people will decline to 1.5 million (equivalent to 3.5% of the population), compared to the Current Path of 2.3 million people (5.6%) by 2043. It means that an aggressive industrialisation that leads to job creation and incomes has the potential to reduce extreme poverty in Mali by an additional 880 000 people.
The Agriculture scenario has the third-largest potential to reduce extreme poverty in Mali. In the Agriculture scenario, the number of poor people will decline to 1.7 million (equivalent to 4.3% of the population), compared to the Current Path of 2.3 million people (5.6%) by 2043. It means that an agricultural revolution in Mali has the potential to reduce extreme poverty by an additional 570 thousand people. This is expected given that nearly 80% of the Malian population depends on the agricultural sector for their livelihoods. It therefore underscores the importance of prioritising an agricultural revolution in Mali as a means of combating extreme poverty.
The Education scenario has the fourth-largest impact on poverty reduction in Mali. In this scenario, 1.8 million people (constituting 4.4% of the population) will live in extreme poverty by 2043. This will be 1.2 percentage points lower than the Current Path, and equivalent to a reduction of about half a million people living in extreme poverty. Education is an important tool to reduce extreme poverty. Increasing access and quality of education equips people with the requisite skills to either start a business or acquire a job which increases their income and ultimately improves their living standards. A recent report by UNESCO confirms that if students in low-income countries have at least basic reading skills, 171 million people can escape extreme poverty globally.
Chart 30 presents GDP in the Current Path and in the Combined scenario, from 2020 to 2043. The data is in US$ 2017 and at market exchange rates (MER).
The Combined scenario combines all eight sectoral scenarios: Governance, Demographics and Health, Education, Large Infrastructure and Leapfrogging, Agriculture, Manufacturing, AfCFTA and Financial Flows.
Mali’s GDP will rise to US$28.3 billion in the Combined scenario, representing an increase of 9.5% (valued at US$2.4 billion) over the Current Path in 2030. By 2043, the GDP of Mali will reach US$83.3 in the Combined Scenario. This will exceed the Current Path of US$53.0 billion, meaning that the Combined scenario will increase the size of the economy by an additional US$30.4 billion by 2043 — an increase of 57.3% compared to the Current Path. Indeed, in the Combined scenario, the economy is expected to grow at an average of 8.4% compared to the 5.5% economic growth projected in the Current Path. The massive economic growth projected in the Combined scenario indicates that an integrated development push across development sectors is the best way to achieve sustained inclusive growth and development in Mali.
Similarly, in the Combined scenario, the GDP per capita for Mali will increase to US$2 468 (US$167 larger than the Current Path) in 2030 and US$4 284 by 2043. This will be US$1 225 higher than the projection of US$3 059 on the Current Path, meaning that the materialisation of the Combined scenario could significantly improve the living standard of the Malian population. The projected GDP per capita in this scenario will be US$1 225 (or 40%) more than the Current Path average for low-income countries in Africa by 2043. The results reflect the importance of a multisectoral program of interventions to rapidly improve average incomes in Mali.
Chart 31 presents the value added by sector in the Current Path and in the Combined scenario, from 2020 to 2043. The data is in US$ 2017 and as a percentage of GDP.
Our modelling provides forecasts in six economic sectors namely agriculture, energy, materials (including mining), manufactures, services and ICTech.
The structure of the Malian economy will undergo significant transformation in the Combined scenario. The size of each sector increases in the Combined scenario (as expressed in US$ terms) given the huge increase in the size of Mali’s economy, but their relative contribution to GDP changes. In summary it appears that Mali has the capacity to grow its manufacturing sector in the long term without trading it off with the agriculture.
In 2030, the agriculture sector will record the largest improvement in the scenario valued at US$1.3 billion over the Current Path. This will be followed by the services and the manufacturing sectors with an improvement of US$931 million and US$163.6 million, respectively, over the Current Path in 2030. The materials, ICT and energy sectors will record modest gains of US$94.8 million, US$84.5 million and US$25.5 million, respectively, above the Current Path in 2030.
By 2043, the service sector will still be the largest contributor to GDP at 40.1% (valued at US$33.4 billion), although this will be lower than the Current Path of 51.6% (valued at US$27.3 billion). The manufacturing sector will be the second-largest contributor to GDP in the scenario by 2043 with a share of 30.8% (equivalent to US$25.7 billion) — higher than the Current Path of 17.0% (US$9.0 billion). It means that the manufacturing sector stands to benefit and grow more than other sectors in the Combined scenario. The share of the agriculture sector will decline to 17.2% (valued at US$14.4) in the Combined scenario compared to 17.8% (valued at US$9.4) in the Current Path in 2043. Although it declines in its contribution, it will therefore be larger in absolute terms.
In the Combined scenario, the share of ICT and materials will decline below the Current Path to constitute 3.2% and 7.2%, respectively, although although both will be larger in absolute terms. The share of the energy sector will rise above the Current Path to 1.5%.
Chart 32 presents the size of the informal sector as a percentage of the total economy in the Current Path and in the Combined scenario, from 2020 to 2043.
In the medium term, the Combined scenario will lead to a modest reduction in the informal economy estimated at 30.6% of GDP in 2030 instead of the 31.8% in the Current Path. Similarly, the size of the informal labour force in Mali will decline to 75.1% in the Combined scenario instead of 78.4% in the scenario. However, in the long term, the Combined scenario will result in a significant reduction in the size of the informal size in Mali.
By 2043, the size of the informal sector in Mali will decline to 23.3% of GDP although its absolute value will rise to US$19.4 billion. At this rate, the contribution of the informal economy will be lower than the 29.6% (valued at US$15.7 billion) on the Current Path and below the average for low-income countries in Africa at 27.0%. Likewise, by 2043, there will be about 1.2 million fewer labour in the informal sector as compared to the Current Path. This will correspond to informal labour constituting 51.4% of total labour in the Combined scenario instead of 72.1% in the Current Path, reflecting the anticipated improvement in state capacity through more tax revenue. If Malian authorities manage to steadily formalise ever-larger portions of the large informal sector through digitisation, for example, it could lead to increased productivity, higher GDP and more government revenue.
Chart 33 compares life expectancy in the Current Path with the Combined scenario from 2020 to 2043.
Life expectancy measures the average lifespan of individuals in a country. In 2023, the average life expectancy at birth in Mali was 63.7 years, which was about 2.6 years lower than the average for the country’s income-group peers in Africa. Women in Mali generally live longer (64.4 years) than men (62.9 years). In the Current Path, life expectancy will increase to 67.4 years in 2030 and 72.4 years by 2043, which will be slightly higher than the average of 71.7 years for low-income African countries. In the Combined scenario, life expectancy will increase to 68.7 years in 2030 and 74.8 years by 2043, which will be 2.4 years more than the country’s Current Path in the same year. In both the Combined scenario and the Current Path, women will be expected to live about two years longer than men by 2043.
Chart 34 compares the Gini coefficient in the Current Path with the Combined scenario for 2023 and 2043.
In the Combined scenario, both the number and the proportion of poor people in Mali will significantly decline. In the medium term, the 2.3 million people (representing 7.8% of the population) will live below the poverty line of US$2.15 by 2030 in the Combined scenario. In the long term, extreme poverty in Mali will be reduced further such that by 2043, only about 150 000 people in the country (0.4% of the population) will be living in extreme poverty. This means that, compared to the Current Path, almost 2.2 million more people could be lifted out of poverty by 2043 in this scenario. Indeed, in the scenario, Mali could meet its SDG target of eliminating extreme poverty by 2037 compared to the Current Path where such a goal can only be met in 2051. In addition, the projected proportion of poor people in Mali in the Combined scenario will be far lower (23.7 percentage points lower) than the average of 24.1% of low-income African countries by 2043.
The Gini coefficient is the standard measure of the level of inequality in a country where a higher score depicts greater inequality while a lower score shows a more equal country. High levels of income inequality have many negative effects including a breakdown of social structure and cohesion, which can result in instability.
Historically, inequality in Mali has been lower than the average of its income-group peers in Africa. In 2023, Mali’s Gini coefficient was 0.36 compared to the average of 0.40 of the low-income country in Africa. This makes Mali the least unequal country among the low-income countries in Africa and the sixth least unequal in Africa. On the Current Path, income inequality in Mali will remain at the same level across the forecast horizon.
In the medium term (by 2030), Agriculture, Governance and Financial flows are the scenarios with the greatest impact potential to reduce income inequality in Mali. However, in the long term by 2043, the Manufacturing scenario scenario has the greatest potential to reduce income inequality followed by the Governance and Education scenarios. In the Combined scenario, inequality in Mali will slowly decline to 0.34 in 2030. By 2043, inequality in the scenario will further reduce below the Current Path with a Gini coefficient of 0.29 by 2043 compared to 0.35 in the Current Path. This means that economic growth in the Combined scenario will be broadly shared.
Chart 35 compares carbon emissions in the Current Path with the Combined scenario from 2020 to 2043. Note that the data is in million tons of carbon, not CO2 equivalent.
Like most African countries, Mali’s emission of carbon is very low. In 2023, Mali released about 2.4 million tons of carbon from fossil fuel use - the 4th-largest emitter among low-income African countries.
According to the Greenhouse Gas Emissions Factsheet by ClimateLinks, deforestation is one of Mali’s main causes of carbon emissions, accounting for around 17% of all greenhouse gas emissions. Logging, fuelwood use and the spread of agriculture are a few examples of the causes of deforestation. In addition to increasing CO2 emissions, the loss of forest cover diminishes the country’s capacity to absorb carbon through natural carbon sinks, worsening Mali’s overall carbon footprint.
The energy sector in Mali is a substantial source of carbon emissions, mainly as a result of the country’s reliance on conventional biomass for cooking and heating. Most people still use firewood and charcoal as their primary energy sources in rural regions, which increases indoor air pollution, harms people’s health and increases carbon emissions. Inadequate public transportation infrastructure, the use of a large number of outdated and inefficient automobiles and a lack of vehicle emission requirements are the leading causes of the transportation sector's contribution to carbon emissions. These elements raise fuel consumption, which in turn causes a rise in CO2 emissions.
Mali has taken steps to reduce carbon emissions and prepare for the impacts of climate change. In its Intended Nationally Determined Contributions (INDC), the country committed to reducing emissions by 27% from projected levels by 2030, compared to the status quo. The country set specific targets for emission reductions across various sectors: agriculture (29%), energy (31%) and Land Use Change and Forestry (LUCF) (21%). To decrease its reliance on fossil fuels, Mali has focused on promoting renewable energy sources, such as solar and wind. Efforts to reduce biomass demand and associated carbon emissions include initiatives aimed at increasing access to cleaner cooking technologies. Additionally, Mali has pursued sustainable land management practices to combat deforestation.
On the Current Path, carbon emissions from fossil fuels will increase 3.9 million tons in 2030 and to 7.2 million tons by 2043. In the Combined scenario, Mali’s total carbon emissions will rise to 8.4 million tons — 17.7% higher than what is estimated in the Current Path in the same year. The materialisation of the Combined scenario and achieving sustainable economic development will come at the cost of more carbon emissions in Mali. However, the country can rely on its huge renewable energy potential to pursue a green development pathway.
The impact of the scenarios differs. In the medium term (by 2030) and long term (2043), the Agriculture, Manufacturing and Governance scenarios are the most carbon-intensive scenarios. It is important to note that these are also the scenarios that have the most potential to increase economic growth and reduce poverty. This implies that embarking on aggressive economic growth will come at a cost to the environment. For instance, intensive manufacturing involves the production of low-end manufacturing goods that will imply more fossil fuel usage. On the other hand, the Large Infrastructure and Leapfrogging as well as the Demographics and Health scenarios are the least carbon-intensive scenarios in Mali, the latter because of the reduction in population growth.
Chart 36 compares energy demand and production in the Current Path with the Combined scenario from 2020 to 2043. Production is done in six types, namely oil, gas, coal, hydro, nuclear and other renewables. The data is converted into billion or million barrels of oil equivalent (BOE) to allow for comparisons. Note that energy production could be for domestic use or for export.
The total energy produced in Mali in 2023 was equivalent to 9.7 million BOE. In the same period, total energy demand of 28.3 million BOE was almost three times its than total production. This signifies a significant energy deficit that the country needs to meet. On the Current Path, total energy demand will outgrow production so that the demand for energy will be equivalent to 30.3 million BOE in 2030 and 65.6 million BOE in 2043. The main source of energy in Mali is oil, followed by gas and hydro. In 2023, the total amount of oil produced in the country amounted to 4.2 million BOE, constituting 43.8% of total energy production. The total amount of oil produced will increase to 20 million BOE, with its share declining to 42% in 2030 and 29.4% of total energy production on the Current Path by 2043. Gas production constituted 42.4% (almost 4.1 million BOE) of total energy production in 2023 but will rapidly decline to about 38.3% in 2030 and 16.8% (valued at 300 000 BOE) in 2043 on the Current Path.
Hydro, which in 2023 constituted just 11.2% of total production (1.1 million BOE), is projected to slightly rise to 13.0% in 2030 but decline to 7.8% by 2043 in the Current Path. Solar energy production is currently low, estimated at 0.9% of total production. However, this will grow rapidly to constitute 4.8% in 2030 and 29.8% of total energy production (8.1 million BOE) by 2043 in the Current Path. At this point, solar energy will become the largest source of energy produced in Mali overtaking oil, gas and hydro. Other renewable energy mostly from biomass also accounted for 1.4% of total energy production and will remain so by 2030 but decline to 1% in 2043.
As expected energy demand in the Combined scenario is higher, creating a larger energy deficit, with renewable energy becoming the dominant energy source, surpassing oil and gas. In the Combined scenario, energy demand in Mali jumps to 44 million BOE in 2030 and 106.8 million BOE by 2043. This will be 1.5 million BOE in 2030 and 22.6 million BOE by 2030 more than the Current Path. Although the total energy production of 29.0 million BOE in the Combined scenario in 2043 will be 10.7 million BOE more than the Current Path, it will fall short of the total demand. Indeed, by 2043, the excess demand for energy of 18.3 million BOE will be almost twice the Current Path projections.
In the Combined scenario, the share of other solar energy in total energy production in the country will rise significantly to constitute 61% of total energy production to become the leading contributor. This will be 31 percentage points more than its contribution to total energy production in the Current Path. The share of hydro production estimated at 7.9% in 2043 in the scenario will also be above its contribution to total energy production in the Current Path. Consequently, the contribution of oil and gas to energy production in the scenario will be 10.5 and 16.5 percentage points, respectively, below the Current Path by 2043.
Chart 37 summarises the policy recommendations for Mali.
Since gaining independence, Mali's economy has experienced notable growth, primarily driven by the implementation of various medium-term programs and internationally supported economic reform initiatives. These include the Structural Adjustment Programmes, the Aid Effectiveness efforts, the Highly Indebted Poor Countries (HIPC) initiative, the Millennium Development Goals (MDGs) and the Sustainable Development Goals (SDGs). The impact of these policies and initiatives has contributed to relatively high economic growth, surpassing the performance of its income peers in Africa over the past three decades.
Despite Mali’s economic growth, the anticipated development gains have been slow to materialise. While the country is endowed with abundant natural resources, it faces challenges in keeping pace with the needs and expectations of a rapidly growing population. Poverty and inequality remain widespread, public debt is rising and youth unemployment continues to be a pressing concern, while average income growth remains modest. The informal sector dominates a significant portion of the economy, depriving the government of potential revenue but serves as an essential survival sector for large portions of the population. The macroeconomic fundamentals of the Malian economy remain fragile, with an economic structure that is still largely agrarian and untransformed, relying heavily on the export of traditional raw materials like gold and cotton. As a result, economic growth is highly volatile, subject to changing weather conditions, fluctuations in international commodity prices and external shocks.
Mali’s economy faces challenges across various sectors, in spite of the improvements in certain areas. The country’s youthful population and rapid population growth have slowed economic progress, with Mali expected to enter a demographic dividend only by 2059. While communicable and infectious diseases remain the leading cause of mortality, deaths from more expensive non-communicable diseases are on the rise. Access to education, particularly for females, continues to be a challenge, and the quality and relevance of education is low. Agriculture in Mali is rainfed and largely subsistence in nature, heavily reliant on unpredictable weather patterns and the effects of climate change, which pose a significant threat of severe food insecurity.
The manufacturing sector is underdeveloped, hindered by inadequate transportation networks, unstable power supplies and limited access to financing. Mali’s decision to leave ECOWAS will inevitably affect its intra-regional trade, particularly with non-WAEMU members. A large portion of the population, especially in rural areas, lacks access to electricity, and even those with access face unreliable and expensive power. Foreign aid, a critical source of financial support for the government, is declining in the contribution that it makes to government revenues, and foreign direct investment (FDI) and remittances have yet to make up for the shortfall. Mali also contends with significant governance challenges, including insecurity, limited institutional effectiveness, concerns around transparency, and ongoing efforts to achieve a stable transition toward democratic governance.
In effect, while Mali's economy is growing, the required and associated governance transformation lags behind. On its current development trajectory, the country will fall short of achieving key development goals, including SDG 1 of eliminating extreme poverty by 2030. This highlights the urgent need for Mali to rethink its economic development strategy, focusing on diversification and adding value to its primary commodities. In other words, for Mali to achieve sustainable development, it must address the structural challenges that have hindered its economy since independence. Additionally, the country must build a more resilient economy that is less vulnerable to external volatility and shocks, particularly those related to the global commodity cycle.
While international and regional organizations have made commendable efforts to support Mali’s transition to a democratic regime, it is important to recognize that long-term sustainability will require prioritizing economic reforms. A key observation from Mali's history is the notable correlation between economic performance and the occurrence of military takeovers. Previous coups in Mali, including those in 1990-92, 2012, 2020, and 2021, were preceded by economic crises, coupled with heightened insecurity, which contributed to conditions conducive to such takeovers. This highlights the critical role that the economic situation plays in determining the stability and sustainability of the governing regime. Therefore, a transition to democratic rule without addressing the underlying economic and security challenges will not be sustainable. Development partners must support Mali in rebuilding its economy and addressing its security challenges to ensure lasting peace and stability. While this will be a difficult task, it is not insurmountable.
As this study illustrates, Mali has the potential to increase its GDP to US$83.3 billion by 2043, which would represent a 57.3% increase over its current trajectory, with the economy growing at an average rate of 8.4% instead of 5.5% during that period. This growth could also improve living standards by raising GDP per capita by an additional 40%, reaching US$4 284. Furthermore, Mali could achieve its SDG target of eliminating extreme poverty by 2037, much earlier than the Current Path, where this goal would only be met in 2051. Additionally, income inequality could be reduced. Achieving these outcomes requires implementing major policy reforms and targeted investment in key sectors of the economy across demographics, health, education, agriculture, infrastructure, manufacturing, trade, financial flows and governance.
While a multisectoral approach is crucial, there are specific sectors that could rapidly unlock Mali’s development potential and should therefore be prioritised. Three critical sectors require focused attention from Mali’s authorities.
The first is the agricultural sector, which employs nearly 80% of the population and has the potential to boost incomes and reduce poverty in both the medium and long term. To harness this potential, Mali needs to modernise its agriculture and diversify away from cotton, exploring other sub-sectors such as biofuels, shea butter, mangoes, peanuts, cashews, poultry and cattle production, all of which remain underdeveloped but hold significant promise. Secondly, an aggressive industrialisation strategy focused on producing low-end manufacturing commodities could transform Mali’s economy from one that is heavily reliant on commodity exports to a more diversified, industrial economy. This shift would create jobs, reduce poverty and ultimately improve living standards and the quality of life for Malians. The third and perhaps most critical focus area for unlocking Mali's development potential is improving governance, particularly by reducing corruption and enhancing efficiency in the public sector. However, none of this can be achieved without addressing Mali's security challenges, restoring stability and re-establishing constitutional rule. History has shown that instability in Mali often results in displacement, hunger and worsened economic crises.
To eradicate poverty, Mali must also invest significantly in education to enhance its quality and ensure that students receive an education aligned with the demands of the 4th Industrial Revolution, vocational training in particular. Such investment will equip them with the knowledge and skills essential for the future of work. Another critical area of consideration is financial flows, particularly the role of aid in supporting Mali's development aspirations. In the medium term, aid remains a crucial source of funding to reduce extreme poverty, as a significant portion is allocated to essential sectors like education and health. While many donors have signalled a withdrawal of aid to the country following the inability to transition to democratic governance, such a withdrawal would severely undermine Mali’s development prospect. An illustrative scenario separately modelled for this study finds that a 30% reduction in aid over the next decade could lower Mali’s GDP by US$34.5 million in 2030 and US$747 million by 2043 compared to the Current Path projections. Furthermore, the same level of aid reduction would significantly worsen poverty levels. In the medium term, approximately 87 000 Malians could be pushed into extreme poverty, and by 2043, nearly 235 000 people could fall below the poverty line of US$2.15 per day. These projections underscore the critical importance of aid to Mali’s economy and the devastating impact an abrupt withdrawal of aid would have on livelihoods and economic stability in the country.
In view of the foregoing discussions, the study concludes with a set of recommendations to government and development partners in considering Mali’s long-term prospects. Some are not realistic in the shorter term and many require an environment that is more stable and secure than the current situation in large parts of the country:
Human Capital (Demographics, Health and Education)
- Address Mali’s security challenges to reduce student and teacher absenteeism and school closures.
- Intensify education on family planning and provide access to affordable and modern contraceptives to reduce unwanted pregnancy.
- Promote girl child education to reduce maternal mortality rate and teenage pregnancy. An initiative in this area is to reduce barriers facing girls of school going age. For instance, providing free feminine hygiene products to teenage girls can reduce school absenteeism and dropout.
- Provide youth apprenticeship programmes and entrepreneurial programmes as part of measures to address youth unemployment.
- Provide additional incentives to health professionals posted to rural areas to attract more health workers in rural communities. This can be in the form of hardship allowance or provision of free housing facilities to those medical officers posted to remote rural communities.
- The government, through the appropriate Ministry, should intensify education on healthy lifestyle practices to reduce the rising burden of diseases such as strokes and respiratory infections in the country.
- There is also a need for the introduction of school feeding programmes, especially for rural students who have been displaced by the effects of climate change and insecurity to reduce student absenteeism and drop rate.
- Establishment of community day senior high schools in rural areas to ensure adequate infrastructure to enrol more pupils in upper secondary.
- Expand access to basic education by introducing free education for students from grade 10 to 12 (upper secondary) as is the case for lower secondary. This should be targeted to ensure that households that can afford to pay their wards' fees are made to do so. Accordingly, students from private Junior High Schools (JHS) could be charged while SHS remains free for those from public JHS. Alternatively, parents could be made responsible for the feeding fees of their wards so that the government only has to cater for other costs.
- Elimination of schools under trees in basic schools and expansion of infrastructure at the secondary level to abolish the double track system.
- Continue with the prioritisation of STEM and vocational education to ensure that more students enrol in STEM and vocational courses. In this vein, the government can build model STEM school in all regions.
- Provision of textbooks, school uniforms and other teaching and learning materials especially for students in rural areas at the basic level.
Agriculture Revolution
- Expand and modernise irrigation infrastructure such as the lands of the Office du Niger initiative to other areas to reduce dependency on unpredictable rainfall to ensure all-year-round agriculture. Also, promote water-saving technologies such as drip irrigation and water harvesting systems.
- To improve crop yield, government should provide subsidies on fertilisers, pesticides and improved seed especially to small-scale farmers to ensure improved yields.
- To reduce post-harvest losses, government should establish storage facilities, and improve rural roads to enhance market access. Another intervention in this area is to establish cooperatives to enable bulk purchasing and reduce individual costs.
- Government should incentives farmers to diversify into production of other sub-sectors such as biofuels, shea butter, mangoes, peanuts, cashews, poultry and cattle production, all of which remain underdeveloped but hold significant promise.
- Train farmers in climate-smart agricultural techniques, including crop rotation, agroforestry and soil conservation. Introduce drought-resistant and fast-maturing crop varieties.
- Strengthen research on climate-smart agricultural technologies as part of the National Climate-Smart Agriculture and Food Security Action Plan.
- The government in partnership with traditional authorities should address land tenure and land ownership challenges to ensure large-scale agriculture.
- Strengthen partnerships with multilateral organisations like the Niger Basin Authority and the Lake Chad Basin Commission to ensure the sustainable management of vital water resources for agriculture and livelihoods.
Manufacturing
- Address the unstable electricity supply in the country for firms to access reliable power for production including investment in the national grid and leveraging Mali’s renewable energy potential particular in solar, biomas and hydro to expand access.
- Subsidise the cost of electricity to firms especially infant industries to provide a cheaper source of power for production.
- Create special economic zones by giving tax incentives, simplified business registration and regulations to attract investment in manufacturing.
- Grant tax exemptions to import substitution and export promotion industries in specialised commodities. For instance, Mali can prioritise tax exemptions to textiles industries to create a value chain and value addition to its cotton.
- Promote manufacturing sector growth requires improving the country's macroeconomic conditions so that financial institutions can advance cheaper credit to micro-, small- and medium-scale enterprises, which constitute the majority of firms in Mali.
- Address the rising youth unemployment by promoting entrepreneurship, skills development and an enabling environment for the private sector to thrive in order to create more jobs.
- Higher educational institutions should collaborate and partner with the private sector and businesses to design curricula that equip students with the required industrial and critical skills.
AfCFTA
- Commit to and leverage opportunities under the African Continental Free Trade Agreement (AfCFTA) to boost exports, integrate Mali into regional and continent-wide value chains, and mitigate the potential negative consequences of withdrawing from ECOWAS.
- The AU, international organisations and development partners should employ diplomacy to ensure that Mali does not exit ECOWAS. However, if it eventually withdraws from ECOWAS, it should be negotiated in a way that does not lead to disruption in free movement of goods and services especially in non-WAEMU ECOWAS member states.
- Strategically engage with non-traditional partners to navigate geopolitical shifts, while ensuring alignment with Mali's long-term development goals.
Infrastructure
- Embark on massive rural electrification projects to improve electricity access to rural areas. This can be achieved using its renewable energy resources, particularly solar and hydroelectric power, by expanding its solar mini-grids and hybrid systems initiatives for remote communities.
- The government should urgently address the inefficiency in power distribution and revenue collection by the state utility, Energie du Mali (EDM) to ensure revenue maximisation in the distribution of power.
- The government should continue to promote digitalisation to rapidly formalise the economy. In this vein, it should work with telecommunication companies to reduce the cost of data. It should also train more young people in ICT and digital skills.
- Rely on its huge renewable energy sources such as solar, biomass and hydro to gradually phase out reliance on fossil fuel for Mali’s energy needs. This will help promote growth while ensuring that environmental concerns are addressed.
- Grant incentives to informal businesses to formalise their operation. This can be achieved by tax education and tax incentives to micro and small business owners. For instance, the government can use a portion of tax by these group as pension scheme or insurance contribution.
Financial Flows
- Transition the country into a democratic rule and address its insecurity challenges to provide regime stability and attract foreign direct investment.
- Create an enabling environment through a stable macroeconomic stability to inspire investor confidence.
- The government should encourage foreign investors to invest in capital and knowledge transfer to build the needed workforce in the country.
- Mali can rethink innovative financing as means of financing it development priorities. For instance, the country can leverage its huge mineral deposits to issue long term bonds at cheaper cost to finance some of its large infrastructure needs.
- With the massive remittance inflow into the country, the government should encourage its expatriate community to invest in the economy by establishing diaspora bonds, as countries such as Israel, India, Nigeria and Ethiopia have done. These bonds not only provide a secure investment opportunity for the diaspora but also inject much-needed capital into the economy, fostering growth and development.
- Given the critical importance of aid to Mali’s economy and the devastating impact an abrupt withdrawal of aid would have on livelihoods and economic stability in the country, development partners should rethink their decision and support Mali with aid in the medium term to support poverty eradication.
Governance
- Commit to the full implementation of the roadmap outlined by the Dialogue Inter-Malians for Peace and National Reconciliation, which was concluded in 2024 to address the recurring conflict in the country.
- Rethink the management of the security crisis, particularly regarding the protection of civilians and the need to complement military action with non-military actions.
- Commit to transitioning the country into democratic rule as initially agreed upon in the 2023 constitution.
- Provide the necessary financial resources and guarantee the independence of anti-corruption institutions, such as the Central Office for Combating Illicit Enrichment (OCLEI) and the Office of the Auditor General.
- Promote the role of civil society participation in the governance process of Mali by guaranteeing their independence and safety.
- Reinforcing the reform of the security sector (army, internal security forces, justice), ensuring that the process is inclusive and transparent.
- Promote virtuous governance of the security sector, by effectively involving civil society in the democratic control of this sector.
Addressing these challenges will require concerted efforts from Malians, regional actors, and the international community. The stakes are high for a region already grappling with the compounded impacts of climate change and insecurity.
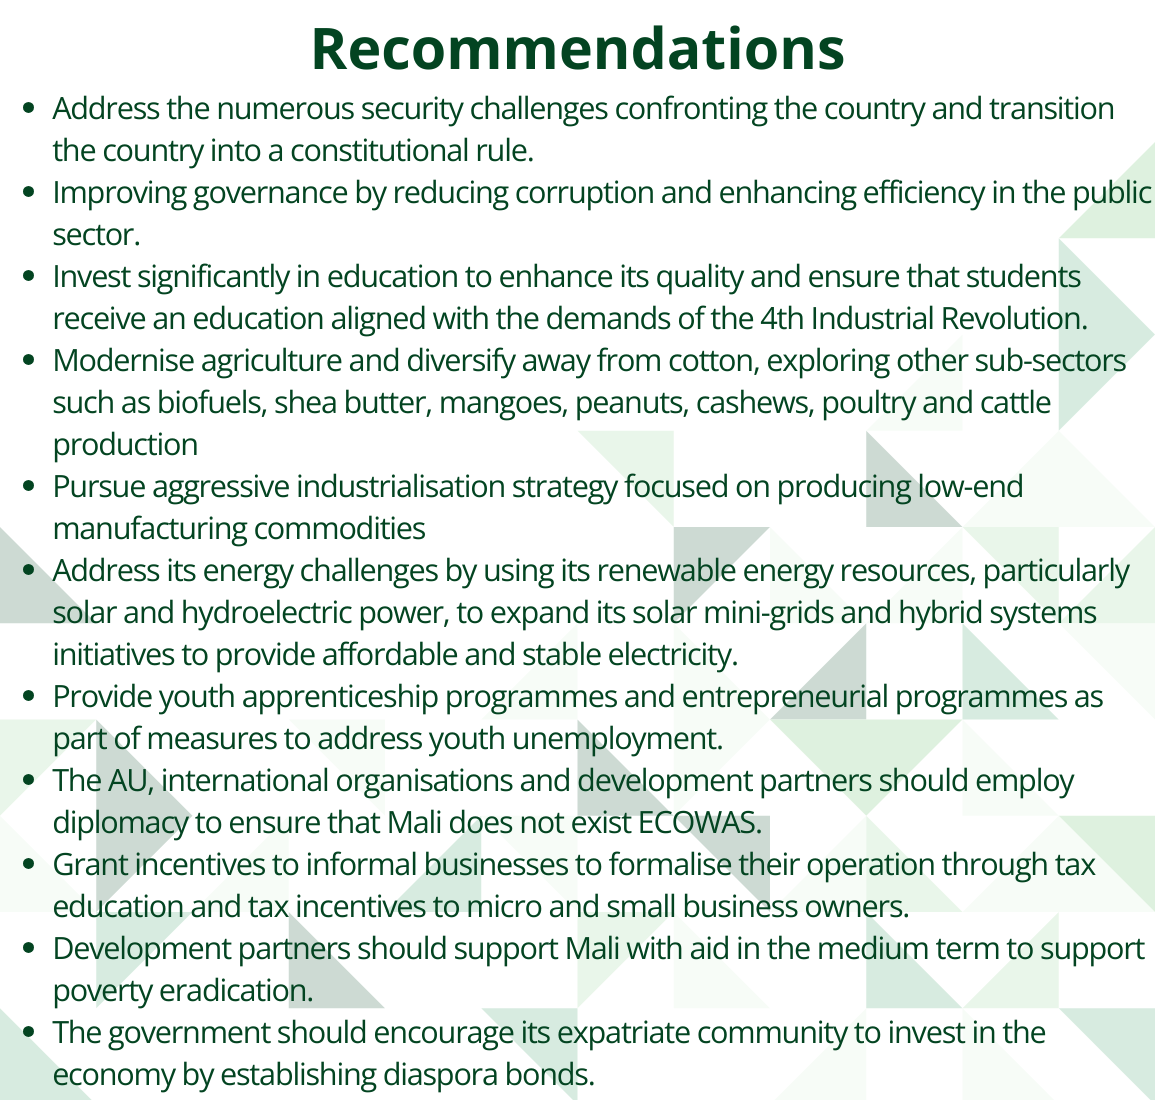
Endnotes
The data on agricultural production and demand in the IFs forecasting platform initialises from data provided on food balances by the Food and Agriculture Organization (FAO). IFs contains data on numerous types of agriculture but aggregate its forecast into crops, meat and fish, presented in million metric tons.
Trade openness measures the extent to which a country is engaged in the global trading system. This is calculated using the sum of the total exports and the total imports over the total GDP.
Page information
Contact at AFI team is Enoch Randy Aikins
This entry was last updated on 12 June 2026 using IFs v7.84.
Donors and sponsors
Reuse our work
- All visualizations, data, and text produced by African Futures are completely open access under the Creative Commons BY license. You have the permission to use, distribute, and reproduce these in any medium, provided the source and authors are credited.
- The data produced by third parties and made available by African Futures is subject to the license terms from the original third-party authors. We will always indicate the original source of the data in our documentation, so you should always check the license of any such third-party data before use and redistribution.
- All of our charts can be embedded in any site.
Cite this research
Enoch Randy Aikins (2026) Mali Development Futures. Published online at futures.issafrica.org. Retrieved from https://futures.issafrica.org/geographic/countries/mali/ [Online Resource] Updated 12 June 2026.