 11 Large Infrastructure
Feedback welcome
Our aim is to use the best data to inform our analysis. See our Technical page for information on the IFs forecasting platform. We appreciate your help and references for improvements via our feedback form.
This theme explores Africa’s infrastructure gap, including roads, railways, ports, airports and ICT, and its potential trajectory under a Current Path (business-as-usual) scenario to 2050. Further, the Large Infrastructure and Leapfrogging scenario models the effects of improved infrastructure, showing how strategic investments in both foundational and advanced systems, supported by modern technologies, could drive substantial development gains across the continent.
Summary
The theme begins with an introductory overview of the history, current progress and challenges of infrastructure across Africa. Importantly, the infrastructure gap is not only a deficit of assets, but a reflection of fragmented systems, weak coordination and limited alignment with development priorities.
- Despite progress in infrastructure development, the continent, particularly sub-Saharan Africa, lags behind other developing regions on key infrastructure indicators.
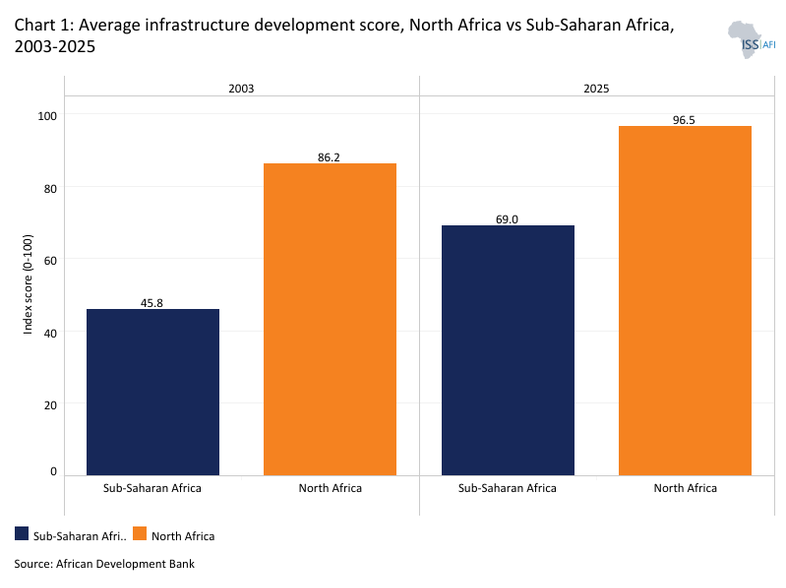
- Sub-Saharan Africa improved its Africa Infrastructure Development Index (AIDI) score by about 50% between 2003 and 2025; North Africa improved by 12% from a higher baseline.
- The infrastructure gap reflects colonial legacies, post-independence choices and ongoing financing and governance constraints.
Subsequently, the first half of this report provides assessments of the current status and likely future development in a business-as-usual forecast (Current Path) for each type of infrastructure. These infrastructure gaps are interconnected, with weaknesses in one system often constraining progress in others and limiting wider productivity gains.
- As of 2024, about 58% of Africa’s population had electricity. Only Egypt, Mauritius, Seychelles, Morocco, Algeria and Tunisia have achieved universal access; about 600 million people remain without electricity.
- Under the Current Path, 543 million Africans will still lack electricity in 2050, virtually unchanged from today, though the share of the population without access will fall to 21%.
- Roads carry 80% of freight and 90% of passenger traffic, but scale, quality and coverage remain inadequate.
- Port infrastructure remains uneven across the continent. Northern African countries—particularly Egypt, Morocco, Algeria and Tunisia—host a dense concentration of international and regional ports, while South Africa, Nigeria and Angola lead in the rest of Africa
- Africa’s airport infrastructure has expanded steadily in recent years; yet Africa’s aviation sector continues to lag behind global standards.
- Over the past two decades, rapid mobile phone adoption and rising internet use have significantly expanded connectivity across the continent. However, major challenges remain, particularly in affordability, the availability of localised digital services and the need to connect underserved communities.
- Taken together, these trends suggest that while infrastructure access is expanding, the pace and quality of progress remain insufficient to meet Africa’s long-term development needs.
- African governments are the main financiers of infrastructure in Africa, but face limited fiscal space amid rising debt. Financing relies on debt, equity and blended instruments. As a result, Africa’s infrastructure challenge is as much about improving governance, project preparation and risk management as it is about mobilising additional finance.
- Africa is not short of ambition for infrastructure, but projects need to be appropriate to the requirements given levels of development, overcome numerous hurdles and ensure that financing is attractive.
- Closing Africa’s infrastructure gap demands deeper coordination among governments, development partners and the private sector.
The second half of this theme report then models a positive Large Infrastructure and Leapfrogging scenario and its impacts on the economy and poverty. This scenario explores the potential effects of scaled-up and more coordinated investments in both foundational and advanced infrastructure on Africa’s development trajectory to 2050.
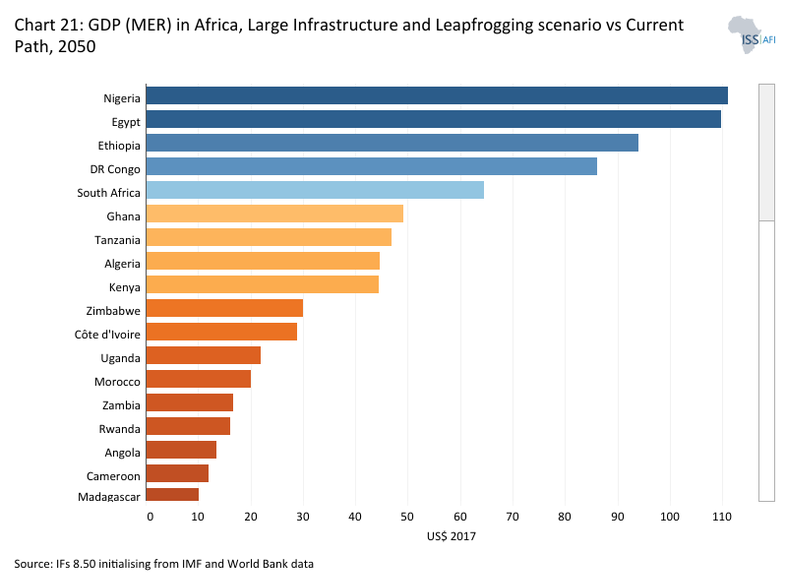
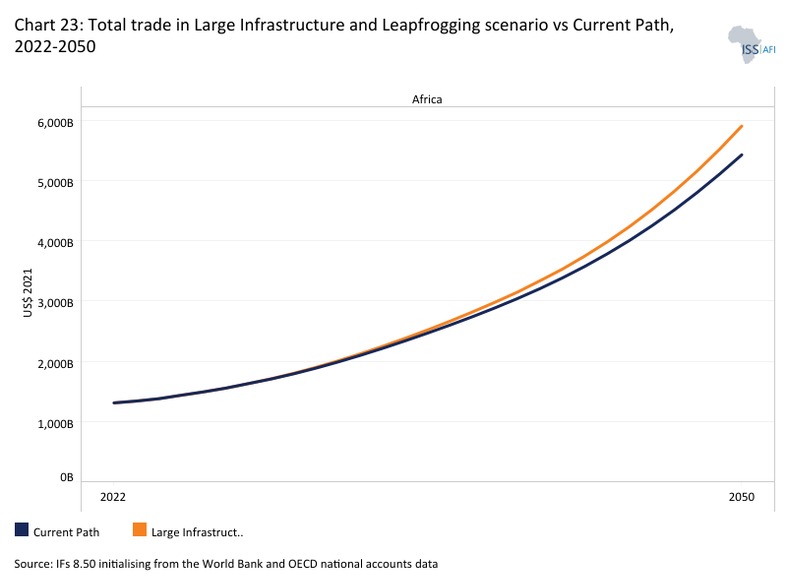
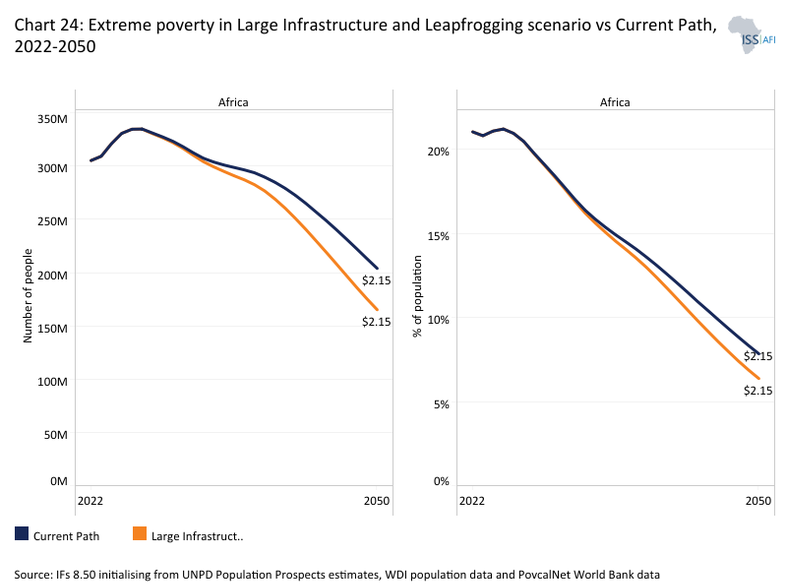
- The Large Infrastructure and Leapfrogging scenario demonstrates that strategic investments in both foundational and advanced infrastructure can stimulate economic growth, create jobs, reduce poverty and boost trade. By 2050, these investments could raise Africa’s GDP per capita by around US$510 and increase total trade volume by US$478 billion compared to the Current Path forecast. Extreme poverty is projected to fall to 299 million people, about 63 million fewer than under the Current Path. Overall, the African economy could be nearly one trillion US dollars larger in 2050. The scenario also shows that infrastructure improvements can reinforce each other, with gains in energy, transport and digital connectivity jointly supporting higher productivity and economic transformation.
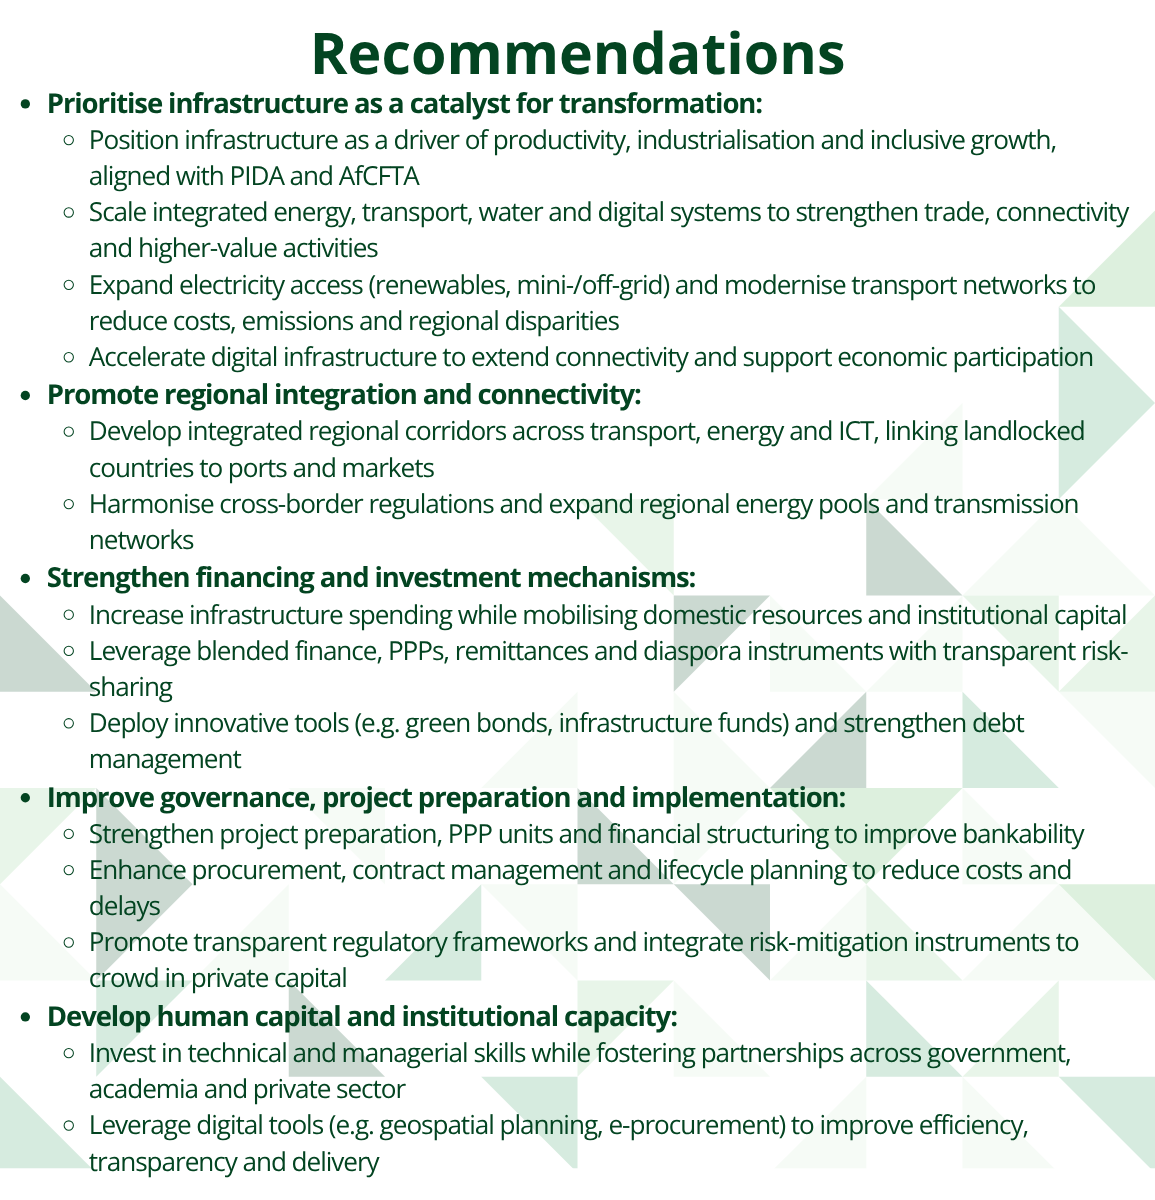
The theme concludes with recommendations for African policymakers. It identifies key priorities for more effective infrastructure development and highlights how stronger coordination, governance, project preparation and financing can unlock long-term growth and development gains.
All charts for Large Infrastructure
- Chart 1: Average infrastructure development score, North Africa vs Sub-Saharan Africa, 2003-2025
- Chart 2: Comparison of infrastructure access in sub-Saharan Africa, North Africa, South Asia and South America in the Current Path forecast
- Chart 3: Access to electricity: total, urban & rural in Africa by income groups, 2022 vs 2050
- Chart 4: Electricity generation capacity per capita in Africa compared with South America and South Asia, 1990–2050
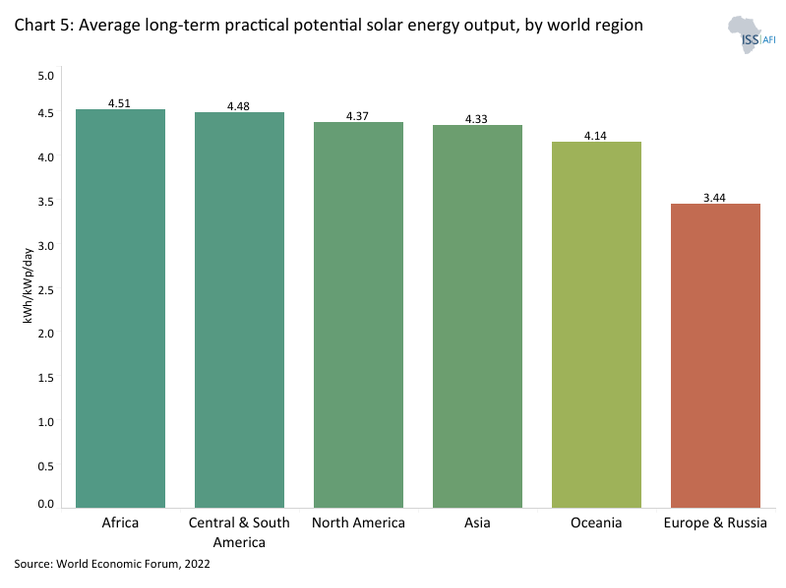
- Chart 5: Average long-term practical potential solar energy output, by world region
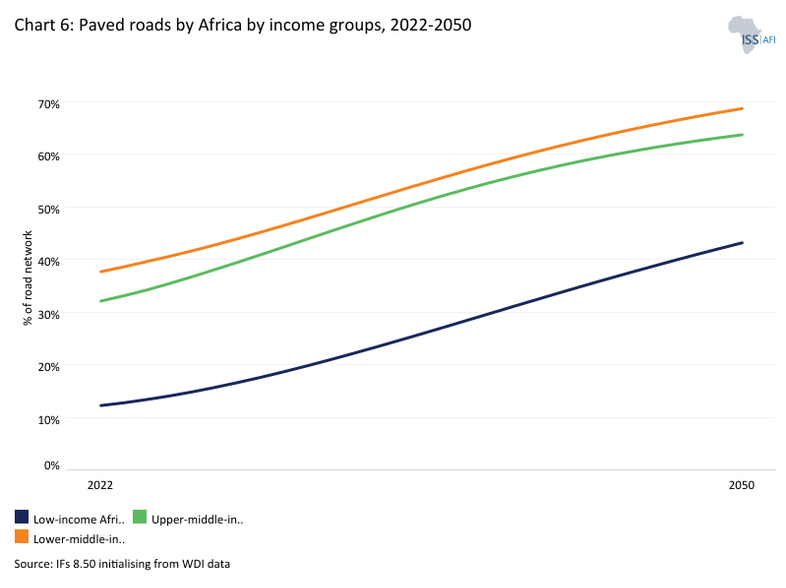
- Chart 6: Paved roads in Africa by income groups, 2022- 2050
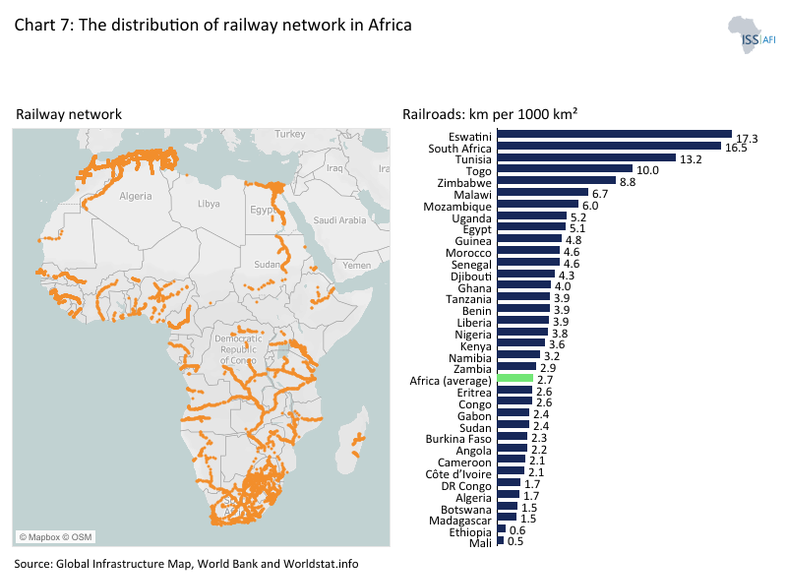
- Chart 7: The distribution of the railway network in Africa.
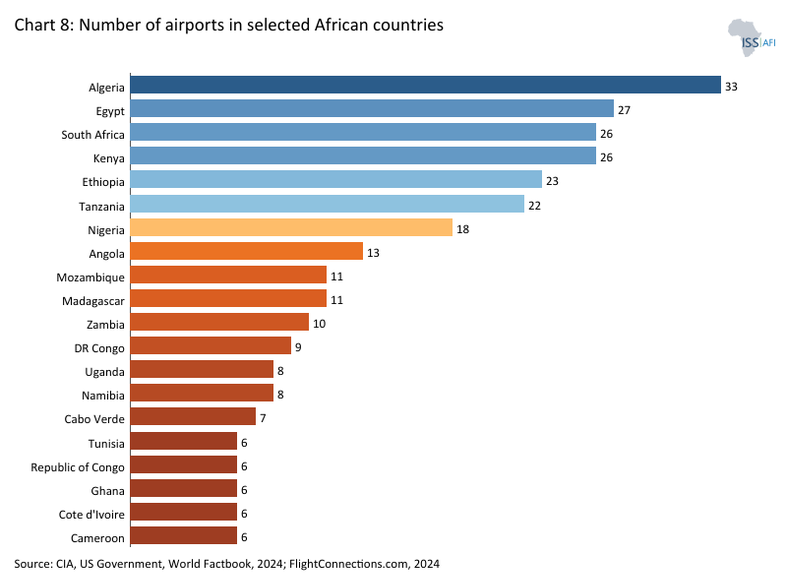
- Chart 8: Number of airports in selected African countries
- Chart 9: Access to fixed & mobile broadband in Africa, 2010- 2050
- Chart 10: Total infrastructure spending in Africa compared with South Asia and South America, 2020–2043
- Chart 11: Contribution (%) to Africa’s infrastructure financing, by source, annual average, 2016-2020
- Chart 12: PIDA Priority Action Plan 2( PAP 2) Dashboard
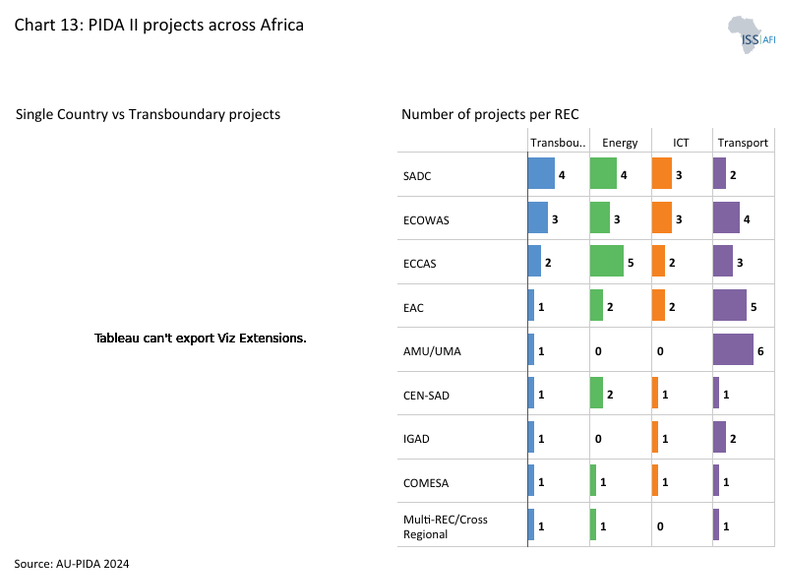
- Chart 13: PIDA projects across Africa
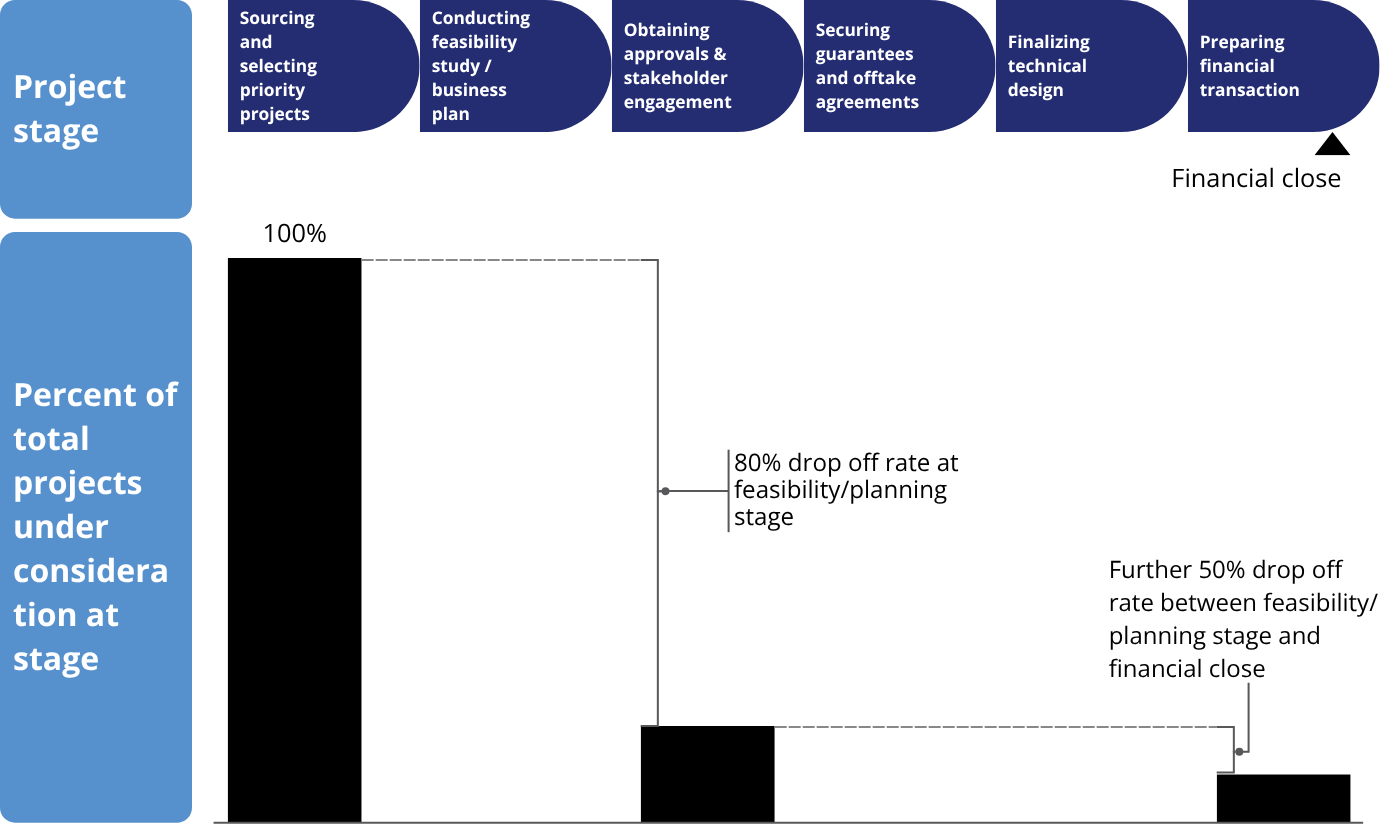
- Chart 14: Africa’s infrastructure pipeline
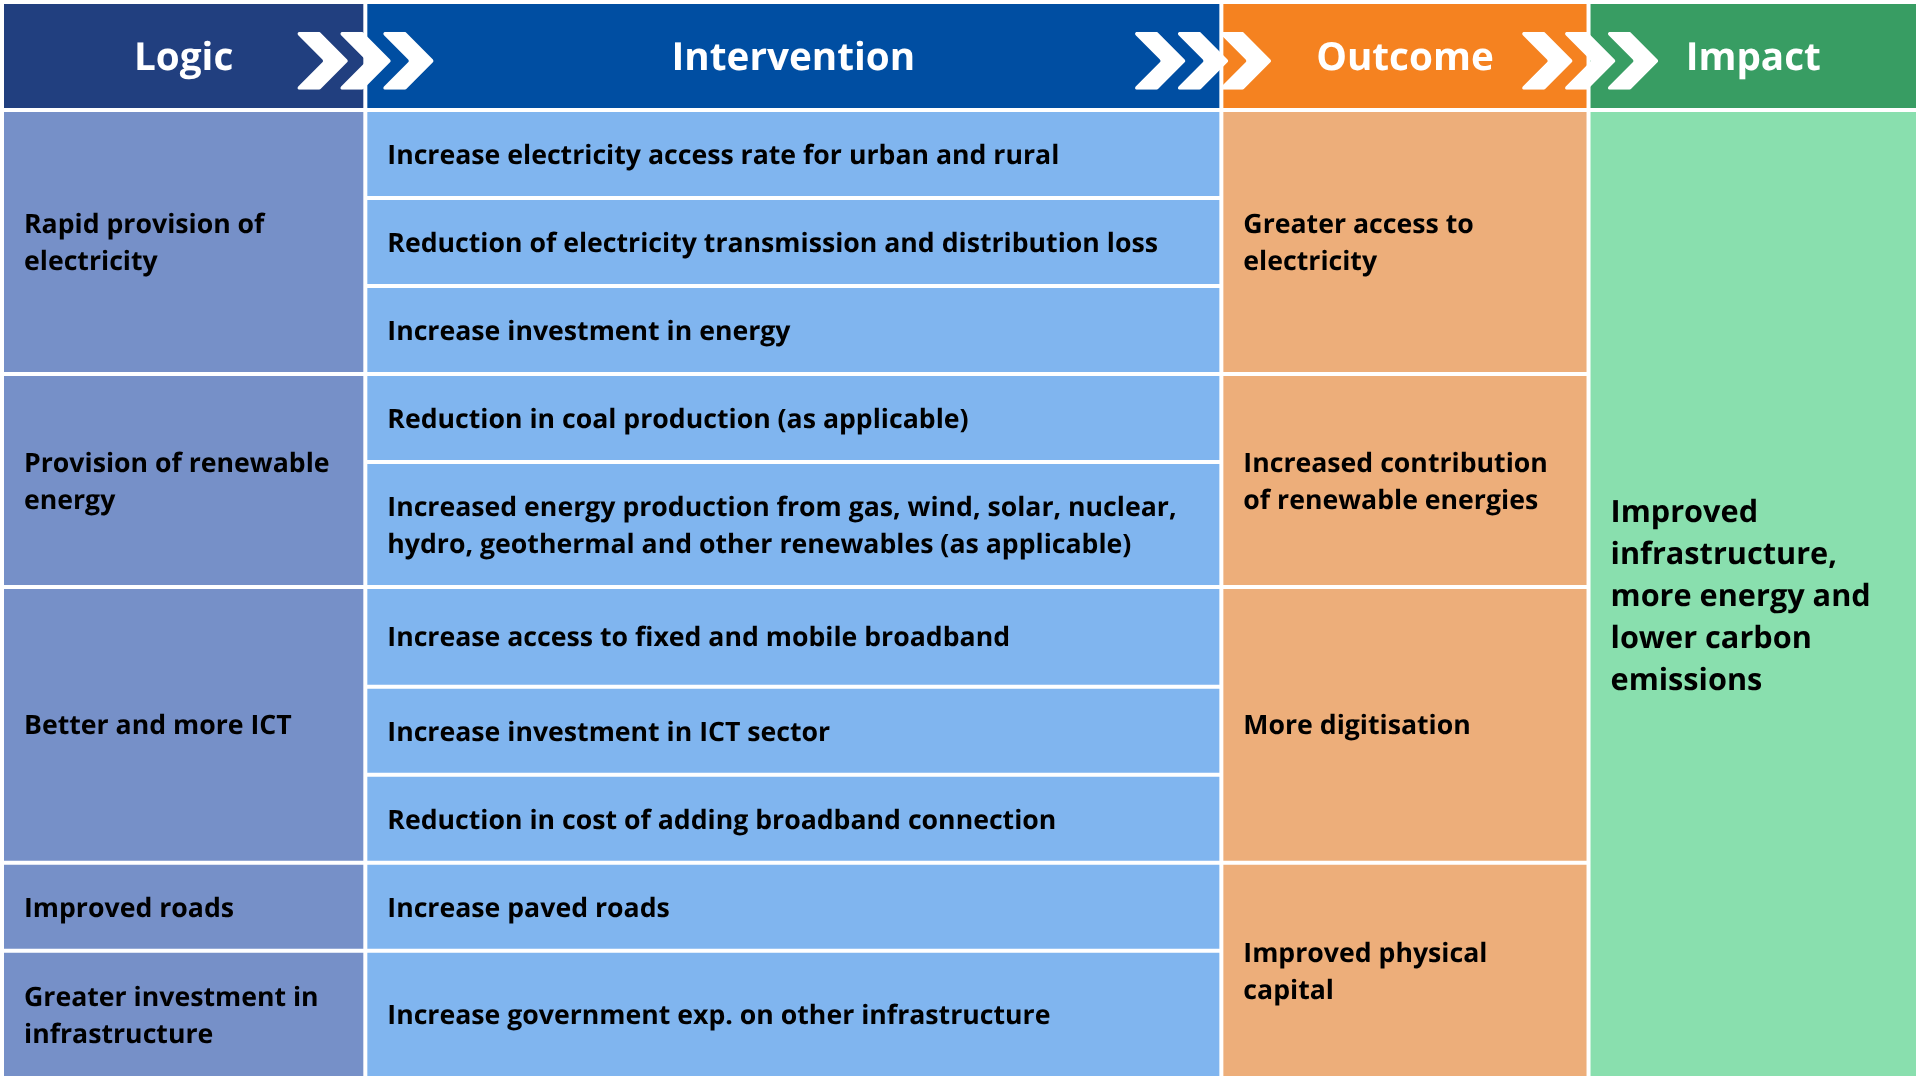
- Chart 15: Schematic of the Large Infrastructure and Leapfrogging scenario
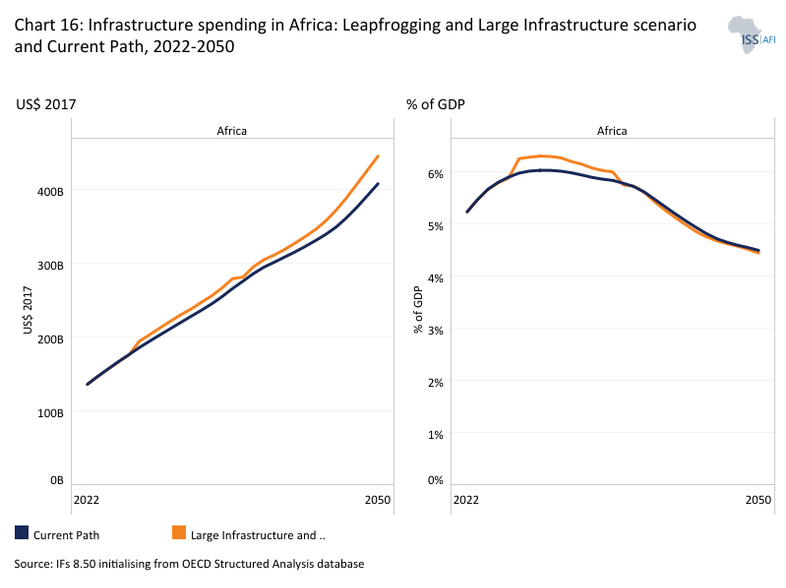
- Chart 16: Government spending on infrastructure in Africa: Infrastructure scenario and Current Path, 2020–2050
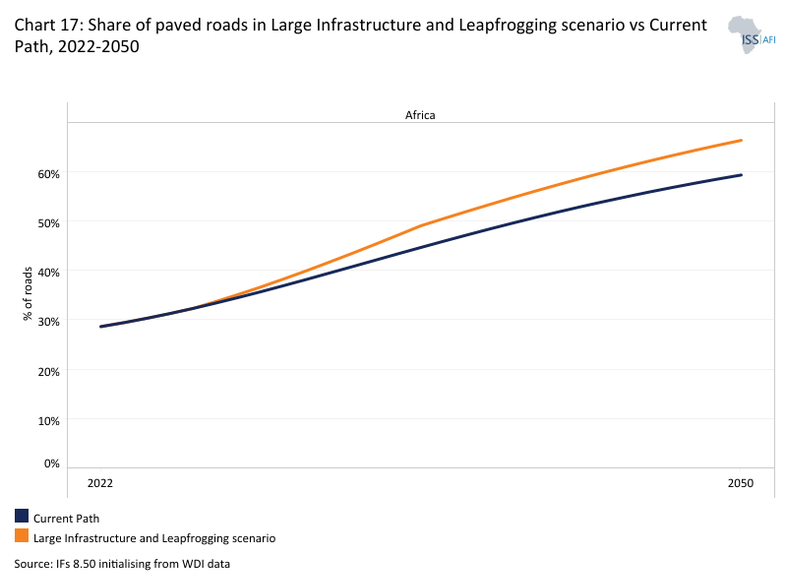
- Chart 17: Share of paved roads in Large Infrastructure and Leapfrogging scenario vs Current Path, 2022-2050
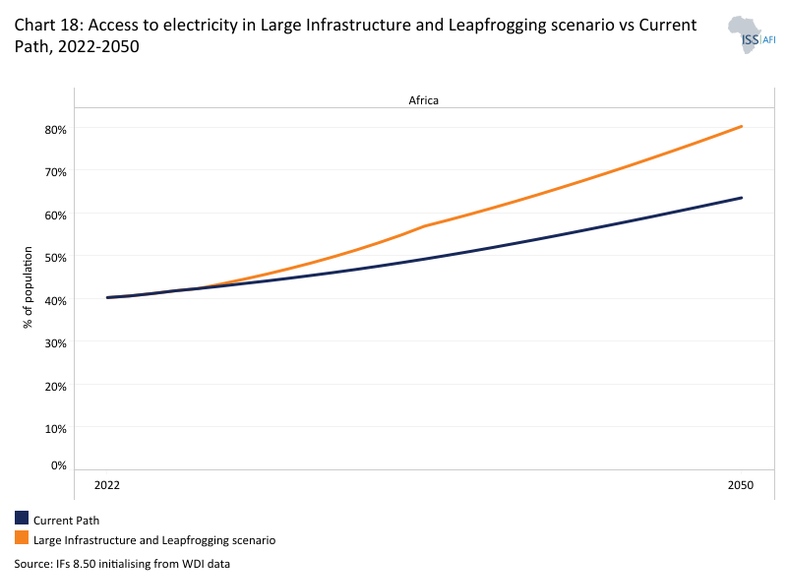
- Chart 18: Access to electricity in Large Infrastructure and Leapfrogging scenario vs Current Path, 2022-2050
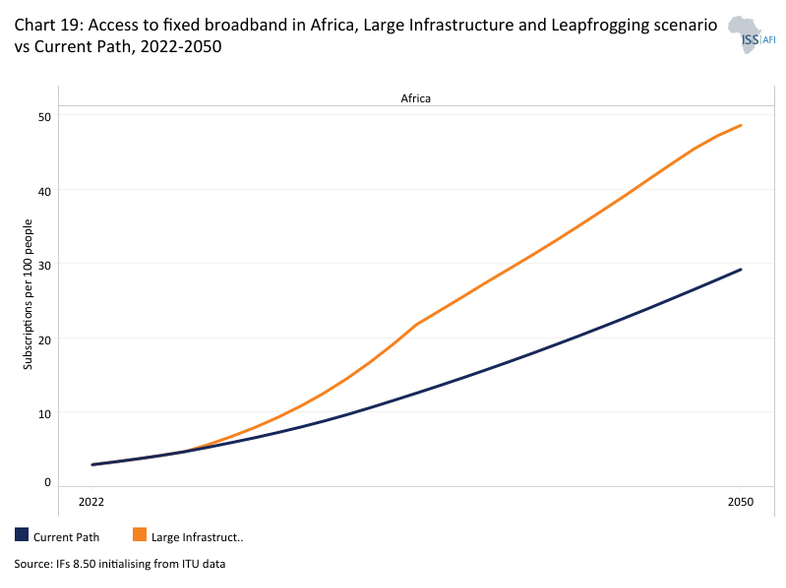
- Chart 19: Access to fixed broadband in Africa, Large Infrastructure and Leapfrogging scenario vs Current Path, 2022-2050
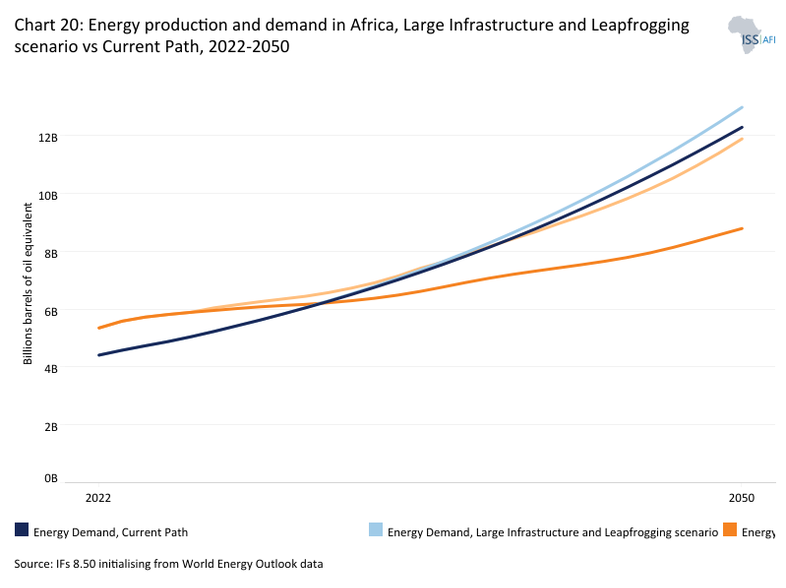
- Chart 20: Energy production and demand in Africa, Large Infrastructure and Leapfrogging scenario vs Current Path, 2022-2050
- Chart 21: GDP (MER) in Africa, Large Infrastructure and Leapfrogging scenario vs Current Path, 2050
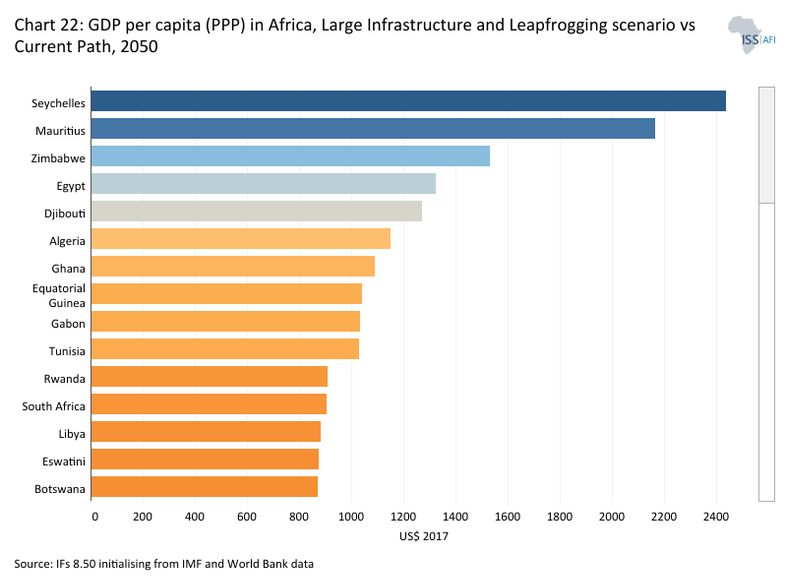
- Chart 22: GDP per capita in African countries– variations relative to the Current Path
- Chart 23: Total trade in Large Infrastructure and Leapfrogging scenario vs Current Path, 2022-2050
- Chart 24: Extreme poverty in Large Infrastructure and Leapfrogging scenario vs Current Path, 2022-2050
- Chart 25: Recommendations
Infrastructure is more than a collection of physical assets; it is the foundation upon which economies grow, societies progress and development becomes sustainable. Roads, energy systems, digital networks and water infrastructure shape how markets function, how people access opportunities and how productivity evolves. In Africa, where rapid demographic growth intersects with rising economic aspirations, infrastructure is indispensable to transforming economic growth into shared prosperity.
The centrality of infrastructure to development is deeply embedded in economic thought. From Adam Smith’s Wealth of Nations, which identified public works as a core responsibility of the state, to modern macroeconomic and endogenous growth models, infrastructure is consistently treated as a critical intermediate input that raises productivity across all sectors.
A substantial body of empirical research over the past decades confirms that the availability, quality and reliability of infrastructure influence firm performance, market integration and long-term growth. More recently, academic literature has also emphasised infrastructure’s role in reducing poverty and inequality by expanding access to basic services, enabling employment opportunities and enhancing human capital. An emerging consensus is that, under the right conditions, infrastructure development can play a major role in promoting growth and equity, and, through both channels, help reduce poverty.
Across Africa, however, a persistent infrastructure deficit remains a binding constraint on economic growth, structural transformation and the achievement of the Sustainable Development Goals (SDGs). Infrastructure investment has contributed significantly to the continent’s improved economic performance in recent years, yet Africa, especially sub-Saharan Africa, lags behind every other developing region on critical infrastructure indicators. Electricity generation per capita is less than a third of South America’s. Internet access is sparse, roads remain largely unpaved and water systems are often unreliable. These gaps translate into high logistics costs, unreliable energy supply, limited digital connectivity, and reduced productivity and competitiveness.
The economic consequences are substantial. Inadequate infrastructure is estimated to reduce Africa’s GDP growth by around two percentage points annually and lower business productivity by up to 40%. Transport inefficiencies raise the cost of African goods, undermining trade and industrialisation, while poor water and sanitation systems alone are estimated to cost the continent nearly 5% of GDP each year. Beyond macroeconomic losses, these deficits constrain access to health, education and decent livelihoods for citizens, reinforcing poverty and inequality.
Africa’s infrastructure gap is not merely a story of constraints; it is also a story of unrealised potential. With the African Continental Free Trade Area (AfCFTA) poised to reshape regional trade and production structures, the returns to improved connectivity, reliable energy and efficient logistics are higher than ever. The African Development Bank estimates that the continent needs over US$100 billion per year to close the infrastructure gap, a monumental ambition, but also an unprecedented opportunity. Infrastructure can serve as a powerful catalyst for structural transformation, enabling value-added production, regional value chains, urban productivity and the absorption of Africa’s rapidly growing labour force.
Against this backdrop, this theme report provides a comprehensive overview of Africa’s infrastructure deficit. It presents a positive scenario for exploring the contribution that improved infrastructure could make to catalyse economic growth and accelerate poverty reduction. By examining the multiplier effects of infrastructure investment and its interlinkages with productivity, trade and human development, the theme outlines a strategic vision for infrastructure-led development in Africa—how closing the infrastructure gap can shift the continent onto a higher, more inclusive growth trajectory.
Africa’s infrastructure deficit is the outcome of a long and cumulative historical process shaped by colonial legacies, post-independence development choices and persistent financing and governance constraints. Understanding these structural origins is essential for designing credible and forward-looking infrastructure strategies that support inclusive growth and structural transformation.
Much of Africa’s infrastructure is still of colonial-era legacy, designed primarily to serve foreign extractive economic objectives rather than broad-based domestic development. Priority was given to infrastructure that served military objectives, facilitated access to mineral resources and linked agriculturally productive zones to coastal export points. Transport networks, particularly railways and ports, were therefore structured as linear corridors connecting mines and plantations to ports, with little consideration for internal market integration or regional cross-border connectivity.
For example, the Western Line in the Gold Coast (now Ghana) was built at the turn of the twentieth century (1898–1903) to serve the goldfields of Tarkwa and Obuasi. It also had military objectives, enabling the British administration to deploy troops to the Ashanti region. Meanwhile, construction of the Eastern Line began in 1908, reaching Tafo by 1918 and Kumasi by 1923, to access not only gold-rich areas but also cocoa-producing regions. Similarly, in Southern Africa, the construction of the Lourenço Marques railway, in present-day Mozambique, was driven by the strategic and economic interests of the colonial powers, both to maintain imperial control and to profit from raw material exports.
It is estimated that roughly one-third of colonial budgets were devoted to railroad construction.
As a result, infrastructure systems emerged as sparse, fragmented and poorly aligned with population distribution and the requirements of long-term economic transformation. Only in territories with significant and permanent European settlement, notably South Africa, did infrastructure development extend beyond extractive functions—and even then, largely to serve the colonist minority.
After independence, many inherited railway systems declined or fell into disuse. They were often poorly aligned with new national development priorities and weakened further by conflict, inadequate maintenance, institutional mismanagement, and shifting policy agendas. Over time, governments shifted their focus from rail to road transport. This transition was not matched by sufficient investment in other essential infrastructure, such as sanitation or cross-border systems needed for regional integration. Consequently, urbanisation across much of Africa often occurred without adequate basic infrastructure.
The impact of colonial railways, persisted, with locations along these routes becoming more developed. The railroads built during the colonial period strongly predicted the current location of cities. Further, many African cities still depend on creaking water, electricity and sanitation infrastructure, which often predate independence more than half a century ago.
In the post-colonial period, infrastructure development was also shaped by politically driven investment decisions. Many countries experienced episodes of “white elephant” projects, involving large-scale investments in roads, dams, power plants and public utilities pursued as prestige projects rather than as part of coherent development strategies. This tendency was particularly pronounced during the 1980s, following the adoption of the Lagos Plan of Action, which, despite its developmental ambition, often translated into poorly coordinated national projects implemented without rigorous economic analysis, adequate feasibility studies or regional coordination. These investments frequently generated limited economic returns while contributing to rising public debt.
By the late 1980s, falling commodity prices, high external debt and governance challenges culminated in widespread macroeconomic instability. The debt crises of the 1980s sharply curtailed public investment, with infrastructure spending declining significantly and maintenance expenditures deferred. This period marked a decisive break in infrastructure accumulation, leading to the rapid deterioration of existing assets. The subsequent Structural Adjustment Programs (SAPs) implemented in the 1980s and 1990s prioritised fiscal consolidation and privatisation and reduced public spending. While the SAPs restored macroeconomic stability in many countries, infrastructure investment, particularly in energy, transport and water, was often treated as a residual rather than a core driver of growth and productivity.
The expectation that private investment would compensate for reduced public spending proved overly optimistic, especially in low-income and fragile contexts where risks were high and returns uncertain. While the telecommunications sector did attract some private investment, leading to the emergence of major operators such as MTN, Vodacom and Airtel, other sectors lagged. Energy sector privatisation progressed unevenly, and electricity access remained limited in many regions. National power grids in sub-Saharan Africa remain underdeveloped, particularly in rural areas. In urban transport, SAPs often contributed to the collapse of public bus companies and the deterioration of local road networks.
Spending on infrastructure began rising again with the commodity boom in the first decade of the 2000s, but with several of Africa’s development ambitions consisting of grandiose urban projects, driven by local politicians and global investors. Many visions drew inspiration from global cities such as Dubai, Singapore or Shanghai, emphasising modern skylines, expressways and “smart city” concepts. The Nairobi Metro 2030 Strategy, launched in 2008, exemplifies this trend, aiming to transform Nairobi into a world-class African metropolis. At the same time, railway infrastructure, long neglected after independence, experienced a resurgence, particularly in Eastern Africa. China played a pivotal role in financing and constructing new railway lines, including Kenya’s Mombasa–Nairobi Standard Gauge Railway, and the Addis Ababa–Djibouti Railway.
Taken together, these historical layers (colonial extraction-oriented design, post-independence institutional and policy constraints, macroeconomic crises and uneven recent investment) explain the depth and persistence of Africa’s infrastructure deficit. They also underscore the importance of focusing on economically grounded and geographically relevant infrastructure systems that support inclusive growth and long-term development.
Africa’s infrastructure landscape is shaped by rapidly expanding demand and persistent financing constraints. Population growth, accelerating urbanisation, ambitions for economic diversification and the deepening of regional and global trade are driving an unprecedented surge in infrastructure needs. Transport networks, energy systems, water and sanitation services, digital connectivity and urban mobility are under pressure to serve populations that are larger, younger and more urban than ever before.
Africa has made notable progress in infrastructure development over the past two decades. According to the Africa Infrastructure Development Index (AIDI), established by the African Development Bank (AfDB), outcomes have improved across all sub-regions. The index tracks nine indicators grouped into four core components (transportation, energy, information and communication technologies (ICT), and water and sanitation), providing a comprehensive picture of infrastructure development trends across countries and regions. Chart 1 shows the average infrastructure development score for North Africa and sub-Saharan Africa from 2003 to 2025. Starting from a low base, sub-Saharan Africa increased its average score by around 50% in that period, reflecting substantial relative progress. By contrast, North Africa, which began from a much higher baseline, recorded a more modest improvement of about 12% over the same period.
Nonetheless, the overall improvement in infrastructure has not been sufficient to close Africa’s substantial deficit. Meeting current and future needs will require large-scale, sustained investment to expand access, improve service quality and maintain existing assets. Public financing remains constrained by limited fiscal space, rising debt burdens and competing priorities, especially in education and health. While private investment has grown—particularly in telecommunications and energy—it remains uneven, concentrated in a small number of countries and commercially viable projects. As a result, infrastructure development continues to fall short of what is needed to support structural transformation and inclusive growth.
These challenges are not uniform across the continent. North Africa stands out as a relative exception, benefiting from comparatively advanced infrastructure in terms of both coverage and quality. By contrast, many countries in sub-Saharan Africa continue to face acute and persistent infrastructure deficits, highlighting the need for differentiated approaches that take into account regional and country-specific realities.
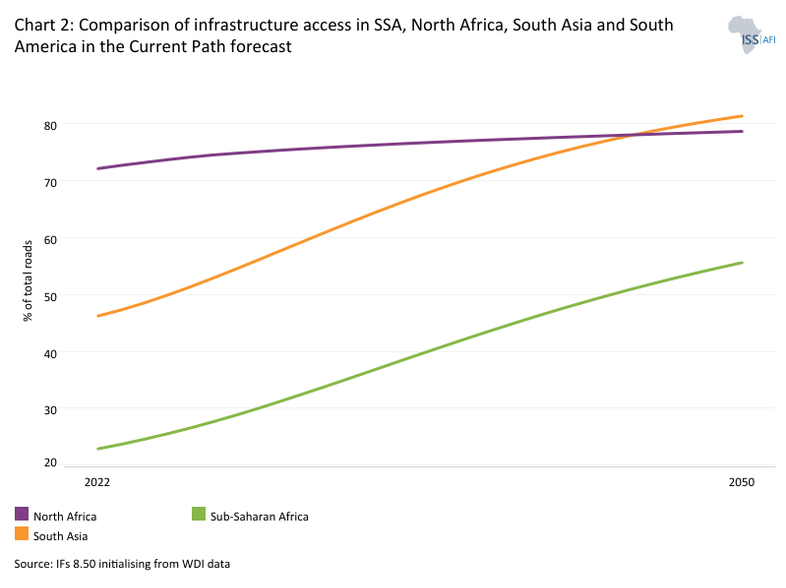
Nevertheless, there are reasons for optimism. Under the Current Path, infrastructure development in sub-Saharan Africa is expected to improve, although it is likely to continue lagging behind other developing regions. Chart 2 illustrates this comparative picture, providing a snapshot of infrastructure performance in sub-Saharan Africa relative to other developing regions to 2050.
In recent years, Africa’s infrastructure development has been increasingly shaped by China’s economic and strategic engagement, crystallised in the Belt and Road Initiative. Through this framework, China has become Africa’s largest bilateral trading partner and a major source of infrastructure finance, particularly for trade-enabling assets such as ports, railways, roads and power generation. Chinese-financed projects have been especially prominent along the eastern seaboard and key regional corridors, helping to link landlocked countries to ports and integrate African economies more deeply into global value chains. The scale and speed of delivery have filled critical financing gaps left by traditional partners and addressed long-standing infrastructure deficits, making China a central actor in Africa’s contemporary development landscape.
At the same time, Chinese state lending practices differ markedly from those of Western multilateral institutions, such as the World Bank and the International Monetary Fund. While Chinese loans are often presented as “no-strings-attached,” in practice they frequently resemble commercial or quasi-commercial financing, with relatively higher interest rates, shorter maturities, collateral requirements and limited public disclosure of terms. This opacity complicates debt sustainability analysis and can constrain fiscal space in borrowing countries. By contrast, World Bank and IMF financing—especially for low-income countries—tends to be more concessional, transparent and embedded in multilateral debt-sustainability frameworks, albeit with policy and governance conditionalities. As a result, the growing reliance on Chinese infrastructure finance has intensified debates in Africa around cost, transparency and long-term debt sustainability, underscoring the need for more strategic debt management and better coordination among all development partners.
Also, the African Union Development Agency New Partnership for Africa’s Development (AUDA–NEPAD) and its flagship Programme for Infrastructure Development in Africa (PIDA) aim to mobilise foreign public and private financing while anchoring infrastructure development in pan-African priorities. PIDA has already supported the preparation and implementation of several strategic projects across the continent. This momentum was reinforced at the Africa Infrastructure Financing Summit co-hosted by AUDA-NEPAD and the African Union Commission (AUC) in Luanda in October 2025, where investors committed US$18 billion to African infrastructure. These resources are expected to finance 38 bankable projects and 11 additional projects aligned with the African Union’s continental blueprint for regional and continental infrastructure integration under PIDA.
At the same time, Africa’s infrastructure agenda is being reshaped by a broader global shift that places sustainability, climate resilience and the Sustainable Development Goals (SDG) at the centre of planning and financing. In line with SDG 9, infrastructure investments are increasingly oriented toward low-carbon pathways, climate resilience and innovation, with multilateral development banks, regional institutions and donors embedding environmental standards and green financing instruments into their portfolios. This shift is most visible in key sectors: energy infrastructure is moving toward renewables; urban transport policies increasingly prioritise electric mobility and mass transit. In Senegal, the Dakar Bus Rapid Transit (BRT) system, launched in 2024, became the first large-scale, fully electric BRT network in Africa, marking a significant milestone in the continent’s green urban transport transition. Digital infrastructure, such as the BRT, supports smarter, more resilient logistics. Water and industrial infrastructure emphasise efficiency and reduced environmental footprints through approaches such as eco-industrial parks, often supported by the World Bank, UN agencies and bilateral partners.
Electricity infrastructure in Africa remains insufficient, with significant disparities between North Africa and sub-Saharan Africa. In 2022 (latest available data), about 58.5% of the continent’s population had access to electricity, and only six countries—Egypt, Mauritius, Seychelles, Morocco, Algeria and Tunisia—had achieved universal access. In other words, roughly 41.5% of Africa’s population still lacked electricity.
Access to reliable electricity is essential for economic growth and improvements in livelihoods. However, in many African countries, even a connection to the national grid does not guarantee a dependable power supply. Frequent power outages are a common feature of electricity provision across the continent. This limited access and unreliable supply, particularly in sub-Saharan Africa, constrain modern economic activities, public services, quality of life and the adoption of new technologies.
In sub-Saharan Africa, the number of people without electricity has risen as population growth outpaces electrification progress. As a result, it holds most of the global population without access to electricity. While the global electricity access rate reached 91.3% per cent in 2022, sub-Saharan Africa achieved only 51.5%, meaning that 597.4 million Africans are without access to electricity. Eighteen of the 20 countries with the largest access deficits in 2022 are in Sub-Saharan Africa. In terms of absolute numbers, the top three–Nigeria (98 million), DR Congo (81 million) and Ethiopia (58 million)–accounted for nearly a third of the entire global deficit. South Sudan, Burundi and Chad have the highest share of their populations without access to electricity, with around 90% of their people lacking access.
Access to electricity in Africa remains deeply unequal, with a pronounced gap between urban and rural areas. Historically, cities have enjoyed far greater electricity coverage than the countryside. As of 2022, 83% of the urban population in Africa had access to electricity, compared with only 42% in rural areas.
Expanding rural electrification can deliver transformative benefits to communities. Reliable electricity enables new economic activities, strengthens essential services and improves daily living conditions. Children can study more safely in the evenings, small businesses can operate longer hours and increase their income, and health facilities can refrigerate medicines and vaccines. Electricity reshapes how time is used, how income is generated and how public services are delivered. In turn, it influences educational attainment, economic participation and overall quality of life—particularly for women and children.
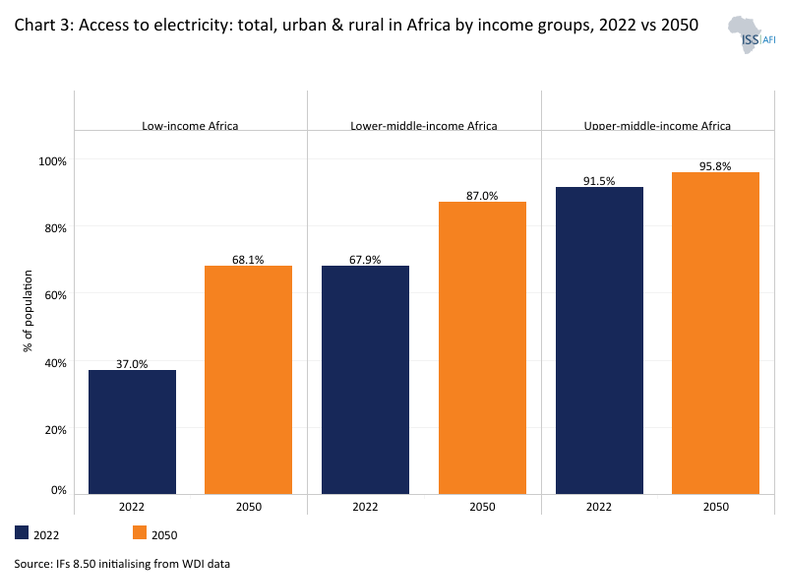
Access levels vary significantly by income group and region. Northern African countries and higher-income nations, such as South Africa, generally achieve higher rates of rural electrification than lower-income countries. Chart 3 shows total electricity access in urban and rural areas by income group in 2022 and 2050.
In 2022, only 21.5% of rural residents in low-income African countries had access to electricity. The rate was higher in lower-middle-income countries (51.4%) and reached nearly 92% in upper-middle-income countries. Overall, thirteen African countries reported rural electricity access below 10%. In some cases—including Central African Republic, Chad, South Sudan and DR Congo—rural access rates remained below 2%.
Achieving universal electricity globally will therefore depend largely on progress in sub-Saharan Africa, particularly in its low-income countries, where the electrification gap is most severe.
The percentage of firms in Sub-Saharan Africa reporting outages (72.1%) is higher than in any other world region. Moreover, electricity load-shedding in Africa tends to last far longer than in Asia or Europe. To mitigate the effects of unreliable electricity services, firms generate their own electricity, typically relying on diesel generators as a backup source of electricity. According to the World Bank, 51% of firms in Sub-Saharan Africa own or share a generator. Nigeria, for instance, is among the global top six countries (Nigeria, India, Iraq, Pakistan, Venezuela and Bangladesh) that generate electricity through back-up generators. According to a report by the International Finance Corporation (IFC), the amount spent every year in Nigeria on buying and operating small generators is about US$12 billion, and the collective installed capacity of generators is eight times more than the entire national grid. The operations of back-up generators come with high financial costs, often double that of grid electricity, and this is a huge burden on the small and medium-scale enterprises (SMEs), which account for about 90% of businesses and over 80% of employment in Nigeria. Also, these generators emit carbon dioxide and carbon monoxide, which pose serious health and environmental risks.
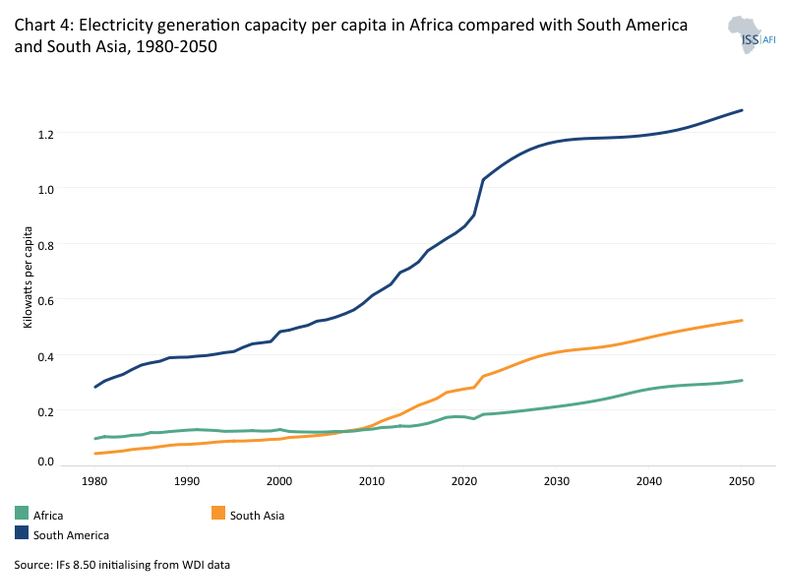
Progress in electricity generation capacity has been limited. In 2022, Africa’s electricity generation capacity per capita stood at only 0.17 kW, lower than 0.29 kW in South Asia and 0.92 kW in South America. Chart 4 shows electricity generation capacity per capita in Africa, South America and South Asia from 1990 to 2050. On the Current Path, per capita generation in Africa will reach only about 0.31 kW by 2050, still lagging behind South America (1.28 kW) and South Asia (0.52 kW) in the same year. Rather than closing the gap, Africa risks falling further behind despite its substantial potential.
Electricity generation in Africa is expanding at less than 2% per year—far below the pace of population and GDP growth. As a result, per capita electricity consumption is falling. According to UN statistics, Africa’s average electricity consumption stood at around 660 kWh per capita in 2015. By 2022, it had dropped to just 514.7 kWh per capita, the lowest level recorded since at least 1998. This trend reflects not only a persistent access gap, but a failure to scale energy systems at a time when Africa must rapidly increase power consumption to support industrialisation, enhance competitiveness and stimulate private-sector growth.
Scaling up power generation is therefore an urgent and strategic priority. In 2024, Africa added only 6.5 gigawatts (GW) of utility-scale capacity to its grid. Nearly half of this came from hydropower, driven by new units from major projects such as the Grand Ethiopian Renaissance Dam, Tanzania’s Julius Nyerere hydropower project, Cameroon’s Nachtigal plant and Uganda’s Karuma dam. Solar energy represented the second-largest share, with large-scale additions in Egypt and South Africa, alongside smaller projects across at least nine other countries. The remaining capacity came from natural gas—mainly in Algeria, Ghana and Nigeria—as well as coal and wind, mostly from South Africa and Morocco. By contrast, India alone added 18 GW in renewables in that year. To meet its development ambitions, Africa must double or triple its annual power-sector buildout.
It is estimated that Africa needs to add at least 16 GW of new grid-connected generation capacity annually until 2050 and invest US$3.2–4.3 billion per year in transmission infrastructure to meet even its most basic growth targets. Achieving this will require decisive action to fully harness Africa’s vast yet underutilised energy resource base. Chart 5 depicts the average long-term practical potential solar energy output by world region. Africa leads the world in average solar energy potential, with the capacity to generate 4.51 kilowatt-hours per kilowatt-peak per day (4.51 kWh/kWp/day). In other words, for every one kilowatt-peak of installed solar capacity, a system generates an average of 4.51 kWh of electricity per day—the highest level globally. The report by the African Solar Industry Association indicates that the continent’s installed solar capacity increased by 17% in 2025, driven by imports of solar panels from China. The continent has vast renewable energy potential, including an estimated 11 TW of solar power, 350 GW of hydropower, 110 GW of wind energy and 15 GW of geothermal capacity. Despite these abundant resources, Africa currently utilises less than 10% of its hydropower potential.
Beyond limited access or insufficient supply, electricity in Africa—particularly in sub-Saharan Africa—is significantly more expensive than in other regions. The African Development Bank estimates that electricity costs in Africa are three times higher than in other developing regions. High electricity costs in Africa are largely driven by the lack of investment in generation capacity and distribution networks. Ironically, several African countries export substantial quantities of energy, including coal and unrefined oil and gas, but they end up importing refined fuels.
The continuous increase in demand for electricity in Africa is expected to be four times higher in 2040 than it was in 2010. In the Current Path, Africa will still have around 543 million people without access to electricity in 2050, remaining virtually unchanged from today. However, the percentage of Africans without access will have declined to 21%. Improving the supply and distribution of electricity infrastructure is a priority, considering Africa’s vast and environmentally friendly electricity generation potential.
Despite uneven progress across countries, significant efforts have been made to expand electricity access through a combination of grid extension, mini-grids and off-grid solutions. As Africa seeks to accelerate economic growth and industrialisation, the expansion of green energy offers a strategic opportunity to leapfrog carbon-intensive development pathways and transition directly toward a more sustainable, resilient and renewable energy future.
Transport and Logistics Infrastructure
Download to pdfThe transport infrastructure in all four subsectors (roads, railways, air and ports) is a major bottleneck for development across much of Africa. Persistent transport infrastructure gaps and high logistics costs continue to constrain trade competitiveness and inclusive development, making accelerated, integrated and climate-resilient investment an urgent priority.
Road transport remains the backbone of mobility in Africa, accounting for an estimated 80% of freight and 90% of passenger traffic. Yet the scale, quality and spatial distribution of the continent’s road infrastructure fall well short of development needs.
By global standards, Africa’s road density is extremely low, averaging about 2.8 kilometres per 100 square kilometres, compared with 138 kilometres in India—an economy with a comparable population but only one-tenth of Africa’s landmass. This places Africa well behind other regions, including Asia, where ASEAN countries average nearly 30 kilometres per 100 square kilometres. The gap is equally stark in road quality. Africa’s paved road network totals approximately 818 000 kilometres, about one-third of India’s. As of 2024, paved roads accounted for roughly 30% of Africa’s total road network; under current trends, this share will rise to about 59% by 2050.
Significant disparities persist across countries, subregions and income groups. Algeria, Egypt and South Africa together account for almost half of Africa’s paved road network. At the same time, South Africa ranks highest among large economies in both overall road density and paved road density. Although countries such as the DR Congo, Ethiopia, Kenya and Tanzania have extensive total road networks, their paved road coverage remains relatively limited. Small island states—including Mauritius, Seychelles, Comoros, São Tomé and Príncipe and Cabo Verde—record the highest road densities on the continent, reflecting their compact geography rather than network scale.
Chart 6 illustrates historical trends and projections for paved roads in Africa, disaggregated by income group from 2022 to 2050. Overall progress in expanding paved road networks remains limited, particularly in low-income countries. As of 2024, only about 13% of the total road network in low-income African countries was paved, compared with more than 30% in lower-middle- and upper-middle-income countries. By 2050, low-income Africa will reach only 43% of paved roads, while the share will rise to about 68% in lower-middle-income countries and 64% in upper-middle-income countries. In general, upper-middle-income African countries have a higher proportion of paved roads; however, slow progress in countries such as Gabon, South Africa and Botswana pulls the group average below that of lower-middle-income countries.
Road condition and functionality present equally serious challenges. In much of sub-Saharan Africa, large portions of the network are in fair or poor condition. According to the Northern Corridor Transit and Transport Coordination Authority, only 41% of corridor roads across Kenya, Uganda, the DR Congo, Rwanda, South Sudan and Burundi are rated in “good” condition. Even in countries with sustained investment efforts, such as Ghana, only 44% of the road network met this benchmark as of 2023. Data from the IMF’s Mean Speed Score, used as a proxy for road quality and traffic efficiency, further illustrates these challenges. Countries such as Namibia, Botswana and Zimbabwe perform relatively well despite low road density, indicating more efficient use of limited infrastructure. By contrast, Nigeria and Ghana, despite higher reported densities, rank poorly on speed metrics, pointing to congestion and substantial rehabilitation needs.
Spatial concentration further constrains logistics efficiency. African road networks are heavily skewed toward urban areas and major corridors linking large cities, ports and borders, while rural areas remain markedly underserved. Many rural roads are unpaved, limiting year-round vehicle access and raising transport costs for agricultural products and mineral resources from remote regions. According to the World Bank, around half of Africa’s main road network—typically under central government responsibility—is in good condition, compared with only 25% of classified rural roads managed by local authorities.
Measures of accessibility reinforce these findings. The World Bank’s Rural Access Index (RAI), which tracks the share of rural populations living within two kilometres of an all-season road, shows notable progress in countries such as Kenya, Gambia, Rwanda, South Africa and Uganda over the past decade. In contrast, Madagascar, Chad, Zambia, Ethiopia and Lesotho have experienced much slower gains.
Complementary indicators on access to cities reveal strong regional contrasts: Southern and Western Africa generally record travel times of 60–120 minutes to the nearest densely populated area, while many Central African countries—including the Central African Republic, the Republic of Congo and the DR Congo—require between 400 and 600 minutes. These gaps highlight the extent to which inadequate road and logistics infrastructure continues to impede market integration, raise trade costs and limit inclusive growth across the continent.
Africa’s railway systems were largely shaped by colonial pit-to-port strategies, designed to move resources from inland areas to coastal ports rather than to support domestic connectivity or regional integration. Although railways initially dominated long-distance transport, the rapid expansion of road networks has since displaced rail as the primary mode for passenger travel and regional trade. Today, the sector faces persistent challenges, including underinvestment, low utilisation, ageing infrastructure and incompatible technologies. Only 36 of Africa’s 54 countries have operational railway systems, and about 15% of Africa’s rail network is non-operational, with conflict further disrupting systems such as Sudan’s, where only a fraction of the network remains functional. In addition, 13 countries—many landlocked—still lack direct rail access to the sea.
Despite its vast land area, Africa’s rail network is small by global standards. India, with just 11% of Africa’s landmass, has a railway network roughly 75% the size of Africa’s. Chart 7 shows the distribution of railway networks across the continent. Rail capacity is concentrated in North and Southern Africa, with South Africa, Egypt, Algeria, the DR Congo and Nigeria accounting for the largest networks. South Africa and Tunisia have the highest rail density. However, fragmented track gauges and technical standards—metre gauge and standard gauge in much of North, East and West Africa, and Cape gauge in Southern Africa—severely limit interoperability, cross-border connectivity and efficient logistics, particularly for landlocked countries.
Between 2015 and 2024, Africa added around 2 000 km of rail lines. The period 2015–2019 was dominated by greenfield projects, including standard gauge railways and high-speed lines, while 2020–2024 shifted toward rehabilitation as fiscal pressures and COVID-19 constrained new investment. However, Tanzania’s standard gauge railway marked a notable exception. With major projects under construction across North and sub-Saharan Africa, railways are entering a renewed phase of development. Rising demand for efficient, low-emission transport and the need to link inland markets to ports are reviving rail’s strategic role, with the potential to transform it into a backbone of Africa’s integrated and inclusive logistics systems.
Since colonial times, ports have been key to Africa’s integration into global trade, initially serving as gateways for exporting natural resources such as minerals and oil. Today, their role has expanded beyond extractive exports to supporting Africa’s rapidly growing domestic markets. With the continent’s population projected to increase to 2.6 billion by 2050, and with strong economic growth in West and East Africa, rising consumption and imports are transforming ports into highly attractive assets for private investment, offering scale, diversification and long-term growth potential.
Port infrastructure remains uneven across the continent. Northern African countries—particularly Egypt, Morocco, Algeria and Tunisia—host a dense concentration of international and regional ports, while South Africa, Nigeria and Angola lead outside the region. According to indicators published by the World Bank and UNCTAD, Africa lags globally in port connectivity. However, Morocco and Egypt rank highest on the Liner Shipping Connectivity Index, which captures how well countries are connected to global shipping networks based on the status of their maritime transport sector.
Container traffic data further highlight divergent performance across African ports. Egypt, Morocco and South Africa dominate in absolute volumes. At the same time, countries such as Togo, the Republic of Congo, Djibouti, Ghana, Senegal, Mozambique and Tanzania record the fastest growth, largely driven by trans-shipment activities and strong links to landlocked economies. Togo, in particular, has emerged as a leading Atlantic trans-shipment hub, with trans-shipment accounting for about 70% of total port traffic. This growth has accelerated by increased use of Togolese ports by landlocked countries of the Alliance of Sahelian States (AES), notably Burkina Faso, Mali and Niger, which have increasingly relied on Togo as a key maritime gateway.
Performance indicators reinforce these trends. The Container Port Performance Index (CPPI) measures the time container ships spend in port. Chart 8 shows the top 10 ports with the highest CPPI in 2024. A high ranking reflects above-average fast turnaround times for all vessel and port call categories. Most of the top-ranked ports are leading export and transhipment hubs. In 2024, Port Said in Egypt ranked third globally on the CPPI and first among its regional peers, while Tanger-Med in Morocco ranked fifth worldwide. In contrast, ports in South Africa, Tunisia and Namibia experienced stagnating or declining performance, underscoring widening disparities across the continent.
In 2024, no port in sub-Saharan Africa ranked among the top 20 ports with the highest CPPI. The region continues to face persistent structural constraints, notably limited automation and weak hinterland connectivity. These challenges were exacerbated in 2024 by the Red Sea crisis, which further strained port operations, particularly in Durban Port and Cape Town Port, which were already affected by prolonged vessel waiting times. The decline in CPPI scores for Durban and Cape Town is primarily driven by longer arrival and anchorage waiting times.
Africa’s airport infrastructure has also expanded steadily in recent years, driven by powerful demographic and urbanisation trends. With more than half of Africans expected to live in cities by 2035, demand for domestic, regional and international air travel is rising rapidly.
Yet Africa’s aviation sector continues to lag behind global standards. In 2022, the continent accounted for only 2.3% of global passengers carried and less than 3% of total aircraft kilometres flown. Likewise, Africa represented less 3% of global passenger and freight tonne-kilometres, underscoring the sector’s limited efficiency in utilising available capacity for both passengers and cargo.
Chart 8 presents the number of airports in selected African countries. Airport capacity and traffic also remain highly concentrated, notably in Algeria, Egypt and South Africa, and no African airport ranked among the world’s top 60 for passenger or cargo traffic in 2023, according to the Airports Council International. Connectivity is strongest in Egypt, Morocco, Ethiopia, South Africa, Kenya and Nigeria, with traffic patterns generally oriented toward Europe. South Africa’s traffic is more regionally focused within Southern Africa, while Ethiopia shows relatively balanced intra-African links.
Limited regional interconnectivity, especially for air freight, remains a key weakness. Cargo capacity is concentrated in a few hubs, including Nairobi, Cairo, Johannesburg, Addis Ababa and Lagos, constraining trade, particularly for landlocked countries and perishable goods. Progress toward an integrated continental air market has also been slow, despite initiatives such as the Yaoundé Treaty and the Yamoussoukro Decision, due to restricted competition, skills shortages and weak regulatory harmonisation.
Looking ahead, growth prospects are strong. Boeing projects passenger traffic growth of about 6% annually through 2044, requiring Africa’s commercial fleet to more than double to around 680 aircraft, largely single-aisle jets serving domestic and regional routes. Aviation expansion will support tourism, trade, investment and job creation, but realising this potential will require modernised airports, large-scale skills development, around 74 000 new aviation professionals by 2044 and coordinated policies to strengthen intra-African connectivity and support the goals of the AfCFTA.
In sum, strengthening Africa’s transport and logistics infrastructure is critical to unlocking industrialisation, managing rapid urbanisation and realising the continent’s ambitious intra-African trade agenda. Achieving these objectives will require the development of a modern, integrated and climate-resilient network encompassing roads, railways, ports, airports and key logistics assets, including dry ports, container depots and efficient border facilities.
Information and communication technology (ICT) infrastructure is foundational for Africa’s digital transformation, economic growth and integration into the global digital economy. Over the past two decades, rapid mobile phone adoption and rising internet use have significantly expanded connectivity across the continent. These gains have supported greater access to information, digital services and markets. However, deep and persistent infrastructure gaps continue to limit universal access, affordability and the deployment of advanced digital applications such as cloud computing and artificial intelligence (AI).
Mobile telephony remains the backbone of ICT connectivity in Africa. Sustained investment by major telecom operators has driven the expansion of third-generation (3G) and fourth-generation (4G) networks, leading to strong growth in mobile broadband subscriptions. Mobile network infrastructure continues to attract the majority of digital investment, accounting for around 60% of total digital infrastructure capital in 2024. As a result, mobile networks reach far more people than any other form of digital infrastructure and serve as the primary mode of internet access for most Africans.
Despite this progress, mobile connectivity remains uneven in both coverage and quality. Urban centres generally benefit from widespread 4G availability, while many rural and remote areas still lack reliable high-speed mobile coverage. Even where coverage exists, the speed, reliability and overall quality of mobile internet services are below global averages, reflecting capacity constraints and underinvestment in network densification and backhaul infrastructure. These limitations reduce the ability of mobile networks to support more data-intensive and productivity-enhancing digital uses.
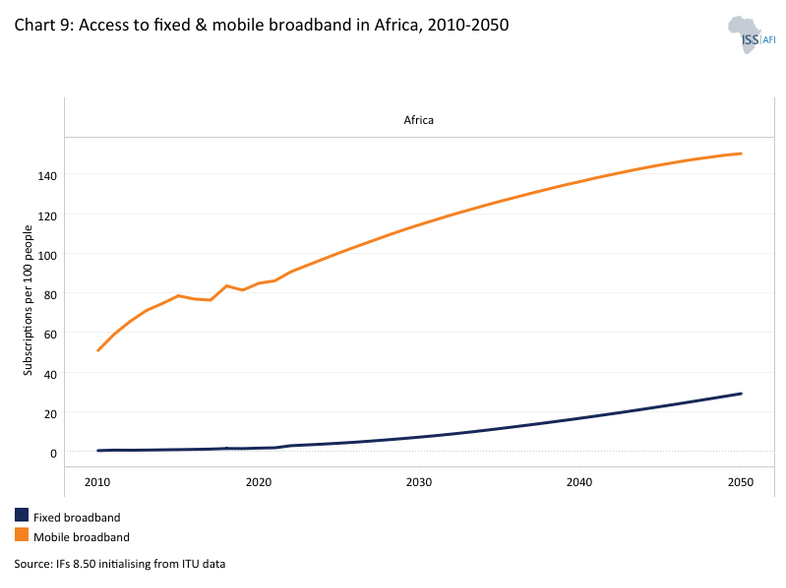
The challenges with fixed broadband infrastructure are more severe. Fixed broadband—delivered through fiber-optic cables, copper DSL lines or cable networks to homes, offices and other fixed locations—typically offers faster and more stable connections than mobile broadband. As such, it is essential for remote work, digital education, e-government services and data-intensive business activities. Yet in 2024, Africa recorded only about 3.7 fixed broadband subscriptions per 100 people, compared with 80.6 for mobile broadband. Chart 9 shows access to fixed and mobile broadband in Africa from 2010 to 2050. On the current trajectory, fixed broadband subscriptions will rise to around 29 subscriptions per 100 people in 2050, compared with 149 subscriptions per 100 people for mobile broadband in the same year.
Several structural factors underpin this gap between mobile and fixed broadband access across the continent. Large areas of the continent lack fibre-optic or other wired networks, particularly outside major cities. Nearly half of Africa’s population lives more than 10 kilometres from a fibre connection, creating a major barrier to the expansion of fixed broadband. High costs further restrict access: installation fees and monthly subscriptions are often prohibitively expensive for lower-income households, with broadband costs absorbing a substantial share of monthly income. Consequently, fixed broadband deployment remains concentrated in capital cities and large metropolitan areas, leaving rural and remote populations largely unconnected.
Given these structural limitations, expanding digital access requires a mix of infrastructure solutions. While mobile broadband (3G, 4G and increasingly 5G) will continue to play a central role, complementary technologies are becoming increasingly important for reaching underserved populations.
Low Earth Orbit (LEO) satellite internet services are one such solution. Starlink, developed by SpaceX, uses a constellation of low-orbit satellites that provide high‑speed, lower‑latency internet connectivity where terrestrial networks are limited. In early 2026, Starlink launched services in Senegal, contributing to national efforts to extend connectivity to remote and underserved areas. Over the past year, Starlink has also expanded operations in countries such as the Central African Republic, São Tomé and Príncipe, Chad, Somalia, Lesotho, Guinea‑Bissau, the DR Congo, Niger and Liberia, significantly broadening its continental footprint.
By offering an alternative where fibre‑optic and traditional mobile network infrastructure are limited, satellite broadband can support remote work, e‑learning, telemedicine, digital commerce and other data‑intensive uses. However, relatively high equipment and subscription costs, as well as regulatory hurdles in several markets, remain barriers to widespread adoption.
Looking ahead, the continent’s annual investment requirement to achieve productive transformation through digital infrastructure is estimated at around US$36 billion. This is lower than the investment needed for transport infrastructure, reflecting the significant progress already made over the past decade. Africa’s operational fibre-optic cable network expanded from about 466 000 kilometres in 2010 to 1.3 million kilometres in 2024, contributing to a significant increase in internet access, which reached about 35% of the population in 2024. However, major challenges remain, particularly in affordability, the availability of localised digital services and the need to connect underserved communities. In 2024, the average monthly cost of broadband internet across 18 African countries was US$56, significantly higher than in Latin America and the Caribbean (US$46) and developing Asia (US$17).
Beyond connectivity, enhanced ICT infrastructure can play a critical complementary role. Digital public infrastructure—such as interoperable digital systems that support public service delivery and private-sector activity—can streamline customs procedures, enable cross-border digital services and trade, support the integration of renewable energy systems and expand access to trade finance for small and medium-sized enterprises. Together, investments in digital connectivity and digital public infrastructure will be essential for unlocking Africa’s full digital and economic potential.
Corruption and political interference are major obstacles to infrastructure development. In South Africa, the Medupi and Kusile coal power stations illustrate these challenges. Medupi, initially budgeted at R80 billion in 2007 (US$11.19 billion), saw its costs triple and faced repeated delays; shortly after completion in 2021, one unit exploded, adding further repair costs. Kusile, budgeted at R81 billion (US$11.33 billion), also experienced major delays and cost overruns, with its budget doubling by 2020 and completion pushed to 2025.
Both projects were linked to corruption and inflated coal contracts, leaving Eskom with unsustainable debt. Despite being named power company of the year in 2001, South Africa later faced severe electricity shortages due to delayed procurement, poor maintenance and underinvestment in new capacity. By the mid-2010s, rolling blackouts were frequent and placed a heavy strain on the economy.
Since 2024, however, performance has improved. In 2025, Eskom recorded 231 consecutive days without load shedding, reflecting better maintenance and a gradual recovery in plant availability.
Another example is the Grand Inga Hydropower Project in DR Congo, where electricity access is extremely low and supply is unreliable, constraining economic growth. Many firms rely on backup generators, reflecting frequent outages. The state utility, Société Nationale d'Électricité (SNEL), is highly inefficient, losing nearly half of the generated electricity through outdated and poorly maintained infrastructure.
Despite an estimated 100 GW of hydropower potential, only a small fraction has been developed, mainly through the Inga I and II dams, which operate at below-capacity levels. The planned Grand Inga scheme could generate 44 GW at a cost of about US$80 billion, potentially meeting domestic demand and enabling exports.
Its first phase, Inga III (4.8 GW, US$14 billion), has been delayed for decades due to governance and funding challenges. After the World Bank suspended funding in 2016 over transparency concerns during Joseph Kabila's presidency, progress slowed further. Inga III is now unlikely to be completed before 2030.
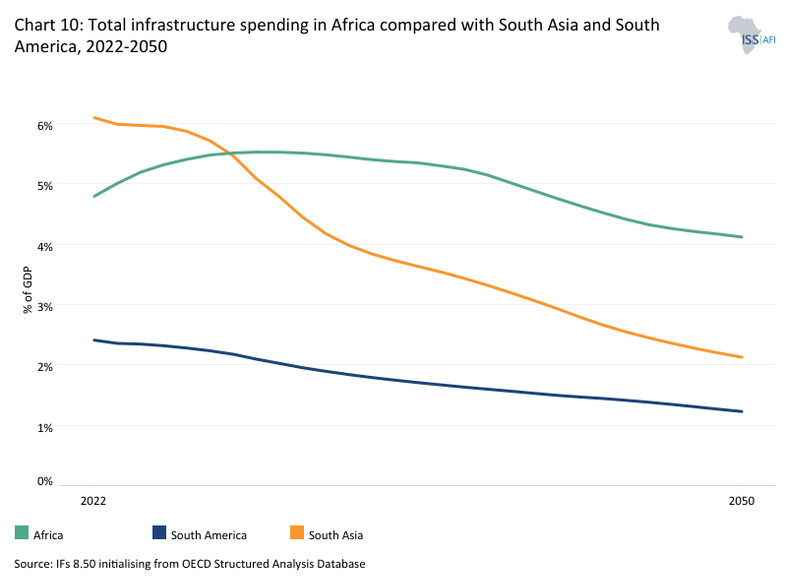
Chart 10 compares spending on infrastructure (all types and including maintenance) in Africa with that in South America and South Asia from 2020 to 2043. As a percentage of GDP, Africa spends significantly more on infrastructure than South America, but much less than South Asia. On the Current Path, this gap will close by 2028 as South Asia’s spending (% GDP) declines faster than Africa’s. Spending on infrastructure is also set to remain quite robust across the forecast horizon, despite a slight reduction over time. However, because of rapid population growth, Africa needs to spend significantly more on infrastructure than other regions, now and in the future. In 2024, Africa's total expenditure on infrastructure was at about 5.7% of GDP on all aspects of infrastructure (core and maintenance, public and private), compared to 5.2% in South Asia and South America and 2.3% in South America.
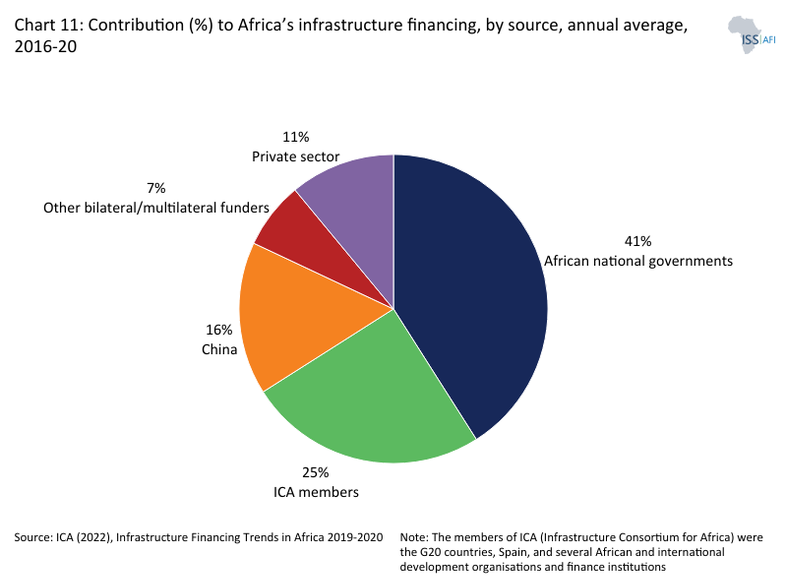
Many actors are involved in financing and delivering infrastructure in Africa. Chart 11 depicts the contribution (%) to Africa’s infrastructure financing, by source, as an annual average from 2016 to 2020. Based on the most recent comparable data, total infrastructure investment in Africa—from governments, development partners and the private sector—averaged US$83 billion per year. African governments and development funders remain the dominant sources of financing, together accounting for 89% of average annual infrastructure commitments over this period. Their investments were largely concentrated in transport, energy and water infrastructure. By contrast, the private sector played a more prominent role in digital infrastructure, accounting for 55% of total investment. Even so, this share remained well below the 76% private sector contribution observed across developing countries.
Over the period 2016-2020, public infrastructure spending averaged 1.3% of GDP (about US$34 billion annually), well below the levels observed in countries that have successfully pursued infrastructure-led development strategies, such as China (6.7% of GDP) and Vietnam (5.1%).
Public investment in Africa is constrained by limited fiscal space and rising sovereign debt burdens. The continent’s debt levels are approaching those seen before the major debt relief initiatives of the early 2000s. In 2024, public debt reached 67% of Africa’s GDP, exceeding the 62% recorded in 2000, with external debt accounting for around 22% of GDP. Eight African countries, out of 11 globally, are in debt distress, while a further 15 face a high risk of overall debt distress, including 12 where vulnerabilities stem primarily from external debt exposures. Over the period 2019–2023, African governments spent, on average, seven times more on debt servicing than on infrastructure. Elevated debt service costs are partly driven by high and uneven interest rates on sovereign borrowing, which range from 0.2% to 7.7% across Africa’s main infrastructure financiers, including the World Bank, China, the AfDB and bilateral creditors. As a result, interest payments exceed infrastructure spending in 15 African countries. China is the largest individual funder of Africa’s infrastructure (Chart 11). However, China’s contribution decreased significantly from US$25.7 billion in 2018 to US$6.7 billion in 2019 and further to US$6.5 billion in 2020. This reduction reflects the decision by China’s government to reduce its investments in Africa because of criticism for its role in growing African governments' sovereign debt burden and concerns about Africa’s ability to service its debt. Also see the section on debt in the Current Path theme.
Private investment in infrastructure in Africa remains modest, reflecting heightened risk perceptions, macroeconomic volatility and a high cost of capital. While global private infrastructure investment tripled between 2013 and 2022, Africa attracted only 6–8% of annual global flows during this period. The weighted average cost of capital for infrastructure projects is estimated at 13% in Africa, compared with 10% in developing Asia and 8% in OECD countries. Despite these challenges, infrastructure investments in Africa can offer high returns, particularly where regulatory frameworks are strong. Project costs and implementation timelines can be up to 60% higher than in developed countries, yet expected returns may reach 20%, among the highest globally. Over the period 2013-2023, South Africa and Egypt captured a significant share of private infrastructure investment, 21% and 15%, respectively. These were supported by robust policy frameworks and targeted initiatives, such as South Africa’s Renewable Energy Independent Power Producer Procurement Programme and Egypt’s issuance of Africa’s first sovereign green bond. Also see the FDI section in the Financial Flows theme.
Development finance continues to play a critical role, but the outlook for this source of finance is increasingly uncertain. Although annual development finance for infrastructure rose by around US$5 billion between 2010 and 2023, recent geopolitical and macroeconomic pressures have led to declining disbursements, which fell from US$16.6 billion in 2022 to US$14.8 billion in 2023. Furthermore, preliminary estimates for 2024 suggest that net aid from members of the OECD Development Assistance Committee (DAC) to all sectors in Africa fell by 1% in real terms compared to 2023, with projections suggesting a cumulative reduction of 16–28% between 2023 and 2025. These declines disproportionately affect countries with lower levels of development.
In sum, Africa’s infrastructure financing is largely structured around three main instruments: debt (through loans and bonds), equity and blended finance. Debt financing takes multiple forms, including commercial loans, concessional loans and grants. While infrastructure financing has traditionally been dominated by grants and concessional lending, China’s engagement in Africa has increasingly shifted infrastructure financing toward more commercially oriented lending. In general, debt financing is less costly than equity financing, while the cost of blended financing varies widely depending on its structure.
Loans and bonds remain the most widely used instruments for financing infrastructure across the continent. Most African countries, for instance, maintain lending arrangements with multilateral institutions such as the World Bank. At the same time, blended finance is gaining prominence as a means of leveraging public resources to attract private capital. Closely linked to this trend is the growing emphasis on public–private partnerships (PPPs). A wide range of PPP models, from Build–Operate–Transfer arrangements to management contracts, has been promoted to mobilise private-sector expertise and financing, to improve project delivery timelines and the long-term operation and maintenance of infrastructure assets.
Meeting Africa’s Infrastructure Investment Need
Download to pdfAfrica’s infrastructure deficit is one of the continent’s binding constraints to sustainable growth and structural transformation, as reflected in the theme on energy. Major infrastructure projects are capital-intensive and often unaffordable for many low-income countries. At the same time, even upper-middle- and high-income economies rarely have the fiscal space to finance large projects entirely from annual budgets. High debt-to-GDP ratios further limit borrowing capacity. According to the African Development Bank, closing Africa’s infrastructure gap will require between US$130 billion and US$180 billion annually, yet despite substantial inflows of public and private finance, an estimated annual shortfall of US$68–108 billion persists. This gap is driven largely by deficits in water and sanitation infrastructure (around 41%), followed by electricity supply and transport access (approximately 28% each), with ICT infrastructure accounting for the remainder. A recent report by the African Union Commission (AUC) and the OECD estimates that, as a share of total GDP, Africa’s infrastructure investment needs are three times those of Latin America and the Caribbean and five times those of developing Asia.
At the core of Africa’s response is the Programme for Infrastructure Development in Africa (PIDA), a continent-wide initiative designed to accelerate the development of transformative, cross-border infrastructure. PIDA is closely aligned with key pan-African priorities such as the Trans-African Highway Network, the Single African Air Transport Market and the Continental High-Speed Rail Project, reflecting a strong emphasis on regional integration.
Under the PIDA Priority Action Plan 1 (PAP1) (2012–2020), 51 cross-border infrastructure programs comprising 409 individual projects were identified. While tangible progress was achieved—including the construction of more than 16 000 km of roads, 4 000 km of railways and 3 500 km of transmission lines—implementation lagged behind ambition, with only 18% of targeted projects operational by 2025. These outcomes highlighted persistent challenges related to project preparation, financing and coordination.
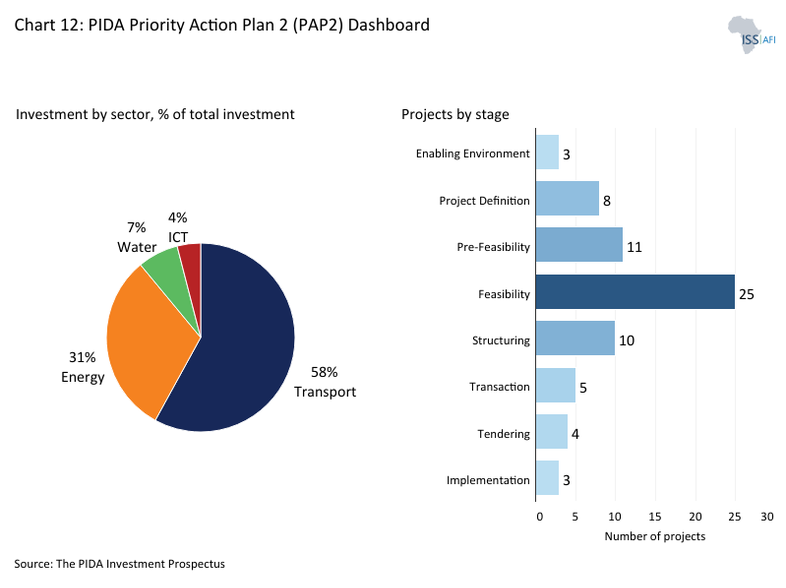
Building on these lessons, PIDA PAP2 (2021–2030) prioritises 69 projects valued at approximately US$125 billion across four sectors: transport, energy, water and ICT. Project selection places strong emphasis on regional relevance and cross-border impact, while also integrating development priorities such as job creation, rural–urban connectivity, youth and gender mainstreaming, climate resilience and financial viability. Chart 12 shows the PIDA PAP2 dashboard. To strengthen implementation, PAP2 is supported by dedicated instruments—including the PIDA Service Delivery Mechanism and the PIDA Job Creation Toolkit—often developed in partnership with international actors.
AUDA-NEPAD further underscores the importance of corridor-based infrastructure development, particularly multi-country projects that combine road, rail, ports and ICT infrastructure. Corridors such as the Lamu Port–South Sudan–Ethiopia Transport Corridor illustrate how integrated approaches can reduce non-tariff barriers to trade, deepen economic linkages and support coordinated solutions to shared challenges such as water resource management. Chart 13 depicts the geographic spread of PIDA projects across the continent in 2021, reflecting this regional logic: transport corridors, ports, and border investments form the backbone of Africa’s integration agenda.
Beyond PIDA, several African- and partner-led initiatives play a critical role in strengthening the infrastructure pipeline and mobilising finance. The NEPAD Infrastructure Project Preparation Facility (NEPAD-IPPF), established in 2005, is a multi-donor fund hosted by the African Development Bank, which supports governments in preparing bankable regional projects by addressing early-stage technical, legal and financial constraints. This upstream support is essential for unlocking downstream investment. Between 2004 and 2022, NEPAD-IPPF approved 106 grants totalling US$115 million, leveraging US$11 billion in investment financing.
The Infrastructure Consortium for Africa (ICA), established at the G8 Gleneagles Summit, brings together African institutions and international partners—including the World Bank and G8 countries—to mobilise financing, remove implementation bottlenecks and support major regional programmes such as power pools and transport corridors. Similarly, the African Investment Forum (AIF), led by the African Development Bank Group, convenes public and private investors to close financing gaps through pooled capital, blended finance and risk-mitigation instruments.
At the global level, initiatives such as the European Union’s Global Gateway and the G7’s Partnership for Global Infrastructure and Investment (PGII) have expanded financing for Africa’s infrastructure. Launched in 2021 and 2022, respectively, both initiatives support infrastructure development, green energy and digital connectivity while helping to coordinate international efforts. The EU’s Global Gateway adopts a more hands-on approach in Africa, working through EU delegations to support priority value chains along 12 strategic corridors. Beyond financing, it seeks to strengthen trade links and promote near-shoring of European production, including green hydrogen. The program aims to mobilise up to EUR 150 billion between 2021 and 2027 by blending EU grants with investments and risk-sharing instruments under the European Fund for Sustainable Development Plus. By the end of 2024, Global Gateway had allocated nearly EUR 624 million in grants to regional infrastructure projects, mainly in energy and transport. Together, these mechanisms improve project bankability, crowd in private capital and help narrow Africa’s infrastructure financing gap.
Public–private partnerships (PPPs) are expected to play an increasingly important role in infrastructure delivery, particularly through concession models such as build–operate–transfer (BOT) arrangements. PPPs offer the potential to mobilise private finance through user-pay principles, such as port fees or road tolls. Still, they also raise concerns about affordability, equity and fiscal risk. Large toll roads remain concentrated in a few countries, including South Africa, Morocco and Senegal, and poorly designed projects risk excluding low-income users or imposing excessive contingent liabilities on governments. Recent projects illustrate these tensions. The Mombasa–Nairobi Standard Gauge Railway, financed largely through Chinese loans at commercial rates, significantly increased Kenya’s debt burden and stalled before full regional extension. Similarly, the Nairobi Expressway, developed under a long-term concession, guarantees substantial profits to the operator through tolls that may limit access for poorer users. These cases underscore the importance of transparency, sound project selection and careful risk allocation.
As global financing conditions tighten and donor countries prioritise domestic agendas, mobilising domestic capital has become increasingly critical. Analysts estimated that Africa already holds over US$1.1 trillion in domestic capital, including pension and insurance assets, sovereign wealth funds, public development banks, commercial banks and foreign exchange reserves. Yet much of this capital remains underutilised for long-term investment.
Institutional investors represent the largest pool of long-term savings. Pension and insurance funds together manage around US$777 billion, while sovereign wealth funds and public development banks account for roughly US$400 billion. However, these assets are typically concentrated in low-risk, short-term instruments such as government securities, limiting investment in infrastructure and other productive sectors. Fragmented capital markets, high informality and regulatory constraints further weaken the link between savings and investment.
Strengthening public capital institutions—notably sovereign wealth funds and public development banks—offers a powerful lever to crowd in private finance, support counter-cyclical investment and reduce reliance on external borrowing. At the same time, expanding the formal savings base could unlock significant additional resources. It is estimated that partial formalisation of the informal economy alone could generate more than US$200 billion in new long-term savings.
Remittances also represent a largely untapped source of financing. In 2024, Africa received over US$95 billion in remittance inflows, comparable to total FDI and more resilient than other capital flows. While primarily used for consumption, these funds could be leveraged for infrastructure through structured instruments such as diaspora bonds integrated into national investment strategies.
Mobilising private investment in Africa’s infrastructure requires systematically reducing project risk and strengthening the enabling environment. While corruption and governance challenges remain concerns, even well-intentioned infrastructure projects face significant structural barriers that deter private capital.
A central constraint lies in project preparation. Chart 14 shows Africa’s infrastructure pipeline. Early-stage development—including feasibility studies, technical design, environmental and social assessments and financial structuring—can account for 5–12% of total project costs and take up to seven years to complete. For large-scale projects worth hundreds of millions or billions of dollars, this represents a substantial upfront investment, often with no guarantee of commercial viability. As a result, up to 90% of infrastructure projects in Africa fail before reaching financial close, with approximately 80% stalling at the feasibility stage. Weak preparation, inconsistent planning standards, and limited technical capacity further increase perceived risks for private investors.
Addressing these challenges requires coordinated action from governments, international financial institutions (IFIs) and private investors. Governments play a critical role in reducing regulatory, political and currency risks through predictable policies, transparent procurement processes and credible legal frameworks, particularly for PPPs. Strengthening institutions and regulatory regimes is essential, as poorly developed PPP frameworks and investment regulations often limit participation by major institutional investors such as pension funds, especially in countries below investment grade.
IFIs and development partners can help mitigate risk through guarantees, blended finance instruments and other risk-sharing mechanisms that improve project bankability. They can also expand support for high-quality project preparation facilities to reduce early-stage failure rates. Private investors, for their part, can engage earlier in the project cycle to shape feasibility assessments and financial structuring, aligning projects more closely with market expectations.
At the continental level, institutions such as AUDA-NEPAD are working to strengthen project preparation and signal investment readiness. Initiatives like the PIDA Quality Label aim to identify bankable projects, while mechanisms such as the African Infrastructure Guarantee Facility seek to share and mitigate risk.
However, governments must also carefully balance commercial viability with development priorities. Certain high-impact but low-return investments, such as basic water, sanitation and rural transport infrastructure, are likely to remain primarily public responsibilities. In contrast, commercially viable sectors such as energy generation, ports and telecommunications may be better suited to private participation under appropriate risk-sharing frameworks.
Ultimately, closing Africa’s infrastructure gap demands deeper coordination among governments, development partners and the private sector. Improving the quality of preparation, strengthening institutions and deploying effective risk-mitigation tools are essential to crowding in private capital at the scale and quality required for sustainable development.
This section models the potential impact of enhanced infrastructure investment on the continent’s development prospects through to 2050.
While discussed separately, the two themes—large-scale infrastructure and leapfrogging—are closely related and mutually reinforcing. This is particularly evident in the expansion of large-scale renewable energy alongside off-grid and micro-grid solutions, which together are transforming electricity access. Combined with the strong multiplier effects of information and communication technologies (ICT), these developments lower barriers to private capital entry and facilitate the faster formalisation of significant segments of the informal economy.
The policy interventions under the Large Infrastructure and Leapfrogging scenario begin in 2027, followed by a sustained ten-year implementation phase through 2036, with gains consolidated and maintained through 2050. Interventions are designed and implemented at the country level and are grounded in a careful assessment of what is realistically achievable. This assessment draws on rigorous benchmarking against countries in other developing regions—particularly South Asia and South America—that have achieved comparable progress at similar stages of development. The primary objective of this scenario analysis is to illustrate how sustained and targeted efforts to accelerate infrastructure development could significantly enhance human welfare and drive long-term economic transformation across the continent.
Chart 15 shows the structure of the Large Infrastructure and Leapfrogging scenario. The International Futures (IFs) forecasting platform used for this study distinguishes between traditional infrastructure (water, roads, electricity, sanitation and wastewater), ICT infrastructure (mobile phones, fixed broadband and mobile broadband) and a residual called ‘other infrastructure’ (facilities such as ports, airports, railways, etc.). IFs considers both public and private spending on core infrastructure and public spending on other infrastructure, but does not provide for infrastructure that is explicitly funded through public–private partnerships.
Chart 16 depicts government spending on infrastructure in Africa in the Large Infrastructure and Leapfrogging scenario versus the Current Path from 2020 to 2050. Although infrastructure financing and delivery in Africa involve many stakeholders, national governments remain the primary source of funding, contributing 41% of total commitments between 2016 and 2020. Under the Large Infrastructure and Leapfrogging scenario, government spending on infrastructure will rise to US$267 billion (2017 constant dollars) by 2050, which will be US$44 billion higher than the Current Path forecast of US$223 billion for that year. Over the period 2027 to 2050, average annual public infrastructure spending will reach US$171 billion (2017 constant dollars) under this scenario, compared with US$150 billion under the Current Path.
Scenario Impact on Provision of Infrastructure, Economy, Trade and Poverty
Download to pdfInfrastructure underpins productive activity by enabling households and firms to access goods, services, and markets. Expanding both the quantity and quality of infrastructure allows previously underused or untapped resources and capital to be mobilised, raising productive capacity and supporting capital accumulation. In turn, this drives economic growth, job creation and broader socio-economic development. Infrastructure is also a prerequisite for productive transformation—the process through which economies build and diffuse organisational, production and technological capabilities and reallocate capital and labour toward more productive activities.
For example, transport infrastructure enables rural agricultural workers to access higher-productivity jobs, particularly in services. In contrast, reliable energy and digital infrastructure facilitate the adoption of modern technologies in agriculture and manufacturing and support the expansion of high-productivity sectors such as financial and digital services. When combined with trade and tax reforms, infrastructure development can therefore catalyse productive transformation, yielding more sustainable and equitable economic outcomes.
Chart 17 shows the share of paved roads in the Large Infrastructure and Leapfrogging scenario compared with the Current Path from 2022 to 2050. In the scenario, paved roads will account for 66% of Africa’s total road network by 2050, which will be seven percentage points higher than the Current Path forecast of 59%. Despite this improvement, the continent’s share of paved roads would remain well below South Asia’s projected level of 81% in 2050.
When the results are disaggregated by income group, clear differences emerge in both baseline conditions and the scale of improvement under the infrastructure scenario.
By 2050, lower-middle-income African countries will have the highest share of paved roads among all income groups. Under the Large Infrastructure and Leapfrogging scenario, the share of paved roads in this group will rise to 74%, compared with 67% under the Current Path, an improvement of seven percentage points. This will place lower-middle-income countries ahead of both low-income and upper-middle-income peers in terms of overall road paving coverage.
For upper-middle-income African countries, the share of paved roads will increase by five percentage points relative to the Current Path, reaching 69% by 2050. In contrast, low-income countries will experience the most dramatic relative improvement. Starting from very low levels of paved road coverage, the interventions in the Large Infrastructure and Leapfrogging scenario are more aggressive for this group. As a result, the share of paved roads in total road networks will increase by nine percentage points above the Current Path, reaching 52% by 2050. While this will still leave them behind higher-income groups in absolute terms, the magnitude of change highlights significant progress in closing the infrastructure gap in the scenario.
Looking at regional comparisons under the Large Infrastructure and Leapfrogging scenario, sub-Saharan Africa will reache 63% paved roads by 2050. Despite improvements—amounting to a seven-percentage-point increase over the baseline—this level will remain below the average for other developing subregions. By contrast, North Africa will achieve a higher level of coverage, with paved roads increasing by four percentage points to 80% by 2050 under the same scenario. North Africa will be on par with South Asia by 2050. In the scenario, North Africa will continue to outperform sub-Saharan Africa in infrastructure provision.
Finally, Seychelles, the continent’s only high-income country, stands out with near-universal coverage. By 2050, 99% of its total road network will be paved, reflecting both its higher income level and smaller geographic scale.
Regarding electricity access, the intervention scenario delivers transformative improvements compared with the Current Path. Chart 18 shows access to electricity in the scenario versus the Current Path from 2022 to 2050. By 2050, the number of people without access to electricity will fall to 273 million under the intervention, compared with 543 million under the Current Path. In other words, the scenario will cut the number of unserved people almost in half. This will translate into a continental electricity access rate of 89.5%, substantially higher than the 79% projected on the Current Path—a gain of more than 10 percentage points.
Although the scenario will not eliminate disparities between urban and rural areas, it will significantly narrow the gap. By 2050, electricity access in urban areas will reache 97.3%, while rural access rises to 80%. The resulting 17-percentage-points gap will be considerably smaller than the 29-percentage-points gap projected under the Current Path in the same year. The scenario will also markedly reduce regional disparities within the continent. In sub-Saharan Africa, electricity access will reach 88% by 2050 under the intervention, compared with 93.7% in North Africa. The gap between the two regions will narrow to about six percentage points, less than half of the 13.7 percentage-point gap projected under the Current Path.
Overall, while universal access will not fully be achieved in the scenario, the intervention will substantially accelerate electrification, sharply reduce the number of people left behind and significantly narrow both urban–rural and regional disparities.
The Large Infrastructure and Leapfrogging scenario will substantially accelerate progress in digital connectivity, particularly in fixed broadband adoption, while producing more modest gains in mobile broadband. Chart 19 shows access to fixed broadband across Africa in the scenario, compared with the Current Path from 2022 to 2050. Under the scenario, fixed broadband subscriptions will rise to 47 subscriptions per 100 people by 2050. This represents a dramatic improvement over the 29 subscriptions per 100 people projected under the Current Path, an increase of 18 subscriptions per 100 people. At this level, Africa would be broadly on par with the projected rate for South America, and notably ahead of South Asia. This will mark a significant shift in closing the digital infrastructure gap with other developing regions, particularly in high-capacity, fixed-line connectivity that supports businesses, institutions and high-data applications.
By contrast, gains in mobile broadband subscriptions will be more incremental. The intervention will raise mobile broadband penetration to 151 subscriptions per 100 people, only slightly above the 149 per 100 people projected under the Current Path. While this will still place Africa roughly on par with South America, the relatively small difference suggests that mobile connectivity is already nearing saturation under baseline trends, leaving less room for dramatic acceleration.
In the Large Infrastructure and Leapfrogging scenario, the gap between energy demand and production will narrow substantially, placing Africa on a more sustainable and resilient development path. Chart 20 depicts energy demand and production in Africa in the scenario versus the Current Path from 2022 to 2050. Under the Current Path, the energy deficit will reach 3.5 billion barrels of oil equivalent (BBOE) by 2050. In contrast, the scenario will reduce this shortfall to just 1 BBOE equivalent in the same year.
In addition, the scenario will accelerate the energy transition. The share of renewable energy in total energy production will reach 45% by 2050, compared with 34% under the Current Path in the same year. This significant increase underscores a structural shift toward cleaner energy sources.
Together, the reduced energy gap and the higher share of renewables carry important implications for sustainable development. They would strengthen energy security, lower dependence on fossil fuel imports and reduce exposure to price volatility. Expanding renewable energy also supports climate mitigation efforts, improves environmental outcomes and broadens access to affordable and reliable power—thereby fostering inclusive growth, industrial development and improved living standards across the continent.
However, this apparent reduction in the energy deficit should be interpreted with caution. Much of the continent’s energy production remains dominated by crude oil, which does not automatically translate into a usable domestic energy supply. It is a raw material that must be refined before it can be used as fuel or for electricity generation. For instance, until recently, Nigeria’s refining capacity was limited and poorly maintained, preventing the country from meeting domestic fuel demand. As a result, most crude oil was exported, while refined petroleum products were imported—often at high cost and with exposure to supply disruptions. This structural mismatch between production and domestic processing capacity highlights the importance of strengthening downstream infrastructure and diversifying energy sources to ensure that production gains effectively support sustainable development outcomes.
Chart 21 shows GDP (MER) in Africa in the scenario versus the Current Path for 2050. Under the Large Infrastructure and Leapfrogging scenario, Africa’s economy will grow at an average annual rate of 6% between 2027 and 2050, one percentage point higher than the 5% average growth rate forecast over the same period on the Current Path. This performance will translate into a significantly larger economy, with Africa’s GDP projected to be nearly US$1 trillion (US$948 billion, in 2017 dollars) higher than the Current Path forecast by 2050. All countries will see their GDP improve above the Current Path. Still, the largest economies, including Nigeria, Egypt, South Africa, Ethiopia, DR Congo, Ghana, Tanzania, Algeria and Kenya, among others, are expected to see the most significant absolute gains.
When improvements in transport networks, energy supply, ports and digital infrastructure raise productivity, the resulting increase is applied to a much larger economic base in countries such as Nigeria, Egypt and South Africa. Even when percentage growth accelerates by a similar margin across countries, the dollar value of additional output is substantially higher in economies that already produce more goods and services. In addition to their larger starting base, larger African economies tend to have more diversified production structures, deeper domestic markets and stronger intersectoral linkages. Infrastructure improvements in these contexts generate broader multiplier effects, as reduced transport and energy costs simultaneously stimulate manufacturing, services, agriculture and trade. Larger markets also attract greater private investment and are better positioned to efficiently absorb new capital, reinforcing the growth impulse. By contrast, smaller economies—often more narrowly specialised—may experience meaningful relative (percentage) gains. Still, the absolute expansion in output remains smaller because fewer sectors and firms can capitalise on the improved infrastructure at scale.
The growth-enhancing effects of infrastructure found in the Large Infrastructure and Leapfrogging scenario are in line with previous studies on the impact of infrastructure development on growth. An IMF study covering the period 1985–2014 found that an unanticipated 1% increase in public infrastructure investment raised GDP by 0.4% in the following year and by 1.5% after four years. Similarly, a recent study by the World Bank shows that a 10% expansion in transport, energy and digital infrastructure increases economic output by 0.1%, 0.5% and 0.3%, respectively, highlighting the critical role of infrastructure in boosting growth.
Africa's average GDP per capita (at purchasing power parity, PPP) will be about US$510 larger in the Large Infrastructure and Leapfrogging scenario than in the Current Path in 2050. This is a notable increase as the continent’s total population will 2050 exceed 2.5 billion people. The improvement in GDP per capita for each African country compared with the Current Path in 2043 is presented in Chart 22, with Seychelles (the only high-income country in Africa) and many lower-middle- and upper-middle-income countries doing exceptionally well in the scenario.
Chart 23 shows total trade in the Large Infrastructure and Leapfrogging scenario versus the Current Path from 2022 to 2050. Under the scenario, Africa will experience substantial long-term trade gains. By 2050, total trade volume (exports plus imports) would increase by US$478 billion (or 9%) relative to the Current Path. Within this total, exports will rise by US$165 billion (6.5%), while imports will grow by US$313 billion (11%). These projections underscore the transformative potential of large-scale infrastructure investment for the continent’s economic trajectory.
Such gains are closely linked to improvements across transport, energy and digital infrastructure systems. Investments in roads and railways reduce transport and transaction costs, currently more than five times higher in Africa than in other world regions, while improving connectivity between production centres and markets. Lower trade costs enhance export competitiveness, stimulate intra-African trade—particularly in processed and semi-processed goods—and increase overall export volumes. Reliable energy infrastructure enables firms to operate consistently and at lower cost, strengthening their integration into regional and global value chains. At the same time, expanded digital infrastructure facilitates e-commerce, digital payments and more efficient customs procedures, reducing barriers for businesses, especially small and medium-sized enterprises. Improved road and railway networks support structural transformation by enabling a shift from low-productivity agriculture toward higher-value manufacturing and services. By enhancing access to inputs, suppliers and consumer markets, infrastructure development raises firm productivity and fosters industrial growth. For example, operationalising regional transport corridors under the Programme for Infrastructure Development in Africa is estimated to increase exports by 11.5% and boost overall GDP growth by up to 2%. Collectively, these investments strengthen regional integration, deepen value chains and position African economies for more diversified and sustained growth.
Through higher growth and expanded trade, the scenario will also generate significant employment gains and contribute to poverty reduction. In the scenario, employment in the services and ICT sectors will increase by 2.9 million and 7.6 million, respectively, above the Current Path forecast by 2050. In contrast, employment in agriculture and manufacturing will decline, reflecting how infrastructure development raises productivity, accelerates technology adoption and reshapes the structure of labour demand across the economy.
Improved infrastructure, such as reliable electricity, broadband and efficient transport and logistics, enables the expansion of modern services and digital industries. Better power and connectivity lower entry barriers for ICT, finance, e-commerce and other knowledge-based activities, which tend to be labour-absorbing and grow rapidly once infrastructure constraints are eased. Rising incomes and urbanisation further increase demand for retail, transport, education, healthcare and other services, shifting employment toward services and ICT.
At the same time, infrastructure raises productivity in agriculture and manufacturing through mechanisation, automation and more efficient supply chains. Improved roads, irrigation, energy and logistics allow higher output with fewer workers. Although production may expand, labour demand per unit of output declines, leading to a reallocation of workers from lower-productivity sectors to higher-productivity services—reflecting the broader process of structural transformation.
This employment potential of the Large Infrastructure and Leapfrogging scenario is consistent with evidence from ongoing continental initiatives. As of 2023, projects under the Programme for Infrastructure Development in Africa (PIDA) had generated about 162,000 jobs, and employment estimates from 94 projects across 34 countries suggest that up to 15 million additional jobs could be created during their construction, operation and maintenance phases. For example, the North-South Corridor—comprising 16 projects across eight countries—is expected to generate 4.5 million jobs over its full implementation period, alongside approximately 130 000 additional jobs in related sectors such as agri-food, mining and trade. These projections highlight the substantial employment potential of large-scale infrastructure investments.
Improved infrastructure development in Africa, as modelled in the scenario, also has the potential to lift millions of people out of extreme poverty. Chart 24 depicts extreme poverty in the Large Infrastructure and Leapfrogging scenario versus the Current Path from 2022 to 2050. Using the US$2.15 per day poverty line, the number of people living in extreme poverty will decline to 299 million by 2050, approximately 63 million fewer than under the Current Path forecast for the same year. This corresponds to a poverty rate of 11.5% in 2050, which is 2.4 percentage points lower than the projected rate on the Current Path.
The Large Infrastructure and Leapfrogging scenario will lead to poverty reduction across all African countries. However, the scale of impact will vary significantly, depending on initial poverty levels, population size and economic structure. Countries with the largest concentrations of people living in extreme poverty will experience the greatest absolute reductions. In particular, the DR Congo will see about 13 million fewer people living below the US$2.15 poverty line in 2050 compared with the Current Path, followed closely by Nigeria with 12 million. Other notable reductions are projected in Sudan (3.9 million), Mozambique (3.8 million) and Tanzania (3.6 million). These large absolute gains reflect both the size of their poor populations and the strong growth and employment effects generated by improved infrastructure, which raise incomes and expand economic opportunities.
The impact also differs across income groups. Low-income countries will record the largest aggregate reduction, with 38.6 million fewer people living in extreme poverty compared to the Current Path, followed by lower-middle-income countries with 23 million fewer poor people. Upper-middle-income countries will see a much smaller reduction, around one million, at the US$2.15 threshold. This pattern is expected, as extreme poverty is already less prevalent in higher-income economies. In contrast, low-income countries start from higher poverty rates. They are therefore more responsive to growth, trade expansion and job creation triggered by infrastructure development, resulting in larger poverty declines both in absolute and relative terms.
Infrastructure is far more than a physical asset; it is a catalyst for structural transformation. Well-targeted investments in transport, energy and digital systems can accelerate industrialisation, deepen regional trade and integrate African economies into global value chains. Under the Large Infrastructure and Leapfrogging scenario, these investments could increase Africa’s GDP per capita by approximately US$510 by 2050 and expand total trade volume by US$478 billion above the Current Path forecast. By lowering transport and logistics costs, providing reliable electricity and expanding digital networks, infrastructure creates the conditions for higher productivity, employment growth and diversification into higher-value economic activities.
The social and employment impacts would be significant. Expanding services and ICT sectors can absorb millions of workers, while productivity gains in agriculture and manufacturing allow labour to shift toward higher-value activities. These dynamics would reinforce structural transformation and lift millions out of extreme poverty. In 2050, Africa could see a reduction of 63 million people living below the US$2.15 per day poverty line compared with the Current Path. Gains will be especially pronounced in low- and lower-middle-income countries, demonstrating that strategic infrastructure investment can narrow development gaps and enhance inclusivity.
These findings are consistent with international research. A systematic review of 110 studies conducted by the OECD finds that, in aggregate, infrastructure investments in Africa have had strong positive effects on human development outcomes, poverty reduction, and access to and quality of employment. For example, every US dollar invested in climate-resilient water and sanitation infrastructure yields at least US$7 in socio-economic returns through improvements in health and education, strengthened food security and accelerated progress toward the Sustainable Development Goals. Furthermore, evidence from 29 African countries indicates that unreliable energy access, affecting 68% of manufacturing firms, significantly reduces employment in non-agricultural and skilled occupations.
Yet, Africa’s infrastructure landscape still reflects its colonial past, with networks designed to extract resources rather than link domestic markets, connect rural producers to cities or integrate neighbouring economies. Decades of underinvestment and weak maintenance have compounded these distortions, leaving significant gaps in transport, energy, water and digital systems. These deficits constrain human development, industrialisation and regional integration.
Although infrastructure investment by national governments and supported by external partners, including China and multilateral institutions, has steadily increased in recent years, growth in investment has not kept pace with rapid population expansion, urbanisation and economic ambitions. As Africa will approach a population exceeding 2.5 billion by 2050, infrastructure will determine whether demographic growth becomes a driver of prosperity or a drag on development. The continent has built extensive project pipelines and articulated ambitious regional frameworks, aligned with the African Continental Free Trade Area (AfCFTA). The core challenge now is execution: converting projects from concept to financial close and delivering functioning systems that raise productivity and improve living standards.
Addressing Africa’s infrastructure deficit to realise this potential will require a coordinated shift from fragmented, short-term project implementation toward integrated, long-term infrastructure systems that directly support economic transformation. Infrastructure investment should be strategically prioritised to maximise regional connectivity, productivity gains and industrial development. Aligning national infrastructure plans with continental frameworks such as the Programme for Infrastructure Development in Africa can help ensure that projects strengthen cross-border trade corridors, energy pools and digital networks while supporting regional value chains.
Financing reform will be equally critical. Africa’s infrastructure gap cannot be closed through public budgets, especially amid rising debt pressures. Governments should deepen domestic resource mobilisation, strengthen tax administration and develop local capital markets to channel pension and insurance funds into long-term infrastructure assets. Blended finance instruments, risk-mitigation facilities, and credible public–private partnership frameworks can crowd in private capital where risks are well allocated. Innovative revenue tools—such as land-value capture around transport nodes, green bonds for climate-resilient infrastructure and regional infrastructure funds—can diversify funding sources while preserving fiscal sustainability. Transparent regulatory environments and predictable policy frameworks will be critical to enhancing investor confidence.
Strengthening governance and project preparation capacity will be equally important. Many infrastructure projects face delays or cost overruns due to weak feasibility assessments, procurement inefficiencies and limited contract management expertise. Establishing robust project preparation facilities, professionalised PPP units and independent regulatory oversight can improve bankability and accelerate implementation. Lifecycle costing and maintenance planning must be integrated at the design stage to preserve asset quality and ensure long-term returns on investment.
Regional integration should be treated as a central pillar of infrastructure strategy. Africa’s fragmented transport, energy and logistics networks constrain trade and limit economies of scale. Coordinated cross-border infrastructure development, supported by regulatory harmonisation and institutional cooperation, can significantly reduce trade costs and enhance market access. Aligning infrastructure expansion with the goals of the AfCFTA will strengthen intra-African trade and deepen economic integration.
Finally, human capital development and institutional strengthening will underpin all reform efforts. Expanding technical and managerial skills in infrastructure planning, engineering, financial structuring and digital systems management will be essential for improving delivery outcomes. Governments should foster partnerships between public institutions, universities and the private sector to build a sustainable pipeline of expertise. Leveraging digital technologies, including geospatial planning tools and e-procurement systems, can further enhance transparency, efficiency and accountability.
Africa’s current infrastructure reflects historical distortions, but its future can reflect deliberate strategic choice. The continent has demonstrated growing commitment and rising investment. The task ahead is to translate ambition into well-prepared, well-financed and well-governed projects that tangibly improve productivity, human welfare and economic resilience. With disciplined policy choices, sustained political commitment and strategic regional coordination, infrastructure can serve as the cornerstone of inclusive growth, economic diversification and poverty reduction, enabling Africa to harness its demographic dividend and secure long-term prosperity.
Chart 25 shows the strategic recommendations for closing Africa’s infrastructure gap. Governments across the continent should focus on the following interventions:
Prioritise infrastructure as a catalyst for transformation:
- Recognise infrastructure as a central driver of economic transformation, boosting productivity, regional integration and inclusive growth.
- Target investments to support industrialisation, structural transformation and higher-value economic activities.
- Align national strategies with continental frameworks such as PIDA and AfCFTA to ensure coordinated regional development.
- Scale up investment in foundational and advanced infrastructure, including energy, transport, water and digital systems, to strengthen trade, industrialisation and connectivity.
- Expand electricity generation and distribution, with a focus on renewables, mini-grids, off-grid solutions and rural electrification to close urban–rural gaps.
- Modernise transport networks, roads, railways, ports and airports, to improve market access, reduce logistics costs, lower emissions and to support trade, tourism and business mobility.
- Accelerate digital infrastructure deployment, including fibre-optic networks, broadband, satellite and alternative connectivity technologies, to extend access to underserved areas.
Promote regional integration and connectivity:
- Develop integrated regional infrastructure corridors combining roads, rail, ports, energy systems and ICT to reduce trade costs and strengthen value chains.
- Harmonise cross-border regulations in transport, energy and aviation sectors.
- Expand regional energy pools and transmission networks to improve electricity reliability and efficiency.
- Support corridor-based development linking landlocked countries to ports and major markets.
Strengthen financing and investment mechanisms:
- Increase overall infrastructure spending to meet Africa’s growing needs.
- Mobilise domestic resources via improved tax administration, fiscal reforms and institutional capital (pension funds, sovereign wealth funds, development banks).
- Leverage remittances, diaspora bonds, blended finance and PPP frameworks to attract private investment while ensuring transparency and fair risk allocation.
- Use innovative financial tools such as green bonds, regional infrastructure funds and land-value capture instruments.
- Improve debt management and fiscal transparency in infrastructure financing arrangements.
Improve governance, project preparation and implementation:
- Strengthen project preparation capacity, including feasibility studies, financial structuring and environmental assessments.
- Establish robust PPP units and project preparation facilities to improve bankability.
- Enhance procurement processes, contract management and lifecycle planning to reduce cost overruns and ensure long-term returns.
- Promote transparent and accountable regulatory frameworks to reduce corruption, political interference and investor risk.
- Integrate risk-mitigation instruments such as guarantees and insurance to crowd in private-sector participation.
Develop human capital and institutional capacity:
- Invest in technical and managerial skills for infrastructure planning, engineering, finance and digital management.
- Foster partnerships among governments, universities and the private sector to build sustainable expertise pipelines.
- Leverage digital tools (geospatial planning, e-procurement, monitoring platforms) to improve efficiency, transparency and delivery outcomes.
Page information
Contact at AFI team is Kouassi Yeboua
This entry was last updated on 25 May 2026 using IFs V8.50.
Donors and sponsors


Reuse our work
- All visualizations, data, and text produced by African Futures are completely open access under the Creative Commons BY license. You have the permission to use, distribute, and reproduce these in any medium, provided the source and authors are credited.
- The data produced by third parties and made available by African Futures is subject to the license terms from the original third-party authors. We will always indicate the original source of the data in our documentation, so you should always check the license of any such third-party data before use and redistribution.
- All of our charts can be embedded in any site.
Cite this research
Kouassi Yeboua (2026) Africa Large Infrastructure Futures. Published online at futures.issafrica.org. Retrieved from https://futures.issafrica.org/thematic/11-large-infrastructure/ [Online Resource] Updated 25 May 2026.