 8 The AfCFTA
Feedback welcome
Our aim is to use the best data to inform our analysis. See our Technical page for information on the IFs forecasting platform. We appreciate your help and references for improvements via our feedback form.
In this theme about the African Continental Free Trade Area (AfCFTA), we describe the effect of trade on economic development and show how Africa can benefit from improved regional trade. We then present a scenario that shows the impact of the full implementation of the AfCFTA and discuss the implications.
For more information about the International Futures modelling platform we use for our scenarios, please see the Technical page.
Summary
We begin this theme with an introduction and background to trade and related challenges for Africa. We then discuss the lack of connecting infrastructure across the continent, and the implications of non-tariff barriers. Subsequently, we explain the framework of the AfCFTA and assess its prospects and challenges.
- Globalisation has made immense contributions to humanity’s prosperity and development, although less in Africa despite several international agreements and measures designed to boost African trade volumes.
- Regional trade agreements (RTAs) can help African countries to implement domestic reforms and open up to global competitive market pressure at a sustainable pace, facilitating their economic integration into the global economy.
- Trade in Africa is complicated and costly due to high tariff rates and non-tariff barriers, such as inefficient customs procedures, inadequate infrastructure, and challenges in transport and logistics.
- As modelled in the AfCTA scenario, the AfCFTA holds considerable promise for economic development in Africa. However, not all member states are in a position to benefit from it, particularly in the short to medium term. Some are hampered by infrastructure deficit, inefficient customs procedures and high domestic inequality.
- The AfCFTA presents a unique opportunity to create an integrated, continent-wide market. It is a vital step towards building the ‘Africa we want’ in line with the aspirations of the African Union Agenda 2063.
- Until recently, Africa has done little to increase its intra-regional trade.
- African countries vary in size, and experiences in other regions indicate that including member states at varying levels of development generally benefits the more advanced members, while the less developed ones tend to lag further behind.
- Given that Africans invest in manufacturing production and productivity, well-considered and meaningful regional trade initiatives can boost trade volumes and value in Africa.
We proceed with examining the implications of a scenario that fully implements the AfCFTA. We assess its impact on the economy, growth, poverty, economic sectors, trade values, imports and exports, and carbon emissions.
- The AfCFTA has the potential to increase Africa’s GDP by around 10% and reduce the number of people living in extreme poverty by over 32 million by 2043.
- The successful implementation of the AfCFTA would greatly benefit Africa's services and manufacturing sectors. The services sector is expected to achieve additional gains of $397.6 billion, which is 10.7% higher than the Current Path. The manufacturing sector will see gains of $110.3 billion, or 8.1% more, while the materials sector could grow by $66.5 billion, or 24.2% more, compared to the Current Path by 2043.
- Total imports are forecasted to reach about $2.4 trillion by 2043, a 19.5% increase compared to the Current Path. While total exports would rise to around $2.2 trillion, reflecting a 27.7% increase.
- The increase in trade volumes under the AfCFTA will increase Africa’s carbon emissions from fossil fuels by 5.8% in 2043.
We end this theme with a summarising conclusion that includes key recommendations for decision-making. Given Africa’s fragmented geography, increased regional trade facilitated by trade agreements is imperative for building competitive, productive capacity at scale.
All charts for The AfCFTA
- Chart 1: Total trade and GDP per capita (PPP), 1960–2043
- Chart 2: Commodity dependence by export product group and commodity exports, average 2019-2021
- Chart 3: Africa's intra and extra-trade composition, 1995-2022
- Chart 4: Intra-region trade as % of total trade, 2004-2023
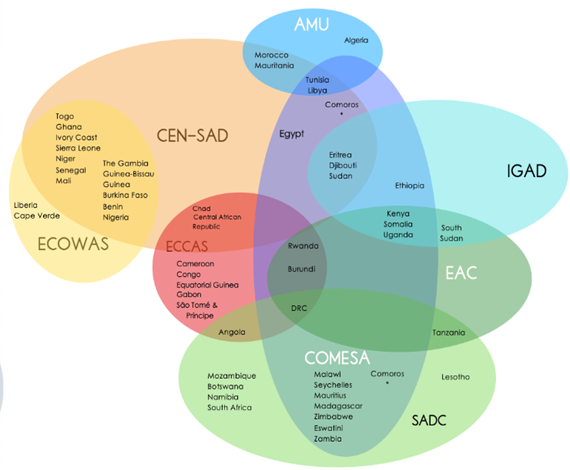
- Chart 5: Active Regional Economic Communities in Africa
- Chart 6: Map of LDCs, Non-LDCs and G6 countries, 2023
- Chart 7: Schedule of liberalisation for the tariff on goods
- Chart 8: The AfCFTA scenario
- Chart 9: GDP per capita (PPP) in the Current Path and AfCFTA scenario, 2023-2043
- Chart 10: GDP growth rates in the Current Path and AfCFTA scenario, 2023 - 2043
- Chart 11: Extreme poverty in the Current Path and AfCFTA scenario, 2023-2043
- Chart 12: GDP (MER) in the Current Path and AfCFTA scenario, 2023-2043
- Chart 13: Value added by sector in the Current Path and AfCFTA scenario, 2043
- Chart 14: Increase in value added by sector in AfCFTA, 2043
- Chart 15: Trade in the Current Path and AfCFTA scenario, 2023 - 2043
- Chart 16: Export values by sector in the Current Path and AfCFTA scenario, 2043
- Chart 17: Export/import gains in the AfCFTA scenario, 2043
- Chart 18: Export/import gains by sector in the AfCFTA scenario, 2043
- Chart 19: Carbon emissions in the Current Path and AfCFTA scenario, 2023-2043
- Chart 20: Key Recommendations
Trade liberalisation (or the extent to which an economy is considered to be open), either globally, continentally or regionally, is an important avenue for countries to boost productivity and output levels. Trade liberalisation can boost productivity and innovation activities, and hence output growth in several ways. For example, it can boost productivity and innovation through knowledge or technology transfer, increasing the quality and variety of inputs available to domestic producers. It can also strengthen competition in the liberalised sector(s), putting pressure on domestic producers to lower prices, improve efficiency and absorb advanced foreign industrial technologies.
Much of the wealth of many developed countries today is related to the extent to which globalisation allowed for trade expansion. For example, the success of the economy of the United Kingdom (UK) followed from its 18th industrial revolution and subsequent export performance through foreign trade. The UK’s industrial revolution subsequently provided the basis for industrial development in Western Europe, the United States (US), and other developed countries today. Similarly, the economic welfare gains of East Asian countries, such as China, Japan, Hong Kong, Korea, Singapore and Taiwan, are all linked to globalisation. These countries efficiently utilised imported industrial technologies that enhanced domestic productivity and innovation, eventually expanding the value of their exports. However, importing industrial technologies and knowledge must be complemented by connecting infrastructure, institutions, human capital and financial development.
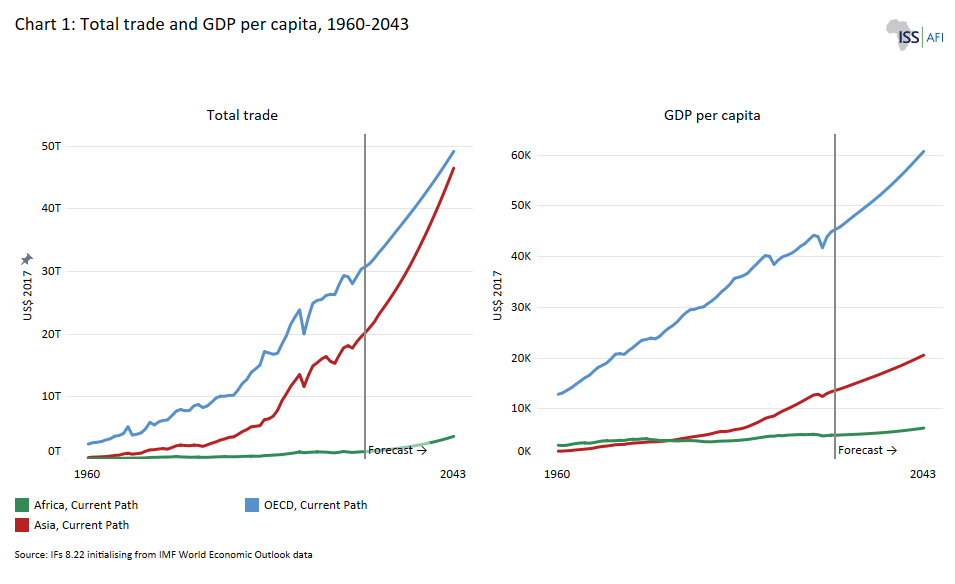
Africa is failing to maximise globalisation and remains the poorer region of the world (see Chart 1). Although Africa has 18.2% of the world's population, it has only about 2.9% of global GDP. Its trade is underperforming both in volume and content. Despite its trade having grown in the previous years. Its share of world exports has remained low, stagnant and heavily skewed towards primary goods, despite signing many trade agreements, including the African Growth and Opportunities Act (AGOA) with the United States, Economic Partnership Agreements (EPAs) with the European Union and various trade-investment agreements with China. In 2023, its exports represented only 2.2% of world exports.
This is the story for most African countries. With few exceptions Africa is failing to add value to its primary or commodity goods. For example, countries like Ghana and Côte d'Ivoire produce about 53% of the world’s cocoa. Yet, shops in these countries are stacked with chocolate imports from Switzerland and the UK. The continent’s participation in global value chains (GVCs) is hampered by high dependence on primary exports. Primary goods are characterised by volatile prices and lack both technological dynamism and local economic linkages; hence, over-dependence on primary goods translates into slow growth.
The forecast in Chart 1 indicates that the trade and GDP per capita between Africa and other world regions will continue to widen. In the Current Path (or business-as-usual scenario), Africa’s total exports are forecasted to account for just about 3.5% of world exports by 2043, while the continent’s GDP per capita will increase to US$6 197, a 29.3% increase (equivalent to US$1 403) compared to 2023. With the full implementation of the AfCFTA agreement, the continent’s total exports will increase to 4.4% of the world's total exports by 2043, and the GDP per capita will increase to US$6 602, a 6.5% increase relative to the Current Path forecast in the same year.
The full implementation of the AfCFTA agreement would assist African countries in diversifying their export markets to other world regions. Amongst others, because Africa relies heavily on fossil fuels for its production and distribution the AfCFTA would reduce exposure to the European Union (EU) Carbon Border Adjustment Mechanism (CBAM) that take full effect in January 2026. Under the CBAM, the European Union will require importers of certain carbon-intensive goods to pay for their products’ embodied carbon emissions. The policy could have a significant impact on the competitiveness of African countries that export these goods to the EU.
For the last half-century, regional or preferential trade agreements (RTAs or PTAs) have been a major and recurring means of eliminating trade barriers for almost all World Trade Organization (WTO) members and through which to advance trade. The attraction of RTAs is reflected in the steady increase in the share of global trade covered under them. The AfCFTA reflects this trend, which is the world’s largest free trade area in terms of membership as it brings together 55 African countries and eight regional economic communities (RECs).
Promoting a free trade area such as the AfCFTA will help African countries implement domestic reforms and open their economies up to competitive market pressures at a sustainable pace, thus facilitating their economic integration into the world economy. It would also benefit the multilateral process by promoting trade openness and competitive liberalisation of international trade relations.
Economic welfare gains from a PTA follows a simply dynamic in that resources flowing to their most productive uses and lower consumer prices. However, creating such an arrangement does not necessarily guarantee the improvement of member states’ welfare, as it may come at a cost. The preferential removal of tariffs may lead to trade diversion, where imports shift away from the most efficient supplier to the country receiving preferential treatment. Such diversion can generate an inefficiency in production, leading to welfare losses for member and non-member countries. It can harm member states if the changes in consumer welfare gains are too small to outweigh the cost of inefficient production. In contrast, trade welfare gains are achieved when a RTA shifts production from inefficient domestic providers to efficient RTA members through a process known as trade creation.
Trade in Africa is complex and expensive due to high tariff rates and significant non-tariff barriers (i.e. poor customs procedures, bad transport and logistics systems and infrastructure). This hinders trade flows across borders and often also contributes to smuggling and the growth of the shadow economy if borders are not well policed. Vast amounts of money can be made smuggling items such as petroleum and cigarettes where prices differ substantially between countries.
This is particularly characteristic of economies in North Africa, but evident across the continent.
A 2019 report by the IMF lists the manifold economic benefits that would flow from regional integration in the Maghreb, including attracting FDI, easing the movement of capital and labour, more efficient resource allocation and the extent to which regional trade would make Africa more resilient to external shocks and market volatility. Countries could, on average, add one percentage point to growth rates with regional trade integration. However, instead of increasing, trade openness has steadily declined in every country in the region (except for Morocco) and traders face significant hurdles, particularly in cross-border trade.
In addition to the various structural reasons for Africa’s poor growth, such as a declining demographic dividend until the late 1980s, its function as a proxy battleground during the Cold War, bad governance, poor policy and lack of implementation of agreements all played an important role. Structurally, the continent did not develop regional value chains and hence did not form part of the global value chains in goods and services that developed between parts of Asia, North America and Europe since the 1990s.
Africa's lack of regional integration is a significant obstacle to economic diversification and growth.
Africa is essentially not part of the global discussions on trade. Outside of Africa, economists use the lens of regional and global value chains — the complex network that ties the flows of goods, services, capital and technology together across national borders — to evaluate the strength and potential of economies. Instead, Africa is generally fixated on the growth and structural change in individual economies, even as the debate moves on.
Evident for several years, goods-producing value chains are becoming more regionally concentrated, especially within Asia and Europe. Goods-producing value chains are also becoming less trade-intensive even as trade in cross-border services is growing more rapidly than merchandised trade. In response to global tensions and concerns around carbon emissions associated with long transport routes, companies are increasingly locating their production facilities in closer proximity to the market rather than closer to cheap labour.
The general trend towards regional instead of global value chains is intensifying with the assault of the second Trump presidency on multilateralism and trade. Trade integration in Asia is gaining momentum as Western countries step away from their previous heavy reliance on China, and Europe reduces its dependence on oil and gas from Russia. This could offer advantages to Africa with its rapidly growing population and growing consumer base.
Africa’s lack of connecting infrastructure, such as bad roads and limited railways between neighbouring countries, increases transport costs and creates delays. Poor infrastructure and bad maintenance reduce the competitiveness of businesses and undermine much-needed investment flows. In some East African countries transport costs are estimated to be about five times more than in Europe and North America even as neighbours exploit opportunities with their landlocked neighbours - which is a long list of countries including Ethiopia, Uganda, Rwanda, Burundi, Lesotho, Eswatini, Zimbabwe, Malawi, Uganda, Burundi, Rwanda and South Sudan.
For example, Africa has an average of 204 km of roads per 1 000 km², of which only one-quarter is paved. This average lags far behind the world average of 944 km of roads per 1 000 km², of which more than half is paved. Most of the continent’s paved roads can also be found in a single country — South Africa — where they are seriously degrading due to corruption and lack of maintenance.
According to the African Development Bank, Africa has an annual infrastructure funding gap of US$130 to US$170 billion, with an annual financing gap of US$68 to US$108 billion.
Poor investment in infrastructure is compounded by a lack of real commitment to regionalism. The Yamoussoukro Declaration of 1988 and the subsequent Yamoussoukro Decision of 1999, both named after the city in Cote d’Ivoire where the agreement was signed, commit their 44 signatory countries to deregulate air services and promote regional air markets open to transnational competition. Although the Yamoussoukro Decision became binding in 2002, it was largely ignored. Eventually, in 2018, 23 countries created the Single African Air Transport Market (SAATM) to allow for the full liberalisation of African air travel and a true open-skies agreement. But progress remains painfully slow.
In 2015, the International Air Transport Association (IATA) estimated that cross-border deregulation among just 12 African countries would create 5 million new passengers, US$1.3 billion in annual GDP growth and 155 000 jobs. Instead, Africa’s aviation sector remains constrained by excessive bureaucracy, high costs and a lack of an accommodating regulatory environment. Instead of facilitating business and tourism, access by air is a constraint, as countries restrict access to their skies to protect the share held by inefficient state-owned air carriers — with the lone exception of the thriving Ethiopian Airlines. Most African countries remain wedded to the notion that a national air carrier, owned by the government, is a non-negotiable signpost of national sovereignty instead of looking to the most cost-efficient way to connect.
Recent progress in building and financing infrastructure was largely spurred by the excess capacity that became available from China some years ago as its economy restructured towards domestic consumption. In the process, China effectively used its large fiscal surplus to export its spare infrastructure-building capacity, which was eventually packaged as the Belt and Road Initiative. The theme on infrastructure presents some of the associated challenges.
In addition to Africa’s infrastructure deficit, non-tariff barriers are a notable constraint to trade in Africa and African trade with the rest of the world. Non-tariff barriers include onerous regulatory procedures, expensive visa requirements, corruption and inefficiency. They include import prohibitions, quotas, export subsidies, export restrictions, technical barriers to trade (such as regulations, standards and assessment procedures) and rules about food safety and animal and plant health standards.
At the Beitbridge border post between South Africa and Zimbabwe, for example, it took a truck an average of 35 hours to clear the border. In response, the South African cabinet adopted a One-Stop Border Framework in 2018, with the first phase of improvements launched in 2021. The result is a noticeable improvement in clearance efficiency, with average processing times having dropped under two hours for compliant trucks.
Significant progress has also been made in East Africa, where border crossing times have reduced from several days to about three to six hours as part of the reforms associated with the East African Community (EAC) — a demonstration of potential progress possible elsewhere.
The World Bank's Ease of Doing Business Index for 2020 (the last year before it was discontinued) includes only nine African countries in the top 100. The COMESA-EAC-SADC Tripartite Free Trade Area website lists examples of 25 non-tariff barriers to trade, which range from import bans and product classification to corruption. However, progress in eliminating these barriers is slow, as each non-tariff barrier reflects a vested interest or a local practice along a border region, sometimes spanning several generations, on which the livelihoods of communities may depend.
With the benefits of regional trade and globalisation in mind, the African Union (AU) announced its intention to embark on the African Continental Free Trade Area (AfCFTA) in 2012. Following a series of continuous engagements between the AU Commission and member states from 2012 to 2018, the AfCFTA agreement was opened for signature on March 21, 2018. After 24 of the 55 AU member states ratified, the AfCFTA came into force on May 30, 2019.
The AfCFTA is a free trade agreement treaty that regulates cross-border trade between African countries, building a single market for goods and services of nearly 1.5 billion people and a combined GDP of around US$2.7 trillion (2023) across Africa. It will be the biggest trade agreement since the establishment of the World Trade Organisation (WTO) in 1995, if fully implemented. Unlike traditional trade agreements which cover trade in goods only, the AfCFTA agreement covers a range of additional trade-related disciplines such as trade in services, dispute settlement, investment, intellectual property rights, competition policy and electronic commerce among others.
The AfCFTA secretariat, an autonomous body within the AU is responsible for coordinating the implementation of this trade agreement. It is one of the AU’s flagship projects in alignment with its Agenda 2063, which aspires to achieve “the Africa we want” and part of its plan to accelarate Africa's development.
The AfCFTA aims to utilise trade policies, including the creation of a single continental market and promote industrial development, as an engine of growth and sustainable development, through the elimination of tariff and non-tariff barriers trade, starting with the removal of tariffs on 90% of goods. The power of removing non-tariff barriers was illustrated by a study from the Trade and Law Centre (tralac), which found that reducing the time it takes to move goods across borders by just 20% would be more economically advantageous for Africa than removing all import tariffs.
The AfCFTA aims to create opportunities for the development of regional value chains and increase the continent’s competitiveness in global value chains, thereby expanding both Africa’s intra- and extra-trade. So, the AfCFTA agreement is not just about the exchange of goods and services; it is a roadmap for Africa's development and once attained would represent a milestone in reducing poverty in Africa.
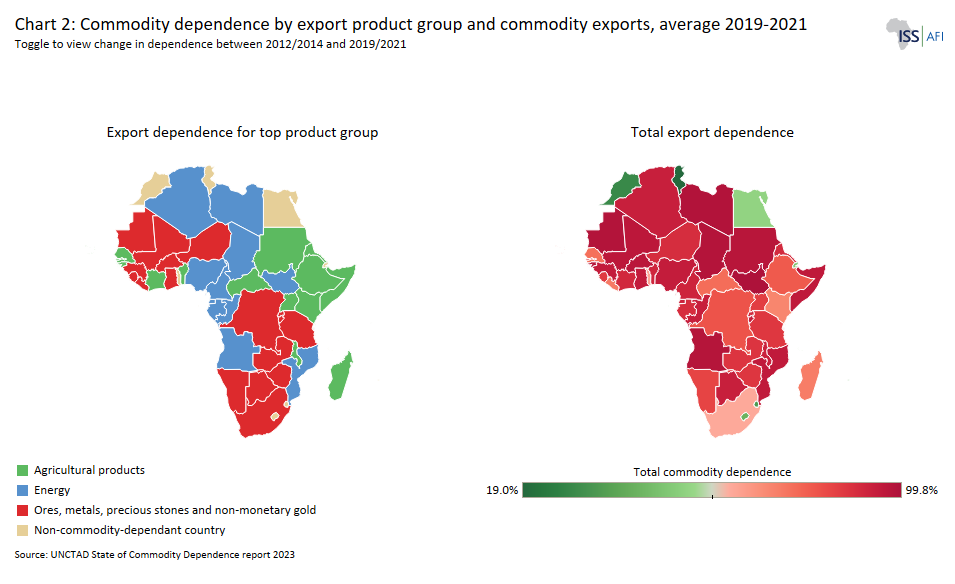
Africa is still struggling to detach itself from its colonial past characterised by the exportation of homogeneous goods (i.e. primary/commodity goods), and the importation of heterogeneous goods (i.e. machinery and equipment), (see Charts 2 and 3). During colonialism, African trade was structured to meet the demands of industrialising Europe by supplying primary inputs with subsequent growth-constraining effects. Countries that heavily depend on primary exports tend to experience lower and more unstable economic growth than those that mostly export manufactured goods. Primary goods lack both economic and technological dynamism and are subject to volatile global prices.
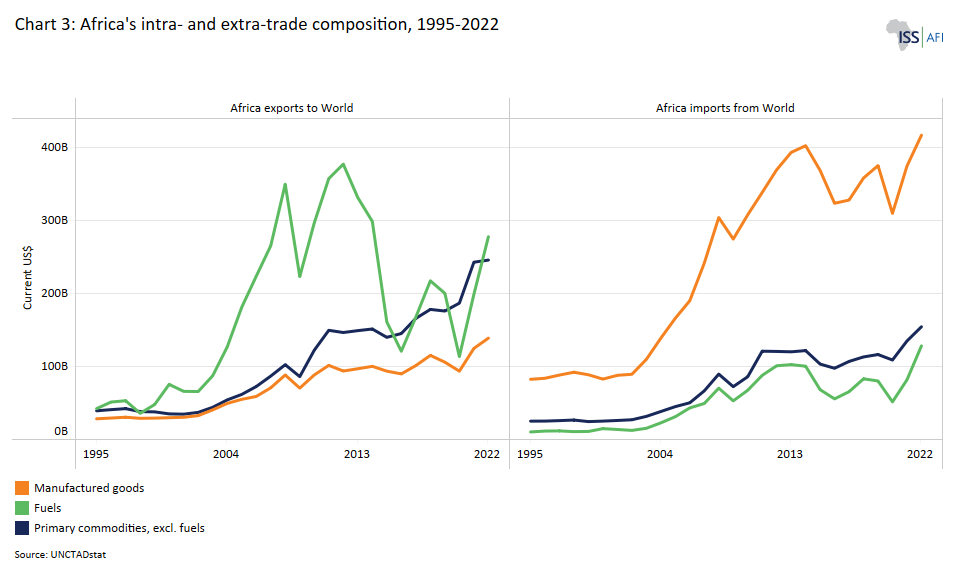
Africa’s limited manufactured exports are centred around resource-based goods, which are also subject to volatile global prices. The overreliance on a narrow range of primary and resource-based products has, over time, made the continent vulnerable to external demand and supply fluctuations with enormous implications for development and poverty reduction efforts. Chart 3 shows Africa’s intra- and extra-trade composition for the period 1995-2022.
Today Africa trades significantly more with the rest of the world than internally, and its participation in global trade has remained low and stagnant even as its share of world exports has steadily declined. Africa’s global share of exports accounted for just 2.2% of exports in 2023 — a 0.4 percentage point decline relative to a decade earlier. Its global import share has also remained marginal, increasing from 2.8% in 2003 to 3.3% in 2013, to 2.7% in 2023.
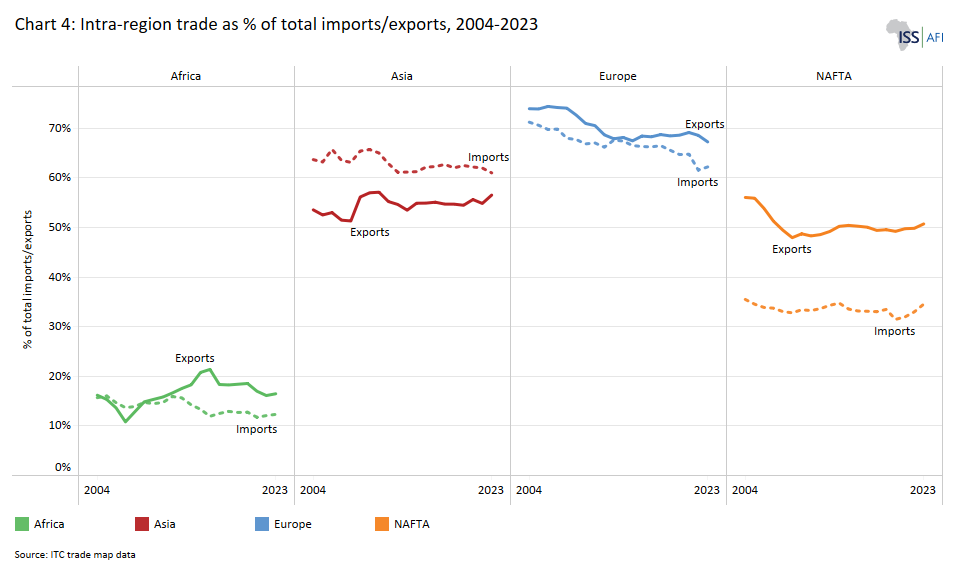
Chart 4 shows Africa’s share of intra-export compared to the share of other world regions. A paltry 14.8% of Africa’s trade is internal, compared to 54.5% for Asia and 68.4% for Europe in 2021. The continent heavily relies on external markets for both its exports and imports. For Africa, the full implementation of the AfCFTA will therefore be crucial to limit the impact of the current trend towards deglobalisation.
Until recently, the continent has done little to increase trade among its members. Most internal trade has been in the Southern African Development Community (SADC) and the East African Community (EAC), which have the highest levels of internal trade among regional groups. Unlike in Asia, Europe and North America, Africa does not have a single hub economy. Apart from South Africa, which operates somewhat as a trading hub for Southern Africa, the continent lacks a systemic global exporter that imports value-added from within Africa. Nigeria and Egypt, the other two large economies have clear potential in this regard.
However, once informal intra-African trade is included, the share of internal trade in Africa is likely significantly larger than shown in official trade data. For instance, in a 2019 study by UNCTAD, informal trade at a single border crossing between Zambia and Malawi was estimated at US$2.9 million per month, while formal trade at the same border crossing accounted for only about US$1.6 million per month.
A survey on smuggling between Benin and its neighbouring countries concluded that there were five times more smuggled goods from Benin to Nigeria than officially recorded exports. Similarly, a 2010 study by the African Resource Centre estimated the value of informal exports from Uganda to its neighbouring countries to be about 83% larger than the official export data. Thus, if formal and informal trade data were to be added together, the share of intra-Africa trade would double or even triple compared to most published estimates.
The main cause of informal intra-Africa trade is the cost associated with formal trade. Monetary costs of formal trade include high tariffs on imports and exports, accompanied by high processing and clearance fees. Time costs include long waiting periods and inadequate border infrastructure that cause long delays at formal crossings.
The AfCFTA would decrease the cost of trade and encourage the formalisation of trade. For instance, with the AfCFTA agreement, to help overcome non-tariff barriers, an online portal has been set up through which traders can report problems. Non-tariff barrier challenges and problems are to be handled by nominated government officials who are meant to take action to remove the barriers.
By fostering intra-African trade and regional value chains, the AfCFTA is a critical driver in the structural transformation and industrialisation of Africa, with the potential to help reduce the continent’s vulnerability to external shocks, enhance export diversification and boost economic performance. With the regional value chains that are being developed under the AfCFTA, member states have the opportunity to also boost global competitiveness, pursue export diversification and increase exports of high-value-added manufactured goods. This has the advantage of helping African countries lower imports and dependency on goods that could be produced and traded within the continent with an important knock-on effect on the balance-of-trade of countries.
The AfCFTA agreement prioritises industrialisation of the agri-business, automotive, pharmaceuticals, transport, and logistics sectors based on the potential for import substitution and existing production capacities on the continent. These sectors have a higher potential for boosting local value addition, job creation and economic growth, with positive implications for poverty reduction.
The AfCFTA agreement expects participating member states to progressively eliminate restrictive measures hindering cross-border supply, consumption abroad, commercial presence, and temporary movement of persons. Member states agreed to start with five priority service sectors: business, communication, financial, transport and tourism services. Some of the service sectors to be liberalised later include construction and related engineering, distribution, educational, environmental, health-related and social services.
The eight Regional Economic Communities (RECs) and their bilateral and multilateral trade agreements recognised by the AU will continue to exist under the AfCFTA agreement. The agreement will provide an Africa-wide regulatory framework to harmonise intra-trade. What makes the AfCFTA stand out from the existing RECs is the extent of political will, the geographical and policy coverage, and the articulation of existing RECs under a single legal umbrella with a dispute settlement mechanism to ensure compliance and enforcement of commitments undertaken.
With these priorities and associated benefits, the AfCFTA presents a unique opportunity for Africa to realise its long-held vision of an integrated, continent-wide market. If successfully implemented it will transform African economies and significantly raise Africa’s share of global trade to position the region as a dynamic force in the international arena.
The AfCFTA agreement came into effect in January 2021, nine years after the idea was proposed by the AU. Only Eritrea has not signed the agreement, shunning it in favour of its membership of COMESA and IGAD. By January 2024, 47 out of 55 countries have ratified, except for Benin, Liberia, Libya, Madagascar, Somalia, South Sudan and Sudan.
Negotiations are inevitably complex and divided into three phases with a large body of associated legal text:
- Phase 1 negotiations: cover trade in goods and services, based on reciprocal concessions and subsequent agreements between state parties. The negotiations led to the ratification of the legal instruments (the AfCFTA agreement itself and protocols on trade in goods and services and settlement of disputes) that came into force end of May 2019, permitting the launch of trading.
- Phase 2 negotiations: cover intellectual property rights, investment and competition policy. Negotiations have already begun.
- Phase 3 negotiations: cover e-commerce and women, and youth in trade. Draft protocols were adopted by the AU Assembly in February 2024, including a Protocol on Digital Trade that aims to harmonise rules and standards, including electronic commerce, cross-border data flows, data protection, cybersecurity, digital payments, digital identities, electronic contracts/invoicing, digital infrastructure, etc. Eight annexes to the Protocol were subsequently adopted by the African Union Assembly in February 2025 to include these matters.
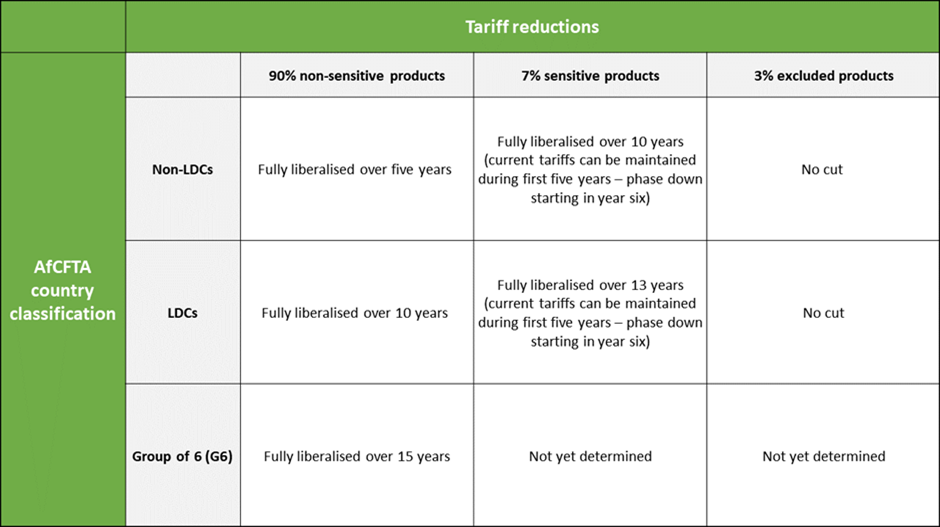
Each phase is captured in a legally binding protocol that forms part of the AfCFTA Agreement on adoption. The plan is that, by 2034, Africa will have achieved tariff liberalisation of 97% of goods in a staged manner. In Phase I, member states agreed to remove 90% of tariff lines, translating into full liberalised with zero tariff rates. The remaining 10% of tariff lines are divided into two categories: 7% are designated sensitive products, and they will have a 10% tariff rate, and 3% of tariff lines are excluded from liberalisation entirely - to allow flexibilities for State Parties with particular sensitivities, but will be subject to review every five years.
A ' pilot phase’ of the AfCFTA was launched in October 2022 in the form of the Guided Trade Initiative (GTI), originally involving seven State Parties representing the five regions of the continent and subsequently expanded. The objectives of the GTI are to test the operational, institutional, legal and trade policy environment under the AfCFTA; allow commercially meaningful trading under the AfCFTA; and send a positive message to African economic operators about the AfCFTA. State Parties that have had their Provisional Schedules of Tariff Concessions verified may join the GTI, subject to their rules of origin for the intended products being finalised.
By January 2024, 44 countries had ratified the associated Pan African Payment and Settlement System (PAPSS), which aims to reduce trade costs and accelerate the continent's economic integration. PAPSS enables companies to conduct transactions using any of Africa’s 42 currencies without requiring a third-party currency, such as the US dollar or the Euro. South Africa is one of the countries that has not yet ratified the payment system due to reservations regarding trade-payment risks, regulatory alignment, and currency stability concerns. South Africa has more than 80% of the manufactured goods trade in Africa.
Only 34 countries signed the AU Protocol of Free Movement of Persons, and it was ratified by just four countries (Rwanda, Niger, Mali, and São Tomé and Príncipe). The slow pace of ratification is of great concern as the free movement of persons is crucial for the successful implementation of the AfCFTA, particularly for facilitating trade in services across the continent.
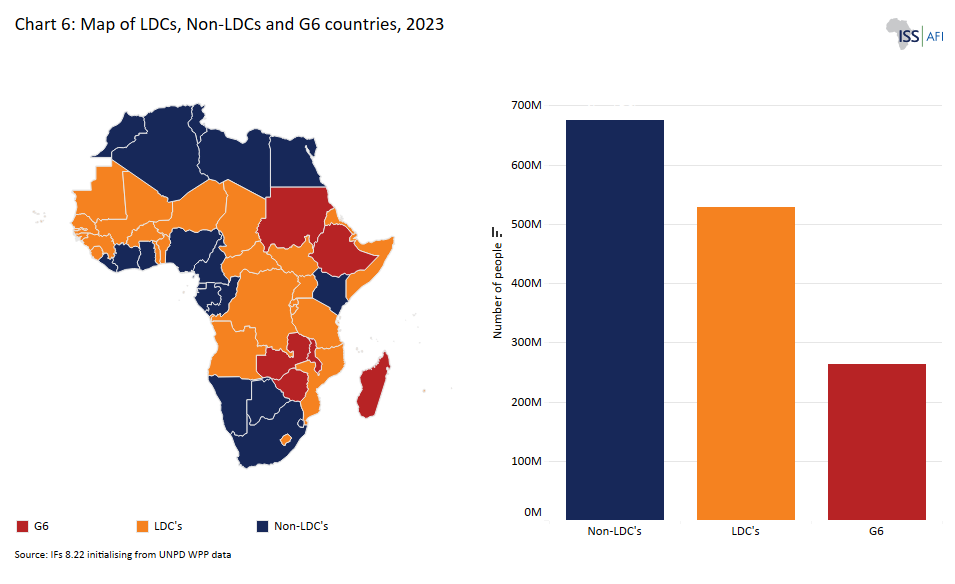
African countries vary in size, level of development and diversification of economic activities. As of 2022, for instance, Comoros, Cabo Verde, Sao Tome and Principe and Seychelles had populations of less than a million while Nigeria, Ethiopia and Egypt had populations of over 100 million. Similarly, the continent includes member states with larger income disparity than in blocs such as the Association of Southeast Asian Nations (ASEAN) and the Caribbean Community (CARICOM). For example, Nigeria, South Africa and Egypt boast GDPs of over US$300 billion, while Gambia, South Sudan, Seychelles, Guinea Bissau, Comoros and Sao Tome and Principe have less than US$2 billion.
The experience elsewhere, particularly in Europe, suggests that the inclusion of member states at different levels of development tends to benefit the more advanced members, while the weaker ones fall further behind in the short to medium term. Like any other free trade agreement, therefore, the implementation of the AfCFTA does not necessarily guarantee the immediate improvement of all member states’ welfare, as it may initially come at a cost to some member states. The AfCFTA could, for example, bring additional competition to domestic markets, leading to firm closures and possibly higher unemployment rates as initial investments shift towards more competitive economies. This is particularly true for the 33 least developed countries (LDCs) that are part of the negotiations towards the AfCFTA. Thus, the agreement will bring together unequal economies with varying production capacities. Chart 6 below shows a map of African countries' income/group classifications under the AfCFTA agreement and the population size of each group as of 2023.
The 33 LDCs negotiating the agreement are small in scale, remote and have low productivity levels. They have weak domestic production capacities relative to firms in non-LDCs and often incur structural disadvantages related to natural endowments and geographic location. For example, 14 of the 33 LDCs are landlocked meaning they are dependent upon their neighbours for access to more distant markets. Furthermore, trade reforms in Africa’s LDCs are associated with the relatively slow implementation of regional agreements due to poor or weak institutional capacities. Thus, the AfCFTA will most likely create winners and losers across countries and sectors. These experiences make the heterogeneity of African countries a major hindrance to engagement and cooperation in implementing the AfCFTA.
Like any FTA or RTA, the implementation of the AfCFTA could also be accompanied by substantial costs during the initial years, particularly for the LDCs. As tariff revenues are reduced, industrial sectors are disarranged, value chains are re-organised and employment is dislocated. These costs include revenue losses, higher income inequality and higher unemployment, particularly if trade openness is not accompanied by the required measures to enable employees to grasp new opportunities emerging elsewhere.
It is for these considerations that Eritrea has not yet signed the AfCFTA agreement. Neither are all member states committed to the free movement of labour. As of January 2023, only Rwanda, Niger, Sao Tome and Principe, and Mali had ratified the AfCFTA Protocol on the free movement of people.
Tariff concessions is a sensitive issue for some of the member states due to the fact that trade tariff revenue remains a significant source of revenue for most African economies, and will decline with AfCFTA. For instance, countries like Central Africa Republic, Chad, Comoros and DR Congo are estimated to depend on intra-continent tariff revenues for more than 5% of their government revenues. As of January 2023, therefore, only 45 African countries had submitted Provisional Schedules of Tariff Concessions (PSTCs). Several, including Djibouti, Libya, Mozambique, Somalia, the Saharawi Republic, and Sudan, are still to submit their tariff offers.
All African states face challenges of creating jobs, developing their industrial sectors and diversifying t heir production capacity. Agreeing on tariff liberalisation schedules considering such large differences will require steadfast respect for special and differential treatment by all concerned. Due to the countries’ different levels of development, differential treatment for the LDCs and the non-LDCs was granted in the AfCFTA tariff negotiations, explained below.
However, the AU Secretariat should provide additional support and assistance to the LDCs beyond tariff differential timelines. This means that the AU cannot bridge the gap alone. Private equity, debt finance, and local and regional banks must all play a part. A special group of countries, the so-called Group of 6 (G6) (Ethiopia, Madagascar, Malawi, Sudan, Zambia and Zimbabwe), also argue that they face specific development challenges and require differential treatment. As a result, while the LDCs have 10 years to fully liberalise 90% of the non-sensitive products, and the non-LDCs have five years, the G6 has secured a 15-year phase-out period. The LDCs have 13 years to eliminate tariffs on sensitive products and may retain the status quo, starting liberalisation in year six, whereas the non-LDCs have the tariffs in 10 years and also maintain the status quo, starting liberalisation in year six. Both the LDCs and the non-LDCs may exclude 3% of tariff lines, but the excluded products may not account for more than 10% of their total trade value (see Chart 7).
Given the context described in the preceding sections, much hope has been placed in the AfCFTA as a vehicle to boost trade and assist in the transformation of African economies towards the production of higher-value goods and services. It is expected to increase both international exports and intra-Africa trade, unlocking greater opportunities for local and global businesses to enter into and expand throughout new markets across the continent. An annexure lists the estimations and calculations on the potential impact of the AfCFTA from the African Development Bank, the African Export-Import Bank, the UN Conference on Trade and Development (UNCTAD) and others.
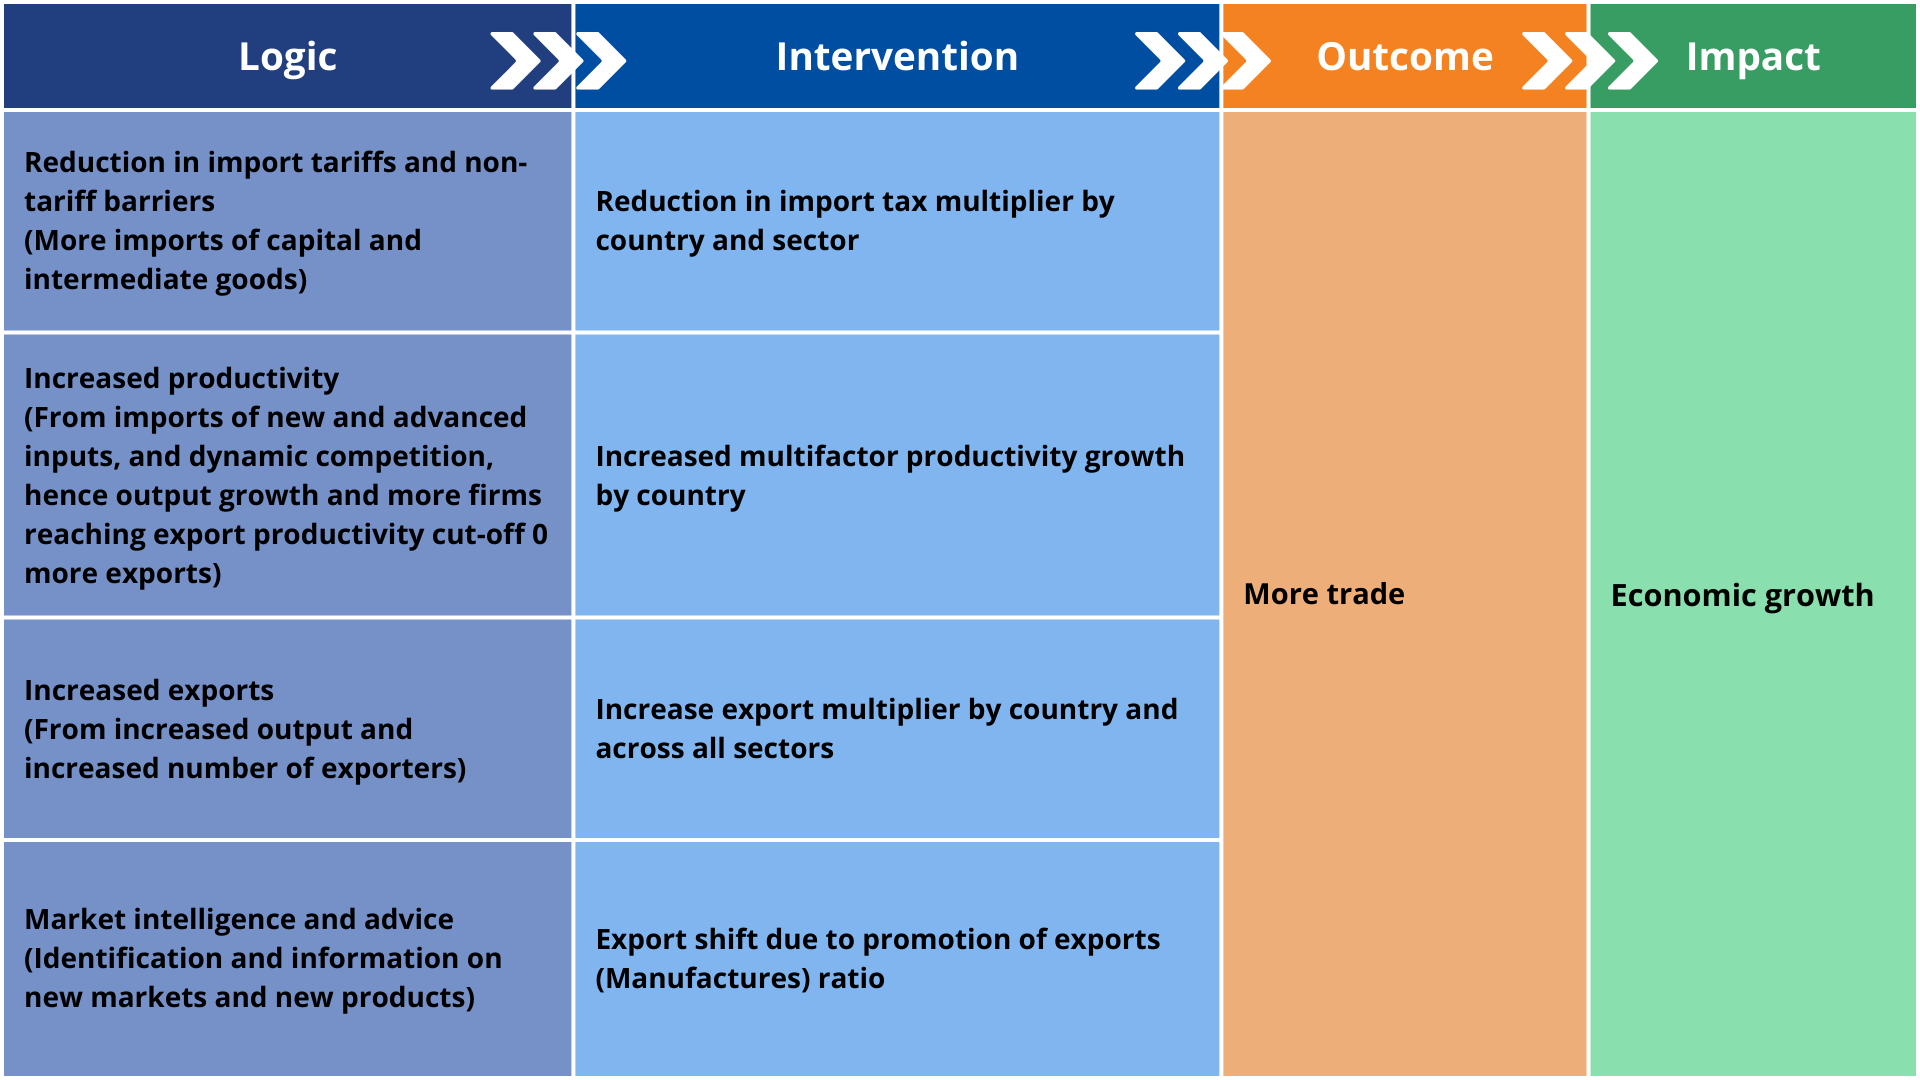
The AfCFTA scenario schematically presented in Chart 8 uses the International Futures (IFs) forecasting platform to model the associated impact. Modelling trade in our model presents a number of challenges. The most important is that this version of IFs uses a pooled model for trade, meaning that countries each trade with a pool that reflects the rest of the world and not directly with one another. Drawing on academic literature, we rely on various proxies to emulate the impact of expanding trade in Africa, as presented in Chart 8 below.
The interventions are done at the individual country level, and we calibrate the combined impact in accordance with the lower end of the modelling in the trade literature. Collectively, four interventions are used for each country, namely a reduction in import tax, an increase in multifactor productivity, an increase in exports and an export shift based on export promotion. The scenario simulates the impact of the full implementation of the AfCFTA, if imperfectly so.
The AfCFTA scenario assumes that the implementation of the AfCFTA starts earliest in 2026 and that tariffs are reduced over the subsequent agreed time periods for the Least Developed Countries (LDCs), the non-LDCs and the G6 countries, in line with current expectations. Since the time period for eliminating the tariffs under the sensitive and excluded products is not yet determined, we apply the same timeframe as for their non-sensitive products. The G6 countries are Ethiopia, Madagascar, Malawi, Sudan, Zambia, and Zimbabwe, which have negotiated a longer 15-year phase-out period for tariff liberalisation compared to the standard timelines for LDCs.
The scenario is an exceptionally optimistic forecast for an agreement as complex and politically fraught as the AfCFTA. However, if leaders manage to stick to their commitments and take African citizens, businesses, labour and other stakeholders along with them, the impact will be substantial.
Impact of the AfCFTA scenario
Download to pdf- Impact of the AfCFTA scenario on economic size, income, extreme poverty and growth
- Impact of the AfCFTA scenario on economic sectors
- Impact of the AfCFTA scenario on trade values
- Impact of the AfCFTA scenario on exports and imports at country level
- Impact of the AfCFTA scenario on carbon emissions
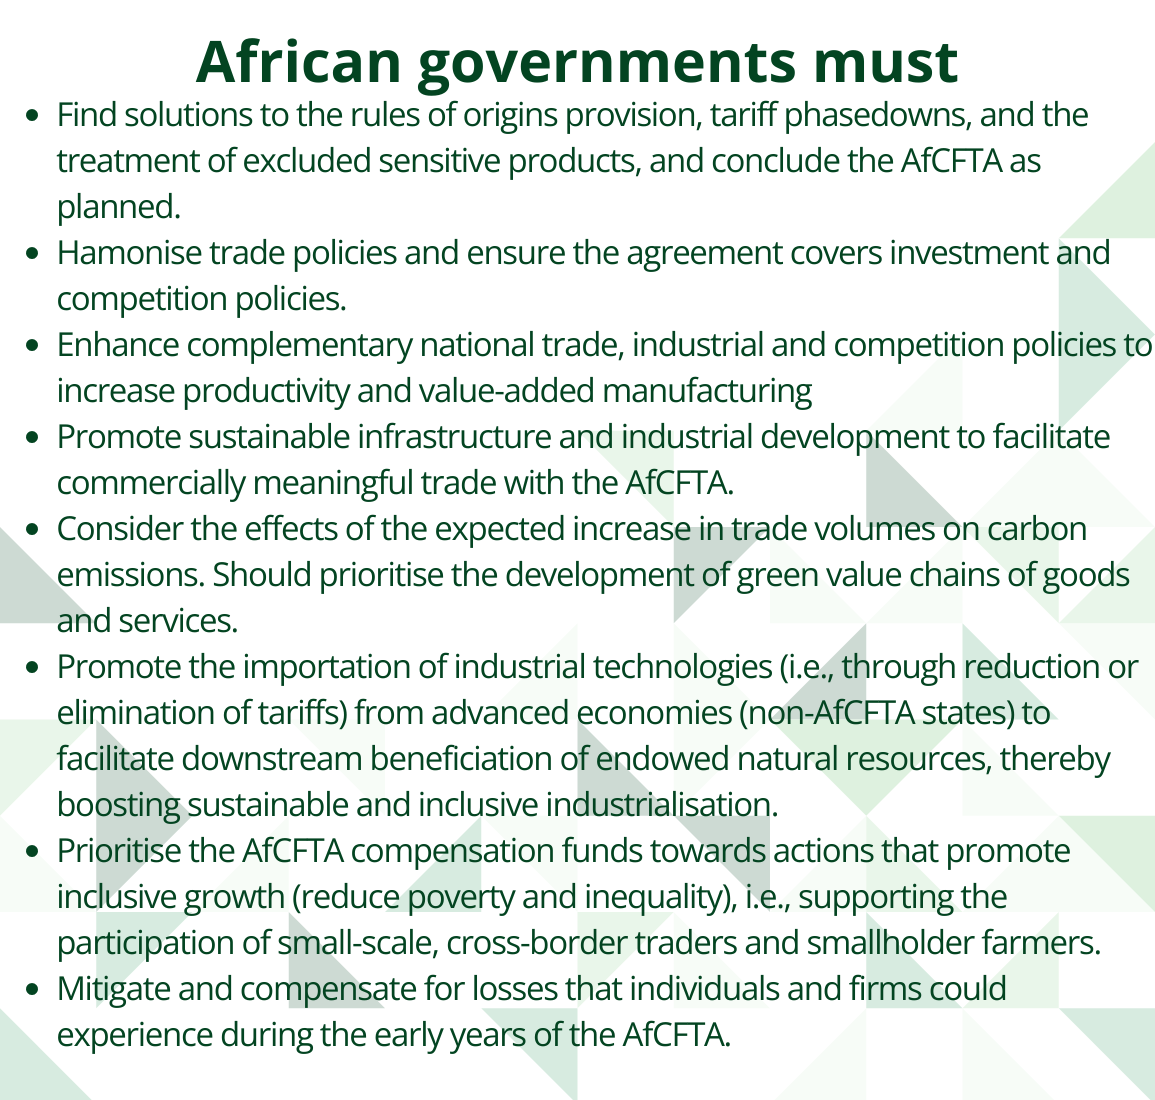
The successful implementation of the AfCFTA will have multiple positive spillover effects across various economic growth and development indicators. To reap the full potential gains from the AfCFTA, member states should conclude the agreement as envisioned and ensure it covers investment and competition policies and harmonises trade policies at the country, regional and continental levels.
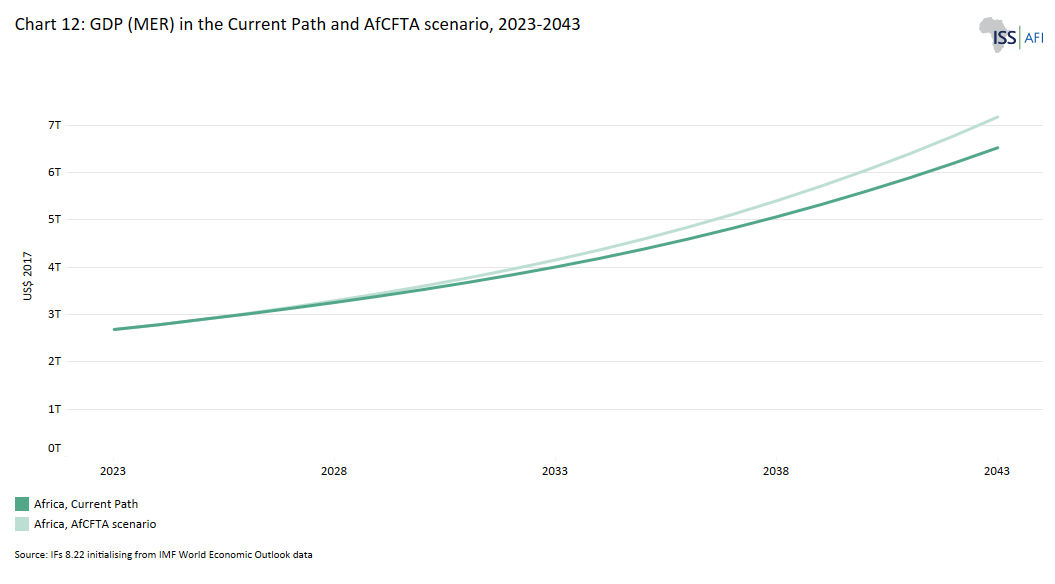
In 2023, the size of Africa’s economy measured in GDP at the market exchange rate (MER) was estimated at about US$2.7 trillion; by 2043, in the Current Path, it is forecast to reach about US$6.5 trillion, a 143% increase between 2023 and 2043. Following the implementation of the AfCFTA agreement, the size of Africa’s economy will be 10% (equivalent to US$650 billion) larger than the Current Path in 2043.
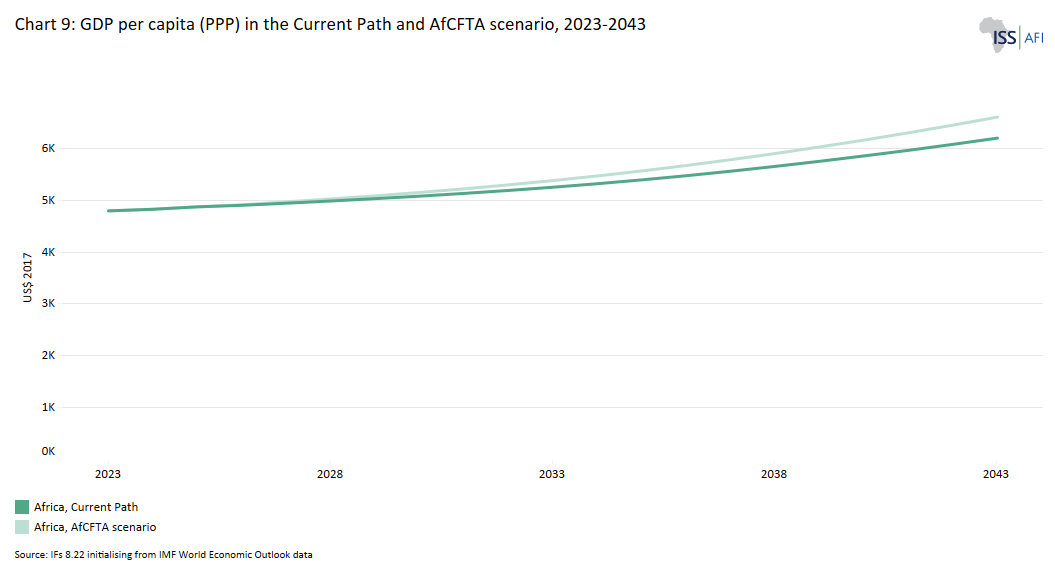
The GDP per capita at the purchasing power parity (PPP) will be US$6 602, which will be US$406 larger than what it would be on the Current Path for a continent that would then be home to nearly 2.3 billion people in 2043 (see Chart 9). Higher living standards reduce fertility and maternal mortality rates and the result is a population size that is about 0.1 smaller compared to the Current Path, equivalent to three million fewer people. However, with the full implementation of the AfCFTA agreement, Africa’s GDP per capita will remain far below the global GDP per capita average of US$22 310 by 2043.
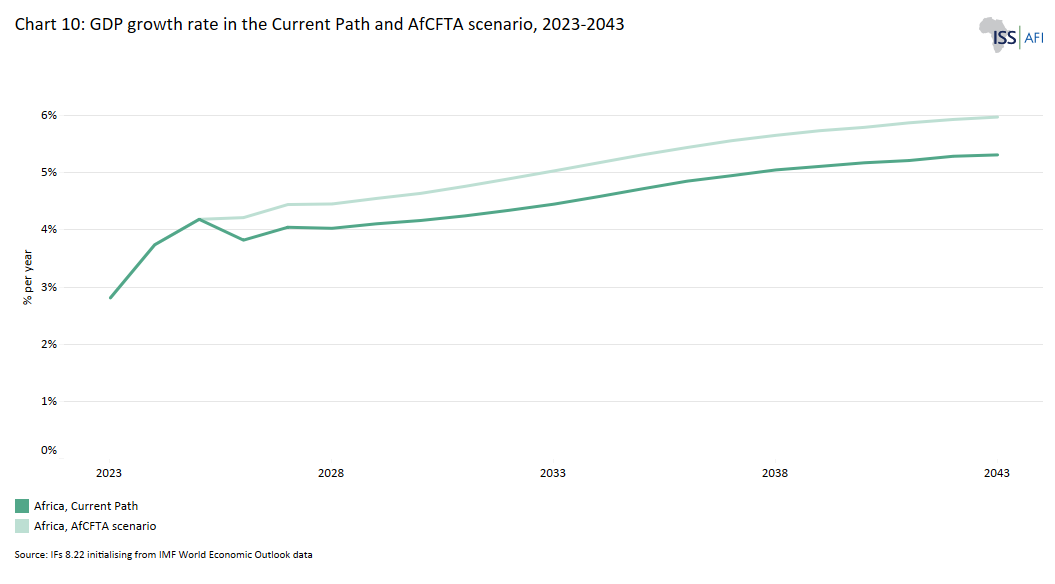
Following implementation, Africa’s economy will be steaming ahead at about 5.3% rate of economic growth in 2035, which is around 0.6 percentage points above the Current Path (see Chart 10). By 2043, Africa’s economy will grow by 6% compared to 5.3% on the Current Path over the same period. Across the entire forecast horizon, from 2026 to 2043, the average economic growth rate for Africa would be about 0.6 percentage points above the Current Path. The user can view the GDP growth impact for each country using the drop-down menu.
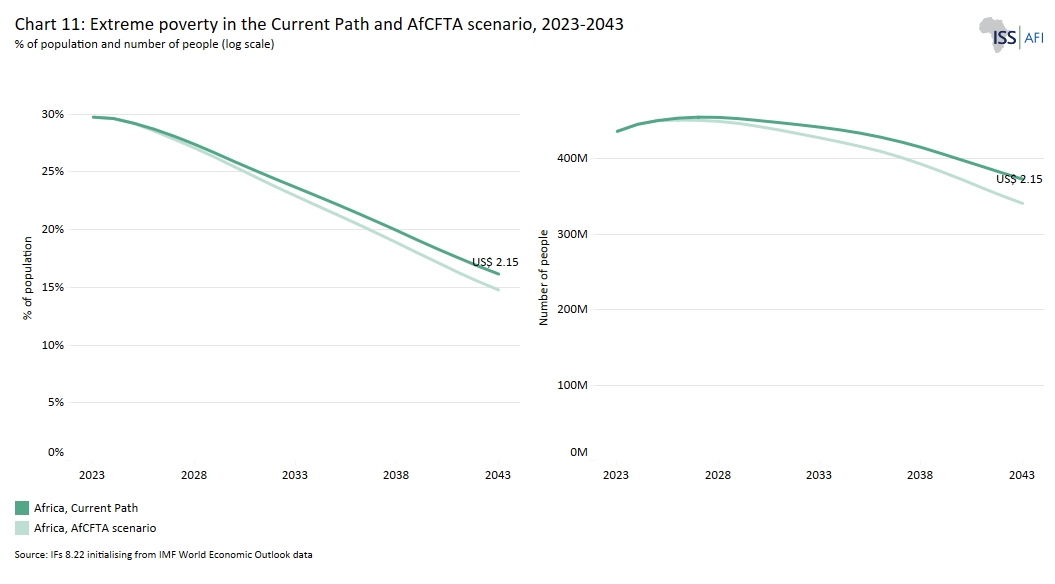
Chart 11 shows the scenario's impact on poverty compared to the Current Path. The result of the full implementation of the AfCFTA is that the African economy will be nearly US$650 billion (at market exchange rates), or about 10%, larger in 2043 than it would be on the Current Path. This growth translates into 32.1 million fewer people living in extreme poverty, i.e. living on less than US$2.15 per day in 2043. However, the initial impact of the AfCFTA is to increase extreme poverty, especially in low-income countries and countries with high income inequality as scarce resources are used towards capital-intensive projects that advantage higher skilled labour. The user can view the poverty trend for individual African countries using the drop-down menu and toggle to switch between absolute values and percentage changes in comparing the Current Path with the AfCFTA scenario.
If the AfCFTA is fully implemented, Nigeria, DR Congo, Sudan, South Sudan and Tanzania will have the largest number of people lifted out of extreme poverty (at US$2.15 per day) relative to the Current Path in 2043, given the fact that the first two have the largest number of poor people in Africa. About 5.9 million Nigerians will be lifted out of extreme poverty in 2043, which is 1.5 percentage points lower relative to the Current Path. DR Congo is projected to have about 4.2 million fewer poor people relative to the Current Path, which will be 2.2 percentage points below the Current Path.
Disaggregating the data by country reveals the heterogeneity of the impact of the AfCFTA scenario across countries. The income gain from the AfCFTA scenario is mainly driven by income gains from Nigeria, South Africa, Egypt, Kenya and Angola.
Nigeria’s GDP would increase by about 8.4% (equivalent to US$78.1 billion) relative to the Current Path in 2043. The size of South Africa’s and Egypt’s economies will be about 11.6% and 5.7% larger (equivalent to US$76.3 billion and US$48.2 billion) than the Current Path in 2043, respectively — these are, of course, also Africa’s largest economies.
At the low end, several smaller economies would see income gains of less than US$1 billion relative to the Current Path. These include Burundi, South Sudan, Liberia, Cabo Verde, Lesotho, Eritrea, Central African Republic, Gambia, Seychelles, Comoros, Guinea Bissau, and Sao Tome and Principe. However, when considering the per cent increase in the size of the economy by 2043, Rwanda, Somalia, Angola, Eswatini and Chad gain the most (a more than 15% increase in the size of their economies), while the size of the economies of Malawi and Mali increase by less than 5%.
Chart 12 depicts the income gains from the AfCFTA scenario compared to the Current Path in 2043. Whereas the GDP and GDP per capita will increase for all African countries, extreme poverty (at US$2.15 per day) will increase by 25 thousand people in Lesotho and in Congo by seven thousand people in 2043. The results for these countries where the AfCFTA scenario increases extreme poverty reflect the countries’ numerous development challenges across all sectors and the challenges they would experience in participating and gaining from the full implementation of the AfCFTA. In these countries, trade openness must be accompanied by the right domestic complementary policies to make the growth gain from the AfCFTA more inclusive. The short-term solution is likely a safety net programme.
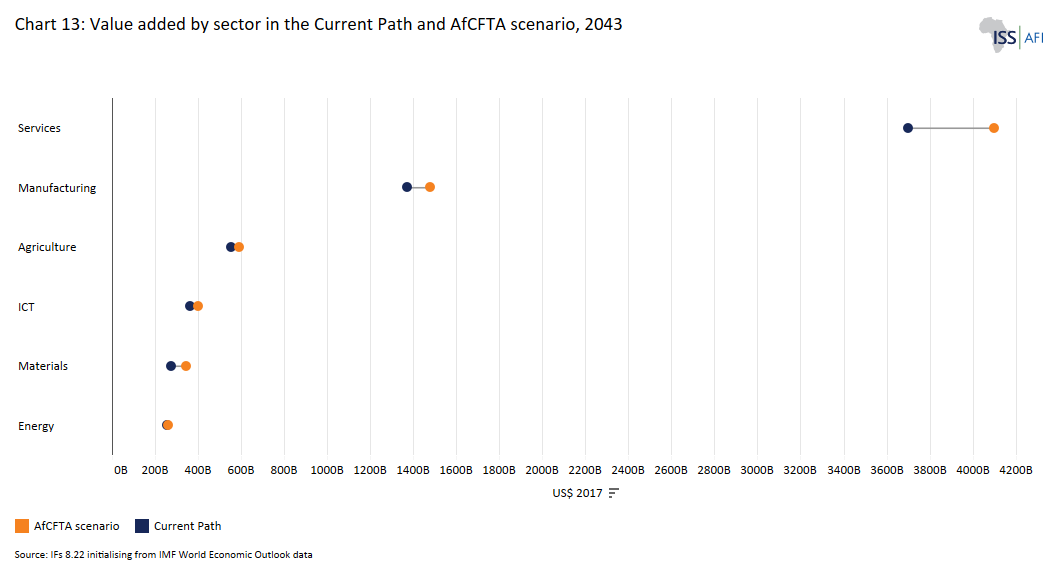
Our modelling uses a sixfold distinction in considering the composition of economies to allow for more flexibility in scenario development. In addition to agriculture, manufacturing, services, the IFs platform initialises from GTAP data to isolate materials, ICTech and energy. The composition of these sectors is listed in the technical page. Given the 0.7 percentage points increase in the size of the African economy by 2043, all six sectors increase in size by 2043 when compared to the Current Path. Chart 13 allows the user to toggle between the absolute numbers and percentage changes for Africa, regions, income groups and countries.
In summary, the successful implementation of the AfCFTA would be particularly beneficial to the continent’s services, manufacturing and materials sectors. The additional gains from the services sector will be US$397.6 billion (or 10.7%) larger than the Current Path. In comparison, the manufacturing sector gains will be US$110.3 billion (or 8.1%) larger, while materials will be US$66.5 billion larger (or 24.2%) relative to the Current Path in 2043.
The performance of the energy and agriculture sectors is less impressive, however, the size of the energy sector would increase by just US$4.4 billion or (1.7%). In comparison, the gains from the agriculture sector would increase by US$35.9 billion (6.5%) relative to the Current Path in 2043.
The contribution to GDP of the materials sector, which includes mining, would increase by about 0.5 percentage points to nearly 4.8% and services by about 0.4 percentage points to account for about 57.2% of the continent’s GDP in 2043. The agriculture, energy, manufacturing and ICT sectors, however, would decline in the contributions that they make to GDP, but not in absolute values since the African economy will be significantly larger in 2043 than otherwise expected. These sectoral shifts follow the natural and expected evolution of economies that become more productive over time.
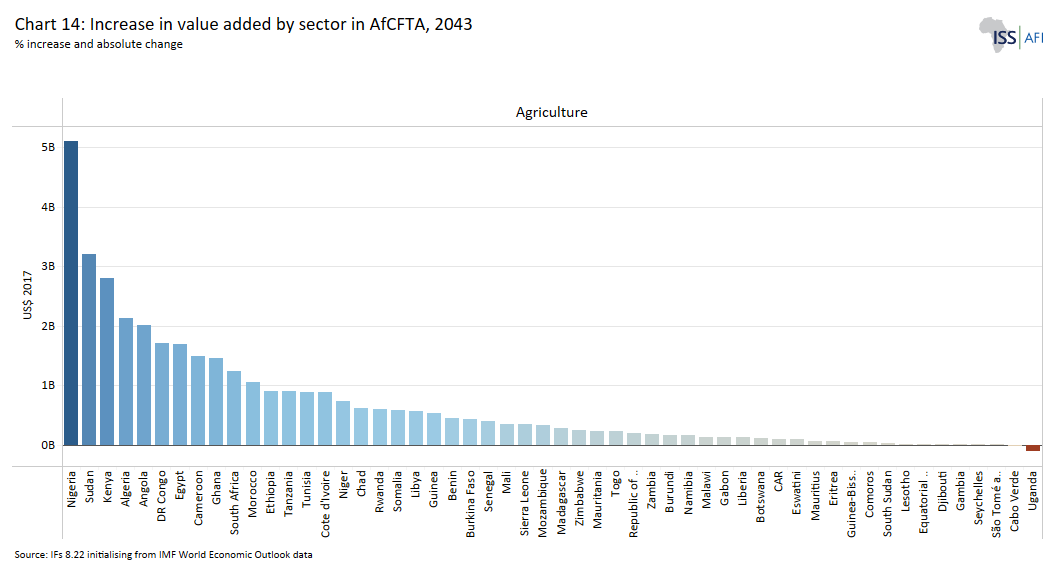
Chart 14 presents the AfCFTA gains in each sector for each country by 2043 relative to the Current Path. The chart allows the user to toggle the value-add and percentage gains for each of the six sectors.
In value terms, South Africa, Nigeria, Algeria and Egypt (respectively) would have the largest increase in the size of their manufacturing sectors relative to the Current Path in 2043. South Africa’s manufacturing sector would increase by US$35.6 billion (equivalent to a 28.6% gain) relative to the Current Path. In contrast, Nigeria's would increase by US$18.1 billion (equivalent to a 9.4% gain). A number of countries would witness a decrease in the manufacturing value added relative to the Current Path, namely Seychelles, Cabo Verde, Liberia, Madagascar, Malawi, Mauritania, Guinea, Namibia, Ethiopia, Zimbabwe and Mauritius. This will be mainly due to their manufacturing sectors being small and less competitive.
In percentage gain terms, South Africa will still be the winner, followed by South Sudan, Chad, Eswatini and Congo. South Sudan’s manufacturing sector will increase by 22.7% relative to the Current Path in 2043, while Chad, Eswatini and Congo sectors will increase by 20.6%, 20% and 18.9%, respectively.
In the agriculture sector, Nigeria will have the largest increase in size, followed by Sudan, Kenya and Algeria. Nigeria’s agriculture sector would increase by US$5 billion relative to the Current Path in 2043. For Sudan, Kenya and Algeria, it would increase by US$3.2 billion, US$2.8 billion and US$2.1 billion, respectively, relative to the Current Path. At the low end would be Uganda and Cabo Verde with US$98 million and US$2 million (respectively) decrease in the size of their agriculture sector value.
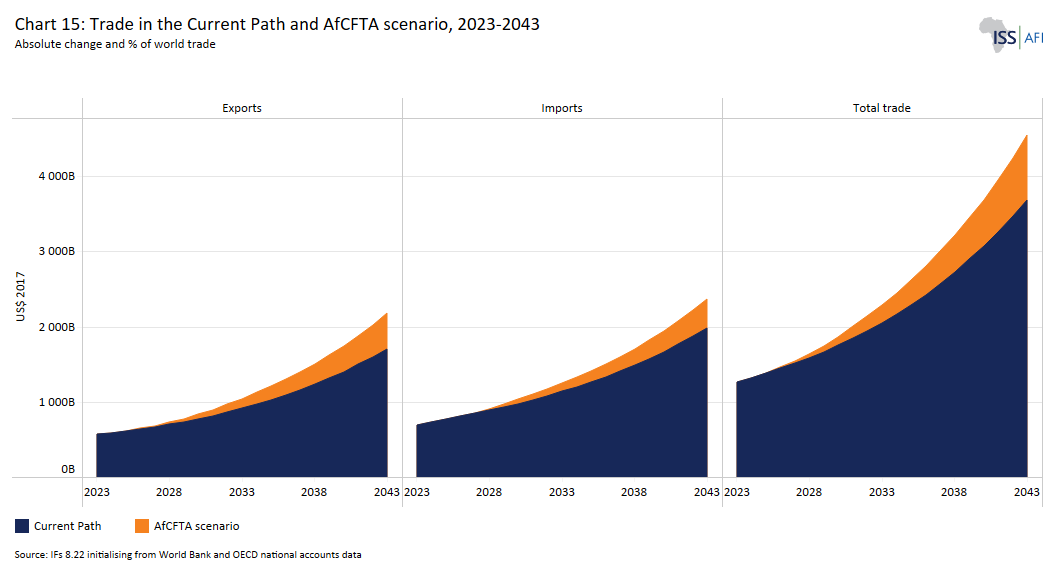
The full implementation of the AfCFTA would significantly boost Africa’s trade values, affecting both exports and imports, reflected in Chart 15 that allows the user to toggle between import and export values for Africa, regions, income groups and countries. Total imports in the AfCFTA scenario would be about US$2.4 trillion in 2043 — an increase of 19.5% relative to the Current Path while total exports would be about US$2.2 trillion, an increase of 27.7%. Africa would still have a trade deficit but it would be significantly lower.
The continent’s total trade would represent 4.6% of global total trade, 0.8 percentage points above the Current Path in 2043. However, the gains are dominated by the increase in imports as the African economies go up the value-curve and integrate into GVCs. Africa’s imports in the AfCFTA scenario would be about US$2.4 trillion in 2043 — an increase of about 19.5% relative to the Current Path while total exports would be about US$2.2 trillion, an increase of 27.7%. Africa would still have a trade deficit but it would be significantly lower.
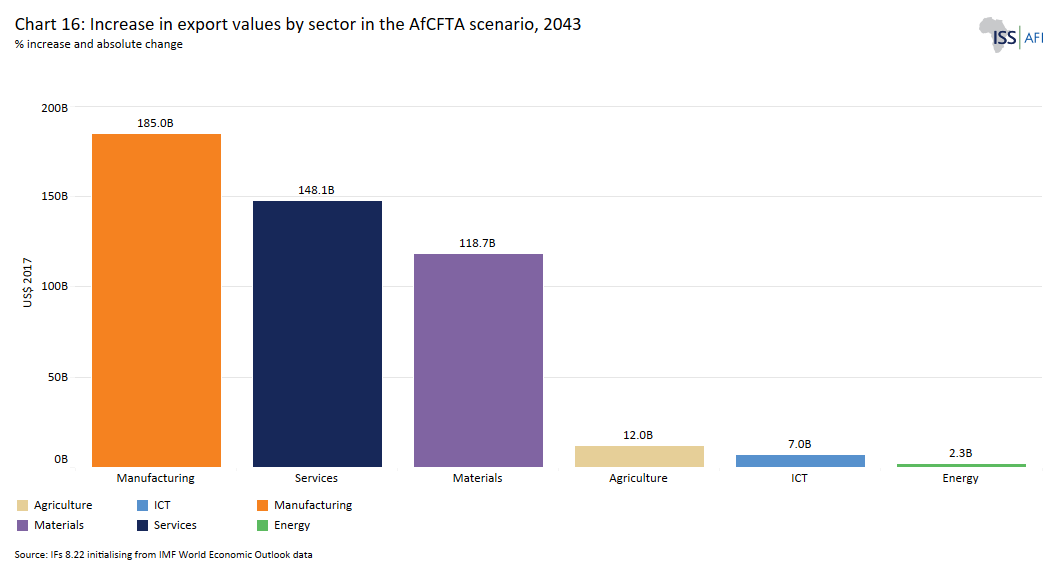
The successful implementation of the AfCFTA would significantly boost Africa’s exports, particularly in the manufacturing and service sectors. The value of Africa’s exports of manufacturing goods will be US$98.9 billion larger than the Current Path in 2043. Service exports would account for about 25.8% of total exports, nearly US$106.8 billion more relative to the Current Path.
Chart 16 allows users to toggle between export values and percentage changes per sector for Africa, regions, income groups and countries. In 2043, Africa’s exports would be highly concentrated in manufactured goods — about 48.2% of total exports in the AfCFTA scenario. This finding reinforces the contribution that the full implementation of the AfCFTA would make to industrialisation and reduction of Africa’s dependence on commodities exports.
Most African countries depend on energy imports to meet their domestic energy demand. Even countries that export oil and gas such as Algeria, Nigeria and Angola, subsequently import the refined product. At the continental level energy exports would decrease by about US$11 billion (7.5% lower) relative to the Current Path in 2043 as Africa’s growing economy and population requires the continent’s energy exporters to reorientate production to domestic use. The share of energy exports in total exports would remain stagnant at around 8.6% of Africa’s total exports in 2043. See the theme on energy for more detail.
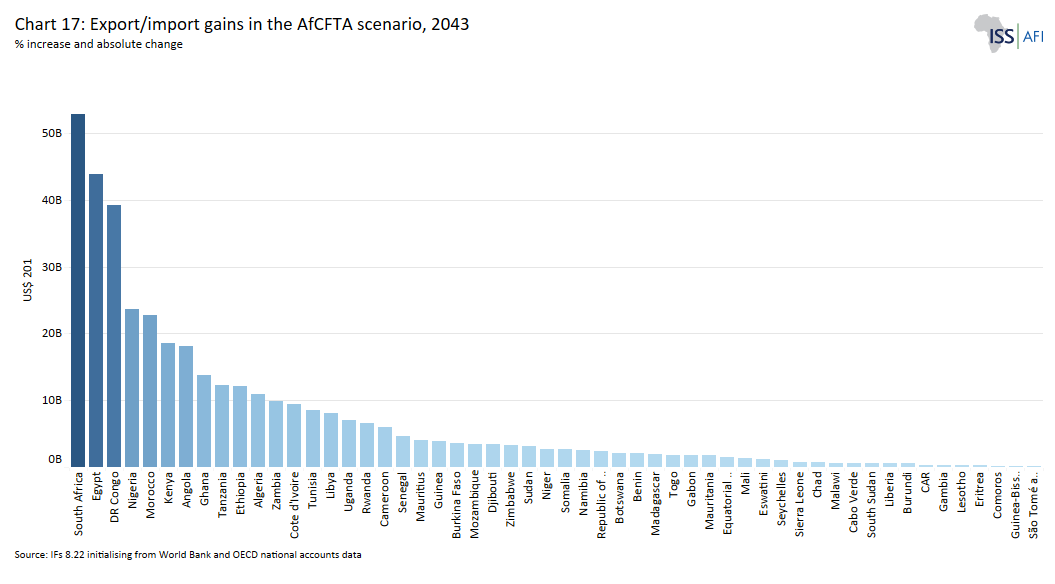
Chart 17 presents African countries’ total export gains and increases in imports in the AfCFTA scenario in 2043. The chart allows the user to toggle between per cent and values in US$. In the AfCFTA scenario, South Africa would gain the most in total export value with an increase of about US$85.2 billion relative to the Current Path in 2043. The continent’s potential export would be heavily concentrated in five major exporters (South Africa, Egypt, DR Congo, Nigeria and Morocco, respectively) in 2043. These top five exporters would account for about 40% of the continent’s total exports in the AfCFTA scenario, while the top 10 exporters would account for about 61% in 2043. The bottom five exporters (Burundi, Sao Tome and Principe, Central African Republic, Comoros and Guinea Bissau, respectively) would account for only 0.1% of Africa’s total potential exports, while the bottom 10 would account for just 0.8%.
In terms of export percentage gains, Nigeria will have the largest percentage increase. Its total exports will increase by 49% relative to the Current Path in 2043, while for South Africa, Angola, Burundi and Kenya will increase by about 43%, 38%, 38%, and 37%, respectively.
The top five importers (South Africa, Egypt, DR Congo, Nigeria and Morocco) will account for 32% (equivalent to US$756.7 billion) of the continent’s total imports in the AfCFTA scenario by 2043, while the top 10 (that including Ethiopia, Algeria, Cote D’Ivoire, Ghana and Kenya will account for 48%. In terms of percentage increase, Mauritius’s imports will increase the most, increasing by about 35.5% relative to the Current Path in 2043. Mauritius import growth will be followed by Seychelles (32.1%), DR Congo (28.3%), Angola (28.2) and Kenya (26.9%) relative to the Current Path.
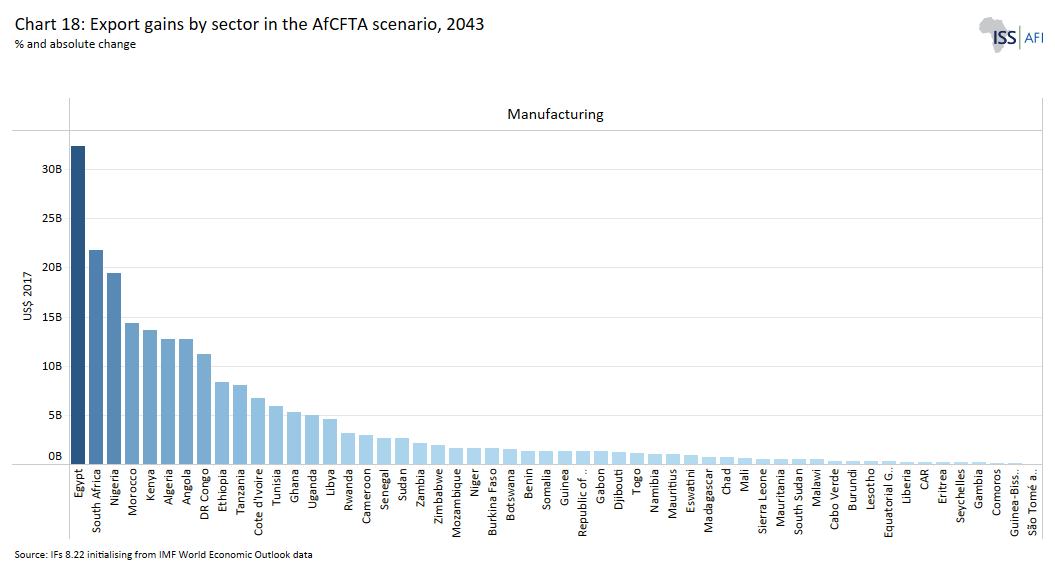
Disaggregating the trade data by sector also reveals the differential impact of the AfCFTA scenario across countries and sectors. Chart 18 allows the user to toggle import/export values and percentage change for each of the six sectors within the IFs forecasting platform.
What a country imports matters for its growth. Advanced manufactured imports have a positive effect on developing countries' technological export composition. Advanced manufactured goods (i.e. industrial goods) are embodied with technologies that improve manufacturing firms’ productivity, and more productive firms are more likely to become exporters. Most African countries are far removed from the technological frontier, and they can experience export composition diversification by importing advanced manufactured goods. Egypt will experience a significant increase in manufactured imports by 2043, increasing by about US$32.4 billion relative to the Current Path. Egypt's manufactured import growth will be followed by South Africa (US$21.8 billion), Nigeria (US$19.4 billion), Morocco (US$14.4 billion) and Kenya (US$13.6), relative to the Current Path.
South Africa would experience the most significant increase in manufacturing exports at about US$49.1 billion relative to the Current Path in 2043, followed by Egypt, Nigeria, Algeria and Morocco. At the low end, Namibia, Mozambique, Malawi, Liberia, Mauritania, Guinea and Mauritius would see manufacturing exports loss relative to the Current Path. Currently, the manufacturing sector of most of these economies is small and weak.
Agricultural exports gain relative to the Current Path in 2043, which would be highly concentrated in the top six exporters (Angola, South Africa, Tanzania, Kenya and Nigeria). Each would gain over US$0.5 billion, accounting for about 26.9% of the continent’s total agricultural exports in the scenario.
Angola would gain the most as its agricultural exports would increase by slightly over US$1.5 billion relative to the Current Path in 2043. South Africa would have the second largest agricultural export gains relative to the Current Path with its agricultural exports increased by nearly US$1.5 billion in 2043. At the low end, the agricultural exports of Central Africa, Gambia, Niger and Sudan would decrease relative to the Current Path in 2043.
Overall, the AfCFTA scenario affirms that the full implementation of the agreement could significantly contribute to diversifying African economies and promoting inclusive growth on the continent. However, the gains from the AfCFTA will vary across states depending on their institutional frameworks, the structure of their economies, their domestic policies and their levels of development, etc. The implementation of the AfCFTA will, however, initially increase extreme poverty in many countries as the gains will be accrued disproportionately across member states. This will happen between countries, within countries, between firms and among the population. Pre-existing inequalities mean that better-developed African countries, cities, manufacturing firms and economic elite will benefit the most from the increased trade. Additionally, in all African countries, cities and urban areas are better integrated into trade value chains than rural areas, without comprehensive policies, inequalities will increase, widening the gaps between urban and rural areas especially when the AfCFTA agreement leads to diversification away from primary/commodity exports.
Without comprehensive policymaking and preferential treatment of Africa’s LDCs, the AfCFTA could be a source of divergence rather than integration. The AfCFTA arguably has the highest income disparities among its member countries than any other FTA. It is, therefore, important that the LDCs build efficient and effective institutional frameworks. To alleviate the negative impacts, dynamic industrial policies must be put in place to encourage productivity, diversification and fair and healthy competition, especially concerning small and medium enterprises (SMEs) and manufacturing.
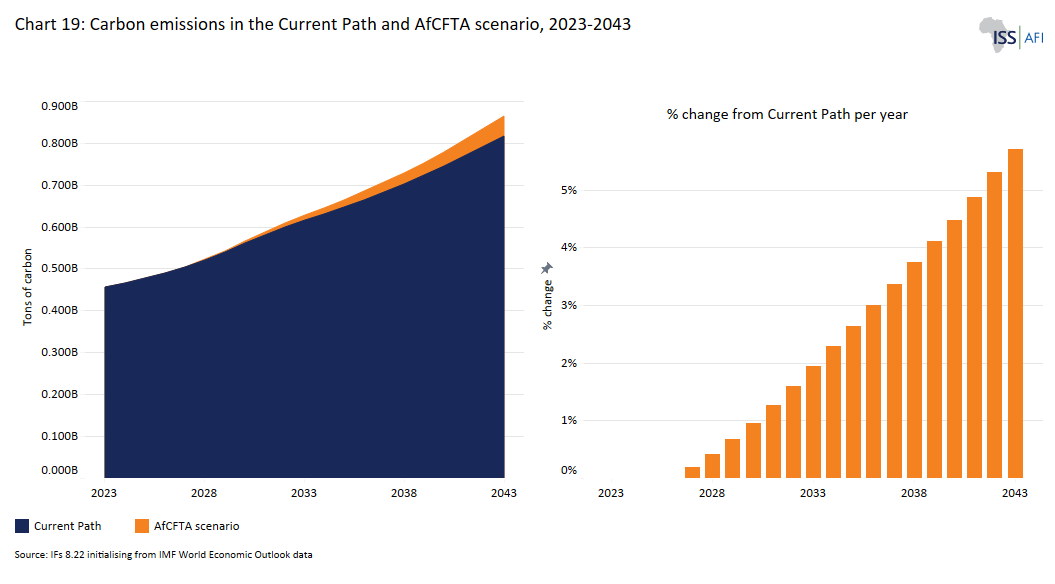
The successful implementation of the AfCFTA agreement will boost Africa’s trade volumes, however, the increased production associated with the implementation of the AfCFTA as well as the movements of goods across borders by trucks, ships and trains will contribute to an increase in carbon emissions. Chart 19 shows an overall upward trend of carbon emissions in Africa. Currently, African countries account for less than 5% of the world’s total carbon emissions. The AfCFTA scenario will increase Africa’s carbon emissions from fossil fuels by 5.8% relative to the Current Path in 2043. The implementation of the agreement should therefore not be separated from environmental policy. The AfCFTA agreement should prioritise the adoption of low-carbon technologies to mitigate its environmental impacts.
In the scenario, Egypt will be the biggest emitter, followed by Nigeria, South Africa, Algeria and Ethiopia. These five top emitters will account for 54.6% of the continent’s total world carbon emissions in 2043. Egypt's carbon emissions will increase by 3% relative to the Current Path, while South Africa’s will increase by 5.3% compared to the Current Path in 2043 although the latter has considerable potential to reduce its significant emissions from coal.
This theme sets out the reasons why African countries need to intensify trade agreements with one another to grow trade, develop and diversify their economies, and progress up the value-added ladder. Most African economies are too small, and the continent is currently too fragmented to build competitive, productive capacity at scale or to offer sufficiently large markets to attract substantive foreign investment without such agreements.
Intra-Africa trade is limited, with the result that countries trade more with the outside world than among themselves. This is ironic, as trade potential in goods inevitably diminishes with distance. African countries are best served by first trading with other countries on the continent.
Eventually, the success of the AfCFTA will be determined by regional value chains with frictionless trade, fast customs procedures and cost-efficient multimodal transit corridors. Success will ultimately come down to the actions of leadership and interests at the country level, as well as the leadership ability and capacity to coordinate and harmonise trade policies and regulations at national, regional, continental and global levels.
That said, the extent to which Africa will be able to leapfrog to higher-end value in exports will depend on the investments in education, technology and selected, well-targeted infrastructure that can support competitive industries and sectors in industrial parks and export-processing zones linked to regional and global markets. But more is required. Removing non-tariff barriers — the bureaucracy and poor infrastructure that keep countries from trading with their neighbours — is important, as is the requirement to improve the quality of Africa’s human capital. Also, imported critical inputs in Africa face relatively high tariffs and other cost-increasing factors, making them more expensive in the domestic market compared to other regions. The AfCFTA will not significantly alleviate this tariff burden, as most critical inputs are sourced from higher-income non-member countries. Therefore, establishing trade agreements with countries outside Africa that produce these essential inputs for Africa’s manufacturing industry will be vital to fully leveraging the potential of the AfCFTA. African countries need to invest in education if they want to improve their human capital endowments and the productive structure of their economies.
Digital technologies can help overcome Africa’s large infrastructure deficit, but will likely dampen trade in goods while further fuelling the growth in service trade. The trend towards global value chains becoming more focused on services and less on goods is well established. A smaller share of the goods rolling off the world’s assembly lines is now traded across borders, while cross-border services are increasing more rapidly as global value chains become more knowledge-intensive and reliant on higher-skilled labour.
Trade integration can help African countries prioritise investment in sectors where they have a comparative advantage. Comparative advantage is dynamic and changes over time, within and among sectors, and such an approach will require ongoing vigilance and policy adjustment.
Irrespective of their comparative advantage, African countries need to enhance export diversification and reduce their vulnerability to external shocks by trading regionally and eventually globally. In addition, regional integration would improve the diversification of goods and the technology content of Africa’s exports.
In other words, trade liberalisation works only to the benefit of countries when they actively manage their levels of openness to trade. For this reason, the support of national governments that invest in the quality of institutions and provide policy certainty is important. China is the poster child when it comes to successfully managing access to its large domestic market, protecting and nurturing its infant industry, and demanding technology transfer from foreign companies. Today, it is the world’s factory.
The AfCFTA is crucial for growth and prosperity in Africa. It has the potential to trigger a virtuous cycle of expanded trade on the continent, which will, in turn, drive the structural transformation of economies. Negotiations are, however, likely to take a long time, and many uncertainties, for instance, about tariff schedules, remain. For this reason, the EAC, the SADC, ECOWAS and the Tripartite Free Trade Area and other existing RTAs should continue to pursue trade facilitation reforms and integration. To date, progress has been very slow.
Many countries (e.g. the UK, the US and China) are entering into bilateral free trade agreements with individual African countries. For Africa, the goal must be a more rapid diversification of African economies, and the following three questions should be kept in mind:
- Do these agreements provide African countries with sufficient support for developing agricultural and industrial value creation?
- Do they offer sufficient protection for Africa’s infant industries?
- Do they help or obstruct the implementation of the AfCFTA?
The major obstacles to regional trade in Africa are often political. They are shaped by the short- and medium-term pain (loss of tariff income and increase in poverty, especially in countries with higher inequality) that is required before the long-term gains (higher growth) offset these losses. Regional integration will eventually increase revenues as more rapid growth, owing to increased efficiency, would translate into more government revenues. Furthermore, higher consumption from increased imports and higher income would also reduce extreme poverty and generate more revenue. But in the immediate future, governments will have to work hard to get domestic buy-in once the pain from increased poverty and loss of tariff income becomes evident.
The condition for success would be for national leadership to mitigate and compensate for losses that could be experienced by countries, firms and individuals that are relatively disadvantaged. Limiting negative employment effects will require increasing formal labour market flexibility. Mitigating adverse income distribution effects requires broader and more efficient social safety nets. Training and retraining programmes to adapt workers’ skills to new needs will also be required.
If the political will exists to overcome the initial tariff losses, the biggest structural challenge to the implementation of the AfCFTA will be integrating extremely unequal partners, such as upper-middle-income South Africa or Botswana, with surrounding low-income countries, such as Mozambique, Eswatini and Lesotho.
Estimations on the impact of the AfCFTA
- The African Export-Import Bank (AFREXIMBANK), in 2018, estimated the export potential of intra-Africa trade at more than US$84 billion, which if tapped would take total intra-Africa trade to US$231 billion. The untapped proportion consists of sectors that are known to be internationally competitive and have good prospects for export success in regional markets. These included mineral commodities, machinery, food products, motor vehicles and parts, and plastics and rubber. At US$53 billion, most of the total untapped figure of US$84 billion sits in Southern Africa. This is followed by North Africa (US$13.4 billion), West Africa (US$9.5 billion) and East Africa (US$7.8 billion). Central Africa comes in last (US$840 million).
- In a 2019 scenario that emulates the full AfCFTA implementation, where all tariffs are eliminated, the United Nations Conference on Trade and Development (UNCTAD) estimates that the net welfare gains could be in the region of US$16 billion and almost 1% more rapid GDP growth than would otherwise be the case. Total employment improves by slightly more than 1%, intra-Africa trade is forecast to grow by one-third and Africa’s total trade deficit is cut in half.
- In its 2019 estimate of the impact of the AfCFTA, the UN Department of Economic and Social Affairs (UNDESA) finds that growth in Africa could accelerate by 0.3 to 0.6 percentage points by 2040 compared to the baseline scenario. However, these forecasts likely substantially underestimate the economic benefits of the AfCFTA, as they do not take into account the impact of liberalisation in other areas, such as service and investment.
- In a 2020 International Monetary Fund (IMF) study, long-term income gains would be at least 2.1% with increased investment, innovation and knowledge diffusion, with significant expansion of intra-regional trade and limited adverse effects on trade with non-member countries (trade diversion). About US$60 billion could be added to African exports.
- In 2021, the Frederick S. Pardee Centre for International Futures reported that intra-Africa trade is expected to increase to 40% of African total trade by 2063.
- A 2022 World Bank report in association with the AfCFTA Secretariat indicated that the full implementation of the AfCFTA scenario could increase intra-Africa exports by up to 109% and global exports by 32% by 2035, lift 50 million people out of poverty and raise overall income by 8% by 2035. Other benefits that could accrue include FDI, which is expected to bring new capital, fresh technology and additional skills to raise the standard of living and reduce African dependence on primary and commodity exports. Women and skilled workers are expected to see the biggest wage gains from the AfCFTA. The wages of female workers are expected to be 11.2% higher in 2035 and male workers’ wages could grow by 9.8%.
Page information
Contact at AFI team is Blessing Chipanda and Jakkie Cilliers
This entry was last updated on 31 March 2026 using IFs v8.22.
Donors and sponsors


Reuse our work
- All visualizations, data, and text produced by African Futures are completely open access under the Creative Commons BY license. You have the permission to use, distribute, and reproduce these in any medium, provided the source and authors are credited.
- The data produced by third parties and made available by African Futures is subject to the license terms from the original third-party authors. We will always indicate the original source of the data in our documentation, so you should always check the license of any such third-party data before use and redistribution.
- All of our charts can be embedded in any site.
Cite this research
Blessing Chipanda and Jakkie Cilliers (2026) Africa AfCFTA Futures. Published online at futures.issafrica.org. Retrieved from https://futures.issafrica.org/thematic/08-afcfta/ [Online Resource] Updated 31 March 2026.