 Gambia
Feedback welcome
Our aim is to use the best data to inform our analysis. See our Technical page for information on the IFs forecasting platform. We appreciate your help and references for improvements via our feedback form.
Please note: This country report was developed using African Futures’ previous analytical framework, which organised the assessment across 11 sectoral scenarios. We have since updated and streamlined the analytical architecture to 8 sectoral scenarios. While the two frameworks remain broadly aligned, the current structure improves consistency, comparability and integration across themes and geographic studies. This page will therefore be updated to the current framework in due course. Read more about our analytical framework on the Technical Page.
In this entry, we first describe the Current Path forecast for The Gambia as it is expected to unfold to 2043, the end of the third ten-year implementation plan of the African Union’s Agenda 2063 long-term vision for Africa. The Current Path in the International Futures (IFs) forecasting model initialises from country-level data that is drawn from a range of data providers. We prioritise data from national sources.
The Current Path forecast is divided into summaries on demographics, economics, poverty, health/WaSH and climate change/energy. A second section then presents a single positive scenario for potential improvements in stability, demographics, health/WaSH, agriculture, education, manufacturing/transfers, leapfrogging, free trade, financial flows, infrastructure, governance and the impact of various scenarios on carbon emissions. With the individual impact of these sectors and dimensions having been considered, a final section presents the impact of the Combined Agenda 2063 scenario.
We generally review the impact of each scenario and the Combined Agenda 2063 scenario on gross domestic product (GDP) per person and extreme poverty except for Health/WaSH that uses life expectancy and infant mortality.
The information is presented graphically and supported by brief interpretive text.
All US$ numbers are in 2017 values.
Executive Summary
- Current Path forecast
- The Gambia is a small low-income country in Africa with a population of 2.4 million people. It is completely surrounded by Senegal, with the exception of the Atlantic Ocean on its western border. Life expectancy in The Gambia is 68.9 years, and there is a high disease burden from both communicable and non-communicable diseases. The Gambia’s GDP per capita in 2019 stood at US$2 600, and about 10.8% of the population (250 000 people) live below the benchmark poverty line of US$1.90 for low-income countries. Jump to forecast: Current Path
- In the Current Path forecast, the population of The Gambia increases from an estimated 2.4 million people in 2019 to 4.4 million people in 2043, and the country witnesses significant growth in urbanisation, such that by 2043, 72.1% of the population will reside in urban areas. Jump to Demographics: Current Path
- The country experiences significant growth in GDP, reaching US$10 billion in 2043 and experiences an increase in GDP per capita to US$4 950 in 2043. Additionally, The Gambia reduces its level of informality, with a decrease in the size of the informal sector’s contribution to GDP, from 32.3% in 2019 to 26.8% in 2043. The country’s reliance on the service sector for job creation sees an increase in its contribution to GDP to US$6.7 billion (66.4% of GDP). Jump to Economy: Current Path
- In 2043, the number of people living below the poverty line of US$1.90 reduces to 90 000 people (2.1% of the population). Jump to Poverty: Current Path
- The Gambia sees reduction in the share of gas produced in the country (52%) while other renewable energies constitute 40% of total energy production in 2043 in the Current Path forecast. Carbon emissions increase to 1 million tons in 2043. Jump to Carbon emissions/Energy: Current Path
- Sectoral Scenarios
- The Stability scenario will improve The Gambia’s score on the government security index to 0.99 in 2043 and simultaneously increase GDP per capita to US$5 114, reducing the proportion of people living below the poverty line to 1.8% of the population. Jump to Stability Scenario
- The Gambia will not get to its demographic dividend by 2043 in the Demographic scenario. It will attain the under 5 mortality target of 25 deaths per 1 000 births by 2030; by 2043, infant mortality will be 9.4 deaths per 1 000 births in the Demographic scenario. Jump to Demographic scenario
- The Health/WaSH scenario will increase life expectancy to 75.2 years by 2043 and reduce infant mortality per 1 000 live births to 11.9. Jump to Health/WaSH scenario
- In the Agriculture scenario, The Gambia’s crop yield will be low at 3.3 tons per hectare, and the nation will remain a net importer of agricultural products with a balance of 38.9% total agricultural demand by 2043. Jump to Agriculture scenario
- The Education scenario will result in a higher GDP per capita of US$5 135 by 2043, although the number of poor people in The Gambia will decline only marginally as a result of implementing this scenario. Jump to Education scenario
- In the Manufacturing/Transfers scenario, government welfare transfers to households will increase to US$0.57 billion in 2043. Jump link to Manufacturing/Transfer scenario
- The Leapfrogging scenario will increase mobile broadband subscriptions per 100 people from 32.9 in 2019 to 156.2 in 2043 and also enable access to electricity to 90.9% of the population. Jump to Leapfrogging scenario
- In the Free Trade scenario, there will be an increase in GDP per capita to US$5 303 by 2043 and a reduction in the proportion of poor people in The Gambia to 1.4% of the population. Jump to Free Trade scenario
- The Financial Flows scenario will decrease aid as a percentage of GDP, while increasing the contribution of foreign direct investment to The Gambia’s economy to 7.8% in 2043. Jump to Financial Flow scenario
- The Infrastructure scenario will increase the percentage of the rural population living within 2 km of an all-weather road to 72.1% by 2043. Jump to Infrastructure scenario
- The Governance scenario will increase GDP per capita to US$5 088 in 2043. Jump to Governance scenario
- While The Gambia’s carbon emissions are projected to increase in all the scenarios, the Free Trade scenario will have the greatest effect, resulting in additional emissions of 1.38 million tons of carbon in 2043. Jump to Impact of scenarios on carbon emissions
- Combined Agenda 2063 scenario Jump to Combined Agenda 2063 scenario
- In the Combined Agenda 2063 scenario, The Gambia sees an increase in GDP per capita by US$2 873 in 2043 with the Free Trade and Agriculture scenarios having the greatest potential to increase GDP per capita. The economy grows to US$18.5 billion in 2043, compared to projections of US$10 billion in the Current Path forecast. There is a significant reduction in the number of people living below the poverty line to 6 000 people (0.15% of population) and a significant increase in carbon emissions to 1.7 million tons by 2043.
All charts for Gambia Development Futures
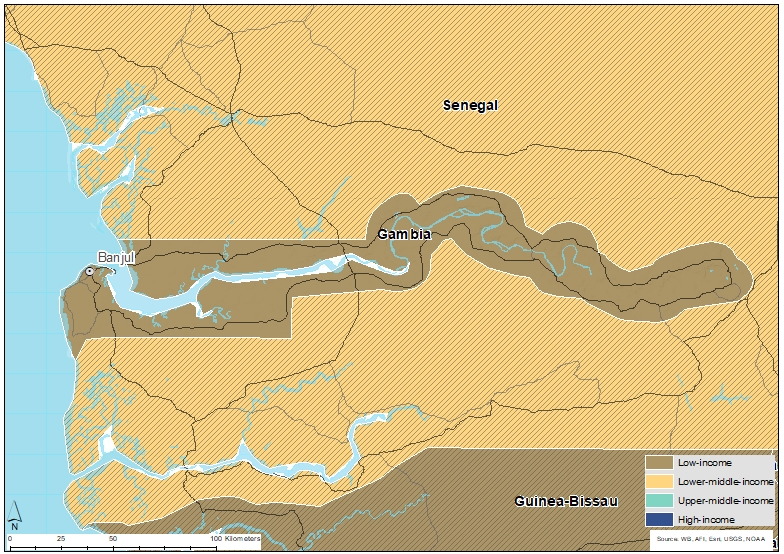
- Chart 1: Political map of The Gambia
- Chart 2: Population structure in CP, 1990–2043
- Chart 3: Urban and rural population in CP, 1990–2043
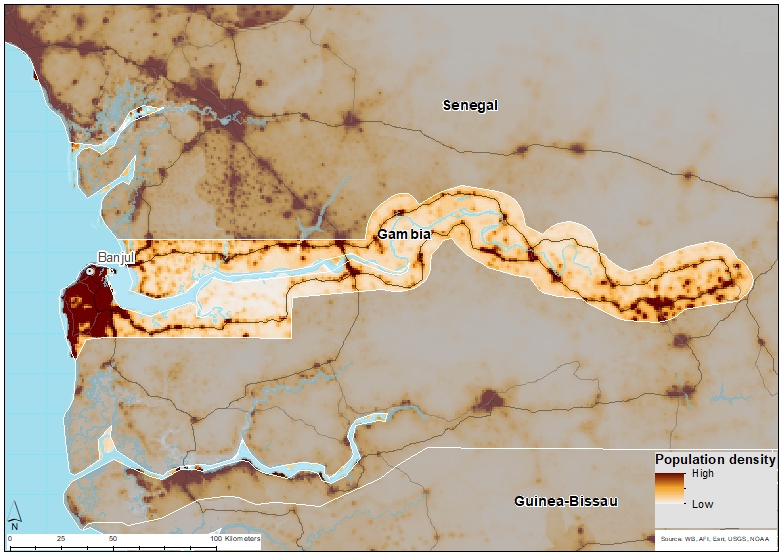
- Chart 4: Population density map for 2019
- Chart 5: GDP in CP, 1990–2043
- Chart 6: GDP per capita in CP, 1990–2043
- Chart 7: Informal sector value in CP, 2015–2043
- Chart 8: Value added by sector in CP, 2015–2043
- Chart 9: Agriculture production/demand in CP, 1990–2043
- Chart 10: Poverty in CP, 2015–2043
- Chart 11: Energy production by type in CP, 1990–2043
- Chart 12: Carbon emissions in CP, 1990–2043
- Chart 13: Governance security in CP and Stability scenario, 2019–2043
- Chart 14: GDP per capita in CP and Stability scenario, 2019–2043
- Chart 15: Poverty in CP and Stability scenario, 2019–2043
- Chart 16: Demographic dividend in CP and Demog scenario, 2019–2043
- Chart 17: Infant mortality in CP and Demog scenario, 2019–2043
- Chart 18: GDP per capita in CP and Demog scenario, 2019–2043
- Chart 19: Poverty in CP and Demog scenario, 2019–2043
- Chart 20: Life expectancy in CP and Health/WaSH scenario, 2019–2043
- Chart 21: Infant mortality in CP and Health/WaSH scenario, 2019–2043
- Chart 22: Yield/hectare in CP and Agric scenario, 2019–2043
- Chart 23: Agriculture imports in CP and Agric scenario, 2019–2043
- Chart 24: GDP per capita in the CP and Agric scenario, 2019–2043
- Chart 25: Poverty in CP and Agric scenario, 2019–2043
- Chart 26: Mean years of education in CP and Educ scenario, 2019–2043
- Chart 27: Education quality in CP and Educ scenario, 2019–2043
- Chart 28: GDP per capita in CP and Educ scenario, 2019–2043
- Chart 29: Poverty in CP and Educ scenario, 2019–2043
- Chart 30: Value added by sector in CP and Manufac/Transfers scenario, 2019–2043
- Chart 31: Gov welfare transfers in CP and Manufac/Transfers scenario, 2019–2043
- Chart 32: GDP per capita in CP and Manufac/Transfers scenario, 2019–2043
- Chart 33: Poverty in CP and Manufac/Transfers scenario, 2019–2043
- Chart 34: Fixed broadband access in CP and Leapfrogging scenario, 2019–2043
- Chart 35: Mobile broadband access in CP and Leapfrogging scenario, 2019–2043
- Chart 36: Electricity access in CP and Leapfrogging scenario, 2019–2043
- Chart 37: GDP per capita in CP and Leapfrogging scenario, 2019–2043
- Chart 38: Poverty in CP and Leapfrogging scenario, 2019–2043
- Chart 39: Trade balance in CP and Free Trade scenario, 2019–2043
- Chart 40: GDP per capita in CP and Free Trade scenario, 2019–2043
- Chart 41: Poverty in CP and Free Trade scenario, 2019–2043
- Chart 42: Foreign aid in CP and Financial Flows scenario, 2019–2043
- Chart 43: Inflow of FDI in CP and Financial Flows scenario, 2019–2043
- Chart 44: Remittances in CP and Financial Flows scenario, 2019–2043
- Chart 45: GDP per capita in CP and Financial Flows scenario, 2019–2043
- Chart 46: Poverty in CP and Financial Flows scenario, 2019–2043
- Chart 47: Electricity access in CP and Infrastructure scenario, 2019–2043
- Chart 48: Rural road access in CP and Infrastructure scenario, 2019–2043
- Chart 49: GDP per capita in CP and Infrastructure scenario, 2019–2043
- Chart 50: Poverty in CP and Infrastructure scenario, 2019–2043
- Chart 51: Gov effectiveness in CP and Governance scenario, 2019–2043
- Chart 52: GDP per capita in CP and Governance scenario, 2019–2043
- Chart 53: Poverty in CP and Governance scenario, 2019–2043
- Chart 54: Carbon emissions in CP and scenarios, 2019–2043
- Chart 55: GDP per capita in CP and scenarios, 2019–2043
- Chart 56: GDP per capita in CP and Combined scenario, 2019–2043
- Chart 57: Poverty in CP and Combined scenario, 2019–2043
- Chart 58: Value added by sector in CP and Combined scenario, 2019–2043
- Chart 59: GDP in CP and Combined scenario, 2019–2043
- Chart 60: Carbon emissions in CP and Combined scenario, 2019–2043


Gambia Development Futures: Current Path
Download to pdfThis page provides an overview of the key characteristics of The Gambia along its likely (or Current Path) development trajectory. The Current Path forecast from the International Futures forecasting (IFs) platform is a dynamic scenario that imitates the continuation of current policies and environmental conditions. The Current Path is therefore in congruence with historical patterns and produces a series of dynamic forecasts endogenised in relationships across crucial global systems. We use 2019 as a standard reference year and the forecasts generally extend to 2043 to coincide with the end of the third ten-year implementation plan of the African Union’s Agenda 2063 long-term development vision.
The Gambia is one of 23 low-income countries in Africa. It is the smallest mainland African country and is surrounded by Senegal, except for its western coast on the Atlantic Ocean. The Gambia is a member of the Economic Community of West African States (ECOWAS) and has a total area of 11,295 km² and is less than 50 km2 wide. The climate is generally of a tropical nature, like in the neighbouring country of Senegal, with a hot and rainy season and a cooler but drier season. The Gambia contains three terrestrial ecoregions: Guinean forest-savanna mosaic, West Sudanian savanna and Guinean mangroves. Administratively, The Gambia is divided into eight local government areas, including the national capital, Banjul. The local government areas are further subdivided into 48 districts. Although Banjul is the capital city of the country, the largest cities are Serekunda and Brikama. The current estimate of the total population of The Gambia is around 2.4 million people. The country is blessed with some natural resources including fish, clay, silica sand, titanium (rutile and ilmenite), tin and zircon. It also exports some agricultural products like peanuts, fish, cashew nuts, mango, various vegetables and sesame. The Gambia River, which passes through the country, is one of the most important waterways in Africa, and it is the only river in Africa that is navigable by ocean-going vessels all year round. The Gambia River is also an important fishing ground for Gambians, enabling oyster harvesting.
The Gambia is the 14th most populous country in West Africa, and the 42nd most populous in Africa, with an estimated population of 2.4 million in 2019 from about 1 million in 1990. This represents an increase of 147% in the country’s population over the past 29 years. In the Current Path forecast, the population of The Gambia is forecasted to increase to 4.4 million in 2043, representing an approximate increase of 85.9% within the 24-year period. The slower pace of the population growth rate within this period can be attributed to the adoption of improved birth control methods such as the use of contraceptives. The Gambia has a large youthful population with a youth bulge (defined as the ratio of the population between the ages of 15 and 29 to the total adult population) of 50.3% and a median age of 17.6 years in 2019. The youth bulge will remain above 40% in the Current Path forecast horizon. This large youth bulge raises concerns about youth unemployment in the country. Indeed, this is already evident as it is estimated that unemployment among youth aged 15–34 years is around 35%. It is significant to note, however, that there have been some efforts to address the issue; for instance, one of the strategic priorities of the National Development Plan 2018-2021 was youth empowerment through creating employment opportunities and entrepreneurial skills for Gambian youth. In the Tekki-Fi project, a number of vocational training institutes were improved to provide skill-based training to youths and to provide them initial seed money to start their own businesses.
In addition, 44.3% of the population is below the age of 15 years and 28% under the age of 30 years. The relatively large cohort of children under the age of 15 constrains the materialisation of the demographic dividend. With an expected decline in the fertility rate from 5.1 births per woman in 2019 to 3.6 births in 2043, it is projected that the proportion of people below the age of 15 years will fall to 35.5% over the next 24 years. This signals the likelihood of a more adult population, increasing the share of people under the age of 64 years from 24.9% in 2019 to 31.6% in 2043 as well as raising the median age to 22 years. The average life expectancy in The Gambia was 68.9 years in 2019 but is estimated to increase to 75.2 years in 2043. The main causes of death in The Gambia are the high disease burden emanating from communicable and non-communicable diseases. With an expected decline in communicable diseases over the period, life expectancy is also projected to increase.
In 1990, the majority of Gambians (over 71% of the population) resided in rural areas. However, by 2003, the country had achieved parity in urban–rural settlement so that in 2019, the proportion of people that resided in rural areas increased to 61.6%, representing a 23.3 percentage point increase from the 1990 figures. The high rate of urbanisation in the country was largely due to young people migrating from the rural areas to the national capital and other urban centres in pursuit of work. The movement of many young women from rural areas in search of domestic work in urban centres could explain this trend. On the Current Path, it is projected that about 72.1% of the Gambian population will live in the urban areas by 2043. This will be far above the projected average of 40.7% for low-income African countries within the same period.
The entire population of The Gambia is settled on a total land area of approximately 11 295 km2. In 2019, The Gambia was the most densely populated country in West Africa and the 5th most densely populated country in Africa. The population density of The Gambia is estimated to be about 2.3 people per hectare, which is far higher than the average of 0.45 for Africa and 0.65 for West Africa. The population distribution of The Gambia is highly influenced by access to the capital city Banjul which is the hub for trade, commerce, education, healthcare and centre for government business. The areas that are most densely populated in the country are Banjul, Kanifing Municipal Council and Kombo North. Areas that are less densely populated include Kiang West in Lower River Division, Foni Bondali in Western Division and Sami in Central River Division.
The main drivers of the Gambian economy are agriculture and tourism, which constitute the country’s major sources of foreign exchange earnings. The GDP of The Gambia has increased by nearly US$1.2 billion from US$0.9 billion in 1990 to US$2.1 billion in 2019, representing an increase of 133% over the 29-year period. The Gambia suffered years of economic mismanagement under the 22-year rule of their former leader, President Yahya Jammeh. Nonetheless, some positive economic gains were recorded during that era: from 2005 to 2010, the economy recorded steady positive economic growth with an average annual growth of 6%–7%. However, the period 2010 to 2016 witnessed a sharp deterioration of the Gambian economy due to multiple shocks. The average GDP growth within this period was about -1%. This was due, first, to the failure of the agriculture sector as a result of a drought that led to a slump in GDP growth in 2011. The GDP consequently fell to 3.3% in 2012. Second, the Ebola crisis negatively impacted The Gambia’s tourism sector, which was a strong contributor to the GDP. Over the next 22 years, The Gambia’s GDP is estimated to almost quintuple to US$10 billion from the 2019 figure. The greater increase in the GDP reflects the higher economic growth expected to occur within the next 22 years compared to previous years.
Although many of the charts in the sectoral scenarios also include GDP per capita, this overview is an essential point of departure for interpreting the general economic outlook of The Gambia.
The Gambia’s GDP per capita in the past has been very unstable, fluctuating between US$2 400 and US$2 765 in the period 1990 to 2019. From 1990, the country’s GDP per capita stood at US$2 668 and eventually moved to a peak of US$2 765 before declining to US$2 600 in 2019. The marginal decline in GDP per capita represents the relatively slower growth rate of GDP compared to population over the period. However, with the anticipated increase in GDP and the decline in fertility rates, it is projected that GDP per capita will rise over the next 24 years, such that by 2043, The Gambia’s GDP per capita will increase to US$4 950, constituting a 90.4% increase over the period. Throughout the period under consideration, The Gambia’s GDP per capita is higher than the projected average of US$3 790 by 2043 for low-income countries in Africa. However, the gap in terms of GDP per capita between The Gambia and its income peers reduces from US$1 535 in 1990 to US$1 160 in 2043. This suggests that The Gambia either has a lower population growth rate or faster economic growth compared to the average low-income country in Africa.
The size of the informal sector in The Gambia was equivalent to 32.3% of GDP in 2019, which was above the average of 30.1% for low-income countries in Africa. The majority of people employed within the informal sector in The Gambia are women, accounting for about 73.8% of the total workforce. The sector further accounts for 77% of all sole proprietorships in the country, with a significant number being micro, small, and medium enterprises. The size of this economy is expected to decline to 26.8% by 2043, constituting a 5.5 percentage point decrease over the 24-year period. In 2019, the total number of people employed by the informal economy constituted 60.2% of the total labour force; this is however expected to decline to 49.1% in 2043. It is therefore not surprising that the level of informality will also decline within the same period.
The IFs platform uses data from the Global Trade and Analysis Project (GTAP) to classify economic activity into six sectors: agriculture, energy, materials (including mining), manufactures, services and information and communications technology (ICT). Most other sources use a threefold distinction between only agriculture, industry and services with the result that data may differ.
The three largest contributors to GDP in The Gambia are the service, agriculture and manufacturing sectors respectively. In 2019, the contribution of the service sector to GDP was about US$1.2 billion, representing 56% of GDP, and it is expected to increase to US$6.7 billion by 2043, representing 66.4% of GDP. The agricultural sector, which employs about 37.7% of the total labour force, is currently the second largest contributor to GDP with a share of 23.3%, constituting about US$0.5 billion in 2019. Manufacturing is the third most significant contributor to GDP, with a share of 12.6%. However, it is expected that by 2032, the manufacturing sector will overtake the agricultural sector as the second largest contributor to GDP, so that by 2043, the manufacturing sector will contribute 10.6 percentage points more to GDP than agriculture, indicating the structural transformation of the economy.
The data on agricultural production and demand in the IFs forecasting platform initialises from data provided on food balances by the Food and Agriculture Organization (FAO). IFs contains data on numerous types of agriculture but aggregates its forecast into crops, meat and fish, presented in million metric tons. Chart 9 shows agricultural production and demand as a total of all three categories.
The average crop yield in The Gambia is very low: it was estimated at 1.2 metric tons per hectare in 2019. In 1990, The Gambia’s demand for agricultural products outstripped domestic production by 0.17 million metric tons; this increased to 0.62 million metric tons in 2019. This can partly be attributed to the declining interest in the agricultural sector reflected in the falling share of total employment. From 1990 to 2019, the sector’s share of total employment reduced significantly by 10 percentage points from 37.7% to 27.7%. The decline in interest in farming is due to lack of fertilisers and farming tools and the insufficient demand for farm produce. Farmers depend heavily on government supplies of fertilisers, tools and effective demand for their produce, and government failure to meet any of the two results in a failed season. Although the yield per hectare for crops is expected to increase from 1.2 metric tons in 2019 to 1.6 metric tons in 2043, the gap between demand and production will widen. By 2043, demand will outstrip domestic production by about 1.8 million metric tons, representing a 185% increase over the period, and growing concerns about food security.
There are numerous methodologies and approaches to defining poverty. We measure income poverty and use GDP per capita as a proxy. In 2015, the World Bank adopted the measure of US$1.90 per person per day (in 2011 international prices), also used to measure progress towards the achievement of Sustainable Development Goal 1 of eradicating extreme poverty. To account for extreme poverty in richer countries occurring at slightly higher levels of income than in poor countries, the World Bank introduced three additional poverty lines in 2017:
- US$3.20 for lower middle-income countries
- US$5.50 for upper middle-income countries
- US$22.70 for high-income countries.
As a low-income country, The Gambia uses the US$1.90 benchmark as the poverty line. As of 2019, there were over 0.25 million people, constituting about 10.8% of the Gambian population, who lived in extreme poverty. However, there are disparities in the poverty levels between rural and urban areas in the country. Poverty levels are higher in the rural areas compared to the urban centres. According to The Gambia Bureau of Statistics Integrated Household Survey of 2015/16, while urban poverty was about 8.4%, rural poverty was as high as 35.9%. Most poor people in rural areas work in the agricultural and fishery sectors, whereas most of the poor people in urban centres work in the informal sector; these were also mostly concentrated in the local government area of Brikama. By 2030, the proportion of people in extreme poverty is projected to be 6.3% meaning that The Gambia will miss the SDG Goal 1 target of eliminating extreme poverty. On the Current Path, it is projected that the absolute number of poor people in The Gambia will decline to 90 000 people by 2043. This represents just about 2.1% of the population, meaning that the extreme poverty rate in Gambia will be 8.7 percentage points lower and the absolute number of poor people will be 0.16 million fewer than it was in 2019. Throughout the period under consideration (2019–2043), the proportion of poor people in The Gambia is far lower than the average for low-income countries in Africa such that by 2043, the extreme poverty rate in The Gambia will be 23.1 percentage points below the projected average for low-income countries in Africa. This relatively low level of poverty can partly be attributed to the implementation of several poverty reduction reforms such as the first Strategy for Poverty Alleviation (SPA I) in 1994, The Gambia Vision 2020, the Poverty Reduction Strategy Papers, and the National Development Plan 2018–2021. These have contributed to the declining levels of poverty in the country.
The IFs platform forecasts six types of energy, namely oil, gas, coal, hydro, nuclear and other renewables. To allow comparisons between different types of energy, the data is converted into billion barrels of oil equivalent (BBOE). The energy contained in a barrel of oil is approximately 5.8 million British thermal units (MBTUs) or 1 700 kilowatt-hours (kWh) of energy.
Gas is the dominant energy produced in The Gambia. In 2019, total production of gas amounted to 2.5 million BOE, representing 87.5% of total energy production in the country. However, the share of gas in total energy production is estimated to decline to 52% in 2043. Likewise, the share of hydro in total energy production is projected to decline from 8.3% in 2019 to 4% in 2043. Although nuclear energy production in the country will marginally increase from 0.1 million BOE in 2019 to 0.2 million BOE in 2043, its share in total energy production will slightly decline from 4.2% to 4% within the same period. From 2032, it is expected that the country will begin production of other renewable energies such as solar and wind energies, which will constitute 40% of total energy production, amounting to 2 million BOE, in 2043.
Carbon is released in many ways, but the three most important contributors to greenhouse gases are carbon dioxide (CO2), carbon monoxide (CO) and methane (CH4). Since each has a different molecular weight, IFs uses carbon. Many other sites and calculations use CO2 equivalent.
The Gambia is one of the countries in Africa with significantly low levels of carbon emissions. Regardless, carbon emissions are projected to increase steadily from nearly zero in 1990 to 1 million tons in 2043 on the Current Path. Lower levels of carbon emissions in the country may be as a result of measures taken by the Gambian government such as introducing agroforestry and improved soil management, adopting solar and wind energy for rural electrification, as well as recovering gases from composite waste and landfills.
Sectoral Scenarios for Gambia Development Futures
Download to pdfThe Stability scenario represents reasonable but ambitious reductions in risk of regime instability and lower levels of internal conflict. Stability is generally a prerequisite for other aspects of development and this would encourage inflows of foreign direct investment (FDI) and improve business confidence. Better governance through the accountability that follows substantive democracy is modelled separately.
The intervention is explained here in the thematic part of the website.
In 2019, The Gambia’s score on the governance security index was 0.72, which was higher than the average of 0.64 for low-income countries in Africa. The Gambia has enjoyed some form of stability compared to other low-income African countries. From independence in 1965, The Gambia was governed under the leadership of Sir Dawda Kairaba Jawara until 1994 when he was toppled in a military coup led by Yahya Jammeh. After coming into power, President Jammeh transformed himself into a democrat by embarking on some constitutional reforms. Key among them were the adoption of a new constitution in 1997 and the electoral reforms that ensued, although elections were reportedly fraught with corruption and human right abuses to ensure a favourable outcome for the incumbent. In 2019, all the major opposition parties formed an alliance led by Adama Barrow to contest the national election, resulting in a surprise victory to end the 22-year rule of Yahya Jammeh. After two months of protest, President Jammeh was forced to step down and flee into exile. This development marked a new era of democratic consolidation and stability in the country. In 2019, President Barrow formed a new political party, the National People’s Party, which would enable him to seek re-election in 2021. However, a new constitution that proposed a two-term limit for Presidency was rejected by the Gambian Parliament in September 2020, stalling any possible constitutional reforms in the country. In the Stability scenario, The Gambia’s score on the governance security index is projected to rise from 0.72 to 0.86 in 2043, which is 0.08 points above the Current Path forecast of 0.78 in the same year. This is also 0.15 higher than the projected average of 0.71 for low-income countries in Africa.
In 2019, the GDP per capita for The Gambia was US$2 600, which was US$940 more than the average for low-income countries in Africa. In the Stability scenario, GDP per capita is projected to increase to US$5 114 by 2043. This will be US$165 more than the Current Path forecast and US$1 324 above the average for low-income countries in Africa. With the exit of the former President Jammeh and the expected political and institutional reforms by the incumbent administration, investor confidence in the Gambian economy is expected to increase, and this augurs well for FDI inflows to boost economic growth.
Being a low-income country, The Gambia uses the global poverty benchmark of US$1.90. In 2019, the number of poor people living on less than US$1.90 per day was around 250 000, equivalent to about 10.8% of the population. The Stability scenario will reduce the portion of people living below the poverty line to 1.8% by 2043, which is 0.3 percentage points below the Current Path forecast and 23.4 percentage points below the projected average for low-income countries in Africa. Also, the number of poor people will decline to 79 000 by 2043 in the Stability scenario. This means that the materialisation of the Stability scenario could lead to 12 000 fewer poor people in 2043 than the Current Path.
This section presents the impact of a Demographic scenario that aims to hasten and increase the demographic dividend through reasonable but ambitious reductions in the communicable-disease burden for children under five, the maternal mortality ratio and increased access to modern contraception.
The intervention is explained here in the thematic part of the website.
Demographers typically differentiate between a first, second and even a third demographic dividend. We focus here on the contribution of the size of the labour force (between 15 and 64 years of age) relative to dependants (children and the elderly) as part of the first dividend. A window of opportunity opens when the ratio of the working-age population to dependants is equal to or surpasses 1.7.
In 2019, the ratio of the working-age persons to dependants in The Gambia was 1.1:1, meaning that there were 1.1 working-age persons for each dependant in the country. This is lower than the average of 1.2 for low-income countries in Africa. Generally, the demographic dividend, which is the economic growth generated by changes in a country’s population structure, materialises when the country reaches a minimum ratio of 1.7 working-age persons for each dependant. The country will not reach its demographic dividend by 2043 in both the Current Path forecast and the Demographic scenario, although the latter leads to quicker improvement in the demographic dividend. In the Demographic scenario, the number of working-age persons to dependants is projected to be 1.63 by 2043 which is 0.07 less than the minimum ratio required for the materialisation of the demographic dividend. It is also below the projected average of 1.74 for low-income countries in Africa; however, this is higher than the Current Path forecast of 1.52 in the same year.
The infant mortality rate is the number of infant deaths per 1 000 live births and is an important marker of the overall quality of the health system in a country.
The infant mortality rate in The Gambia in 2019 was 29.9 deaths per thousand live births, meaning that for every 1 000 infants that were born, about 30 died. This figure is lower than the average of 48.5 for low-income countries in Africa. By 2043, the Demographic scenario will lead to a decline in infant mortality to 9.4 deaths per thousand live births, which is 2.6 lower than the Current Path forecast and 2.1 above than the average for low-income countries in Africa.
In 2019, the GDP per capita for The Gambia was US$2 600, which was US$940 higher than the average for low-income African countries. By 2043, it is estimated that based on the Demographic scenario, the GDP per capita will increase to US$5 060, which is US$110 more than the projected US$4 950 on the Current Path in the same year. However, this will still be significantly higher than the US$3 790 average for low-income countries in Africa. The additional increase in GDP per capita as a result of the Demographic scenario may be as a result of the reduction in population growth due to the decline in fertility rates emanating from improved access to contraceptives. It can also be attributed to economic growth arising from the materialisation of the demographic dividend.
As noted earlier, the number of people in The Gambia living below the poverty line of US$1.90 in 2019 was 250 000. Based on the Demographic scenario, this number will steadily decline to 80 000 people in 2043 which will be 10 000 people less than in the Current Path forecast. Similarly, the proportion of the poor population can be reduced to 1.9% in the Demographic scenario, which is about 0.2 percentage points lower than the Current Path forecast and 23.3 percentage points lower than the average for low-income countries in Africa in 2043. The decline in both the number and portion of poor people based on the Demographic scenario reflects the decline in population as a result of the use of modern contraceptives that reduce fertility rates. The reduction of the size of the cohort of children under the age of 15 will also enable households to invest in education and health for human capital formation and poverty reduction.
This section presents reasonable but ambitious improvements in the Health/WaSH scenario, which include reductions in the mortality rate associated with both communicable diseases (e.g. AIDS, diarrhoea, malaria and respiratory infections) and non-communicable diseases (NCDs) (e.g. diabetes), as well as improvements in access to safe water and better sanitation. The acronym WaSH stands for water, sanitation and hygiene.
The intervention is explained here in the thematic part of the website.
The increase in life expectancy can be as a result of a reduction in mortality that is caused by communicable and non-communicable diseases. It can also be achieved through improved sanitation and access to safe water. The life expectancy at birth for the average Gambian was 68.9 years in 2019, which was above the average of 63.8 for low-income countries in Africa. On average, females have a higher life expectancy at birth, at 71 years, than males, at 66.9 years. Based on the Health/WaSH scenario, life expectancy is estimated to increase to about 75.2 by 2043, which is slightly above the Current Path forecast of 75.1 and above the average of 71.4 for low-income African countries. This increased life expectancy in the country can be attributed to the expected improvement in access to safe water and sanitation, as well as a reduction in mortality from communicable diseases. However, death from non-communicable diseases continues to be a problem. Females will continue to have a higher life expectancy than males with a difference of over five years by 2043.
The Agriculture scenario represents reasonable but ambitious increases in yields per hectare (reflecting better management and seed and fertiliser technology), increased land under irrigation and reduced loss and waste. Where appropriate, it includes an increase in calorie consumption, reflecting the prioritisation of food self-sufficiency above food exports as a desirable policy objective.
The intervention is explained here in the thematic part of the website.
The data on yield per hectare (in metric tons) is for crops but does not distinguish between different categories of crops.
In 2019, the average yield per hectare for crops was 1.2 metric tons per hectare, which was below the average of 2.7 metric tons per hectare for low-income countries in Africa. Based on the Current Path forecast, this is projected to increase to 1.6 metric tons per hectare by 2043. In the Agriculture scenario, the average yield will be 3.3 metric tons per hectare. This means that if the country is able to adopt modern methods of farming including the use of fertilisers and improved seeds, there will be a resulting increase of an extra 1.8 metric tons per hectare compared to the Current Path forecast in 2043. However, this figure is lower than the projected average of 5.5 for low-income African countries in the same period.
The Gambia has a very high import dependency. Despite the fact that agricultural land accounts for 54% of total land in the country, the country still imports half of its food requirement. For instance, though The Gambia has one of the highest per capita consumption rates of rice in Africa, local production accounts for only a fraction of this consumption. This has left a huge market for imported rice in the country. In 2019, the net agricultural import was half of agricultural demand in the country, which was far above the average for low-income countries in Africa. Agricultural products often imported into the country include chicken cuts, edible offal, and sauces and condiments. Challenges facing agriculture in The Gambia include inadequate infrastructure, soil fertility depletion, lack of access to credit and fluctuating and low agriculture commodity prices as opposed to high prices of imported production input. However, there have been some interventions in the sector aimed at promoting agricultural development in the country. For instance, the World Bank recently approved US$40 million to support smallholder farmers and agribusinesses in the country. The Current Path forecast is that import dependence will grow to 63.2% of total demand. The situation is mitigated in the Agriculture scenario such that by 2043, the country will be a net importer of agricultural products with a balance of 38.9% of total agricultural demand. However, this balance will be higher than the average for low-income countries by about 40 percentage points, which is expected to be a net exporter with a balance of 0.8%.
The Agriculture scenario is expected to lead to an increase in GDP per capita over the years. By 2043, GDP per capita as a result of the Agriculture scenario will increase from US$2 600 in 2019 to US$5 404, constituting about 107.8% increase over the period. These estimates are greater than the projections in the Current Path forecast so that by 2043, the additional gains from GDP per capita as a result of the Agriculture scenario will be US$454. In the Agriculture scenario, The Gambia’s GDP per capita will still remain above the average for low-income countries in Africa. Indeed, the gap in GDP per capita between The Gambia and its peer group is projected to widen positively in the Agriculture scenario.
Implementing good agricultural policies that will result in increased yield per hectare and reduction in waste appear to have a significant impact on poverty reduction in the country. Based on the Current Path forecast, 90 000 people, representing 2.1% of the population, are projected to be extremely poor by 2043. However, based on the Agriculture scenario, the number of people below the poverty line of US$1.90 will be reduced to 60 000, constituting 1.4% of the population. This means that 30 000 additional Gambians can be lifted out of extreme poverty primarily by focusing on agricultural growth. Throughout the period, in the Agriculture scenario, the proportion of people living in extreme poverty in The Gambia will be lower than the average for low-income countries in Africa although the gap closes up. By 2043, the poverty rate in The Gambia will be 23.8 percentage points below the average for low-income countries in Africa.
The Education scenario represents reasonable but ambitious improved intake, transition and graduation rates from primary to tertiary levels and better quality of education. It also models substantive progress towards gender parity at all levels, additional vocational training at secondary school level and increases in the share of science and engineering graduates.
The intervention is explained here in the thematic part of the website.
Some of the challenges facing the education sector in The Gambia include low enrolment even at the basic levels, low performance in learning outcomes, inadequate teaching and learning materials and educational infrastructure especially at higher levels of education. Many families especially in the rural areas cannot also afford higher education for their children. In 2019, The Gambia’s mean years of education was 4.7, which was above the average of 4.4 for low-income countries on the continent. In terms of gender, the mean years of education for males is 5.1, which is 0.8 years more than the female average of 4.3. This means that on average, men are more likely to attain higher education than women. The gender inequality in school enrolment is partly due to cultural and social norms that limit education for girls. Many young women are also forced into early marriages that truncate their educational attainment. This gap in favour of men for mean years of education in The Gambia is lower than the average of 1.3 years for low-income countries in Africa. By 2043, in the Education scenario, it is expected that the mean years of education will rise to 7.1 years, which will be 0.4 years more than the Current Path estimates and 0.5 years more than the average for low-income countries in Africa. Also, based on the Education scenario forecast, the gender gap regarding mean years of education in The Gambia will close by 0.3 years by 2043, while the gender gap between The Gambia and the average low-income country in Africa will close by 0.5 years within the same period.
The average test score for primary learners in The Gambia for 2019 was 25%, which is lower than the 27.7% average for low-income countries in Africa, signifying a relatively lower performance in this regard. The Education scenario will increase the average test scores for primary learners to 36.8%, compared to the Current Path scenario estimated at 31.4% in 2043. Also, the Education scenario for 2043 will result in test scores which are 1.2 percentage points higher than the average for Africa low-income countries.
In 2019, the average secondary learner test score for The Gambia was 36.1%, which was slightly above the average of 35.8% for low-income African countries. This suggests that The Gambia performs relatively better at the secondary level than at the primary level. By 2043, the average test score for secondary learners is projected to rise to 48.7%, which is above the Current Path estimates of 40.5% and the average of 37.8% for low-income countries in Africa.
By 2043, GDP per capita as a result of the Education scenario is estimated to be US$185 more than the projected US$4 950 in the Current Path forecast, suggesting that investment in education is an important tool for productivity, growth and income prospects. This will also be US$1 212 more than the average of US$3 923 for low-income countries in Africa.
In the Education scenario, by 2043 it is projected that the number of poor people will be 70 000, representing 1.7% of the population. This means that the Education scenario will contribute to reducing the number of poor people by 20 000 in 2043 compared to the Current Path forecast. This is expected given that households in The Gambia whose heads of the household with no educational background are much poorer than households whose heads have had some form of formal education, suggesting that education is an important tool for poverty reduction. Also, the proportion of poor people based on the Education scenario in The Gambia will be 23.5 percentage points lower than the average for low-income countries in Africa.
The Manufacturing/Transfers scenario represents reasonable but ambitious manufacturing growth through greater investment in the economy, investments in research and development, and promotion of the export of manufactured goods. It is accompanied by an increase in welfare transfers (social grants) to moderate the initial increases in inequality that are typically associated with a manufacturing transition. To this end, the scenario improves tax administration and increases government revenues.
The intervention is explained here in the thematic part of the website.
Chart 30 should be read with Chart 8 that presents a stacked area graph on the contribution to GDP and size, in billion US$, of the Current Path economy for each of the sectors.
Based on the Manufacturing/Transfer scenario, the service sector will be the largest contributor to GDP with an absolute contribution of US$0.57 billion more by 2043 compared to the Current Path forecast. The rate of contribution to GDP by the service sector will increase until it peaks at 0.39 percentage points difference in 2039 and marginally declines to 0.24 percentage points in 2043. The manufacturing sector, which is the second largest contributor, is also projected to contribute an additional US$0.16 billion to GDP by 2043 with a rate of contribution of 0.13 percentage points difference to GDP based on the Manufacturing/Transfer scenario. The third largest contributor to GDP in The Gambia is ICT, with a contribution of US$0.07 billion; however, its rate of contribution will slightly overtake manufacturing to become the second largest so that by 2043, the ICT sector will contribute 0.05 percentage points more to GDP than the manufacturing sector. It is significant to note that agriculture’s contribution to GDP in the Manufacturing/Transfer scenario is lower than the Current Path forecast from 2027 to 2043.
The Gambian government’s welfare transfer to households is significantly low. In 2019, total welfare transfer to households was US$0.03 billion, far below the average of US$7.4 billion for low-income countries in Africa. The welfare system in The Gambia is weak, with retirement benefits available to only a small proportion of the population, usually those who have worked for more than ten years in a government or selected private institution. Other social welfare packages such as unemployment benefits and compensation for workplace injuries are mostly non-existent and even where available, benefit only a few. The amount of welfare transfer is projected to increase to US$0.57 billion by 2043 in the Manufacturing/Transfer scenario, which is higher than the US$0.33 billion estimated for 2043 based on the Current Path. This suggests that the Manufacturing/Transfer scenario can lead to an improvement in government welfare transfers by an additional US$0.24 billion compared to the Current Path in 2043.
By 2043, it is estimated that The Gambia’s GDP per capita will rise to US$5 215, which is US$265 higher than projections from the Current Path. The GDP per capita for The Gambia by 2043 in the Manufacturing/Transfer scenario will also be higher than the average of US$3 790 for low-income countries in Africa.
The Manufacturing/Transfer scenario will lead to a decline in absolute number of poor people to 60 000 compared to the 90 000 people in the Current Path forecast in 2043; this is equivalent to 30 000 fewer poor people than in the Current Path forecast in 2043. This means that if the country embarks on policies aimed at building a robust manufacturing sector, it will contribute to creating jobs and reducing poverty in The Gambia. The poverty rate in The Gambia based on the Manufacturing/Transfer scenario will be about 1.3% in 2043, which is 0.81 percentage points below the Current Path forecast and 23.9 percentage points below the average for low-income countries in Africa.
The Leapfrogging scenario represents a reasonable but ambitious adoption of and investment in renewable energy technologies, resulting in better access to electricity in urban and rural areas. The scenario includes accelerated access to mobile and fixed broadband and the adoption of modern technology that improves government efficiency and allows for the more rapid formalisation of the informal sector.
The intervention is explained here in the thematic part of the website.
Fixed broadband includes cable modem Internet connections, DSL Internet connections of at least 256 KB/s, fibre and other fixed broadband technology connections (such as satellite broadband Internet, ethernet local area networks, fixed-wireless access, wireless local area networks, WiMAX, etc.).
In 2019, the total number of fixed broadband subscriptions was 3.1 per 100 people, which was slightly above the average for low-income countries in Africa. In the Current Path forecast, fixed broadband subscriptions are expected to rise to 45.9 per 100 people. The Leapfrogging scenario will lead to a much greater increase in fixed broadband subscriptions compared to the Current Path forecast, with a difference of 4 subscriptions per 100 people compared to the Current Path in 2043. Across the forecast horizon, fixed broadband subscriptions in The Gambia are expected to be higher than the average for low-income African countries.
Mobile broadband refers to wireless Internet access delivered through cellular towers to computers and other digital devices.
The Gambia had a mobile broadband subscription of 32.9 per 100 people in 2019, which was more than the average of 22.9 for low-income countries on the continent. Although in the short term mobile broadband subscriptions in the Leapfrogging scenario rise quickly above the Current Path, in the long term, the Leapfrogging and Current Path scenarios converge. By 2043, mobile broadband subscriptions in the Current Path forecast and the Leapfrogging scenario increase to 153.6 and 156.2 per 100 people respectively, greater than the average of 133.9 per 100 people for Africa’s low-income countries.
The number of Gambians who had access to electricity in 2019 was 1.4 million people, representing 52.3% of the total population. This is above the average of 32.2 for low-income countries in Africa. The country has a large rural–urban disparity in terms of access to electricity. In 2019, about 70.7% of people in urban centres had access to electricity, compared to the paltry 36.1% of those in rural areas. In the Leapfrogging scenario it is projected that by 2043 about 90.9% of the Gambian population, constituting about 4 million people, will have access to electricity. This is above the projected average for low-income countries. It is also higher than the 80.9%, reflecting 3.6 million people, projected on the Current Path forecast, signifying that the Leapfrogging scenario can provide access to electricity to an additional 400 000 people. By 2043, 92% and 86.1% of urban residents will have access to electricity in the Leapfrogging scenario and Current Path forecast respectively. In the case of rural dwellers, 88.2% and 67.7% will have access to electricity by 2043 based on the Leapfrogging scenario and the Current Path forecast respectively. This means that the gap between rural and urban residents in terms of access to electricity closes more quickly in the Leapfrogging scenario.
The Gambia’s GDP per capita is projected to increase from US$2 600 in 2019 to US$5 350 in 2043 based on the Leapfrogging scenario. This represents an increase of US$400 compared to the Current Path forecast in 2043. It is also higher than the projected average of US$3 790 for low-income countries in Africa.
Based on the Leapfrogging scenario, the number of poor people in 2043 is projected to be 70 000, representing 1.6% of the population. This projection is lower than the 90 000 people estimated in the Current Path forecast in the same year, which suggests that the number of poor people in the Leapfrogging scenario is about 20 000 people fewer than the Current Path forecast in 2043. The number of poor people projected in the Leapfrogging scenario is 23.6 percentage points lower than the average for low-income African countries.
The Free Trade scenario represents the impact of the full implementation of the African Continental Free Trade Area (AfCFTA) by 2034 through increases in exports, improved productivity and increased trade and economic freedom.
The intervention is explained here in the thematic part of the website.
The trade balance is the difference between the value of a country's exports and its imports. A country that imports more goods and services than it exports in terms of value has a trade deficit, while a country that exports more goods and services than it imports has a trade surplus.
The Gambia, like many African economies, is a net importer of goods and services. In 2019, The Gambia’s trade deficit represented 20.3% of GDP. This large deficit is partly due to the import of food items such as chicken, sauces, and condiments and seasonings. The Gambia will begin to see a deterioration in its trade balance in both the Current Path forecast and the Free Trade scenario, although the situation is worse in the former. This downward trend will continue until it reaches a peak of a deficit of about 26.1% and 28.2% of GDP in 2030 in the Free Trade scenario and the Current Path forecast respectively. However, afterwards, the country will witness an improvement in its balance until it peaks again at 15.4% in the Free Trade scenario in 2038 and 15.8% in 2040 in the Current Path forecast. By 2043, the projected trade deficit will be 18.5% of GDP in the Free Trade scenario, which is higher than the projected 16.5% of GDP in the Current Path forecast. This implies that the full implementation of the AfCFTA can improve the trade balance of The Gambia in the short term. However, in the long term, intense competition from other African countries will worsen the country’s trade balance. Throughout the period under consideration, The Gambia’s trade deficit as a percentage of GDP is higher than the average for low-income African countries.
The GDP per capita for The Gambia is estimated to increase to US$5 568 by 2043 in the Free Trade scenario, which is US$618 more than the projections of the Current Path in 2043. This means that if The Gambia takes advantage of the AfCFTA to increase trade and productivity, it can achieve an extra US$618 increase in GDP per capita compared to the Current Path forecast in 2043. It is US$1 768 higher than the average GDP per capita of US$3 790 for low-income African countries in the Free Trade scenario.
By 2043, the number of people living below the poverty line of US$1.90 will be about 60 000, representing 1.4% of the population. This is 0.7 percentage points lower than the Current Path forecast, meaning that the Free Trade scenario has 30 000 fewer poor people than the Current Path by 2043. The proportion of the poor people projected in the Free Trade scenario is still lower than the projected average poverty rate of 25.2% for low-income countries in Africa in 2043.
The Financial Flows scenario represents a reasonable but ambitious increase in worker remittances and aid flows to poor countries, and an increase in the stock of foreign direct investment (FDI) and additional portfolio investment inflows to middle-income countries. We also reduced outward financial flows to emulate a reduction in illicit financial outflows.
The intervention is explained here in the thematic part of the website.
Generally, the total foreign aid received by The Gambia has been high. The total foreign aid received by The Gambia in 2019 represented 14.1% of GDP, which was above the average of 8.6% for low-income countries in Africa. The total aid received by the country in 2017 alone was about US$284.49 million. The influx of foreign aid into the country after the defeat of former President Jammeh and the assumption of office by President Barrow may be a signal of the support of international communities and donor countries for the new government. Foreign aid as a percentage of GDP is however expected to decline such that by 2043 the total foreign aid received by the country will be 8.2% of GDP in the Financial Flows forecast and 7.3% of GDP in the Current Path forecast. This suggests that in the Financial Flow scenario, foreign aid as a percentage of GDP is higher than the Current Path forecast in 2043. Furthermore, these projections are still above the average for a low-income African country. The decline in foreign aid can be due to the projected growth and expansion anticipated to occur in the future, resulting in the country moving from lower income status to lower middle-income. That will automatically disqualify the country from certain aid packages, as the bulk of aid goes to low-income countries.
The Gambia’s total FDI in 2019 amounted to 6.3% of GDP, which was higher than the average of 4.3% for low-income African countries. Some of the measures that have been introduced to attract FDI into the country include extended tax exemptions for qualifying investments in priority sectors and one-stop shops for business registration. However, institutional and administrative weaknesses are some of the factors that hinder the inflow of FDI into the country. These barriers are worsened by the corruption and inefficiencies associated with doing business in the country, as well as poor infrastructural networks and high interest rates in the country. By 2043, it is projected that total FDI to the country will be about 7.0% of GDP in the Current Path forecast. In the Financial Flows scenario, FDI is projected to be around 7.8% of GDP in 2043, which is also above the average for low-income countries on the continent.
In 2019, the total value of remittances that The Gambia received amounted to US$0.15 billion, which constituted about 7.2% of GDP. This is significantly higher than the average for low-income African countries. While the absolute value of remittance is projected to increase over the period, remittances as a percentage of GDP will fall initially but eventually rise to a peak in 2033 before declining again. In the Financial Flows scenario, remittance is projected to increase to US$0.80 billion, representing 7.7% of GDP. Remittances will decline quicker in the Current Path forecast, so that by 2043 the total value of remittances in the country will be about US$0.67 billion, representing 6.8% of GDP.
The Gambia’s GDP per capita is estimated to increase to US$5 084 by 2043 in the Financial Flows scenario. This represents an increase of US$134 over the Current Path projection in the same year. The US$5 084 estimate is also above the average for low-income countries in Africa, which is projected to be US$3 790 by 2043.
Trade openness will reduce poverty in the long term after initially increasing it due to the redistributive effects of trade. Most African countries export primary commodities and low-tech manufacturing products, and therefore a continental free trade agreement (AfCFTA) that reduces tariffs and non-tariff barriers across Africa will increase competition among countries in primary commodities and low-tech manufacturing exports. Countries with inefficient, high-cost manufacturing sectors might be displaced as the AfCFTA is implemented, thereby pushing up poverty rates. In the long term, as the economy adjusts and produces and exports its comparatively advantaged (lower relative cost) goods and services, poverty rates will decline.
Based on the Financial Flows scenario, in 2043 the total number of people projected to live below the poverty line of US$1.90 will decline to 70 000, representing 1.7% of the total population. This estimate constitutes a reduction of about 20 000 people compared to the Current Path forecast in the same year. It is also far below the average of 25.2% of the total population projected for low-income countries in Africa.
The Infrastructure scenario represents a reasonable but ambitious increase in infrastructure spending across Africa, focusing on basic infrastructure (roads, water, sanitation, electricity access and ICT) in low-income countries and increasing emphasis on advanced infrastructure (such as ports, airports, railway and electricity generation) in higher-income countries.
Note that health and sanitation infrastructure is included as part of the Health/WaSH scenario and that ICT infrastructure and more rapid uptake of renewables are part of the Leapfrogging scenario. The interventions there push directly on outcomes, whereas those modelled in this scenario increase infrastructure spending, indirectly boosting other forms of infrastructure, including that supporting health, sanitation and ICT.
The intervention is explained here in the thematic part of the website.
The total number of people with access to electricity in The Gambia is 1.4 million, representing 57.3% of the population, which is above the average for low-income countries in Africa. In the Infrastructure scenario, in 2043 this is expected to increase to 3.9 million, constituting 89.1% of the population. This increase exceeds the projected value of 3.6 million people, representing 80.1% of the population, in the Current Path forecast. In terms of rural–urban dichotomy, by 2043, it is projected that 86.1% and 92% of urban dwellers will have access to electricity in the Current Path forecast and the Infrastructure scenario respectively, and 81.7% and 67.7% of rural dwellers in the Infrastructure scenario and the Current Path forecast respectively will have access to electricity in 2043. This suggests a disparity in access to electricity between urban and rural dwellers in both the Current Path and the Infrastructure scenario.
Indicator 9.1.1 in the Sustainable Development Goals refers to the proportion of the rural population who live within 2 km of an all-season road and is captured in the Rural Access Index.
Accessibility to rural areas is important in encouraging the socio-economic development of a country and improving the living standards of people living in rural areas as it enables rural dwellers to enjoy amenities from nearby urban areas while allowing urban centres to benefit more easily from the agricultural products supplied by rural areas. In 2019, 58.7% of all rural dwellers in The Gambia resided within 2 km of an all-weather road, which was higher than the average of 43% for low-income African countries. In the Infrastructure scenario, this is expected to rise to 72.1% by 2043, higher than the 66.6% projected in the Current Path forecast and the average of 51% for low-income countries in Africa.
The Gambia’s GDP per capita is estimated to rise to US$5 049 by 2043 in the Infrastructure scenario. This is US$99 more than the projection in the Current Path forecast in the same year and above the average of US$3 790 for low-income countries in Africa.
The proportion of the poor population is expected to decline from 10.7% in 2019 to 2%, corresponding to 90 000 poor people, in 2043 in the Infrastructure scenario. Comparing this with the projections in the Current Path suggests that there will be 6 000 fewer poor people in the Infrastructure scenario than in the Current Path forecast for the same year, which is far below the estimated average of 25.2% for low-income countries in Africa in 2043.
The Governance scenario represents a reasonable but ambitious improvement in accountability and reduces corruption, and hence improves the quality of service delivery by government.
The intervention is explained here in the thematic part of the website.
As defined by the World Bank, government effectiveness ‘captures perceptions of the quality of public services, the quality of the civil service and the degree of its independence from political pressures, the quality of policy formulation and implementation, and the credibility of the government’s commitment to such policies’.
Chart 51 presents the impact of the interventions in the Governance scenario on government effectiveness.
In 2019, The Gambia’s score in government effectiveness was 1.64 out of a maximum of 5, which was above the average of 1.37 for low-income countries in Africa. In both the Current Path forecast and the Governance scenario, government effectiveness is estimated to increase over the period, although the increase in the Governance scenario is higher than the increase in the Current Path forecast. The projected score for government effectiveness in the Governance scenario by 2043 is 2.33, which is 0.16 more than projected score in the Current Path forecast. Also, The Gambia’s score for 2043 will be higher than the projected average of 1.9 for low-income countries in Africa.
In the Governance scenario, The Gambia’s GDP per capita is projected to increase to US$5 088 in 2043, which is US$138 more than the estimates in the Current Path forecast and higher than the average for low-income countries on the continent in the same year. This suggests that good governance in the forms of reducing corruption, improvement in quality of service delivery and accountability can lead to an additional US$138 in GDP per capita compared to the Current Path forecast in 2043.
The proportion of people living below the poverty line of US$1.90 is expected to decline to 1.9% in 2043 in the Governance scenario, which is far below the 25.2% average for low-income African countries, and corresponds to about 10 000 people fewer than the 90 000 poor people projected in the Current Path forecast for 2043.
This section presents projections for carbon emissions in the Current Path for [The Gambia] and the 11 scenarios. Note that IFs uses carbon equivalents rather than CO2 equivalents.
In 2019, the total carbon emissions in The Gambia were 220 000 tons. This is projected to increase to about 1.7 million tons of carbon in the Combined Agenda 2063 scenario as The Gambia’s carbon emissions are projected to increase in all the scenarios. The intervention with the greatest impact on carbon emissions is the Free Trade scenario, which will lead to The Gambia’s carbon emissions being 1.38 million tons by 2043. This is followed by the Agriculture and Manufacturing/Transfer scenarios with carbon emissions reaching 1.34 and 1.30 million tons respectively by 2043. The interventions with the least impact on carbon emission are the Demographic and Infrastructure scenarios respectively.
The Combined Agenda 2063 scenario consists of the combination of all 11 sectoral scenarios presented above, namely the Stability, Demographic, Health/WaSH, Agriculture, Education, Manufacturing/Transfers, Leapfrogging, Free Trade, Financial Flows, Infrastructure and Governance scenarios. The cumulative impact of better education, health, infrastructure, etc. means that countries get an additional benefit in the integrated IFs forecasting platform that we refer to as the synergistic effect. Chart 55 presents the contribution of each of these 12 components to GDP per capita in the Combined Agenda 2063 scenario as a stacked area graph.
The synergistic effect of all the scenarios on GDP per capita is estimated to be about US$294 in 2043. The scenario with the greatest impact on GDP per capita by 2043 is the Free Trade scenario followed by the Agriculture scenario, while the scenarios with the least impact on GDP per capita are Health/WaSH and Infrastructure. This suggests that policies aimed at improving agricultural production and trade liberalisation will significantly improve human and economic development in The Gambia.
Whereas Chart 55 presents a stacked area graph on the contribution of each scenario to GDP per capita as well as the additional benefit or synergistic effect, Chart 56 presents only the GDP per capita in the Current Path forecast and the Combined Agenda 2063 scenario.
The Gambia’s GDP per capita is estimated to increase to US$7 823 in 2043 in the Combined Agenda 2063 scenario. This is US$2 873 more than the projection based on the Current Path forecast. Also, The Gambia’s GDP per capita in the Combined Agenda 2063 scenario will still be above the projected average of US$3 790 for low-income countries in Africa by 2043.
In the Combined Agenda 2063 scenario, the number of poor people will significantly decline such that by 2043, only 6 000 Gambians, representing 0.15% of the population, will be living below the poverty line. This means that, compared to the Current Path, an additional 85 000 Gambians can be lifted out of extreme poverty in the Combined Agenda 2063 scenario.
See Chart 8 to view the Current Path forecast of the sectoral composition of the economy.
In the Combined Agenda 2063 scenario, the biggest contributors to GDP in the long term are the service, manufacturing and agriculture sectors. By 2043, the service sector will contribute an additional 0.3 percentage points to GDP, which corresponds to US$5.7 billion. Although manufacturing contributes US$1.4 billion, in terms of percentage of GDP, its contribution is lower than in the Current Path forecast. The agriculture sector contributes 0.02 percentage points less to GDP by 2043, which is equivalent to about US$0.62 billion.
The estimated GDP (MER) for 2043 in the Combined Agenda 2063 scenario will be US$18.5 billion, which is higher than the Current Path estimates of US$10 billion. This suggests that compared to the Current Path forecast, the size of the economy will almost double by 2043 in the Combined Agenda 2063 scenario. The Agenda 2063 scenario shows that a policy push across all the development sectors is necessary to achieve sustained growth and development in The Gambia.
The total amount of carbon emitted by The Gambia in 2019 was 220 000 tons. In the Combined Agenda 2063 scenario, the total carbon emissions are projected to rise to 1.7 million tons by 2043. This is higher than the estimates of 1.3 million tons in the Current Path forecast for 2043, meaning that the Combined Agenda 2063 scenario leads to much greater carbon emissions than the Current Path forecast. The materialisation of the Combined Agenda 2063 scenario would stimulate growth in The Gambia but the cost in terms of environmental degradation would be relatively high.
Page information
Contact at AFI team is Enoch Randy Aikins
This entry was last updated on 31 May 2026 using IFs v7.63.
Donors and sponsors


Reuse our work
- All visualizations, data, and text produced by African Futures are completely open access under the Creative Commons BY license. You have the permission to use, distribute, and reproduce these in any medium, provided the source and authors are credited.
- The data produced by third parties and made available by African Futures is subject to the license terms from the original third-party authors. We will always indicate the original source of the data in our documentation, so you should always check the license of any such third-party data before use and redistribution.
- All of our charts can be embedded in any site.
Cite this research
Enoch Randy Aikins (2026) Gambia Development Futures. Published online at futures.issafrica.org. Retrieved from https://futures.issafrica.org/geographic/countries/gambia/ [Online Resource] Updated 31 May 2026.