 10 Financial Flows.
Feedback welcome
Our aim is to use the best data to inform our analysis. See our Technical page for information on the IFs forecasting platform. We appreciate your help and references for improvements via our feedback form.
This theme on external financial flows in Africa explores the continent’s persistent development-financing gap and the different roles played by aid, foreign direct investment (FDI), remittances and portfolio investment. It examines recent trends in these flows, as well as debt pressures, domestic revenue mobilisation and illicit financial flows. It considers how their stability, distribution and development impact vary across Africa’s income groups.
Using the International Futures (IFs) platform, the theme presents Africa’s external financial inflows under the Current Path forecast to 2043, the end of the third term implementation of African Union (AU) Agenda 2063. It then develops an ambitious External Financial Inflows scenario that combines higher levels of aid, FDI, remittances and portfolio investment with stronger domestic absorptive capacity. The analysis assesses the impact of this scenario on economic growth, income per person, poverty, government revenue and inward FDI stock.
For more information about the International Futures (IFs) modelling platform used for scenario development, please see the Technical page.
Summary
Africa faces a persistent development-financing gap amid rising debt-service costs, tightening aid budgets and uneven access to international capital. Aid, foreign direct investment (FDI), remittances and portfolio investment remain important sources of external finance, but they differ markedly in stability, distribution and development impact. Aid remains particularly important for low-income and fragile states. FDI is volatile and concentrated, remittances have become one of the continent’s largest and most stable flows, and portfolio investment remains constrained by relatively shallow financial markets.
Using the International Futures (IFs) platform, this theme constructs an ambitious External Financial Inflows scenario to examine what could be achieved by 2043 under a more favourable financing environment combined with stronger domestic absorptive capacity. Interventions for aid, remittances, FDI and inward portfolio investment are benchmarked against Current Path levels in peer developing regions, particularly South America and South Asia.
The distribution of incremental gains relative to the Current Path differs substantially across income groups, reflecting deliberately differentiated interventions based on development level and financing needs. Low-income countries receive most of the additional aid; lower-middle-income economies account for the largest absolute increases in remittances, FDI and portfolio investment; and upper-middle-income economies are better positioned to attract more sophisticated portfolio finance and higher-value investment.
Under the External Financial Inflows scenario, Africa’s GDP will be approximately US$210 billion, or 2.6%, above the Current Path by 2043. GDP per capita will increase by about US$140, government revenue by around US$70 billion, and inward FDI stock by approximately US$228 billion. Around 21 million fewer Africans will be living below the US$3.00-a-day poverty threshold than under the Current Path. These gains underline the importance of combining greater access to external finance with stronger investment efficiency, technology absorption, institutional capability, skills utilisation and domestic productive linkages.
Africa’s financing strategy should focus not only on attracting more capital, but on increasing the productive value retained from every external financial flow. Low-income and fragile countries need continued access to grants and concessional resources; lower-middle-income economies need external finance to accelerate infrastructure development, industrialisation and regional value chains; and upper-middle-income economies increasingly need investment that supports innovation, technological upgrading and deeper capital markets. Across all groups, stronger institutions, infrastructure, skills, domestic supplier networks, tax systems and financial markets determine how much development is generated from additional external resources.
All charts for Financial Flows.
- Chart 1: Africa's aid, FDI inflows, portfolio investment inflows and remittances inflows, 1960-2043
- Chart 2: Bilateral assistance to Africa from selected bilateral donors, 2010-2024
- Chart 3: Africa’s FDI inflows and stock from selected sources, 2013-2024
- Chart 4: Estimated informal remittance inflows as a portion of total remittances, 2023
- Chart 5: Net portfolio investment balances in African countries with available data, 2025
- Chart 6: External Financial Inflows scenario
- Chart 7: Africa’s net foreign aid flows in the Current Path and External Financial Inflows scenario, 2022-2043
- Chart 8: Africa's foreign direct investment flows in the Current Path and External Financial Inflows scenario, 2022-2043
- Chart 9: Africa's net remittances in the Current Path and External Financial Inflows scenario, 2022-2043
- Chart 10: Africa's inward portfolio investment stock in the Current Path and External Financial Inflows scenario, 2022-2043
- Chart 11: Percentage increase in GDP (MER) by scenario compared to the Current Path, 2043
- Chart 12: Percentage increase in GDP per capita (PPP) by scenario compared to the Current Path, 2043
- Chart 13: Reduction in poverty by scenario compared to the Current Path, 2043
- Chart 14: Increase in government revenue per scenario compared to the Current Path, 2043
- Chart 15: Increase in inward foreign direct investment stocks compared to the Current Path per scenario, 2043
- Policy Recommendations


Africa’s development-finance challenge is shaped by both the scale of its financing needs and the structure of the resources available to meet them. Domestic revenue remains constrained, debt-service pressures are rising and financial markets remain unevenly developed, while external finance is often volatile, concentrated or costly. These pressures vary across income groups and are compounded by illicit financial outflows and weaknesses in domestic resource mobilisation. The challenge is therefore not only to mobilise more finance, but to build a financing mix that is sustainable, resilient and capable of supporting structural transformation.
Africa’s development challenge is increasingly a financing challenge. The African Development Bank (AfDB) estimates that accelerating the continent’s structural transformation requires closing an annual financing gap of about US$402.2 billion by 2030. This aggregate shortfall coexists with long-standing sectoral deficits, including an infrastructure financing gap of US$68–108 billion per year and climate-related investment needs of approximately US$250–277 billion annually. These figures illustrate why Africa cannot realistically finance its development through any single channel: domestic public revenue remains insufficient, local financial markets are generally shallow and external finance is often costly, concentrated or volatile.
These constraints differ substantially across income groups. Africa’s 22 low-income economies remain the most dependent on grants, concessional loans and remittances because they have smaller tax bases, weaker export baskets and thinner domestic financial systems. The continent's 24 lower-middle-income economies have greater scope to mobilise FDI, portfolio finance and domestic borrowing. Still, they remain highly sensitive to exchange-rate pressure, global interest rates and investor sentiment. Africa’s 8 upper-middle-income economies generally have deeper markets and greater access to commercial finance, but that access is often cyclical, costly and susceptible to sudden reversals. In accordance with the 2025/6 World Bank classifications, Seychelles is Africa’s only high-income country (Mauritius became a second in 2026/7). Continental financing policy is therefore overwhelmingly concerned with the different requirements of low-, lower-middle- and upper-middle-income countries.
The problem has become more difficult to manage because debt-service burdens have risen while access to affordable external capital has tightened. The IMF has described the region as facing a “big funding squeeze”, with shrinking concessional inflows, limited market access and rising debt-service costs. Africa owed roughly US$707.9 billion to external creditors in 2024, of which almost 42% was owed to private creditors, 37% to multilateral creditors and 21% to bilateral creditors. External debt-service payments are projected to reach a record high of approximately US$101.3 billion in 2025, then decline to about US$63.6 billion by 2030. At the same time, 95% of low-income African countries are either in or at risk of debt distress. The implications extend beyond deteriorating solvency indicators. High debt-service burdens constrain fiscal space by diverting scarce public resources away from infrastructure, health, education and other productivity-enhancing investments, potentially weakening long-term growth and reinforcing dependence on external financing.
Compared with peer-developing regions, Africa’s financing structure remains comparatively constrained. South Asia benefits from exceptionally large remittance flows supported by extensive labour-migration corridors. Latin America and the Caribbean combine substantial remittance receipts with broader access to domestic and international capital markets. East and Southeast Asia attract larger volumes of manufacturing- and export-oriented FDI, supported by dense production networks, stronger logistics systems and deeper domestic supplier bases. These comparisons reinforce the view that the development effect of external finance depends on the institutions and productive capabilities through which it is absorbed. Thus, the composition, stability and domestic linkages of financial flows matter at least as much as their aggregate volume.
Any assessment of Africa’s development-finance landscape must also acknowledge that the continent loses a considerable proportion of its own investible resources. UN Trade and Development (UNCTAD) estimates that Africa loses around US$88.6 billion annually through illicit financial flows (IFFs), equivalent to 3.7% of GDP. This amount is almost equivalent to the combined average annual aid and FDI inflows received by African countries between 2017 and 2020. Africa’s financing constraint is therefore partly self-reinforcing: governments seek to attract foreign capital while substantial domestic and foreign-owned resources simultaneously leak out through illicit channels.
IFFs are not confined to corruption in the narrow sense. They also involve trade misinvoicing, abusive transfer pricing, profit shifting, criminal markets and weak asset-recovery systems. These losses weaken public revenue, reduce foreign-exchange availability and can discourage investment in health, education and productive infrastructure. UNCTAD has estimated trade misinvoicing losses at US$30–52 billion per year, and it has shown that countries with high IFFs tend to invest less in health and education. Measures to curb IFFs should therefore be treated as an integral component of development-finance policy. Stronger tax cooperation, customs administration, ownership transparency and asset recovery could retain more domestic resources while improving the legitimacy of the investment environment.
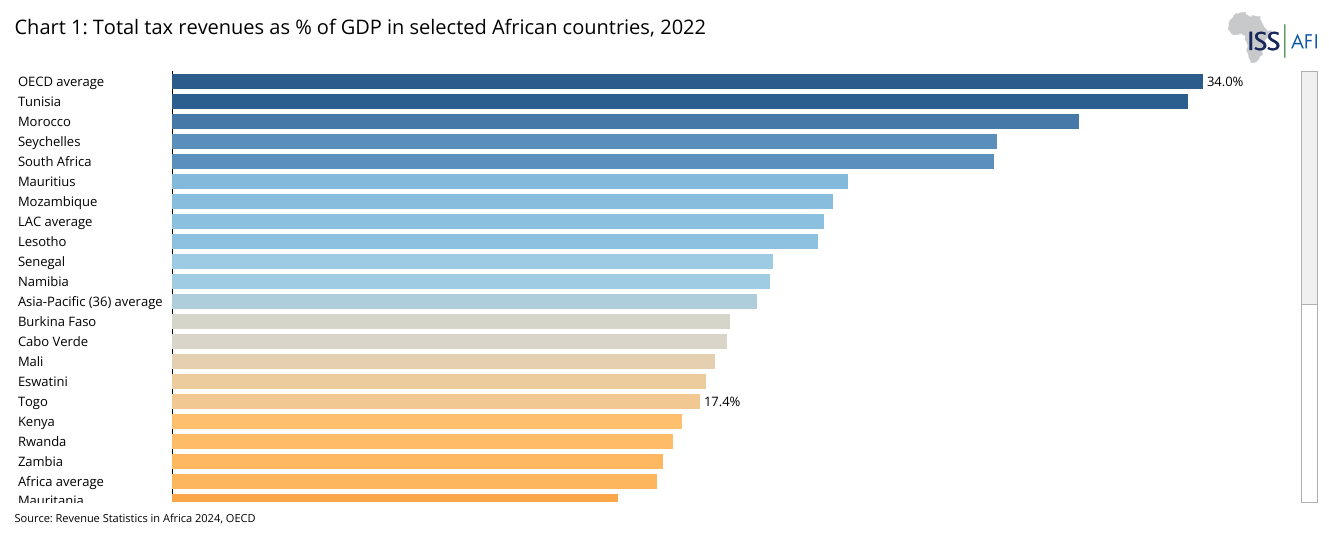
Domestic resource mobilisation remains the most sustainable source of development finance because it improves fiscal sovereignty, strengthens accountability and reduces vulnerability to external shocks. The latest Revenue Statistics in Africa, produced by the OECD, African Union Commission and African Tax Administration Forum (OECD/AUC/ATAF), show that the average tax-to-GDP ratio among the 38 participating African countries reached 16.1% in 2023, up for the third year in a row. It nevertheless remained below the averages for Asia and the Pacific (19.6%), Latin America and the Caribbean (21.3%) and the OECD (33.9%). The continental average also conceals substantial variation: tax-to-GDP ratios ranged from 2.9% in Somalia to 34% in Tunisia, while 20 of the 38 countries recorded ratios below 15%. Africa, therefore, faces both an overall revenue shortfall and pronounced differences in fiscal capacity across countries and regions.
Closing this revenue gap does not simply require higher statutory tax rates. Durable gains are more likely to come from economic growth, broader tax bases, rationalised exemptions, more effective taxation of property and high-net-worth individuals, improved natural-resource taxation, digital registration, cleaner taxpayer databases and stronger customs administration. Formalisation is important, but it should not be pursued through coercive taxation of subsistence workers and microenterprises. Simplified compliance regimes, affordable business registration, digital identification, access to financial services and visible improvements in public services can create stronger incentives for firms and workers to participate in the formal economy.
Institutional integrity is central to this agenda. IMF work on governance in sub-Saharan Africa shows that corruption weakens institutions, reduces programme effectiveness and impairs trust in public policy. At the same time, digitalisation and transparency can produce a measurable “governance dividend”. This implies that tax systems perceived to be arbitrary, captured by elites or disconnected from public services will struggle to secure voluntary compliance. Revenue reform should therefore be accompanied by greater transparency, digitalisation and stronger oversight to reduce corruption and reinforce the fiscal relationship between citizens and the state.
External financial inflows nevertheless remain indispensable because different flows address different constraints. Aid is particularly valuable where it finances public goods, humanitarian assistance and institutional capacity that private markets will not provide. FDI can add productive capital, technology, skills and access to export markets, but its development impact depends on sectoral allocation, domestic supplier linkages, employment creation, taxation and profit-repatriation arrangements. Remittances contribute directly to household consumption, education, healthcare and resilience and may also support savings and small-scale investment. Portfolio flows can deepen financial markets and expand financing options for governments and firms. Still, they are generally more sensitive to global interest rates, exchange-rate expectations and changing risk perceptions. Debt can accelerate development where borrowed funds generate sufficiently high economic and social returns. Still, it can intensify external vulnerability when maturities are short, interest costs are high, or revenues are denominated in local currency while repayments are denominated in foreign currency.
The appropriate policy question is therefore not which single financial flow Africa should prefer. It is how governments can construct a financing mix that mobilises domestic savings, protects fiscal sustainability, improves investment quality and supports structural transformation. The answer will vary by country income, economic structure, institutional capability and exposure to fragility. It will also require stronger sovereign balance-sheet management, more transparent investment governance and closer alignment between external financing and national development priorities.
This theme examines recent trends in aid, FDI, remittances and portfolio investment and constructs an ambitious External Financial Inflows scenario using the International Futures (IFs) platform. The scenario combines higher external financial inflows with a productivity intervention that represents stronger domestic absorptive capacity[1A finance-only variant is retained as a comparator to assess how far the development return from additional external finance depends on productivity, institutional capability and domestic economic linkages.]. The analysis assesses effects on economic output, income per person, poverty, government revenue and inward FDI stock through 2043, the end of the third ten-year implementation period of AU Agenda 2063.
Overview of Africa's External Financial Inflows
Download to pdfAfrica’s external financial inflows comprise several distinct sources of capital, with aid, remittances, FDI and portfolio investment among the most significant. These flows differ in their origins, recipients, transmission channels and degree of stability. Aid is primarily transferred to governments, public institutions and implementing organisations; remittances are private transfers directed largely to households; FDI represents longer-term investment by foreign firms in productive assets and business operations; and portfolio investment comprises cross-border holdings of financial assets such as equities and debt securities. Their aggregate values are therefore not directly interchangeable, but examining them together provides a useful picture of how external resources enter and support African economies.
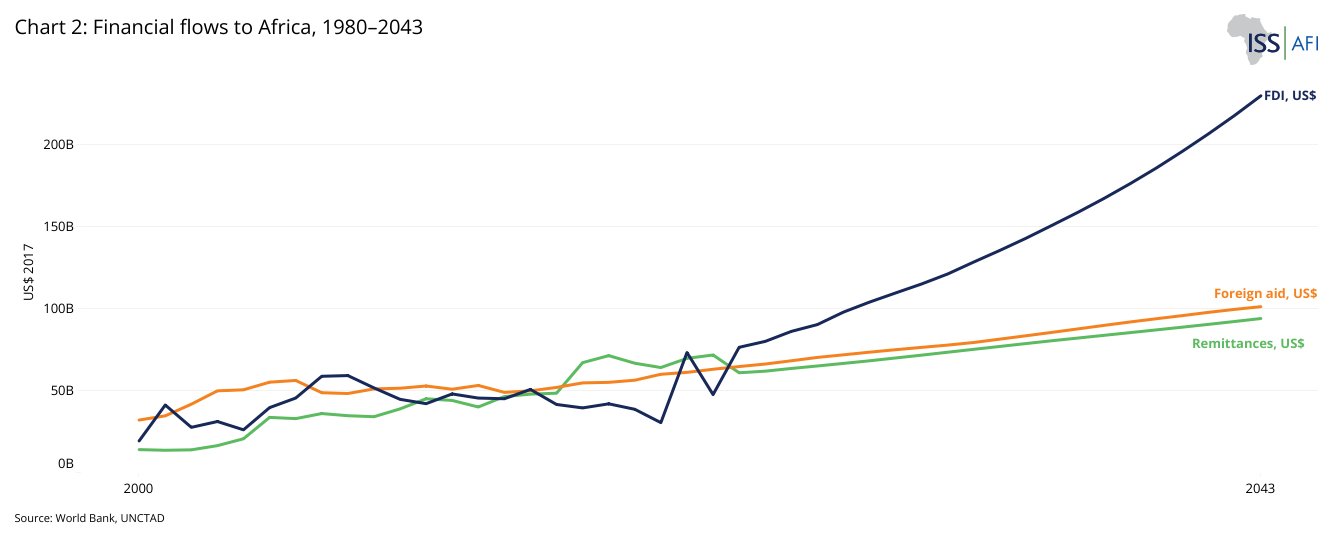
The relative importance of the four flows has changed considerably over time (Chart 1). Remittances have become one of Africa’s largest and most stable sources of external finance, rising from about US$58.2 billion in 2010 to almost US$95 billion in 2025. Aid inflows have also remained relatively stable, increasing from US$56.1 billion to US$75.2 billion over the same period. In contrast, FDI has been the most volatile of the four flows, although annual inflows almost doubled from US$52.4 billion in 2010 to US$103.9 billion in 2025. This volatility reflects changes in commodity prices, investor confidence, mergers and acquisitions, intracompany financing and the timing of large projects. Portfolio investment inflows were considerably smaller, at about US$4.9 billion in 2025, making them the smallest of the four external financial flows in that year.
The continental totals also conceal significant differences in geographical distribution. Remittance inflows are concentrated in countries with large diaspora populations and established migration corridors. Aid is concentrated disproportionately in low-income, fragile and conflict-affected countries, although its composition varies between humanitarian assistance, budget support, technical cooperation and development projects. FDI is concentrated in larger markets, resource-rich economies and countries able to host major infrastructure, energy, manufacturing or services investments. Portfolio investment is even more concentrated in economies with relatively deep and liquid capital markets, stronger financial institutions and established access to international investors, making it especially sensitive to global interest rates, exchange-rate expectations and shifts in investor risk appetite. The countries receiving the largest flows in absolute terms are therefore not necessarily those for which the flows are most important relative to GDP, public expenditure, household income or domestic financial-market size.
Bilateral assistance has remained the largest component of aid received by Africa, accounting for over 65% of total aid inflows, with imputed multilateral assistance accounting for the remainder. This composition matters because bilateral and multilateral aid are governed through different allocation processes. Bilateral assistance is more directly influenced by the strategic and geopolitical priorities, fiscal circumstances and foreign-policy objectives of individual donor governments. In contrast, multilateral institutions can pool contributions across providers and allocate resources according to collectively agreed mandates.
Members of the OECD Development Assistance Committee (DAC) remain the principal providers of bilateral assistance to Africa, with the United States (US), EU member states and the United Kingdom (UK) among the largest providers. Among the non-DAC providers covered by the dataset in Chart 2, the United Arab Emirates (UAE) is the most prominent.
The persistent donor concentration depicted in Chart 2 exposes African countries to fiscal and political decisions made in Europe and the US. This represents a significant financing risk, particularly where external grants support essential public services or recurrent expenditure. Reductions by major providers can therefore have immediate consequences for health programmes, humanitarian operations and public budgets, as illustrated by the current retrenchment in aid from several traditional donors. The concentration of aid, therefore, strengthens the case for a more diversified and predictable external financing base.
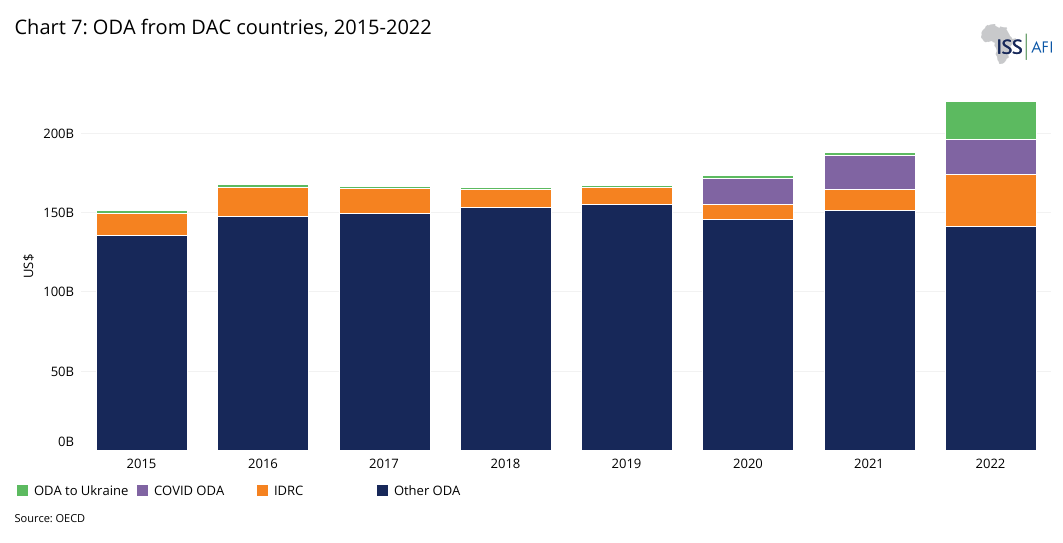
In 2025, major DAC donors, the US, Germany, the UK, Japan and France, shrunk their official development assistance (ODA) budgets to developing countries, resulting in ODA to sub-Saharan Africa falling by 26.3% in real terms from 2024. A further 11.6% reduction is expected in 2026. This would reduce bilateral assistance to the region to its lowest level since the early 2000s. Imputed multilateral assistance is also expected to decline, limiting multilateral institutions' ability to offset reductions by bilateral providers.
Sub-Saharan Africa is more dependent on aid than other major developing regions, making the implications of the prevailing aid cut serious. In 2024, ODA was equivalent to nearly 3% of regional GDP, rising to 6.4% in low-income countries and approximately 6% in fragile and conflict-affected states, compared with only 0.4% in emerging market economies. In South Sudan, aid accounted for around 36% of GDP, illustrating the acute dependence of some fragile countries on external support.
More than half of the aid received by the region supports health, education and humanitarian assistance. Cuts can therefore weaken vaccination programmes, disease surveillance, food assistance, education services and emergency responses, even where funds do not pass directly through government budgets. The risks are amplified by limited fiscal space, high debt-service obligations and elevated humanitarian needs, leaving governments with difficult choices between replacing external financing, reducing expenditure or allowing essential programmes to lapse.
Non-DAC providers, including China, the UAE and other emerging partners, may maintain or expand selected forms of development cooperation. Still, their contributions are neither guaranteed nor sufficient to offset the contraction among traditional providers. Their assistance may also differ in sectoral focus, concessionality, transparency and reporting standards. The IMF similarly notes that the growing role of non-traditional providers is insufficient to fully offset the decline in traditional aid.
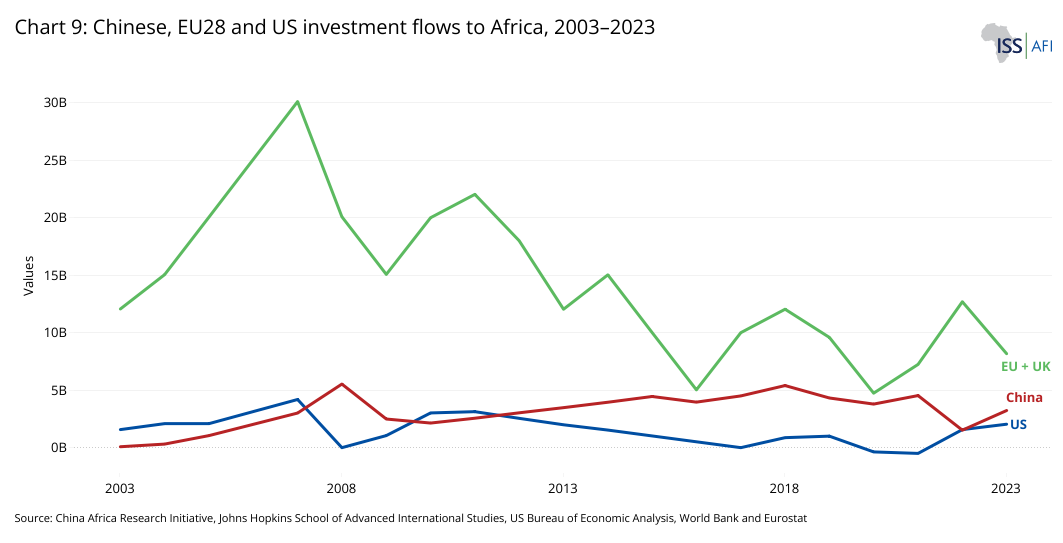
The source-country data presented in Chart 3 provides a more nuanced picture of foreign investment in Africa than the common perception that China is the continent’s largest conventional foreign direct investor. Annual flows show that the EU-27 and the UK have remained important sources of FDI, although their investment has fluctuated considerably. China recorded larger positive annual flows than the US did in several years, but its accumulated FDI position remained below that of the US.
The volatility of FDI inflows reflects the way they are measured. FDI flows include equity investment, reinvested earnings and intracompany debt, so a large acquisition, corporate restructuring or repayment between a parent company and its African affiliate can produce substantial annual movements without an equivalent change in factories, employment or productive capacity.
Negative annual FDI flows, such as those recorded by the EU-27 in 2023, occur when withdrawals, repayments of intracompany debt, asset disposals or profit distributions exceed new investment during a given year. They should not, therefore, be interpreted as evidence that foreign firms have closed all their operations or withdrawn entirely from Africa.
Exchange-rate movements and the timing of individual megaprojects can further amplify fluctuations in reported US-dollar values. For instance, the sharp increase in Africa’s FDI inflows in 2024 was driven largely by a major urban-development transaction in Egypt. This shows why headline annual figures should be assessed alongside information on the countries, sectors and projects responsible for the change. Policymakers should therefore distinguish between one-off financial transactions and broad-based investment that expands productive capacity, employment, exports and domestic supplier linkages.
FDI stock data in Chart 3 provide a more stable indication of longer-term investor presence. Over the past decade, European economies, particularly the Netherlands, France and the UK, have held some of the largest FDI positions in Africa, followed by the US and China. UNCTAD similarly reports that European investors collectively hold the continent’s largest FDI stock.
However, stock values should also be interpreted with caution, as they may reflect corporate ownership structures, financial centres and valuation changes rather than the ultimate source or developmental quality of the investment. A large position recorded for a particular jurisdiction does not always identify the ultimate beneficial owner of the capital. The Netherlands, for example, is frequently used as an intermediate corporate and financial location. Source-country statistics must therefore be interpreted with care when concluding ultimate ownership.
China’s role can also be understated if it is assessed solely through conventional FDI data. Chinese firms are prominent in construction, infrastructure contracting and project finance, but not all such activity qualifies statistically as FDI. Loans from Chinese policy banks, engineering contracts and projects implemented for African governments may be economically significant without creating a lasting Chinese ownership position in an African enterprise.
The distinction between flows and stocks is therefore crucial. Flows indicate new net investment during a particular period but are volatile and highly sensitive to corporate transactions. Stocks capture the accumulated value of investment and provide a better indication of established commercial presence, although they are affected by valuation changes and corporate structures. Neither measure alone captures investment quality. Therefore, FDI should be evaluated by its contribution to productive capacity and domestic linkages, not by headline value or investor nationality alone.
Remittance inflows to Africa are highly concentrated in a small number of countries. In 2024, Egypt received approximately 25.9% of the continental total, followed by Nigeria at 18.6%, Morocco at 10.9%, Ethiopia at 6.2% and Kenya at 4.4%. Egypt, Nigeria and Morocco, therefore, accounted for about 55.4% of recorded remittances to Africa. This concentration has persisted since 2020 and reflects the size of these countries’ diaspora populations, the geographical distribution of their migrants, labour-market conditions in destination economies and the degree to which transfers pass through formal channels.
Remittance corridors reflect historical, linguistic and labour-market relationships. Egypt receives substantial transfers from migrants in Saudi Arabia, the UAE, Kuwait and Qatar, as well as from the US. Morocco’s principal corridors are closely connected to France, Spain and Italy. Nigeria receives considerable transfers from the US and the UK, as well as flows from African and European destinations. Intra-African migration also makes the continent an important source of its own remittances, particularly through corridors linked to regional economic centres and neighbouring countries. A notable example is Zimbabwe, where in 2021, approximately 37% of its remittance inflows came from South Africa.
Conditions in destination economies are a major determinant of remittance trends. Employment and wage growth among migrant workers generally support higher transfers, whereas recession, unemployment, conflict or restrictive migration policies can weaken them. Exchange-rate arrangements also influence whether transfers use formal systems. The World Bank attributed the sharp fall in officially recorded remittances to Egypt in 2023, in part, to the difference between official and parallel exchange rates, which encouraged transfers through informal markets; recorded inflows subsequently rebounded following exchange-rate unification in March 2024.
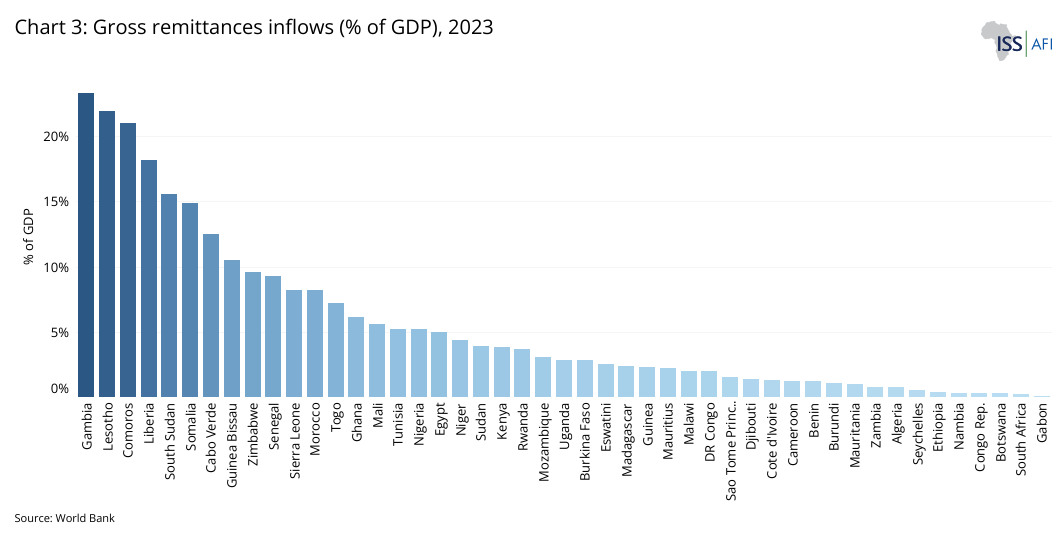
The largest recipients in absolute terms are not necessarily the most remittance-dependent. Smaller economies, including Gambia, Liberia and Lesotho, receive much lower nominal amounts, yet their GDP share exceeds 20%. This implies that they depend more heavily on remittances relative to GDP, household income or foreign-exchange earnings. Both absolute inflows and relative dependence are therefore necessary to assess the developmental importance and vulnerability associated with remittances.
High dependence can provide resilience, but it also exposes the recipient country to shocks outside its borders. A slowdown in major destination markets, changes in migration policy or currency instability can affect household welfare and the balance of payments. Governments should therefore recognise remittances as private household resources rather than as predictable public-development revenue. Policies should facilitate their safe and affordable transfer while avoiding assumptions that governments can direct their use.
A further analytical challenge is that a considerable proportion of remittances enters African countries through informal channels. Hand-carried cash, transfers through relatives, unlicensed intermediaries and informal settlement networks are particularly significant where formal services are expensive, inaccessible or mistrusted. Chart 4 indicates especially large estimated informal shares in the Democratic Republic of the Congo (DR Congo), Libya, Zimbabwe, Somalia and Nigeria.
The prevalence of informal channels means that officially recorded remittances may understate the true scale of transfers received by African households, complicating assessments of household income and foreign-exchange availability.
The pattern of formal and informal transfers also indicates that cost, accessibility, trust and exchange-rate conditions influence how migrants send money. These issues are examined in greater detail in the scenario analysis, which considers how lower transfer costs, stronger payment interoperability and wider access to regulated financial services could increase recorded remittance receipts.
Portfolio investment is a relatively volatile component of Africa’s external financing landscape and remains concentrated in economies with greater access to international capital markets and more developed domestic financial systems. Unlike FDI, portfolio investment consists of cross-border transactions in equity and debt securities that do not confer a controlling interest and can adjust relatively rapidly in response to interest rates, exchange-rate expectations, sovereign risk and changes in global investor sentiment.
The availability of comparable 2025 data remains limited. Among African countries with reported observations, net portfolio investment balances ranged from approximately –US$9.91 billion in Egypt and –US$2.66 billion in Morocco to positive balances of about US$0.98 billion in Ghana and US$0.89 billion in Angola (Chart 5). South Africa recorded a balance of around –US$1.72 billion, while Lesotho, the DR Congo, Cabo Verde and Burundi recorded considerably smaller positions.
These values require careful interpretation. Under IMF BPM6 accounting conventions, net portfolio investment is calculated as the net acquisition of portfolio assets minus the net incurrence of portfolio liabilities. A negative balance can therefore reflect a net increase in liabilities to foreign investors and is not, by itself, evidence of portfolio capital leaving the country. Conversely, a positive balance may indicate that residents acquired more foreign portfolio assets relative to the increase in liabilities to non-residents.
The wide variation across countries nevertheless highlights the uneven integration of African economies into international securities markets. Portfolio finance can broaden the investor base, deepen bond and equity markets and expand financing options for governments and firms. Still, it is also more reversible than FDI and can amplify exchange-rate, refinancing and sovereign-risk pressures when global financial conditions deteriorate. Its developmental value, therefore, depends not only on attracting portfolio capital, but also on strengthening local-currency markets, domestic institutional investors, debt transparency, market regulation and safeguards against sudden reversals.
The External Financial Inflows Scenario
Download to pdfBuilding on the preceding analysis of Africa’s external financial inflows, this section shows how a more favourable external financing environment could raise the four financial flows above their Current Path levels by 2043, the end of the third implementation decade of AU Agenda 2063. The analysis uses the International Futures (IFs) platform, with interventions across the four flows benchmarked[2South Asia and South America are benchmark regions, and this does not imply that Africa is necessarily expected to reproduce their trajectories.] against levels observed under the Current Path in peer developing regions, specifically South America and South Asia. The resulting integrated External Financial Inflows scenario combines higher net remittance receipts, aid, FDI inflows and inward portfolio investment, combined with stronger domestic absorptive capacity.
As recently emphasised by the AfDB, and consistent with the broader growth literature, stronger development outcomes depend not only on the volume of finance available, but also on the effectiveness with which those resources are converted into productive economic activity. To reflect this dimension, the scenario incorporates a multi-factor productivity (MFP) adjustment as a proxy for stronger absorptive capacity, including improved investment efficiency, technology absorption, institutional capability, skills utilisation and domestic productive linkages. Chart 6 summarises the interventions, transmission channels and intended development effects.
The External Financial Inflows scenario is deliberately ambitious. It does not assume that higher inflows will arise automatically, nor does it present them as a forecast of what will necessarily occur. Instead, it assesses what could be achieved if African countries and their international partners implemented policies that could increase the volume, stability and developmental value of external finance. The scenario illustrates the scale and distribution of potential gains relative to the IFs baseline forecast, referred to as the Current Path.
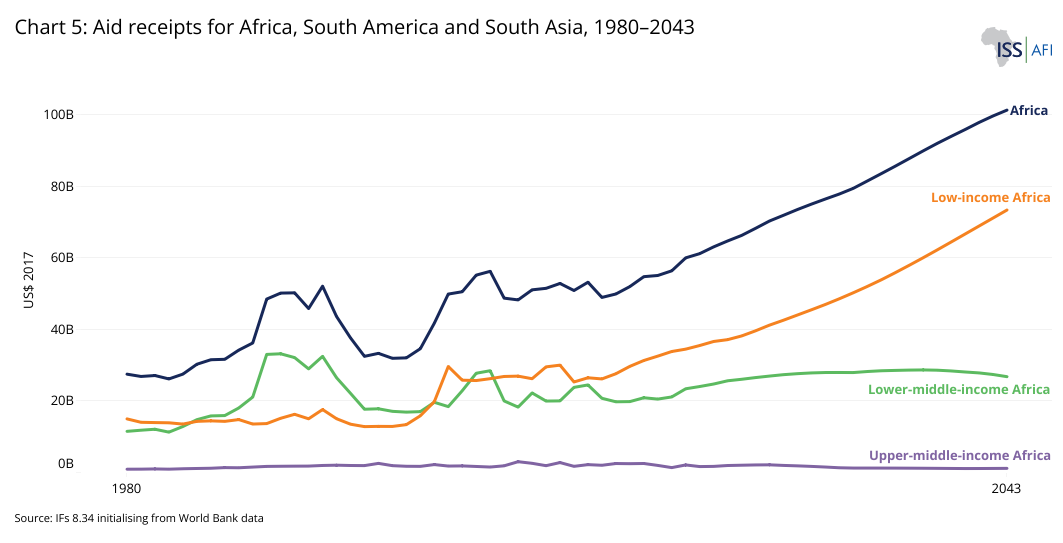
Against the deteriorating global aid environment, the External Financial Inflows scenario assumes that Africa’s net foreign aid receipts will reach US$126.7 billion by 2043, approximately US$21.4 billion above the Current Path. Aid dependence will decline more slowly under the scenario because aid receipts are deliberately maintained at a higher level, falling from about 2.2% of GDP in 2025 to 1.6% by 2043, compared with 1.3% under the Current Path. As a result, Africa would remain considerably more aid-dependent than South America and South Asia, where aid will account for only about 0.1% of GDP by 2043 under the Current Path. This reflects, in part, Africa’s larger concentration of low-income and fragile states, where aid remains more important.
Low-income countries account for the largest share of the additional aid (approximately 86%), receiving about US$18.5 billion above the Current Path by 2043, compared with approximately US$2.9 billion for lower-middle-income countries and about US$40 million for upper-middle-income countries. These differences reflect the deliberately stronger intervention in low-income countries, where financing constraints are generally more acute, alternative sources of external finance are more limited, and grants and deeply concessional finance remain especially important for funding essential public services and humanitarian needs that cannot readily generate commercial returns. This allocation is broadly consistent with the wider aid-effectiveness principles associated with the Paris Declaration on Aid Effectiveness (2005) and the Busan Partnership for Effective Development Cooperation (2011), particularly their emphasis on country ownership, alignment with national priorities and the effective use of development resources.
In the context of tightening global aid, policy should prioritise protecting essential expenditure, improving predictability and effectiveness, preserving concessional financing and diversifying the provider base. Governments and development partners should identify programmes for which abrupt funding withdrawal would impose the greatest social and economic costs, particularly in health, education, nutrition and humanitarian assistance, while avoiding replacing lost grants with unsustainable borrowing. Multi-year commitments, better alignment with national development strategies, stronger country systems and reduced fragmentation can improve the development return from limited aid resources. Concessional windows at multilateral institutions remain particularly important for low-income, fragile and highly indebted countries, including for climate adaptation and other regional and global public goods. Greater engagement with non-DAC donors, philanthropic organisations and other providers can reduce concentration risk, but diversification should not weaken standards for transparency, procurement, debt disclosure, environmental safeguards and evaluation.
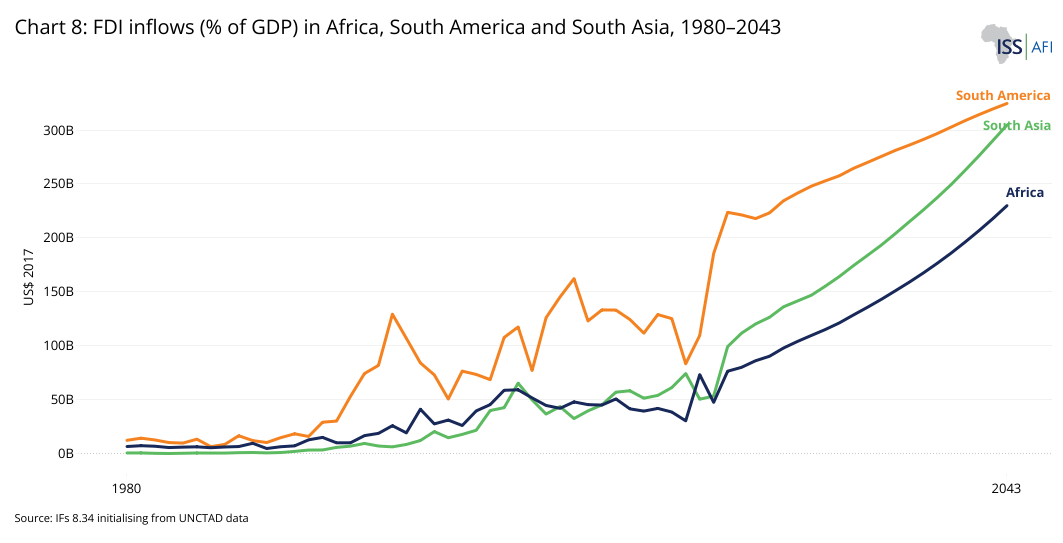
Africa’s FDI inflows will increase to approximately US$305 billion by 2043 under the External Financial Inflows scenario, about US$28 billion above the Current Path. The scenario assumes that Africa will surpass South America in absolute FDI inflows by around 2039, about 2 to 3 years earlier than under the Current Path, and will narrow the gap with South Asia, where inflows will reach approximately US$313 billion by 2043.
In relative terms, South America will remain the most FDI-intensive of the three regions, with inflows equivalent to about 4.4% of GDP by 2043 under the Current Path. Under the External Financial Inflows scenario, Africa’s FDI inflows will increase from about 3% of GDP in 2025 to 3.7% by 2043, compared with 3.5% under the Current Path, thereby narrowing the gap with South America. South Asia, despite attracting a relatively higher absolute volume of FDI, will maintain a considerably lower FDI-to-GDP ratio of around 2%. The comparison, therefore, highlights the importance of considering both the scale of FDI inflows and their significance relative to the size of the receiving economy.
Lower-middle-income economies account for over 70% of the additional FDI inflows generated by the scenario, with gains of approximately US$20 billion above the Current Path by 2043. Low-income countries gain about US$5.9 billion, while upper-middle-income countries gain around US$2.1 billion. The larger absolute gain in lower-middle-income economies reflects the stronger intervention applied to this group, based on their assumed greater capacity to attract and absorb additional FDI, supported by larger markets, broader productive bases and stronger integration into regional and global value chains.
The geographical sources of additional FDI are likely to remain diverse, with European, Chinese, US, Gulf and other Asian investors continuing to play important but differentiated roles. However, because IFs version 8.72 does not clearly attribute the modelled increase to particular source economies, the policy emphasis should be on the quality and productive additionality of investment rather than investor nationality. African countries should prioritise FDI that expands productive capacity, supports exports and employment, transfers technology and skills, strengthens domestic suppliers and contributes to public revenue. This will require better infrastructure, regulatory predictability, regional market integration, credible project pipelines, stronger investment facilitation and closer links between foreign firms, domestic companies and skills institutions. Priorities should also differ by income group: low-income countries need basic infrastructure and risk mitigation to diversify beyond enclave investment; lower-middle-income economies should connect FDI more strongly to manufacturing, agro-processing and regional value chains; and upper-middle-income economies should increasingly target technologically sophisticated and higher-value activities.
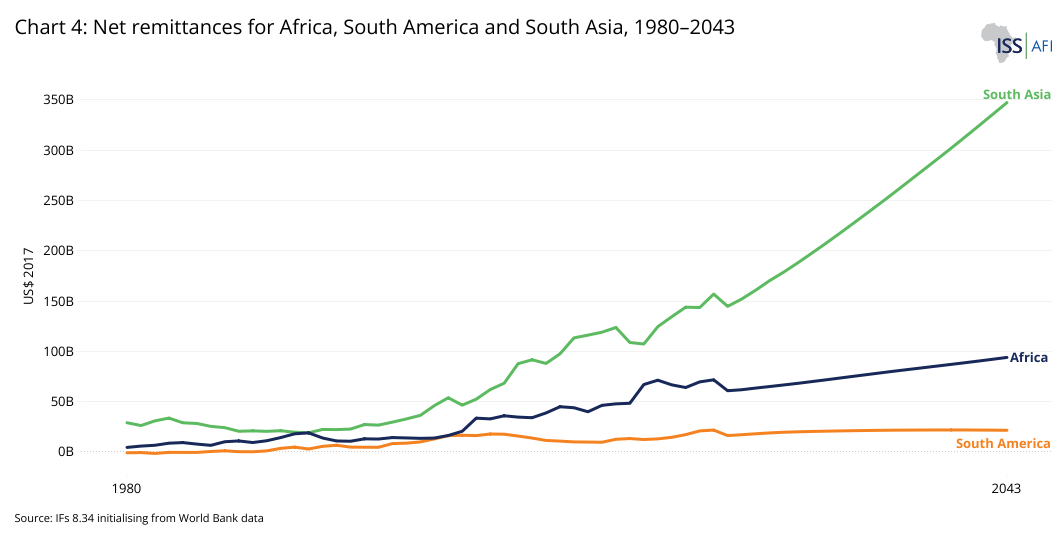
Future remittance inflows are benchmarked against South Asia, which leads the three regions by a wide absolute margin, followed by Africa. Under the External Financial Inflows scenario, Africa’s net remittance receipts are assumed to reach US$125.3 billion by 2043, approximately US$17.7 billion above the Current Path. Relative to the size of the economy, remittance receipts will decline from 2.7% of GDP in 2025 to 1.9% by 2043, around 0.2 percentage points above the Current Path. The External Financial Inflows scenario will therefore keep Africa’s remittance-to-GDP ratio closer to that of South Asia, where the ratio declines from 3.3% to 2.5% over the same period under the Current Path.
Lower-middle-income economies account for over 80% of the additional net remittances generated by the scenario, with gains of approximately US$15 billion above the Current Path by 2043. Low-income countries account for about US$2.4 billion. The stronger intervention in lower-middle-income countries reflects their assumed combination of large diaspora populations, established migration corridors, expanding financial systems and substantial household dependence on remittances. Although many low-income countries also have sizeable diaspora populations and high remittance dependence, the intervention is more moderate because weaker financial infrastructure, limited access to formal payment systems and higher transaction costs can constrain the share of transfers recorded through formal channels.
Upper-middle-income African economies, by contrast, remain net remittance senders throughout the forecast period. This means that outward transfers by migrant workers residing in these economies exceed remittances received from their citizens abroad. South Africa, Botswana, Mauritius and other comparatively higher-income African economies serve as important regional migration destinations and therefore as significant sources of intra-African remittance flows.
The difference between the External Financial Inflows scenario and the Current Path reflects policy interventions intended to increase the share of transfers passing through recorded channels, reduce transaction costs and strengthen formal remittance corridors. It should not be interpreted as an assumption that migration alone will automatically generate the additional inflows. Realising the scenario would therefore require governments and regulators to promote competition among banks, money-transfer operators, mobile providers and FinTech firms, while improving transparency over fees and exchange-rate margins and ensuring that regulated channels are affordable, accessible and trusted. Regional payment systems, including the Pan-African Payment and Settlement System (PAPSS), can reduce transfer frictions where commercial participation, settlement arrangements and regulatory interoperability are strengthened. Formal remittance channels can also expand recipients’ voluntary access to savings, insurance and appropriately designed credit, while improving the measurement of household transfers. Diaspora bonds and other investment instruments may provide additional channels for migrants wishing to invest, but their success depends on credible projects, competitive returns, sound macroeconomic management and public trust. Remittances should nevertheless continue to be treated primarily as private household resources rather than as a substitute for public development finance.
Under the External Financial Inflows scenario, Africa’s inward portfolio investment stock will increase from US$401.9 billion in 2025 to US$735.7 billion by 2043, approximately US$96.4 billion above the Current Path. Even under this ambitious trajectory, however, Africa remains well below South America and South Asia, where inward portfolio investment stocks reach about US$1.2 trillion and US$1.3 trillion, respectively, by 2043 under the Current Path. The gap highlights the relative shallowness of Africa’s capital markets and its more limited integration into global portfolio investment.
The strongest intervention is applied to upper-middle-income African economies because they generally have larger and more liquid financial markets, stronger institutional-investor bases and more established access to international capital. Their relatively developed banking systems, stock exchanges and government-bond markets make them more visible to global investors. As a result, under the External Financial Inflows scenario, inward portfolio investment stock in this group will increase by approximately US$29.4 billion above the Current Path by 2043.
Lower-middle-income economies nevertheless account for the largest absolute share of the continental gain, with inward portfolio investment stock approximately US$65.3 billion above the Current Path by 2043, despite a lower intervention than upper-middle-income countries. This partly reflects the larger size of the group, but also its greater potential for financial deepening as economies grow, domestic bond and equity markets expand and a wider range of institutional investors emerges. These markets may offer stronger growth prospects and higher returns than those in more mature economies, but they can also face substantial liquidity, exchange-rate, and refinancing risks.
A more moderate intervention assumed for low-income countries reflects the shallow depth of domestic capital markets, smaller pools of listed assets, weaker institutional-investor participation and higher perceived risk. As a result, inward portfolio investment stock in this group rises by only about US$1.5 billion above the Current Path by 2043.
Realising the potential benefits of higher portfolio investment will require deeper domestic capital markets alongside stronger safeguards against volatility and financial instability. Governments should develop more liquid local-currency bond and equity markets, strengthen domestic institutional investors and improve market infrastructure, disclosure and corporate governance. Regional integration can enlarge the pool of investible assets and investors, but practical barriers involving taxation, foreign-exchange rules, custody and settlement arrangements also need to be addressed. Because portfolio capital can reverse rapidly, stronger macroeconomic management, transparent debt strategies, adequate monitoring of foreign-currency exposures and careful sequencing of capital-account liberalisation remain essential. Policy should also encourage portfolio finance to support productive private-sector activity rather than predominantly short-term government borrowing or speculative transactions. The appropriate sequencing will differ by income group, with low-income economies first requiring sound market institutions and supervision, lower-middle-income economies needing deeper local-currency and corporate markets, and upper-middle-income economies focusing increasingly on liquidity, diversification and resilience to global capital-flow cycles.
Development Impact of the External Financial Inflows Scenario
Download to pdfThe economic significance of the gains illustrated in the preceding section will depend less on the headline volume of additional finance than on its composition, allocation and productive use. For example, FDI directed towards manufacturing, agro-processing, transport, energy, digital infrastructure and tradable services is likely to generate stronger effects on employment, exports and productivity than investment concentrated in extractive enclaves, real estate or activities with limited domestic linkages. Similarly, the development impact of aid, remittances and portfolio investment will depend on how effectively these resources support productive investment, household welfare, public services and domestic financial deepening.
The scenario should therefore be interpreted as more than an increase in external finance. It represents a more favourable financing environment in which African countries attract and retain greater financial resources while strengthening their capacity to convert those resources into domestic economic activity. Achieving this outcome would require improvements in infrastructure, regulatory predictability, regional market integration, project preparation, skills and investment facilitation, alongside stronger linkages between foreign investors, domestic suppliers, workers, financial institutions and research institutions.
This section, therefore, assesses how a combination of a favourable external financing environment and stronger domestic absorptive capacity, represented by the External Financial Inflows scenario, could affect GDP, GDP per capita, poverty, government revenue and the inward FDI stock through 2043 relative to the Current Path.
The GDP results provide the clearest evidence that the development impact of external finance depends on domestic absorptive capacity. Under the External Financial Inflows scenario, Africa’s GDP at market exchange rates (MER) will reach approximately US$8.17 trillion by 2043, around US$210 billion, or 2.6%, above the Current Path forecast of approximately US$7.96 trillion. By comparison, higher external financial inflows without the absorptive-capacity intervention will raise GDP by only about US$63.7 billion, or 0.8%, above the Current Path. The contrast reinforces the central argument of the theme: increasing the volume of finance can ease financing constraints, but the growth effect remains limited where domestic productive capacity is weak.
Lower-middle-income economies account for the largest absolute GDP gain, at approximately US$130 billion above the Current Path by 2043. Low-income economies gain about US$50 billion, while upper-middle-income economies gain roughly US$30 billion.
These differences underline the importance of productive structure. Lower-middle-income countries generally have broader markets, stronger infrastructure and more diversified production systems through which additional finance can generate larger multiplier effects. Low-income countries can also achieve substantial gains where finance helps remove binding constraints in energy, transport, agriculture and human capital.
The smaller gain in upper-middle-income economies reflects not only the smaller number of countries in this group, but also their higher initial income and productivity levels, deeper financial markets and greater access to alternative sources of capital. Additional external finance, therefore, generates smaller marginal gains than in lower-middle-income economies, where infrastructure gaps, financing constraints and opportunities for industrial expansion remain larger. For upper-middle-income countries, future growth increasingly depends on innovation, technological upgrading and higher-value production rather than simply expanding the volume of capital available.
External finance generates stronger growth when domestic firms can supply inputs, workers possess appropriate skills, infrastructure supports production and trade, institutions can implement projects effectively, and investment is directed towards activities with strong domestic linkages. The composition of the additional finance also matters. FDI is more growth-enhancing when it expands productive assets, exports and technology rather than operating as an enclave. Aid can support long-term growth through infrastructure, health, education and institutional capability. Remittances can strengthen consumption and household investment, although the domestic multiplier is weaker where additional demand is met largely through imports. Portfolio investment can ease financing constraints, but its contribution is more limited where it is concentrated in secondary-market transactions or short-term public financing.
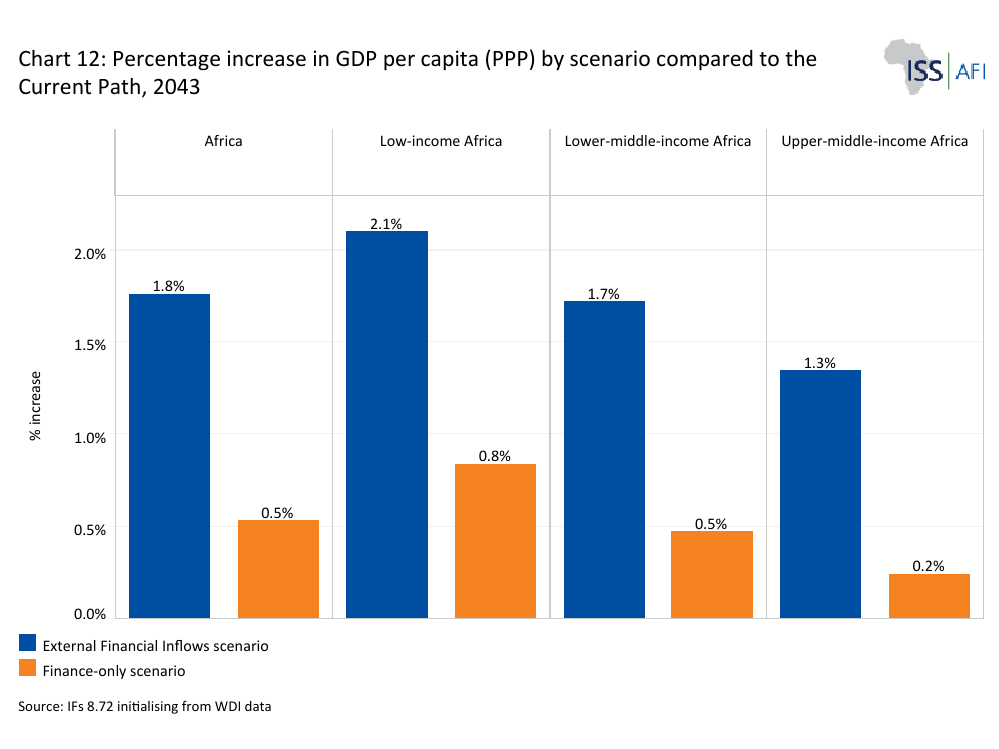
The same pattern is evident in GDP per capita. Under the External Financial Inflows scenario, Africa’s average GDP per capita at purchasing-power parity (PPP) will reach approximately US$8 021 by 2043, around US$140, or 1.8%, above the Current Path forecast. By comparison, higher external financial inflows without the absorptive-capacity intervention increase GDP per capita by only about US$40 above the Current Path. This again indicates that the welfare effect of external finance depends less on the volume of resources alone than on whether those resources contribute to higher productivity, employment and incomes.
The largest absolute per-capita gain occurs in upper-middle-income countries, where GDP per capita will be approximately US$220 above the Current Path by 2043, followed by lower-middle-income countries at about US$190 above the Current Path. Low-income countries record a smaller absolute gain of approximately US$80. The larger per-capita gains in upper-middle-income economies, despite their smaller aggregate GDP increase, partly reflect their smaller population base and higher starting levels of productivity and income.
These averages should nevertheless be interpreted cautiously. Higher GDP per capita does not necessarily imply broad-based improvements in welfare where income gains are concentrated among particular sectors, regions or households. Employment creation, labour productivity, public-service provision and income distribution therefore remain important in determining whether stronger economic growth translates into improved living standards.
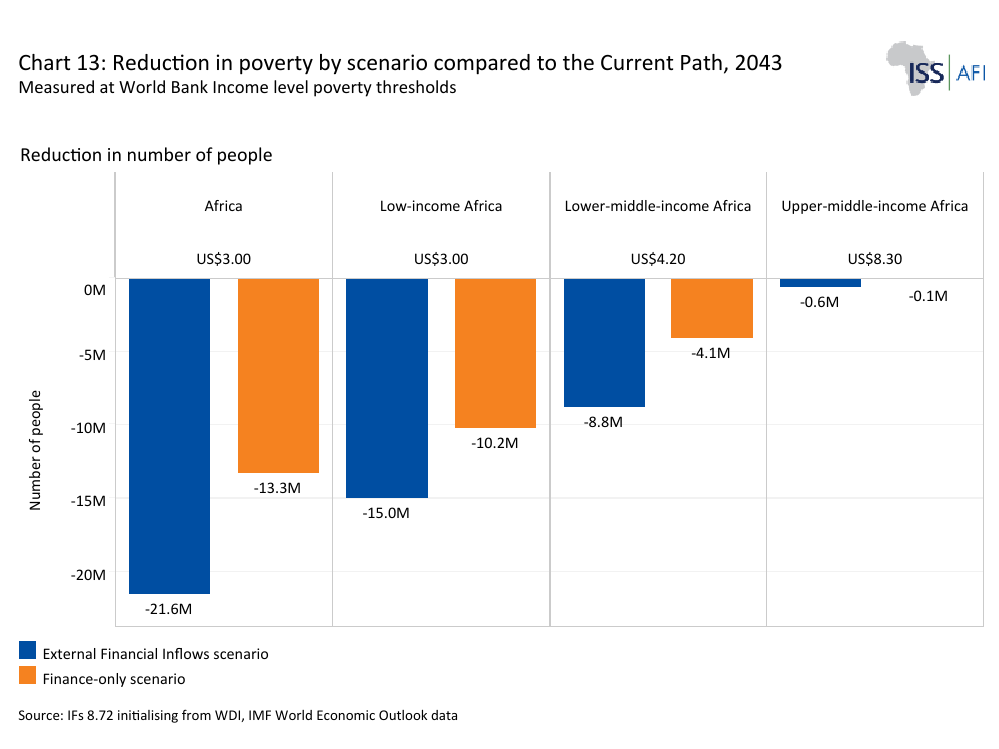
The poverty results also show that combining a favourable external financing environment with stronger absorptive capacity increases the development impact of external finance. Under the External Financial Inflows scenario, Africa’s extreme-poverty rate at the US$3.00-a-day threshold will fall to approximately 22.4% by 2043, compared with 24.4% under the Current Path. The number of people living below this threshold will decline to about 507 million, roughly 21 million fewer than under the Current Path. By comparison, higher external financial inflows without the absorptive-capacity intervention lift approximately 13 million additional people out of extreme poverty relative to the Current Path by 2043. This reinforces the wider finding that additional financial resources have a stronger poverty-reduction effect when they generate productive employment, higher labour and agricultural productivity, stronger public services and broader domestic economic linkages.
The largest absolute poverty reduction occurs in low-income countries, where approximately 15 million fewer people will be living below the US$3.00-a-day threshold than under the Current Path by 2043. In lower-middle-income countries, assessed at the US$4.20-a-day threshold, approximately 7 million fewer people will be living in poverty, while in upper-middle-income economies, assessed at the US$8.30-a-day threshold, the reduction is about 300 000 people. The comparatively large effect in low-income economies reflects the severity of their initial development constraints and the greater number of people clustered close to the extreme-poverty threshold. Even under the External Financial Inflows scenario, however, poverty remains substantial.
Across the income groups, the results point to the same conclusion: external finance can accelerate poverty reduction, but its effect is considerably stronger where economies possess the productive and institutional capacity to translate additional resources into employment, higher incomes and improved public services.
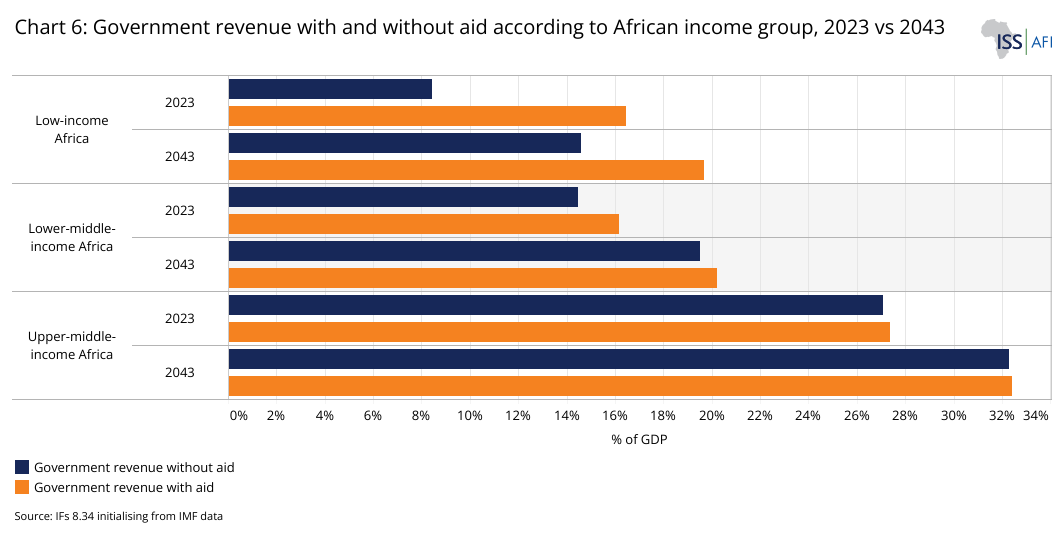
Under the External Financial Inflows scenario, Africa’s government revenue will rise from approximately US$503 billion, or 14.5% of GDP, in 2025 to US$1.58 trillion, or 19.3% of GDP, by 2043. This is around US$70 billion above the Current Path forecast of US$1.51 trillion, or 19% of GDP. By comparison, higher external financial inflows without the absorptive-capacity intervention will increase revenue by only about US$36.3 billion above the Current Path, illustrating the importance of the domestic transmission mechanism.
External financial inflows do not translate directly into government revenue. Their fiscal contribution depends on the economic activity they generate and on the capacity of governments to capture a reasonable share of the expansion in income, consumption, profits, wages, and trade. Remittances can strengthen household demand and formal financial activity; FDI can expand production, employment and corporate income; aid can support public investment and administrative capability; and deeper portfolio markets can ease financing constraints. These channels generate substantially larger fiscal effects when additional finance is accompanied by higher productivity and broader domestic economic activity.
The largest absolute increase occurs in lower-middle-income countries, where government revenue will be approximately US$29 billion higher than the Current Path by 2043. Low-income countries follow closely, with gains of about US$28 billion, while upper-middle-income countries gain around US$7 billion.
These differences reflect variations in economic structure and fiscal capacity. Lower-middle-income economies are generally better positioned to convert stronger investment, financial deepening and remittance-supported demand into taxable production and income. Low-income countries also benefit substantially, as even modest improvements can be achieved from a relatively narrow initial tax base. However, weak revenue administration and high informality can limit fiscal capture. Upper-middle-income economies already have broader tax bases and more developed revenue systems, so the marginal fiscal effect of additional finance is smaller.
The policy implication is that attracting external finance should be accompanied by stronger tax administration, more effective taxation of multinational and digital activity, transparent investment incentives and closer coordination between finance ministries, tax authorities and investment agencies.
Africa’s inward FDI stock will increase from approximately US$1.4 trillion, or 40.4% of GDP, in 2025 to about US$3.39 trillion, or 41.6% of GDP, by 2043 under the External Financial Inflows scenario. This is around US$228 billion above the Current Path forecast. By comparison, higher external financial inflows without the absorptive-capacity intervention increase inward FDI stock by only about US$175 billion above the Current Path, indicating that stronger domestic productivity and investment conditions can reinforce the accumulation and retention of foreign capital.
Stronger infrastructure, skills, institutional capability and domestic supplier linkages can improve the profitability of existing investments, encourage reinvestment of earnings and make African economies more attractive for business expansion. The result, therefore, highlights an important distinction between attracting foreign capital and creating the conditions that allow investment to remain, expand and become more deeply embedded in the domestic economy.
The largest absolute gain occurs in lower-middle-income economies, where inward FDI stock will be approximately US$170 billion above the Current Path by 2043. Low-income countries follow with a gain of about US$38.1 billion, while upper-middle-income economies are approximately US$19.1 billion above the Current Path.
The development significance of these increases depends on the quality of investment. A larger FDI stock does not necessarily imply an equivalent increase in factories, infrastructure or other productive assets, because stock values can also change through exchange-rate movements, asset revaluation, mergers, corporate restructuring and intracompany debt. The central policy objective should therefore be to increase the share of foreign investment that supports productive capacity, reinvestment, technology transfer, skills development and domestic supplier networks.
Africa’s external financing challenge is not simply a shortage of capital. It is also a challenge of converting external resources into productive investment, employment, public revenue and higher household incomes. Aid, remittances, FDI and portfolio investment play different roles and carry different risks. Still, all can contribute more effectively to development when they are supported by stronger domestic institutions, infrastructure, skills and productive linkages.
The scenario analysis illustrates this distinction. A more favourable external financing environment increases the resources available to African economies, but the development gains are considerably larger when stronger absorptive capacity accompanies those inflows. By 2043, the combined intervention, represented by the External Financial Inflows scenario, raises GDP by approximately US$210 billion above the Current Path, increases government revenue by about US$70 billion, raises average GDP per capita by around US$140, increases the inward FDI stock by approximately US$228 billion, and results in roughly 21 million fewer Africans living below the US$3.00-a-day poverty threshold. The effects differ across income groups, reinforcing the need for differentiated financing strategies rather than a single continental approach.
The central policy implication is that Africa should pursue more external finance, but place equal emphasis on improving the development return from every dollar, euro, yen or renminbi it attracts. The objective is not financing for its own sake, but financing that expands productive capacity, strengthens domestic linkages and supports structural transformation.
Policy recommendations:
- Strengthen domestic absorptive capacity: Prioritise reliable infrastructure, skills, institutional capability, project preparation, technology absorption and domestic supplier development so that additional external finance translates into productivity, employment and income rather than remaining disconnected from the domestic economy.
- Improve the quality, not only the volume, of external finance: Investment incentives and facilitation should favour finance that expands productive capacity, exports, employment, technology transfer and local value addition. Aid should protect essential public goods and capability-building, while remittance policy should reduce transfer costs without treating household resources as public finance.
- Differentiate financing strategies by country conditions: Low-income and fragile economies require continued access to grants and deeply concessional finance; lower-middle-income economies should increasingly use external finance to support industrialisation, infrastructure and regional value chains; and upper-middle-income economies should prioritise innovation, technological upgrading and deeper, more resilient capital markets.
- Deepen domestic financial and fiscal systems: Stronger tax administration, transparent investment incentives, deeper local-currency bond and equity markets and larger domestic institutional-investor bases can increase the domestic benefits of external finance while reducing vulnerability to sudden reversals.
- Diversify finance and manage external vulnerability: Diversify financing partners, curb illicit financial flows, strengthen debt transparency and macroeconomic management, and align external finance with national and regional development priorities. External finance should complement, not substitute for, stronger domestic resource mobilisation.
Endnotes
A finance-only variant is retained as a comparator to assess how far the development return from additional external finance depends on productivity, institutional capability and domestic economic linkages.
South Asia and South America are benchmark regions, and this does not imply that Africa is necessarily expected to reproduce their trajectories.
Page information
Contact at AFI team is Marvellous Ngundu
This entry was last updated on 6 October 2026 using IFs 8.72.
Donors and sponsors




Reuse our work
- All visualizations, data, and text produced by African Futures are completely open access under the Creative Commons BY license. You have the permission to use, distribute, and reproduce these in any medium, provided the source and authors are credited.
- The data produced by third parties and made available by African Futures is subject to the license terms from the original third-party authors. We will always indicate the original source of the data in our documentation, so you should always check the license of any such third-party data before use and redistribution.
- All of our charts can be embedded in any site.
Cite this research
Marvellous Ngundu (2026) Africa Financial Flows Forecast . Published online at futures.issafrica.org. Retrieved from https://futures.issafrica.org/thematic/10-financial-flows/ [Online Resource] Updated 6 October 2026.