 Sudan
Sudan
Feedback welcome
Our aim is to use the best data to inform our analysis. See our Technical page for information on the IFs forecasting platform. We appreciate your help and references for improvements via our feedback form.
This report analyses Sudan’s current development path and prospects, examining how various sectoral interventions could shape the country’s economic and social landscape through to 2043, the end of the third ten-year implementation plan of the African Union’s Agenda 2063. Grounded in scenario modelling, the analysis explores eight key sectors and assesses their individual and combined impact on Sudan’s long-term growth and development trajectory. It does so in the context of a country whose strategic location, natural resources and youthful population are constrained by conflict, institutional fragility and economic underperformance. The report concludes by summarising the key findings and offering policy insights to support Sudan in moving from crisis toward recovery and a more inclusive, resilient and sustainable future.
Visit the Technical section for additional information on the International Futures (IFs) modelling platform, which serves as the analytical foundation for this report’s scenario simulations.
Executive Summary
We begin this page with an introduction and context to Sudan.
- Straddling and connecting north, east and central Africa, Sudan is the third-largest country in Africa after Algeria and DR Congo, with a land area of approximately 1 868 000 square kilometres. It shares borders with seven neighbouring countries, including Libya, Chad, the Central African Republic, Eritrea, Ethiopia, South Sudan and Egypt.
- Sudan’s maritime access to the Red Sea has the potential to serve as a logistical hub for countries in East Africa and as a gateway to landlocked countries in Central Africa. This geographical setup offers development opportunities through trade and regional integration. However, it has also brought geopolitics into a region with a long history of destabilisation, external interference, persistent intra-state conflict and proxy efforts, most notable in the context of the ongoing war.
The introductory section is followed by an analysis of the Current Path for Sudan, which informs the region’s likely current development trajectory to 2043, mostly comparing Sudan with its low-income peers in Africa. It is based on current developmental trends and assumes that no major shocks would occur in a ‘business-as-usual’ future.
- Sudan is the eighth-most populous country in Africa, the fourth-most populous country in East Africa after Ethiopia, Tanzania and Kenya, and the 30th globally. The Sudanese population is estimated at 52 million people, more than double the 22 million in 1990. The total population increased from 22 million in 1990 to 52 million in 2022, and by 2043, it will be 81.7 million. In terms of population structure, Sudan has a youthful and dependent population. In 2023, 57.2% of Sudanese were under the age of 15, 41.3% were in the 15–64 age group (working age), and 3.4% were 65 years and older.
- Sudan has urbanised rapidly over the years, such that the urban population stood at 35.3% in 2023, making Sudan the 13th most urbanised country among low-income African countries. On the Current Path, Sudan's urban population will grow modestly, reaching 42.8% by 2043
- The Sudanese economy revolves around the export of oil. Its GDP measured in market exchange rates (MER) tripled from US$15.7 billion in 1990 to US$45.4 billion in 2010 before the secession of South Sudan. In 2023, Sudan’s GDP stood at US$32.4 billion, a contraction of 12% from the previous year and is projected to reach US$38.9 billion by 20243.
- Sudan has a large informal sector that is vital to its economy. In 2023, the informal sector accounted for approximately 14% of GDP, below the average of 32% for its income peers in Africa. In the Current Path, the size of the informal sector will largely remain the same, even reaching 14.7% of GDP by 2043. The large contrast between its labour force share and contribution to GDP reflects the underlying low productivity, wages and inefficiency that characterise the sector.
- Since South Sudan's secession, Sudan has generally experienced a downward trend, with its GDP per capita dropping from US$4 884 in 2011 to US$2 961 in 2023. By 2043, Sudan’s GDP per capita will rise to US$2 998, indicative of a slower growth in GDP per capita
- Like many low-income countries in Africa, poverty in Sudan is widespread. In 2023, 22.8 million Sudanese, representing 45% of the population, lived below the poverty line of US$2.15 per day, above the average of 41.5% for low-income countries in Africa. By 2043, the poverty rate of 38.8% (equivalent to 31.7 million people) means that Sudan will miss the Sustainable Development Goal 1 target, which can only be met in 2088.
The next section compares progress on the Current Path with eight sectoral scenarios . These are Demographics and Health; Agriculture; Education; Manufacturing; the African Continental Free Trade Area (AfCFTA); Large Infrastructure and Leapfrogging; Financial Flows; and Governance. Each scenario is benchmarked to present an ambitious but reasonable aspiration in that sector.
- Sudan’s rapidly growing population constrains potential improvements in income. The Demographics and Health scenario will reduce the infant mortality rate from 41.9 deaths per 1 000 births in 2023 to 25.5 deaths by 2043, 14 deaths fewer than in the Current Path. The scenario pushes the ratio of the working-age population to 1.4 working-age persons to one dependants by 2043, close to the ratio of 1.7 to one that is required to enter a potential demographic window of opportunity.
- In 2022, Sudan’s net import of crops stood at 12.4% of total crop demand, which was less than the average of 7.9% for low-income countries in Africa. Sudan will reduce its crop import dependency, so that by 2043, the net crop import share will reach 25% in the Agriculture scenario instead of the 45.9% in the Current Path.
- In 2023, the mean years of education attained by adults between 15 and 24 years in Mali stood at 5.3 years — slightly below the average of 5.9 years for low-income countries on the continent. In the Education scenario, the mean years of adult education will rise to 7.6 years by 2043, 1.7 years more than the Current Path. By 2043, the scenario further increases average test scores for primary and secondary school students by 33.7% and 41.4%, respectively, significantly closing the gap with its income peers.
- In the Manufacturing scenario, Sudan makes substantial progress in industrialisation such that, by 2043, the share of the manufacturing sector in GDP is about 17.6%, equivalent to US$7.0 billion, which will be about US$439 above the Current Path.
- In the African Continental Free Trade Area (AfCFTA) scenario, Sudan’s trade deficit will constitute about 11.4% of GDP by 2043 instead of the 13.6% of GDP on the Current Path.
- Based on the Large Infrastructure and Leapfrogging scenario, 67.7% of Sudanese will have access to electricity by 2043. As a result, 28.0% of households in Sudan will use modern fuel for cooking in the Large Infrastructure and Leapfrogging scenario. The scenario will further lead to a larger increase in fixed and mobile broadband access, so that, by 2043, subscriptions will likely be at 21.1 and 127.4 per 100 people, respectively.
- In 2022, the government’s total revenue in Sudan amounted to US$3.1 billion, equivalent to 12.8% of GDP — lower than the average of its income-group peers in Africa. Compared to the Current Path, the Financial Flows scenario will improve government revenue in Sudan by an additional US$1.3 billion by 2043.
- Generally, Sudan performs poorly on governance indices compared to its income peers in Africa. Sudan’s score on the composite governance index of 0.23 in 2023 was 55% of the average for its income peers in Africa. In the Governance scenario, Sudan's score on the composite governance index will improve to 0.50, which is about 34% above the Current Path by 2043.
In the third section, we compare the impact of each of these eight sectoral scenarios with one another and subsequently with a Combined scenario (the integrated effect of all eight scenarios). In our forecasts, we measure progress on various dimensions such as economic size (in market exchange rates), gross domestic product per capita (in purchasing power parity), extreme poverty, carbon emissions, the changes in the structure of the economy and selected sectoral dimensions such as progress with mean years of education, life expectancy, the Gini coefficient or reductions in mortality rates.
- The scenarios with the greatest impact on GDP per capita in Sudan by 2043 will be the Agriculture scenario, followed by the Governance, the AfCFTA and the Financial Flows scenarios. Regarding poverty reduction, the Governance scenario has the greatest impact, followed by the Agriculture, AfCFTA, and Financial Flows scenarios. These four sectors are the most critical for raising living standards and eradicating poverty in Sudan.
- In the Combined scenario, Sudan’s GDP will rise to US$58.2 billion, exceeding the Current Path by US$19 billion. Similarly, in the Combined scenario, GDP per capita will increase to US$3 176 by 2043. This will be US$792 more than the Current Path.
- By 2043, the services sector will still be the largest contributor to GDP at 50.4%. The agriculture sector will be the second-largest contributor to GDP in the scenario by 2043 with a share of 25.7%. The share of the manufacturing sector will decline to 14.8%.
- By 2043, the size of the informal sector in Sudan will decline to 5.8% of GDP, valued at US$3.3 billion. At this rate, the contribution of the informal economy will be lower than the Current Path at 14.7% (valued at US$5.7 billion).
- In 2023, the average life expectancy at birth in Sudan was 70.3 years, which was about 6 years lower than the average for the country’s income-group peers in Africa. In the Combined scenario, life expectancy will increase to 73.1 years by 2043, which will be 4.2 years more than the country’s Current Path in the same year.
- In the Combined scenario, both the number and the proportion of poor people will significantly decline. By 2043, only about 18% of Sudanese, equivalent to 14.4 million people, will be living in extreme poverty, meaning 17.3 million more people could be lifted out of poverty.
- In the Combined scenario, Sudan’s total carbon emissions will rise to 11.4 million tons, 32.6% higher than what is estimated in the Current Path for the same year.
We end this page with a summarising conclusion offering key recommendations for decision-making.
Sudan is at a critical juncture. Despite its strategic location, substantial natural and agricultural resources and youthful population, the country has remained trapped in a prolonged cycle of conflict, institutional fragility and economic underperformance. Nearly seven decades after independence, development outcomes remain far below potential. The civil war that erupted in April 2023 has profoundly intensified these challenges, precipitating one of the world’s most severe humanitarian and development crises and bringing state institutions close to collapse.
The analysis confirms that violent conflict is the single most binding constraint to Sudan’s development, directly undermining all dimensions of human development addressed in the UNDP Strategic Plan. Since 2023, the war has resulted in large-scale loss of life, displaced more than 13 million people, destroyed infrastructure, disrupted markets and severely weakened the delivery of basic services.
The modelling identifies agricultural transformation, governance reform, regional trade integration and sustained external financial flows as the most powerful levers for raising incomes and reducing poverty. The strategic implication is clear: peace is a necessary condition for development, but peace alone is not sufficient. Sudan’s transition from fragility to resilience requires an urgent political settlement, the restoration of core state institutions and a coherent, data-driven development framework that prioritises governance, agricultural transformation, inclusive economic growth and climate resilience. With sustained and well-coordinated international support, Sudan can still move from crisis to recovery and from unrealised potential to inclusive and sustainable development. The window for action remains open, but it is rapidly narrowing.
All charts for Sudan Development Futures
- Chart 1: Political map of Sudan
- Chart 2: Population structure in the Current Path, 1990–2043
- Chart 3: Population distribution map, 2023
- Chart 4: Urban and rural population in the Current Path, 1990-2043
- Chart 5: GDP (MER) and growth rate in the Current Path, 1990–2043
- Chart 6: Size of the informal economy in the Current Path, 2020-2043
- Chart 7: GDP per capita in Current Path, 1990–2043
- Chart 8: Extreme poverty in the Current Path, 2020–2043
- Chart 9: Relationship between Current Path and scenarios
- Chart 10: Mortality distribution in the Current Path, 2023 and 2043
- Chart 11: Infant mortality rate in Current Path and Demographics and Health scenario, 2020–2043
- Chart 12: Demographic dividend in the Current Path and the Demographics and Health scenario, 2020–2043
- Chart 13: Crop production and demand in the Current Path, 1990-2043
- Chart 14: Import dependence in the Current Path and Agriculture scenario, 2020–2043
- Chart 15: Progress through the education funnel in the Current Path, 2023 and 2043
- Chart 16: Mean years of education in the Current Path and Education scenario, 2020–2043
- Chart 17: Value-add by sector as % of GDP in the Current Path, 2020 and 2043
- Chart 18: Value-add by the manufacturing sector in the Current Path and Manufacturing scenario, 2020–2043
- Chart 19: Exports and imports as % of GDP in the Current Path, 2000-2043
- Chart 20: Trade balance in the Current Path and AfCFTA scenario, 2020–2043
- Chart 21: Electricity access: urban, rural and total in the Current Path, 2000-2043
- Chart 22: Cookstove usage in the Current Path and Large Infra/Leapfrogging scenario, 2020–2043
- Chart 23: Access to mobile and fixed broadband in the Current Path and the Large Infra/Leapfrogging scenario, 2020–2043
- Chart 24: FDI, foreign aid and remittances as % of GDP in the Current Path and in the Financial Flows scenario, 1990-2043
- Chart 25: Government revenue in the Current Path and Financial Flows scenario, 2020–2043
- Chart 26: Government effectiveness score in the Current Path, 2002-2043
- Chart 27: Composite governance index in the Current Path and Governance scenario, 2023 and 2043
- Chart 28: GDP per capita in the Current Path and scenarios, 2020–2043
- Chart 29: Poverty in the Current Path and scenarios, 2020–2043
- Chart 30: GDP (MER) in the Current Path and Combined scenario, 2020–2043
- Chart 31: GDP per capita in the Current Path and Combined scenario, 2023-2043
- Chart 32: Value-add by sector in the Current Path and Combined scenario, 2023 and 2043
- Chart 33: Informal sector in the Current Path and Combined scenario, 2020–2043
- Chart 34: Poverty in the Current Path and Combined scenario, 2023 and 2043
- Chart 35: Life expectancy in the Current Path and Combined scenario, 2020–2043
- Chart 36: Carbon emissions in the Current Path and Combined scenario, 2020–2043
- Chart 37: Energy demand and production by type in the Current Path and Combined scenario, 2020-2043
- Chart 38: Policy recommendations
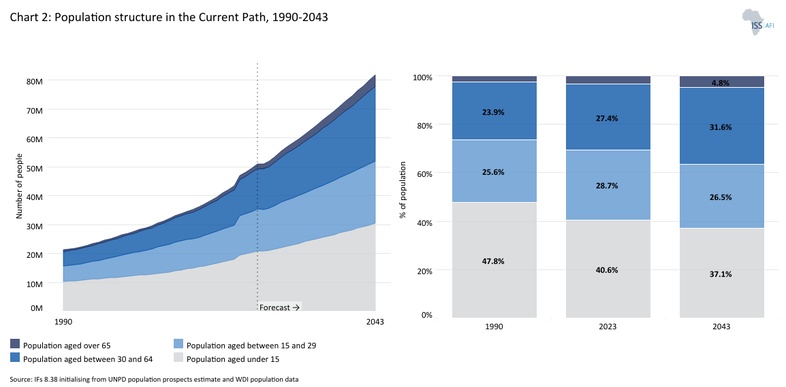
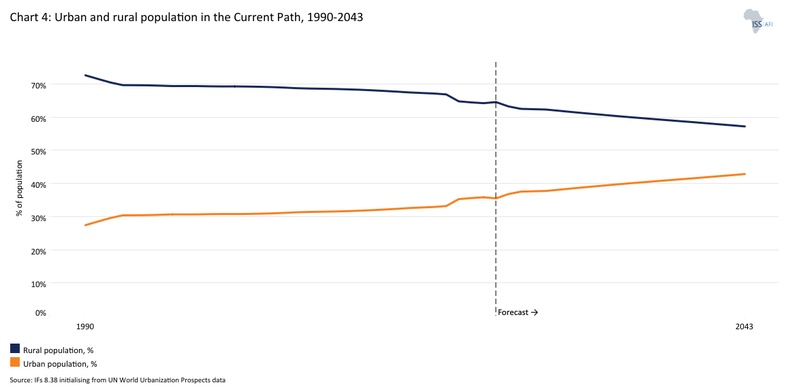
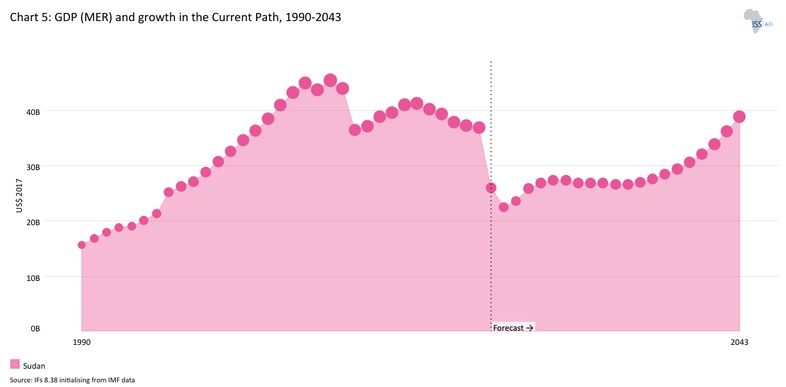
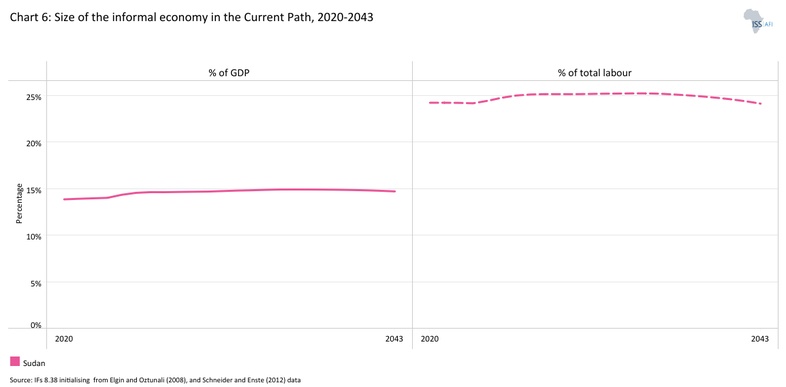
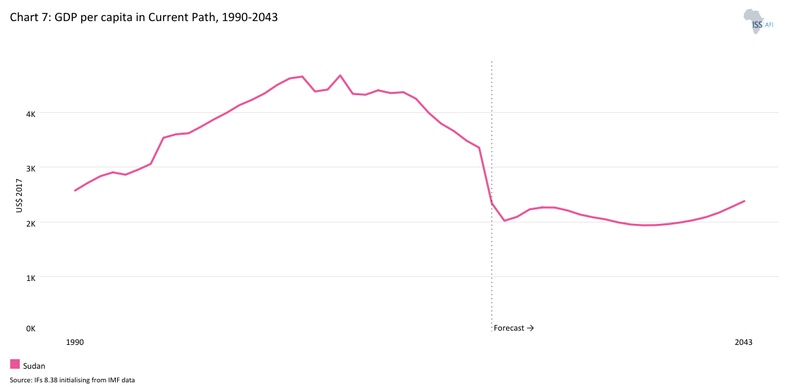
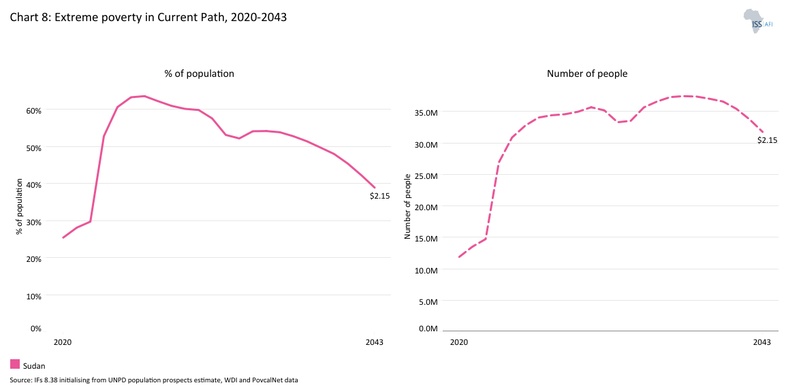
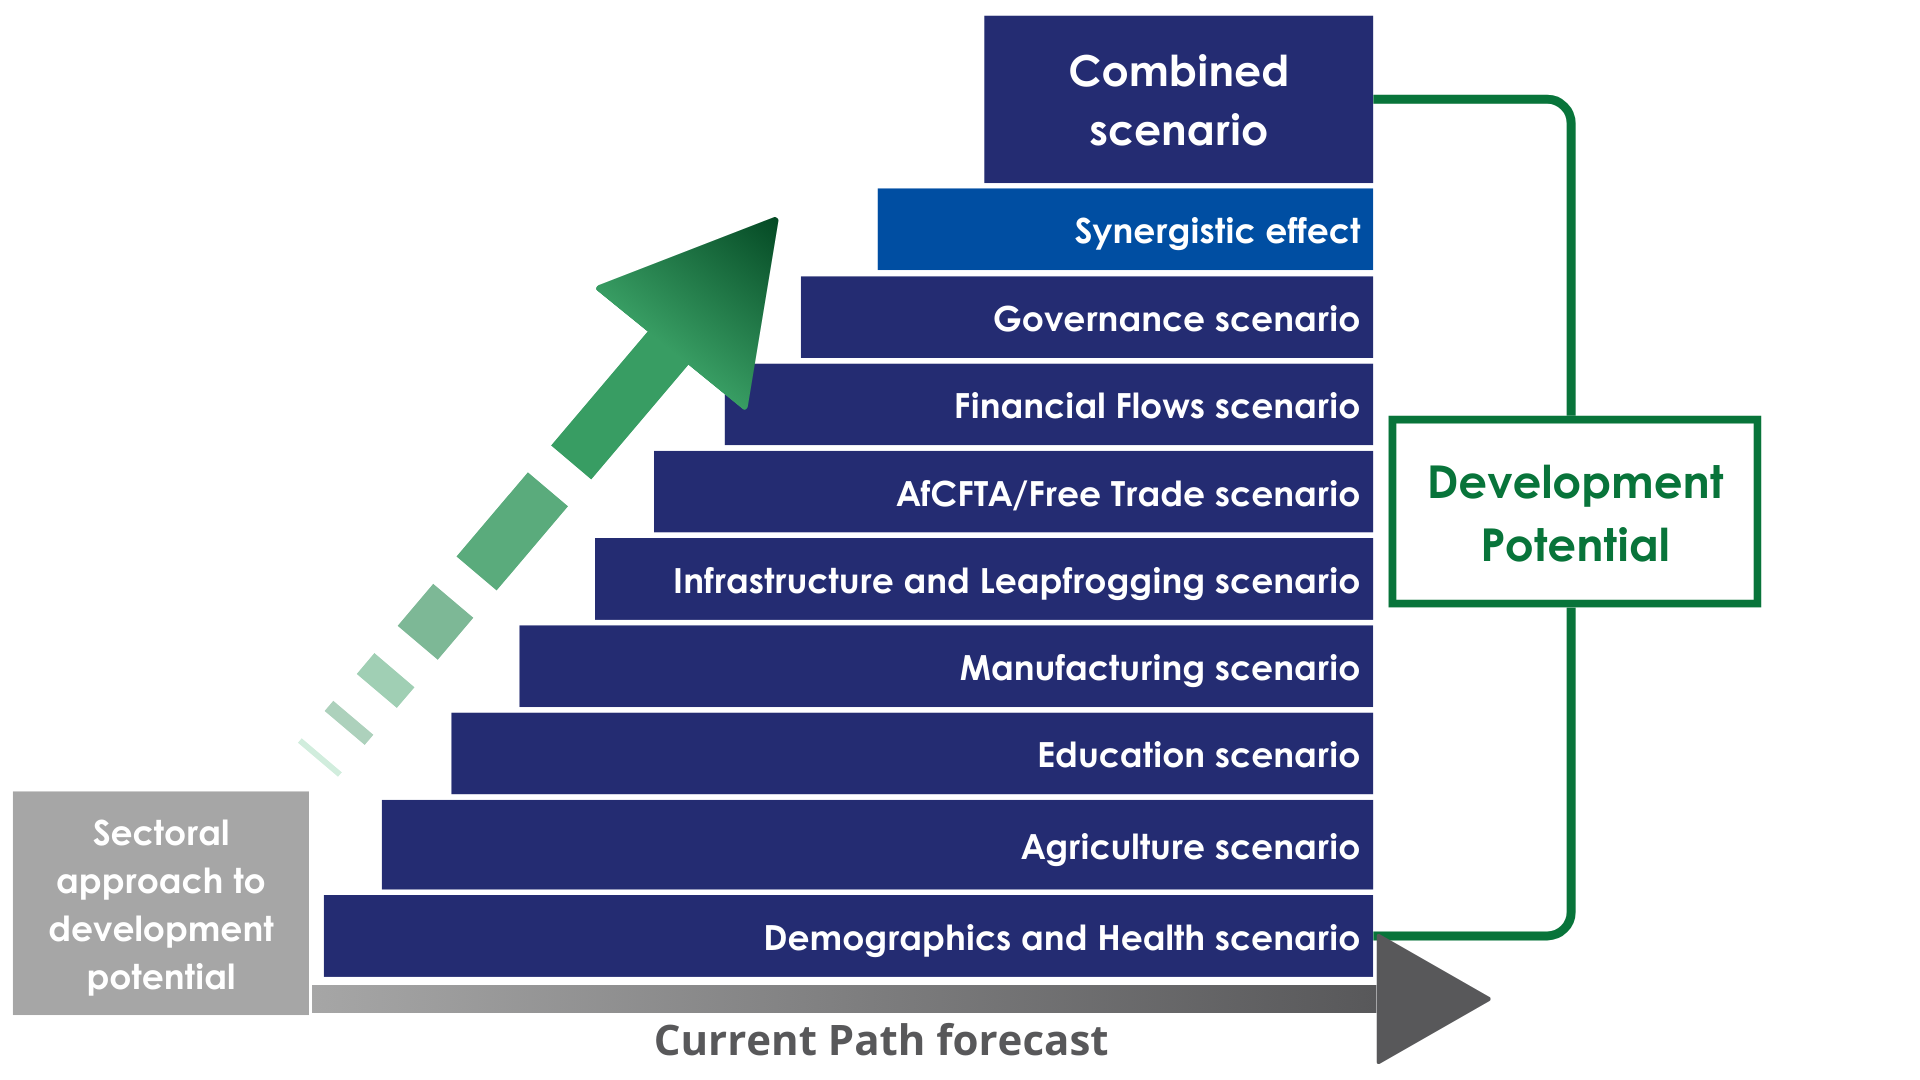
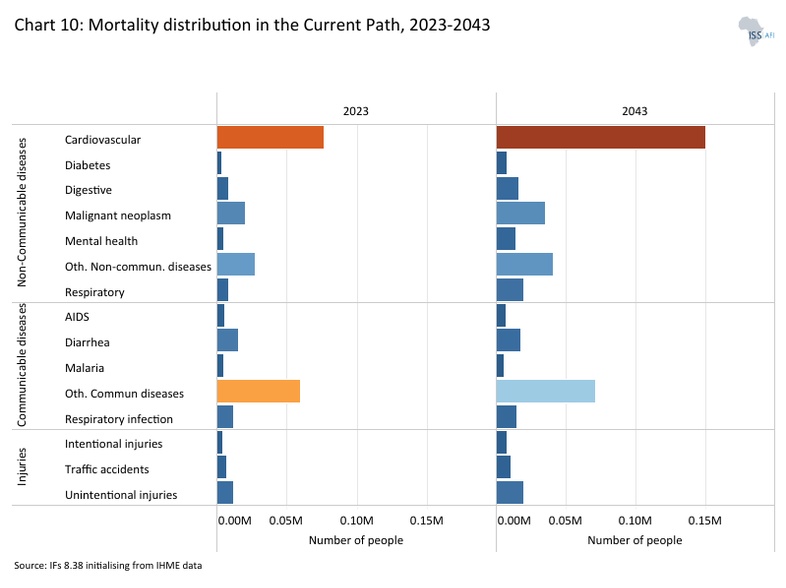
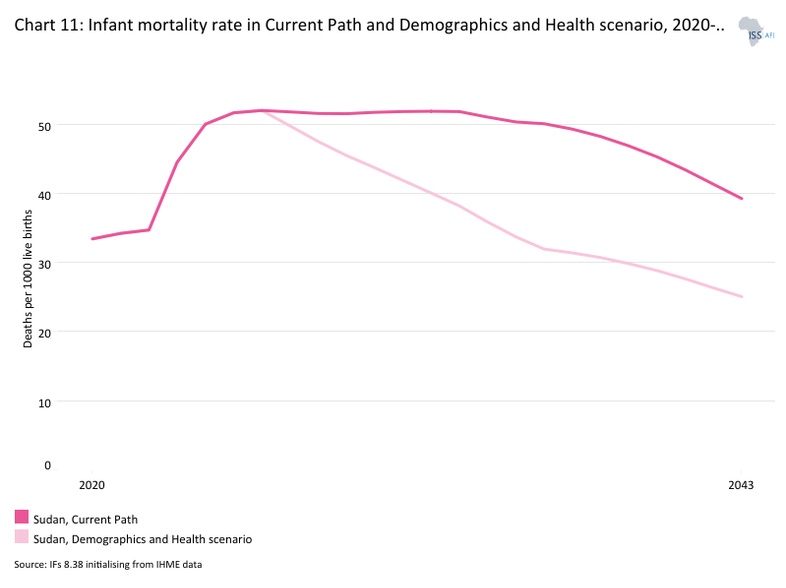
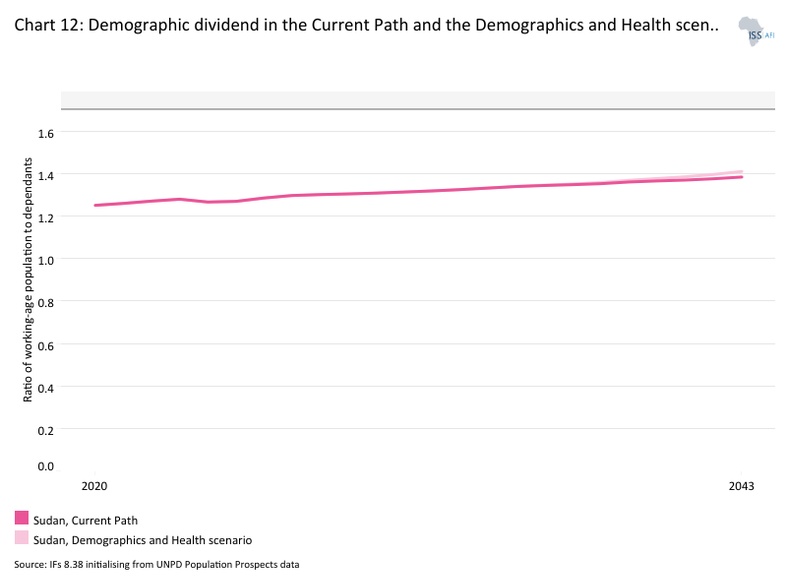
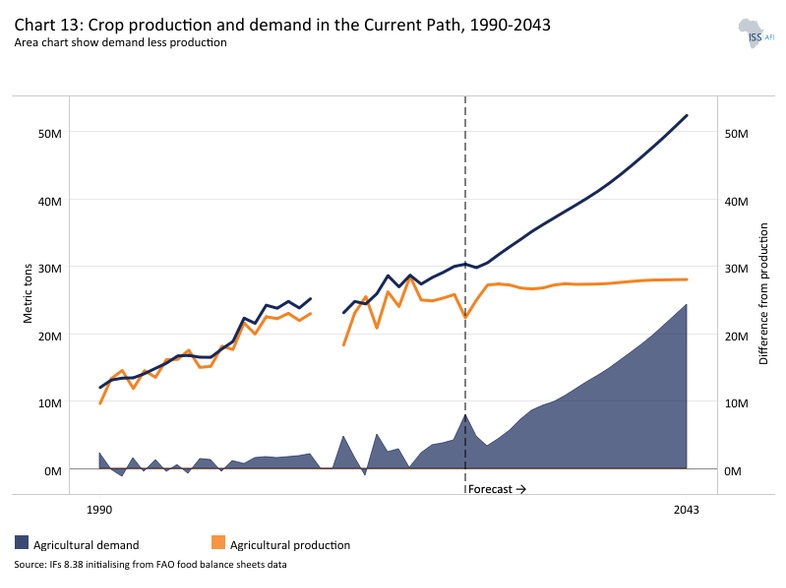
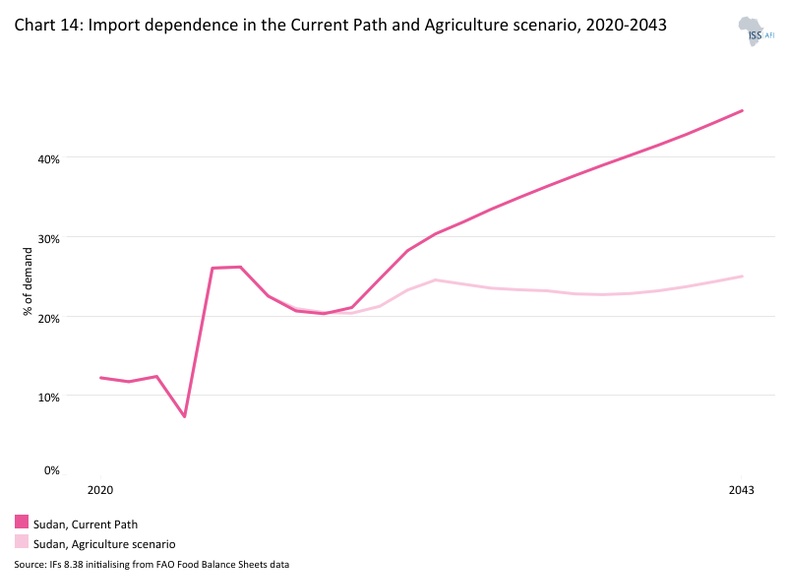
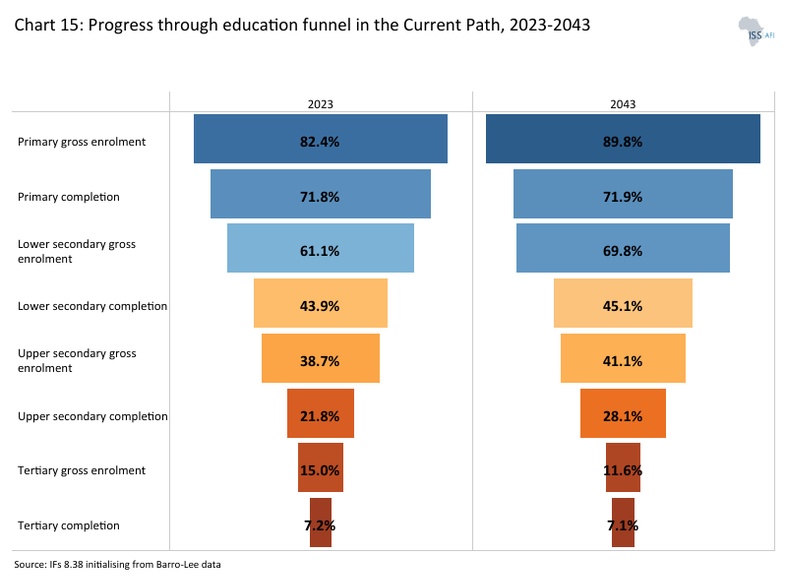

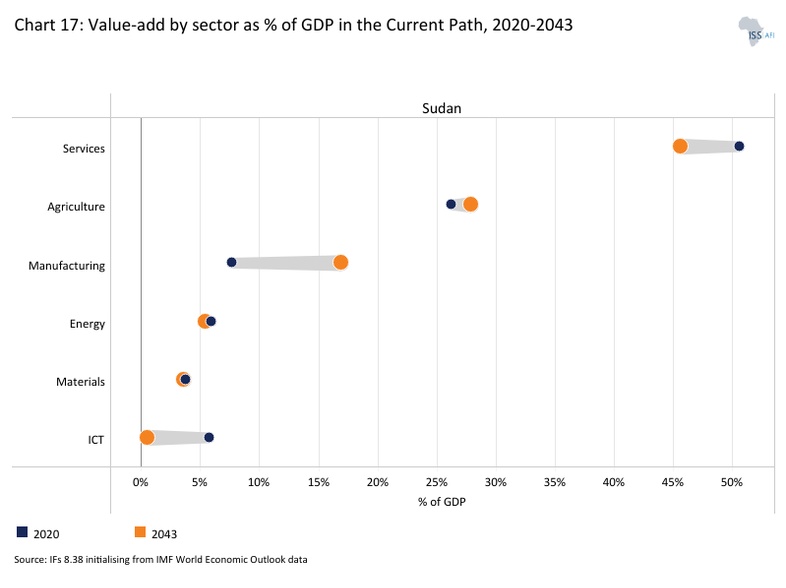
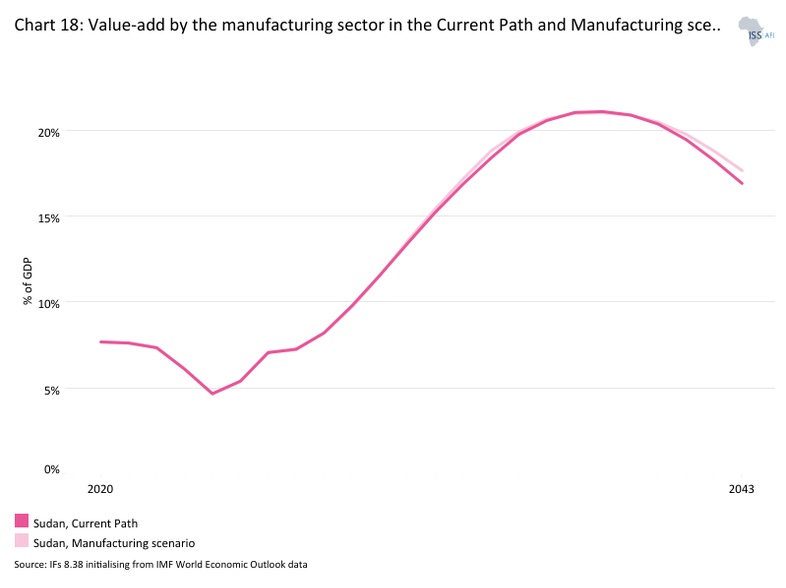
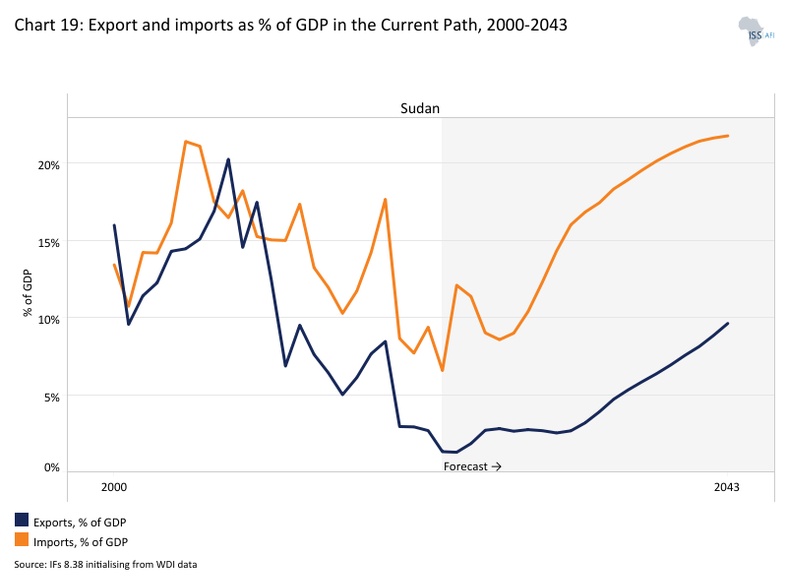
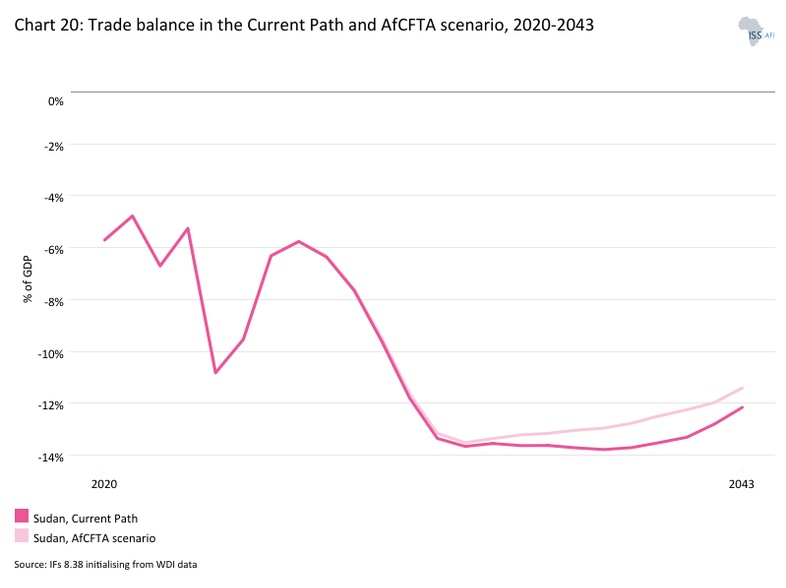
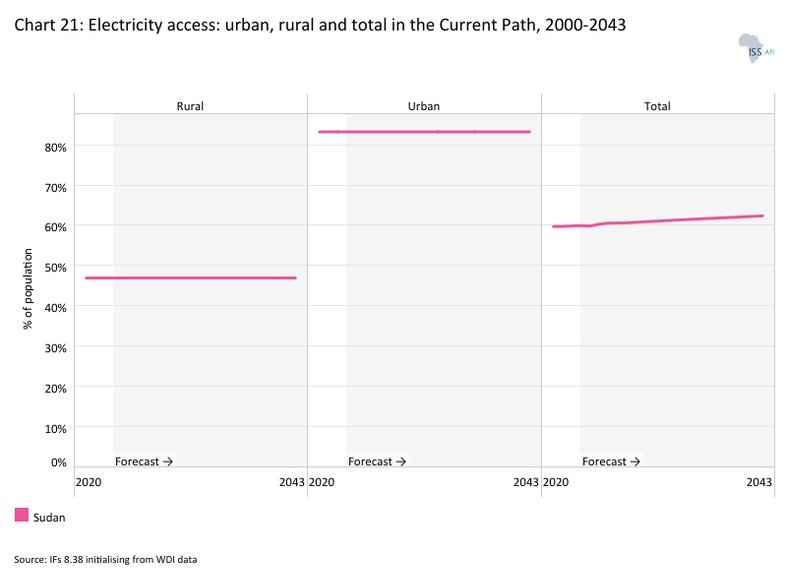
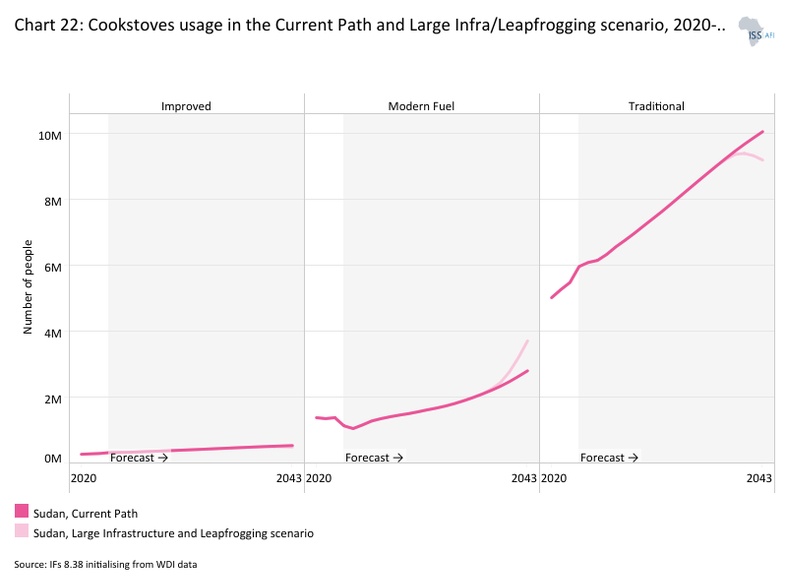
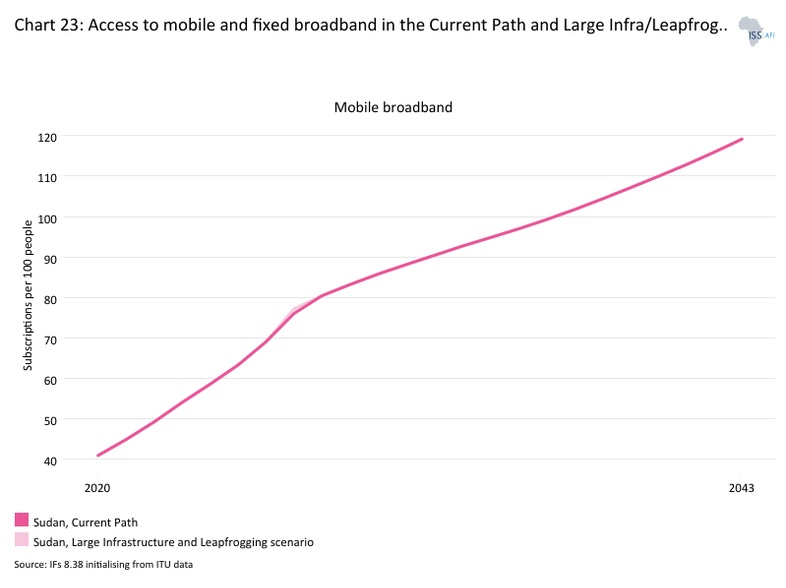
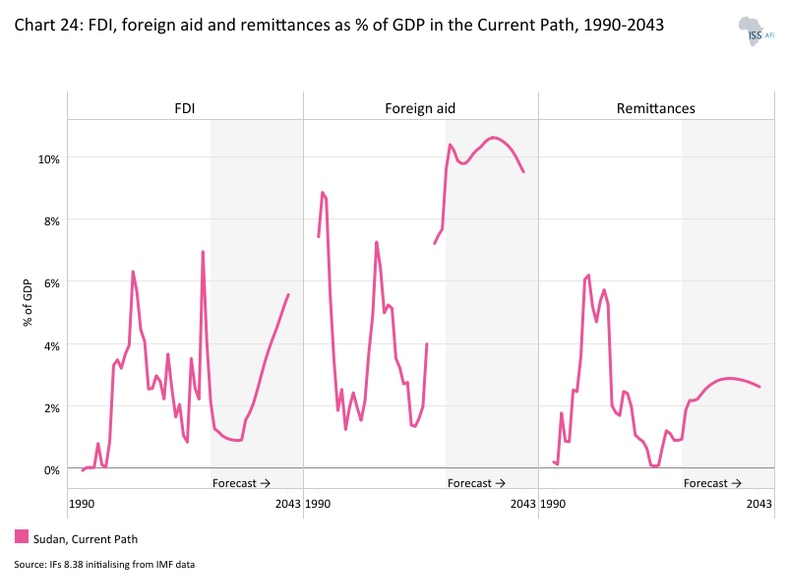
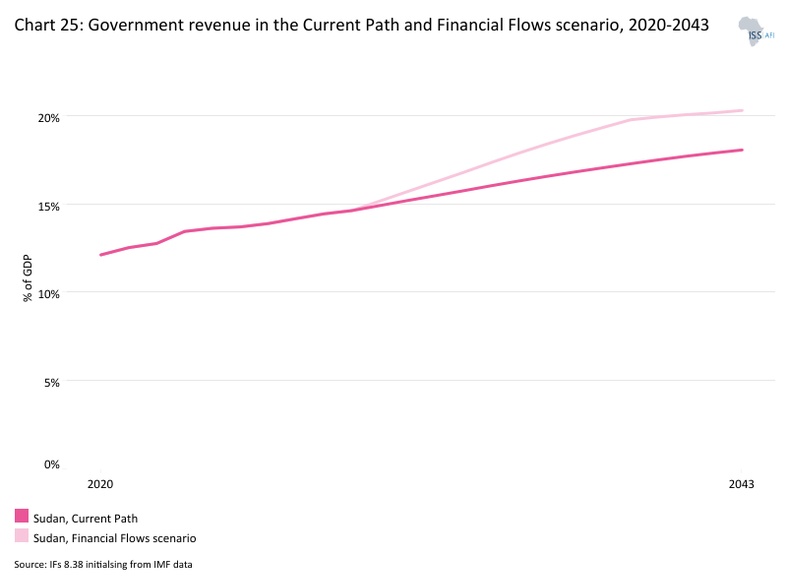
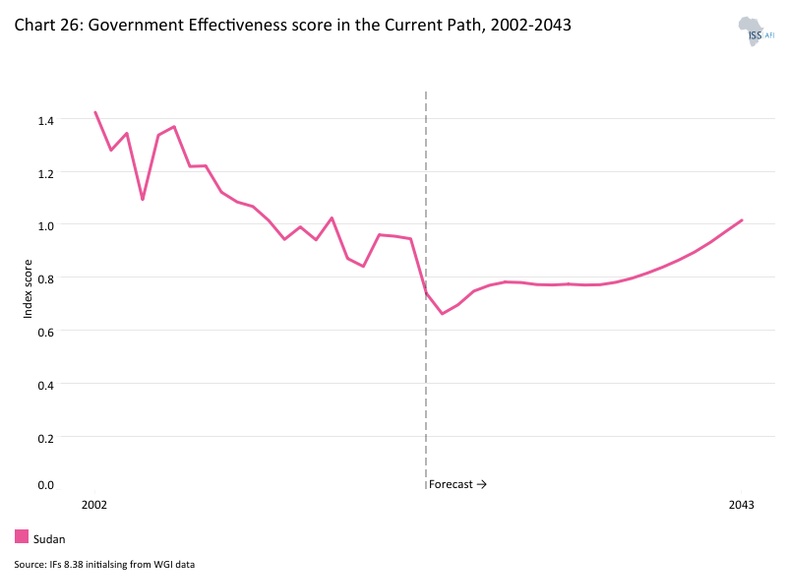
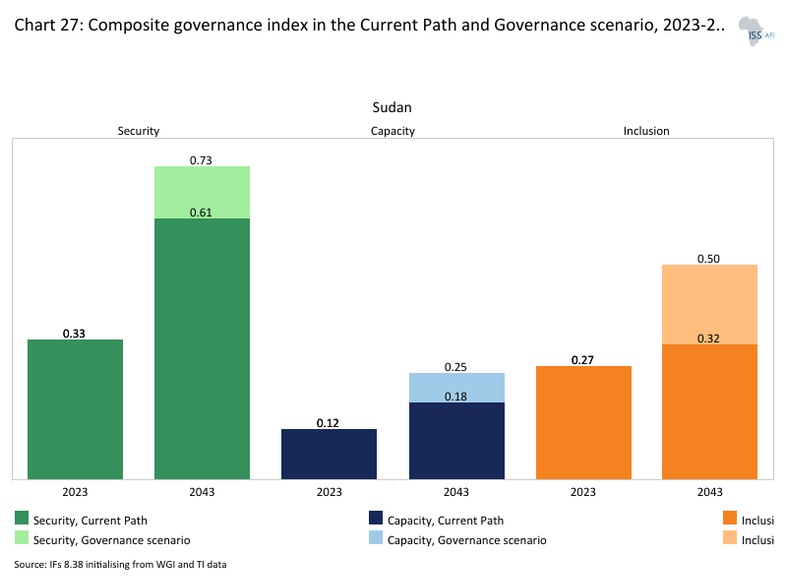
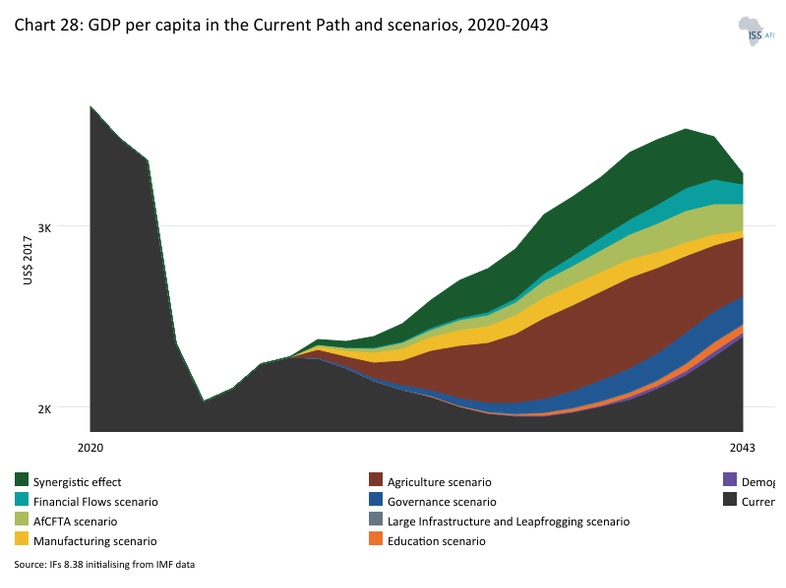
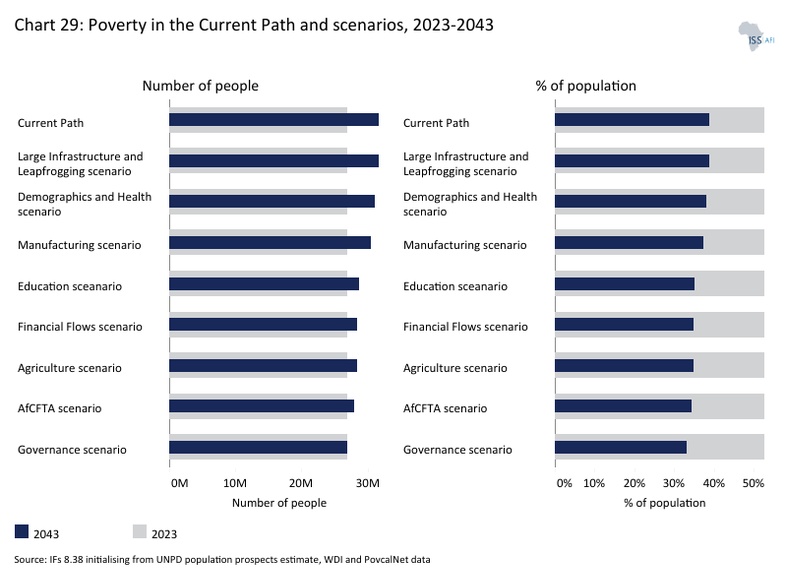
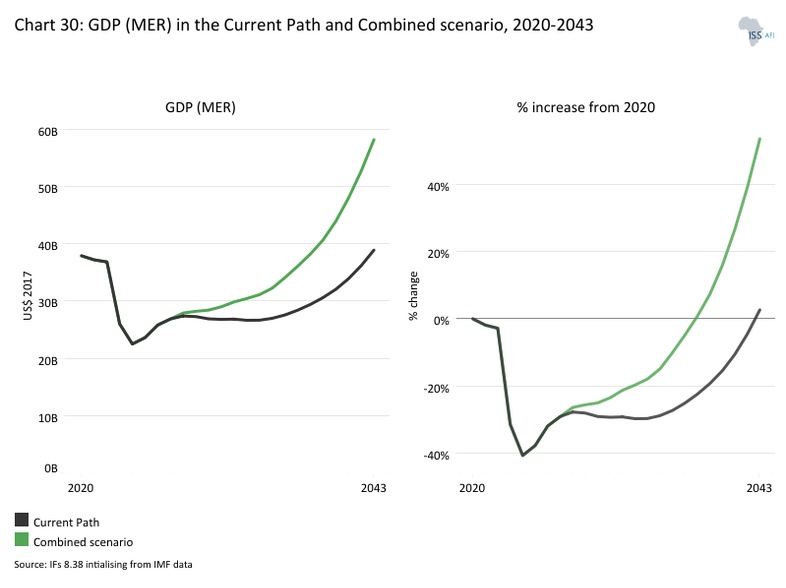
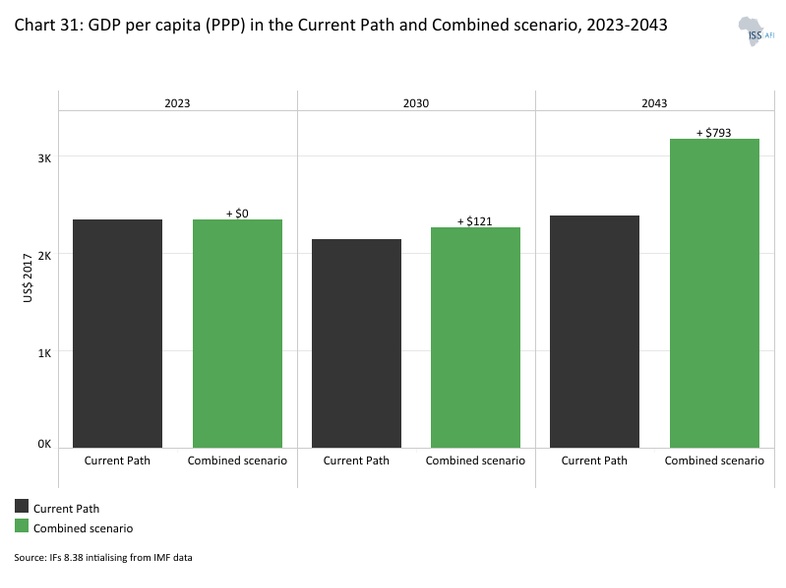
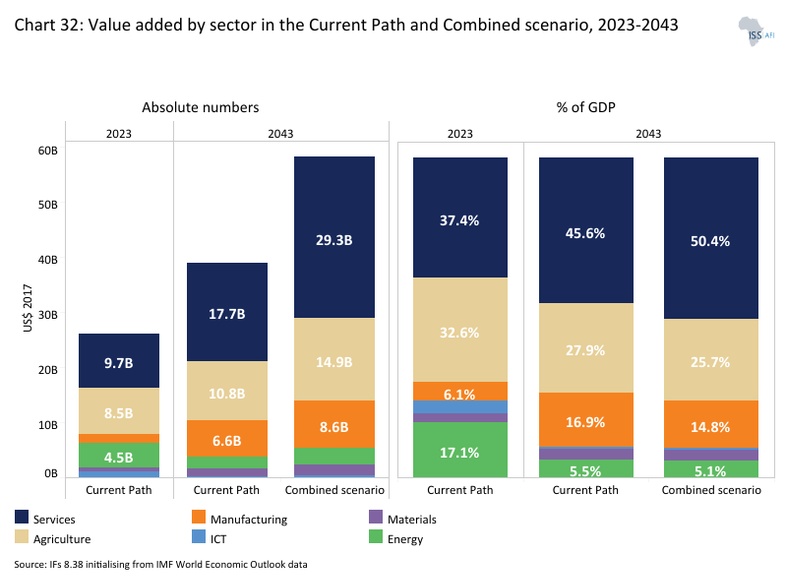
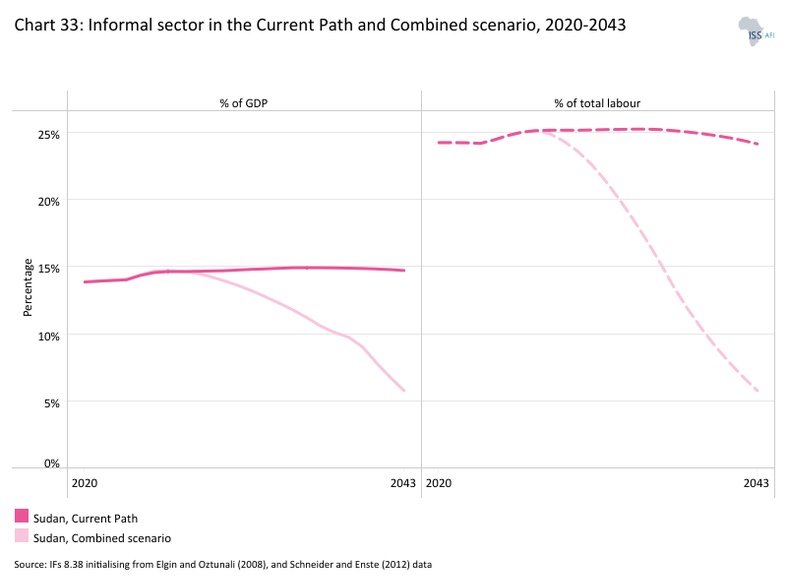
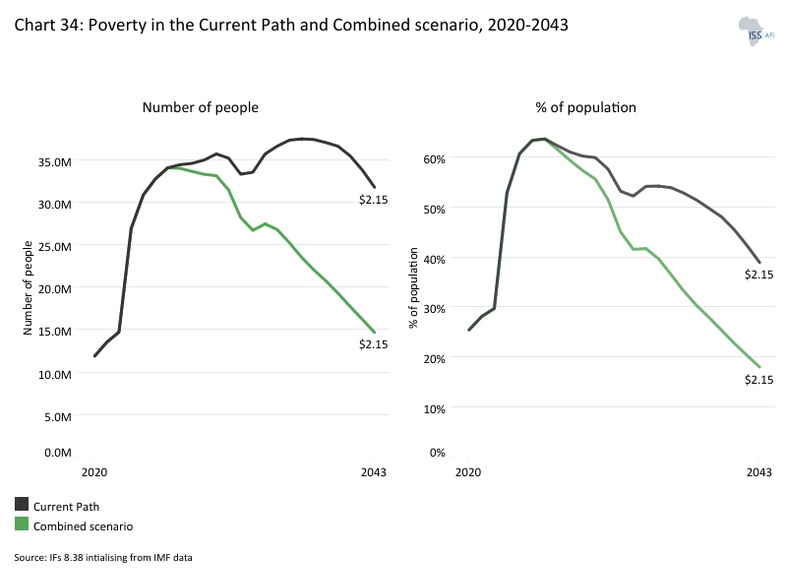
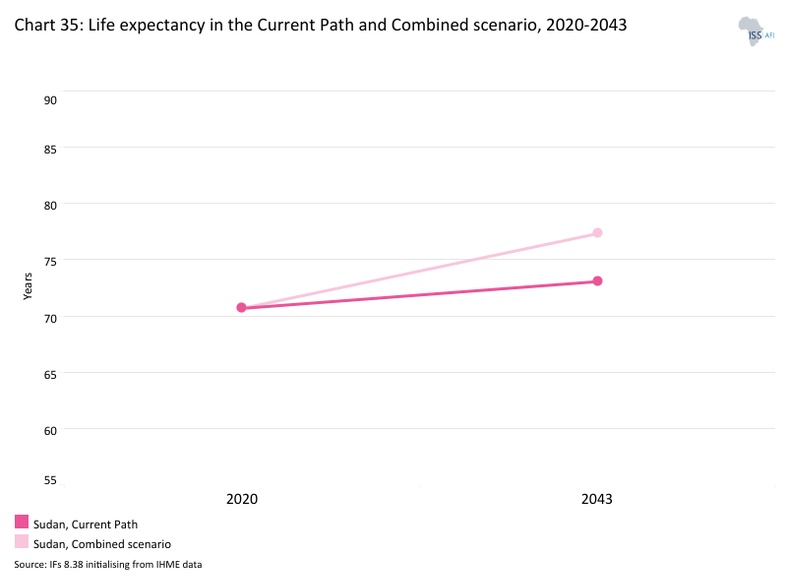
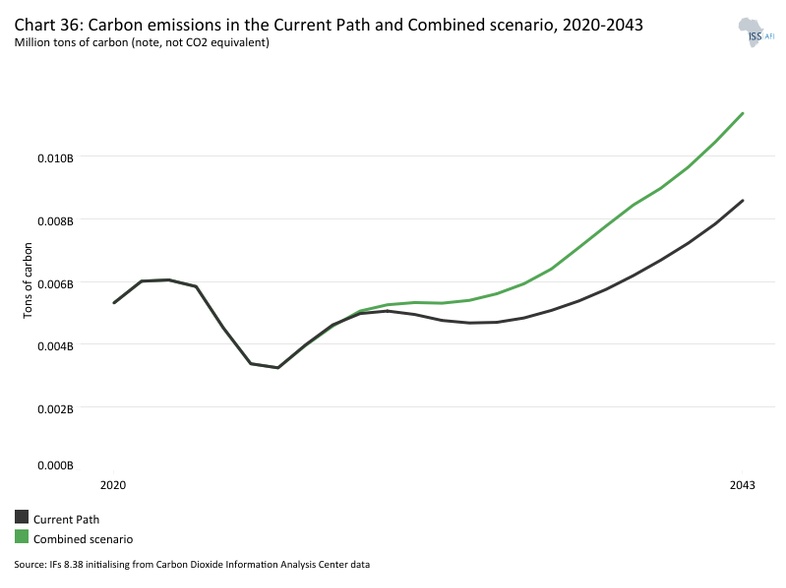
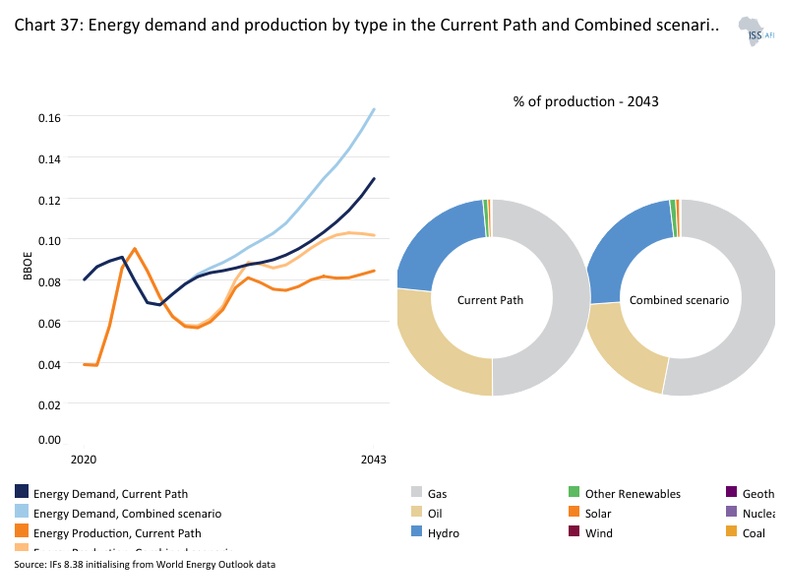
Chart 1 is a political map of Sudan.
Sudan gained independence in 1956. Despite attaining nearly seven decades of autonomy and self-rule from the Anglo-Egyptian condominium, the country’s socio-economic achievements do not match its potential, given its geography, natural resource endowments, and population size. A poor governance record, evident in protracted conflicts and authoritarian rule, has constrained effective state-building and left few prospects for transformative development.
Straddling and connecting north, east and central Africa, Sudan is the third-largest country in Africa after Algeria and DR Congo, with a land area of approximately 1 868 000 square kilometres. It shares borders with seven neighbouring countries, including Libya, Chad, the Central African Republic, Eritrea, Ethiopia, South Sudan and Egypt. Sudan’s maritime access to the Red Sea has the potential to serve as a logistical hub for countries in East Africa and as a gateway to landlocked countries in Central Africa. This geographical setup offers development opportunities through trade and regional integration. However, it has also brought geopolitics into a region with a long history of destabilisation, external interference, persistent intra-state conflict and proxy efforts, most notable in the context of the ongoing war.
Sudan’s capacity to serve as a hegemonic player in the region is heightened by its natural resource endowments. Sudan’s mineral deposit catalogue includes gold, uranium, chromite, gypsum, mica, marble and iron ore. Arable land and a wealth of livestock give Sudan the potential to serve as a key regional player in food value chains. However, these endowments have not translated into broad-based growth, employment creation, or improved welfare. Recurrent conflict, weak institutions, and policy inconsistency have constrained investment, undermined productivity, and limited value addition, leaving natural resource wealth insufficient to drive structural transformation.
Before South Sudan's secession in 2011, Sudan was one of the largest oil producers. Categorised as a petro-state, oil exports accounted for approximately 50% of government revenues and between 90-95% of total export earnings. Other prominent sectors comprising the Sudanese economy include agriculture, manufacturing, mining and services. Chronic trade deficits, particularly after South Sudan’s secession, and a lack of diversification created a contracting economy with high inflation, growing debt and chronic unemployment.
For most of its post-independence political history, the country has been beset by internal conflicts that have weakened its ability to play a leadership role in the region. Decades of internal conflicts have eroded Sudan’s governance and economic resilience, leaving its agricultural systems vulnerable. Today, this legacy of instability continues to undermine food security, as disrupted supply chains and weakened institutions struggle to meet the population’s needs. For example, continuous food price hikes due to a drop in export earnings led to the December 2018 demonstrations that resulted in the removal of President al-Bashir from power in April 2019. This led to the formation of a transitional government in September 2019. The power-sharing agreement between the military and civilian forces, which was expected to last 39 months, was cut short on 25 October 2021 when the Sudanese military, led by General Abdel Fattah al-Burhan, seized power in a military coup.
Since April 2023, Sudan has been embroiled in another civil war between the Sudanese Armed Forces (SAF) and the paramilitary Rapid Support Forces (RSF). The conflict has led to catastrophic humanitarian consequences. More than 150 000 people have been killed and nearly 15 million have been displaced, with 24 million people facing food insecurity, while 19 million people lack access to safe water and sanitation. The war has paralysed governance and resulted in the near-total collapse of state institutions. Beyond displacement and food insecurity, the war has disrupted health and education service delivery, damaged market infrastructure, and weakened production systems across agriculture, manufacturing, and services, deepening vulnerabilities and complicating recovery.
Despite its potential given its natural resources, youthful population, arable land, blue economy and maritime attributes along the Nile and access to the Red Sea, Sudan often ranks amongst the poorest countries according to the world’s human development indicators. According to the 2023-2024 Human Development Report (HDR), Sudan ranks 170 out of 193 countries. This low ranking reflects multi-dimensional constraints, including economic hardship and inequality, disrupted schooling and low learning outcomes, and a health system under severe strain. Recent years suggest stagnation and, since the outbreak of war, a likely regression in key human development outcomes, such as service delivery and household welfare deterioration.
While Sudan's future looks precarious given the nature of the war and the tremendous investments required for post-conflict reconstruction, once a permanent ceasefire is achieved, there’s hope for stabilisation and recovery scenarios. The trifecta of natural resources, a youthful population and propitious geography could help Sudan to realise its development potential and act as a pivotal player in the region. However, there is an urgent need for a political solution to end the conflict and address the humanitarian crisis. Building resilience and reimagining development in Sudan could be crucial steps towards achieving peace and stability.
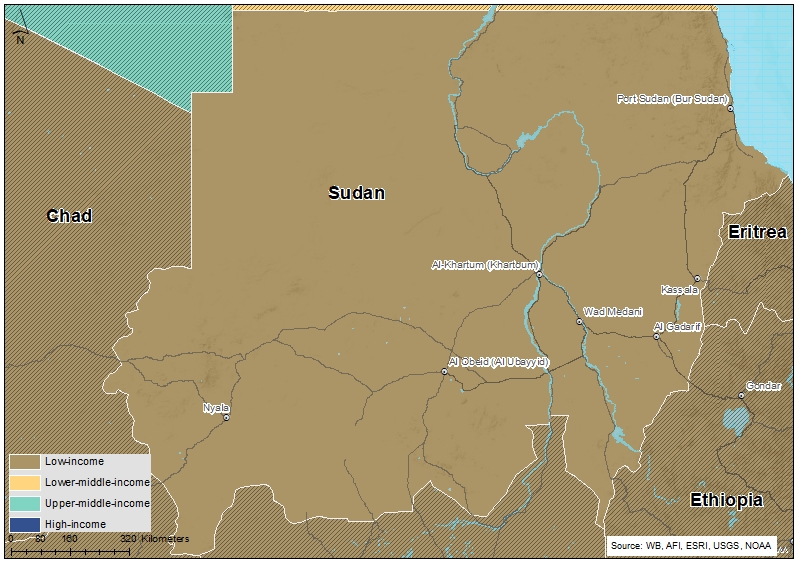
Chart 2 presents the Current Path of the population structure, from 1990 to 2043.
Sudan is the eighth-most populous country in Africa, the fourth-most populous country in East Africa after Ethiopia, Tanzania and Kenya, and the 30th globally. The Sudanese population is estimated at 52 million people, more than double the 22 million in 1990. Before the war, the country’s population grew by 2.7% in 2022, making it the 14th-highest growth rate in Africa and the highest in East Africa. Sudan’s population growth places significant pressure on government finances, as the government must increase its spending on essential social services, including education, healthcare and other amenities, to accommodate the growing population.
The war has had a devastating impact on demography and population, resulting in widespread displacement, loss of life and major disruptions to health, food security and infrastructure. As of mid-2025, nearly 12 million people had been forced to evacuate their homes as a result of the violence, with 7.7 million internally displaced persons (IDPs) and approximately 4.1 million crossing borders to seek refuge in neighbouring nations such as Egypt, South Sudan and Chad. The country now has the world's fastest-growing displacement crisis. Prolonged conflict will continue to influence Sudan's demographic and population profile for many years, affecting population density, age structure and urbanisation trends.
Sudan’s fertility rate fell from 6.1 children per woman of reproductive age in 1990 to 4.3 in 2023. Despite this decline, it remains high and far above the replacement rate. Several factors contribute to this, including the age at marriage, limited levels of female education, low urbanisation, extremely low contraceptive use and cultural norms. On the Current Path, the total fertility rate will decline further to 4 children per woman by 2043. As a result of this high fertility rate, the country has a youthful population. In 2023, 57.2% of Sudanese were below the age of 15 years, 41.3% were in the 15-64 years age group (working age), and 3.4% were 65 years and older. Comparing this with the structure in the 1990s reveals that Sudan’s population structure has not fundamentally changed over the past three decades. The high dependency ratio (population aged 15 and below and 65 and above) significantly affects the government's ability to generate the necessary revenue for development, as fewer individuals are in the working-age population. At the household level, families with more dependents typically save less, reducing overall domestic savings. This, in turn, limits the capital available for investment, impeding economic growth.
Sudan has the 5th-largest youth bulge (the ratio of its population aged 15-29 to the total adult population) in East Africa, after Uganda, Somalia, Eritrea and Ethiopia. The country’s youth bulge stood at about 48.3% in 2023, close to the East African average of 48.9% and below the African average of 45.6%. The median age for Sudan is 18.5 years, which is close to Africa’s median age of 19.3 years.
The large youth population in Sudan presents both opportunities and challenges. On the one hand, it can lead to a youthful labour force and drive positive political change and activism in the country. On the other hand, if the needs of the youth are not adequately addressed, it can increase the risk of criminal violence, conflict and instability, especially with relatively high youth unemployment, estimated to be 12% as of 2023. However, the country can harness the potential of its youthful population by making substantial investments in education and training, equipping young people with the skills they need, and creating opportunities through both government initiatives and private sector involvement.
The structure of Sudan’s population will not change much across the forecast horizon to 2043. The country’s population growth rate will increase to 2.3% by 2043, and the total population will rise to 81.7 million on the Current Path, making Sudan the sixth-most populous country in Africa. The median age will increase to 20.2 years by 2030 and 21.7 years by 2043, while the youth bulge will fall to 45.8% by 2030 and further to 42.1% by 2043. The proportion of people under 15 will decline slightly to 39.3% in 2030 and 37.1% in 2043. Consequently, the share of the working-age population and the population aged 65 and older will increase to 56.7% and 4.0% in 2030, and to 58.1% and 4.8% by 2043, respectively. Despite these shifts, the rapid population growth will continue to place pressure on development and limit improvements in average income, as the government will face significant challenges in addressing the needs of its rapidly expanding, youthful population.
Chart 3 presents a population distribution map for 2023.
Sudan has a population density of approximately 0.29 people per hectare, ranking 11th-least-populated country in Africa. Half of the population lives on just over 15% of the land because of inadequate water supplies in many parts of the country. One-quarter of Sudan is virtually uninhabited, including the deserts of the north and north-west.
Khartoum and Omdurman are Sudan's most densely populated cities, with estimated populations of 6.8 million and 1.2 million, respectively. Its dense population is due to its role as a political, economic and cultural hub, hosting government institutions, businesses, trade centres and transport. Additionally, many internally displaced people seek refuge in Khartoum due to better security and services. Cities and regions in the arid and semi-arid western and southern parts of Sudan tend to be sparsely populated due to harsh climatic conditions that limit agricultural potential and water availability, ongoing conflicts and natural disasters that force population displacement, poor infrastructure and fewer economic opportunities, all of which discourage settlement. Some oil-producing border regions have displaced local populations due to concessions for exploration, contributing to a sparse population in those areas.
In the Current Path, Sudan’s population density will reach 0.47 people per hectare by 2043. However, that will still be significantly lower than the average of 0.77 and 1.0 people per hectare for Africa and East Africa, respectively.
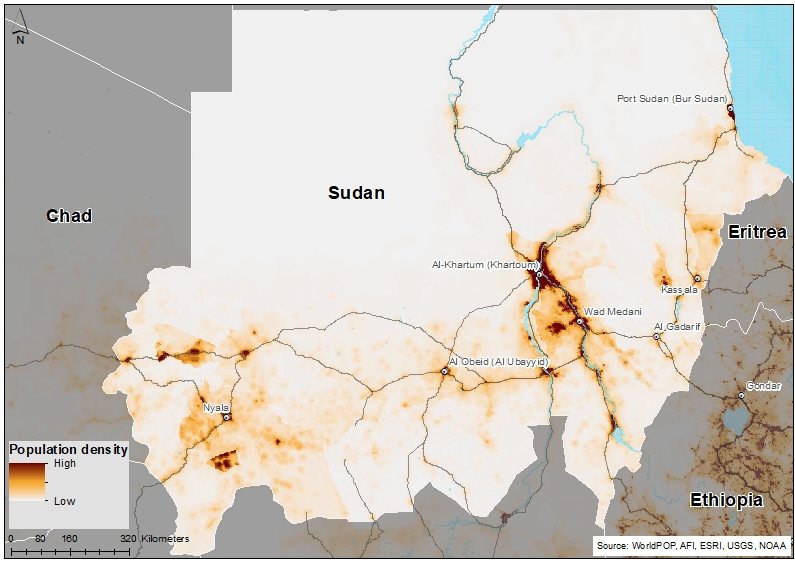
Chart 4 presents the urban and rural population in the Current Path, from 1990 to 2043.
Urbanisation in Sudan is driven largely by conflict-induced displacement, environmental and economic challenges in rural areas, and the concentration of opportunities in a few key urban centres. In 1990, close to two-thirds of Sudanese lived in rural areas, making Sudan predominantly rural. The country has experienced relatively rapid urbanisation over the past three decades compared to its income peers in Africa. It ranked 8th among the urbanised countries in East Africa and 13th among Africa’s low-income countries. Now, over 18.2 million Sudanese, equivalent to 35.3% of the population, live in urban areas. This rate is above the 30.2% and 32.6% averages of low-income countries in Africa and East Africa, respectively.
Urbanisation has been more pronounced in areas of the country with better-developed trade. With few exceptions, all major cities and towns in Sudan are located along the Nile, and one of its tributaries or along the coast of the Red Sea. The largest urban areas are the capital, Khartoum, and Omdurman, located roughly in the centre of the country, along with other regional capitals such as Nyala, Port Sudan and Kassala.
On the Current Path, Sudan's urban population will grow modestly, reaching 42.8% by 2043. Despite the country's overall slow pace of urbanisation, some cities, particularly the capital, are set to experience rapid growth due to the war's impact. As the SAF recaptures Khartoum in early 2025, it is likely to experience an influx of returnees. If not well managed, such urbanisation could lead to problems such as unemployment, poverty, inadequate healthcare, poor sanitation, the expansion of urban slums and environmental degradation. Already, a high proportion of the urban population lives in slums, estimated at 74% in 2022. This places considerable strain on public infrastructure, resulting in overcrowded roads, inadequate public transportation, and limited access to essential services such as healthcare and education. It thus requires careful planning and investment in sustainable development to ensure positive outcomes.
Chart 5 presents GDP in market exchange rates (MER) and growth rate in the Current Path, from 1990 to 2043.
The Sudanese economy was the fifth-largest in East Africa (after Ethiopia, Kenya, Tanzania and Uganda) and the fourth-largest among the 23 low-income countries in Africa (after Ethiopia, DR Congo and Uganda) in 2022. Its GDP measured in market exchange rates (MER) tripled from US$15.7 billion in 1990 to US$45.4 billion in 2010 before the secession of South Sudan. During this period, the average GDP growth was estimated at 5.0% per annum, above the average of 3.6% for low-income countries in Africa. This relatively stronger performance compared to its income peers can be attributed to its large volumes of oil export that spur growth in the country. The secession of South Sudan led to the loss of 75% of its oil resources, which accounted for more than half of Sudan's government revenue and 90% of its exports. This shock resulted in severe challenges, including double-digit consumer price inflation of over 40%, rapid exchange rate depreciation, and a significant trade deficit, which, together with increased fuel prices, triggered violent protests in the country. Ultimately, the economy contracted by 17% in 2012, reflecting the underlying macroeconomic shocks occasioned by the secession.
The economy began to recover in 2013 and continued a positive economic trajectory until 2017. The stable growth within this period was driven by increased exports of gold and oil and supported by government economic reforms. These reforms include the implementation of the Five-Year Economic Reform Program (2015-2019), exchange rate liberalisation and the Investment Encouragement Act (2013), which provided fiscal incentives and legal protections to attract investment. A modest attempt at fiscal consolidation through subsidy reductions and improved revenue mobilisation also reduced fiscal deficit and curbed inflation, all of which contributed to increased investment and donor support.
However, since the coup in April 2019, Sudan has been trapped in political instability, conflict and an economic mire with currency depreciation, crippling debts, rising inflation and food shortages. Multiple shocks to the economy have derailed Sudan’s economic recovery and worsened macroeconomic conditions, leading the country to regress from a lower-middle-income to low-income status in July 2020. Within this period, three key factors underlie this economic contraction. The first is the recurrent political instability that has plagued the country. Continuous food price hikes led to the December 2018 demonstrations that resulted in the removal of President al-Bashir from power in April 2019. The October 2021 military coup that toppled the transitional government also constrained economic recovery. As such, even the removal of Sudan from the US State Sponsors of Terrorism list to end the 23-year sanctions, which was expected to open the door to aid, debt relief, trade, and investment badly needed to pull the country out of its severe economic crisis, did not materialise. Sudan’s economic growth was further disrupted by the COVID-19 pandemic in 2020. The restrictive measures and protocols instituted to control the virus curtailed economic activities. This, coupled with Russia’s invasion of Ukraine that led to a global food crisis, worsened the domestic economic vulnerabilities.
In 2023, Sudan’s GDP stood at US$32.4 billion, a contraction of 12% from the previous year. It is estimated to have contracted further in 2024. Sudan’s economy was already under severe strain before the current conflict, burdened by high debt levels, weak revenue generation, and stalled structural reforms. The outbreak of conflict has further exacerbated these vulnerabilities, leading to widespread institutional breakdown and economic dislocation. Monetary accommodation and rapid deposit growth have fueled persistent inflationary pressures and widened currency market disparities, prompting authorities to implement emergency measures—such as suspending corporate mobile money transactions—to curb speculative activity.
Annual inflation reached an all-time high of 360% in 2021. It was estimated at 170% in 2024, mainly driven by high food inflation, with soaring prices and foreign exchange shortages placing immense strain on households and businesses alike. High public spending is also resulting in a large fiscal deficit and public debt, largely financed by external borrowing. Public debt stood at about 148% of GDP by the end of 2024, with external debt constituting about 137% of total debt. While this is very high, it represents a decline from the 281% it recorded in 2020 during the COVID-19 pandemic.
The government continues to grapple with limited revenue mobilisation, large fiscal deficits and rising public debt, all of which constrain its policy response. External pressures have compounded the situation: the UAE’s ban on Port Sudan’s maritime and air operations and ongoing US sanctions have significantly restricted trade and access to international financing. Moreover, the emergence of a parallel government in Nyala poses a serious risk of further political fragmentation and an escalation of conflict, threatening to derail any prospects for economic stabilisation and recovery. The attacks in May 2025 on Port Sudan and oil facilities expanded the conflict to previously stable regions, increasing broader economic recovery risks.
A nascent economic recovery is emerging in some urban centres, supported by the gradual return of displaced populations and government initiatives to reestablish key institutions. Satellite trade data indicate improving economic activity in less-affected states and a rebound in external trade during early 2025. Notably, inflation has begun to ease, with monthly inflation rates declining—primarily driven by lower housing and food prices.
On the Current Path, Sudan’s GDP will reach US$38.9 billion by 2043. The average growth rate within this period (2024-2043) is estimated at 1.2%, far below the 6.2% estimated average for low-income countries on the continent. This suggests that Sudan’s growth potential is hindered by recurrent conflict and political instability, even in the long term. The country, therefore, needs to rethink its economic development strategy to focus on economic diversification and value addition to its main commodities. Its huge natural resource deposits, along with its agricultural and renewable energy potential, offer opportunities to grow and transform the economy. Nonetheless, the most pressing need is for peace and stability, which is sine qua non for any economic recovery agenda.
Chart 6 presents the size of the informal economy as per cent of GDP and per cent of total labour (non-agriculture), from 2020 to 2043. The data in our modelling are largely estimates and therefore may differ from other sources.
The informal sector in Sudan constitutes a significant portion of the national economy and exhibits several defining characteristics. The relatively low barriers to entry in the informal sector compared to those in formal industrial enterprises allow individuals to sustain livelihoods with minimal start-up capital. A large share of Sudan’s workforce operates within this sector, with approximately 85% engaged in vulnerable employment and 60% working in subsistence agriculture. Informal enterprises are commonly characterised by low-cost, small-scale activities such as food preparation and sales, tea and coffee vending, tailoring, street vending, domestic services and small-scale manufacturing, including bread and charcoal production.
In 2023, the informal sector in Sudan accounted for approximately 14% of GDP, below the average of 32% for its income peers in Africa. This represents a significant drop from the 27.2% of GDP recorded in 1990. In the Current Path, the size of the informal sector will largely remain the same, even reaching 14.7% of GDP by 2043. The large contrast between its labour force share and contribution to GDP reflects the underlying low productivity, wages and inefficiency that characterise the sector.
Since the 1990s, informal economic activity has increasingly shifted toward urban areas as a result of internal migration driven by conflict, drought and economic hardship. Major cities such as Khartoum, Omdurman and Port Sudan now host substantial concentrations of informal businesses. Most of these enterprises remain unregistered, untaxed and outside formal legal frameworks, which limits their access to financial services, government support and legal protections. Workers in this sector often face precarious employment conditions, lacking social protection or employment benefits. Women are particularly disadvantaged, facing higher unemployment rates and lower wages than men.
Due to their exclusion from formal systems, informal workers often lack access to education, healthcare and social security. The sector’s broad scope—spanning agriculture, trade and services—complicates the design and implementation of targeted policy interventions. Moreover, microfinance institutions have largely failed to meet the needs of informal workers, frequently trapping them in cycles of debt rather than facilitating sustainable economic growth. The private sector has also shown limited engagement, with fragmented and uncoordinated initiatives that rarely address critical areas such as capacity development, credit access and institutional support. Macroeconomic instability and inconsistent policy frameworks further constrain efforts to formalise the sector. Many informal workers remain resistant to formalisation, fearing loss of flexibility or increased taxation, while government-led efforts have often emphasised tax collection over meaningful inclusion and support.
Several initiatives have attempted to extend protection and support to informal workers. The Sudan Family Support Programme (SFSP) and Zakat schemes sought to provide social safety nets, but their effectiveness has been limited by political instability. Programs such as Mobile Training Centres have offered vocational training in carpentry, electrical maintenance and automobile repair to enhance workforce skills. In contrast, organisations such as the Sudanese Women’s General Union (SWGU) have provided health insurance to informal workers, particularly women tea sellers. However, these efforts face sustainability challenges due to limited resources and weak institutional capacity.
Expanding social protection coverage through simplified and inclusive systems can promote productivity and income growth in the informal economy, laying the foundation for gradual formalisation. It also encourages collective bargaining and worker representation through structured stakeholder dialogue. The International Labour Organization (ILO) advocates combining macroeconomic reforms with micro-level interventions, including entrepreneurship support, vocational training, improved access to microfinance and legal frameworks that incentivise formalisation.
Despite ongoing initiatives to formalise the informal sector through training programs, social protection schemes and policy frameworks, persistent challenges—such as economic instability, poor coordination and worker resistance—continue to hinder progress. A comprehensive, multi-level strategy that addresses these systemic barriers is essential to promoting successful formalisation and inclusive economic transformation in Sudan.
Chart 7 presents GDP per capita in the Current Path, from 1990 to 2043, compared with the average for the Africa income group.
In terms of GDP per capita (using the purchasing power parity (PPP) measure for this analysis), Sudan’s GDP per capita improved from US$2 868 in 1990 to US$4 884 in 2011 before the secession of South Sudan. Since then, Sudan has generally recorded a downward trend, with its GDP per capita dropping to US$2 961 in 2023. This represents a 54% contraction from the country's 2012 levels and sends Sudan back to the per capita income levels it recorded in 1992. This is a clear demonstration of the impact that the recurrent conflicts, political instability and the secession of South Sudan have had on the welfare of the Sudanese.
In the medium term (2035), per capita income in Sudan is set to drop further to US$1 941. However, after 2035, the country will begin to record modest improvement with its GDP per capita reaching US$2 384 by 2043. Despite this improvement, Sudan will lose ground to its income-group peers, as their average GDP per capita reaches US$2 998 by 2043, placing Sudan tenth among low-income African countries. The country’s GDP per capita Current Path forecast for 2043 remains below the current levels and worse than the 1960s levels. Slower growth in GDP per capita can have several implications. First, it can lead to slower poverty reduction and limited improvements in living standards in Sudan. Additionally, slow GDP per capita growth may imply that the benefits of economic growth are not evenly distributed or broadly shared, thereby worsening inequality in the country. It may also constrain government revenue, limiting the ability to invest in critical areas such as education, healthcare and infrastructure.
Chart 8 presents the rate and number of poor people in the Current Path from 2020 to 2043.
The IFs forecasting platform projects international measures for extreme poverty. Thus, this study uses the US$2.15 per day poverty line (2017 PPP), unless otherwise specified, to remain consistent with international poverty analyses. As a result, the poverty rates reported here differ from those measured using the national poverty line.
Like many low-income countries in Africa, poverty in Sudan is widespread. In 1990, 8.4 million Sudanese, representing 38.1% of the population, lived below the poverty line of US$2.15, which was half the average rate of 66.6% for low-income countries in Africa. In the past two decades that followed, the country’s efforts at poverty eradication have yielded results, as the poverty rate declined to 15.6% in 2011, far below the average of 50% for low-income countries in Africa. However, since then, Sudan has backslidden with poverty levels rising substantially over the last decade to reach 45% of the population, which corresponds to 22.8 million Sudanese living below the poverty line of US$2.15 in 2023. This takes the country back to extreme poverty levels higher than those it recorded in the 1980s.
Extreme poverty levels in Sudan are set to worsen, reaching nearly 60% of the population in 2030 under the Current Path, translating to almost 36 million people. Yet, the world is targeting to eliminate extreme poverty. However, beyond 2030, extreme poverty is projected to decline to 38.8% of the population by 2043, equivalent to 31.7 million. This means that Sudan will not meet either Sustainable Development Goal 1, which aims to eliminate extreme poverty below 3% by 2030, or the AU Agenda 2063 Goal 1, Aspiration 1, a feat that can only be achieved in 2088 if the current development trajectory persists.
To appreciate the full extent of poverty, one must look beyond monetary poverty, as it tells only part of the story. The Human Development Index (HDI), which measures the average achievement of countries in three main areas: health, knowledge and standard of living, is one such measure. Sudan’s HDI score of 0.511 in 2023 ranks 170 out of 193 countries globally. The global Multidimensional Poverty Index (MPI) also measures acute multidimensional poverty by assessing each person’s overlapping deprivations across 10 indicators in three equally weighted dimensions: health, education and standard of living. The MPI complements the international US$2.15-a-day poverty rate by identifying who is multidimensionally poor and by showing the composition of multidimensional poverty. The headcount or incidence of multidimensional poverty is often several percentage points higher than that of monetary poverty. This implies that individuals living above the monetary poverty line may still suffer deprivations in health, education and/or standard of living.
According to the 2023 UNDP Multidimensional Poverty Index, about 52.3% of Sudanese were considered multidimensionally poor with an intensity of deprivation estimated at 53.4%. An extra 17.7% of the population was considered vulnerable to multidimensional poverty. Likewise, inequality is high in Sudan, although better than the average for Africa’s low-income countries. In 2023, Sudan’s Gini coefficient was 0.33 compared to the average of 0.40 for low-income countries in Africa. Given the devastating impact of the conflict, the actual levels of inequality may be much worse than estimated. Such high levels of income inequality have many negative effects, including a breakdown of social structure and cohesion, which can result in instability. On the Current Path, income inequality in Sudan remains unchanged across the forecast horizon, only slightly declining to 0.30 by 2043.
Sudan has implemented a range of strategies and projects to address poverty and inequality, including Sudan’s Poverty Reduction Strategy Paper (PRSP) for 2021-2023, which focused on macroeconomic stability, inclusive economic growth, human and social development, peace promotion and governance strengthening. The PRSP also integrated gender equity, emphasising job creation for women and youth. Complementary measures include expanding fiscal policies to mobilise domestic and external resources for public investment, improving access to credit for small-scale farmers and supporting microfinance initiatives to generate employment opportunities. Collectively, these strategies aim to reduce poverty and foster sustainable development nationwide. In addition, the World Bank approved US$182 million in 2025 for two key initiatives: the Sudan Health Assistance and Response to Emergencies (SHARE) Project and the Sudan Emergency Crisis Response Safety Net Project. These initiatives aim to enhance healthcare services, provide emergency safety nets and address food insecurity among vulnerable populations affected by conflict and natural disasters.
However, several structural and contextual factors continue to perpetuate poverty in Sudan. Prolonged conflicts have destroyed infrastructure, displaced millions and disrupted livelihoods. The secession of South Sudan in 2011 further deepened fiscal deficits by eliminating a major source of oil revenue, previously a cornerstone of Sudan’s economy. In addition, droughts and desertification have severely reduced agricultural productivity, leading to food shortages and worsening rural poverty. Weak healthcare and education systems limit access to essential services, particularly in remote areas, while high illiteracy rates constrain economic opportunities, further entrenching poverty.
Ongoing political instability and security challenges have also undermined development efforts. The loss of oil revenues, coupled with a heavy external debt burden and restricted access to financing, limits the government’s capacity to implement effective poverty reduction programs. Furthermore, pro-poor spending remains inadequate due to fiscal constraints and low execution rates for poverty-targeted expenditures. Poor infrastructure—especially in transportation, energy and communication—continues to hinder economic growth potential, while climate-related shocks exacerbate food insecurity and displacement. Addressing these challenges requires sustained international support, comprehensive structural reforms and enhanced governance frameworks to build resilience, stimulate inclusive growth and establish a stable foundation for sustainable development.
The eight sectoral scenarios as well as their relationship to the Current Path and the Combined scenario are explained in the Technical page. Chart 9 summarises the approach.
Chart 10 presents the mortality distribution in the Current Path for 2023 and 2043.
The Demographics and Health scenario envisions ambitious improvements in child and maternal mortality rates, enhanced access to modern contraception, and decreased mortality from communicable diseases (e.g., AIDS, diarrhoea, malaria, respiratory infections) and non-communicable diseases (e.g., diabetes), alongside advancements in safe water access and sanitation. This scenario assumes a swift demographic transition supported by heightened investments in health and water, sanitation and hygiene (WaSH) infrastructure.
Visit the themes on Demographics and Health/WaSH for more detail on the scenario structure and interventions.
The IFs model uses the International Classification of Diseases (ICD) to differentiate between three broad categories of diseases: communicable, non-communicable and injuries, as well as 15 subcategories of mortality and morbidity. Historically, Sudan has recorded a relatively large share of deaths from non-communicable diseases and injuries compared to many African countries. In 1990, communicable diseases caused about 131 000 deaths, representing about 51% of total deaths in that year. This was followed by non-communicable diseases that caused 97 740 deaths (38.5% of total deaths) and injuries that caused 25 190 deaths (9.9% of total deaths). Due to the rapid increase in deaths from non-communicable diseases, Sudan reached its epidemiological transition in 2002: the point where deaths from non-communicable diseases outweigh deaths from communicable diseases. This transition will inevitably increase health sector costs, as these patients are more expensive to treat.
By 2023, deaths from non-communicable diseases had risen to 149 360, constituting 55.4% of all deaths in the country, while deaths from communicable diseases and injuries fell to 97 170 (36.1% of all deaths) and 22 860 (8.5% of all deaths), respectively. According to the WHO, the leading causes of death in Sudan are: ischaemic heart disease, stroke, preterm birth complications, lower respiratory, road injury, malaria and measles. However, due to the ongoing conflict, deaths from injuries may be underestimated. Conservative estimates show that over 61 000 deaths occurred between April 2023 and June 2024, with high intentional injury in Khartoum State and Gezira State, the Kordofan and Darfur regions.
Since the onset of the war, Sudan’s healthcare system has suffered catastrophic disruptions, with an estimated 70-80% of health facilities in conflict zones rendered non-functional due to attacks, looting and destruction. Hospitals and primary healthcare centres in Khartoum, Darfur, Kordofan and Al Jazirah have been particularly affected. More than 145 verified attacks on health facilities and personnel have resulted in deaths, service disruptions and severe shortages of essential medical supplies. Consequently, around 65% of Sudan’s population lacks adequate access to healthcare, and in Khartoum, only one in four hospitals remains operational.
The conflict has forced many skilled healthcare professionals to flee or become displaced, leaving those who remain to work under unsafe and resource-constrained conditions. Disease outbreaks such as measles in White Nile State have emerged among displaced populations, worsened by the breakdown of vaccination programs and disease surveillance systems. Women face life-threatening complications due to the absence of reproductive health services, while children are disproportionately affected by malnutrition, disease outbreaks and inadequate paediatric care.
The collapse of healthcare infrastructure has fueled the spread of cholera, malaria, dengue fever and measles, driven by poor sanitation, disrupted vaccination campaigns and inadequate disease surveillance. These outbreaks have disproportionately affected women, children, the elderly and persons with disabilities. Approximately 35% of women lack access to reproductive health services, and 55% of children are at risk of preventable diseases. The situation is further aggravated by economic instability, which has reduced funding for public health and left two-thirds of the population without access to essential services.
Despite these challenges, several efforts are underway to mitigate the crisis. The World Health Organization (WHO) has launched emergency appeals and distributed medical supplies nationwide, providing care for over 22 000 war-wounded patients in 2023. The International Committee of the Red Cross (ICRC) has deployed mobile surgical teams and delivered emergency medical aid to conflict-affected regions. The World Bank has approved US$182 million to support healthcare restoration and social safety nets, including financing for WHO and UNICEF to rebuild health infrastructure and contain disease outbreaks. Collaborative efforts among health institutions, local organisations and civil society groups aim to improve immunisation rates, expand access to healthcare in underserved areas and reduce preventable illnesses. Additionally, partnerships between health and WaSH (Water, Sanitation, and Hygiene) clusters seek to limit disease transmission by improving access to safe drinking water and sanitation facilities.
These interventions are critical as Sudan’s health vulnerabilities deepen amid ongoing conflict, mass displacement and structural instability. Sustained international support, improved governance and long-term investment in healthcare infrastructure are crucial to rebuilding the system and ensuring access to essential health services for all Sudanese. On the Current Path, the epidemiological transition that is already visible will continue, such that non-communicable diseases will be the highest cause of death with 282 720 deaths in the country (about 64.9% of all deaths) by 2043. By then, deaths from communicable diseases will also rise to 115 540, constituting 26.5% of all deaths, while deaths from injuries will constitute the remaining 8.6%. These conditions underscore the urgent need for coordinated humanitarian interventions to restore healthcare delivery and address the escalating crisis.
Access to improved, safe and treated water as well as proper sanitation is crucial for preventing the spread of communicable diseases. Poor water sources and inadequate sanitation are linked to diseases such as diarrhoea, which disproportionately affect children. Sudan has made significant progress towards achieving SDG 6.1 on universal access to safe drinking water. In 2023, 30.6 million Sudanese (constituting 87.2% of the population) had access to an improved water supply. Out of this, 15.6 million people (about 45.8% of the population) had access to a piped water supply in the country. Despite this progress, Sudan’s water systems face severe and compounding challenges, exacerbated by ongoing conflict, infrastructure degradation and limited institutional capacity. Many water delivery systems have become inoperable due to battle damage, poor maintenance and fuel shortages needed to power pumping stations. Urban water networks have been destroyed or neglected, while rural communities rely primarily on hand pumps and protected wells.
On the Current Path, Sudan’s progress will lag behind the SDG target as only 91.3% of the population will have access to improved water by 2030. Even by 2043, it is projected that access to improved water in Sudan will largely remain the same (90.5%), although the share of piped water will rise to constitute 36% of connections, meaning that the country will still miss the SDG target by then.
Access to improved sanitation is limited in Sudan, with many citizens resorting to open defecation and other unimproved methods. In 2000, more than half of the Sudanese resorted to open defecation and 23% used unimproved sanitation. Despite efforts to improve access to safely managed sanitation, the country still lags. By 2023, only about 8.6 million Sudanese (16.9% of the population) had access to safely managed sanitation services, which is slightly above the average of 15.5% for its income-group peers in Africa. More than two-thirds of the Sudanese resort to unimproved sanitation, including open defecation, an inadequate waste management system and the absence of proper toilet facilities, which pose major health and environmental risks to the country.
On the Current Path, the proportion of the population with access to safely managed sanitation will decline to 13.8% in 2030, before rising to 22.5% by 2043. This means that Sudan will lag in achieving SDG target 6.2, which aims to ensure access to adequate and equitable sanitation and hygiene for all, and to end open defecation. Consequently, the share of the population with unimproved sanitation access will rise to 45.8% in 2030, before falling to 36.5% in 2043. The use of open defecation will constitute 23.5% of the population in 2030 and 20.6% by 2043.
Emergency sanitation measures have often been temporary and inadequate, exposing communities to waterborne diseases and gender-based violence due to the lack of privacy and safe sanitation facilities. With the escalation of conflict, the situation has worsened, particularly for women and children, who face disproportionate health risks and vulnerabilities. The government, with international support, has developed strategic frameworks for WaSH, aiming to achieve universal access by 2030. However, the current humanitarian crisis—marked by millions of internally displaced persons (IDPs), limited access to potable water, worsening cholera outbreaks and a broader public health emergency—has severely undermined progress toward these goals.
Key challenges include damaged infrastructure, climate variability leading to both droughts and floods, economic constraints that restrict investment and population displacement, which place additional pressure on already scarce water resources. In response, UNICEF and other humanitarian partners are working to provide emergency water supplies through chlorination, water trucking and rehabilitation of water facilities. However, lasting improvements will require significant infrastructure reconstruction, sustained financing and the implementation of coordinated national strategies for water and sanitation reform.
Chart 11 presents the infant mortality rate in the Current Path and in the Demographics and Health scenario, from 2020 to 2043.
The infant mortality rate is the probability of a child born in a specific year dying before reaching the age of one. It measures the neonatal survival rate and reflects the social, economic and environmental conditions in which children live, including their health care. It is measured as the number of infant deaths per 1 000 live births and is an important marker of a country's overall health system quality.
Historically, Sudan’s infant mortality rate has been lower than the average for its income peers in Africa. In 1990, the country recorded the fifth-lowest infant mortality rate among low-income nations on the continent. However, progress has been slow over the years, as other countries have made faster improvements, causing Sudan to slip to the 12th position by 2023. Beginning in 2022, the infant mortality rate started to rise, surpassing the average rate observed among other low-income African countries. In 2023, the infant mortality rate in Sudan was 44.5 deaths per 1 000 live births, a drop of more than half from the 1990 rate. However, this was slightly higher than the average of 43.8 deaths for low-income countries in Africa.
Infant mortality in Sudan is driven by a combination of interrelated factors, including infectious diseases, malnutrition, limited access to healthcare, maternal health complications and poor sanitation. The leading direct causes include septicemia (blood poisoning), malaria, respiratory infections, gastrointestinal diseases and neonatal malnutrition. The situation in Sudan is aggravated by the lack of functional health facilities, the high cost and limited availability of transportation to medical centres, and unsanitary conditions during delivery and neonatal care. Socioeconomic factors also play a crucial role: lower household income and limited parental education are strongly associated with higher infant mortality rates. Additionally, conflict and population displacement increase the risk of unsafe and unhygienic childbirth conditions, further endangering both mothers and newborns.
On the Current Path, the infant mortality rate will rise further, reaching 51.7 deaths per 1 000 live births in 2030, before eventually falling to 39.2 deaths per 1 000 live births by 2043, a rate higher than recorded in 2017, an indication of retrogression that is expected to occur. At this rate, Sudan will become the country with the fifth-highest infant mortality among low-income countries in Africa. It means that Sudan will not achieve the SDG target of 12 deaths per 1 000 live births even by 2043, which can only be achieved by 2093 in the Current Path projections.
Under the Demographics and Health scenario, Sudan will reduce its infant mortality rate to 41.9 deaths per 1 000 births in 2030 and 25.1 deaths per 1 000 births by 2043. This will be 14 deaths fewer than in the Current Path and at par with the average of low-income countries in Africa by 2043. Although this does not meet the SDG target of 12 deaths per 1 000 births, it pushes Sudan close to it, emphasising the need for the country to invest in improving healthcare services and infrastructure.
Chart 12 presents the demographic dividend in the Current Path and in the Demographics and Health scenario, from 2020 to 2043.
The demographic dividend is the potential of economic growth generated by changes in the population structure. It generally materialises when the ratio of the working-age population to dependants is at least 1.7 to one, meaning that for every dependant, there are 1.7 persons of working age. When there are fewer dependants to care for, it frees up resources for investment in both physical and human capital. However, the growth in the working-age population relative to dependants does not automatically translate into rapid economic growth unless the labour force acquires the needed skills and is absorbed by the labour market. Without sufficient education and employment opportunities to harness their productive power, the growing labour force (especially in urban areas) could become increasingly frustrated by the lack of job opportunities, leading to social tension and even civil instability.
In 2023, the ratio of the working-age population to dependants in Sudan was 1.3 to one, which means that, on average, for every dependant in Sudan, there were only 1.3 persons of working age (15-64 years of age). This is slightly higher than the 1.2-to-one average for low-income countries in Africa. The high dependency rate in Sudan can be attributed to the high fertility rate, as discussed previously. On the Current Path, Sudan’s progress will lag and is unlikely to achieve the minimum ratio of 1.7 working-age persons per dependant required for the materialisation of the demographic dividend, even by 2043. Indeed, Sudan is likely only to achieve this minimum ratio by 2068.
The scenario also pushes the country close to the target such that, by 2043, the ratio of the working-age population to dependants will be 1.4 to one, slightly above the projections in the Current Path and almost on par with the average for its income-group peers in Africa. The growing size of the working-age population in Sudan can be a catalyst for growth if sufficient education and employment are generated to harness their productive power successfully. Otherwise, it could turn into a demographic 'bomb', as many people of working age may remain in poverty, potentially creating frustration, social tension and conflict. This means that Sudan needs to invest in educating its growing population and provide decent job opportunities, not to drag on growth.
Chart 13 presents crop production and demand in the Current Path from 1990 to 2043.
The Agriculture scenario envisions an agricultural revolution that ensures food security through ambitious yet feasible increases in yields per hectare, thanks to improved management, seed, fertiliser technology and expanded irrigation. Efforts to reduce food loss and waste are emphasised, with increased calorie consumption as an indicator of self-sufficiency and prioritising it over food exports. Additionally, enhanced forest protection signifies a commitment to sustainable land use practices.
Visit the theme on Agriculture for our conceptualisation and details on the scenario structure and interventions.
Sudan was once the largest agricultural producer in Africa and the Middle East and has long been regarded as a potential “breadbasket” for the region and beyond. Agriculture remains the backbone of the Sudanese economy, with the majority of the population living in rural areas and depending on farming for both income and food security. The sector employs approximately 65% of the workforce and benefits from the country’s substantial agricultural resources, including an estimated 19.8 million hectares of arable land and access to 21% of the Nile’s water resources under regional agreements.
Sudan produces a wide variety of agricultural commodities, with cereals serving as the country’s primary staple crops. The main cereals include sorghum, millet and wheat. Sorghum is the most widely cultivated crop, followed by millet, which is predominant in regions such as Darfur and Kordofan. Wheat production is concentrated mainly in the Gezira and Northern states. In addition to staple crops, Sudan cultivates several cash crops that play a vital role in export earnings and rural livelihoods. These include cotton, sesame, groundnuts, sugarcane and sunflowers. Notably, sesame production has significantly improved household incomes in parts of Kordofan. Sudan also produces fruits and vegetables, such as watermelons, for both domestic consumption and export markets.
Following South Sudan's secession and the consequent loss of most oil revenues, Sudan’s government has renewed its focus on agriculture as a key driver of economic recovery and diversification. This shift has revived the country’s long-standing aspiration to become a regional agricultural powerhouse. However, the agricultural sector faces severe challenges, many of which have been exacerbated by the ongoing conflict. Fighting in key agricultural regions—particularly Darfur, Kordofan and Gezira—has disrupted farming operations. Looting of agricultural machinery, seeds and fertilisers has further reduced productivity.
Additionally, unsustainable land use practices have contributed to soil erosion and declining soil fertility. Rain-fed agriculture continues to yield far below regional averages, while limited access to quality seeds, fertilisers and agrochemicals further constrains output. The lack of irrigation infrastructure, storage facilities and transportation networks compounds these problems, resulting in post-harvest losses and reduced market access. Moreover, rising input costs and restricted access to financial services have made farming increasingly unprofitable for smallholder farmers.
To address these challenges, several initiatives and partnerships have been launched to support Sudan’s agricultural recovery. The government has identified agriculture as a strategic sector for international cooperation, particularly with partners such as Iran, focusing on knowledge-sharing and capacity-building programs. Policy efforts aim to improve farmers’ access to seeds, fertilisers and agrochemicals through strengthened local production and distribution networks. Concurrently, projects are underway to rehabilitate irrigation systems and improve rural transport infrastructure, thereby enhancing farmers’ market access. International organisations have also supported the development of agricultural input markets and implemented interventions to mitigate the effects of conflict on production.
Total agriculture production in 1990 stood at about 13 million metric tons. Of this, about 10 million metric tons, representing almost 72%, were crops, with the remainder constituting meat production. In 2022, before the war, total agricultural production had grown to 32.1 million metric tons. Of this, crop production constituted about 80.6% (25.4 million metric tons), meat production 19.1%, and fish production constituted the remainder of the total production. However, the prolonged conflict in Sudan has had a devastating impact on food production, leading to a 46% decline in staple crop output in 2023. This was primarily due to mass displacement, restricted access to agricultural inputs and the destruction of critical farming infrastructure.
The total demand for agricultural products in Sudan has consistently exceeded total production. Total demand stood at about 16 million metric tons in 1990, of which 12 million metric tons, equivalent to 75%, were for crops. The remaining demand was for meat (3.9 million tons) and for fish (33 000 tons). Comparing this to the total production (about 13.5 million metric tons) in the same year means that Sudan had an excess demand for agricultural products of about 2.5 million metric tons. Since then, domestic demand has rapidly outpaced production, and by 2022, agricultural demand exceeded domestic production by 4.5 million metric tons, despite increased production. Of the total demand of 22.9 million tons, 82.2% was for crops (30 million tons). The remaining demand was mainly for meat (6.4 million tons), and the lowest demand was for fish (52 000 tons).
The conflict has plunged millions into food poverty and famine conditions. More than 19 million people—approximately 40% of Sudan’s population—are facing severe food insecurity, and the situation is projected to worsen further. Key grain-producing regions, including Darfur, Kordofan and Gezira, have been particularly affected, with some areas experiencing harvest losses of nearly 50%. The destruction of infrastructure, theft of farming assets and trade disruptions have made food increasingly scarce, while continued violence perpetuates a vicious cycle of hunger, displacement and instability.
Despite the projected increase in domestic production, reaching 33.8 million metric tons in 2030 and 37.8 million metric tons in 2043, it will not be enough to meet domestic demand that will rapidly grow to 42.6 million metric tons and 62.1 million metric tons in the same period, respectively. As a result, excess demand for agricultural products will reach 9.3 million metric tons in 2030 and 24.3 million by 2043. This indicates that Sudan faces the risk of food shortages in the future if drastic measures are not taken to revamp the agriculture sector to increase domestic production to meet its growing demand.
With total agricultural demand outpacing domestic production, Sudan is likely to continue relying on imports to meet its domestic demand. In 2022, Sudan’s net import of crops stood at 12.4% of total crop demand, exceeding the average of 7.9% for low-income countries in Africa. In the Current Path, net crop imports in Sudan will grow rapidly to 24.7% and 45.9% of total crop demand by 2030 and 2043, respectively. This suggests a growing level of national food insecurity in Sudan.
Chart 14 presents the import dependence in the Current Path and the Agriculture scenario, from 2020 to 2043.
In the Agriculture scenario, yields per hectare will increase to 2.2 metric tons by 2043, a 57% improvement compared to the Current Path projection and the average of low-income countries in Africa. Higher yields will boost crop production. In the Agriculture scenario, total crop production will rise to 45.3 million tons, almost 17.2 million metric tons, or 61.2%, more than the Current Path by 2043. The projected increases in crop production under the Agriculture scenario reduce the country's crop import dependency compared to the Current Path. By 2043, the net import of crops will decline to 25.0% in the Agriculture scenario, far below the projected Current Path average of 45.9%. This implies that, despite the devastating impact of the conflict on Sudan’s agriculture sector, the country still has the potential to reduce its food import and become food-sufficient if the conflict ceases and significant steps are taken to revamp the agricultural sector.
Chart 15 depicts the progress through the educational system in the Current Path, for 2023 and 2043.
The Education scenario represents reasonable but ambitious improvements in intake, transition, and graduation rates from primary to tertiary levels and better quality of education at primary and secondary levels. It also models substantive progress towards gender parity at all levels, additional vocational training at the secondary school level, and increases in the share of science and engineering graduates.
Visit the theme on Education for our conceptualisation and details on the scenario structure and interventions.
The education system can be likened to a long funnel through which children enter at the primary level and exit upon completing tertiary education. However, in Sudan, as in many sub-Saharan African countries, the funnel is leaky, with numerous cracks along the way. While many children enter the system at the mouth of the funnel, only a few complete the entire journey from primary to secondary and eventually to tertiary education. Even before the current conflict, educational enrolment rates in Sudan were significantly lower than those of comparable African countries. This situation has been severely worsened by the ongoing conflict, leading to a profound crisis.
The education system has been decimated at all levels as a result of the ongoing war. More than 19 million school-aged children have experienced disruptions in their education, with only 20% of schools currently operational. Many educational facilities have been destroyed, repurposed as shelters or occupied by armed groups. Even before the conflict, the education sector suffered from chronic underfunding, inadequate infrastructure and political instability. Today, widespread poverty and soaring inflation have rendered schooling unaffordable for many families, while teachers often go months without pay, further undermining the sector’s capacity.
Several policies and initiatives have been introduced to address these challenges. Plan International advocates for safe and inclusive access to education in conflict zones. At the same time, UNESCO has launched programs to reopen schools, improve teaching quality and mobilise resources for system-wide recovery. In addition, the Global Partnership for Education (GPE) has funded a US$41.9 million program to support 3 000 schools, enhance remote learning opportunities and provide remedial programs for vulnerable children. Efforts are also underway to integrate technology into education, although these are constrained by limited infrastructure.
Despite these interventions, the education sector continues to face severe obstacles. The destruction and repurposing of schools due to ongoing violence have displaced millions of students and teachers. High poverty levels and rising living costs have made education increasingly inaccessible, while many teachers have abandoned their posts because of unpaid salaries and unsafe working conditions. Girls are particularly at risk of dropping out of school due to child marriage, domestic labour responsibilities and safety concerns. Digital learning efforts are further hindered by low internet penetration and low computer ownership.
In 2022, the gross enrolment rate for primary school students in Sudan was 82.1%, a significant improvement from 60% in 2001, but still well below the average of 106.3% for low-income countries in Africa. Comparing this to the net enrolment rate of 63.6% in the same period leads to two important conclusions. First, a significant number of school-age children in Sudan are out of school (as reflected in the low net number). Secondly, many classrooms in Sudan are likely to be crowded with older students (as reflected in the high gross number).
In the Current Path, Sudan's gross enrolment rates will reach 83.3% and 89.8% in 2030 and 2043, respectively. In the same period, the net enrolment rate will be 64.0% in 2030 and 67.4% by 2043. At this rate of progress, the country will still lag behind the average of its income-group peers in Africa. The gross primary completion rate stood at almost 70.5% in 2023, above the average of 59.1% for low-income countries in Africa, indicating that a sizable number of children who enrolled did not complete the last grade of primary school in Sudan. On the Current Path, Sudan’s progress in ensuring more children complete primary school will be slower, reaching 72.7% in 2030, slightly below the average of 73.5% for its income peers in Africa. By 2043, the primary completion rate in Sudan will rise to 71.8%—still below the average for African low-income countries at 83.2%.
Among those who complete primary education, some will transition immediately to the lower-secondary level, others may enrol after spending a few years out of school, and some may never continue to lower-secondary education. Those who do progress may thereafter advance to upper-secondary and eventually to tertiary levels of education.
Consistent with broader trends across low-income countries in Africa, more students in Sudan transition from the primary level to the lower-secondary level than from the lower-secondary to the upper-secondary level. In both cases, however, Sudan’s transition rates are higher than those of its income-group peers on the continent. In 2022, the gross enrolment rates for lower- and upper-secondary education in Sudan stood at 61.2% and 41.3%, respectively, compared to 47.0% and 24.7% among its income-group peers in Africa. In the Current Path, Sudan’s progress in gross enrolment at both the lower- and upper-secondary levels is projected to lag behind that of its peers.
By 2043, these figures are projected to rise modestly to 69.8% and 41.1%, respectively, both remaining below the average rates for countries in Sudan’s income group in Africa. This trend highlights a significant drop in student retention between the lower- and upper-secondary levels of education. Completion rates in Sudan dropped from 48.2% at the lower-secondary level to just 30.2% at the upper-secondary level, indicative of a rapid contraction in the educational funnel. In the Current Path, Sudan is projected to experience further regression, with lower- and upper-secondary completion rates expected to decline modestly to 45.1% and 28.1%, respectively, by 2043—significantly below the average for low-income countries in Africa.
At the tertiary level, the situation is even more concerning. In 2022, only 16.9% of individuals within the relevant age group were enrolled in tertiary institutions in Sudan. Although this figure is low, it was roughly twice the average income level of the country’s peers at the time. Since the war, Sudanese universities and higher education institutions have suffered extensive destruction and mass displacement of both students and faculty. Despite these severe challenges, some individuals and institutions have demonstrated resilience by continuing academic and research activities both within Sudan and in neighbouring countries.
In the Current Path, Sudan’s progress is expected to slow significantly. By 2043, tertiary enrolment will decline to 11.6%, by which point the average rate for its peers will have surpassed it. Similarly, only 12% of the eligible age group in Sudan graduated from a tertiary institution with at least a first degree in 2023. This rate is projected to fall steadily to 6.4% in 2030 and then rise back, slowly, to 7.1% by 2043—both figures well below the average for other low-income African countries. In summary, the educational bottleneck that begins at the lower-secondary level continues to tighten progressively through the upper-secondary and tertiary stages, severely constraining the country’s human capital development.
Technical and Vocational Education and Training (TVET) has gained growing recognition as a strategic pathway to address skills shortages and youth unemployment. Efforts are being made to integrate TVET with general education, enabling students to acquire both practical skills and foundational knowledge. Sudan is also drawing lessons from successful international models, such as Germany’s dual vocational system, to reduce the stigma associated with TVET as “education for dropouts”. Mobile classrooms and community-based initiatives are being deployed to reach displaced learners, while partnerships with global organisations are helping to design labour-market-aligned curricula and invest in teacher training for vocational programs.
However, significant funding gaps continue to limit the expansion and sustainability of these initiatives. Enrolment in vocational programs in Sudan remains extremely low. In 2022, only 2.4% of upper-secondary school students were enrolled in vocational training programs, a rate projected to remain unchanged even by 2043. This is far below the average of 24.7% observed among low-income countries in Africa. At the tertiary level, however, the picture is somewhat different. In 2022, about 28% of tertiary students in Sudan were enrolled in science and engineering programs, a relatively high proportion compared to similar countries. Yet, in the Current Path, progress in this area is expected to stagnate, with the share declining slightly to 25% by 2043. A comprehensive and well-coordinated approach—linking humanitarian assistance, system rebuilding and long-term investment in human capital and learning systems in Sudan.
Despite ongoing efforts to improve female enrolment, significant gender disparities in education persist at higher levels in Sudan. Since the war, girls are especially vulnerable, facing increased risks of violence, early marriage and school dropout, with 2.5 times higher rates than boys and less chance of returning to education post-conflict. In 2022, there were 94 girls enrolled in primary school for every 100 boys, a rate roughly on par with the average for low-income countries in Africa. At the secondary level, however, gender representation was more balanced, with 101 females enrolled in lower-secondary schools for every 100 males, compared to the regional average of 87 females per 100 males in low-income African countries. Although the reversed gender disparity in secondary and higher education is becoming a global phenomenon, in the case of Sudan, it is further exacerbated by the recruitment of young boys into the military and militias. At the tertiary level, gender balance was nearly achieved in 2022, but the Current Path forecast indicates a disproportionate decline in female participation over time. By 2043, there are expected to be only 78.1 female students for every 100 male students, reflecting a widening gender gap in higher education.
Using average standardised international test scores or their equivalents as a proxy for the quality of learning, Sudan’s performance in 2023 reflected moderate outcomes relative to its income peers. The average primary-level test score stood at 28.1 out of 100, roughly on par with the average for its income-group peers in Africa. At the secondary level, the average test score was 38.4 out of 100, slightly above the 37.4 recorded for low-income African countries.
In the Current Path, this trend is expected to persist, with Sudan’s educational performance continuing to trail that of its income-group peers over time. Although Sudan has made efforts to strengthen its education system, significant challenges remain. These include limited access to schooling—particularly for girls and those in rural areas—low educational quality, and inadequate learning resources. The ongoing security situation further exacerbates these issues, and if left unaddressed, could erode the country’s human capital base and undermine future labour productivity.
Chart 16 presents the mean years of education in the Current Path and in the Education scenario, from 2020 to 2043, for the 15 to 24-year age group.
The average years of education among adults aged 15 to 24 serves as a useful indicator of how the stock of knowledge in a society is evolving. In 2022, the mean years of education attained by this age group in Sudan stood at 5.3 years, below the continental average of 5.9 years for low-income countries. In the Current Path, the average Sudanese aged 15-24 will have completed 5.8 years of education by 2043. Under the Education scenario, however, the mean years of schooling are expected to rise to 7.6 years by 2043, representing an improvement of 1.7 years over the Current Path projection.
The Education scenario also shows gains in educational quality. Average primary-level test scores will increase to 30.7 in 2030 and 33.7 in 2043, compared to 28.7 and 29.4, respectively, under the Current Path. At the secondary level, average test scores will rise to 41.4 by 2043, surpassing both the Current Path outcome and the average for low-income African countries. These improvements suggest that the Education scenario has strong potential to enhance access and the quality of education in Sudan, enabling the country to outperform its income-group peers and strengthen its human capital base over time. However, without urgent intervention and a cessation of hostilities, the future of millions of Sudanese children and youth remains at risk. The long-term consequences of this educational collapse will reverberate for generations, undermining the country’s human capital and prospects for sustainable development.
Chart 17 presents the value-add by sector as a share of GDP in the Current Path, for 2023 and 2043.
In the Manufacturing scenario, reasonable but ambitious growth in manufacturing is envisaged through increased investment in the sector, research and development (R&D) and improved government regulation of businesses. This aims to enhance total labour
Visit the theme on Manufacturing for our conceptualisation and details on the scenario structure and interventions.
The manufacturing sector is crucial for the productive transformation of a country’s economy towards sustained high growth, employment creation and improved prosperity. It has backwards and forward linkages with other sectors, such as the agriculture and the service sectors. In Sudan, the manufacturing industry is centred on four major production categories. Agricultural processing forms the backbone of the sector, encompassing sugar refining, vegetable oil production, cotton ginning and textile manufacturing. Light industries include the production of soap, footwear, fertilisers, plastics, furniture and paint, while heavy industries cover oil refining and cement production. In addition, Sudan has emerged as East Africa’s pharmaceutical production hub, and the Giad Industrial Complex plays a pivotal role in manufacturing automobiles, trucks, military equipment and drones.
The country also possesses a significant mining industry, producing approximately 30 tons of gold annually, alongside the extraction and export of asbestos, chromium, mica, kaolin and copper. Khartoum and the central states are the industrial landscape of Sudan. The majority of manufacturing industries in Sudan (66% of all establishments) are concentrated in Khartoum, Gezira, Darfur and Kordofan. The concentration of manufacturing in these areas is largely due to accessible transportation and energy infrastructure, high population density and availability of labour and markets.
Several initiatives are underway to revitalise Sudan’s manufacturing sector. These include relocating factories from conflict zones to safer states, expanding industrial operations into resource-rich regions, and offering investment incentives, such as land grants and streamlined business registration processes. Efforts also focus on enhancing food security through agro-processing industries that cater to both domestic and international markets. Additionally, the government aims to leverage preferential trade agreements to revive dormant industries and integrate them into regional and global value chains. Projects such as the Red Sea Free Trade Zone seek to attract international investors and boost trade. Promoting craft and regional industries for integration into larger production systems is also a key strategy for generating value and creating jobs.
Despite these initiatives, Sudan’s manufacturing sector continues to face multiple structural and operational challenges. Ongoing conflict has disrupted supply chains and destroyed industrial infrastructure, while hyperinflation, volatile input costs, limited foreign exchange reserves and high fuel prices have further constrained operations. Port closures and transportation delays have affected both imports of raw materials and exports of finished goods, while frequent power outages increase production costs. Moreover, weak management practices, inadequate worker training, low wages and limited performance incentives undermine productivity. The sector also suffers from poor marketing systems and weak coordination between production and markets.
Political instability, economic mismanagement and insecurity have severely affected industrial activity, with many enterprises now operating at less than half their capacity. The recent conflict has devastated industrial infrastructure, destroying an estimated 90% of enterprises in Khartoum and the surrounding areas. Although reconstruction efforts have begun, progress remains slow due to logistical challenges, hyperinflation and widespread poverty, which now affects 64% of the population.
The three largest contributors to GDP in Sudan are the services, agriculture and energy sectors. In 2023, the services sector in Sudan contributed US$9.7 billion to the economy, equivalent to 30.0% of GDP. This was followed by the agriculture sector's contribution, valued at US$8.5 billion, equivalent to about 26% of GDP. The energy sector contributed US$4.5 billion, representing 13.7% of GDP in 2023. In the same period, the manufacturing sector accounted for US$1.6 billion, equivalent to 4.9% of GDP. In comparison, the contributions of the information and communications (ICT) and material sectors (which include mining) were valued at US$1.0 billion (3.2% of GDP) and US$723.5 million (2.2% of GDP), respectively.
On the Current Path, the services sector will continue to dominate the economy, contributing to long-term GDP growth, though it will contract in the medium term. By 2043, the services sector will almost double to US$17.7 billion (45.6% of GDP). Although the contribution of the agricultural sector to GDP will decline, it will remain the second-largest contributor over the forecast period and grow in size. Its contribution will be valued at US$10.8 billion (equivalent to 27.9% of GDP) in 2043. The contribution of manufacturing to Sudan's GDP will increase to 16.9% (valued at US$6.6 billion) in 2043. The energy sector in Sudan will be the fourth-largest contributor to GDP, accounting for 5.4% of GDP in 2043. The material and ICT sectors will contribute 3.6% and 0.6% to GDP, respectively, by 2043.
The relative decline of the agricultural sector alongside the modest expansion of the manufacturing sector reflects the expected structural transformation of Sudan’s economy. While this shift has the potential to stimulate economic growth and generate employment, it also risks widening inequality, particularly since a large share of Sudan’s population—especially the poor and vulnerable—relies on agriculture for their livelihoods. Therefore, the transition toward a more industrialised economy must be complemented by robust social protection measures, including welfare transfers and retraining programs for displaced workers. Such interventions are essential to ensure that Sudan’s structural transformation promotes inclusive growth and shared prosperity while safeguarding the well-being of the poor and vulnerable.
Chart 18 presents the contribution of the manufacturing sector to GDP in the Current Path and in the Manufacturing scenario, from 2020 to 2043. The data is in US$ and % of GDP.
In the Manufacturing scenario, Sudan makes modest progress in industrialisation compared to the Current Path. By 2043, the manufacturing sector's share of GDP is about 17.6% (US$7.0 billion). This means that a manufacturing transition can add an extra US$439 million to Sudan's economy. The country’s vast arable land offers opportunities for agro-industrial expansion, while gold mining and other mineral exports present viable paths for industrial diversification. Sudan’s strategic geographic position—linking the Middle East, North Africa and East Africa—could enable it to serve as a regional trade and production hub, particularly for pharmaceuticals and electronics assembly. If stability improves, infrastructure reconstruction and policy reform could attract foreign direct investment (FDI) and stimulate industrial growth.
However, industrialisation is a complex and long-term process that requires strong, collaborative relationships between the state and the private sector. The state plays a crucial role in providing strategic direction, policy support and an enabling environment for industrial growth. For firms to thrive, they require a government with a clear economic vision and strategy, one that efficiently delivers supportive infrastructure and public services, and maintains a regulatory framework that fosters innovation and entrepreneurship. Moreover, successful industrialisation also depends on the government’s ability to facilitate the acquisition of new technologies and expand access to emerging markets and economic opportunities. These elements together create the foundation for sustainable industrial development and competitiveness.
Given this, Sudan must pursue an ambitious manufacturing transition by increasing investment in the sector, promoting research and development (R&D) and creating an enabling environment for the private sector through government regulation that empowers it. In this process, the government should also focus on increasing female labour participation, which currently lags behind male participation, by supporting education, training and affirmative policies. To mitigate the potential rise in inequality that often accompanies a transition to low-end manufacturing, the government should also expand welfare transfers to unskilled workers.
Chart 19 depicts exports and imports as a percentage of GDP, from 2000 to 2043, in the Current Path.
The AfCFTA scenario represents the impact of fully implementing the African Continental Free Trade Agreement by 2034. The scenario increases exports in manufacturing, agriculture, services, ICT, materials and energy exports. It also includes improved multifactor productivity growth from trade and reduced tariffs for all sectors.
Visit the theme on AfCFTA for our conceptualisation and details on the scenario structure and interventions.
Sudan is a member of several regional and international trade organisations, including the World Trade Organization (WTO) (observer status), the African Union (AU) and the Common Market for Eastern and Southern Africa (COMESA). It also participates in the African Continental Free Trade Area (AfCFTA) and the Arab Free Trade Area. Additionally, Sudan has signed several bilateral and regional trade agreements to enhance trade cooperation, such as the COMESA Free Trade Area.
Sudan possesses significant trade potential. Its vast arable land offers opportunities to expand agricultural exports such as sesame seeds, gum Arabic and livestock. Membership in AfCFTA and COMESA offers access to larger regional markets with preferential trade terms. Diversifying into non-traditional sectors, particularly manufacturing, could reduce dependency on raw commodity exports and increase value addition. Moreover, Sudan’s strategic geographic position, linking Middle Eastern and African markets, offers logistical advantages for regional trade expansion.
However, Sudan’s trade sector faces numerous obstacles. Poor transport and logistics infrastructure undermines trade competitiveness, while high customs duties and non-tariff barriers impose additional costs on businesses. This, coupled with the political instability, has also significantly constrained trade development. The ongoing war has severely disrupted both domestic and cross-border trade in Sudan. Embargoes imposed by the Rapid Support Forces (RSF) in Darfur have restricted the movement of local commodities, effectively isolating the region economically. Much of the market infrastructure has been destroyed or rendered non-functional. For instance, the El Fasher livestock market—one of the region’s key trading hubs—was shelled in January 2025, resulting in casualties and the near-total collapse of economic activity in the area.
Historically, Sudan’s economy was less open[1] to trade than its income-group peers in Africa. In 1990, Sudan’s exports and imports accounted for 11.1% of GDP, well below the low-income country average of 32.9% for Africa. By 2023, trade openness in Sudan had contracted to 2.7% of GDP, far below the 47% average for low-income countries. On the Current Path, this trend will reverse, with Sudan’s exports and imports reaching only 31.4% of GDP by 2043, far below the average rates of its income peers in Africa.
Like most African countries, it imports large volumes of mostly finished or processed goods while exporting raw materials, with little or no value addition occurring within the country. This results in low export revenues and higher import expenditures. In 1990, Sudan’s total export volume stood at US$562 million, constituting 4.0% of GDP, far below the average of 12% for its income-group peers. Since then, exports from Sudan have grown rapidly, reaching US$5.4 billion, equivalent to 12.5% of GDP in 2011, before South Sudan's secession. However, since the secession, export revenue has dropped due to the loss of its major oil revenue. By 2022, before the conflict, Sudan’s exports had dropped to US$578 million, equivalent to 1.6% of GDP, far below the average of 18.6% for low-income African countries.
Sudan’s major exports include gold, crude petroleum and agricultural products such as gum Arabic, live sheep, sesame seeds, groundnuts and raw cotton. Sudan’s main export destinations are the United Arab Emirates, China, Italy, Egypt and Turkey. On the Current Path, total exports in Sudan will reach 2.5% of GDP in 2030, equivalent to US$717 million, and 9.6% of GDP valued at US$3.7 billion by 2043. However, this will be less than a third of the average for low-income peers in Africa.
Sudan’s total imports grew from US$1.1 billion in 1990, equivalent to 7.1% of GDP, to US$8 billion in 2009 before eventually declining to US$415 million, representing 1.1% of GDP, in 2022. At that rate, Sudan’s total imports as a proportion of GDP were just a fraction of the estimated average of 28.4% for low-income African countries in the same year. The country’s primary imports include durum wheat, refined petroleum, raw sugar, wheeled tractors and automobiles. Its leading import sources are China, the United Arab Emirates, India, Egypt and Turkey. In the Current Path, total imports to Sudan will reach US$3.3 billion (12.3% of GDP) in 2030 and US$8.5 billion (21.8% of GDP) by 2043. The high import volumes, coupled with the lower exports, result in a trade deficit.
[1] Trade openness measures the extent to which a country is engaged in the global trading system. This is calculated using the sum of the total exports and the total imports over the total GDP.
Chart 20 presents the trade balance in the Current Path and in the AfCFTA scenario, from 2020 to 2043 as a percentage of GDP.
Sudan has a chronic trade deficit, as exports cover only about half of imports. In 2023, its trade deficit constituted 4.2% of GDP, below the average of 12.3% for low-income African countries. The low trade deficit was mainly due to the trade disruptions caused by the war. In the AfCFTA scenario, Sudan will record an improvement in its trade balance. By 2043, Sudan’s trade deficit under the Current Path will amount to about 13.6% of GDP. In contrast, in the same year, the AfCFTA scenario will mitigate this situation, leading to a slightly lower deficit of 11.4% of GDP. Despite this limited improvement in the trade balance, Sudan can still benefit substantially from the AfCFTA if it is well-positioned.
Chart 21 presents the Current Path of access to electricity for urban, rural and the total population from 2000 to 2043.
The Large Infrastructure and Leapfrogging scenario involves ambitious investments in road and renewable energy infrastructure, improved electricity access and accelerated broadband connectivity. It emphasises adopting modern technologies to enhance government efficiency and incorporates significant investments in major infrastructure projects like rail, ports and airports (other infra) while highlighting the positive impacts of renewables and ICT.
Visit the themes on Large Infrastructure and Leapfrogging for our conceptualisation and details on the scenario structure and interventions.
Modern infrastructure can improve productivity, support healthy lifestyles, boost educational outcomes and facilitate government effectiveness. This study focused on both physical and digital infrastructure, including roads, electricity access and ICT. Although Sudan has made strides in improving the quality and quantity of basic infrastructure, its infrastructure stock is limited and ageing. The Africa Infrastructure Development Index (AIDI) consists of four composite indicators—needs in transport, electricity, ICT, and water supply and sanitation. According to the 2025 AIDI, Sudan ranks 24th with a score of 72.3 in infrastructure development. The relatively higher score is driven by performance in the water supply and sanitation index.
Transport infrastructure, such as roads and railways, is a critical driver of economic growth and an important component of development. It facilitates the movement of people and commodities and serves as an enabler of social service provision, such as education and health. However, transportation infrastructure in Sudan is severely challenged. The AIDI ranks Sudan 53rd in 2025 with a score of 1 out of 100 on its Transport Composite Index, only better than South Sudan, reflecting the level of transportation deficit in the country.
The road network suffers from poor maintenance, inadequate funding and accelerated deterioration caused by axle-load violations. Only 100 km of road overlay and rehabilitation are funded annually, far short of the 400-500 km required. Current priorities focus on rehabilitating strategic corridors essential for economic recovery. Upgrading and maintaining road infrastructure is critical for unlocking Sudan’s agricultural potential, enhancing market connectivity and reducing freight costs.
In 2022, the total length of roads in Sudan was estimated at 30 217 km, of which only 8 007 km, equivalent to 26.4%, were paved. The proportion of paved roads in Sudan is still high relative to its income peers. The ongoing conflict in Sudan has inflicted severe damage on the country’s infrastructure, with long-term repercussions for the economy. The destruction of bridges and major transport infrastructure in major cities, particularly Khartoum, is hindering transportation access. The Khartoum International Airport lies in ruins, with burnt aircraft scattered across the tarmac, and most downtown buildings reduced to charred shells. Sudanese authorities estimate the cost of infrastructure reconstruction to be between US$300 billion and US$700 billion. However, recovery prospects remain limited due to persistent violence and a global decline in foreign aid, particularly from the United States.
On the Current Path, the total road network in Sudan will increase to 38 853 km in 2030, of which only 29% will be paved. By 2043, the total road network will rise to 62 949 km, of which paved roads will constitute 33.9%, close to the average of 34.9% across Africa’s low-income countries.
Sudan’s energy mix is dominated by hydropower and fossil thermal generation, with biomass accounting for 52% of total energy consumption, followed by oil products (38%) and electricity (10%). Wood and charcoal remain the primary sources of energy for cooking and heating, particularly in rural areas, while solar power initiatives remain limited in scale. Although Sudan possesses natural gas reserves, development has stalled due to concerns about commercial viability.
In 2022, 63.2% of the people in Sudan had access to electricity. This was above the average of 37.1% of low-income countries in Africa. Similar to the trend observed in most low-income countries in Africa, an overwhelming 84.0% of urban residents, but only 49.4% of rural dwellers, had access to electricity in 2022, reflecting a disparity in favour of urban areas. This low access to electricity, coupled with frequent power outages, hinders economic growth and reduces the quality of life.
Close to 80% of the electricity is generated from hydro, while oil and solar account for 19.2% and 0.9%, respectively. The country’s available generation capacity currently meets only 60% of total demand. At the same time, recent tariff increases have worsened the burden on households, particularly in Darfur and Kordofan, where grid coverage is extremely limited. Although Sudan aims to achieve 80% electricity access by 2031, this target remains highly ambitious due to financial constraints and challenges in expanding transmission and distribution networks. Initiatives such as solar home systems, launched in 2014, have provided only marginal relief, benefiting approximately 1 500 homes by 2018.
The conflict has worsened these challenges, as crucial energy infrastructure has suffered catastrophic damage. The Al-Jaili oil refinery, one of Sudan’s largest, has sustained an estimated US$3 billion in losses, resulting in fuel shortages and environmental hazards. Repeated attacks and looting of energy facilities continue to undermine supply stability and further complicate recovery and reconstruction efforts.
The consequence of such low electricity access rates, especially in rural areas, is that many Sudanese still rely on traditional stoves for cooking. In 2023, 80.5% of households in Sudan used traditional stoves fueled by firewood or charcoal, while 4.2% used improved cookstoves, and 15.2% used modern stoves. This contributes to pollution and carbon emissions, negatively impacting the health of these households. A similar trend is observed for households in most low-income countries in Africa, with 88% using traditional cookstoves.
On the Current Path, access to electricity will reach 62.3% of the population by 2043, which will be above the average for Sudan’s income-group peers (estimated at 59.5% in 2043). The disparity in electricity access in favour of urban residents will continue, such that 83.2% urban residents in Sudan will have access to electricity by 2043. Only 40.7% of Sudanese living in rural areas will have access to electricity by 2043. This suggests that the government needs to intensify its rural electrification efforts to close the gap in electricity access between rural and urban areas.
Aside from physical infrastructure, technological advancement is essential for economic growth. Technology improves productivity and reduces the transaction costs and bottlenecks associated with doing business. It can also enable firms to adopt more efficient technologies, improving productivity and driving economic growth. Sudan scores below 40% on the Global Connectivity Index, indicating limited access to digital tools for most citizens. This digital divide constrains opportunities for micro-, small-, and medium-sized enterprises (MSMEs). Nonetheless, efforts are underway to digitise government operations, expand e-government infrastructure and promote public–private partnerships (PPPs) to stimulate innovation across sectors such as agriculture, education, healthcare and transportation.
In 2023, Sudan had a mobile broadband subscription rate of 54.0 per 100 people, equivalent to 48.2%, above the average of 36.2% for low-income countries on the continent. However, on the Current Path, Sudan’s progress will lag, as mobile broadband subscriptions will rise to 119 per 100 people in 2043, 7% below the average of its income-group peers. Sudan’s progress in fixed broadband access, like that of many other African countries, has lagged mainly because of the rapid expansion of mobile broadband that has rendered fixed broadband less essential. In 2023, the total number of fixed broadband subscriptions in the country was estimated at 2.2 per 100 people, above the average of 1.9 per 100 people in low-income Africa. In the Current Path, fixed broadband subscriptions will rise to 16.9 per 100 people by 2043, below the average of 18.5 subscriptions per 100 people for low-income African economies.
Widespread access to high-speed Internet can improve a country's socio-economic outcomes. Broadband can increase productivity, reduce transaction costs and optimise supply chains, positively affecting economic growth. Sudan has one of the most liberalised ICT sectors in Africa. Recent connection to an undersea fibre-optic cable led to access extensions, efficiency upgrades and reduced telecommunications costs. Despite this, only 26.6% of the Sudanese population had access to the Internet in 2023. Although this was higher than the average of 17.9% in low-income countries, it was half of the rate in Gambia, which has the highest rate among low-income countries.
Also, on the Current Path, Sudan will regress behind its income-group peers, with the proportion of people with access to the Internet in Sudan almost on par with the average for its peers in Africa at 22%. Currently, Sudan’s low Internet service penetration worsens inequality, limits access to essential services and restricts the country's potential for economic growth and development in an increasingly digital world.
Chart 22 presents the number of people using cookstoves in the Current Path and in the Large Infrastructure and Leapfrogging scenario, from 2020 to 2043.
Based on the Large Infrastructure and Leapfrogging scenario, 67.7% of Sudanese will have access to electricity by 2043. Also, 89% of those living in urban areas will have access to electricity by 2043, according to the scenario. The share of people with access to electricity in rural areas will improve to 52.1% by 2043, up from 47% under the Current Path. A major consequence of improved access to electricity is that people switch from traditional cooking to modern stoves. However, in Sudan, this link is not automatic, as other barriers may prevent households from using modern cooking fuels. These barriers can include the cost of using modern fuels, an unstable power supply and even the cost of buying modern stoves.
As a result, 28.0% of households in Sudan will use modern fuels for cooking in the Large Infrastructure and Leapfrogging scenario in 2043, instead of the 21% estimated in the Current Path projection for the same period. The implication is that close to 68.7% Sudanese will still rely on traditional stoves even by 2043. Although this is an improvement over the Current Path, which estimates that almost two-thirds of Sudanese use traditional stoves, it is still very high. The risk of contracting health-related diseases and carbon emissions arising from the use of traditional cookstoves in the country will continue.
Chart 23 presents the percentage of the population and number of people with access to mobile and fixed broadband in the Current Path and in the Large Infrastructure and Leapfrogging scenario, from 2020 to 2043. The user can toggle between mobile and fixed broadband.
In the Large Infrastructure and Leapfrogging scenario, access to fixed broadband will rise to 21.1 per 100 people by 2043. This will be above the average of 18.5 for low-income African countries in 2043. Access to mobile broadband, driven by the aggressive Current Path forecast, will reach 119 subscriptions by 2043. The Large Infrastructure and Leapfrogging scenario has only a marginal impact, below the average of 127.4 for Africa’s low-income countries in the same period.
Chart 24 presents the trends in FDI, aid and remittances in the Current Path and in the Financial Flows scenario as a percentage of GDP, from 1990 to 2043.
The Financial Flows scenario represents a reasonable but ambitious increase in inward flows of worker remittances, aid to poor countries and an increase in the stock of foreign direct investment (FDI) and additional portfolio investment inflows. We reduce outward financial flows to emulate a reduction in illicit financial outflows.
Visit the theme on Financial Flows for our conceptualisation and details on the scenario structure and interventions.
Sudan is a significant recipient of official development assistance (ODA) in Africa. It is currently one of the many countries in sub-Saharan Africa that still rely heavily on foreign aid to provide basic services, such as education and health. In 1990, Sudan received 7.4% of its GDP in aid, compared to 14.3% for other low-income African countries in the same period. By 2023, total aid as a percentage of GDP stood at 7.7%, equivalent to US$2.5 billion. This was close to the average of 8% for other low-income countries in Africa. Like most states in the Horn of Africa, Sudan relies heavily on aid from the Gulf countries.
Aid in Sudan is primarily directed toward humanitarian assistance, targeting vulnerable populations such as internally displaced persons (IDPs), refugees and food-insecure communities. Humanitarian aid primarily provides life-saving services, including healthcare, water and sanitation, and education, while also addressing acute food insecurity through emergency food assistance. In addition, aid programs support livelihood recovery by supplying agricultural inputs, rebuilding essential infrastructure and mitigating the effects of conflict, flooding and disease outbreaks.
On the Current Path, foreign aid will rise to 9.5% of GDP, equivalent to US$3.7 billion in 2043, surpassing the average of 4.8% of GDP for other low-income countries in Africa. The rise in aid to Sudan reflects both the anticipated slow economic growth and donor support for humanitarian purposes amid the conflict. This suggests that Sudan’s economy will remain heavily dependent on foreign aid in the coming years, particularly in critical sectors such as education, healthcare and humanitarian assistance. A sharp decline in aid flows over the medium term could have devastating consequences, further weakening the economy, exacerbating poverty and undermining efforts toward recovery and stability.
Foreign Direct Investment (FDI) inflows to Sudan, like in most low-income countries, are historically low. In 1990, total FDI inflows to Sudan amounted to a paltry 0.1% of GDP, below the average for low-income countries in Africa. By 2023, FDI inflows to Sudan reached 1.1% of GDP, still below the average of 4.5% of GDP for low-income African countries. Like most countries in the Horn of Africa, Sudan relies heavily on investment from the Gulf countries. Ethiopia and Sudan are the main destinations of Arab countries' investments in the Horn of Africa. For instance, these two countries accounted for about 95% of total investment by the Gulf states (Saudi Arabia, the UAE, Kuwait and Qatar) in the Horn between 2000 and 2017.
The main sectors attracting FDI in Sudan include fossil fuels, which remain the dominant recipient due to the country’s historical reliance on oil production. Other key sectors include business services (ranked second in FDI inflows), followed by transportation, which attracts substantial investments in logistics and infrastructure. Agriculture also receives notable foreign investment, particularly in sorghum production, livestock and oilseeds, while manufacturing—notably automobile production—represents a growing area of interest.
To encourage greater foreign investment, Sudan has implemented a series of policy and legal reforms under the Investment Act, which provides a framework of incentives and protections. These include tax holidays, reduced corporate tax rates and temporary exemptions for priority sectors. The Act also offers investment guarantees protecting investors from nationalisation and expropriation. At the same time, regulatory reforms have aimed to streamline licensing and permitting processes through institutions such as the Sudanese Investment Encouragement Authority. Additionally, efforts to expand infrastructure, improve connectivity and expand market access are central to Sudan’s investment strategy, alongside broader policy alignment with international standards to strengthen investor confidence.
Despite these initiatives, Sudan continues to face significant challenges in attracting FDI. The poor business climate, recurrent political instability and conflicts deter foreign investment in Sudan. In the 2020 Ease of Doing Business report by the World Bank, Sudan ranked 171 out of 190 countries, reflecting the difficult business environment and the numerous obstacles to investing in Sudan. Persistent political instability undermines investor confidence. Economic volatility, including high inflation and exchange rate fluctuations, further complicates the investment climate. Corruption, bureaucratic inefficiencies and weak institutional capacity hinder effective governance and regulatory enforcement. Moreover, regional instability and geopolitical tensions within the Horn of Africa amplify risks, making Sudan a challenging environment for sustained foreign investment.
On the Current Path, FDI inflows are expected to rise to 5.6% of GDP by 2043. However, this will still be below the average of 4.7% for low-income countries on the continent by 2043. The authorities in Sudan should improve stability and make the necessary reforms to attract more FDI, especially in manufacturing.
Remittances serve as a lifeline for many families in Sudan, mainly supporting immediate consumption. In 1990, total remittance inflows to Sudan were valued at US$27.9 million, equivalent to 0.2% of GDP, about half the average rate for its income peers in Africa. By 2022, this has grown rapidly, such that Sudan received US$892 million in remittances, constituting 2.4% of GDP, roughly at par with the average of 2% for low-income African countries. In Sudan, remittances are primarily received by households to cover essential needs, including food, housing and education. They also play a crucial role in supporting small-scale businesses and agricultural activities, providing a vital source of financial stability for families during periods of economic hardship or crisis.
The ongoing armed conflict in Sudan has had a profound and devastating impact on the country’s financial flows, both domestically and internationally. The war has destroyed banking infrastructure, particularly in conflict-affected regions such as Khartoum and Darfur, making it extremely difficult for individuals and businesses to access funds, conduct financial transactions or maintain savings. As a result, remittances are increasingly managed through informal networks, including hawala systems, local traders and digital platforms, such as Bankak. However, these mechanisms face significant constraints due to limited access to technology, a lack of identification documents and frequent power outages, especially in the areas most affected by conflict. Consequently, transactions are often delayed, and agents charge surcharges of up to 20% for digital withdrawals, further burdening vulnerable populations.
On the Current Path, remittances to Sudan will increase to US$1.0 billion (2.6% of GDP) by 2043, exceeding the average of 1.6% of GDP projected for low-income countries.
Chart 25 presents government revenue in the Current Path and in the Financial Flows scenario, from 2020 to 2043. The data is in US$ 2017 and % of GDP.
In 2022, the government’s total revenue in Sudan amounted to US$3.1 billion, equivalent to 12.8% of GDP—lower than the average of its income-group peers in Africa. However, much of this revenue was due to aid. As a result, Sudan’s revenue without aid was estimated at 5.7% of GDP, below the average of 8.9% for low-income countries in Africa.
In the Financial Flows scenario, government revenue will rise to US$8.4 billion in 2043, representing 20.3% of GDP above the average of 20.0% for low-income countries in Africa in the same year. Compared to the Current Path, the Financial Flows scenario will further improve government revenue in Sudan by almost an extra US$1.3 billion by 2043. This highlights the need for the government of Sudan to implement targeted policies to attract more financial flows, particularly FDI, into the country. The increased government revenue could then be used to support public spending, especially in rebuilding the country after the conflict.
Chart 26 presents the Current Path of government effectiveness comparing the country to the average for the African income group, from 2002 to 2043.
Modelling of governance in this report is conceptualised along three dimensions–security, capacity and inclusion–reflecting the traditional sequencing of the state formation processes. The score for each dimension measures the probability of intra-state conflict and assesses overall risk levels. The second dimension focuses on the state’s capacity to ensure fair regulatory practices, limit corruption and accrue government revenue through taxation. The third dimension, inclusiveness, measures the level of democracy and gender empowerment. Traditionally, these transitions occurred sequentially, with progress in one dimension providing a basis for the next. The composite ‘governance triangle’ measures a state’s progress by averaging these three indices. To this end, it includes an index (0 to 1) for each dimension, with higher scores indicating better outcomes. Combining this modelling with various indices paints an accurate picture of the government’s ability to pursue and implement effective, sustainable development strategies.
Generally, Sudan performs more poorly on governance indices than most African countries. Its composite governance index score of 0.23 in 2023 was 55% of the average for its income peers in Africa. A further disaggregation into the three dimensions of the triangle (i.e. security, capacity and inclusion) shows that the country performs poorly across all these three indices compared to its income peers. This weak performance is further reflected in the Ibrahim Index of African Governance (IIAG), where Sudan ranked 51st out of 54 countries on the continent. Only Eritrea, Somalia and South Sudan ranked lower, underscoring Sudan’s ongoing governance challenges and institutional fragility.
Sudan’s 2023 security index score of 0.32 was almost half the average of 0.61 for low-income countries in Africa. The country has long been beset by conflict and instability. Conflict between a riverain core and militia groups broke out as early as 1963, only 7 years after Sudan gained independence from the Anglo-Egyptian condominium. The first civil war lasted 9 years and concluded with the Addis Ababa Agreement, signed in 1972. While the North was undergoing a transitional period throughout the 1970s following the 1969 military coup, the failure to implement the Addis accord ignited the second civil war in 1983. This conflict lasted more than 20 years and culminated in the signing of the Comprehensive Peace Agreement (CPA) in 2005, which eventually led to South Sudan's secession in July 2011. Combined, the first and second civil wars resulted in the deaths of approximately 2.5 million people and the displacement of four million. The inability to govern and preside over diverse ethnicities, cultures, religions and languages indicates a failed statebuilding process from the very start of Sudan’s independence.
The conflict in Sudan was not confined to Western Sudan and erupted there before the cessation of hostilities in the south. The Darfur conflict, fundamentally an issue of land and water management between different communities, resulted in an over-securitised and heavy-handed response from the central government, which utilised militia groups to roll out a counter-insurgency and scorched earth policy. The Darfur conflict, which officially ended with the signing of the Abuja agreement, caused over 300 000 deaths and 3 million displacements. The level of war crimes, crimes against humanity and genocide perpetrated was unprecedented, leading to the International Criminal Court issuing arrest warrants for six individuals, including the head of state at the time, Omar al-Bashir. Even after the signing of the agreement, insecurity persisted as inter-communal violence waged on and the region only stabilised after the deployment of the United Nations and African Union Mission in Darfur (UNAMID). The root causes of the current civil war are largely a manifestation and repetition of the Darfur conflict.
Also, continuous food price hikes and long-standing grievances stemming from nearly 30 years of rule led to mass demonstrations that began in December 2018. They culminated in the removal of then-President al-Bashir from power in April 2019. This led to the formation of a transitional government in September 2019. The Transitional Government of Sudan enacted ambitious economic and social reforms and engaged in peace negotiations with armed groups to address armed conflicts and grievances. This ultimately led to the signing of the Juba Peace Agreement with nearly all armed opposition in October 2020. Unfortunately, a military takeover took place in October 2021. Key government structures were dissolved, and the terms of the 2019 constitutional charter were suspended. In early January 2022, the prime minister stepped down after his efforts to reach a political settlement between domestic stakeholders failed.
On the Current Path, it is projected that Sudan’s score on the governance security index will reach 0.57 in 2030 and 0.61 by 2043, lower compared to the average of 0.69 for low-income African countries in 2043.
Regarding governance capacity, Sudan’s score in 2023 of 0.12 was less than half the average for low-income Africa. One important reason is that Sudan’s government revenue as a percentage of GDP (excluding aid) was 5.7%, well below the 8.9% average for low-income countries in Africa. In 2024, Sudan ranked 170 out of 180 globally on the corruption perception index (CPI), with a score of 15. This was a seven-point decline from its 2022 peak of 22, showing an increase in corruption with the onset of the war in 2023.
Likewise, the country’s performance on the World Bank government effectiveness index is below that of its peers. The World Bank measures government effectiveness in five key areas, including ‘perceptions of the quality of public services, the quality of the civil service, and the degree of its independence from political pressures, the quality of policy formulation and implementation, and the credibility of the government’s commitment to action such policies’. In these areas, Sudan has consistently ranked amongst the worst performers of government effectiveness. Its 2023 score of 0.74 was far below the average of 1.4 for low-income countries in Africa.
Sudan’s history is marked by decades of poor governance and mismanagement in the central and peripheral ungoverned regions, exacerbated by the weak implementation of policies aimed at resource sharing. Public service provision has largely been concentrated in the capital city, Khartoum, while the Islamic government’s repression of liberties and freedom has significantly impacted civic space. Policy formulation and implementation were largely missing as inept and incapacitated institutions made executive decisions over strategic policy options. Governance, from an administrative and resource-sharing perspective, was therefore limited and dominated by a centralised riverine elite.
The current absence of state institutions and administrative capacity, division and fragmentation within the political and civilian class leading to the formation of rival governments, and the lack of territorial control would likely make Sudan’s post-conflict reconstruction an arduous task that necessitates a reimagination of the state and its functions. Post-war governance in Sudan will require an unprecedented nation and state-building process, not implemented by previous administrations. On the Current Path, Sudan’s progress on the governance capacity index will be slower than the average for its income-group peers, reaching 0.13 by 2030, compared to 0.26. By 2043, its score of 0.18 will still be lower than the average for low-income countries in Africa, estimated at 0.32.
Similar to the security and capacity index, Sudan’s performance on the governance inclusion index is lower than for its income-group peers in Africa. In 2023, Sudan's score of 0.27 on the inclusion index was below the average of 0.44 for its income-group peers on the continent. Sudan’s model of governance is defined by authoritarian rule and the lack of management of diversity. The country has experienced a total of six coups and more than 35 alleged attempts, some of which were thwarted. Civilian rule, following elections, lasted for less than a decade of the country’s nearly 70 years since gaining independence.
The absence of a democratic culture and the lack of rotational power transfer exemplify an authoritarian mode of governance. This, in turn, has had significant implications on security governance, leading to continuous war-making as an avenue towards resource-sharing and development. Centralising decision-making and resources at the expense of the peripheries has resulted in successive civil wars. On the Current Path, Sudan will progress slowly on the governance inclusion index, reaching 0.28 in 2030 and 0.31 by 2043, but this will still be below the average of 0.53 for low-income countries in Africa.
Chart 27 presents the security, capacity and inclusion index for the Current Path versus the Governance scenario, for 2023 and 2043.
This scenario assumes better governance: stability, capacity and inclusion. It measures a state’s progress using the average of these three indices. To this end, it includes an index (0 to 1) for each dimension, with higher scores indicating improved outcomes. participation rates, particularly among females, where appropriate.
Note that the scenario includes increased welfare transfers to unskilled workers, which are paid for by taxes on skilled workers. Note: the two should roughly balance one another in US$ terms. In the context of high poverty levels and inequality, social transfers have proven the most effective short/medium-term measures of alleviating both.
Visit the theme on Governance for a full conceptualisation and details on the scenario structure and interventions.
In the Governance scenario, Sudan's score on the governance composite index will improve to 0.50 by 2043. At that point, it will be about 34% above the Current Path and almost at par with the average for low-income Africa in that year. Its score on the government security index will rise to 0.73 in 2043, which will be 20% more than the Current Path forecast and close to the average for its income peers. Governance capacity will also improve in the Governance scenario, with its score increasing to 0.25 by 2043, representing a 38.9% improvement over the Current Path. In terms of inclusion, the Governance scenario will raise Sudan’s score to 0.50 in 2043, above the Current Path of 0.32, but below the average for low-income countries in Africa.
Chart 28 presents GDP per capita in purchasing power parity (PPP) in the Current Path and each of the eight sectoral scenarios. The data is from 2020 with a forecast to 2043.
The scenarios with the greatest impact on GDP per capita in Sudan by 2043 will be the Agriculture scenario, followed by the Governance, the AfCFTA and the Financial Flows scenarios.
In the Agricultural scenario, Sudan’s GDP per capita (PPP) will increase to US$2 707 by 2043, up US$323 (13.5%) from the Current Path projections for that year.
The second powerful scenario to improve incomes and reduce poverty in Sudan is the Governance scenario. In this scenario, Sudan’s GDP per capita will rise to US$2 539 in 2043, representing a 6.5% (US$155) increase over the Current Path for that year.
Good governance in the form of adherence to the rule of law, reduced corruption and improved transparency and accountability can undoubtedly inspire investor confidence in the economy and attract more FDI into Sudan, which can lead to more rapid economic growth. Also, strong governance systems ensure that public resources are utilised efficiently to address people's needs rather than being diverted into individual pockets, thereby significantly impacting poverty reduction.
Another important scenario for raising living standards is the AfCFTA. In the AfCFTA scenario, Sudan’s GDP per capita will increase to US$2 535 by 2043, representing an increase of US$151 or 6.3% over the Current Path. A regional free trade area such as the AfCFTA increases trade openness, accelerating technology diffusion and thereby improving productivity and innovation activities. This ultimately leads to welfare gains as resources flow to their most productive uses and lower consumer prices. It could also increase Sudan’s exports by providing access to a much larger market and by improving the country’s manufacturing sector through competition.
The Financial Flows scenario also has a strong impact on improving average incomes and reducing extreme poverty in Sudan. By 2043, the scenario will raise GDP per capita to US$2 492, which is US$108 above the Current Path projections. The scenario could also push an additional 3.3 million Sudanese out of extreme poverty. This suggests that external financial flows, particularly aid, remain a crucial source of funding to improve average incomes in Sudan and, therefore, an abrupt end of aid to the country will be detrimental to its economic recovery prospects, at least in the medium term. The country should aim to attract more FDI in the long term, once the conflict ceases, as this is a more sustainable means of funding development priorities.
Chart 29 presents poverty in the Current Path and for each scenario, from 2020 to 2043. The user can select the number of extremely poor people or the percentage of the population.
Regarding poverty reduction, the Governance scenario has the greatest impact, followed by the Agriculture, AfCFTA, and Financial Flows scenarios. These four sectors are the most critical for raising living standards and eradicating poverty in Sudan.
In the Agriculture scenario, the number of poor people will decline to 28.2 million (equivalent to 34.8% of the population), compared to the Current Path of 31.7 million people (38.9%) by 2043, meaning that an agricultural revolution in Sudan has the potential to reduce extreme poverty by an additional 4.7 million people. This is not surprising given that nearly 80% of the Sudanese population depends on the agricultural sector for their livelihoods. The impact of the Agriculture scenario underscores the importance of Sudan’s agricultural sector to economic growth and poverty eradication, with the potential to be Africa's breadbasket. The sector is crucial to the economy, providing a primary source of income and employment for many Sudanese, especially rural populations. Its forward linkage with the manufacturing sector means it also drives economic growth by supplying industries with raw materials, generating income, fostering trade and creating jobs in related industries such as food processing, transportation and retail. Consequently, in Sudan, there is a strong correlation between agricultural yields and economic performance, with the sector contributing significantly to the country’s GDP.
The Governance scenario will also lift 4.8 million additional people out of extreme poverty, compared to the Current Path forecast. Additionally, in the AfCFTA scenario, 3.7 million fewer people will be living in extreme poverty compared to the Current Path. The Financial Flows scenario could also push an additional 3.3 million Sudanese out of extreme poverty. This suggests that external financial flows, particularly aid, remain a crucial source of funding to improve average incomes in Sudan and, therefore, an abrupt end of aid to the country will be detrimental to its economic recovery prospects, at least in the medium term.
Chart 30 presents GDP in the Current Path and in the Combined scenario from 2020 to 2043. The data is in US$ 2017 and at market exchange rates (MER).
The Combined scenario combines all eight sectoral scenarios: Governance, Demographics and Health, Education, Large Infrastructure and Leapfrogging, Agriculture, Manufacturing, AfCFTA and Financial Flows.
In the Combined scenario, Sudan’s GDP will increase to US$58.2 billion by 2043, up US$19.3 billion from the Current Path. In the Combined scenario, the economy is expected to grow at an average of 5.0%, compared with the 2.4% projected in the Current Path.
Chart 31 presents GDP per capita in purchasing power parity (PPP) in the Current Path and the Combined scenario. The data is from 2023 with a forecast to 2043.
In the Combined scenario, the GDP per capita will increase to US$3 176 by 2043. This will be US$792 higher than the Current Path projection of US$2 384, suggesting that the materialisation of the Combined scenario could significantly improve the living standards of the Sudanese population. The projected GDP per capita in this scenario will be US$178 more than the Current Path average for low-income countries in Africa by 2043. The results reflect the importance of a multisectoral program of interventions to rapidly improve average incomes in Sudan. The economic growth projected in the Combined scenario indicates that an integrated development push across sectors is the best way to achieve sustained inclusive growth, increase average incomes and improve living standards in Sudan.
Chart 32 presents the value-add by sector in the Current Path and in the Combined scenario, for 2023 and 2043. The data is in US$ 2017 and as a percentage of GDP.
The structure of the Sudanese economy will undergo a significant transformation in the Combined scenario. The size of each sector increases in the Combined scenario (expressed in US$ terms), given the large overall increase in Sudan’s economy, but their relative contributions to GDP change. By 2043, the services sector will remain the largest contributor to GDP at 50.4% (valued at US$29.3 billion), higher than the Current Path of 45.6% (valued at US$17.7 billion). The share of the agriculture sector will fall to 25.7% (valued at US$14.9) in the Combined scenario, compared to 27.9% (valued at US$10.8) in the Current Path in 2043. The manufacturing sector will be the third-largest contributor to GDP in the scenario by 2043, with a share of 14.8% (equivalent to US$8.6 billion), below the Current Path of 16.7% (US$6.6 billion). In the Combined scenario, the share of energy, materials and ICT will decline below the Current Path to constitute 5.1%, 3.4% and 0.6%, respectively, although all will be larger in absolute terms.
Chart 33 presents the size of the informal sector in the Current Path and in the Combined scenario, from 2020 to 2043.
By 2043, the size of the informal sector in Sudan will decline to 5.8% of GDP, equivalent to US$3.3 billion in absolute value. At this rate, the contribution of the informal economy will be lower than the 14.7% (valued at US$5.7 billion) on the Current Path and below the average for low-income countries in Africa at 28.0%. Likewise, by 2043, there will be about 2.7 million fewer labourers in the informal sector than under the Current Path. This will correspond to informal labour constituting 5.8% of total labour in the Combined scenario, rather than 24.1% in the Current Path, reflecting the anticipated improvement in state capacity driven by higher tax revenue. If Sudanese authorities manage to steadily formalise larger portions of the informal sector through digitisation, for example, it could lead to increased productivity, higher GDP and more government revenue. Indeed, this could raise government revenue without aid to 10.3% of GDP in the scenario, instead of the projected 8.5% of GDP by 2043.
Chart 34 presents poverty in the Current Path and the Combined scenario, for 2023 and 2043.
In the Combined scenario, both the number and proportion of poor people in Sudan will decline significantly. By 2043, about 14.4 million people in the country, equivalent to 18.0% of the population, will be living in extreme poverty. This means that, compared to the Current Path, 17.3 million more people could be lifted out of poverty by 2043 in this scenario—a decline of 20.9 percentage points from the Current Path's 38.9% in 2043. Additionally, the proportion of poor people in Sudan in the scenario will be half the average of 28.3% for low-income African countries by 2043. In the Combined scenario, inequality in Sudan will fall to 0.26 in 2043, compared to 0.30 in the Current Path, indicating that economic growth will be broadly shared.
Chart 35 compares life expectancy in the Current Path with the Combined scenario from 2020 to 2043.
In 2023, the average life expectancy at birth in Sudan was 70.3 years, about 6 years higher than the average for peers in the same income group in Africa. On average, women in Sudan (71.9 years) live 3.3 years longer than men (68.6 years). In the Current Path, life expectancy will increase to only 73.1 years by 2043, slightly higher than the average of 71.8 years for low-income African countries. In the Combined scenario, life expectancy will increase to 77.3 years by 2043, which is 4.2 years higher than the country’s Current Path in that year. In both the Combined scenario and the Current Path, women will be expected to live about two years longer than men by 2043.
Chart 36 compares carbon emissions in the Current Path with the Combined scenario from 2020 to 2043. Note that the data is in million tons of carbon, not CO2 equivalent.
Like most African countries, Sudan’s overall carbon emissions are very low compared to those of advanced economies. In 2023, Sudan released about 5.8 million tons of carbon from fossil fuel use, making it the largest emitter among low-income African countries, though. On the Current Path, carbon emissions from fossil fuels will increase to 8.6 million tons by 2043. The primary sources of carbon emissions in Sudan stem from the energy sector (electricity generation and fuel use), transportation (fossil-fuel-powered vehicles), agriculture (deforestation, land-use change, and livestock) and waste management (landfills and manure). Deforestation, overgrazing, inadequate irrigation practices and unsustainable land-use changes have been major contributors to carbon emissions in Sudan. Additionally, fossil fuel consumption, particularly in the electricity and transportation sectors, has significantly increased greenhouse gas output. The expansion of agriculture and the country’s heavy reliance on wood fuel for energy further exacerbate emissions.
Sudan has initiated several initiatives to reduce emissions and transition toward renewable energy, although these efforts face numerous challenges. The government has set ambitious targets to cut carbon emissions through projects to expand renewable energy capacity. Plans include connecting grid-scale solar and wind power plants with a total capacity of 2 140 MW, expected to avoid over 3.5 million tons of CO₂ emissions. Furthermore, the deployment of standalone and mini-grid renewable solutions totalling 796 MW for residential, agricultural and industrial applications is projected to prevent an additional 1 million tons of CO₂.
Complementary strategies include upgrading transmission infrastructure to reduce grid losses and promoting energy-efficient technologies and appliances to enhance consumption efficiency. In the transport sector, Sudan aims to expand public transportation, implement a 10% biofuel blending policy and increase freight rail usage, all of which contribute to significant emissions reductions and support a transition toward a sustainable, low-carbon economy by 2030.
Despite these efforts, resource limitations, technical constraints and the ongoing conflict pose major barriers to progress. The war has intensified soil erosion, water scarcity and environmental degradation, while disrupting infrastructure maintenance and long-term planning. These challenges underscore the need for international support, institutional strengthening and sustained peace to achieve Sudan’s climate and energy transition goals.
However, the materialisation of the Combined scenario and the achievement of sustainable economic development will come at the cost of increased carbon emissions in Sudan. In the Combined scenario, Sudan’s total carbon emissions will rise to 11.4 million tons, 32.6% higher than what is estimated in the Current Path for the same year.
Chart 37 compares energy demand and production in the Current Path with the Combined scenario from 2020 to 2043. Production is done in nine types, namely oil, gas, coal, hydro, nuclear, solar, wind, geothermal and other renewables. The data is converted into billion barrels of oil equivalent (BBOE) to allow for comparisons. Note that energy production could be for domestic use or for export.
The IFs model forecasts energy production in nine types: namely oil, gas, coal, hydro, nuclear, solar, wind, geothermal and other renewables. The data is converted into billions or millions of barrels of oil equivalent (BOE) to facilitate comparisons. In 2023, the total energy produced in Sudan was equivalent to 86.0 million BOE, while, in the same period, total energy demand was 91.1 million BOE. This signifies a significant energy deficit that the country must address. On the Current Path, total energy demand will outpace production so that the demand for energy will be equivalent to 129.3 million BOE in 2043.
The primary sources of energy in Sudan are oil, followed by gas and hydroelectric power. Before South Sudan's secession, Sudan as a whole was estimated to have 6 billion barrels of oil and 3 trillion cubic feet of natural gas reserves. As most oil blocks are in the territory of South Sudan, the oil-producing capacity of Sudan was heavily diminished by the secession. Crude oil production declined from about 130 000 barrels per day in 2013 to 72 000 barrels per day in 2019.
In 2022, the total amount of oil produced in the country was 17.6 million BOE, constituting 44.6% of total energy production. The total amount of oil produced will increase to 22.6 million BOE, with its share declining to 26.7% of total energy production on the Current Path by 2043. Gas production constituted 36.8% (almost 14.6 million BOE) of total energy production in 2022, but will rapidly rise to about 49.9% (valued at 42.2 million BOE) in 2043 on the Current Path.
Hydropower remains the country’s most developed renewable energy source and continues to play a central role in electricity generation. The total hydroelectric potential from Sudan’s major river systems is estimated at 4 860 megawatts (MW), with about 2 200 MW considered technically feasible by 2030. As of 2017, Sudan’s installed hydropower capacity stood at 1 928 MW, generated from six large reservoir dams. In 2023, hydropower accounted for 17.5% of total energy production (6.9 million BOE), and is projected to increase slightly to 22.0% by 2043 under the Current Path.
Other renewable energies, such as geothermal, nuclear, solar, and wind, are very limited in Sudan despite their potential. Located within the Sunbelt region, Sudan receives some of the highest solar radiation levels in the world, with the potential to generate up to 15 gigawatts (GW) of solar power. The country has so far constructed only a 10-MW solar photovoltaic (PV) plant, of which 5 MW are grid-connected. Two additional 10-MW solar projects are currently under construction with an ambitious target to install a total of 2 190 MW of grid-connected solar PV and 50 MW of solar thermal capacity by 2035.
Likewise, Sudan’s wind energy potential is large, estimated at up to 1.5 GW. However, this resource remains underutilised. Currently, only a single 0.8-MW wind turbine is connected to the national grid, with another 100-MW wind power project under construction, although the government envisions expanding total wind capacity to 1 550 MW by 2035. Despite the country’s geothermal potential in the Red Sea region, no geothermal power plants have yet been installed. However, 54 MW of geothermal capacity is planned by 2030, signalling a step toward diversification. Sudan also has bioenergy capacity—mainly from sugar industry cogeneration—which totals around 199 MW, with less than 20 MW currently grid-connected. Plans call for increasing grid-connected bioenergy capacity to 270 MW by 2032.
Despite these enormous potentials, the transition to renewables necessitates significant investment, political stability and infrastructure improvements. These challenges have been worsened by the ongoing conflict in the country, which has derailed progress in the energy transition.
Energy demand in the Combined scenario will be higher due to the expected expansion of economic activities, creating a larger energy deficit. In the scenario, energy demand in Sudan will jump to 163 million BOE by 2043, 33.8 million BOE above the Current Path. Although the total energy production of 101.8 million BOE in the Combined scenario in 2043 will be 17.3 million BOE above the Current Path, it will still fall short of total demand. By 2043, the excess energy demand of 61.3 million BOE will be 36.8% higher than Current Path projections. These suggest that while Sudan has the potential to grow, it will come at the cost of more emissions and will require more energy to pursue its development agenda. To achieve this, the country can rely on its huge renewable energy potential, as discussed in the Current Path, to pursue a green development pathway.
Chart 38 summarises the policy recommendations.
A delicate balance between immense potential and profound vulnerability shapes Sudan’s development trajectory. The country possesses substantial natural and demographic assets: vast arable land capable of supporting an agricultural transformation, a youthful population, strategic access to the Red Sea and mineral endowments that could form the backbone of a diversified economy. Yet, these advantages have not translated into sustained development.
Sudan’s economic potential has been constrained for decades by the secession of South Sudan, recurrent conflict and political instability, international sanctions and global shocks, including the COVID-19 pandemic. The 2023 civil war has dramatically deepened the country’s economic fragility and reversed years of developmental gains. The economy is now trapped in a cycle of contraction, rising poverty and widening inequality. Average income levels have fallen to those recorded in 1992, while extreme poverty has worsened beyond its incidence in the 1980s. The analysis estimates that Sudan lost US$6.4 billion in 2023 alone due to the conflict, equivalent to a per capita income loss of about US$500. In the same year, nearly 6.9 million additional Sudanese were pushed into extreme poverty as a direct consequence of the war.
On its current trajectory, Sudan will struggle to reduce poverty or achieve meaningful structural transformation. Extreme poverty remains high, inequality declines only marginally and human development outcomes are far below the continental average. Although gradual improvements will occur over the long term, Sudan is unlikely to meet the Sustainable Development Goals or the aspirations of Agenda 2063. The economy faces multidimensional pressures across all key sectors, each requiring urgent and coordinated attention.
To examine the impact of the war on the economy and poverty reduction, using two illustrative scenarios. The first is the No-Conflict scenario, which takes a retrospective view of what the development prospects would have been if the 2023 conflict had not occurred. To do this, the Current Path (adjusted for the impact of the conflict) is compared with Sudan’s development prospects before the conflict (based on the IMF growth projection). The second step was to examine the impact of a protracted conflict in Sudan through 2030, with a delayed economic recovery.
In 2023, Sudan’s GDP in the No-Conflict scenario was estimated at US$32.4 billion. Compared with the Current Path, the economic losses from the conflict in 2023 alone totalled US$6.4 billion. This translates into a GDP per capita loss (in PPP) of about US$500, reflecting a significant deterioration in the standard of living for the Sudanese population. By 2043, Sudan’s GDP under the No-Conflict scenario would have reached US$57.6 billion. This represents an estimated GDP loss of about US$18.8 billion by 2043, equivalent to a per capita income loss of about US$752.
The conflict has also severely undermined progress in poverty reduction. In the No-Conflict scenario, around 20 million Sudanese (representing 39.2% of the population) would have lived below the international poverty line of US$2.15 per day in 2023. Comparing this to the Current Path means that almost 6.9 million more Sudanese were pushed into extreme poverty in 2023 alone due to the conflict. By 2043, this would have worsened such that nearly 13.4 million additional Sudanese would have been pushed into extreme poverty in the Current Path due to the conflict compared to the No-Conflict scenario.
In the Protracted Conflict scenario, Sudan’s GDP is projected to fall to US$23.1 billion in 2043, representing a loss of US$34.5 billion relative to the No-Conflict scenario. This corresponds to a GDP per capita loss of US$1 725 in 2043, underscoring the devastating economic toll of prolonged conflict.
The consequences of poverty are severe. About 52.4 million Sudanese (equivalent to 63.3% of the population) will live below the extreme poverty line of US$2.15 in the Protracted Conflict scenario by 2043. This translates into 34.1 million more people living in extreme poverty compared to the No-Conflict scenario. If the current conflict persists, almost 34 million additional Sudanese risk falling into extreme poverty by 2043. Thus, without peace and recovery efforts, the war will continue to erode livelihoods, reverse development gains and entrench poverty for millions.
While reversing this trajectory is challenging, it is not beyond reach. The Combined scenario presents a realistic yet ambitious outlook for Sudan’s development by 2043. Under this scenario, Sudan’s GDP could expand by an additional US$19.3 billion above the Current Path, with the economy growing at an average rate of 5.0% compared to 2.4% on the Current Path. This translates into an additional US$792 in GDP per capita by 2043. More importantly, 17.3 million more people could be lifted out of extreme poverty in this scenario, and life expectancy would rise by an additional 4.2 years relative to the Current Path. However, realising this scenario comes with trade-offs: carbon emissions would rise by 32.6% compared to the Current Path, underscoring the need for a green, renewable-energy-led development approach.
The sectoral intervention scenarios further demonstrate that targeted and coordinated reforms can significantly enhance outcomes. The Agriculture, Governance, AfCFTA and Financial Flows scenarios show particularly strong impacts on GDP per capita, poverty reduction and economic diversification. These results highlight the centrality of strengthened governance, particularly in ending the conflict, driving an agricultural revolution, promoting regional integration and attracting external financial inflows, such as aid, to Sudan’s long-term development strategy.
The alternative is dire, as the Protracted Conflict scenario illustrates the catastrophic cost of continued instability. If the war were to persist until 2030, Sudan’s GDP would fall to US$23.1 billion by 2043, resulting in losses of US$34.5 billion relative to the No-Conflict scenario. GDP per capita would decline by US$1 750, and an additional 34 million Sudanese would fall into extreme poverty. Such an outcome would entrench humanitarian crises, erode state capacity and close the window for meaningful recovery.
Ultimately, Sudan’s future depends on an urgent political settlement that restores security and the rebuilding of state institutions. Peace is the single most critical precondition for restoring livelihoods, rebuilding the economy and reopening credible pathways toward development and inclusive growth. Beyond ending the conflict, the country must adopt a forward-looking, coherent and data-driven development framework that strengthens governance, revitalises productive sectors, expands opportunities for its youthful population and builds resilience to future shocks. Unlocking its potential further requires the restoration of state institutions and a coordinated long-term strategy that places human development, structural transformation and regional integration at its core. With coherent reforms and sustained commitment, Sudan can transition from fragility toward recovery and from potential to long-term structural transformation.
Based on the modelling results and sectoral analysis, Sudan’s recovery strategy should prioritise the following policy actions:
Governance:
- Stabilise and secure service corridors: Prioritise securing key population centres and economic corridors (ports, markets, irrigation zones, transport nodes) to restart production chains and reverse the paralysis of institutions. This directly supports the baseline assumption that a cessation of hostilities is foundational to recovery.
- Reconstitute core state capability: Establish a minimum-functioning civil administration for revenue collection, basic regulatory delivery, and public financial management to reverse the “absence of state institutions and administrative capacity.”
- Anti-corruption and credibility reforms: Embed transparent emergency procurement, publish budget execution reports, and restore oversight bodies to address the severe governance-capacity constraints, including very weak revenue mobilisation and high perceived corruption.
- Inclusion and social compact: Move beyond the historic centre–periphery imbalance by institutionalising inclusive decision-making and equitable resource-sharing mechanisms, reducing the incentives for “war-making as an avenue towards resource-sharing and development.”
- Protect the poor during transition: Expand welfare transfers and targeted social support as governance improves, consistent with the governance scenario’s emphasis on social transfers to alleviate extreme poverty and reduce inequality.
Agriculture:
- Restore productive capacity in key breadbasket zones: Rapidly rehabilitate agricultural assets and input supply chains in conflict-affected producing regions (e.g., Darfur, Kordofan, Gezira) where disruption, looting and insecurity have undermined yields and market access.
- Scale irrigation and climate resilience: Prioritise investments in irrigation systems and water control to reduce reliance on low-yield rain-fed production and buffer drought/flood variability, while strengthening extension services and land management to curb soil erosion and declining fertility.
- Reduce post-harvest losses: Invest in storage, cold chains where feasible, and rural feeder roads to address post-harvest losses and strengthen market connectivity.
- Re-open rural finance: Develop risk-sharing facilities and simplified financial products for smallholders to address restricted access to finance and rising input costs, which are rendering farming increasingly unprofitable.
- Food security first: Align strategy with the scenario, emphasising improved yields, better seed and fertiliser technology, expanded irrigation, and reduced food loss and waste—prioritising self-sufficiency over exports in the recovery period.
Macroeconomy:
- Emergency macro-stabilisation package: Re-establish basic monetary and fiscal coordination to curb inflationary pressures and restore minimal confidence in transactions, alongside restoring the integrity of payment systems to enable commerce and humanitarian delivery.
- Revenue mobilisation without overburdening recovery: Focus on gradually broadening the tax base through digitisation and simplified compliance, rather than punitive tax drives, to support the state's capacity deficit while protecting fragile livelihoods.
- Diversification through value addition: Tie public investment and incentives to value-chain development in agriculture-linked processing and light manufacturing to reduce dependence on raw commodity exports and widen employment creation.
Manufacturing:
- Industrial recovery zones and relocation support: Formalise safe-area industrial parks and temporary relocation facilities for firms displaced from conflict zones, with targeted energy and logistics support to reduce the binding constraints posed by power outages and transport disruptions.
- Agro-processing as the first mover: Prioritise agro-processing (sugar, vegetable oils, textiles, cotton ginning) to link agricultural recovery to industrial jobs and exports, while stabilising food systems.
- Skills and productivity compact: Pair firm support with worker training and performance systems to address weak worker training and productivity constraints, linked to TVET and targeted upskilling.
- Gender-inclusive labour participation: Implement affirmative policies, training and childcare/safety measures to increase female labour participation, consistent with the manufacturing transition logic and broader inclusion objectives.
- Mitigate inequality during transition: Expand welfare transfers and labour protections for low-skilled workers during early industrialisation, as envisaged in the manufacturing scenario approach.
Trade:
- Restore trade corridors and market infrastructure: Rehabilitate key markets and logistics nodes (including cross-border trade points) that have been destroyed and where movement has been restricted, especially in conflict-affected regions.
- Lower non-tariff barriers and streamline customs: Reduce high trade costs by simplifying customs procedures and tackling non-tariff barriers that impose additional costs on businesses, paired with digital trade facilitation where connectivity allows.
- Export diversification and value addition: Shift from exporting raw materials toward processed goods, leveraging agro-processing and light manufacturing, consistent with the report’s diagnosis of low value addition.
- AfCFTA readiness plan: Create a phased roadmap to exploit preferential market access and productivity gains from trade openness, so Sudan can translate membership into concrete competitiveness improvements rather than nominal participation.
Infrastructure:
- Transport—focus on strategic corridors first: Prioritise road rehabilitation on routes that unlock agricultural areas and connect to markets/ports, recognising that improved road infrastructure reduces freight costs and strengthens market connectivity.
- Energy—close the access and reliability gap:
- Accelerate rural electrification to narrow the pronounced urban–rural disparity in access and reduce welfare losses and productivity constraints.
- Rehabilitate damaged energy assets and protect critical infrastructure to stabilise supply, given war-related damage to key facilities.
- Clean cooking transition as a health–energy co-benefit: Pair electrification with affordability measures and reliable supply to reduce heavy reliance on traditional stoves, lowering indoor air pollution and associated health burdens.
- Digital infrastructure as an enabler: Expand fixed broadband and affordable internet access to support e-government, MSMEs, and service delivery, given low internet penetration and the inequality costs of limited digital access.
Financial Flows:
- Protect and coordinate humanitarian and recovery aid: Maintain predictable aid flows in the medium term, recognising that Sudan remains heavily dependent on aid for basic services and that sharp declines would be devastating for recovery.
- Shift from emergency to catalytic financing: Rebalance aid toward rebuilding productive capacity and foundational systems (PFM, health systems, schools, irrigation, and corridors) to reduce long-run dependency while protecting human development.
- Crowd in FDI with credibility reforms: Improve stability and the business climate to attract more (especially manufacturing) FDI, leveraging investment frameworks while addressing the core deterrents of political instability and weak institutions.
- Formalise remittance channels and reduce transaction costs: Strengthen payment infrastructure, expand access to ID solutions, and regulate to reduce leakage and costs, given the war’s disruption to banking and reliance on informal mechanisms.
- Reduce illicit outflows: Pair improved financial governance with enforcement and transparency measures to align with the Financial Flows scenario logic of reducing outward illicit financial flows.
Health and WaSH:
- Reopen and protect service delivery: Rapidly restore functionality of health facilities and protect health workers, prioritising conflict-affected states and displacement hubs where outbreaks and service collapse are most acute.
- Outbreak control and surveillance reset: Rebuild disease surveillance and vaccination campaigns to contain cholera, malaria, dengue and measles, and re-establish supply chains for essential medicines.
- Maternal and child health as a recovery anchor: Prioritise reproductive health services and paediatric care, given severe access constraints for women and heightened child vulnerability.
- WaSH infrastructure reconstruction: Rehabilitate urban water networks and restore pumping capacity (including fuel/power solutions) where systems have become inoperable. Scale safely managed sanitation and end open defecation through durable community sanitation infrastructure, moving beyond temporary emergency measures that increase disease risk and expose women and children to harm.
- Integrated health–WaSH programming: Institutionalise joint planning and financing between health and WaSH clusters to reduce transmission channels for communicable diseases and improve resilience.
Education:
- Emergency reopening and learning continuity: Reopen schools where feasible, rehabilitate damaged facilities, and deploy temporary/accelerated learning programmes for displaced learners, given the vast scale of disruption and low operational school share.
- Teacher stabilisation package: Restore salary payment mechanisms and safety protections to reduce attrition and rebuild capacity.
- Protect girls’ education: Implement targeted safety, cash support, and community protection measures to counter the heightened risks of violence, early marriage and dropout for girls.
- Rebuild quality and progression pathways: Reduce leakage from lower secondary onward through remedial programmes, transition support, and investments in learning materials—aligned with the Education scenario’s emphasis on improving intake, transition, graduation and quality. Expansion of vocational and technical education aligned with agricultural and manufacturing recovery.
Achieving this will require sustained commitment from Sudanese leaders, regional partners and the international community. Without such coordinated effort, Sudan risks remaining trapped in a cycle of conflict, institutional fragility and deepening poverty.
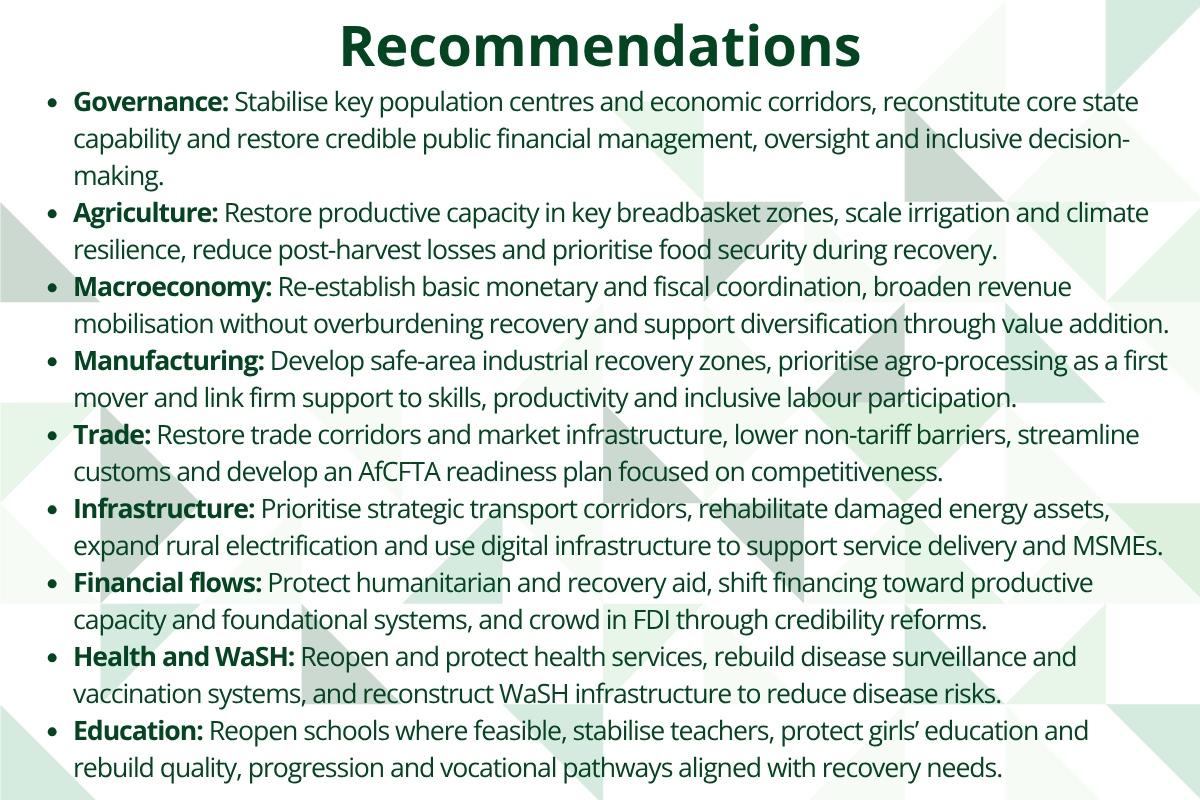
Page information
Contact at AFI team is Enoch Randy Aikins
This entry was last updated on 15 June 2026 using IFs v7.38.
Donors and sponsors


Reuse our work
- All visualizations, data, and text produced by African Futures are completely open access under the Creative Commons BY license. You have the permission to use, distribute, and reproduce these in any medium, provided the source and authors are credited.
- The data produced by third parties and made available by African Futures is subject to the license terms from the original third-party authors. We will always indicate the original source of the data in our documentation, so you should always check the license of any such third-party data before use and redistribution.
- All of our charts can be embedded in any site.
Cite this research
Enoch Randy Aikins (2026) Sudan Development Futures. Published online at futures.issafrica.org. Retrieved from https://futures.issafrica.org/geographic/countries/sudan/ [Online Resource] Updated 15 June 2026.