 Chad
Chad
Feedback welcome
Our aim is to use the best data to inform our analysis. See our Technical page for information on the IFs forecasting platform. We appreciate your help and references for improvements via our feedback form.
This page explores the current and projected future development of Chad, examining various sectoral scenarios and their potential impacts on the country's growth. It explores eight sectors including demographic, economic, and infrastructure-related outcomes for Chad up to 2043. The analysis also considers the implications of the Agenda 2063 goals, aiming to offer insights into policy actions that could enhance the country's developmental trajectory.
For more information about the International Futures modelling platform, we use to develop the various scenarios, please see About this Site.
Summary
We begin this page with an introductory assessment of Chad’s context looking at the current population distribution and structure, climate and topography.
The Republic of Chad is a landlocked former French colony that borders Libya, Sudan, Central African Republic (CAR), Cameroon, Nigeria and Niger. Since gaining independence from France in 1960, Chad's journey has been marked by a tumultuous blend of religious and ethnic strife, punctuated by periods of civil unrest. Rich in gold and uranium, Chad also became an oil-producing nation in 2003. However, corruption, poor governance, weak state institutions, and chronic instability have made Chad one of the top five countries with the lowest Human Development Index (HDI) and one of the poorest countries in the World.
This section is followed by an analysis of the Current Path for Chad which informs the country's likely development trajectory to 2043. It is based on current geopolitical trends and assumes that no major shocks would occur in a 'business as usual' scenario.
- The population of Chad is growing rapidly at a pace of about 3% per year. In 2023, Chad's population was estimated at 18.4 million, and on the Current Path, will almost double to reach 34.8 million people by 2043. This represents about 16 million more people over the next 20 years.
- The economy's dependence shifted from agricultural commodities like cotton and cattle to oil when the country joined the ranks of oil-producing countries in 2003, and it has been dependent on oil since then. In 2023, the size of Chad's economy was US$10.9 billion; by 2043, it will reach only US$22.5 billion. In the Current Path, the average annual growth rate between 2023 and 2043 will be about 3.7%.
- Chad's GDP per capita (PPP) was US$1 413 in 2022, down significantly from US$1 862 in 2014 and lower than the average of US$1 853 for low-income African countries. In the Current Path, the country will reach a GDP per capita of US$1 701 (PPP) by 2043, still below its peak of US$1 862 in 2014.
- Monetary poverty in Chad has significantly declined over the last two decades but remains high, and progress has even slowed in recent years. The poverty rate measured at the international extreme poverty line of US$2.15/day (per capita, 2017 PPP) declined from 57.8% in 2003 to about 26.5% in 2015. However, the poverty rate has increased since 2015 amid economic recession and other shocks such as food inflation. It stood at about 35% in 2023. By 2043, Chad's poverty rate will decline to 24.7%.
- The Chad National Development Plan, titled “Vision 2030, the Chad We Want,” is built around two key objectives: consolidating good governance and the rule of law while strengthening national cohesion, and establishing the conditions for sustainable development. The plan is supported by four pillars: strengthening national unity, enhancing good governance and the rule of law, developing a diversified and competitive economy, and improving the quality of life for the Chadian population.
The next section compares progress on the Current Path with eight sectoral scenarios. These are Demographics and Health, Agriculture, Education, Manufacturing, the African Continental Free Trade Area (AfCFTA), Large Infrastructure and Leapfrogging, Financial Flows and Governance. Each scenario is benchmarked to present an ambitious but reasonable aspiration in that sector.
- Under the Demographics and Health scenario, the ratio of the working-age population to dependants will only be at about 1.3 by 2043, below the minimum ratio of 1.7 required for a country to reap the demographic dividend. However, the Demographic scenario will still be an improvement from the projected ratio of 1.2 in the Current Path.
- Chad boasts substantial agricultural potential, and agriculture remains the main economic activity in rural areas. However, the country's agricultural potential is underexploited. The Agriculture scenario will result in a lower import dependency of 17% of total demand compared with 37% in the Current Path and below the projected average of 33% for low-income Africa.
- Although education is a priority for Chad, the country remains faced with a real challenge to achieve Goal 4 of the Sustainable Development Goals (SDG). The mean educational attainment for adults aged 15 to 24 in Chad is low. It stood at 4.8 years in 2023 and will reach about 6 years in 2043. The implementation of the Education scenario would improve the mean years of education for adults aged 15 to 24 in Chad to 7 years by 2043, one year above the Current Path.
- The continued reliance on oil has led Chad’s economy undiversified and vulnerable to exogenous shocks. Manufacturing forms only a small part of the economy. On the Current Path, the share of the manufacturing sector in Chad’s GDP will likely increase marginally to 6.5% by 2043. However, in the Manufacturing scenario, the share of the manufacturing sector in GDP could get to 11.6% by 2043 comparable to its level in the 1980s and 1990s.
- The trade pattern of Chad is similar to that of many other African countries that rely on a few key commodity exports while importing higher-value manufactured goods, consumer items and foodstuffs. As a result, Chad’s trade balance is structurally in deficit—a trend which is likely to persist over the forecast horizon. On the Current Path, the trade deficit will likely be equivalent to 12.3% of GDP by 2043. In the AfCFTA scenario, Chad’s trade balance could improve from a projected deficit equivalent to 12.3% of GDP in the baseline scenario (Current Path) by 2043 to 6.5% of GDP.
- Infrastructure deficits, especially poor access to electricity and the lack of a good road network pose a major obstacle to Chad’s economic development. Due to limited electricity access, especially in rural areas, the bulk of the households continue to rely on inefficient energy sources for cooking. The percentage of households that use traditional cookstoves will be at 67% by 2043, slightly down from 69% in 2023. However, in the Large Infrastructure and Leapfrogging scenario, the percentage of households that use traditional cookstoves could be 65%.
- Chad receives significant foreign aid, especially humanitarian aid. Foreign investment faces obstacles such as inadequate transport infrastructure, a shortage of skilled labour, unreliable electricity supply, weak contract enforcement, pervasive corruption, and high tax burdens on private enterprises. In the Financial Flows scenario, government revenue increases to reach 21.8% of GDP by 2043 (US$5.1 billion), up from 15.3% in 2023. This is 1.1 percentage points of GDP above the Current Path in 2043.
- Bad governance, high levels of corruption and a highly conflictive society have stunted development progress in Chad. In the Governance scenario, Chad's overall governance performance is nearly 11.2% higher than the Current Path in 2043.
In the third section, we compare the impact of each of these eight sectoral scenarios with one another and subsequently with a Combined scenario (the integrated effect of all eight scenarios). In our forecasts, we measure progress on various dimensions such as economic size (in market exchange rates), gross domestic product per capita (in purchasing power parity), extreme poverty, carbon emissions, the changes in the structure of the economy, and selected sectoral dimensions such as progress with mean years of Education, life expectancy, the Gini coefficient or reductions in mortality rates.
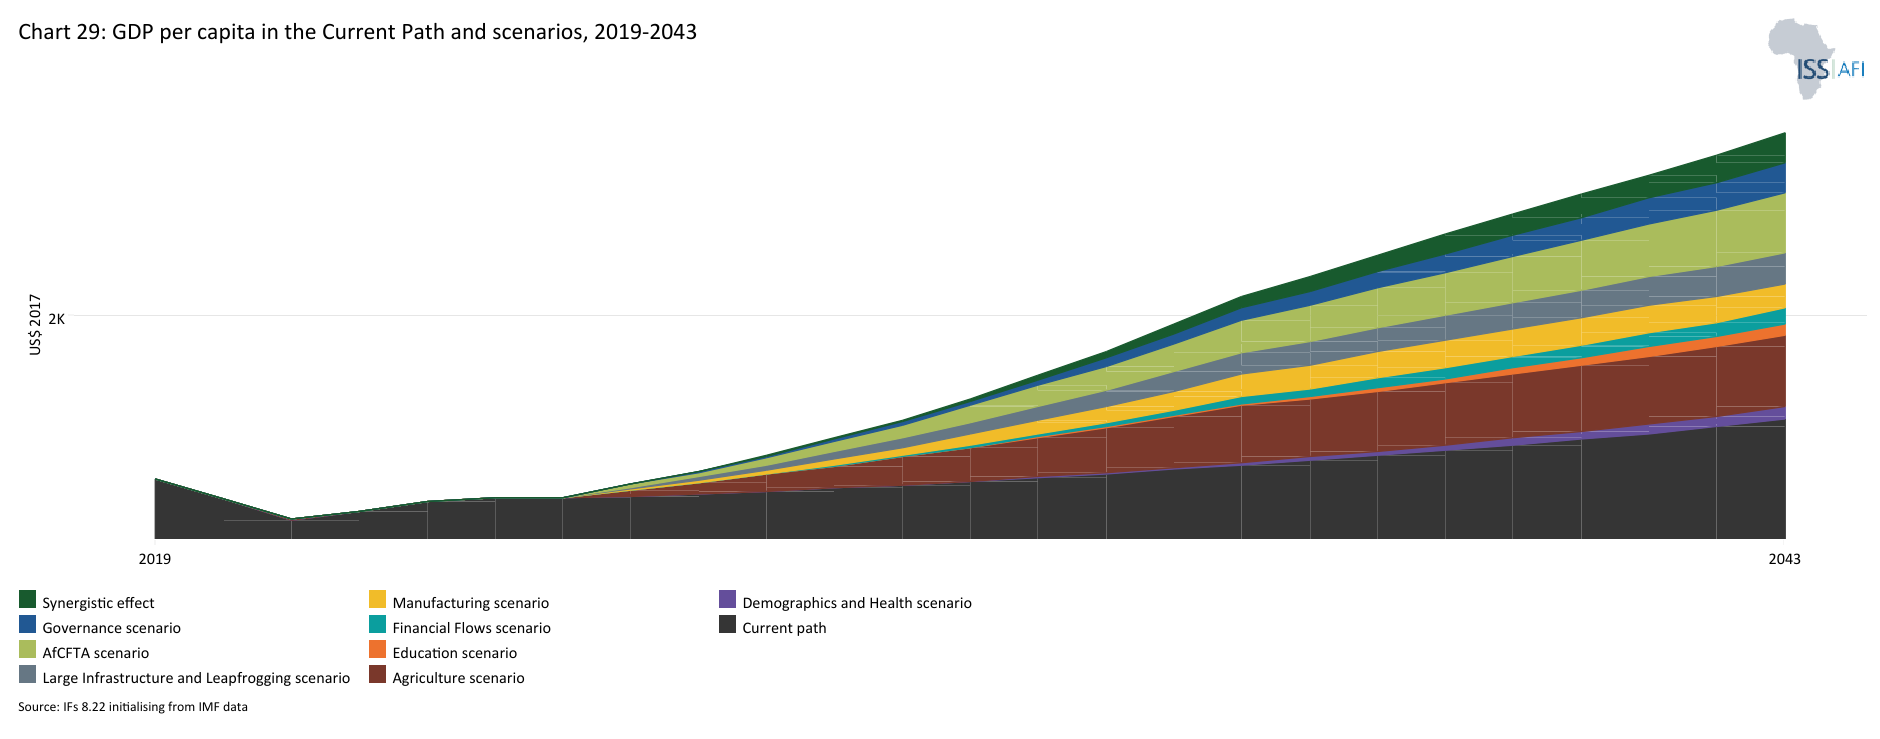
- The Combined scenario has a much greater impact on GDP per capita than the individual sectoral scenarios. By 2043, Chad's GDP per capita (PPP) will be US$2 511, US$810 larger than in the Current Path. Among the sectoral scenarios, the Agriculture scenario will have the most significantly positive impact on GDP per capita, followed by the AfCFTA scenario, the Large Infrastructure and Leapfrogging scenario, and the Governance scenario.
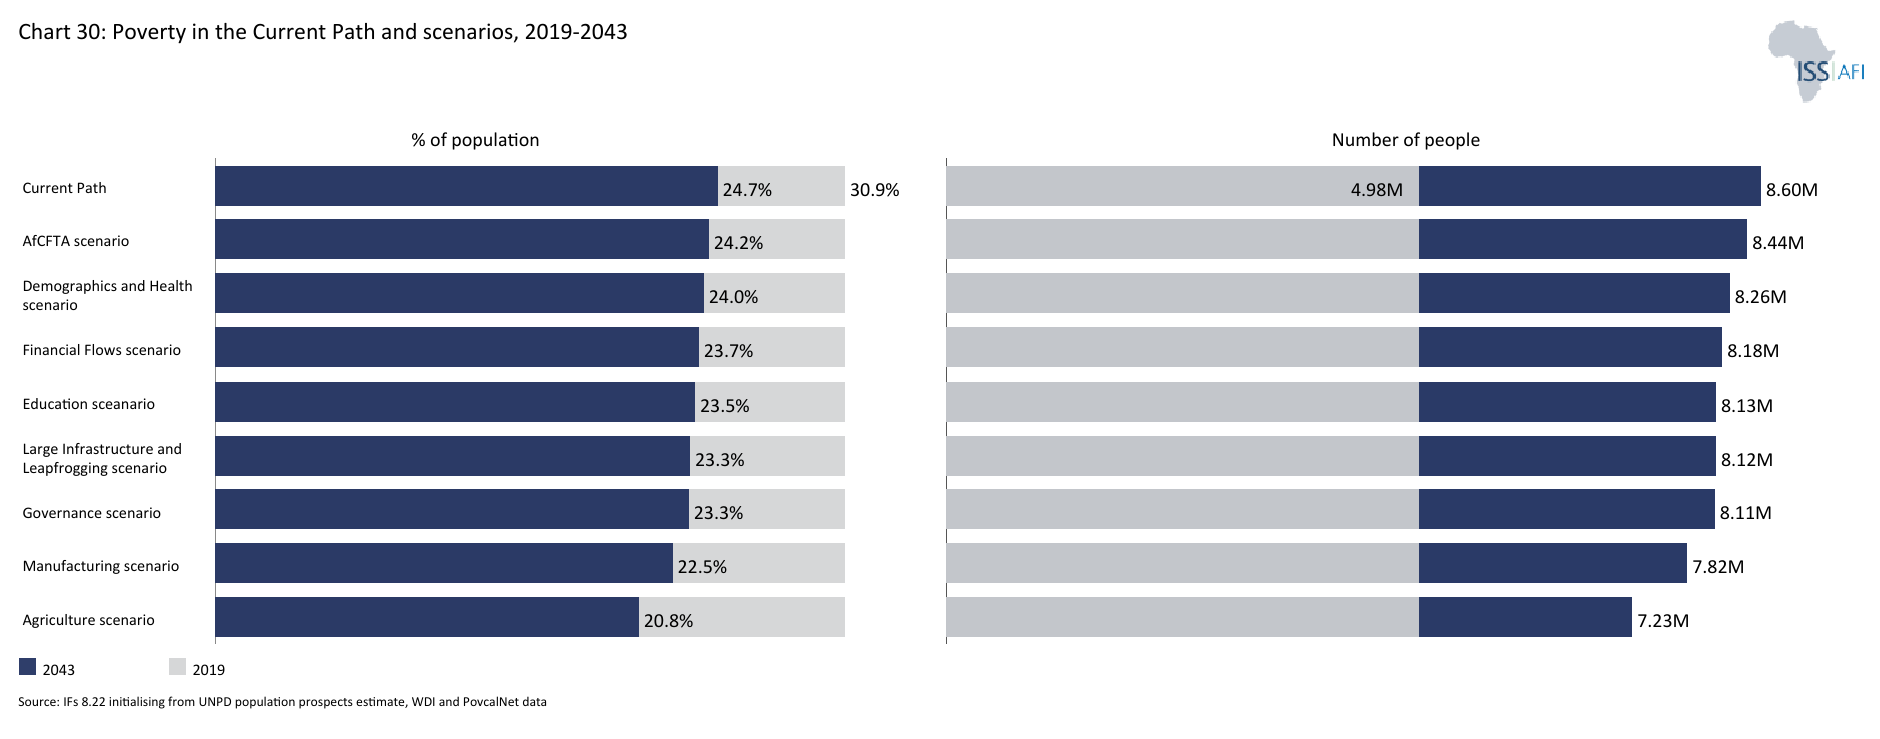
- All the sectoral scenarios contribute to poverty reduction in Chad; however, the Agriculture scenario contributes most significantly to reducing the extreme poverty rate by 2043. In the Combined scenario, by 2043, the extreme poverty rate at the US$2.15 poverty threshold will decline to roughly 12% (4 million people) compared to 24.7% (8.6 million people) in the Current Path.
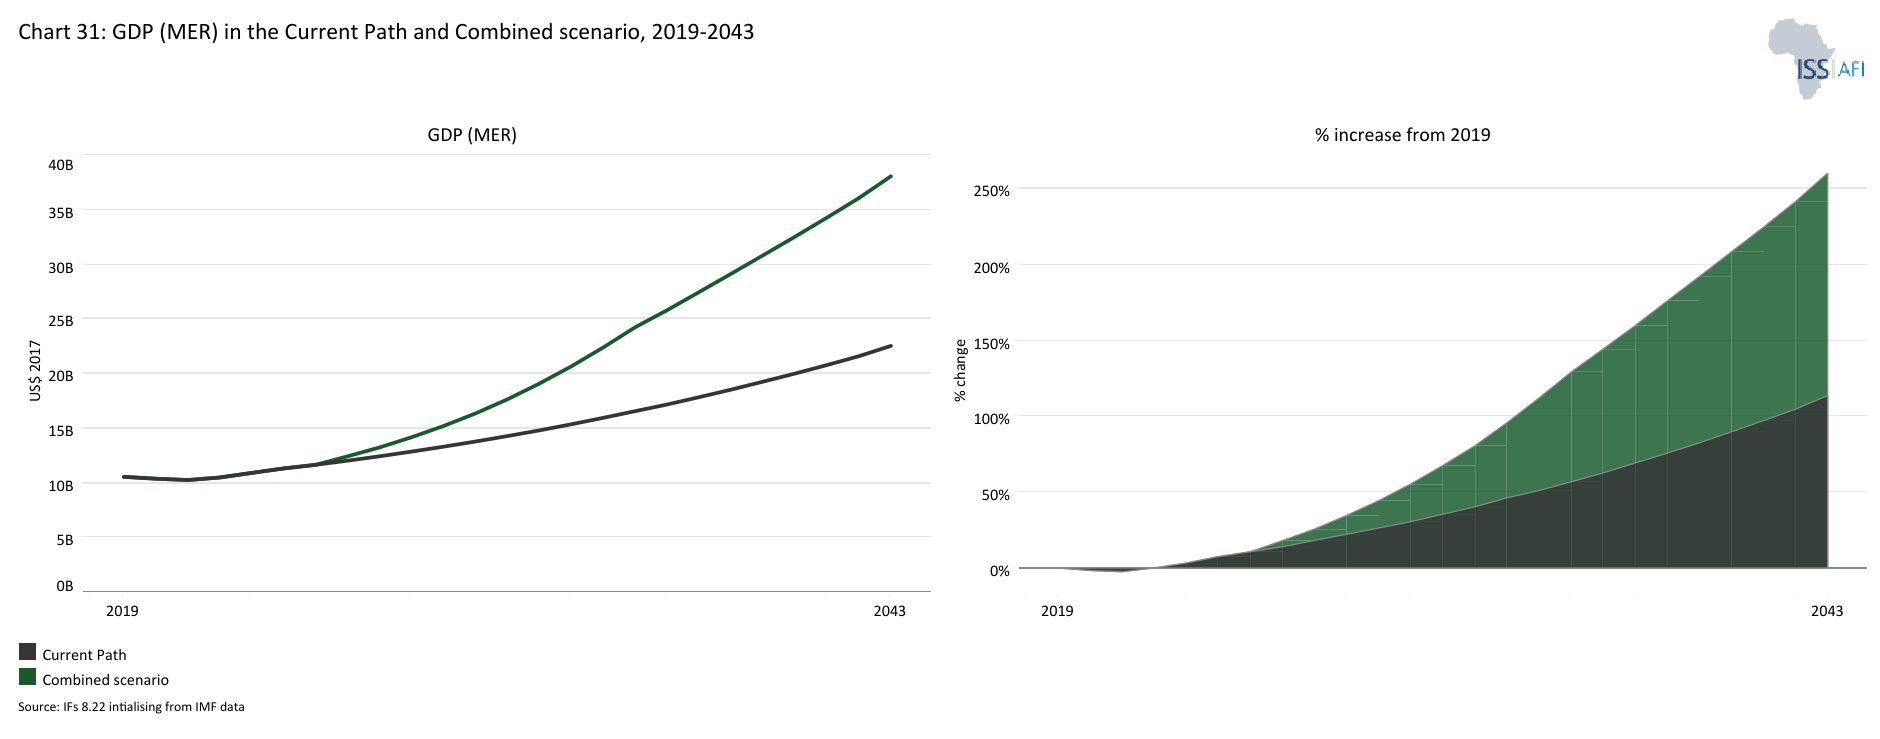
- The Combined scenario significantly improves Chad’s growth prospects. In this scenario, the size of the Chadian economy measured in GDP at the market exchange rate (MER) is US$15.5 billion larger than the Current Path in 2043.
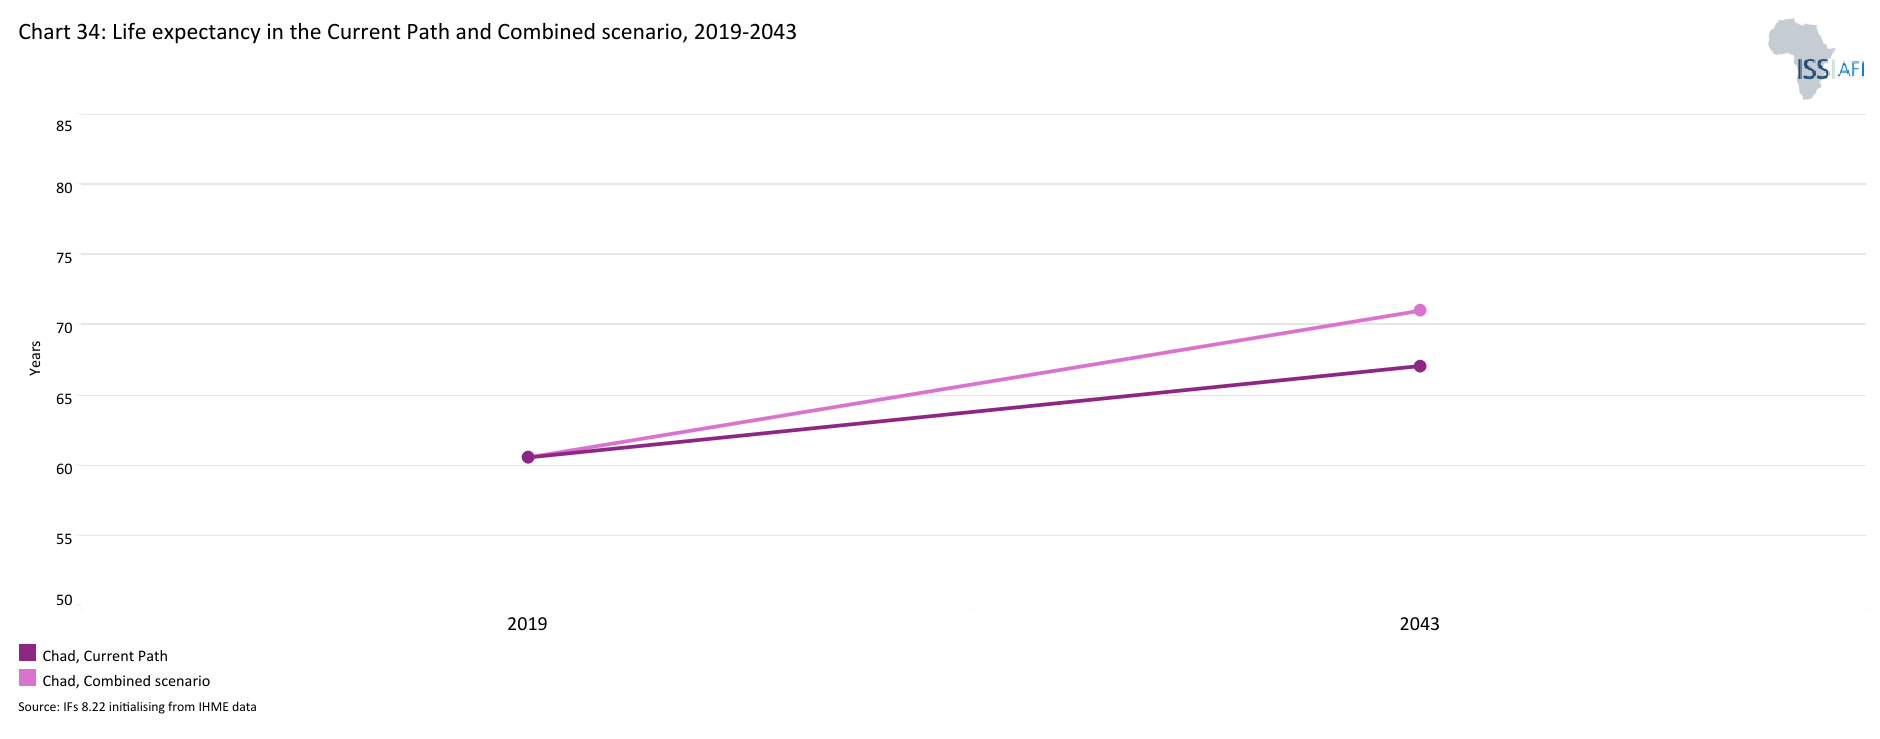
- In the Combined Scenario, the average Chadian could expect to live four years longer at 71 years, compared with the projected 67 years on the Current Path by 2043.
We end this page with a summarising conclusion offering key recommendations for decision-making.
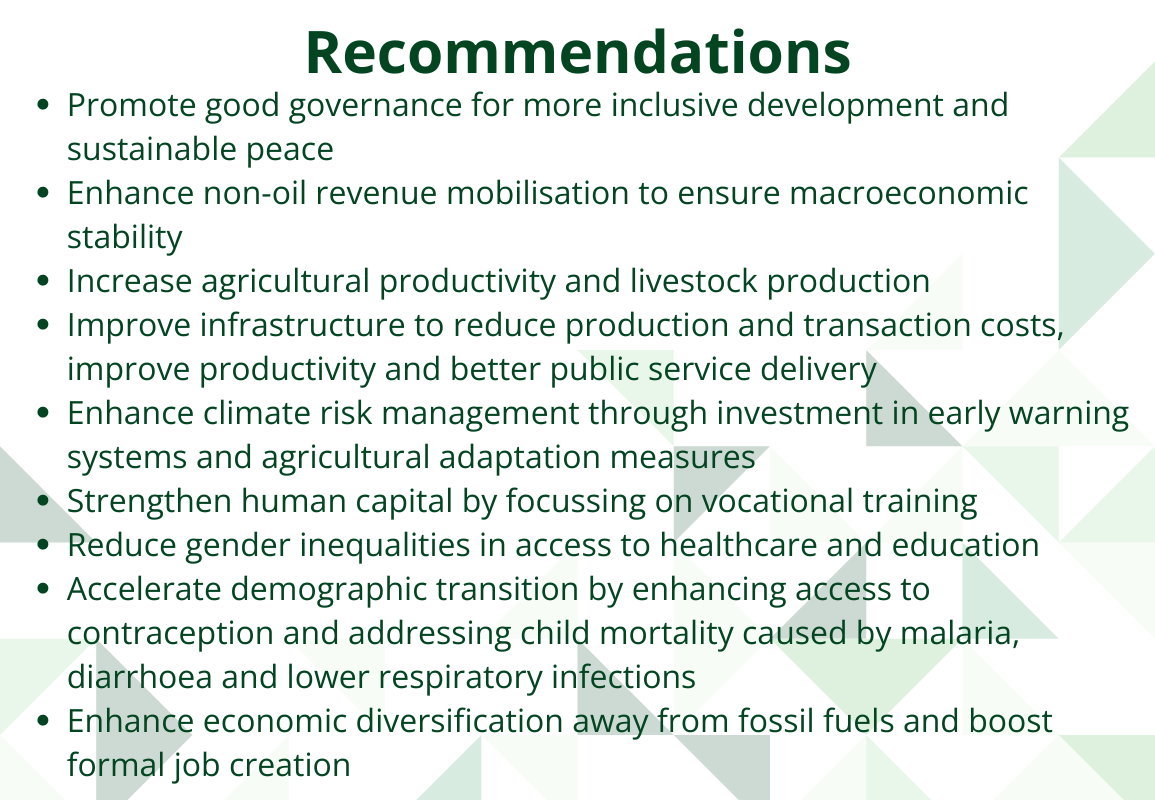
Chad's main growth constraints include insecurity, overreliance on oil export, climate change and variability, low agricultural productivity, weak governance and poor business environment, infrastructure shortage and limited human capital. To stimulate inclusive economic growth and development, the government should prioritise policy reforms and investments that improve governance, address infrastructure shortage, facilitate private sector development, and agriculture productivity. The country also needs to build quality human capital stock and diversify the economy away from oil.
All charts for Chad
- Chart 1: Political map of Chad
- Chart 2: Population structure in Current Path, 2019–2043
- Chart 3: Population distribution map, 2023
- Chart 4: Urban/rural population, 1990-2043
- Chart 5: GDP in MER and growth rate in the Current Path, 1990–2043
- Chart 6: Size of the informal economy as per cent of GDP and per cent of total labour (non-agriculture), 2019-2043
- Chart 7: GDP per capita in Current Path, 1990–2043
- Chart 8: Extreme poverty in Current Path as per cent of population and numbers, 2019–2043
- Chart 9: National Development Plan of Chad
- Chart 10: Relationship between Current Path forecast and scenario
- Chart 11: Mortality distribution in 2023
- Chart 12: Infant mortality rate in Current Path and Demographics and Health scenario, 1990–2043
- Chart 13: Demographic dividend in Current Path and Demographics and Health scenario, 2019–2043
- Chart 14: Crop production and demand 1990 to 2043
- Chart 15: Import dependence in the Current Path and Agriculture scenario, 2019–2043
- Chart 16: Progress through the educational funnel in the Country compared to income group (primary gross enrolment, primary completion, lower secondary gross enrolment, lower secretary completion, upper secondary enrolment, upper secondary completion, tertiary enrolment, tertiary completion (2023 and 2043)
- Chart 17: Mean years of education in Current Path and Education scenario, 2019–2043
- Chart 18: Value-add by sector as % of GDP in the Current Path, 2023 and 2043
- Chart 19: Value-add of the manufacturing sector in Current Path and Manufacturing scenario, 2019–2023
- Chart 20: Exports and imports as % of GDP in the Current Path, 2000-2043
- Chart 21: Trade balance in the Current Path and AfCFTA scenario, 2019–2043
- Chart 22: Electricity access: urban, rural and total in the Current Path, 2000-2043
- Chart 23: Cookstove usage in the Current Path and Large Infra/Leapfrogging scenario, 2019–2043
- Chart 24: Access to mobile and fixed broadband in the Current Path and the Large Infra/Leapfrogging scenario, 2019–2043
- Chart 25: FDI, foreign aid and remittances as % of GDP in the Current Path and in the Financial Flows scenario, 1990-2043
- Chart 26: Government revenue in Current Path and Financial Flows scenario, 2019–2043
- Chart 27: Government effectiveness score in the Current Path, 2002-2043
- Chart 28: Composite governance index in the Current Path and Governance scenario, 2023 and 2043
- Chart 29: GDP per capita in Current Path and scenarios, 2019–2043
- Chart 30: Poverty in Current Path and scenarios, 2019–2043
- Chart 31: GDP (MER) in Current Path and Combined scenario, 2019–2043
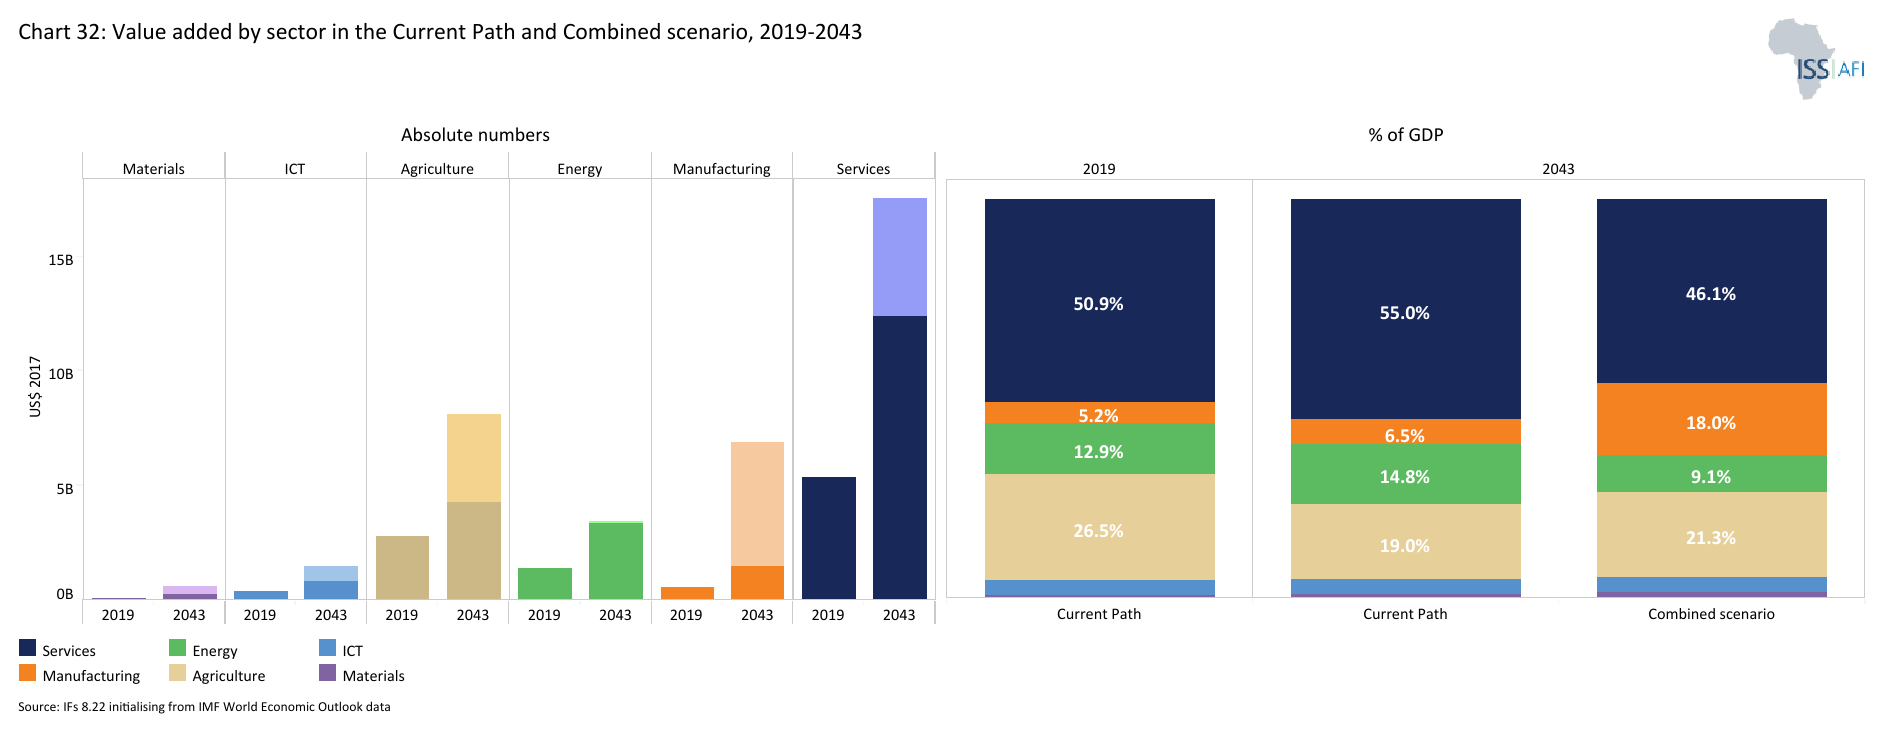
- Chart 32: Value added by sector in Current Path and Combined scenario, 2019–2043
- Chart 33: Informal sector as % of total economy in Current Path and Combined scenario, 2019–2043
- Chart 34: Life expectancy in Current Path and Combined scenario, 2019–2043
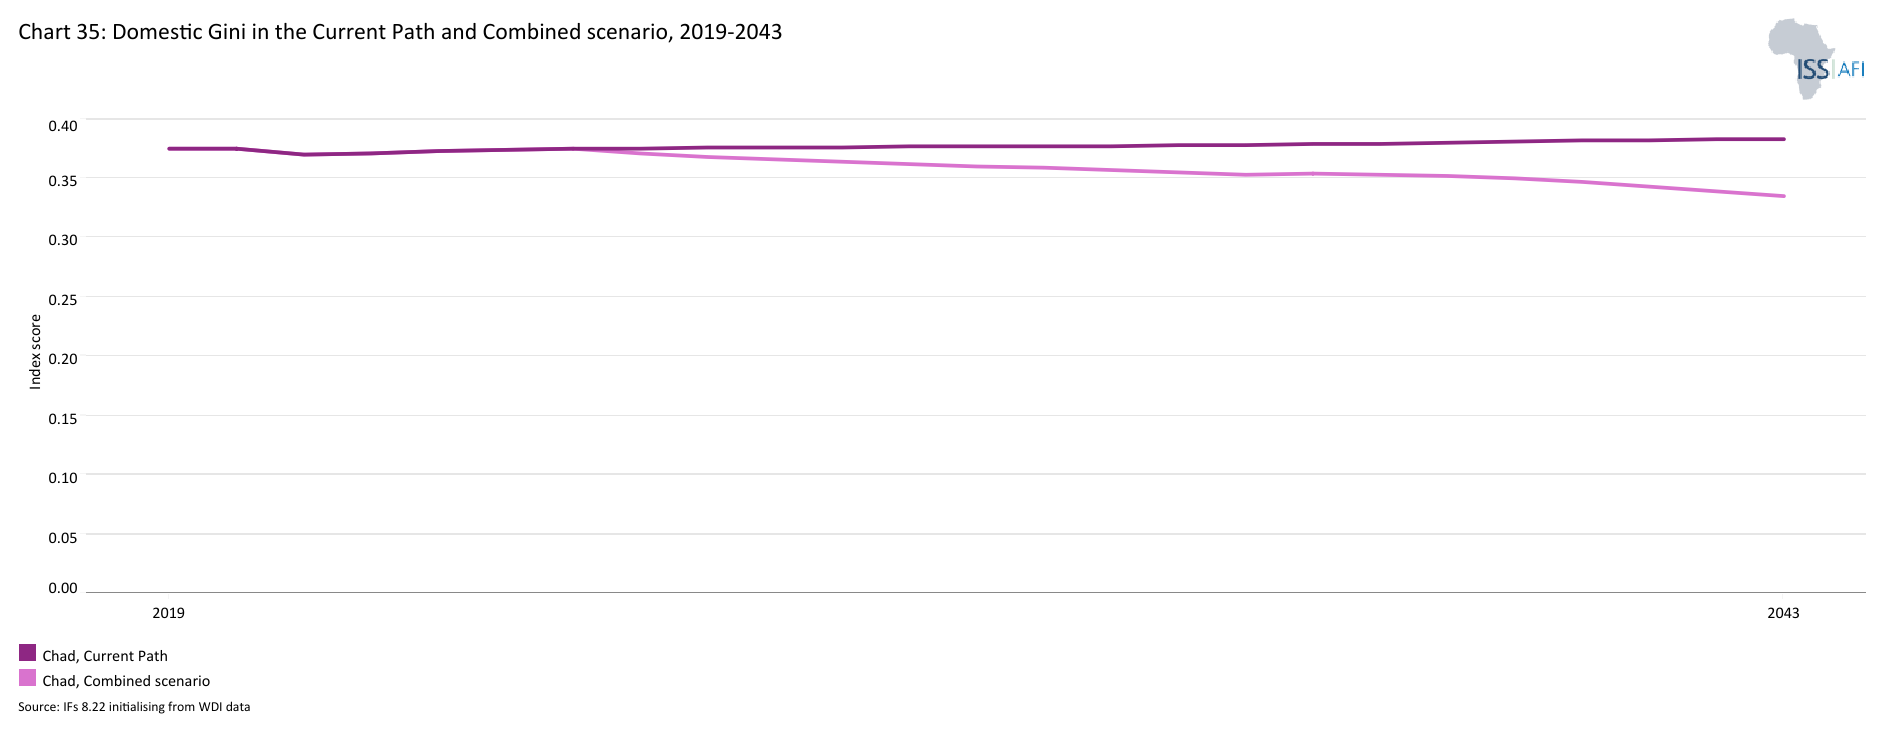
- Chart 35: Domestic Gini in the Current Path and Combined scenario, 2023 and 2043
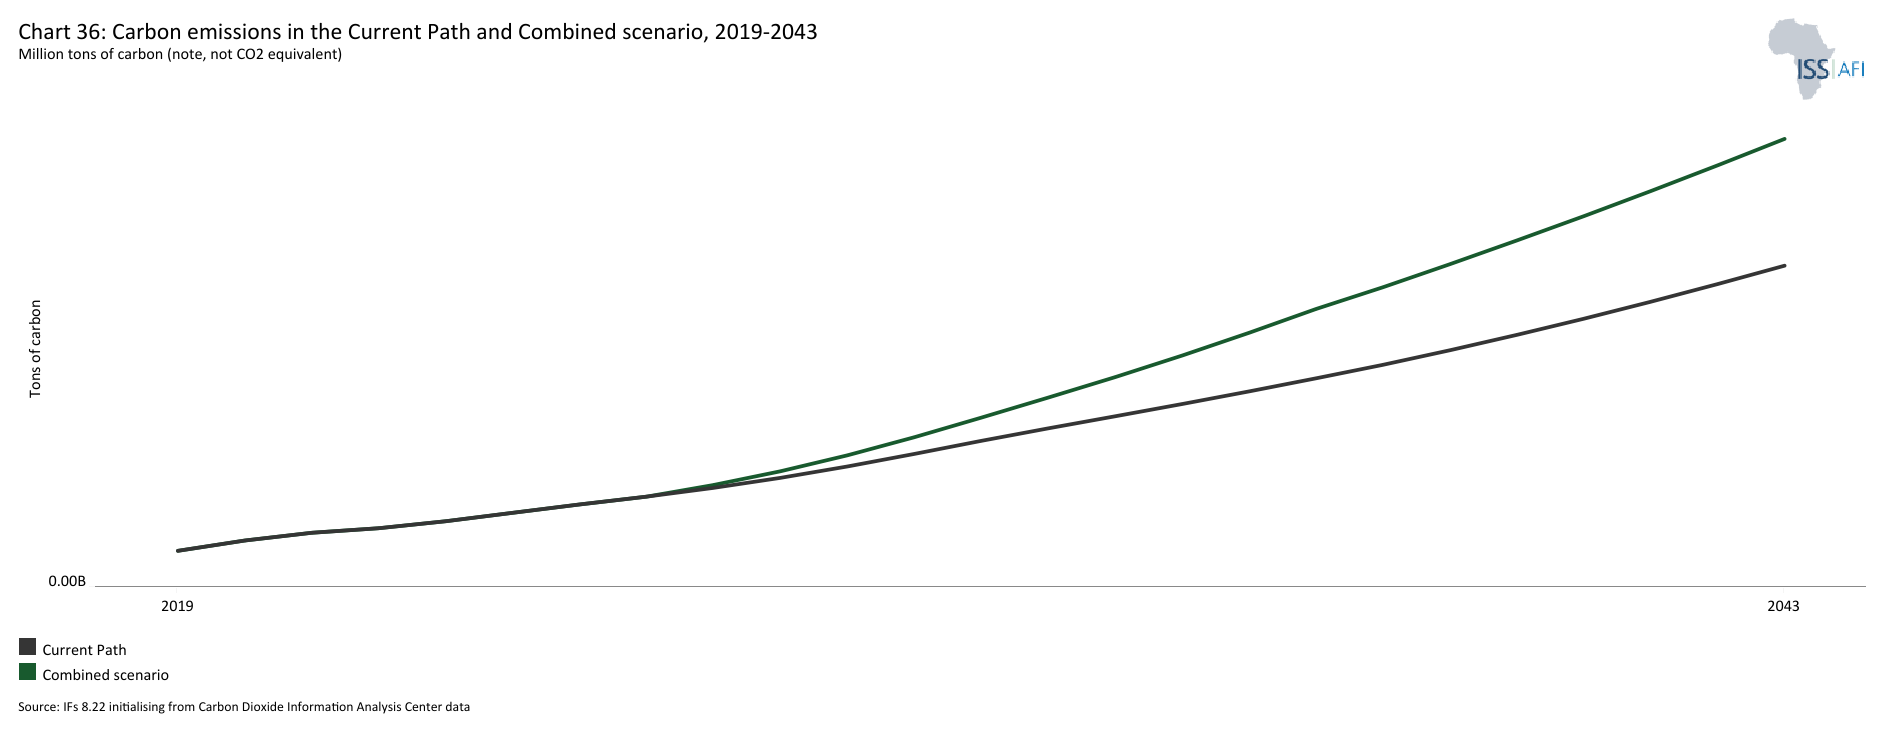
- Chart 36: Carbon emissions in Current Path and Combined scenario, 2019–2043
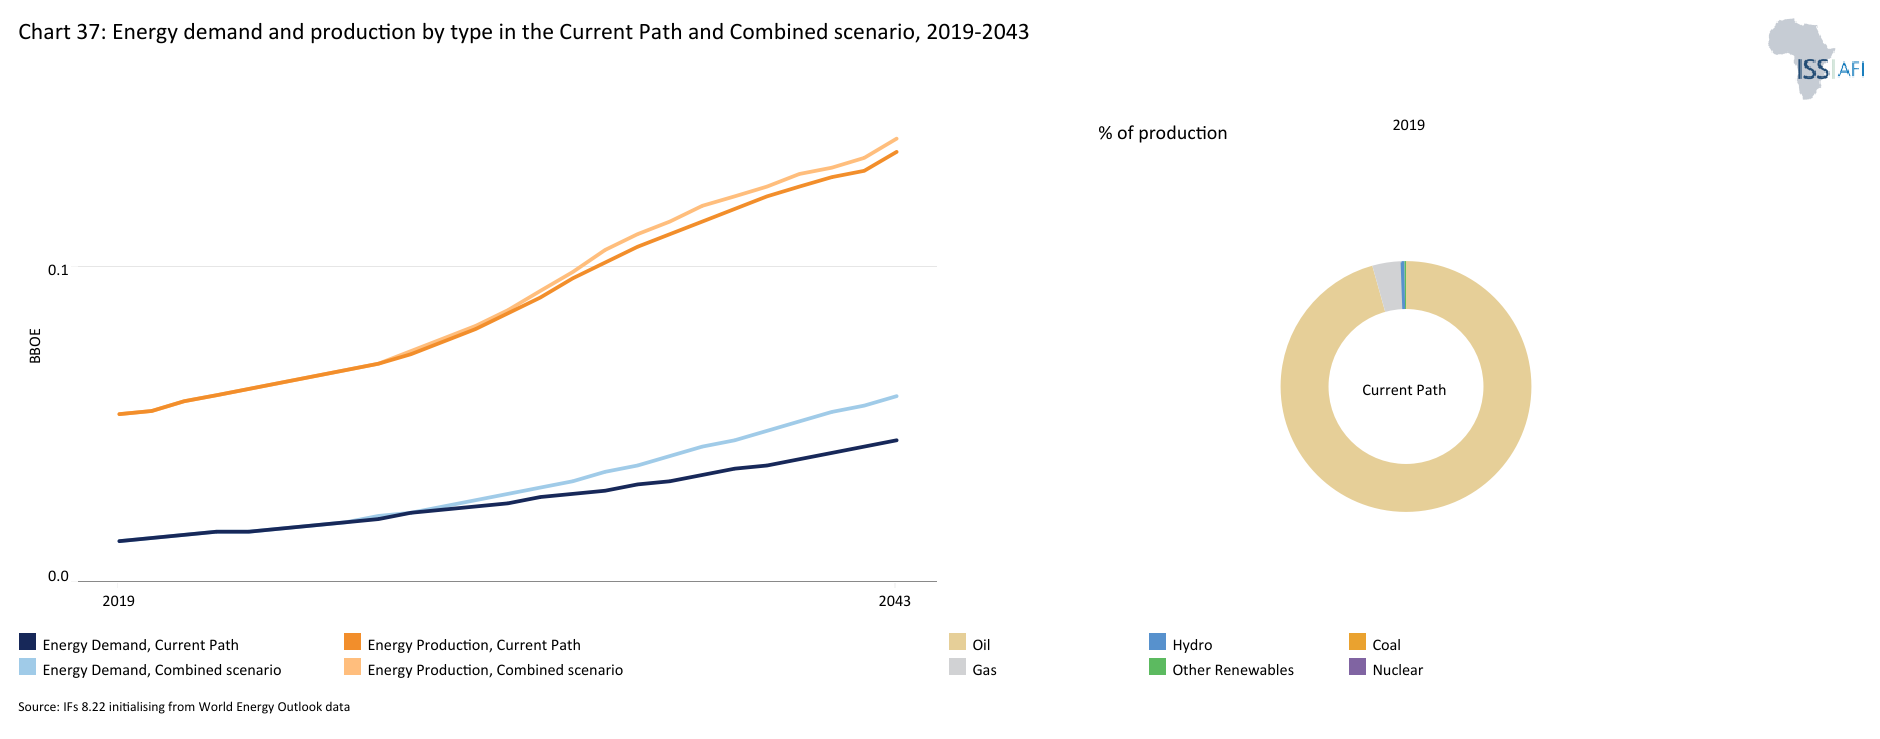
- Chart 37: Energy demand and production by type in Current Path forecast and Combined scenario, 2019-2043
- Chart 38: Policy recommendations
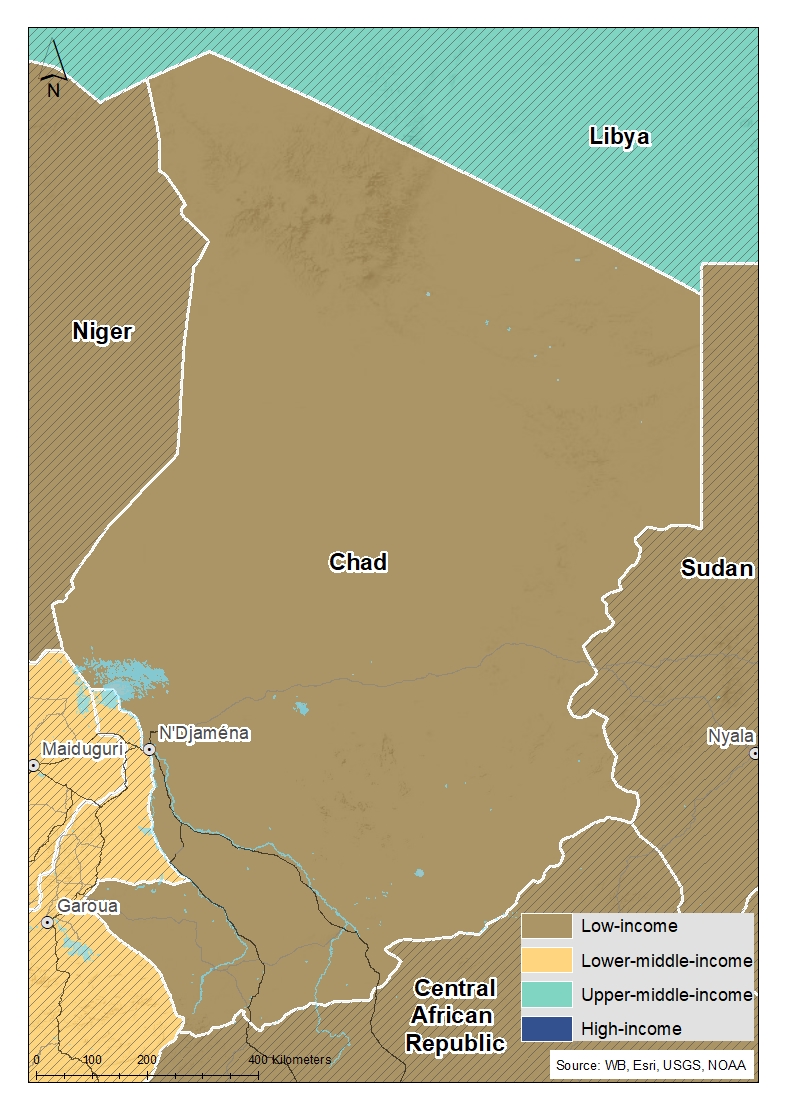
Chart 1 is a political map of Chad.
The Republic of Chad is a landlocked former French colony that borders Libya, Sudan, Central African Republic (CAR), Cameroon, Nigeria and Niger. It is the sixth-largest country in Africa by land area at approximately 1 284 000 km2, and it is a member of the Community of Sahel-Saharan States (CEN-SAD) and the Economic Community of Central African States (ECCAS).
Chad is home to Lake Chad, the largest water body in the Sahel. It provides freshwater and sustains the livelihood of millions of people across the Chad basin. Cycles of drought, land degradation and a shifting climate have resulted in large numbers of herders migrating southwards, encroaching on settlements and farmlands, sparking farmer-herder conflicts, particularly in the country's south. The conflict between herders and farmers has spread in neighbouring Nigeria as well and has become the largest source of such conflict deaths, even surpassing fatalities from Boko Haram.
Since gaining independence from France in 1960, Chad's journey has been marked by a tumultuous blend of religious and ethnic strife, punctuated by periods of civil unrest. The nation's political landscape turned volatile in 1965, triggered by a tax revolt that incited rebellion among the predominantly Islamic tribes in the north against the Christian-dominated government in the south. This uprising set the stage for years of authoritarian governance and internal conflict. Idriss Déby Itno, the late president and a former general, seized power by force when he launched a rebellion against President Hissein Habré from Sudan in 1989[1L Ploch, Instability in Chad, CRS Report for Congress, June 2009]. Déby's forces, reportedly aided by Libya and Sudan and largely unopposed by French troops stationed in Chad, seized the capital, N'Djamena, in 1990, forcing Habré into exile. Déby, became president in 1991 and pledged to create a democratic multi-party-political system.
Chad's first multi-party presidential elections were held in 1996; legislative elections followed in 1997. Déby won reelection in 2001, and his party won a majority of seats in the 2002 legislative elections. According to observers, the elections were all marked by irregularities and fraud.
President Déby's perceived lack of legitimacy among the opposition contributed to political tensions throughout his rule. As a result, he faced challenges from various politicised military movements that sought to overthrow his regime. French military support prevented major attacks by coalitions such as the Military Command Council for the Salvation of the Republic (CCMSR) and the Union des forces de la résistance (UFR). Deby who had just been elected for his sixth term, and ruled the country for 30 years, passed away in April 2021 under unclear circumstances while visiting troops fighting against the Front for Change and Concord in Chad (Front pour l'Alternance et la Concorde au Tchad), which was advancing toward the capital.
The Transitional Military Council, led by Déby's son Mahamat, seized power immediately, despite the constitution allowing the president of parliament to serve as interim president and organise new elections within 90 days, raising concerns about a potential dynastic power grab by the Déby clan. General Mahamat Déby initially pledged to remain interim leader for 18 months and would not run for president. However, in October 2022, a National Dialogue Forum extended the transition period to two years instead of the initially planned 18 months, and he was inaugurated as president for the transition.
The opposition protested against extending the transition period; the resulting violence led to an estimated 128 deaths, according to the National Human Rights Commission (CNDH) of Chad. A constitutional referendum took place on December 17, 2023. The new constitution was approved by 86% of voters, with a 63.75% turnout, though opposition leaders disputed these figures.
After spending a year in exile, the main opposition leader, Succès Masra, returned to N'Djaména following the reconciliation agreement reached through the "Kinshasa Agreement" on November 3, 2023. On January 1, 2024, he was appointed as Prime Minister by the Transitional President.
In May 2024, Chad's military leader Mahamat Idriss Déby won the country's presidency with 61% of the vote, compared to opposition leader Succès Masra's 18.5% in an election that international observers described as highly stage-managed.
Rich in gold and uranium, Chad also became an oil-producing nation in 2003, with the completion of a US$4 billion pipeline linking its oilfields to terminals on the Atlantic coast through neighbouring Cameroon. Chadians had high expectations that oil revenues might serve as a catalyst for economic growth and development, but corruption, poor governance, weak state institutions, and chronic instability have made Chad one of the top five countries with the lowest Human Development Index (HDI) and one of the poorest countries in the world. According to the 2023/2024 Human Development Report, Chad ranked 189th among 193 nations on the Human Development Index (HDI). It is also ranked 165th among 167 countries on the 2024 SDG Index, which ranks countries based on their performance across 17 goals.
Low life expectancy, low levels of education (expected years of schooling at birth and mean years of schooling) and low standards of life all contribute to the stagnation of socioeconomic growth within the country.
Chart 2 presents the Current Path of the population structure, from 2019 to 2043.
The characteristics of a country's population can shape its long-term social, economic, and political foundations; thus, understanding a nation's demographic profile indicates its development prospects.
The Chadian population is culturally diverse, with many ethnic communities, languages and religions. The country has over 120 languages and dialects, with French and Arabic as the official languages, and Islam is the predominant religion.
The population of Chad is growing rapidly at about 3% per year. In 2023, Chad's population was estimated at 18.5 million, and on the Current Path, it will almost double to reach 34.9 million people by 2043. This represents about 16 million more people over the next 20 years.
As a result of ongoing conflict in the region, Chad hosts more than one million forcibly displaced people, including 580 000 refugees from conflicts in neighbouring Sudan, the Central African Republic and Cameroon. More than 125 000 refugees and asylum seekers from the Central African Republic have fled to Chad escaping different waves of violence since 2005.
With a fertility rate estimated at 6.2 children per woman in 2023, Chad has the second-highest fertility rate in Africa after Niger and above the average of 4.8 children per woman for low-income countries in Africa in the same year. On the Current Path, Chad's fertility rate will decline slightly to 4.8 children per woman by 2043, the highest in Africa by then.
Due to the high fertility rates and low life expectancy, Chad's population is very youthful. With a median age of about 16.3 years in 2023, Chad has the fourth-youngest population globally, and its median age will only be 18.6 years by 2043, making it the third-youngest population in the world.
Due to this youthful age structure, the dependency ratio is high, as a large portion of the population depends on the small workforce to provide for its needs — this constrains savings and investment in human and physical capital.
As of 2023, about 47% of the country's population was under 15. On the Current Path, the population under 15 years will decline but will still constitute about 42.3% in 2043. The share of the elderly (65 and above) has been stable over time — at about 2.2% in 2023 — and it will reach 3.1% in 2043.
When the ratio of the working-age population to dependant is 1.7 or more, countries often experience more rapid growth, known as the demographic dividend, provided the workforce is appropriately skilled and absorbed in the labour market. Currently, the private sector's limited capacity, combined with the constrained ability to expand payroll budgets, makes it challenging to accommodate the large number of generally unskilled young job seekers in the country.[2The World Bank, the Republic of Chad: systematic country diagnostic, March, 2022]
Chad is unlikely to reap its demographic dividend across the Current Path forecast horizon. The ratio of the working-age population to dependants stood at 1.03 in 2023 — almost one working-age person for each dependant. It will only be at 1.2 in 2043, slightly below the average of 1.4 for African low-income countries but far below the threshold of 1.7 that a country needs to expect to reap the demographic dividend. Chad only gets to this positive ratio at around 2074, indicating the slow demographic transition. It also implies that Chad will achieve its demographic dividend almost two decades later than the average for low-income Africa.
Chad also has a large youth bulge at 51%. Youth bulge is the percentage of the population between 15 and 29 years old relative to those aged 15 and above. It will get to 48% by 2043. In addition to the requirement for more spending on education, health services and job creation, large numbers of young adults can lead to positive political change in a country through youth activism, but they can also carry the seeds for socio-political instability in the absence of economic opportunities.
Chad authorities must design and implement sound policies to accelerate the demographic transition for economic prosperity and decent human development.
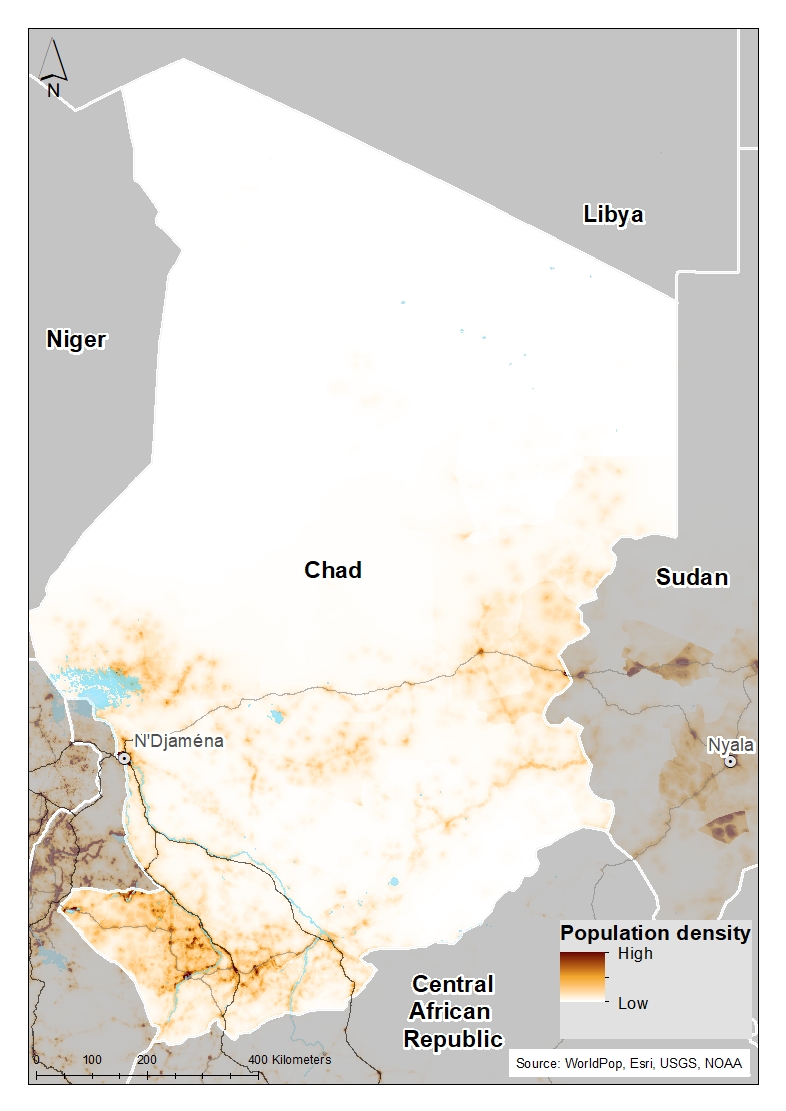
Chart 3 presents a population distribution map for 2023.
The population distribution of Chad is closely linked to its physical geography and climate. The harsh dry climate in the north is characterised by very low population densities and few inhabitants, while the southern regions with distinct rainfall seasons, forests and perennial rivers are home to the vast majority of the population. The highest population densities are located in the Logone Occidental Region and the capital of N'Djamena.
Chart 4 presents the urban and rural population in the Current Path, from 1990 to 2043.
Chad's urbanisation rate is very low; the population is largely rural at about 75.9% in 2023, above the average of 67% for low-income Africa. On the Current Path, the rural population will only reduce by 4.2 percentage points to reach 71.7% by 2043. This means the urbanisation rate only marginally increases from about 24% in 2023 to 28.3% by 2043. The capital city, N'Djamena is one of the few urban areas in Chad.
If well planned, urbanisation can be critical to economic growth and development, as it fosters entrepreneurship and increases productivity. However, limited supply of energy, infrastructure deficit, limited skills, poor business regulation system and low access to finance impede the productivity potential of Chad's urban areas. The newly elected government of Chad needs to address these shortfalls while curbing unplanned informal development to reduce flood risks in urban areas.
Chart 5 presents GDP in market exchange rates (MER) and growth rate in the Current Path, from 1990 to 2043.
In the 1990s, Chad began its journey toward economic and political transformation following a devastating civil war, successfully completing an enhanced structural adjustment facility through the IMF.
The economy's dependence shifted from agricultural commodities like cotton and cattle to oil when the country joined the ranks of oil-producing countries in 2003, and it has been dependent on oil since then. Despite initial hopes of substantial socioeconomic improvement from oil exploitation, Chad failed to achieve meaningful development and economic diversification.
Apart from challenges related to oil price shocks, Chad's economy also generally suffers due to its geographical remoteness, conflict and insecurity in the region, lack of investment in infrastructure, a harsh climate and poor business environment.
Efforts to restore public finances in Chad have also been challenging. The country's public debt, at 56% of GDP in 2021, became unsustainable with the Covid- 19 pandemic, volatility in oil prices, heightened insecurity, and a food crisis. Chad was the first country to reach an agreement with its creditors under the G20 Common Framework for Debt Treatment, and the debt service-to-revenue ratio was projected to average 17% in 2022-23, before gradually declining to below 14% from 2024 onward.
Chad recorded an average growth rate of 9.4 % over the period 2001-2014, a period characterised by an initial major positive shock — the onset of oil production — and the oil super cycle. As a result, the GDP increased from US$3.1 billion in 2000 to US$10.7 billion in 2014. However, Chad's continued reliance on oil has left the economy less diversified and more vulnerable to exogenous shocks.
Chad's economic growth has been slow since 2015, averaging -0.2% over the period 2015-2022, due to oil price shocks, socio-political instability, volatile security and the COVID-19 pandemic. These factors have prevented the country from reducing poverty and improving development outcomes.
In 2023, the size of Chad's economy was US$10.9 billion; by 2043, it will reach only US$22.5 billion. In the Current Path, the average annual growth rate between 2023 and 2043 will be about 3.7%. This projected slow growth reflects the expected decline in oil production in the near future due to a modest proven petroleum reserve, long distance from infrastructure, security risks, and commercialisation challenges.
Investments in critical sectors such as education, health, infrastructure and agriculture are urgently needed to boost the economy's structural transformation and build resilience against future shocks.
Chart 6 presents the size of the informal economy as per cent of GDP and per cent of total labour (non-agriculture), from 2019 to 2043. The data in our modelling are largely estimates and therefore may differ from other sources.
An informal economy (informal sector or shadow economy) is the part of any economy that is neither officially taxed nor monitored. Countries with high informality have a whole host of development challenges such as low revenue mobilisation. Economic growth tends to be below potential in countries with high levels of informality.
With limited formal sector opportunities, most of Chad's workforce is employed in the low-value-added informal sector. The size of Chad's informal economy was estimated at 34.6% of GDP in 2023, above the average of 29.3% for low-income Africa. On the Current Path, the level of informality will likely decline to 31.5% of GDP by 2043, still above the projected average of 27% for low-income Africa in the year.
Addressing informality is essential to promote inclusive wealth creation in Chad. However, systematic attacks on the sector motivated by the view that it generally operates illegally and evades taxes will be counterproductive. The process should be gradual as the informal sector is currently the only viable income source for millions of people. Improving access to quality education, job creation, and financial inclusion are some policies that tackle informality.
Chart 7 presents GDP per capita in the Current Path, from 1990 to 2043, compared with the average for the Africa income group.
One of the least-developed countries in the world, Chad's GDP per capita increased by about 90% between 2001 and 2014 due to strong economic growth generated by oil production and high oil prices. This helped the country reduce the large income gap with the rest of sub-Saharan Africa. GDP per capita (PPP, and constant 2017 US$) increased from US$980 in 2001 to US$1 862 in 2014, compared to the average of US$1 744 for low-income Africa.
However, GDP per capita has contracted since 2015 amid economic contraction due to oil price shocks, climate shocks and renewed insecurity. Chad's GDP per capita was US$1 562 in 2019 and US$1 413 in 2022, down significantly from US$1 862 in 2014 and lower than the average of US$1 853 for low-income African countries in 2022.
In the Current Path, the country will reach a GDP per capita of US$1 701 (Chart 7) by 2043, still below its peak of US$ 1 862 in 2014. Chad's economy will continue to grow much slower than other African low-income countries. It will drop to 19th in terms of GDP per capita by 2043 among Africa's 22 low-income countries, significantly above its 6th in 2014. On the Current Path, Chad will likely recover its 2014 GDP per capita only in 2051, indicating a significant loss in the population's well-being.
Chart 8 presents the rate and numbers of extremely poor people in the Current Path from 2019 to 2043.
In 2015, the World Bank adopted US$1.90 per person per day (in 2011 prices using GNI), also used to measure progress towards achieving Sustainable Development Goal (SDG) 1 of eradicating extreme poverty. In 2022, the World Bank updated the poverty lines to 2017 constant dollar values as follows:
- The previous US$1.90 extreme poverty line is now set at US$2.15, also for use with low-income countries.
- US$3.20 for lower-middle-income countries, now US$3.65 in 2017 values.
- US$5.50 for upper-middle-income countries, now US$6.85 in 2017 values.
- US$22.70 for high-income countries. The Bank has not yet announced the new poverty line in 2017 US$ prices for high-income countries.
Monetary poverty in Chad has significantly declined over the last two decades but remains high, and progress has even slowed in recent years. The poverty rate measured at the international extreme poverty line of US$2.15/day (per capita, 2017 PPP) declined from 57.8% in 2003 to about 26.5% in 2015. According to the World Bank data, in addition to the decline in the share of the population living in extreme poverty, the depth and severity of poverty also declined, meaning that those who remained in poverty got closer to the poverty line, and inequality between people experiencing poverty declined.[3The World Bank, the Republic of Chad: systematic country diagnostic, March, 2022]
However, the poverty rate has increased since 2015 amid economic recession and other shocks such as food inflation. It stood at 30.8% in 2019. In 2023, the poverty rate at 34.5% (6.3 million people). This is however, 6.4 percentage points lower than the average for African low-income countries. Extreme poverty in Chad is primarily concentrated in rural areas, where 47.4 % of the population is extremely poor, highlighting significant regional disparities.
By 2043, Chad's poverty rate will decline to 24.7%, however, poverty rate will decline more slowly than population growth, resulting in an increase in the absolute number of poor Chadians to 8.6 million people by 2043, 2.2 million additional poor people compared to 2023.
Monetary poverty only tells part of the story, however. The global Multidimensional Poverty Index (MPI) measures acute multidimensional poverty by measuring each person's overlapping deprivations across 10 indicators in three equally weighted dimensions: health, education and standard of living.
On the Multidimensional Poverty Index, 84.2% of the Chadians are multidimensionally poor, about 50 percentage points higher than the monetary poverty rate. An additional 10.7% of the population is also classified as vulnerable to multidimensional poverty.
The binding constraints to poverty reduction and shared prosperity in Chad are weak access to infrastructure, low agricultural productivity, limited access to education and health, increasing insecurity, and
climate change issues, challenges in managing oil revenue volatility, low access to formal employment, low inclusion of women in the economy, slow demographic transition and weak public administration.[4The World Bank, the Republic of Chad: systematic country diagnostic, March, 2022]
Chart 9 depicts the National Development Plan of Chad.
Since the advent of democracy in 1990, Chad has not adopted a long-term framework for planning and development. Development planning was guided by short- and medium-term perspectives, resulting in poor coordination between the different development plans and strategies. Drawing lessons from the implementation of the previous plans and strategies, the Government decided to carry out a forecasting, which led to the elaboration of Vision 2030.
The Chad National Development Plan, titled “Vision 2030, the Chad We Want,” embodies the country's commitment to fulfilling the legitimate aspirations of its people. This plan highlights the government's dedication to long-term development, aiming to transform Chad into an emerging country by 2030. The vision focuses on two primary objectives: (1) strengthening the foundations of good governance and the rule of law while enhancing national cohesion, and (2) creating the conditions for sustainable development.
To achieve these goals, four strategic axes have been identified:
Axis 1: Strengthening National Unity
Sub-axes:
- Promoting a culture of peace and national cohesion
- Promoting cultural values and redefining the role of culture as a lever for inclusive development
Axis 2: Strengthening Good Governance and the Rule of Law
Sub-axes:
- Promoting performance and motivation in public administration
- Promoting good economic governance
- Strengthening a genuine democratic culture as a mode of governance
- Enhancing security as a development factor
Axis 3: Developing a Diversified and Competitive Economy
Sub-axes:
- Fostering a diversified and rapidly growing economy
- Ensuring economic financing primarily through domestic savings and foreign private capital
- Using infrastructure as a lever for sustainable development
Axis 4: Improving the Quality of Life for the People of Chad
Sub-axes:
- Ensuring a healthy environment with preserved natural resources
- Creating an environment conducive to the flourishing and well-being of the Chadian people
In summary, Vision 2030 is built around two key objectives: consolidating good governance and the rule of law while strengthening national cohesion, and establishing the conditions for sustainable development. The plan is supported by four pillars: strengthening national unity, enhancing good governance and the rule of law, developing a diversified and competitive economy, and improving the quality of life for the Chadian population.
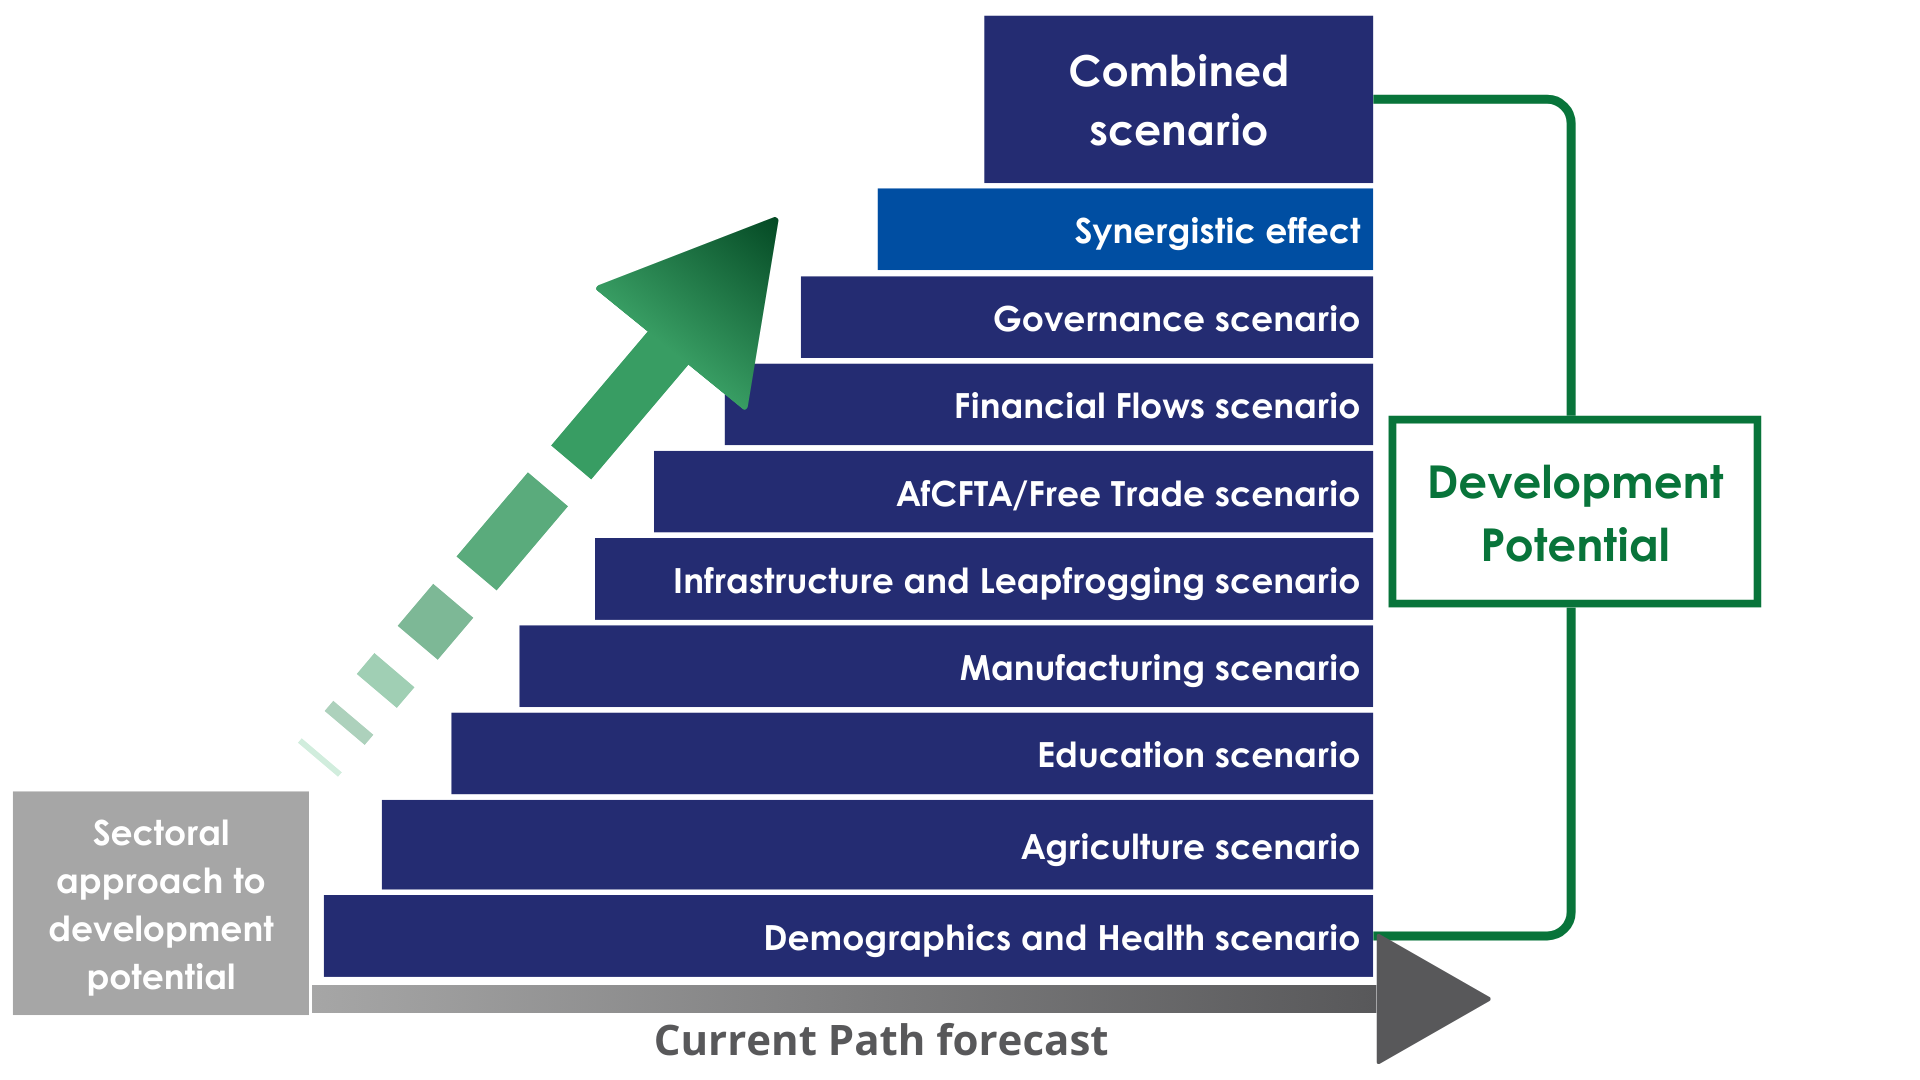
The eight sectoral scenarios as well as their relationship to the Current Path and the Combined scenario are explained in the About Page. Chart 10 summarises the approach.
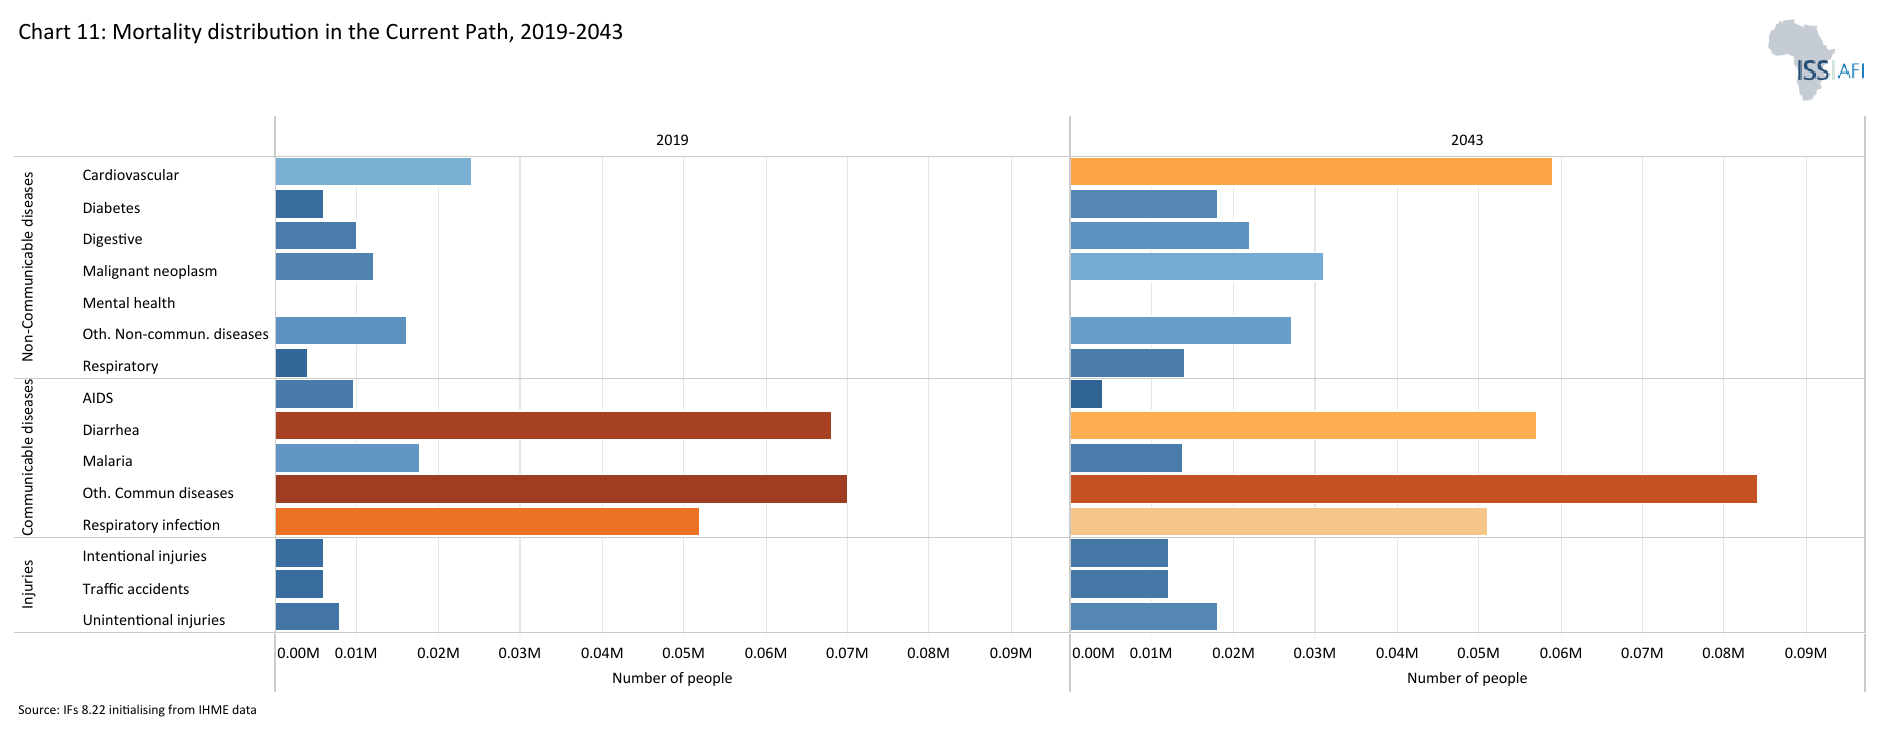
Chart 11 presents the mortality distribution in the Current Path for 2023.
There are strong interactions between population and health. The status of a country's health influences levels of fertility, mortality and morbidity. At the same time, high population growth contributes to an increased need for basic necessities for life, such as nutrition and health.
Access to basic health care is limited in Chad due to many reasons such as conflict, low readiness of health facilities to deliver quality care, and the cost associated with health services.[5J Azétsop and M Ochieng,the right to health, health systems development and public health policy challenges in Chad, Philos Ethics Humanit Med. Feb. 2015] Access to care is provided through four main mechanisms: direct payment, free access to selected services, health insurance and health mutual. The out-of-pocket payment is the most common healthcare financing mechanism, representing about 50% of total health expenditure. Private health insurance, used by less than 2% of the population, is provided as part of contracts by large corporations to benefit employees.[6J Azétsop and M Ochieng,the right to health, health systems development and public health policy challenges in Chad, Philos Ethics Humanit Med. Feb. 2015]
The country has a high prevalence of malnutrition, malaria and outbreaks of disease. Communicable diseases such as malaria, diarrhoea and lower respiratory infections are the primary causes of death among the children and the youth in Chad. Nearly the entire population of Chad is at risk of malaria, with 1.8 million confirmed cases and over 2 500 inpatient deaths recorded in 2022. The country ranks 13th in the world for malaria mortality, with children under five years old making up nearly 60 percent of these deaths.
Non-communicable diseases such as cardiovascular and diabetes remain the leading causes of death among the elderly (Chart 11). Poor access to safe drinking water, improved sanitation and lack of hygiene has caused significant number of deaths in the country. Poor access to safe drinking water, improved sanitation and lack of hygiene kills and sickens many people, especially children, in the country. Chad has one of the lowest rates of access to safe drinking water and sanitation services in the world. While this is improving in urban areas, children in rural areas are almost always at risk from water- and sanitation-related diseases.
However, Chad has made some progress in improving key health outcomes in recent years. The stunting rate among children under the age of five has significantly declined from 44.4% in 2004 to 28% in 2022, six percentage points above the average for low-income Africa. Chad is on track to achieve the SDG target of 25% by 2030. On the Current Path, the stunting rate among children below five will decline to 23% by 2030 and 17% by 2043.
Maternal mortality has declined from 1 450 per 100 000 live births in 1990 to 956 in 2023, the second highest in Africa after South Sudan. This high maternal mortality rate indicates a need for improved access to healthcare services and higher quality care, particularly in reproductive health.
Child (under 5) mortality has also declined from 113 deaths per 1 000 lives births in 1990 to 68 deaths in 2023, while life expectancy has increased from 53.7 years to 61 years over the same period.
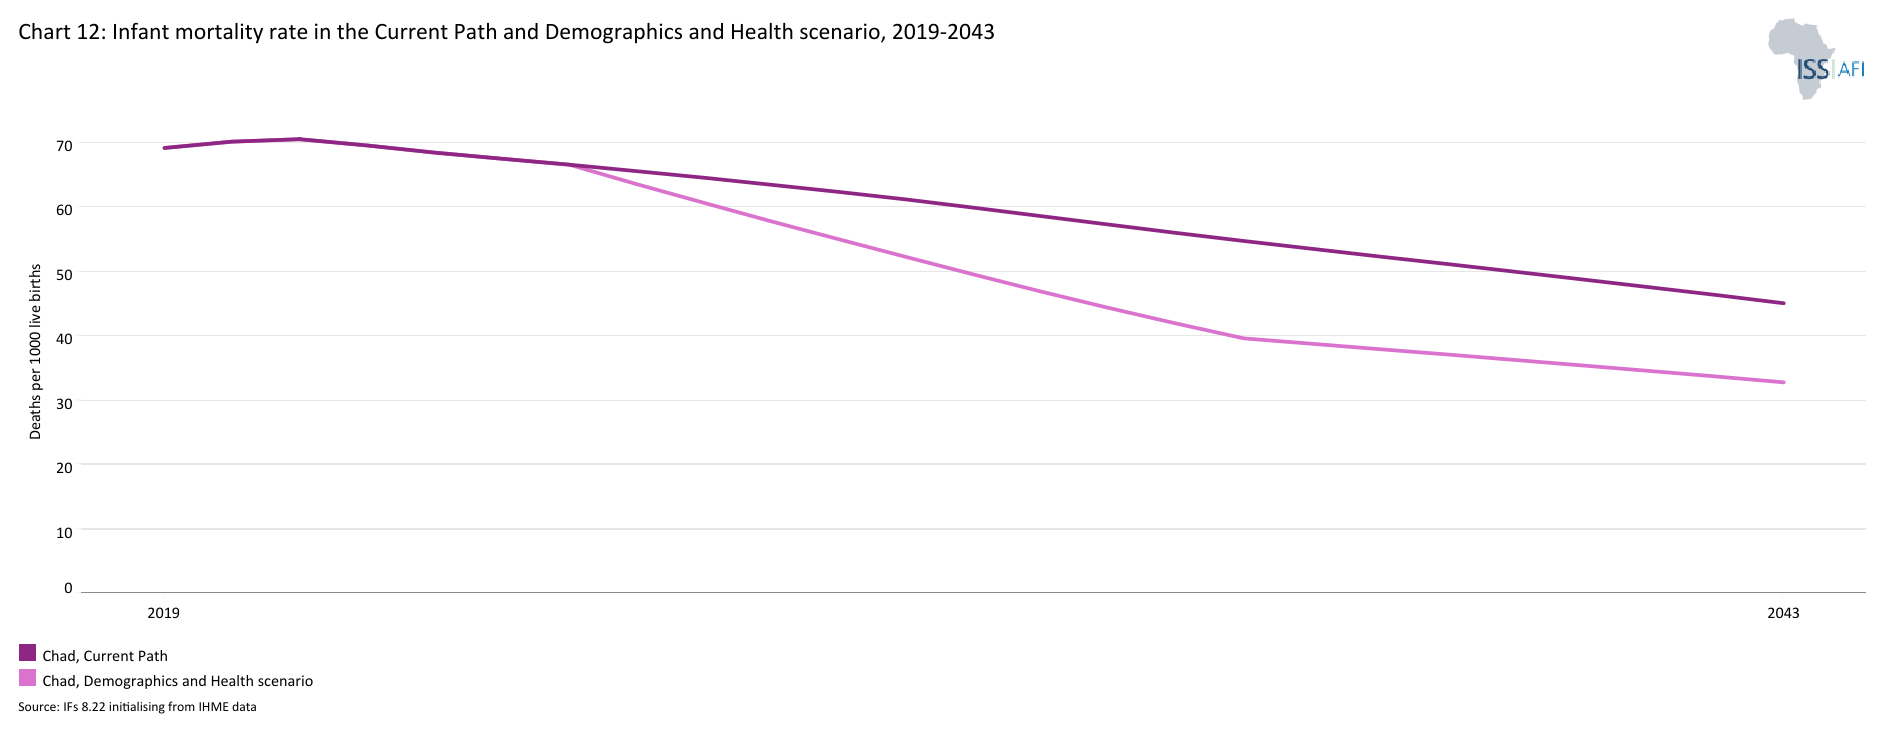
Despite this progress, Chad is not on track to meet the SDG targets related to infant and maternal mortality. On the Current Path, the maternal mortality rate will likely decline to 798 deaths per 100 000 live births by 2030 and 500 per 100 000 live births by 2043, significantly above the SDG targets of less than 70 per 100 000 live births. Infant mortality will also decline to 61 deaths per 1 000 lives births by 2030 and 45 deaths by 2043, a far cry from the SDG target of 12 deaths per 1 000 live births by 2030.
The Government and development partners should strengthen their support for improving the health system. Public health expenditure represented less than 2% of GDP in 2023, below the average of 2.3% for low-income African countries.
The Demographics and Health scenario therefore envisions ambitious improvements in child and maternal mortality rates, enhanced access to modern contraception, and decreased mortality from communicable diseases (e.g., AIDS, diarrhoea, malaria, respiratory infections) and non-communicable diseases (e.g., diabetes), alongside advancements in safe water access and sanitation. This scenario assumes a swift demographic transition supported by heightened investments in health and water, sanitation, and hygiene (WaSH) infrastructure.
Visit the themes on Demographics and Health/WaSH for more detail on the scenario structure and interventions.
Chart 12 presents the infant mortality rate in the Current Path and in the Demographics and Health scenario, from 1990 to 2043.
The infant mortality rate is the probability of a child born in a specific year dying before reaching the age of one. It measures the child-born survival rate and reflects the social, economic and environmental conditions in which children live, including their health care. It is measured as the number of infant deaths per 1 000 live births and is an important marker of the overall quality of the health system in a country.
Child (under 5) mortality has declined from 113 deaths per 1 000 lives births in 1990 to 68 deaths in 2023. On the Current Path, infant mortality will continue to decline to 45 deaths per 1 000 lives births by 2043. The interventions in the Demographics and Health scenario see Chad's infant mortality rate drop even further by 2043 to 33 deaths. While this is a significant improvement, the country still lags behind the average for low-income Africa that sees a reduction to 22 deaths by 2043 in the Demographics and Health scenario (Chart 12).
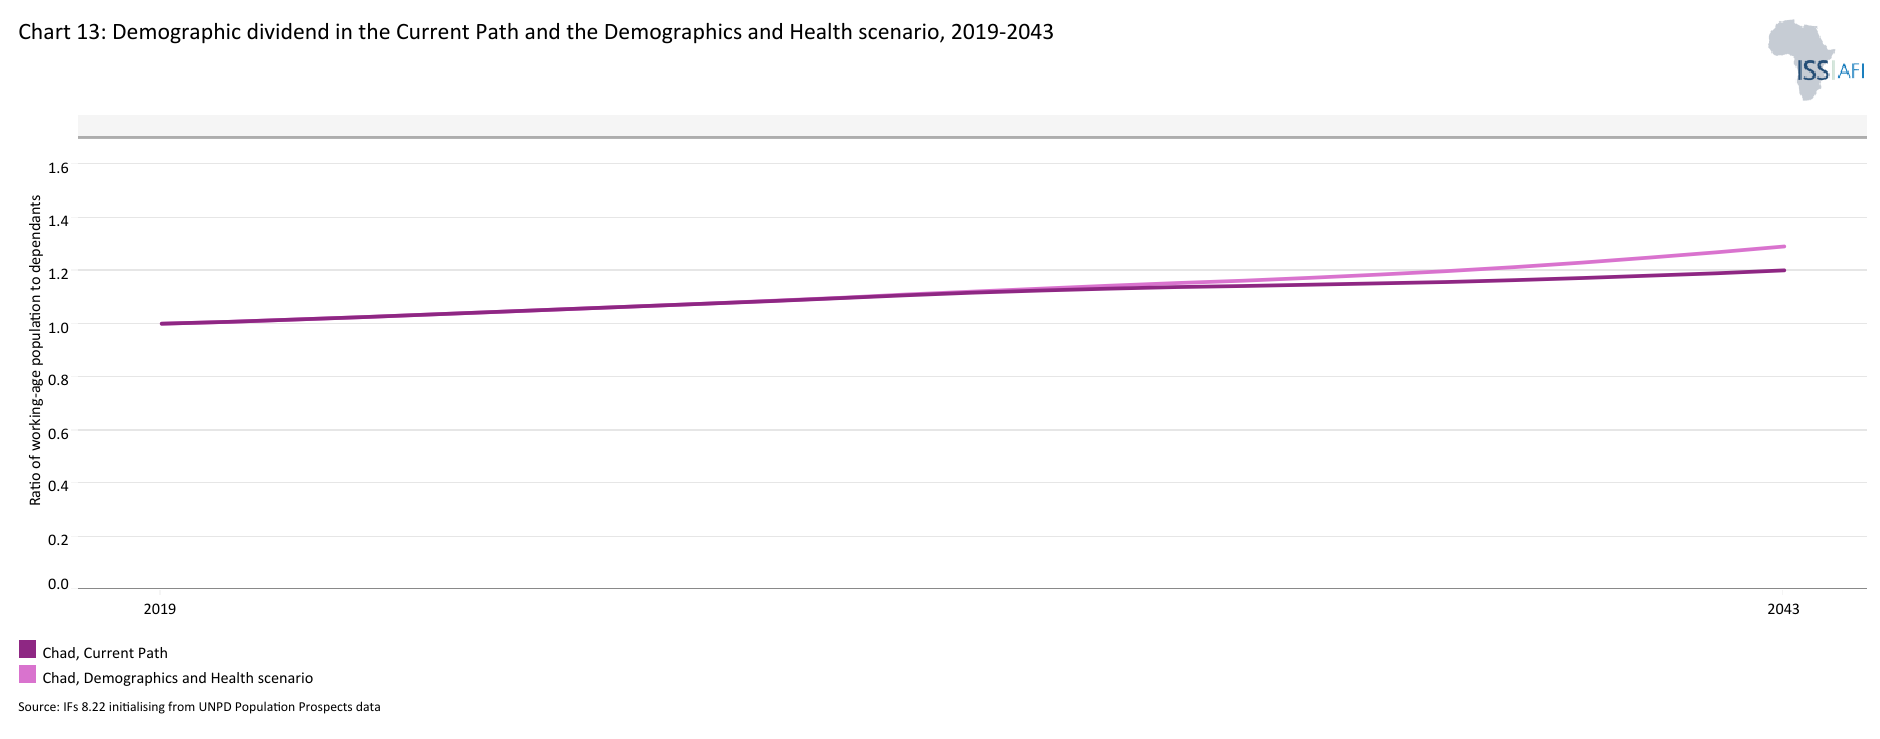
Chart 13 presents the demographic dividend in the Current Path and in the Demographics and Health scenario, from 2019 to 2043.
The demographic dividend is the economic growth generated by change in a country’s demographic structure. It generally materialises when the ratio of working-age persons to dependents (children and elderly) increases to at least 1.7. However, this is not straightforward, the labour force need to be properly skilled and productively integrated into the economy.
In the Demographics and Health scenario, the ratio of the working-age population to dependants will only be at about 1.3 by 2043 (Chart 13), below the minimum ratio of 1.7 required for a country to reap the demographic dividend. However, the Demographics and Health scenario will still be an improvement from the projected ratio of 1.20 in the Current Path. Given Chad’s youthful population, the country will require more time beyond the intervention horizon of 2043 to see a meaningful change in its population structure and to benefit from the gains that can be accrued from a large working-age population relative to dependants.
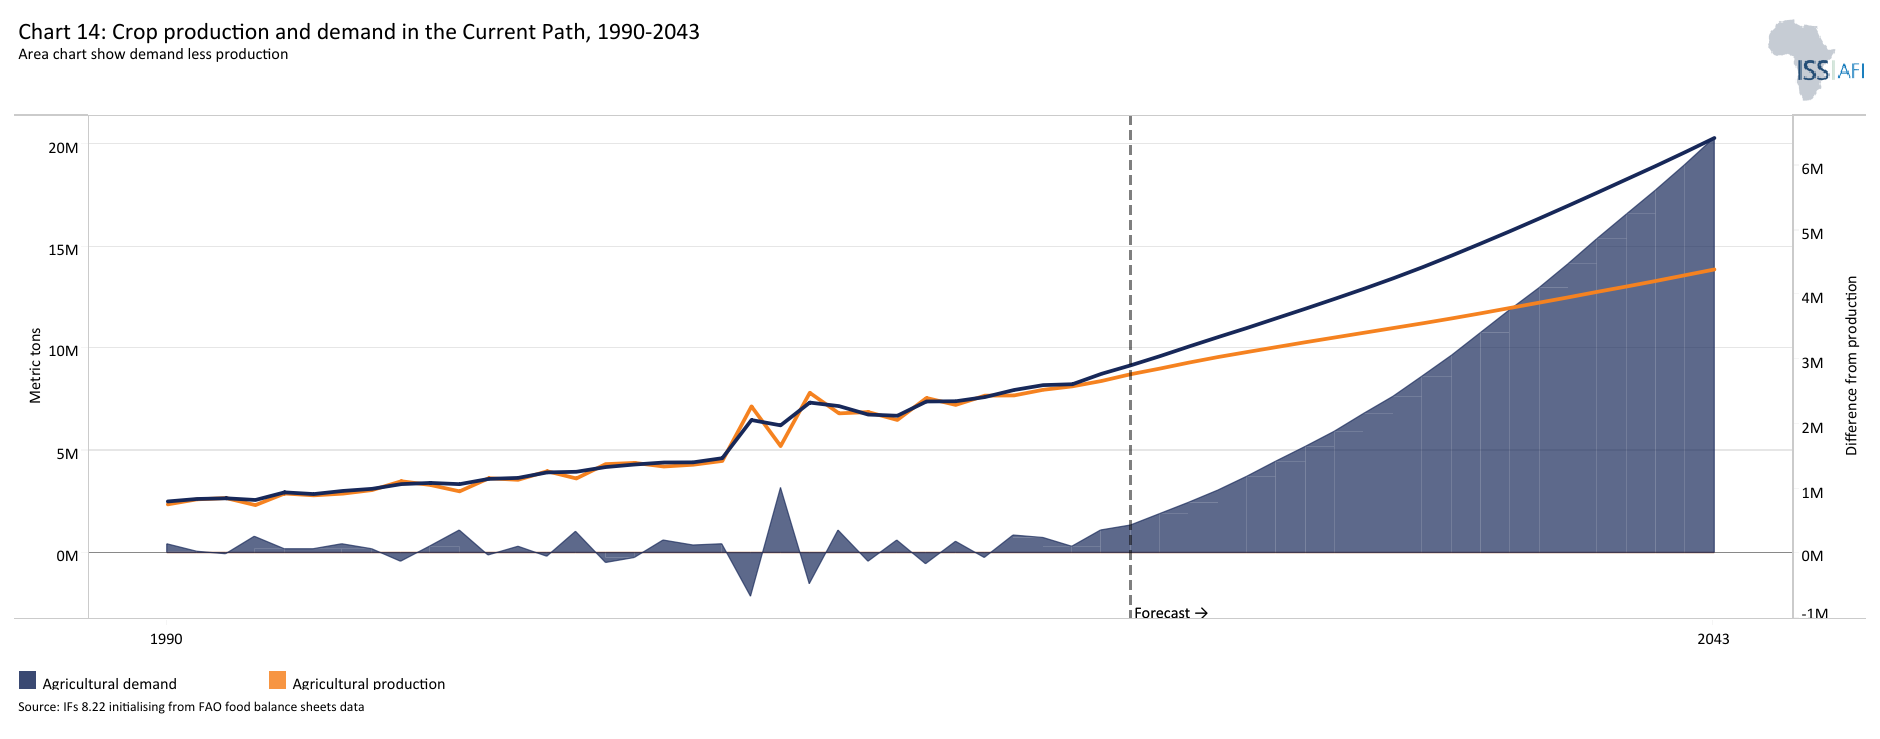
Chart 14 presents crop production and demand in the Current Path from 1990 to 2043.
Chad boasts substantial agricultural potential, and agriculture remains the main economic activity in rural areas. With an estimated 39 million hectares of cultivable land and sufficient water resources to irrigate over 5 million hectares of land, Chad could substantially increase agricultural production. It is estimated that, with appropriate infrastructure and support, one-third of Chad's land area could be used to grow crops.
However, the country's agricultural potential is underexploited. Only 7000 hectares of farmland are irrigated; the sector is characterised by a high prevalence of subsistence agriculture with low productivity. Agriculture generates 30% of GDP while employing 80% of the workforce. Millet, sorghum and rice are the main staple foods.
Chad has one of the lowest average crop yields per hectare in Africa. With an estimated 1.4 tons per hectare in 2023, the country ranked 47 out of 54 countries in Africa. On the Current Path, the average crop yields per hectare will marginally increase to 1.8 tons by 2043, far below the projected average of 3.6 tons for low-income countries in Africa in the same year.
This low agricultural productivity stems from various factors. These include climate variations such as extreme rainfall, drought, and floods, insufficient public investment, inadequate extension services, and a lack of advanced skills, all of which contribute to the limited adoption of new technologies. Additionally, poor water and land management impede efforts to boost yields and mitigate climate-related risks. The lack of integration within up- and downstream value chains, limited connectivity to local and international markets, and insecure land tenure further exacerbate the situation.
Going forward, feeding the growing population under such conditions will be one of the country's biggest challenges. In 2023, an estimated 7.2 million metric tons of crops were produced, a significant increase from the two million metric tons produced in 1990. On the Current Path, crop production will increase to about 11 million metric tons by 2043, while crop demand is set to increase from 7.6 million metric tons in 2023 to about 17 million metric tons by 2043, a deficit of 6 million metric tons (Chart 14). The Current Path paints a picture of a growing gap between domestic food production and demand, a situation that will exacerbate Chad's agricultural trade deficit with food import dependency of 37.5% of total demand by 2043 compared to 6% in 2023.
The Agriculture scenario envisions an agricultural revolution that ensures food security through ambitious yet feasible increases in yields per hectare, thanks to improved management, seed, fertiliser technology, and expanded irrigation and equipped land. Efforts to reduce food loss and waste are emphasised, with increased calorie consumption as an indicator of self-sufficiency and prioritising it over food exports. Additionally, enhanced forest protection signifies a commitment to sustainable land use practices.
Visit the theme on Agriculture for our conceptualisation and details on the scenario structure and interventions.
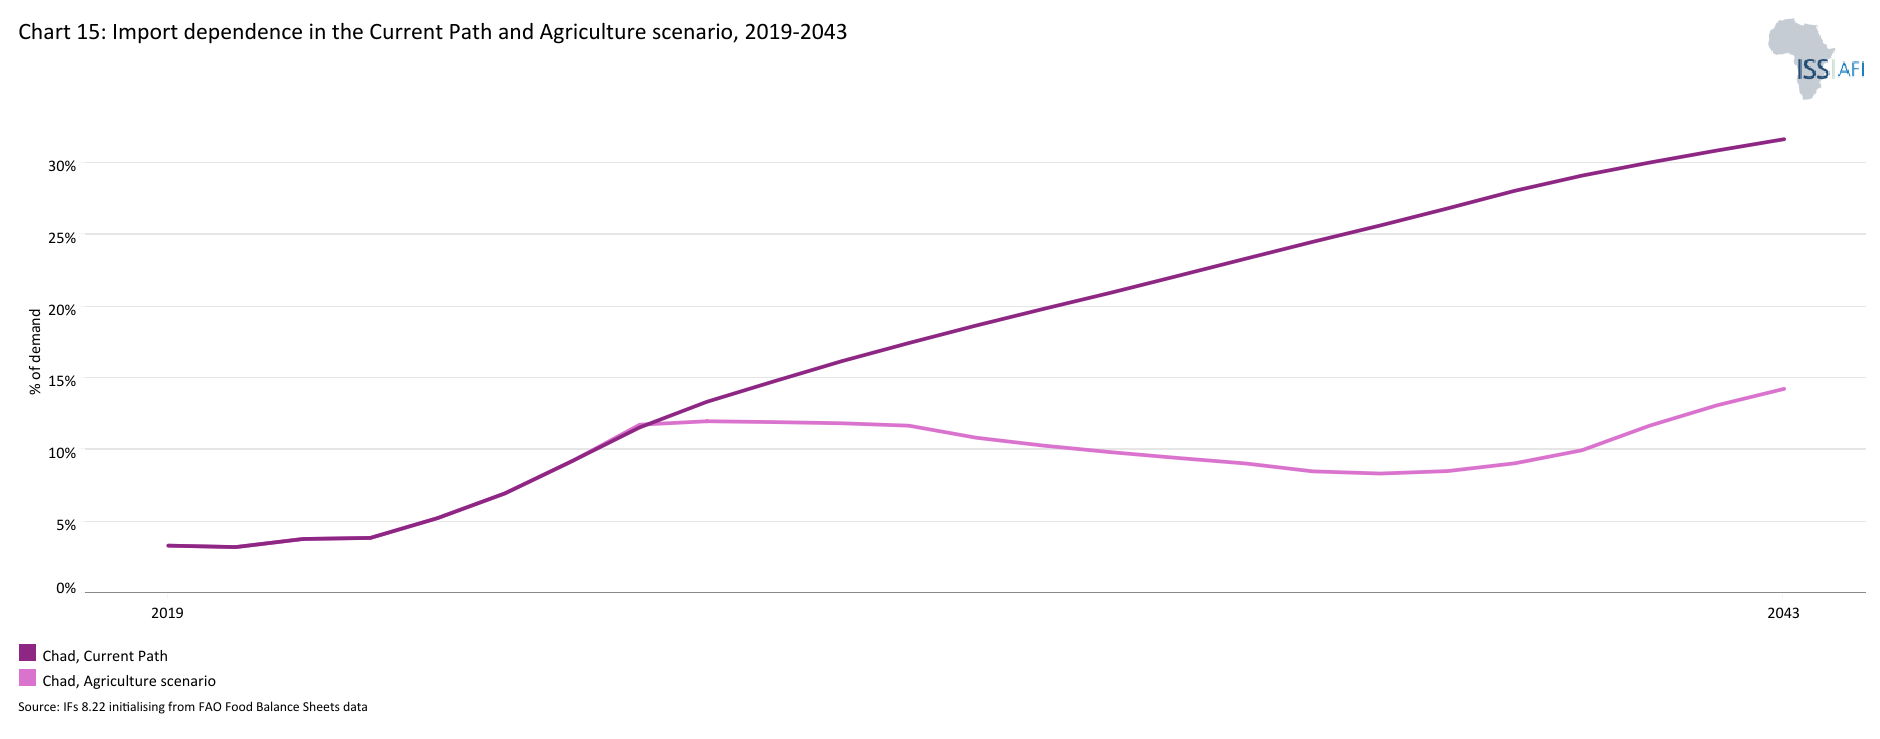
Chart 15 presents the import dependence in the Current Path and the Agriculture scenario, from 2019 to 2043.
The Agriculture scenario will benefit Chad by increasing yields, reducing vulnerable rain-fed crops through irrigation schemes, reducing post-harvest losses and tapping into Chad’s agricultural potential. In this scenario, crop production will be 5.6 million metric tons more by 2043 than in the Current Path. This will result in a lower import dependency of 17% of total demand compared with 37% in the Current Path and below the average of 33% for low-income Africa.
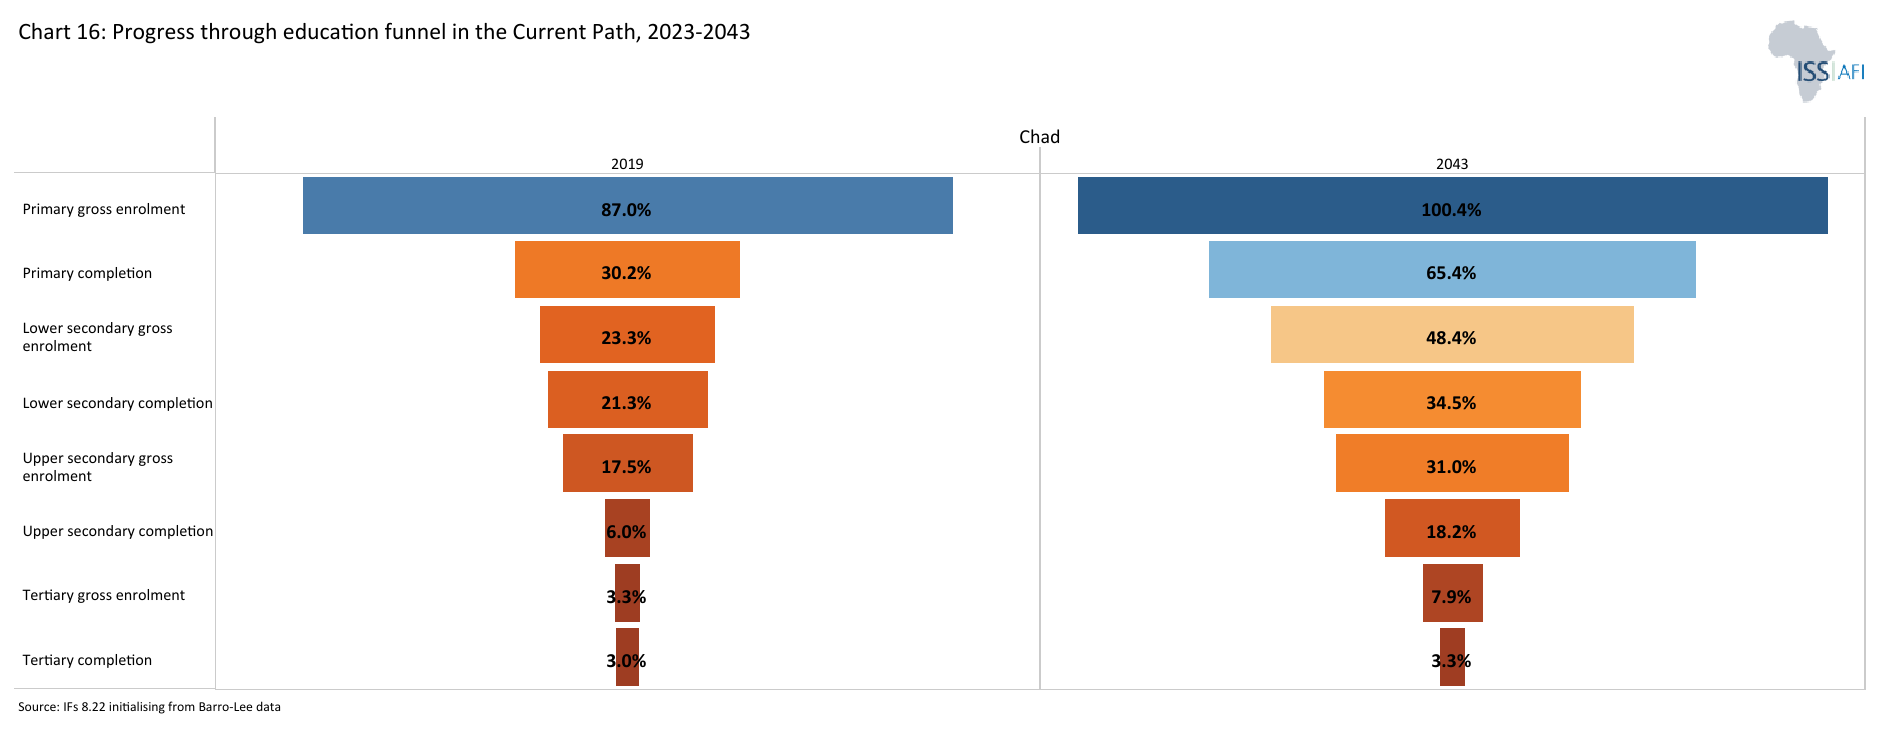
Chart 16 depicts the progress through the educational system in the Current Path, for 2023 and 2043.
Although education is a priority for Chad, the country remains faced with a real challenge to achieve Goal 4 of the Sustainable Development Goals (SDG). The educational system is characterised by a low level of schooling, with one out of two school-age children out of school.
Chad has one of the lowest literacy rates globally. In 2023, the adult literacy rate (population aged 15 years and older) stood at 27.4%, the second lowest in Africa after Somalia. Higher literacy rates are important to improve employment prospects for the poor, and hence, an opportunity to get themselves out of extreme poverty. On the Current Path, the literacy rate in Chad will likely increase to 73.6% by 2043.
Chad has made progress in primary gross enrolment, which stood at 77.5% in 2023, slightly below the average of 78.8% for African low-income countries. However, the completion rate remains very low: 37% in 2023 compared with an average of 61.2% for low-income countries. Because of low completion and transition rates right from the primary level, fewer students are eligible for subsequent education levels and the resultant outcomes get poorer (Chart 16), which in turn reduces human capital accumulation. The gross tertiary enrollment rate is just about 3%. The mean educational attainment for adults (15+ years of age) is a good indicator of the stock of human capital in a country but Chad has one of the lowest in the world, at 3.5 years in 2023. The country ranked 51th in Africa (out of 54).
One of the root causes of low educational outcomes in the country is financial constraints. Families often struggle to pay for their childrens’ registration fees, contributions and the cost of school supplies, uniforms, food, and transportation. Dropouts due to failure are also a reason.
Female education in Chad has experienced some improvements, especially at primary level, but the gap between female and male education persists. For instance, the parity ratio in primary gross enrolment increased from 0.4 in 1990 to 0.8 in 2023. The parity ratio in secondary education was 0.5 in 2023, up from 0.2 in 1990 while the parity ratio at tertiary level improved from 0.17 in 2000 to roughly 0.28 in 2023. The gender disparities in educational access are driven by social norms that prioritise investing in boys' education and emphasise young women's reproductive roles over their potential as income earners as they reach adolescence. Consequently, the proportion of primary and secondary school-aged children who cite family refusal as the main reason for not attending school is more than twice as high for girls compared to boys.
Although the country has made some progress in getting more children into school, the quality of education they receive is poor. This remains one of the major challenges facing the education system. Most children who finish their primary school studies have poor foundation in reading and maths in the two classroom languages, French and Arabic. Learners in Chad score 333 out of 625 on the Harmonised Test Scores; 625 represents advanced attainment while 300 represents minimum attainment.
The Education scenario represents reasonable but ambitious improved intake, transition and graduation rates from primary to tertiary levels and better quality of Education at primary and secondary levels. It also models substantive progress towards gender parity at all levels, additional vocational training at the secondary school level and increases in the share of science and engineering graduates.
Visit the theme on Education for our conceptualisation and details on the scenario structure and interventions.
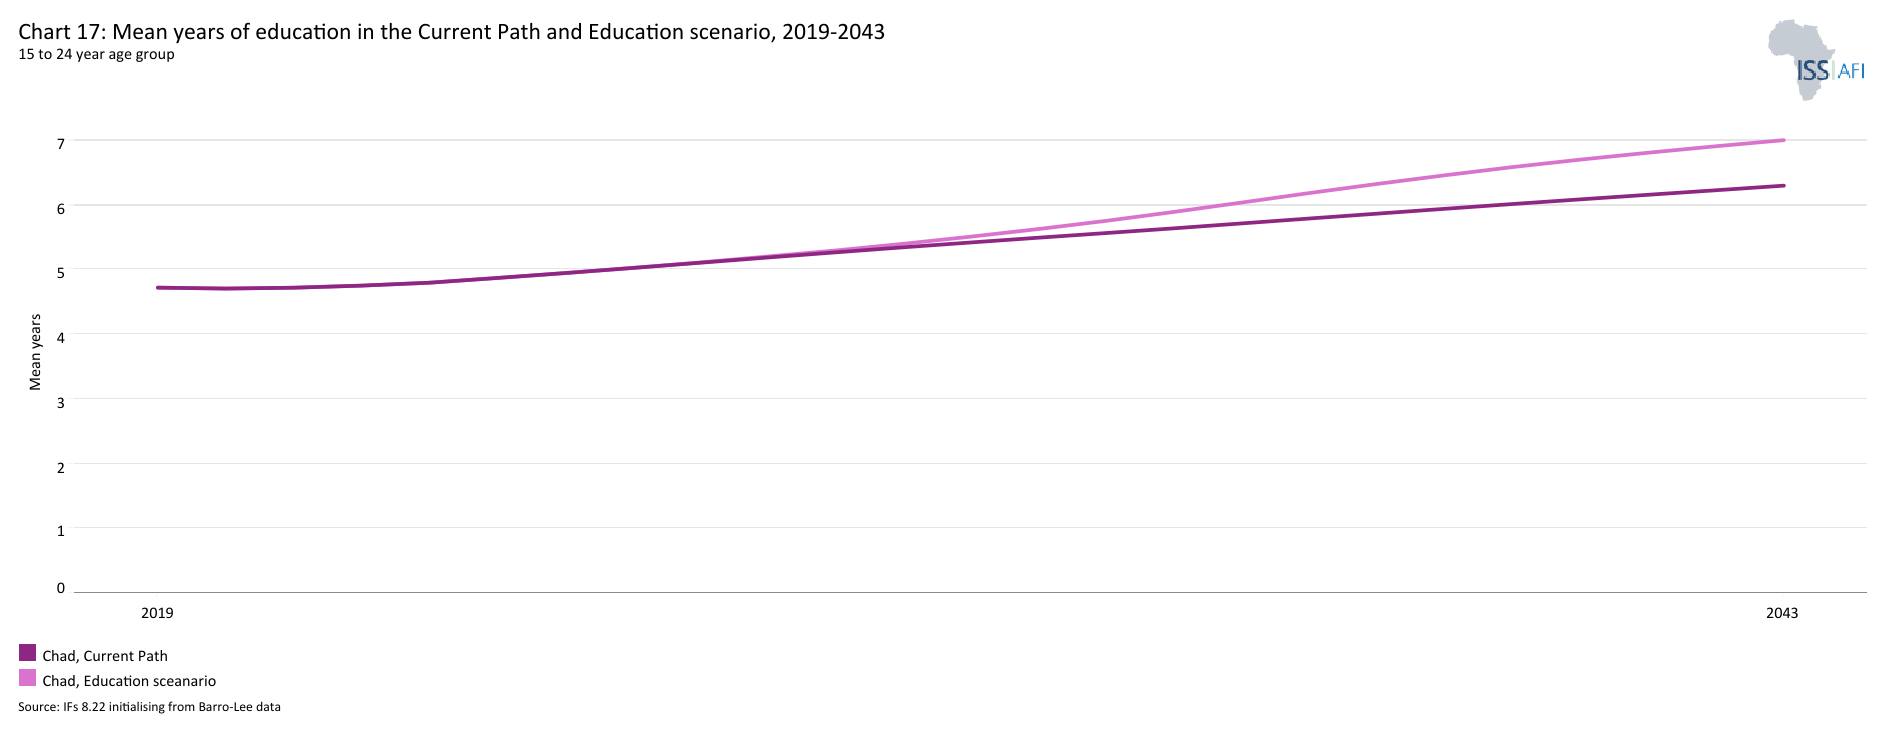
The average years of education in the adult population aged 15 to 24 is a good first indicator whether the stock of education in society is changing. The mean educational attainment for adults aged 15 to 24 in Chad is low. It stood at 4.8 years in 2023 and will reach about 6 years in 2043. The implementation of the Education scenario would improve the mean years of education for adults aged 15 to 24 in Chad to 7 years by 2043 (Chart 17).
Low-skilled and poorly educated workers make up most of the labour force in Chad. Due to the low economic complexity, the labour market tends to require more unskilled labour but over time as the economic complexity increases there will be a growing demand for more skilled labour, particularly in the formal sector. Given the current weak education system, Chad remains ill-prepared to produce relevant skills for the job market, which could hamper competitiveness and productivity.
The Education scenario could contribute to addressing these challenges. The share of science and engineering students in tertiary graduates in Chad will increase to 21% by 2043 in the scenario, five percentage points higher than 16% on the Current Path in 2043. Also, the share of vocational students in total students at the upper-secondary level is 11.5% in 2043 compared to only 5.2% on the Current Path in the same year.
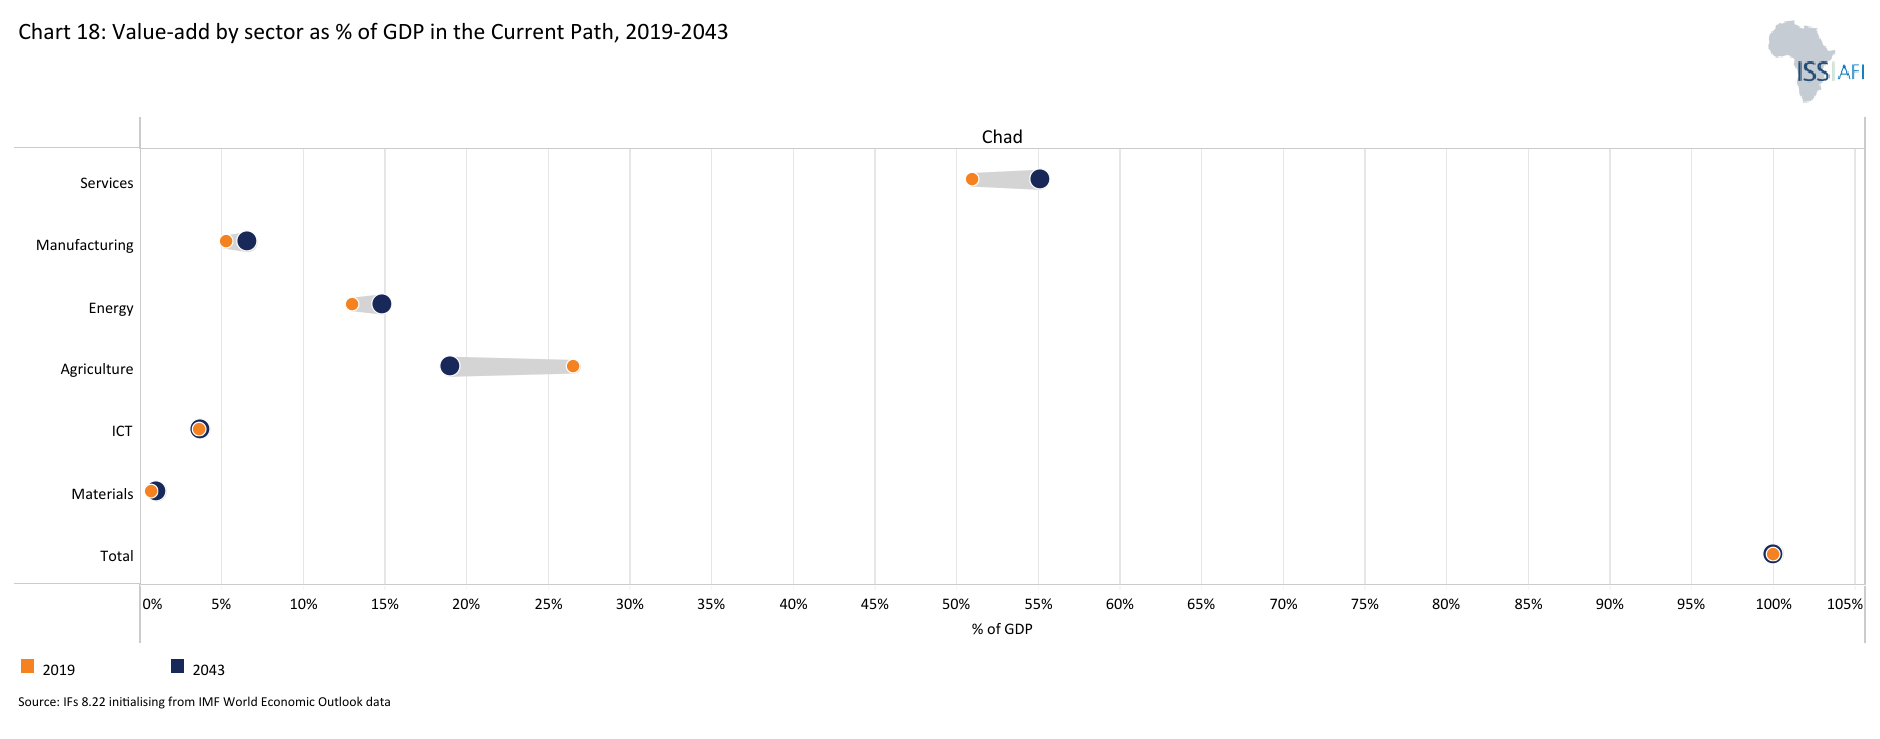
Chart 18 presents the value-add by sector as share of GDP in the Current Path, for 2023 and 2043.
The continued reliance on oil has led Chad’s economy undiversified and vulnerable to exogenous shocks. Manufacturing forms only a small part of the economy. It is limited to small-scale processing of cotton, textiles and sugar with its contribution to GDP ranging between 2% to 3% since 2012, after reaching about 10% in the 1980s and 1990s. Chad is currently one of the least industrialised countries in Africa. In 2022, it ranked 44 of 52 countries on the African Development Bank's African Industrialisation Index, which measures African progress on industrialization. On the Current Path, the share of the manufacturing sector in Chad’s GDP will likely increase marginally to 6.5% by 2043, far below the projected average of 20.5% for low-income Africa (Chart 18).
The manufacturing sector faces significant challenges, including low consumer purchasing power, a difficult business and investment climate, and limited private sector financing due to an underdeveloped domestic financial market. Chad's business environment is particularly challenging, with private sector growth hampered by poor transport infrastructure, a shortage of skilled labour due weak education system, minimal and unreliable electricity supply, limited telecommunications infrastructure, excessive government bureaucracy, weak contract enforcement, corruption, and high tax burdens on private enterprises. Despite the already limited availability of skilled labour, companies attempting to bring in foreign experts for projects encounter stringent restrictions on the employment of foreigners.
Like in other African countries, many impoverished individuals in Chad find themselves entrenched in low-productivity agriculture and informal service-based activities. Boosting the manufacturing sector will generate inclusive growth by facilitating the transition of low-income individuals from these sectors to higher productivity areas. This structural shift not only boosts incomes but fosters a positive cycle wherein the growth of productive employment, capacities and earnings mutually reinforce one another, propelling economic expansion and poverty reduction.
However, industrialization is a long-term process. It requires constructive relationships between the state that encourages and supports the private sector. Firms need a state that has strong capabilities in setting an overall economic vision and strategy, efficiently providing supportive infrastructure and services, maintaining a regulatory environment conducive to entrepreneurial activity, and making it easier to acquire skilled labour and new technology and enter new economic activities and markets.
The Manufacturing scenario models the impact of the manufacturing push in Chad. A reasonable but ambitious growth in manufacturing is envisaged through increased investment in the sector, research and development (R&D), and improved government regulation of businesses. This aims to enhance total labour participation rates, particularly among females and is accompanied by increased welfare transfers to unskilled workers to mitigate the initial rises in inequality typically associated with structural transformation. Structural transformation may have a tendency—in the absence of policy intervention—to put upward pressure on income inequality.
Visit the theme on Manufacturing for our conceptualisation and details on the scenario structure and interventions.
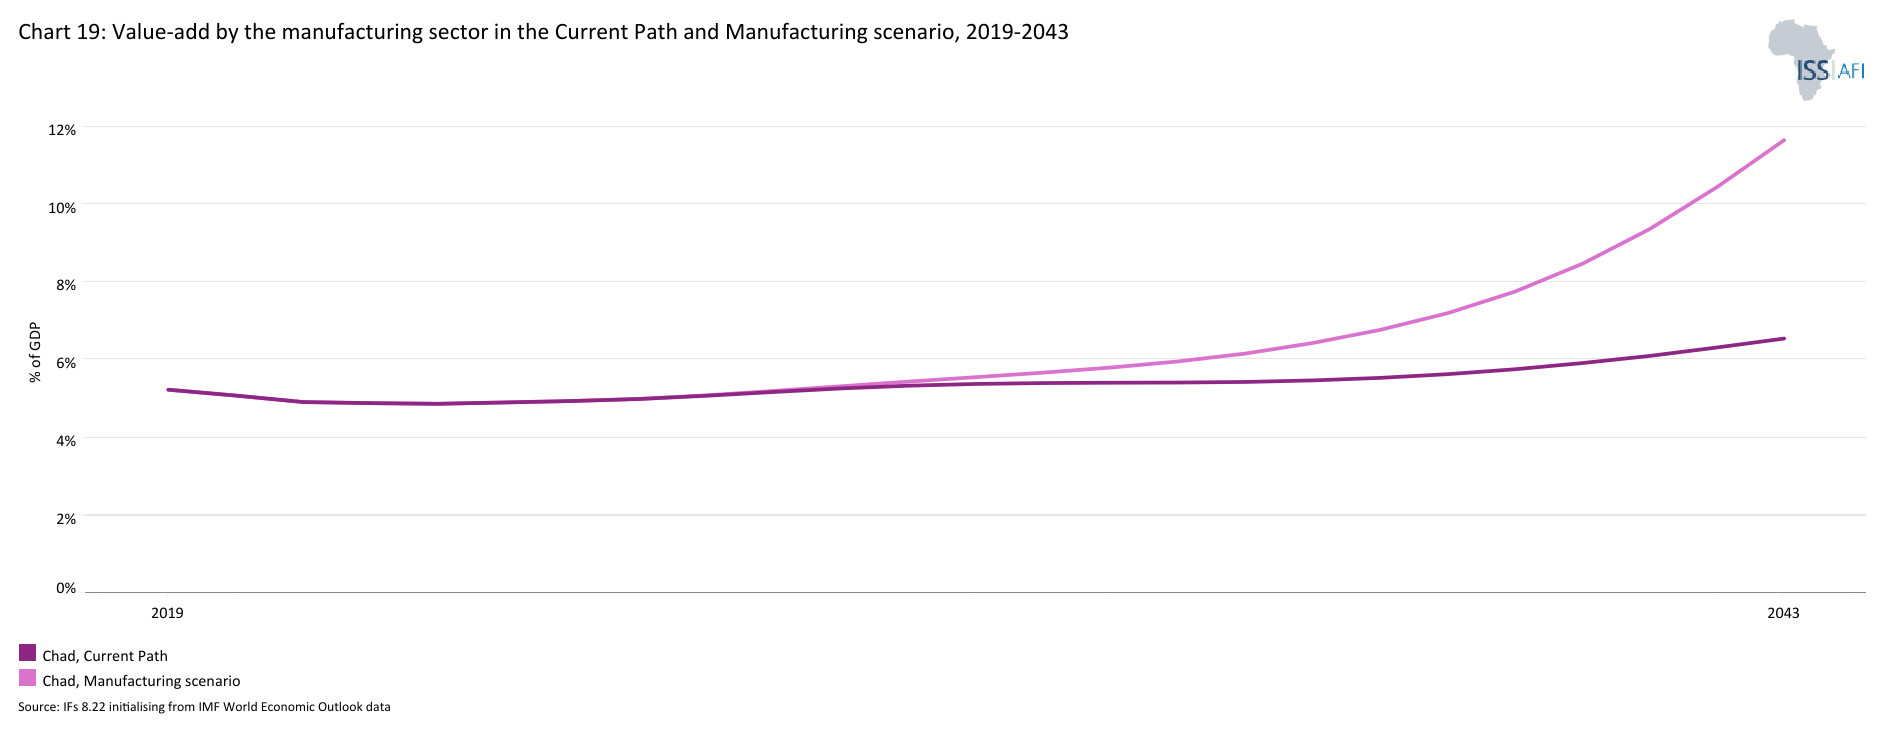
Chart 19 presents the contribution of the manufacturing sector to GDP in the Current Path and in the Manufacturing scenario, from 2019 to 2023. The data is in US$ and % of GDP.
There is an urgent need for Chad to diversify its economy away from oil. Improving light manufacturing (light agro-processing) will be instrumental. On the Current Path, the share of the manufacturing sector in Chad’s GDP will likely increase marginally to 6.5% by 2043, far below the average of 20.5% for low-income Africa. However, the implementation of the Manufacturing scenario could push the share of the manufacturing sector in GDP to 11.6% by 2043 (Chart 19) comparable to its level in the 1980s and 1990s, but almost half of the average for low-income Africa.
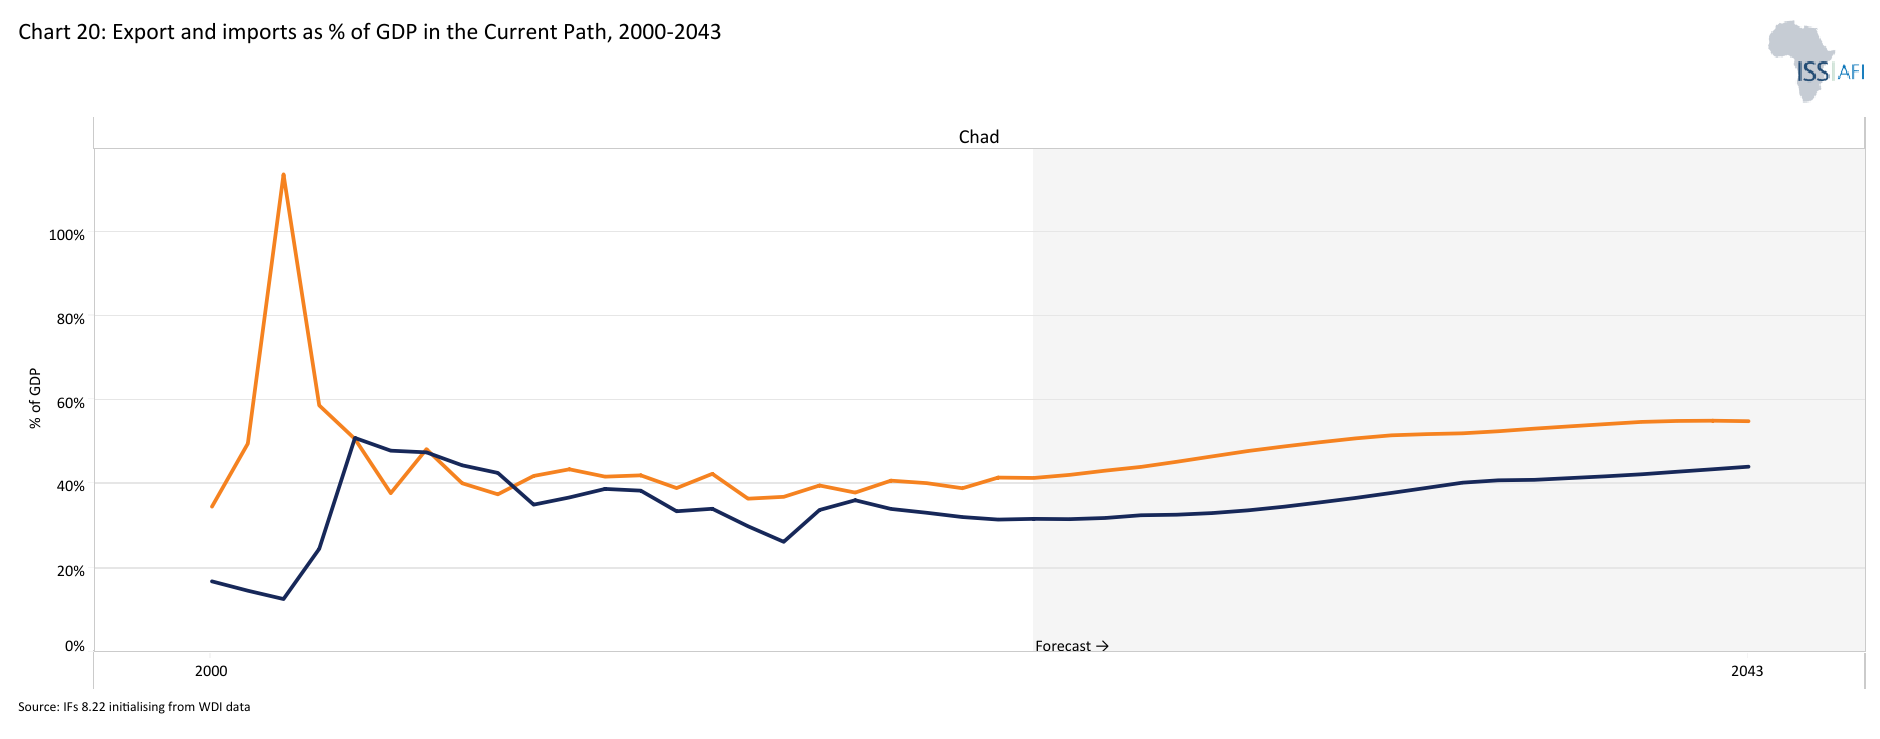
Chart 20 depicts exports and imports as a percentage of GDP, from 2000 to 2043, in the Current Path.
Chad has among the highest trade costs, with the nearest port in Douala, Cameroon 1,800 kilometres away. And, the country has an economy largely dependent on oil means the country is vulnerable to terms-of-trade shocks, which can have an outsized impact on its impoverished population. The trade pattern of Chad is similar to that of many other African countries that rely on a few key commodity exports while importing higher-value manufactured goods, consumer items and foodstuffs.
Chad is open to trade with a foreign trade (export plus import)-to-GDP ratio of 90.76% in 2022, above the average of 38.14% for low-income Africa.
Chad's top exports are Crude Petroleum, Gold, Oily Seeds, Insect Resins, and Raw Cotton, which it exports mostly to Germany, China, the United Arab Emirates, Chinese Taipei, and France. In 2022, oil accounted for 76% of Chad's total export value, while gold accounted for 20%. African destinations of Chad export account for less than 2% of Chad's total exports, owing in part to its excessive dependence on crude oil exports and other primary commodities.
Chad's top imports are Vaccines, blood, antisera, toxins and cultures, Jewellery, Electric Generating Sets, Broadcasting Equipment, and Packaged Medications, mostly from China, the United Arab Emirates, France, the United States, and Belgium. Its leading African trade partners are Cameroon, Côte d’Ivoire, Nigeria, and Senegal, which account for 91.5 percent of its total intra-African trade.
In 2023, the total import value was estimated at 41.5% of GDP while the total export represented 31.7%. On the Current Path, the value of imports will continue to remain above Chad’s exports. By 2043, Chad’s import value will represent 55% of GDP against 42.7% for its exports in the same year (Chart 20).
The Free Trade (AfCFTA) scenario models the impact of fully implementing the African Continental Free Trade Agreement by 2034. The scenario increases exports in manufacturing, agriculture, services, ICT, materials and energy exports. It also includes improved multifactor productivity growth from trade and reduced tariffs for all sectors.
Visit the theme on AfCFTA for our conceptualisation and details on the scenario structure and interventions.
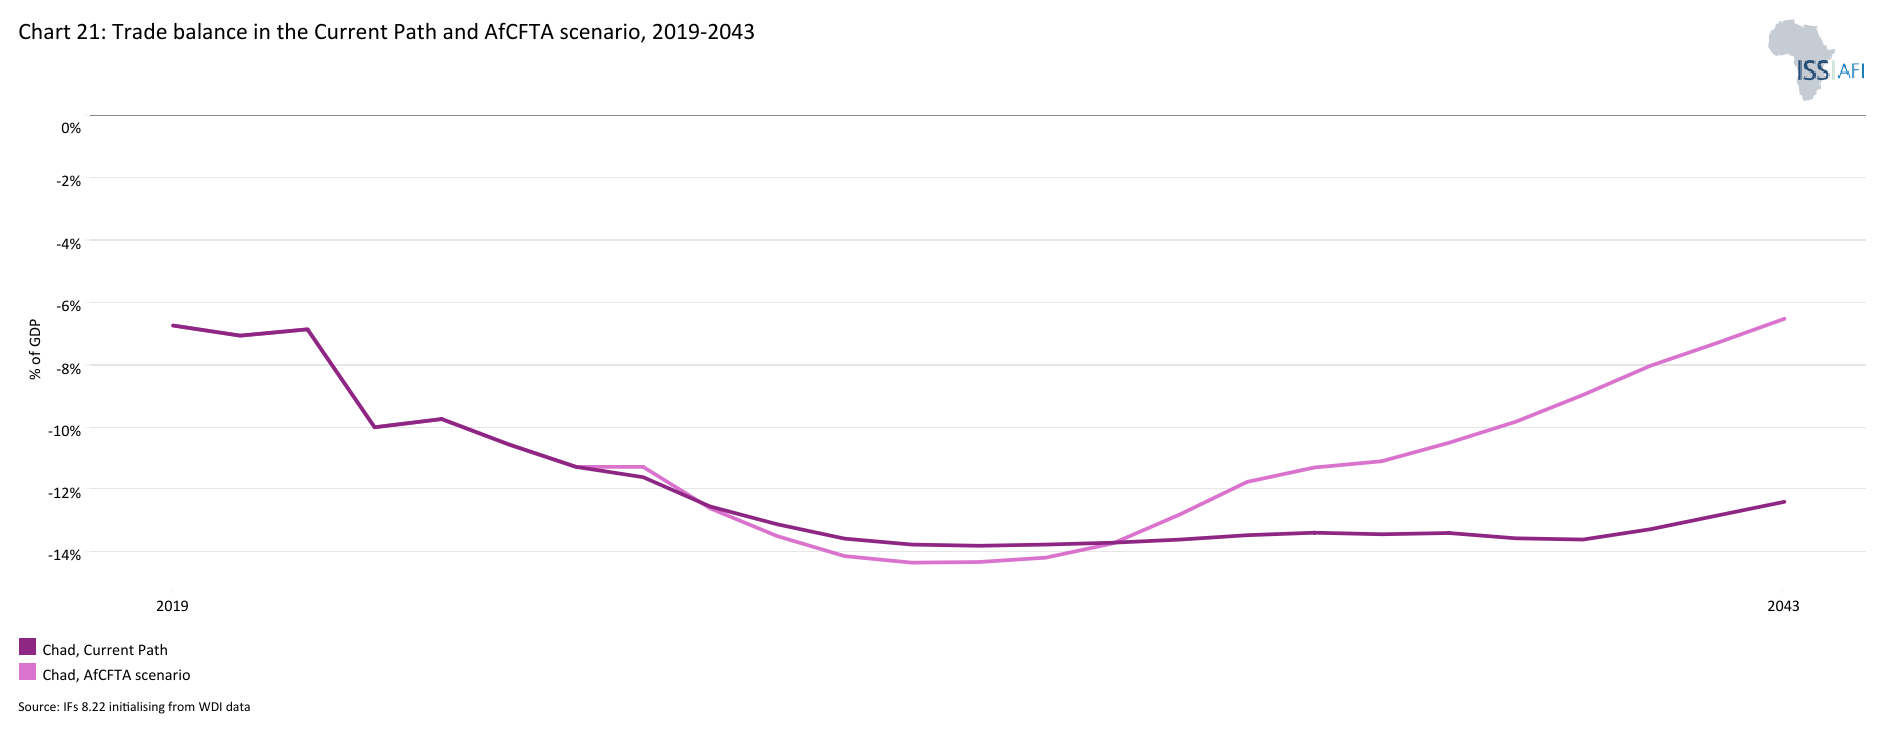
Chart 21 presents the trade balance in the Current Path and in the AfCFTA scenario, from 2019 to 2043 as a percentage of GDP.
Chad’s trade balance is structurally in deficit— a trend which is likely to persist over the forecast horizon. On the Current Path, the trade deficit will likely be equivalent to 12.4% of GDP by 2043, which is significantly higher than its level of 9.7% in 2023. In the AfCFTA scenario, where trade restrictions are loosened and productivity is increased, Chad would not record a trade surplus or be a net exporter; however, its trade deficit could significantly improve from a projected deficit equivalent to 12.4% of GDP in the Current Path by 2043 to only 6.5% of GDP. The AfCFTA represents a major opportunity for African countries, including Chad, to overcome the constraints of narrow domestic markets to boost exports. In the AfCFTA scenario, the value of Chad’s total export is about US$1.8 billion larger than the Current Path in 2043. These gains will, however, require major efforts to reduce the burden on businesses and traders to cross borders quickly and safely and with minimal interference by officials.
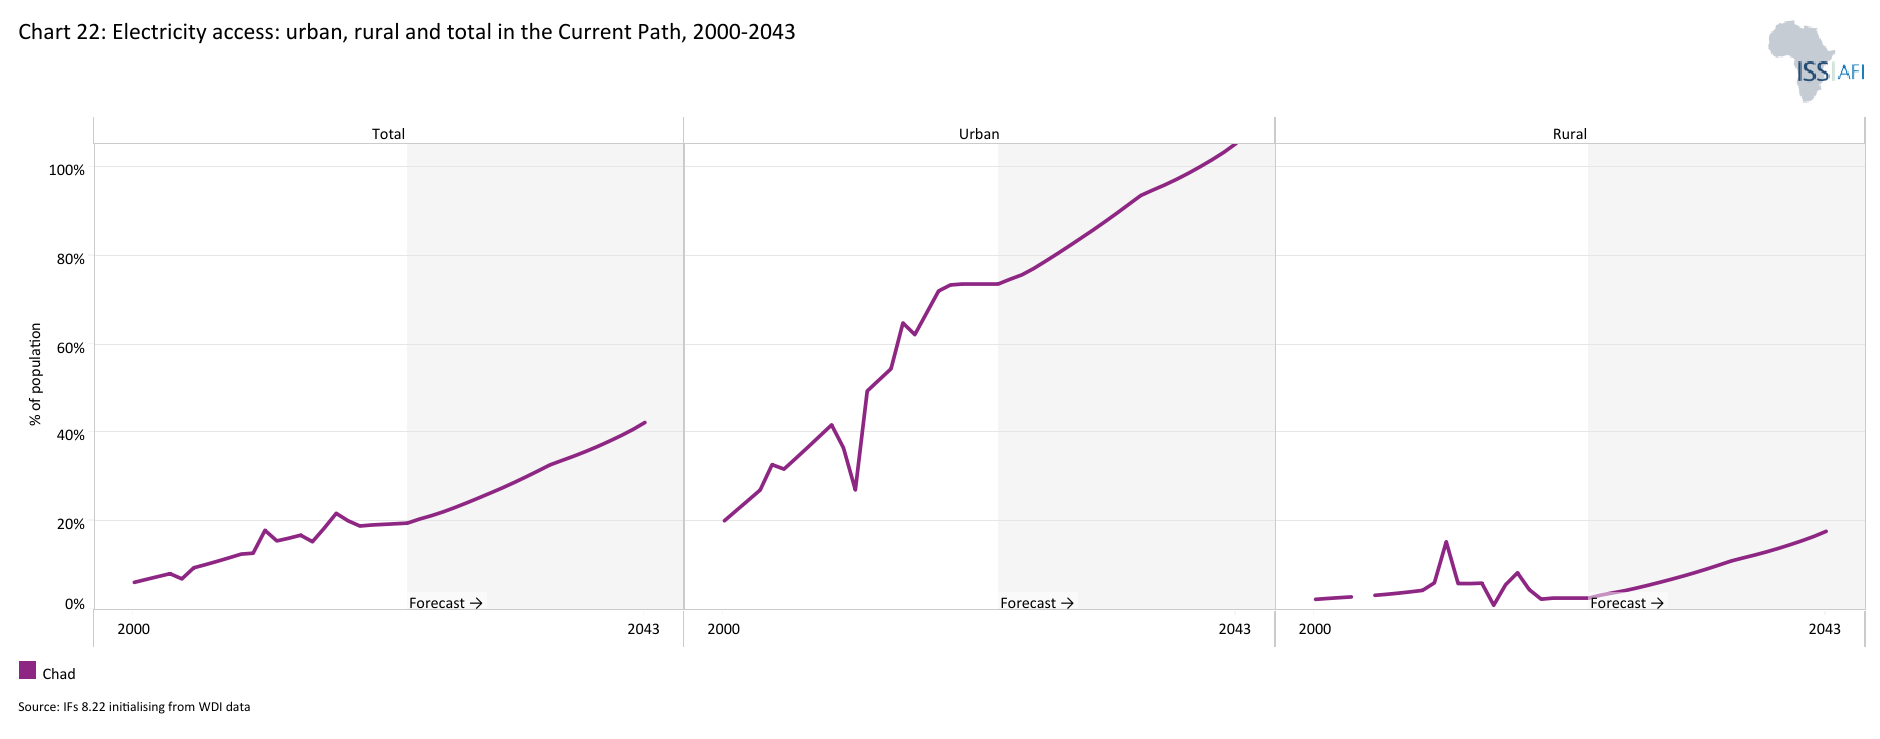
Chart 22 presents the Current Path of access to electricity for urban, rural and the total population from 2000 to 2043.
Infrastructure shortage is one of the significant constraints to the modernisation of the Chadian economy. In 2020, Chad ranked 51 out of 54 African countries on the African Infrastructure Development Index (AIDI). Chad, Niger, South Sudan and Somalia continuously occupy last place on the index. Poor infrastructure coverage and low quality in Chad increase transaction costs and lower the return on capital and work, discouraging domestic and foreign investment and constraining economic growth. It is estimated that the cost of addressing the country’s infrastructure needs by 2030 would be more than 50% of its 2021 GDP. Even if major potential efficiency gains are achieved and domestic revenue can be increased from its current low levels, Chad would still face important infrastructure funding gaps that would need to be financed by innovative and non-traditional financing sources.
The exorbitant cost and scarcity of electricity pose a major obstacle to Chad’s economic development. Despite the endowment of fossil fuels and solar resources, Chad has Africa's third-lowest electricity access rate, only ahead of Burundi and South Sudan. As of 2021, only 11.3% of the country's total population had access to electricity compared to about 37% for the average for low-income Africa. Access to electricity is also skewed in favour of urban areas, especially in N’Djamena, the capital city. In 2021, 43% of the population in urban areas had access to electricity, while it stood at only 1.3% of the people in rural areas. Even for those connected to grid power, supply remains unreliable mainly. Electricity demand significantly exceeds capacity due to deficient governance, inadequate tariffs, high production costs, and lack of policies to enable private investments in off-grid access. On the Current Path, the national electricity access ratewill improve modestly to 18.5% by 2043 with 7% in rural areas and 48% in urban areas (Chart 22).
Chad transport infrastructure is also inadequate. The country mainly depends on road transport for the transportation of goods and services and has a crumbling road network of about 40 000 km, of which about 1% is paved. Travelling on dirt roads is slow and extremely difficult during the rainy season, isolating many communities and limiting trade. On the Current Path, 15% of the total road network will likely be paved over the next 20 years to 2043.
In sum, the infrastructure deficit, especially poor access to electricity and the lack of a good road network are cited as some of the most significant obstacles to expanding the small private sector in the country.
The Large Infrastructure and Leapfrogging scenario, therefore, addresses these issues. It involves ambitious investments in road and renewable energy infrastructure, improved electricity access and accelerated broadband connectivity. It emphasises adopting modern technologies to enhance government efficiency and the rapid formalisation of the informal sector, incorporating significant investments in major infrastructure projects like rail, ports, and airports while highlighting the positive impacts of renewables and ICT.
Visit the themes on Large Infrastructure and Leapfrogging for our conceptualisation and details on the scenario structure and interventions.
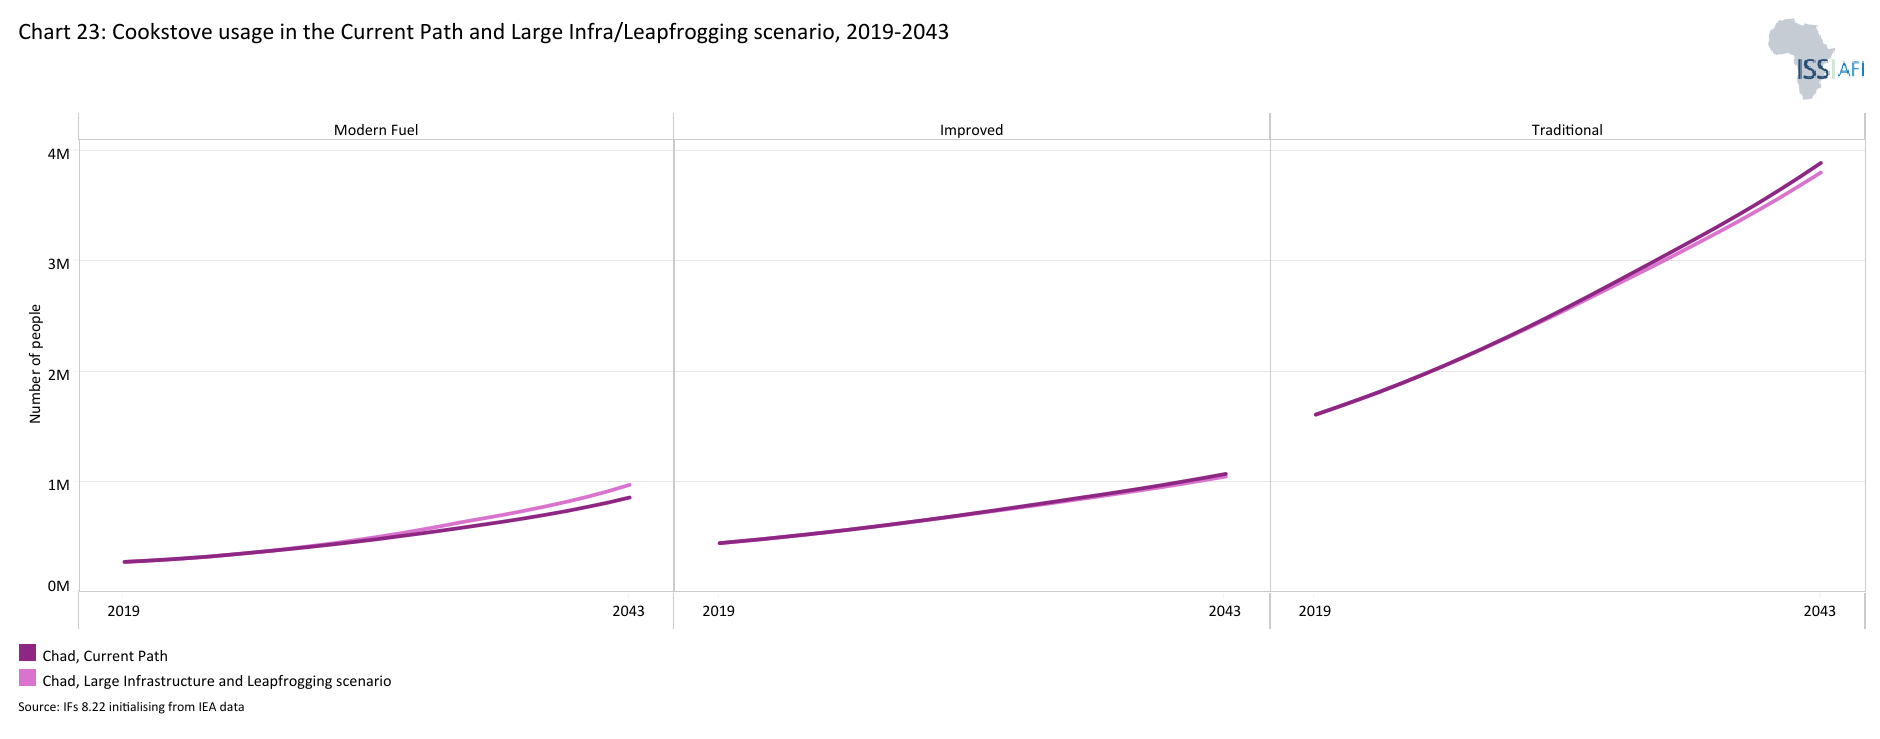
Chart 23 presents the number of people using cookstoves in the Current Path and in the Large Infrastructure and Leapfrogging scenario, from 2019 to 2043.
Due to limited electricity access, especially in rural areas, the bulk of the households continue to rely on inefficient energy sources for cooking. Wood and charcoal (traditional cookstoves) provide 83% of the energy consumed in Chad.
This poses a risk to the environment with the acceleration of deforestation. It also affects the health of infants and children by causing respiratory problems. It also limits study hours for girls because the daily collection of firewood, which sometimes involves young girls, may deprive them of time that could be devoted to education.
However, in the Large Infrastructure and Leapfrogging scenario, the percentage of households that use traditional cookstoves could be 65%. The share of households using modern fuel cookstoves is 16.7% by 2043, compared to the Current Path of 14.7% in the same year. These findings imply that increasing access to energy/electricity and/or off-grid renewable energy solutions, especially in rural areas, could contribute to reducing emissions by shifting households away from traditional cooking methods to modern ones.
Chart 24 presents the percentage of the population and number of people with access to mobile and fixed broadband in the Current Path and in the Large Infrastructure and Leapfrogging scenario, from 2019 to 2043. The user can toggle between mobile and fixed broadband.
Limited access to and poor quality of digital connectivity also limits Chad's growth potential. The mobile broadband subscriptions per 100 people were at about 7.3 in 2021, against an average of 27 for low-income Africa. It will be at 129.7 by 2043.
Fixed broadband provides faster internet access speeds with more secure connections and is important for high value-add service sectors. However, fixed broadband penetration in Chad is strikingly low, with a subscription rate of 0.002 per 100 people, on the Current Path, fixed broadband subscriptions are forecast to be 18.5 per 100 people by 2043. In the Large Infrastructure and Leapfrogging scenario, fixed broadband subscriptions will reach 28 per 100 people by 2043.
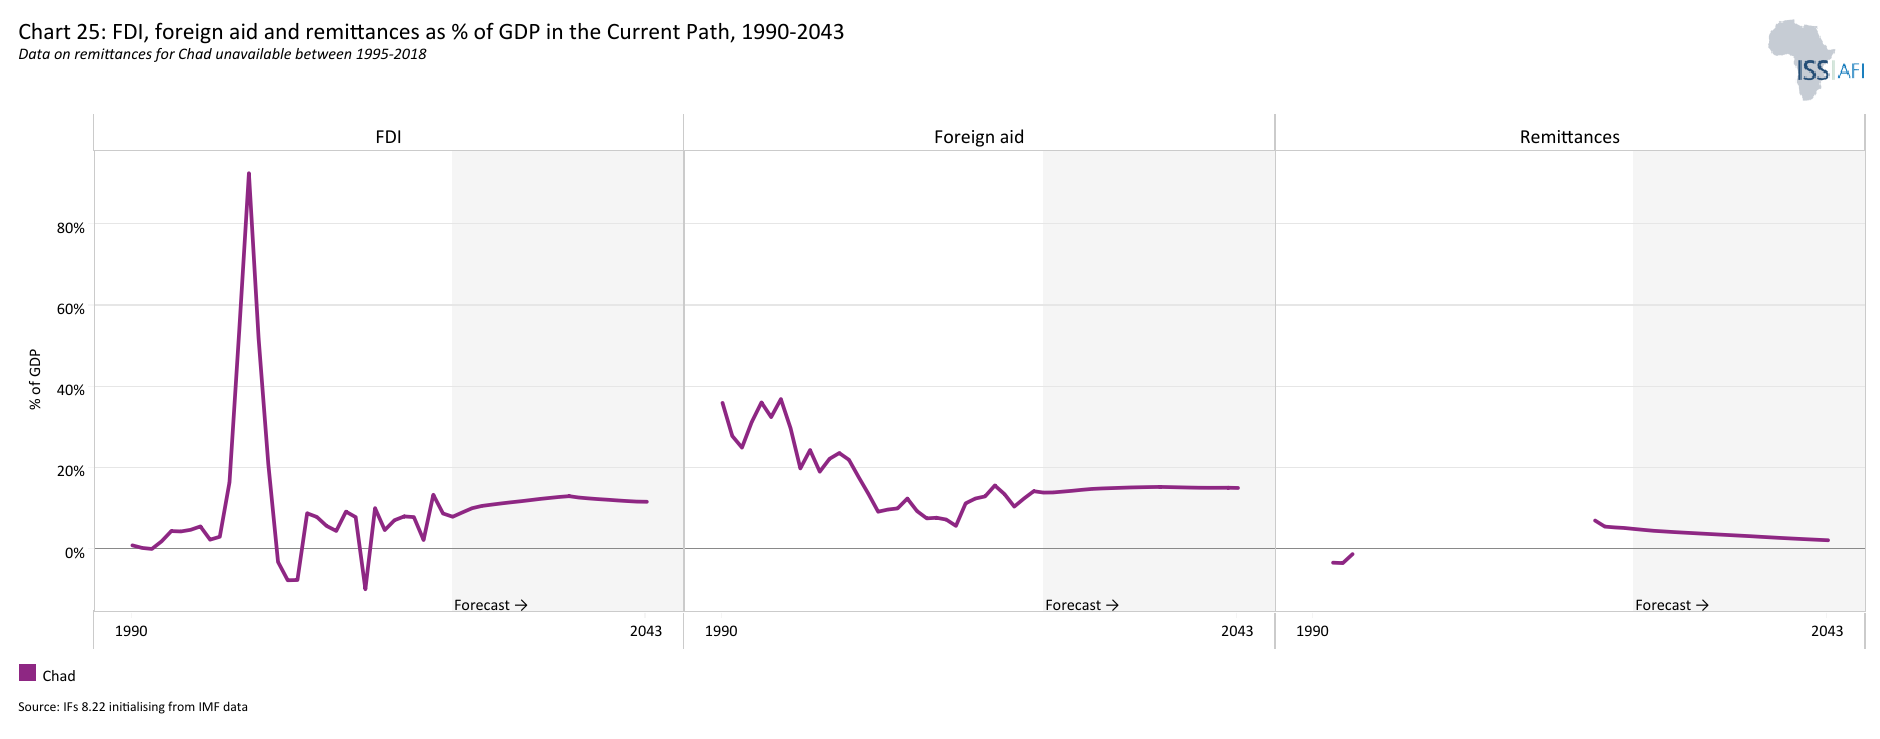
Chart 25 presents the trends in FDI, aid and remittances in the Current Path and in the Financial Flows scenario as a percentage of GDP, from 1990 to 2043.
Chad receives significant foreign aid, especially humanitarian aid. The country has become a refugee sanctuary to citizens of neighbouring countries such as Sudan, Central African Republic, and Nigeria providing shelter for about 480 000 refugees and almost 300 000 internally displaced people. The EU is one of the main humanitarian aid donors to Chad. In 2023, the EU allocated more than €56 million in humanitarian assistance to help the most vulnerable in the country.
With net foreign aid representing about 7% of GDP in 2023, Chad ranked 13th in Africa for aid received as a percentage of GDP. On the Current Path, aid flows to Chad as a percentage of GDP will revolve around 7% across the forecast horizon (see Chart 25).
In addition to aid, the Government of Chad is generally seeking to attract foreign investment to promote economic growth and industrialization. Since oil production began in 2003, the petroleum sector has dominated economic activity and has been the largest target of foreign investment to the country. FDI inflows represented about 46.3% in 2002, the highest ever, driven by foreign investment related to oil production.
Chad's business and investment environment remains difficult. Foreign investment faces obstacles such as inadequate transport infrastructure, a shortage of skilled labour, unreliable electricity supply, weak contract enforcement, pervasive corruption, and high tax burdens on private enterprises. Nonetheless, Chad offers opportunities for targeted investment in key sectors like agribusiness, agriculture, construction, education, energy and mining, environmental technologies, food processing and packaging, health technologies, information technology, industrial equipment and supplies, information and communication, and services. To encourage investment in these target sectors, the Government of Chad introduced tax credits, discounts, and exemptions for investments in agriculture, animal husbandry, solar and wind energy, information technology, oil, and plastics in the 2021 Finance Law.
As of 2022, FDI flows to Chad represented about 4.5% of GDP. On the Current Path, these will reach about 5.2% of GDP(Chart 25).
Many Chadians who live abroad also send money back home (remittances). Remittances are a crucial lifeline for many households in Chad. A recent study by the International Organization for Migration (IOM) surveyed over 800 households in N’djamena, the capital city of Chad, to understand the utilisation of remittances from family members living abroad. The study found that the average remittance amount exceeds the average monthly salary. Households receiving remittances reported an average monthly amount of 125,302 CFA francs (US$131), which surpasses the average monthly income of 113,807 CFA francs (US$119). The study also indicated that remittances are primarily spent on general household expenses, followed by food, social reasons, health, and education. Only 10% of respondents reported using remittances for investment purposes. Remittances, therefore, serve as a private source of capital that helps households escape poverty and improve their living conditions in Chad.
In 2023, remittances represented 2.5% of GDP, and, on the Current Path, will decline to about 1.1% of GDP by 2043.
In addition to their contribution to poverty reduction and human development, remittances tend to be less volatile to economic downturns than FDI and Portfolio Investment, and hence may help mitigate balance of payment difficulties if encouraged and facilitated.
An increase in foreign financial flows can bring considerable economic benefits to Chad and reduce its persistent balance of payment difficulties. The Financial Flows scenario represents a reasonable but ambitious increase in inward flows of worker remittances, aid to poor countries and an increase in the stock of foreign direct investment (FDI) and additional portfolio investment inflows. We reduce outward financial flows to emulate a reduction in illicit financial outflows.
Visit the theme on Financial Flows for our conceptualisation and details on the scenario structure and interventions.
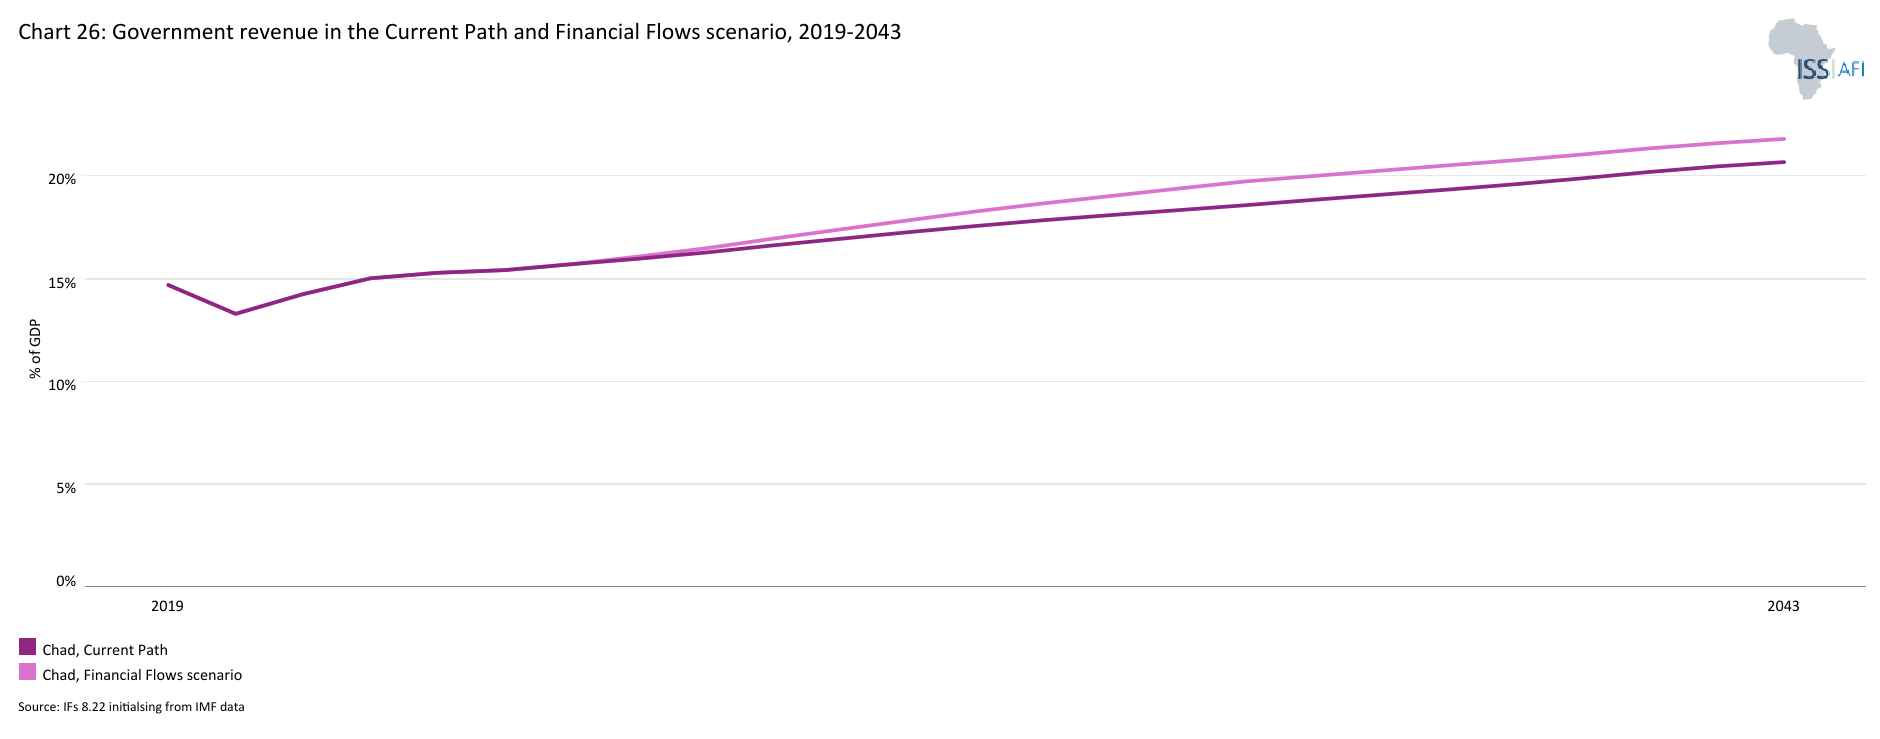
Chart 26 presents government revenue in the Current Path and in the Financial Flows scenario, from 2019 to 2043. The data is in US$ 2017 and % of GDP.
In the Financial Flows scenario, government revenue increases across the forecast horizon to reach 21.8% of GDP by 2043 (US$5.1 billion), up from 15.3% in 2023. This is 1.1 percentage points of GDP above the Current Path in 2043.
Several pathways might explain the positive association between capital inflows and government revenue. The first is direct because more aid means more revenue for the government to provide public services. Another is indirect: higher inflows are associated with higher tax revenue because foreign direct investors tend to have good tax compliance habits or are subject to natural resource taxes. Or higher inflows could be associated with higher economic growth and, therefore, higher government revenues.
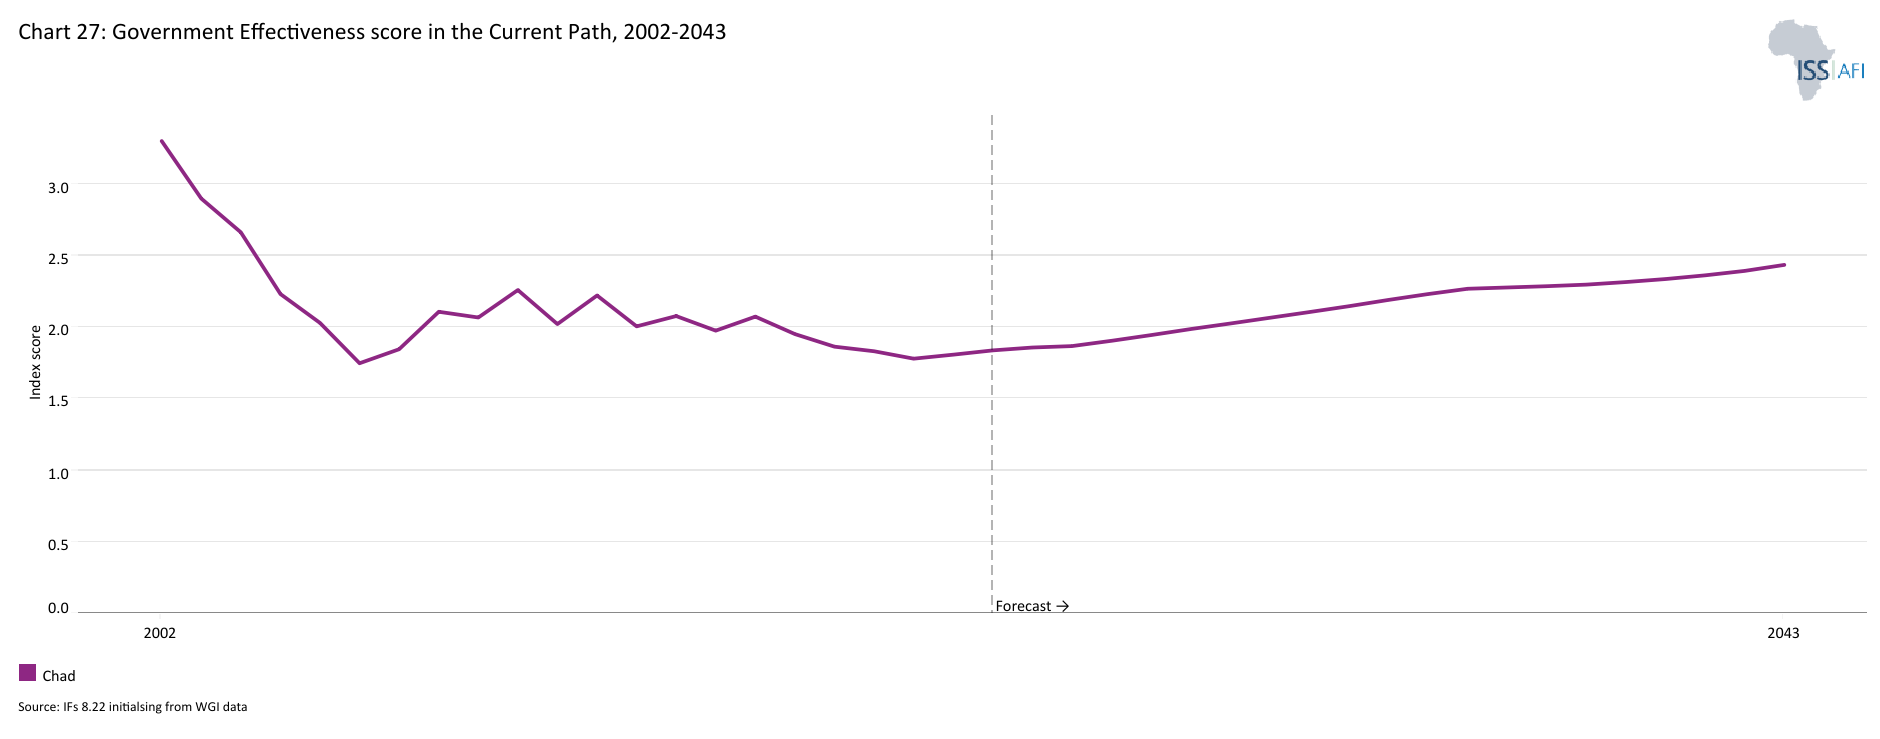
Chart 27 presents the Current Path of government effectiveness comparing the country to the average for the Africa income group, from 2002 to 2043.
Good governance is key to economic progress. Greater security and stability at the national level creates an enabling environment for domestic and foreign investment. It also creates conditions in which governments can pursue effective sustainable development strategies.
Bad governance, high levels of corruption and a highly conflictive society have stunted development progress in Chad. Chad’s recent history has been characterised by insecurity, endemic corruption and a deeply entrenched patronage system which permeates all sectors of society. According to the 2022 Ibrahim Index of African Governance (IIAG) report, Chad is one of the countries with the biggest governance challenges in Africa. With a score of 34.5 out of 100 - where 100 indicates the full provision of political, social and economic public goods and services that a citizen expects from his/her government and the state has responsibility to deliver to its citizens - it ranked 47th of 54 African countries. Chad's score is lower than the African average (48.9) and lower than the regional average for Central Africa (39.1).
Major international governance indicators suggest persistent, widespread and endemic forms of corruption, permeating all sectors of Chadian society, with little evidence of progress made in anti-corruption in recent years. Even newly constructed roads degrade after a short period due to corruption within the ruling elite during the commissioning process. According to the global Corruption Perceptions Index (CPI) 2023 by Transparency International, Chad, with a score of 20 out of 100, occupies 162th position out of the 180 countries surveyed. This high level of corruption, along with limited public administration capacity, a concentration of resources and decision-making in the capital city, low levels of revenues, and the country’s large size and sparse population density undermine government effectiveness in service delivery.
Approximately 55 per cent of civil servants are stationed in N’Djamena, with nearly all financial resources managed at the central ministry level. Although decentralisation efforts began in 2012, they remain mostly in the planning phase. The transfer of resources and responsibilities has been minimal, and the expansion of these transfers is hindered by inadequate local capacity and poor central resource management institutions. These institutions struggle with formulating, planning, and executing public policies, as well as managing crises. As a result, there is a significant disconnect between policy planning, implementation, and the service delivery needs of citizens.[7The World Bank, the Republic of Chad: systematic country diagnostic, March, 2022]
With a score of 0.9 out of a maximum of 5 in 2023, Chad ranked 47 of 54 countries in Africa in terms of government effectiveness as measured by the World Bank. On the Current Path, the governance effectiveness score will slightly increase to 1.03 (out of 5) by 2043, below the projected average score of 1.75 for low-income African countries (Chart 27).
The Governance scenario assumes better governance: stability, capacity, and inclusion. It measures a state's progress using the average of these three indices. To this end, it includes an index (0 to 1) for each dimension, with higher scores indicating improved outcomes.
Visit the theme on Governance for a full conceptualisation and details on the scenario structure and interventions.
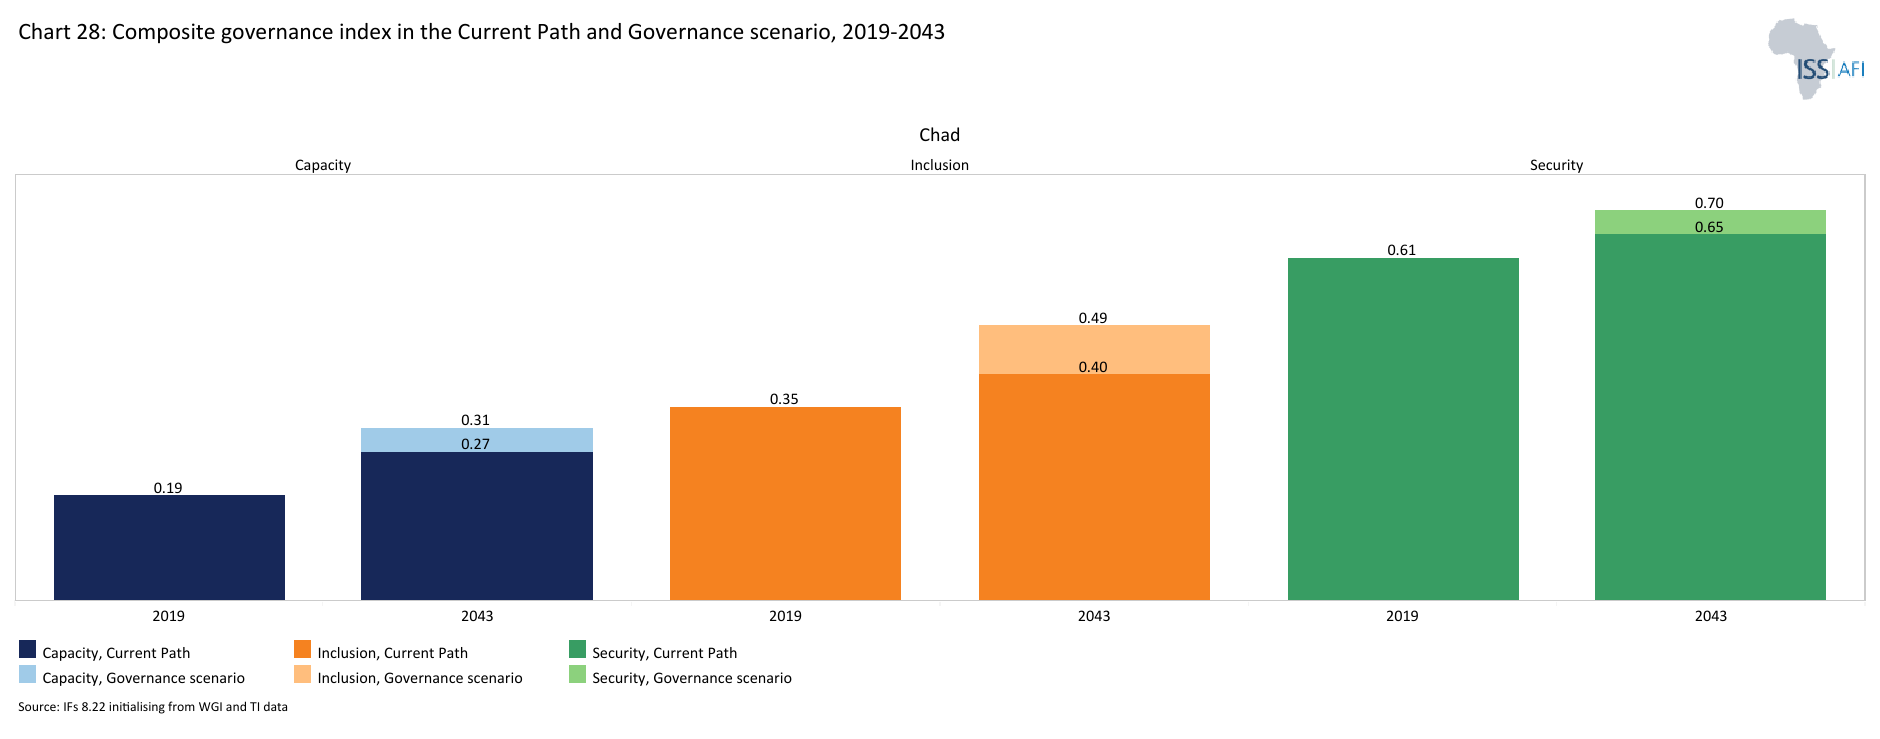
Chart 28 presents security, capacity and inclusion index for the Current Path versus the Governance scenario, for 2023 and 2043.
In our modelling, governance is conceptualised along three dimensions – security, capacity and inclusion – reflecting the traditional sequencing of the state formation process. The score for each dimension of governance ranges from zero (bad) to one (good). The security dimension measures the probability of intra-state conflict and the general level of risk. The second dimension, capacity, is related to government revenue, corruption, regulatory quality, economic freedom, and government effectiveness. The third dimension, inclusiveness, measures the level of democracy and gender empowerment.[8For the purposes of modelling and measuring governance in IFs, Hughes et al use modernisation theory and the notion that governance historically develops through three sequential transitions: a security transition, followed by a capacity transition, and finally a transition towards greater inclusion. Although Africa did not follow this pattern of state formation, the three transitions provide a useful analytical lens through which to view governance. To this end, IFs includes an index (0 to 1) for each dimension, with higher scores indicating improved outcomes. A composite governance index is a simple average of the three. BB Hughes, DK Joshi, JD Moyer, TD Sisk and JR Solórzano, Patterns of Potential Human Progress: Strengthening Governance Globally, Boulder: Oxford University Press, 2014, 6]
Chad performs poorly in terms of capacity compared to other dimensions of governance with a score of 0.19 out of 1. This reflects the low level of government revenue, endemic corruption, poor regulatory quality, and weak government effectiveness. For instance, Chad's tax-to-GDP ratio in 2021 (10%) was lower than the average for sub-Saharan Africa (15.6%) by 5.6 percentage points. The worsening security situation in Chad and the Sahel has also resulted in a higher portion of government spending being directed towards national defence. Chad is a key player in the regional fight against extremist groups. However, this shift has diminished the limited public resources available for other sectors, including critical pro-poor social sectors like education and health. Additionally, the influx of refugees from neighbouring countries has further strained the already overburdened public service providers [9The World Bank, the Republic of Chad: systematic country diagnostic, March, 2022].
Chad performs better in terms of security (0.6 out of 1) compared to other dimensions of governance. However, it remains vulnerable to
localised conflicts and violence. Since 2016, violent conflicts in neighbouring countries—including Libya to the north, the Central African Republic to the south, and Nigeria to the southwest—have posed a significant security threat to Chad. This threat became a reality in April 2021 when a rebellion originating at the Libyan border resulted in the death of President Idriss Déby, who had been reelected for a sixth term.
On the Current Path, Chad will make progress in all three dimensions of governance. As a result, the country’s score on the composite governance index, which is a simple average of the three dimensions of governance mentioned above, will be about 17% higher in 2043 than its level in 2023 (Chart 28). In the Governance scenario, the overall governance performance of Chad is nearly 11.2% higher than on the Current Path for the same year.
Chart 29 presents GDP per capita in purchasing power parity (PPP) in the Current Path and each of the eight sectoral scenarios, plus the synergistic effect and the Combined scenario. The data is from 2019 with a forecast to 2043.
This section compares the impacts of each sectoral scenario on GDP per capita.
The agriculture development scenario has the most significant positive impact on GDP per capita with an increase of US$201 above the Current Path in 2043. The second, third and fourth most significant impact on GDP per capita is achieved in the AfCFTA scenario, US$170 , above the Current Path, the Large Infrastructure and Leapfrogging scenario (US$89 ), and the Governance scenario (US$84) above the Current Path. The Demographics and Health and Education scenarios are the least impactful in terms of GDP per capita, with an increase of US$36 and US$34 (respectively) compared with the Current Path in 2043.
These sectors are, however, not isolated; they are strongly interlinked. For instance, infrastructure and human capital development are crucial for industrialisation and economic diversification. Similarly, the provision of rural roads is vital for agriculture commercialisation and food self-sufficiency. Agriculture can also pave the way to manufacturing through agro-processing while improving governance and security cuts across all sectors. Thus, a holistic approach or a coordinated policy push across industries is the best option to achieve inclusive, sustained growth in Chad. Therefore, the Combined scenario combines all the sectoral scenarios; it represents an integrated development push to remove the binding constraints on sustained, inclusive growth and development in Chad.
The Combined scenario has a much greater impact on GDP per capita compared to the individual sectoral scenarios. By 2043, the GDP per capita of Chad (PPP) is US$2 511, US$810 larger than in the Current Path, indicating that an integrated push across all the development sectors could significantly improve the living standard of Chadians.
Chart 30 presents poverty in the Current Path and for each scenario, from 2019 to 2043. The user can select the number of extremely poor people or the percentage of the population.
All the scenario interventions contribute to poverty reduction in Chad (Chart 30); however, the Agriculture scenario contributes most significantly to reducing the extreme poverty rate by 2043. In the Agriculture scenario, the poverty rate will decline to 20.8% by 2043, compared to the Current Path of 24.7%. This is equivalent to 1.3 million fewer poor people than the Current Path in 2043. Agriculture employs 80 per cent of the workforce in Chad. Enhancing productivity in the sector could increase incomes for millions of people and reduce poverty in Chad.
The Agriculture scenario is followed by the Manufacturing and the Governance scenarios in terms of poverty reduction. The extreme poverty rate in Chad by 2043 will be 22.5% in the Manufacturing scenario and 23.3% in the Governance scenario compared with the Current Path of 24.7% in the same year.
Like in other African countries, many impoverished individuals in Chad find themselves entrenched in low-productivity sectors and informal service-based activities. Boosting the manufacturing sector will generate inclusive growth by facilitating the transition of low-income individuals from these sectors to higher productivity areas. This structural shift not only boosts incomes but fosters a positive cycle wherein the growth of productive employment, capacities and earnings mutually reinforce one another, propelling economic expansion and poverty reduction.
Also, good governance as embodied, for example, in the control of corruption and the design and implementation of effective regulatory policies, significantly improves the ability of the poor to participate in and benefit from economic growth. Corruption, for instance, affects poor people by reducing the government’s ability to allocate public services in an efficient and equitable manner.
In the AfCFTA scenario, the poverty rate remains slightly below the Current Path. By 2043, the poverty rate in the AfCFTA scenario is 24.3% compared with 24.7% on the Current Path in the same year. This implies that the economic growth that the full implementation of the AfCFTA is expected to generate in Chad will likely not be inclusive. Many studies conclude that the benefits of trade liberalisation in terms of poverty reduction are not automatic, but rather depend on good domestic policies. This implies that trade liberalisation could have a marginal impact on poverty reduction or increase poverty in the absence of the right complementary policies. Policies could include carefully designed trade adjustment assistance programmes and training in new skills that would be valuable in the growing sectors of the economy. Chad authorities could also target the most critical sectors for the poor through policies to increase their productivity and efficiency of trade.
In the Combined scenario, by 2033, 19% of Chadians will be living in extreme poverty compared to 28.4% in the Current Path. This represents about 2.4 million fewer people living in extreme poverty compared to 7.3 million people in the Current Path. By 2043, the extreme poverty rate at the US$2.15 poverty threshold will decline to roughly 12% (4 million people) compared to 24.7% (8.6 million people) in the Current Path. Even though the Combined scenario does not completely eliminate extreme poverty in Chad, its materialisation could have a significant impact on poverty reduction in the country.
Chart 31 presents GDP in the Current Path and in the Combined scenario, from 2019 to 2043. The data is in US$ 2017 and at market exchange rates (MER).
The Combined scenario incorporates all eight sectoral scenarios: Governance, Demographics and Health, Education, Large Infrastructure and Leapfrogging, Agriculture, Manufacturing, AfCFTA and Financial Flows.
Assuming that the Combined scenario is implemented, Chad could expect a significant improvement in its growth prospects. In this scenario, the average growth rate between 2025 and 2043 is 6.5% compared with 3.7% on the Current Path over the same period. The size of the Chadian economy measured in GDP at the market exchange rate (MER) is US$15.5 billion larger than the Current Path in 2043. On the Current Path, Chad will have the 37th-largest economy in Africa by 2043. If the Combined scenario is implemented, the country will have the 29th-largest economy in Africa in 2043 with a GDP of about US$38 billion, assuming a business-as-usual scenario (Current Path assumptions) for other countries.
Chart 32 compares the value added by sector in the Current Path and Combined scenario, from 2019 to 2043. The data is in US$ 2017 and as a percentage of GDP.
Implementing the Combined scenario will increase the value-add of all the sectors above the Current Path across the forecast horizon to 2043 (Chart 32).
In 2043, the agriculture value-add in the Combined scenario is about US$3.8 billion, larger than the Current Path in the same year. The manufacturing and services value-add are US$5.4 and US$5.1 billion, respectively, higher than the Current Path in 2043.
Implementing the Combined scenario could accelerate the structural transformation of the Chadian economy, with the share of the manufacturing sector in GDP increasing from 4.8% in 2023 to 18% in 2043, 12.5 percentage points of GDP above the Current Path in 2043. The share of the agriculture sector in GDP declines from 28.6% in 2023 to 21.2% in 2043 as a result of the structural transformation of the economy. The services sector remains the dominant sector in the economy, although its contribution to GDP in the Combined scenario (46.2% in 2043) is lower than the Current Path of 55% in the same year.
Chart 33 presents the size of the informal sector as percentage of the total economy in the Current Path and in the Combined scenario, from 2019 to 2043.
With limited formal sector opportunities, most of the workforce in Chad is employed in the low-value-added informal sector. The size of Chad's informal economy was estimated at 34.6% of GDP in 2023, above the average of 29.3% for low-income Africa. On the Current Path, the level of informality will likely decline to 31.5% of GDP by 2043, still above the average of 27% for low-income Africa in the year. Assuming that all policies and reforms in the Combined scenario are implemented, the size of the informal sector could significantly decline to 23% of GDP in 2043, below the average of 26.8% for low-income Africa. As a result, informal labour as a percentage of total labour in Chad could decline to 41.3 compared with 61.5 in the Current Path in 2043.
Chart 34 shows the trends in life expectancy in the Current Path and the Combined scenario from 2019 to 2043.
In Chad, life expectancy at birth (years) has improved by 8.5 years from 52.6 years in 2000 to 61.1 years in 2023. Life expectancy for women stood at about 63 years in 2023 compared with 59.5 years for men. On the Current Path, life expectancy at birth will improve to 67 years by 2043. In the Combined scenario, the average Chadian could expect to live four years longer at 71 years, one year below the average for low-income Africa in the same year.
Chart 35 compares the Gini coefficient in the Current Path with the Combined scenario in 2023 and 2043.
The Gini coefficient is a standard measure of the level of inequality. In Chad, oil has constituted the main natural resource since 2003. Before this date, agriculture and livestock were the two main economic activities in the country. However, income from oil exploitation has not been equally distributed. The intensity of income inequality captured by the Gini index increased by 8.8%, from 0.398 to 0.433, over the period 2003-2011 before declining to 0.375 in 2018 and 0.373 in 2023. On the Current Path, income inequality in Chad will slightly increase with a Gini coefficient of 0.383 by 2043. The implementation of the Combined scenario could however generate inclusive growth and improve income distribution in the country. In the Combined scenario, the Gini index will decline to 0.33 by 2043, 12% lower than the Current Path in the same year.
Chart 36 compares carbon emissions in the Current Path with the Combined scenario from 2019 to 2043. Note that the data is in million tons of carbon, not CO2 equivalent.
In 2023, Chad released about 1 million tons of carbon, and in the Current Path, it will release 5 million tons by 2043. Although carbon emissions are set to increase with increased economic activity, Chad's carbon emissions come from a very low base. Like many developing countries, Chad will disproportionately suffer the impact of climate change which it has contributed very little to. Nonetheless, the country must reduce its carbon emissions and move towards renewable energy for sustainable growth and mitigate climate change.
The materialisation of the Combined scenario and the associated rapid economic growth in Chad will increase carbon emission to 7 million tons by 2043, two million tons above the Current Path.
Chart 37 compares energy demand and production in the Current Path with the Combined scenario from 2019 to 2043. Production is done in six types, namely oil, gas, coal, hydro, nuclear and other renewables. The data is converted into billion barrels of oil equivalent (BOE) to allow for comparisons. Note that energy production could be for domestic use or for export.
The total energy produced in Chad in 2023 stood at 61 million BOE compared with a total energy demand of 16 million BOE leading to an excess production of 45 million BOE. On the Current Path, total energy production will continue to outgrow demand so that by 2043, excess energy production will be equivalent to 92 million BOE compared to an excess of 81 million BOE in the Combined scenario, reflecting an increase in energy demand in the Combined scenario.
However, the aggregate energy production and demand in Chad can be misleading as total energy demand outweighs production in all types of energy except oil. Since 2003, oil has been the main source of energy produced in Chad. Energy production from other sources is negligible. In 2023, the total amount of oil produced in Chad amounted to 58 million BOE, constituting about 95% of total energy production.
On the Current Path, this trend is likely to persist with oil production projected to represent 94.8% of total energy production in 2043. The composition of energy production in the Combined scenario will not significantly differ from the Current Path. Oil production will still constitute about 94% of total energy production followed by gas (4.9%).
Chart 38 depicts the summary of the policy recommendations.
This report outlines Chad's current development challenges and the strategic opportunities to put the country on a path of inclusive and sustainable growth and development.
The analysis revealed that Chad grapples with complex, interlinked challenges that have contributed to its economic fragility, impeding inclusive growth and development. The country's main growth constraints include insecurity, overreliance on oil exports (limited economic diversification), climate change and variability, low agricultural productivity, weak governance and poor business environment, infrastructure shortage and limited human capital.
Tackling these issues is crucial to set the country on a path of sustained growth and shared prosperity. The government must take decisive, targeted actions on the priority policies outlined below:
- Promoting good and inclusive governance for a more inclusive development and sustainable peace
The government of Chad must prioritise the creation of institutions that are inclusive, transparent, and accountable. The current over-centralised governance, combined with poor government effectiveness and a lack of accountability leads to social exclusion, inequality, and conflict. Therefore, the government should prioritise the fight against corruption and impunity, improve public sector administration, enhance the transparency in the oil sector and advance the decentralisation process to strengthen local governance and public service delivery.
- Enhancing non-oil revenue mobilisation to mitigate the impact of the falling oil revenue and ensure macroeconomic stability
This can be done by implementing several key strategies such as digitised tax collecting system to facilitate efficient tax processing and minimise corruption, streamlining business registration processes to make them more user-friendly and simplifying tax laws to make them easier to understand and comply with. By focusing on these areas, tax administration can enhance its efficiency, reduce the informal sector, and build trust between tax authorities and taxpayers.
- Increasing agricultural productivity
This can be achieved by investing in productivity-enhancing technologies and facilitating access to high-yield, disease- and drought-resistant seedlings, fertiliser and credit guarantees for farmers and supporting R&D activities in building resilience and agricultural productivity. With access to land, water and other natural resources being central to rising inter-communal conflicts in the country, Chad authorities should develop a national land policy to ensure the effective, sustainable, and equitable use of land.
- Improving the quality and supply of infrastructure to reduce production and transaction costs, to improve connectivity and productivity, and boost regional integration and better public service delivery
Given the high cost of infrastructure, the government may explore public-private partnerships. Access to electricity in remote areas can be provided through mini-grid and off-grid solutions using renewable energy.
- Strengthening human capital
This can be achieved by improving access to and quality of education and Vocational Training, as well as access to quality healthcare, with a focus on closing the gender gap.
- Accelerating demographic transition
Efforts to reduce the high fertility rate and accelerate the demographic transition would contribute to poverty reduction. Chadian authorities should continue the roll-out of modern contraceptives by focusing on the underserved, younger, more rural population groups where contraceptive awareness-raising campaigns and uptake remain low; implement programs and policies to end child marriage, and prevent early childbearing.
- Enhancing climate risk management
Chad is prone to extreme weather events, including floods and droughts, which affect agriculture productivity. Chadian authorities should invest in the prevention of natural hazards and improve early warning systems and reinforce adaptation measures in agriculture.
- Diversifying the economy away from oil and boost formal job creation
This can be achieved by improving the business environment to boost private sector development and attract manufacturing FDI, supporting light manufacturing such as light agro-processing, and services, specifically the digital economy.
By implementing these strategies, Chad can achieve socio-political stability, inclusive growth and development.
Endnotes
L Ploch, Instability in Chad, CRS Report for Congress, June 2009
The World Bank, the Republic of Chad: systematic country diagnostic, March, 2022
The World Bank, the Republic of Chad: systematic country diagnostic, March, 2022
The World Bank, the Republic of Chad: systematic country diagnostic, March, 2022
J Azétsop and M Ochieng,the right to health, health systems development and public health policy challenges in Chad, Philos Ethics Humanit Med. Feb. 2015
J Azétsop and M Ochieng,the right to health, health systems development and public health policy challenges in Chad, Philos Ethics Humanit Med. Feb. 2015
The World Bank, the Republic of Chad: systematic country diagnostic, March, 2022
For the purposes of modelling and measuring governance in IFs, Hughes et al use modernisation theory and the notion that governance historically develops through three sequential transitions: a security transition, followed by a capacity transition, and finally a transition towards greater inclusion. Although Africa did not follow this pattern of state formation, the three transitions provide a useful analytical lens through which to view governance. To this end, IFs includes an index (0 to 1) for each dimension, with higher scores indicating improved outcomes. A composite governance index is a simple average of the three. BB Hughes, DK Joshi, JD Moyer, TD Sisk and JR Solórzano, Patterns of Potential Human Progress: Strengthening Governance Globally, Boulder: Oxford University Press, 2014, 6
The World Bank, the Republic of Chad: systematic country diagnostic, March, 2022
Page information
Contact at AFI team is Kouassi Yeboua and Blessing Chipanda
This entry was last updated on 28 June 2025 using IFs v8.22.
Reuse our work
- All visualizations, data, and text produced by African Futures are completely open access under the Creative Commons BY license. You have the permission to use, distribute, and reproduce these in any medium, provided the source and authors are credited.
- The data produced by third parties and made available by African Futures is subject to the license terms from the original third-party authors. We will always indicate the original source of the data in our documentation, so you should always check the license of any such third-party data before use and redistribution.
- All of our charts can be embedded in any site.
Cite this research
Kouassi Yeboua and Blessing Chipanda (2025) Chad. Published online at futures.issafrica.org. Retrieved from https://futures.issafrica.org/geographic/countries/chad/ [Online Resource] Updated 28 June 2025.
