 Senegal
Feedback welcome
Our aim is to use the best data to inform our analysis. See our Technical page for information on the IFs forecasting platform. We appreciate your help and references for improvements via our feedback form.
Ce rapport est disponible en français.
The page provides an in-depth analysis of Senegal's current and projected future development, examining various sectoral scenarios and their potential impacts on the country's growth. It explores eight sectors including demographic, economic, and infrastructure-related outcomes for Senegal up to 2043. The analysis also considers the implications of the Agenda 2063 goals, aiming to offer insights into policy actions that could enhance Senegal's developmental trajectory.
For more information about the International Futures modelling platform that we use for the development of the various scenarios, please see About this Site.
Executive Summary
We begin this page with an introductory assessment of the country’s context by looking at current population distribution, social structure, climate and topography. Senegal is classified as a lower-middle-income country. It is located in West Africa and bordered to the west by the Atlantic Ocean, to the north by Mauritania, to the east by Mali and to the south by Guinea and Guinea-Bissau. Senegal is a member of the Economic Community of West African States (ECOWAS) and the West African Economic and Monetary Union (WAEMU, or UEMOA in French).
We also provide an overview of the country’s long-term development vision called Plan Senegal Emergent (PSE) which spans from 2014 to 2035.
The next section consists of an analysis of the Current Path forecast for Senegal which informs the country’s likely current development trajectory to 2043. It is based on current development trends and assumes that no major shocks would occur in a ‘business as usual’ future.
- The population of Senegal more than doubled between 1990 and 2019, increasing from 7.5 million people to 16.3 million. By 2043, the total population is projected to double again to 28.2 million on the Current Path.
- As the fourth largest economy in West Africa, Senegal’s GDP measured in market exchange rates (MER) almost tripled from US$9.2 billion in 1990 to US$29.4 billion in 2019. On the Current Path, the country’s GDP is estimated to more than quadruple to US$132 billion by 2043.
- The country’s GDP per capita of US$3 546 in 2019 was 89% lower than the average of lower-middle-income countries in Africa. On the Current Path, its GDP per capita is projected to reach US$7 239 by 2043, which will be 23% lower than the average of US$8 902 for its income-group peers in Africa.
- In 2019, 57.3% of Senegal’s population still lived below the extreme poverty line of US$3.20 per day. This was below the average of lower-middle-income countries in Africa. However, by 2043, the poverty rate of 23.4% will be about 15 percentage points higher than the average of lower-middle-income countries in Africa.
The analysis then proceeds to compare progress on the Current Path with eight sectoral scenarios. These are Demographics and Health; Agriculture; Education; Manufacturing; the African Continental Free Trade Area (AfCFTA); Large Infrastructure and Leapfrogging; Financial Flows; and Governance. Each scenario is benchmarked to present an ambitious but reasonable aspiration in that sector.
- The Demographics and Health scenario will reduce Senegal’s infant mortality rate from 31.5 deaths per 1 000 births in 2019 to 7.8 deaths by 2043 — almost 3.2 deaths fewer than in the Current Path forecast. In addition, the scenario pushes the ratio of the working-age population to dependants to 1.9-to-1. This is above the Current Path average of 1.67-to-1 and the average of 1.7-to-1 for its income-group peers.
- Annual crop production in Senegal will rise by 19% over the Current Path to 17 million tons in the Agriculture scenario by 2043. As a result, net import of crops is projected to reach 34% in the scenario, which is 10 percentage points lower than the projected Current Path average of 44%.
- In 2019, the mean years of education attained by adults between 15 and 24 years of age in Senegal stood at 5.5 years. This was far below the average of 8.8 years for lower-middle-income countries on the continent. In the Education scenario, the mean years of adult education in Senegal will rise by 0.7 years more than the Current Path forecast to 7.7 years by 2043. The scenario further increases average test scores for primary and secondary school students.
- Senegal makes substantial progress in industrialisation in the Manufacturing scenario, such that by 2043, the share of the manufacturing sector in GDP is about 27.2% (US$41.1 billion), which is about 3.4 percentage points of GDP above the Current Path forecast.
- In the African Continental Free Trade Area (AfCFTA) scenario, the sum of Senegal’s exports and imports as a percentage of GDP will be about 19 percentage points above the Current Path to reach 77.2% by 2043. By 2043, Senegal’s trade deficit in the Current Path will constitute about 10.2% of GDP, whereas, in the same year, the AfCFTA scenario will mitigate this situation leading to a slightly lower deficit of 9.2% of GDP.
- Based on the Large Infrastructure and Infrastructure scenario, it is projected that 96.7% of Senegalese will have access to electricity by 2043, compared to 89.4% in the Current Path forecast. As a result, 86% of households in Senegal are expected to use modern fuel for cooking in the scenario compared to the Current Path forecast by 2043.
- Government revenue is projected to rise to US$34.8 billion in 2043, representing 25.2% of GDP, in the Financial Flows scenario. Compared to the Current Path, this scenario can improve government revenue in Senegal by almost an extra US$1.9 billion by 2043.
- In the Governance scenario, Senegal’s score on the governance security index will be about 3.1% above the Current Path. Furthermore, the country’s capacity and inclusion scores will be a 10.6% and 12.8% improvement, respectively, above the Current Path forecast by 2043.
In the third section, we compare the impact of each of these eight sectoral scenarios with one another and subsequently with a Combined Agenda 2063 scenario (the integrated effect of all eight scenarios).
In our forecasts, we measure progress on various dimensions such as economic size (in market exchange rates), gross domestic product per capita (in purchasing power parity), extreme poverty, carbon emissions, the changes in the structure of the economy, and selected sectoral dimensions such as progress with mean years of education, life expectancy, the Gini coefficient or reductions in mortality rates.
- By 2043, Senegal’s GDP per capita will see significant improvements in various scenarios. The AfCFTA scenario will have the greatest impact on GDP per capita, showing the potential benefits of embracing intra-Africa trade. This is followed by the Manufacturing and Governance scenarios, respectively. The Manufacturing scenario has the greatest potential to reduce extreme poverty in Senegal, followed by the Governance and Demographics and Health scenarios.
- Senegal’s GDP is projected to rise to US$245.6 billion in the Combined Agenda 2063 scenario. This increase of 86% is equivalent an additional US$113.7 billion compared to the Current Path forecast. Similarly, in the Combined Agenda 2063 scenario, GDP per capita for Senegal is estimated to increase to US$12 502 by 2043, which will be 73% higher than the forecast on the Current Path.
- By 2043, the service sector will still be the largest contributor to GDP at 63.4%, followed by the manufacturing sector with a share of 23.5%. The share of the agricultural sector will decline to 3.5% in the Combined Agenda 2063 scenario.
- In the Combined Agenda 2063 scenario, both the number and proportion of poor people in Senegal will significantly decline. By 2043, about 863 000 people in the country, representing 3.2% of the population, will be living in extreme poverty, meaning 5.6 million more people could be lifted out of poverty by 2043 in this scenario.
- Inequality in Senegal will be slightly lower in the Combined Agenda 2063 scenario than in the Current Path forecast, with a Gini coefficient of 0.34 by 2043 instead of 0.38 in the Current Path.
- Senegal’s total carbon emissions will rise to 19 million tons in the Combined Agenda 2063 scenario. This is 46.2% higher than what is estimated in the Current Path forecast in the same year.
- The Combined Agenda 2063 scenario shows an increase in energy demand, creating a larger energy deficit, with renewable energy becoming the dominant energy source, surpassing oil and gas.
We end this page with a summarising conclusion offering key recommendations for decision-making. Senegal's development faces significant challenges like economic dependency on limited sectors, high poverty rates, and gaps in education, governance, and infrastructure, which slow down its growth and societal progress. Targeted interventions in manufacturing, education, and governance could substantially improve economic performance and reduce poverty. Opportunities for sustainable growth include harnessing the demographic dividend, regional integration, mineral deposits, oil, gas and renewable energy, technological advancements, and agricultural transformation, suggesting that a holistic development strategy could align with Agenda 2063 and drive significant national advancement.
All charts for Senegal Development Futures
- Chart 1: Political map of Senegal
- Chart 2: Population structure in Current Path, 2019–2043
- Chart 3: Population distribution map, 2022
- Chart 4: GDP in MER and growth in the Current Path forecast, 1990–2043
- Chart 5: Size of the informal economy as per cent of GDP and per cent of total labour (non-agriculture), 2019-2043
- Chart 6: GDP per capita in Current Path forecast, 1990–2043
- Chart 7: Extreme poverty in Current Path as per cent of population and numbers, 2019–2043
-
Chart 8: National Development Plan of Senegal
Chart 8: National Development Plan of Senegal
 Source: Presidency of Senegal website
 - Chart 9: Current Path and scenarios
- Chart 10: Demographics and Health scenario
- Chart 11: Urban and rural population in Current Path and Demographics and Health scenario, 1990–2043
- Chart 12: Infant mortality rate in Current Path and Demographics and Health scenario, 2019–2043
- Chart 13: Demographic dividend in the Current Path forecast and the Demographics and Health scenario, 2019–2043
-
Chart 14: Agriculture scenario
Chart 14: Agriculture scenario
- Chart 15: Import dependence in the Current Path forecast and Agriculture scenario, 2019–2043
- Chart 16: Education scenario
- Chart 17: Mean years of education in Current Path and Education scenario, 2019–2043
- Chart 18: Manufacturing scenario
- Chart 19: Value-add by the manufacturing sector in Current Path and Manufacturing scenario, 2019–2043
-
Chart 20: AfCFTA scenario
Chart 20: AfCFTA scenario
- Chart 21: Trade balance in CP and AfCFTA scenario, 2019–2043
- Chart 22: Infrastructure and Leapfrogging scenario
- Chart 23: Cookstove usage in Current Path and Infra/Leapfrogging scenario, 2019–2043
- Chart 24: Access to mobile and fixed broadband in Current Path and Infra/Leapfrogging scenario, 2019–2043
- Chart 25: Financial Flows scenario
- Chart 26: Government revenue in Current Path and Financial Flows scenario, 2019–2043
- Chart 27: Governance scenario
- Chart 28: Composite governance index in Current Path vs Governance scenario, 2019–2043
- Chart 29: GDP per capita in Current Path and scenarios, 2019–2043
- Chart 30: Poverty in Current Path and scenarios, 2019–2043
- Chart 31: GDP (MER) in Current Path and Combined Agenda 2063 scenario, 2019–2043
- Chart 32: Value added by sector in Current Path and Combined Agenda 2063 scenario, 2019–2043
- Chart 33: Informal sector as % of total economy in Current Path and Combined Agenda 2063, 2019–2043
- Chart 34: Life expectancy in Current Path and Combined Agenda 2063 scenario, 2019–2043
- Chart 35: Domestic Gini in Current Path and the Combined Agenda 2063 scenario, 2019–2043
- Chart 36: Carbon emissions in Current Path and in Combined Agenda 2063 scenario, 2019–2043
- Chart 37: Energy production by type in Current Path forecast and Combined Agenda 2063 scenario, 2019-2043
-
Chart 38: Recommendations
Chart 38: Recommendations
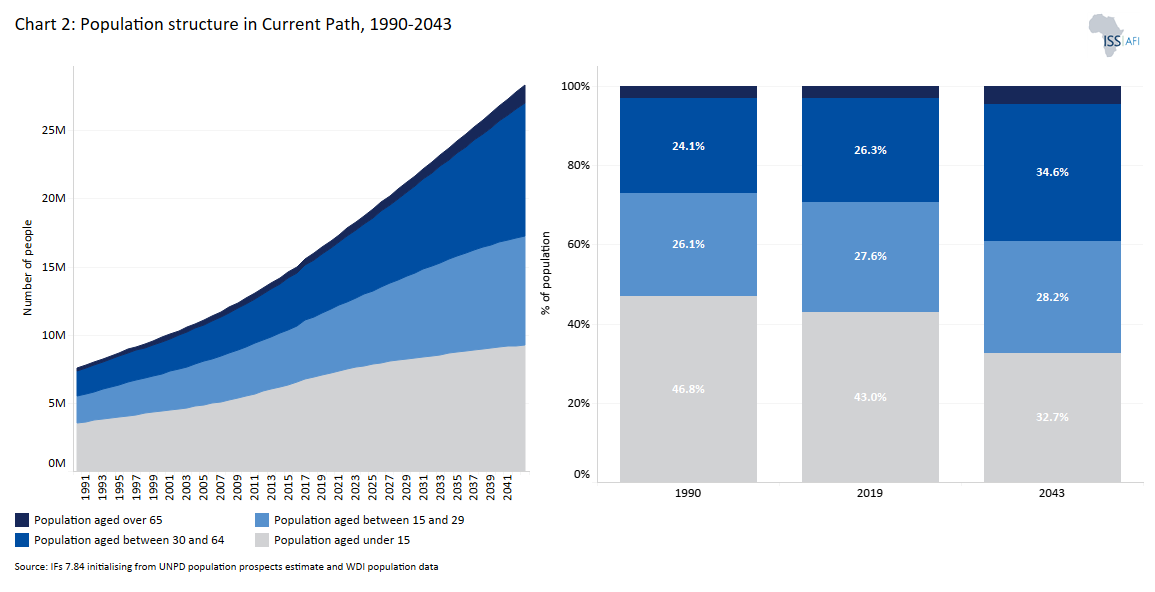
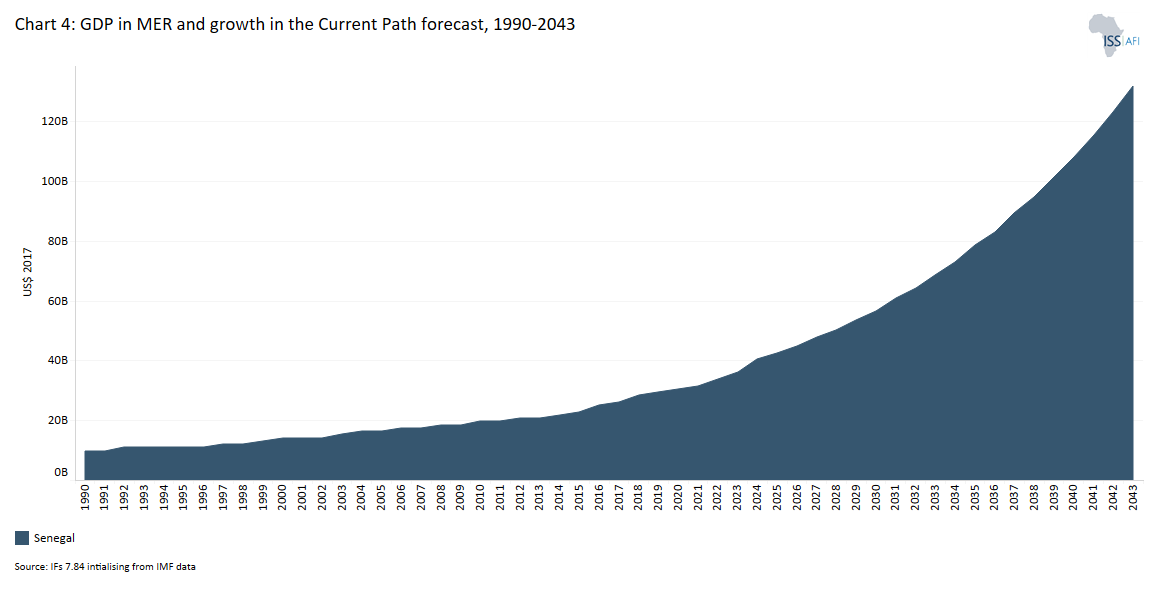
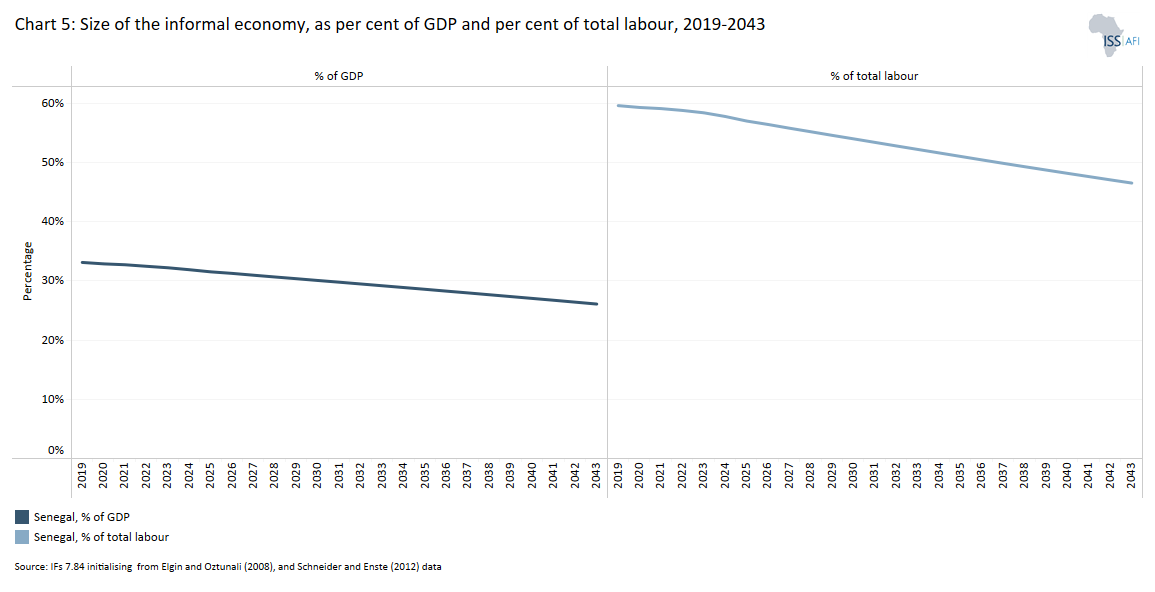
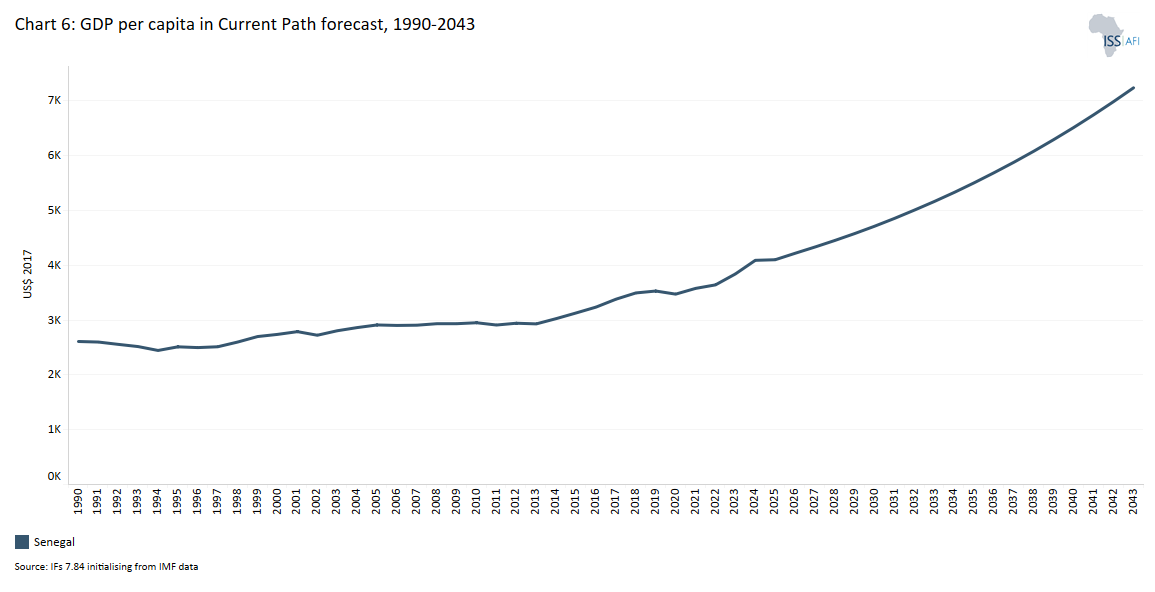
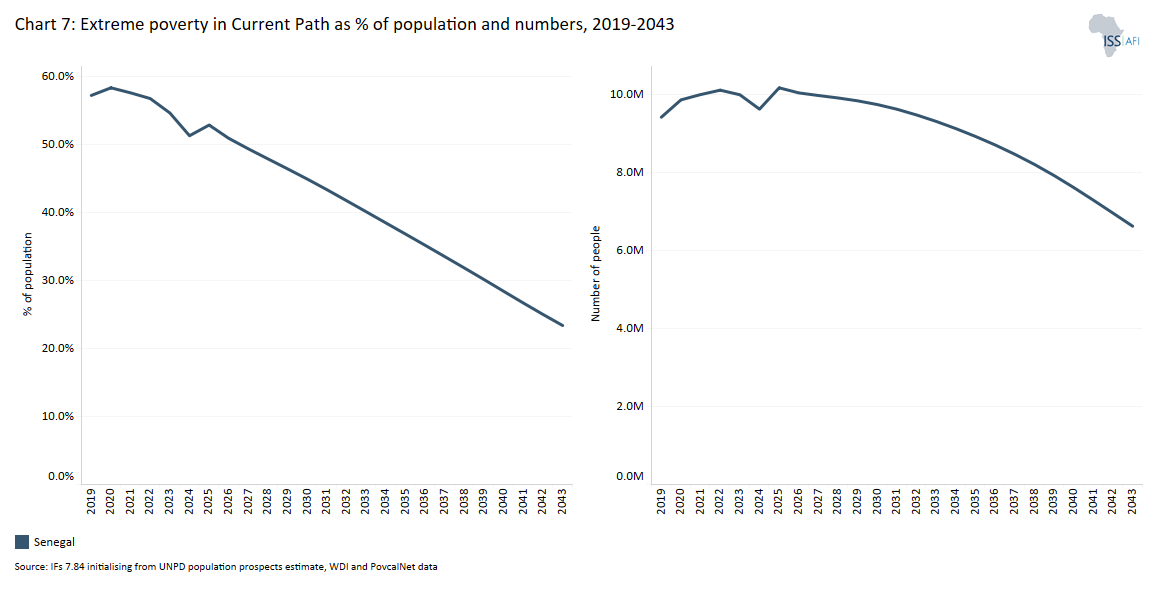
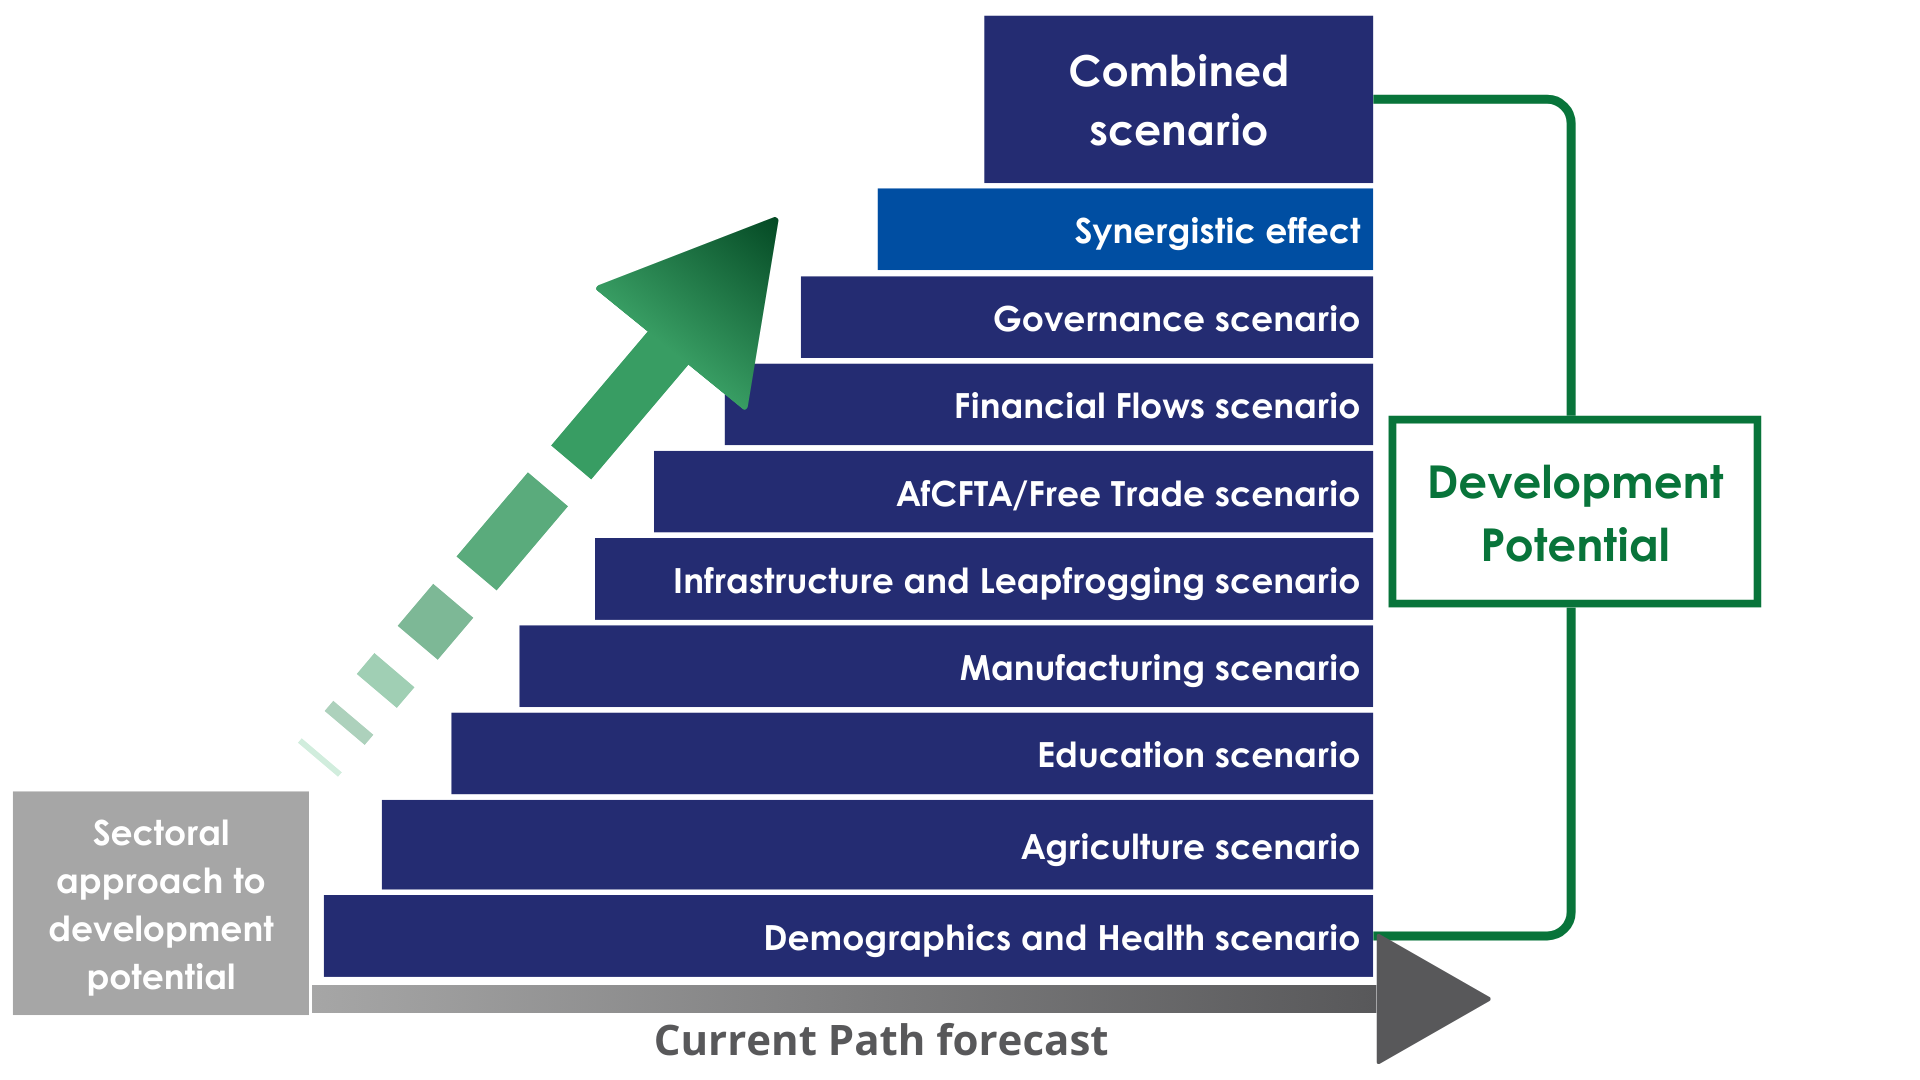
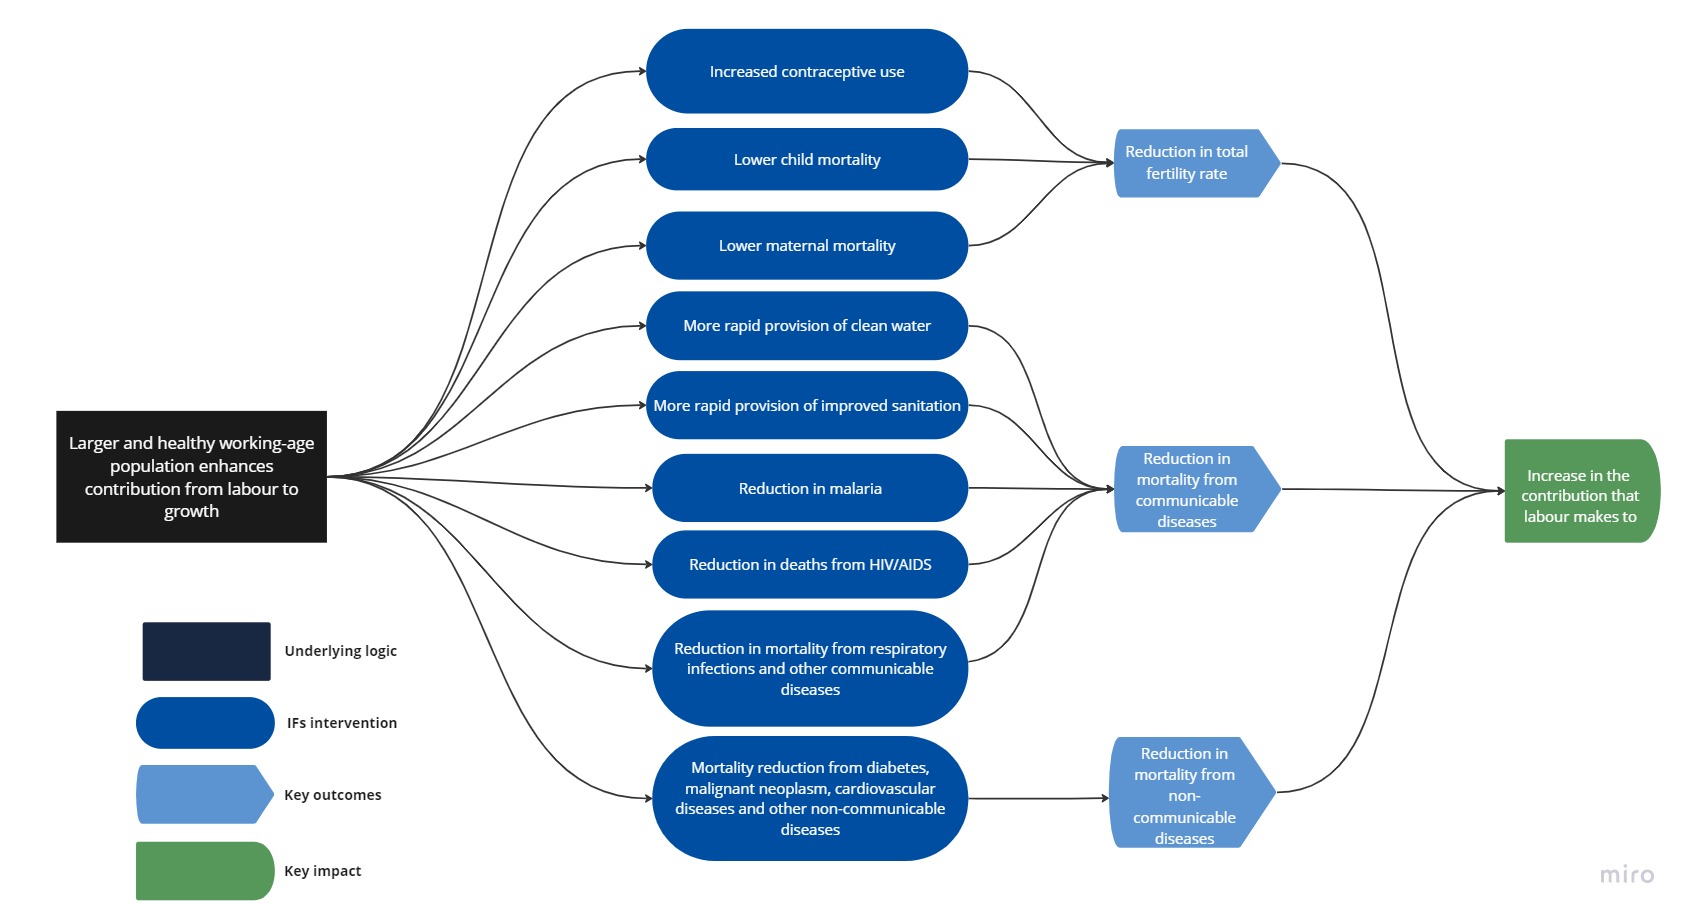
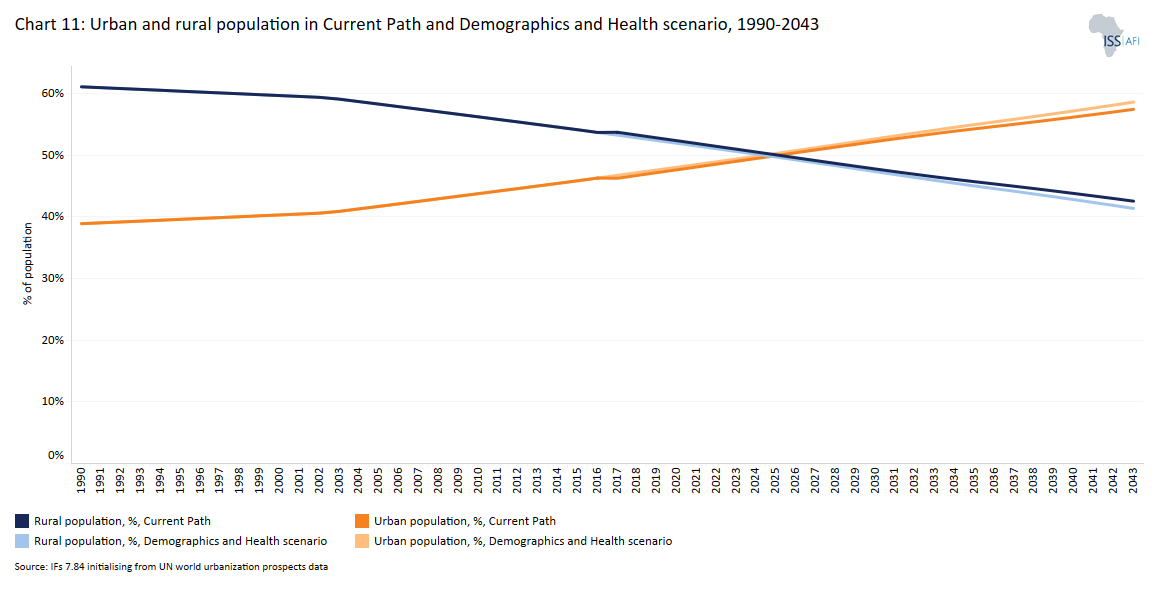
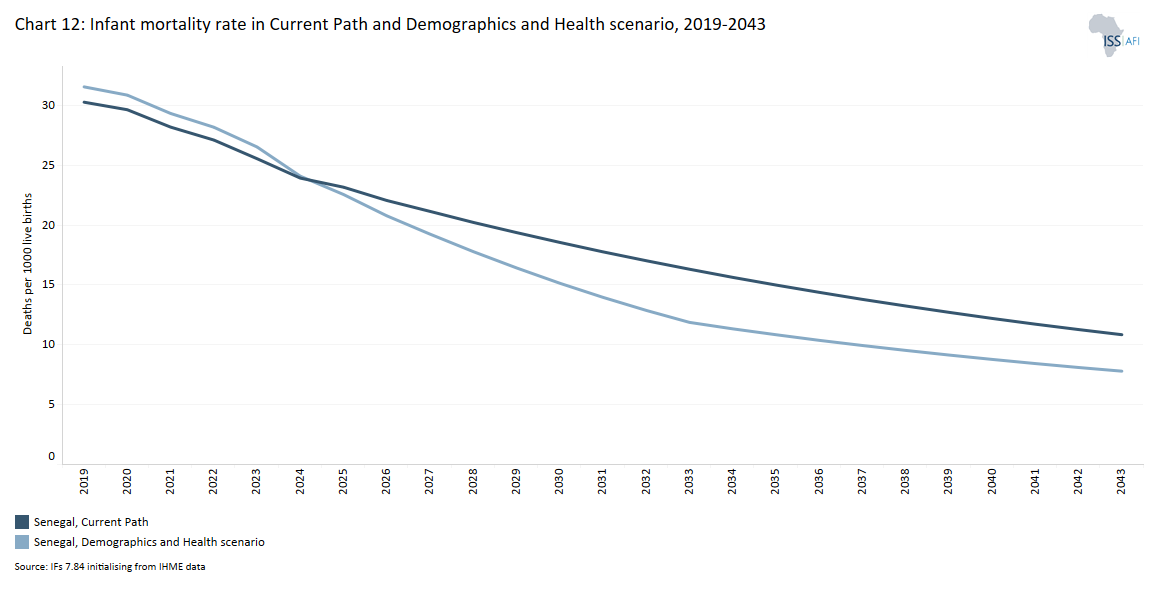
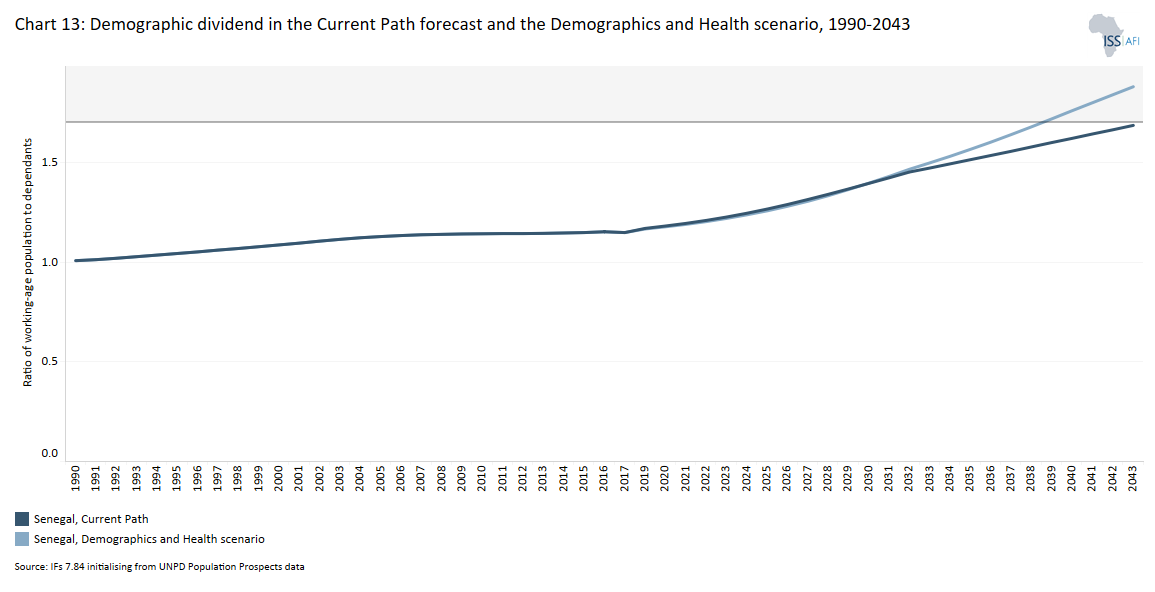
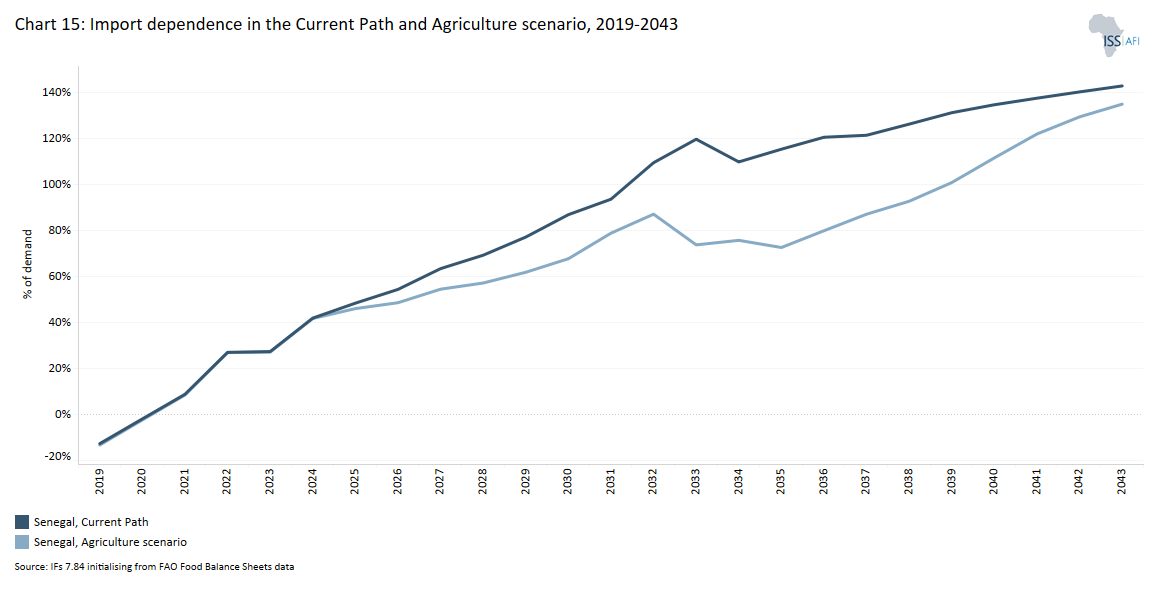
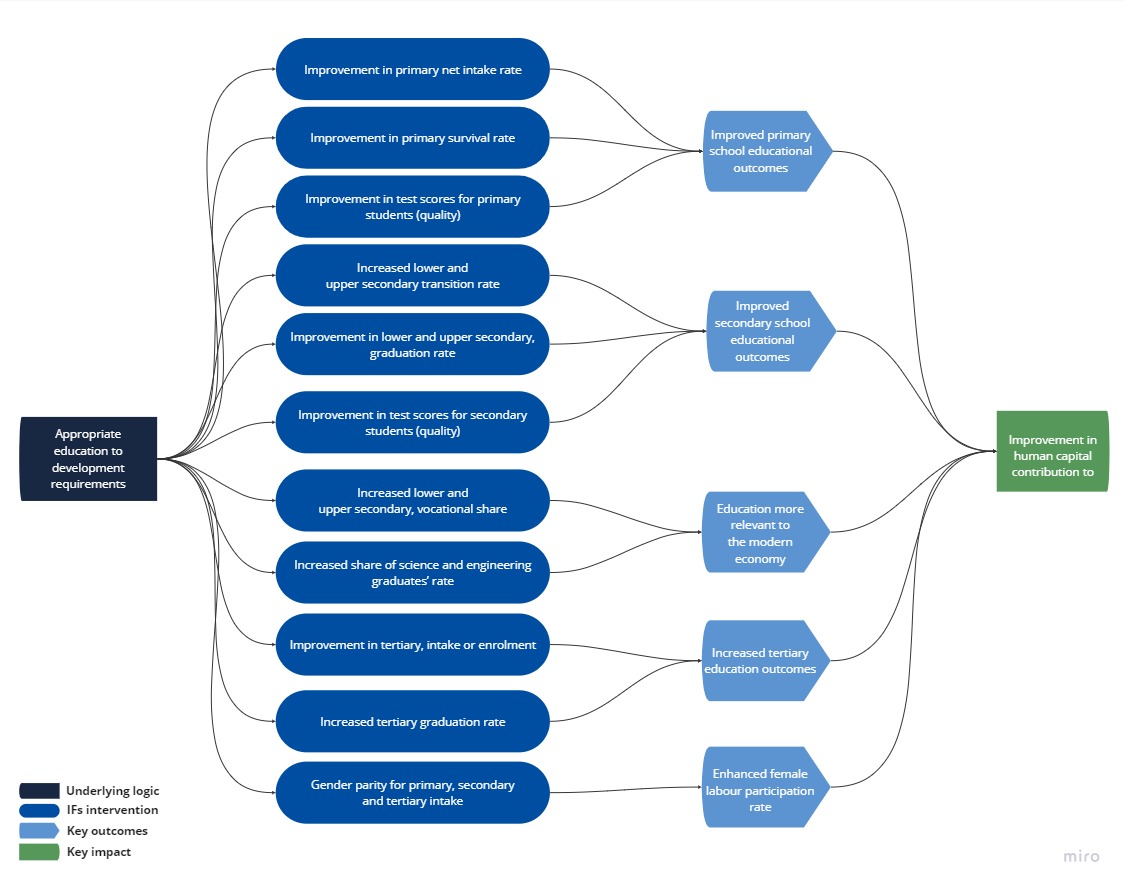
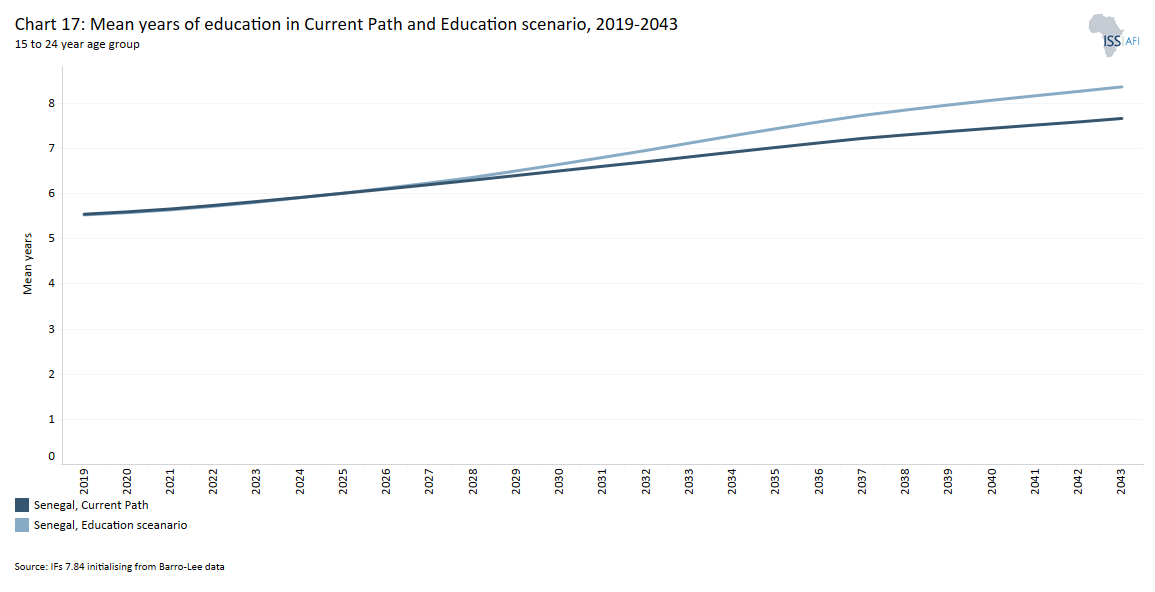
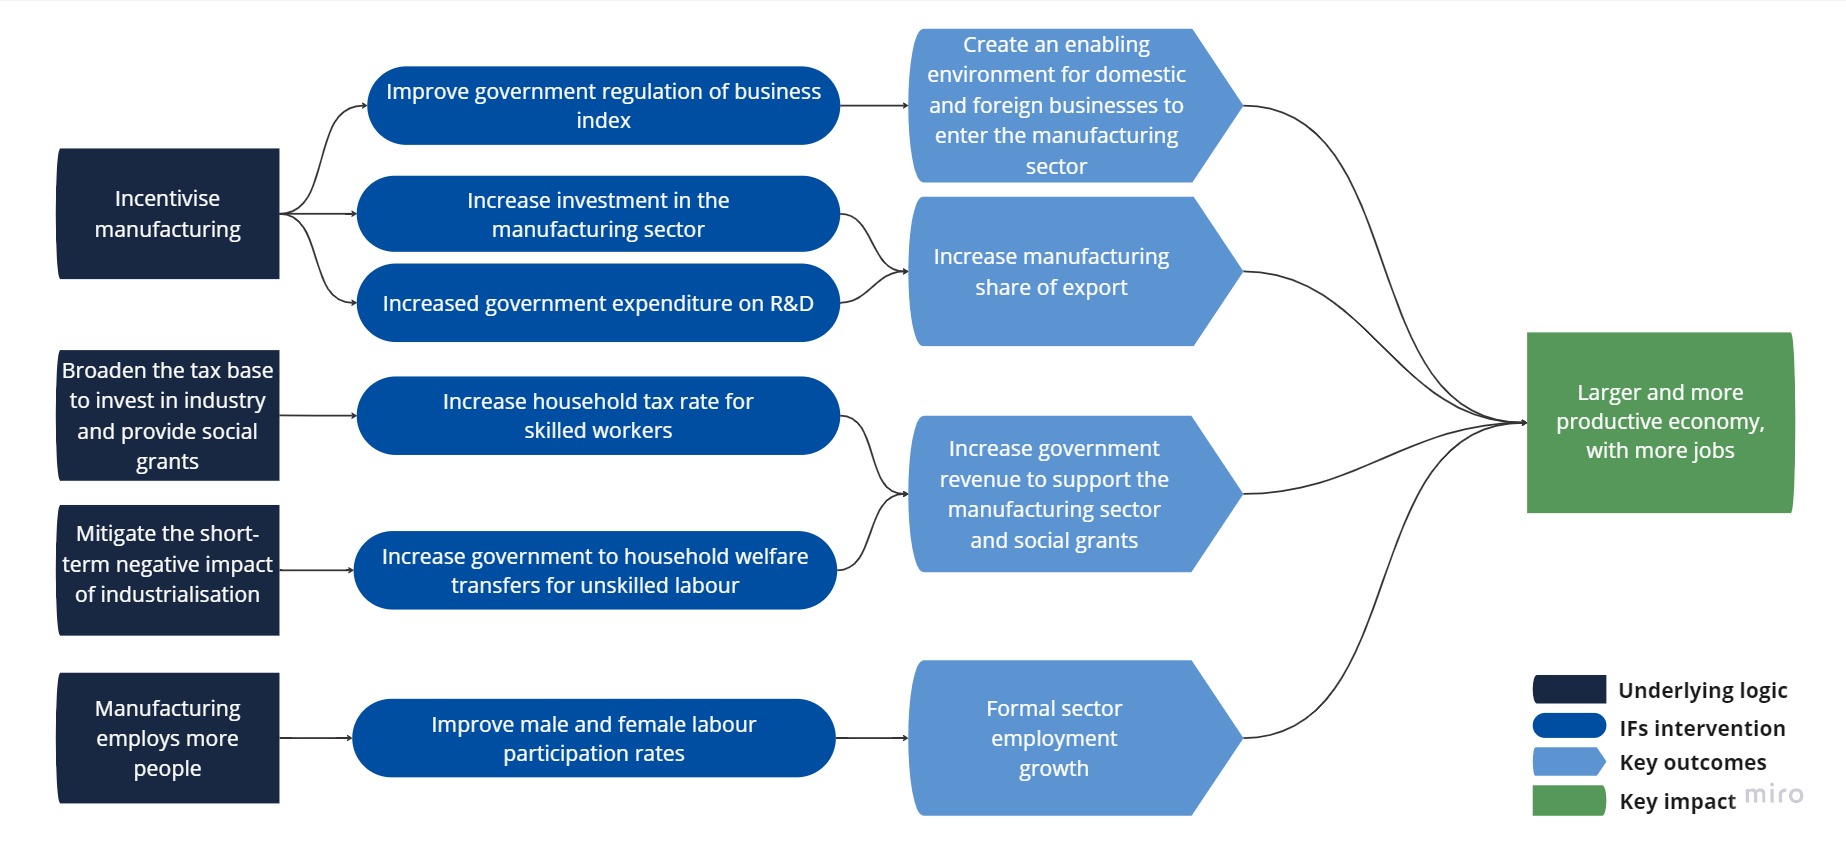
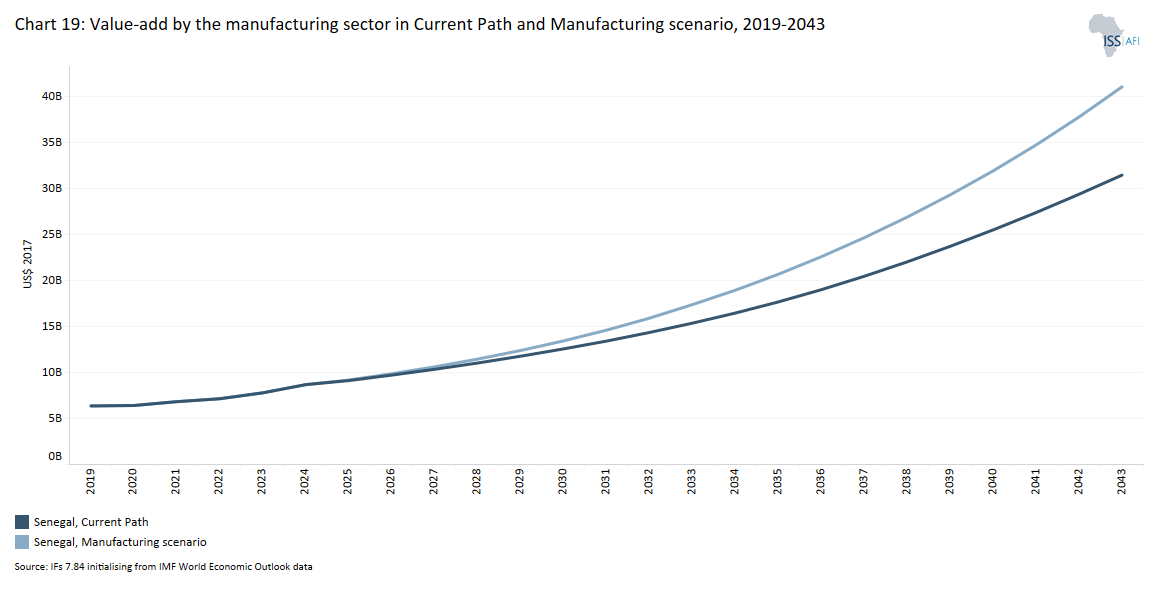
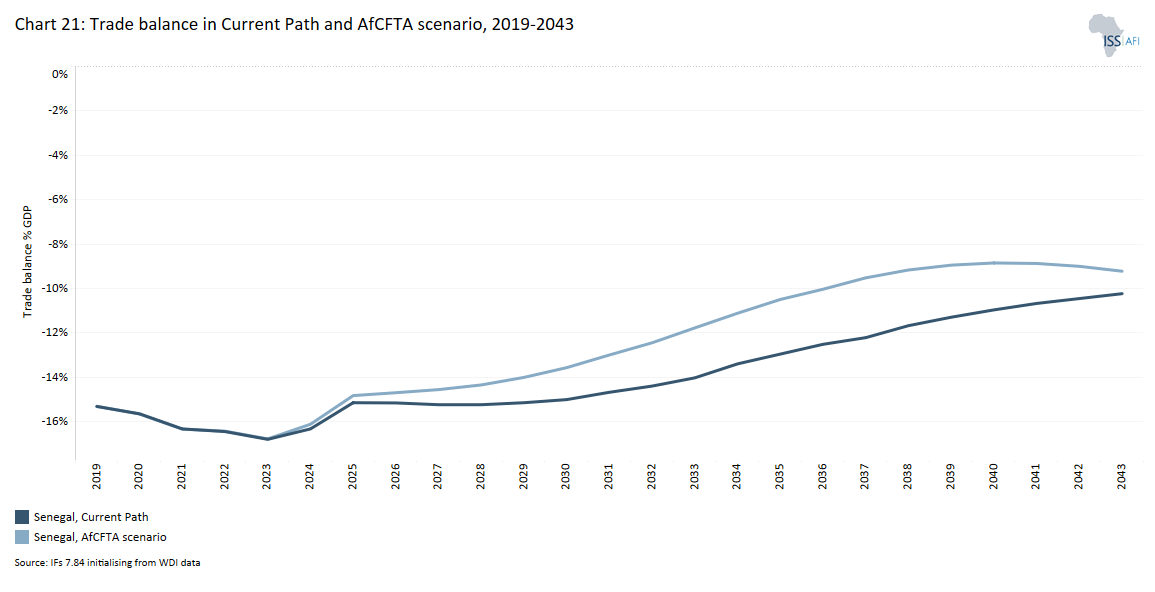

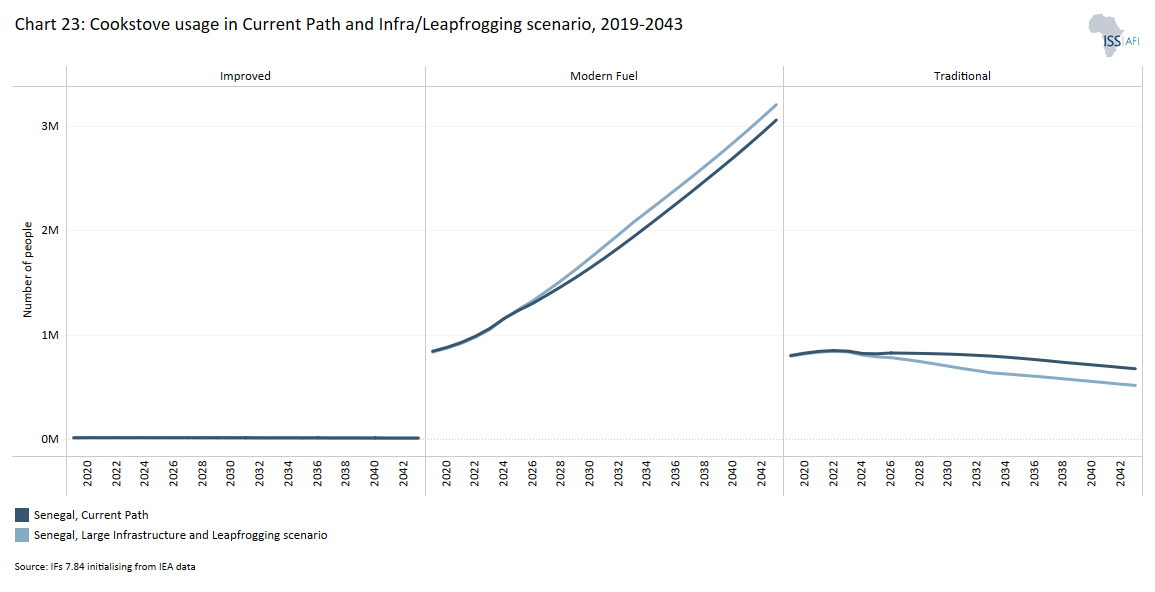
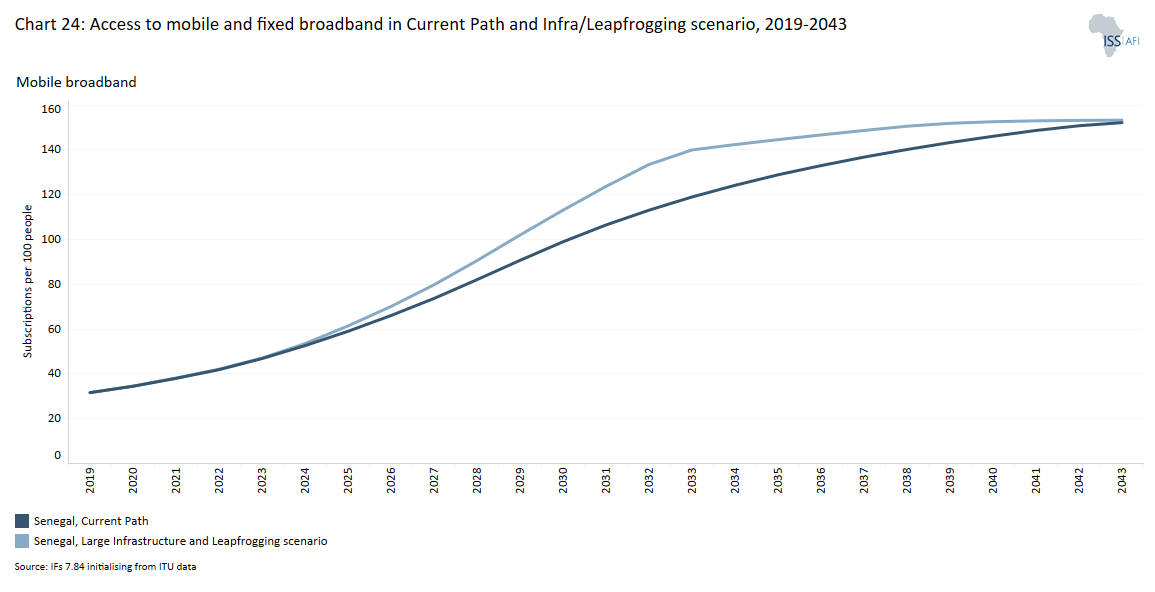
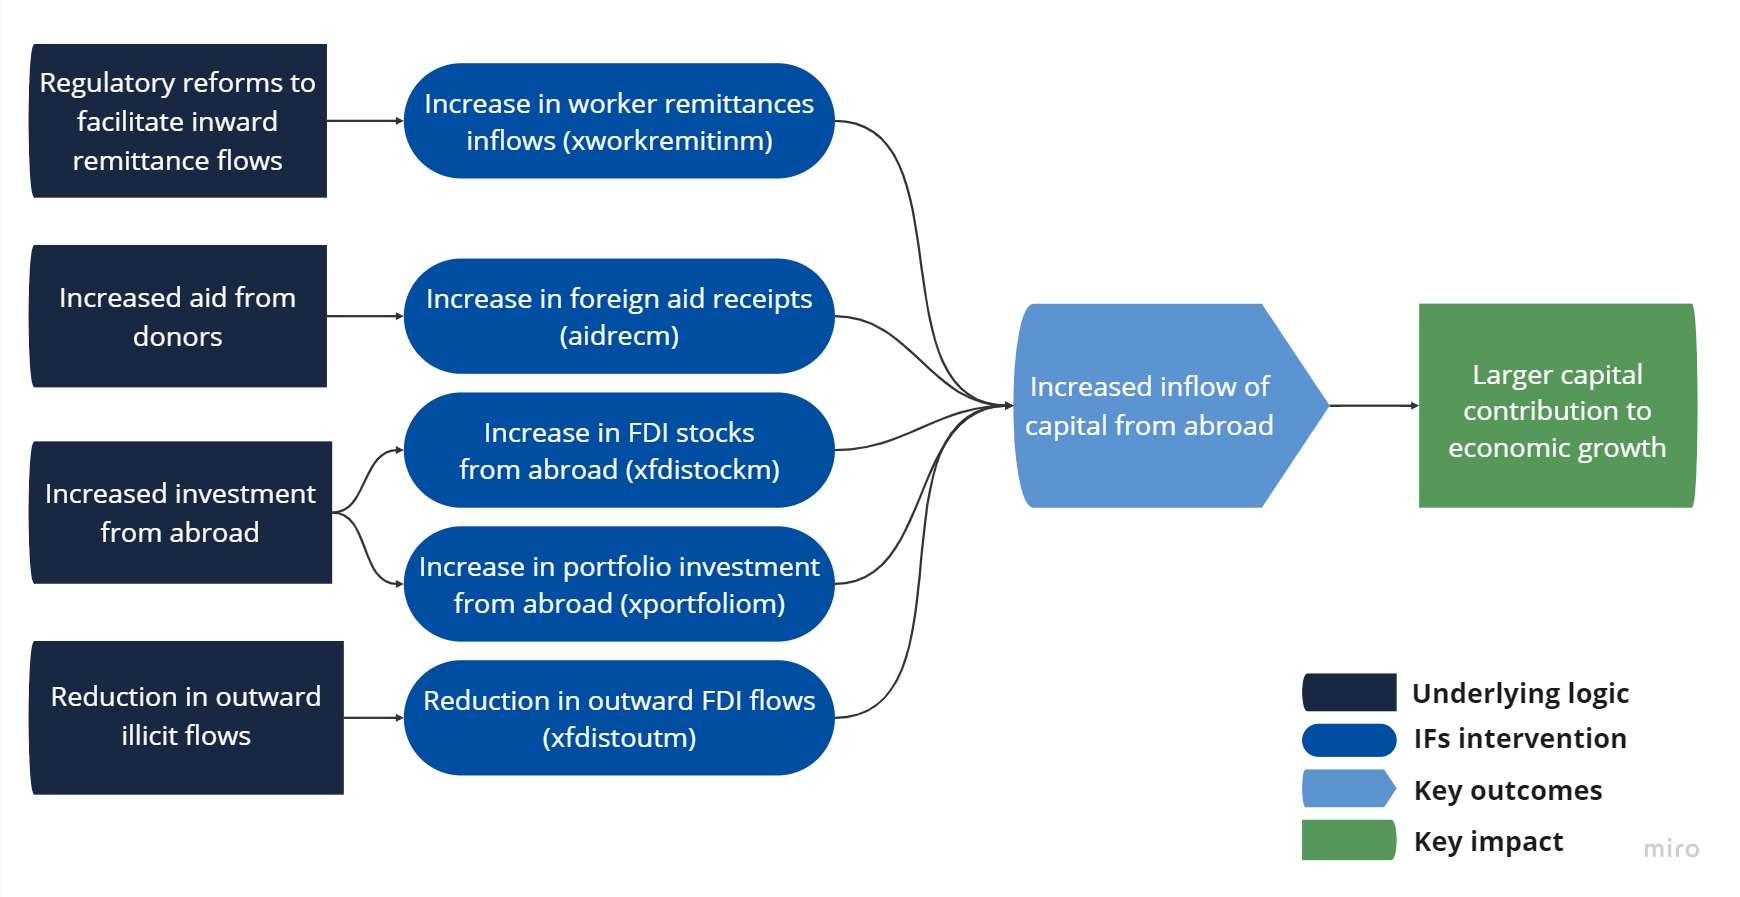
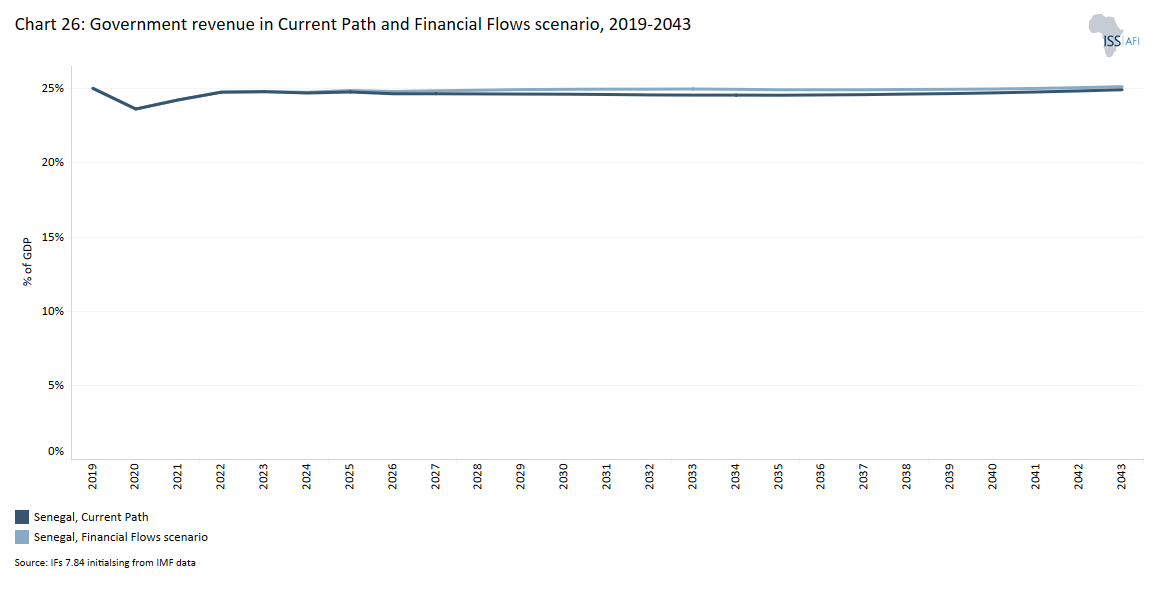
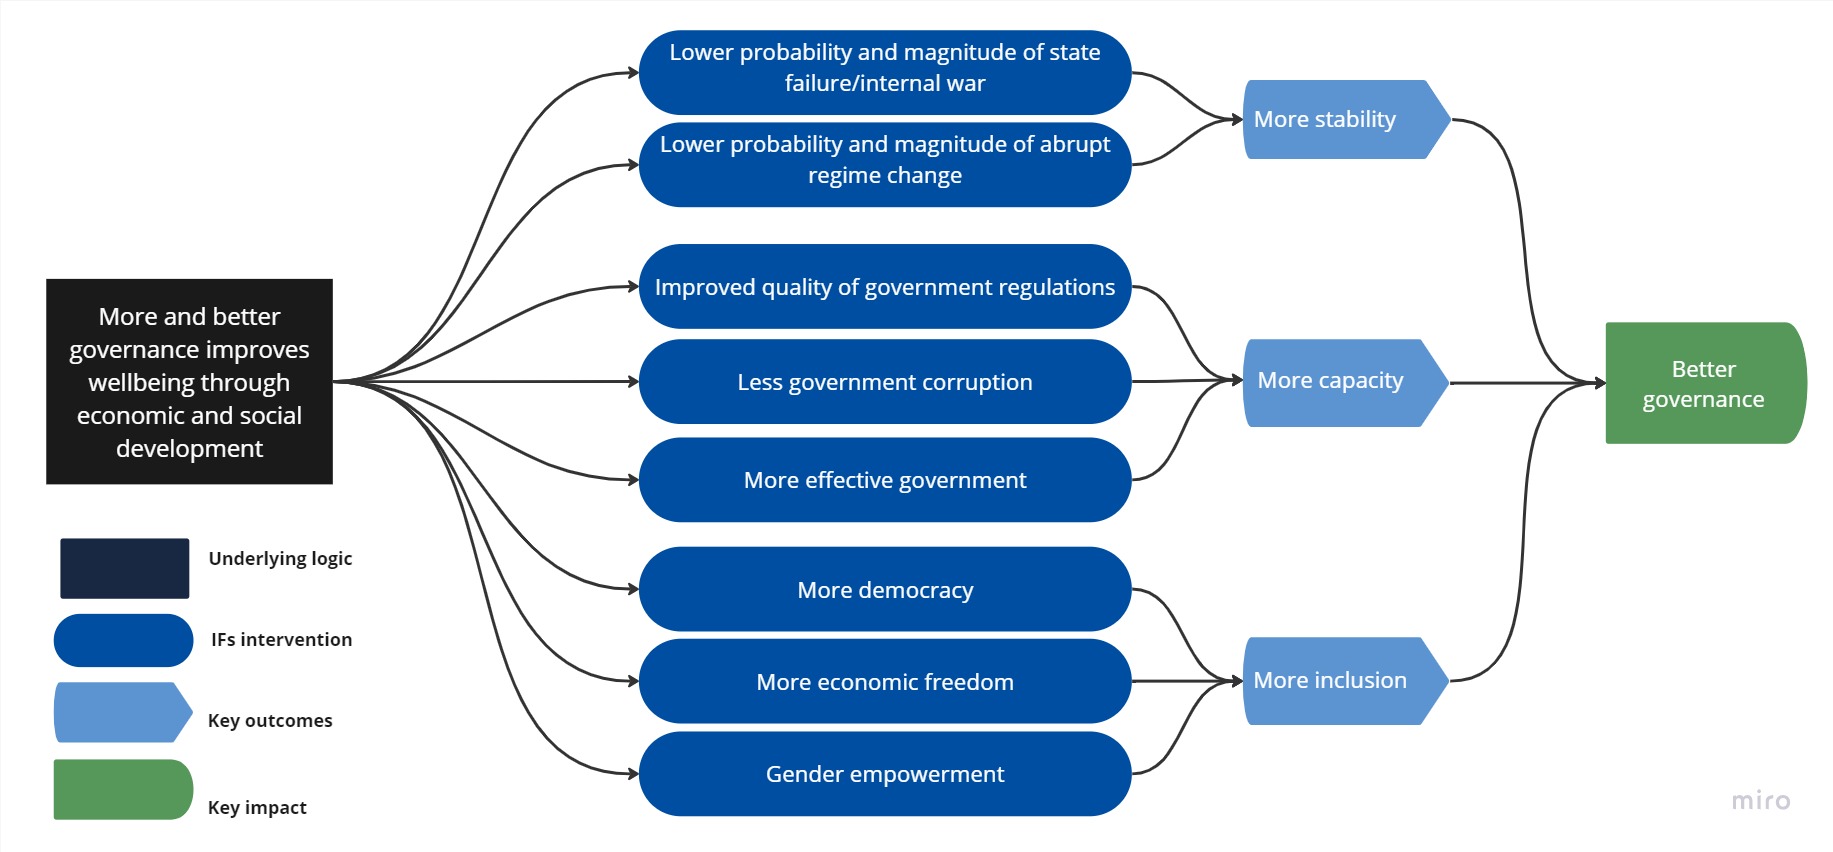
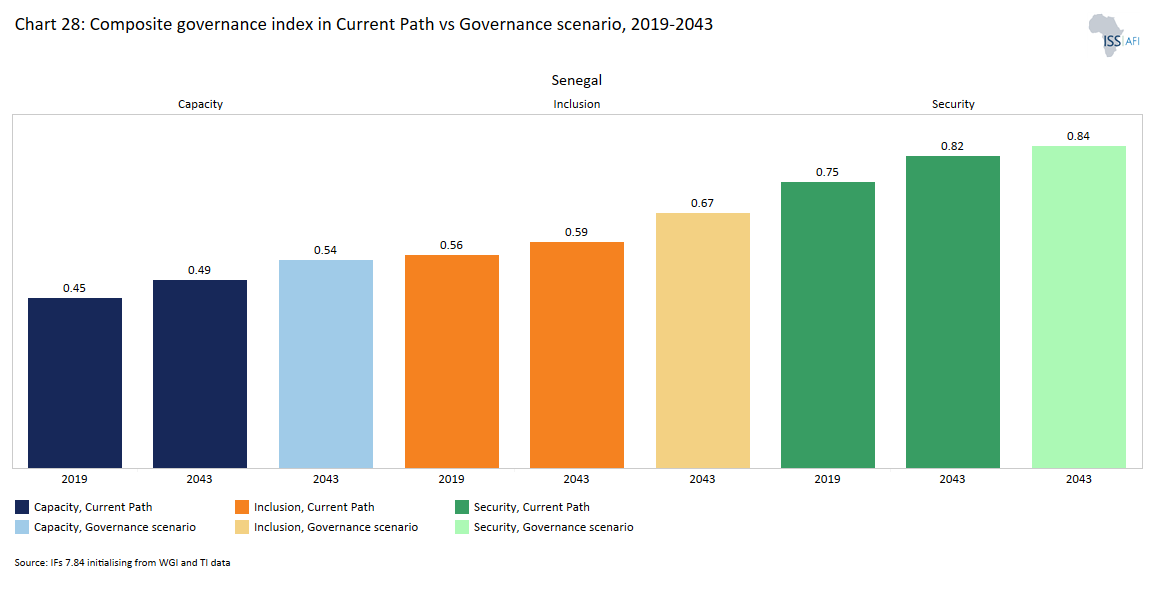
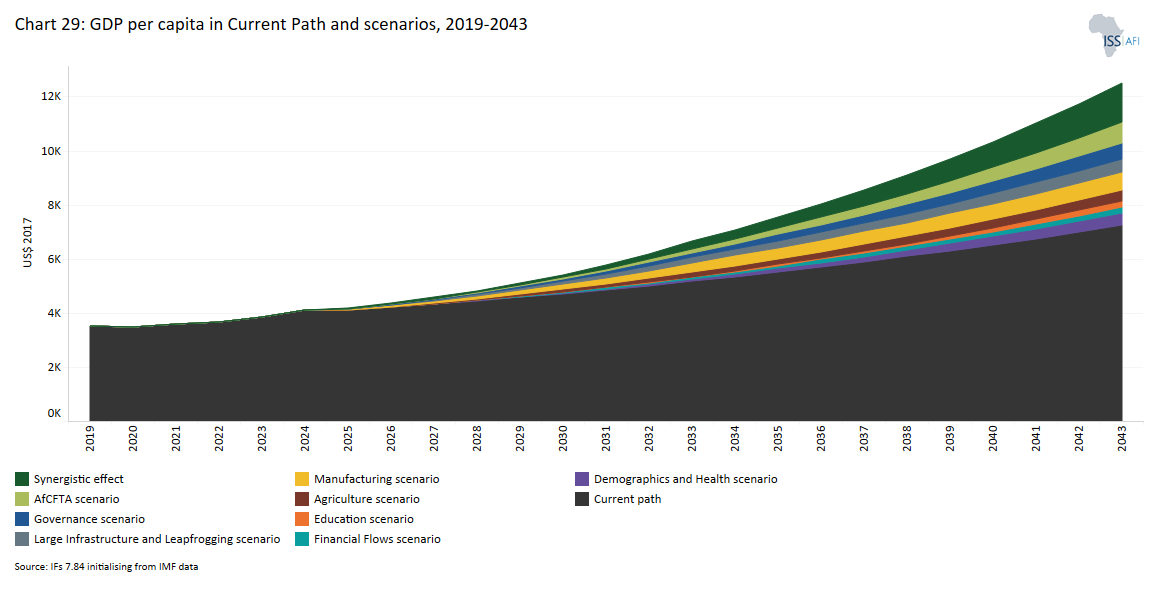
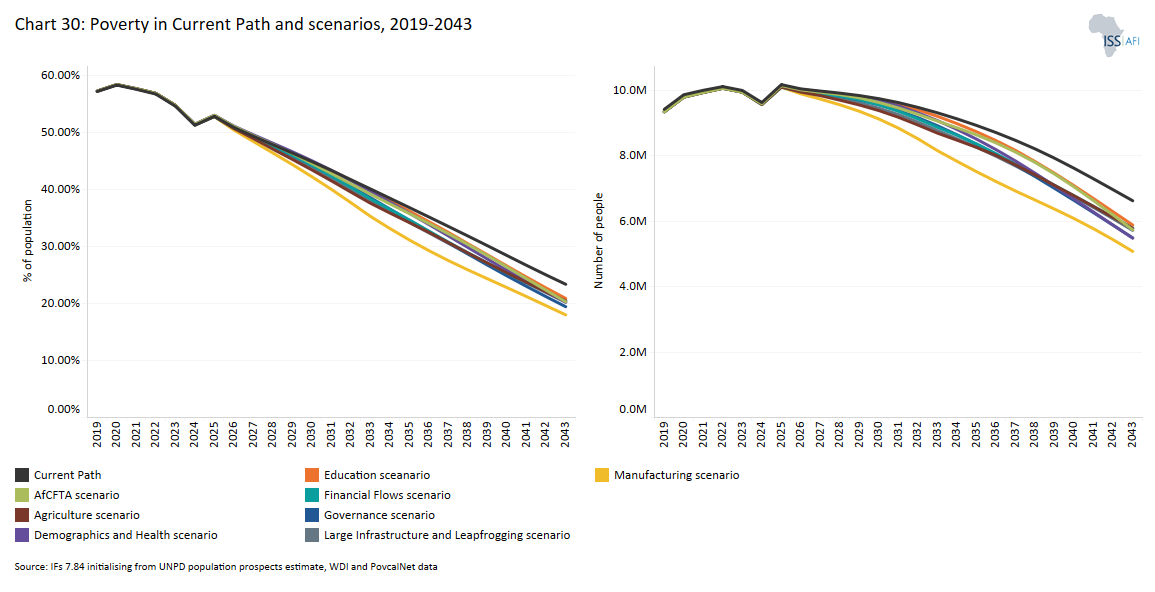
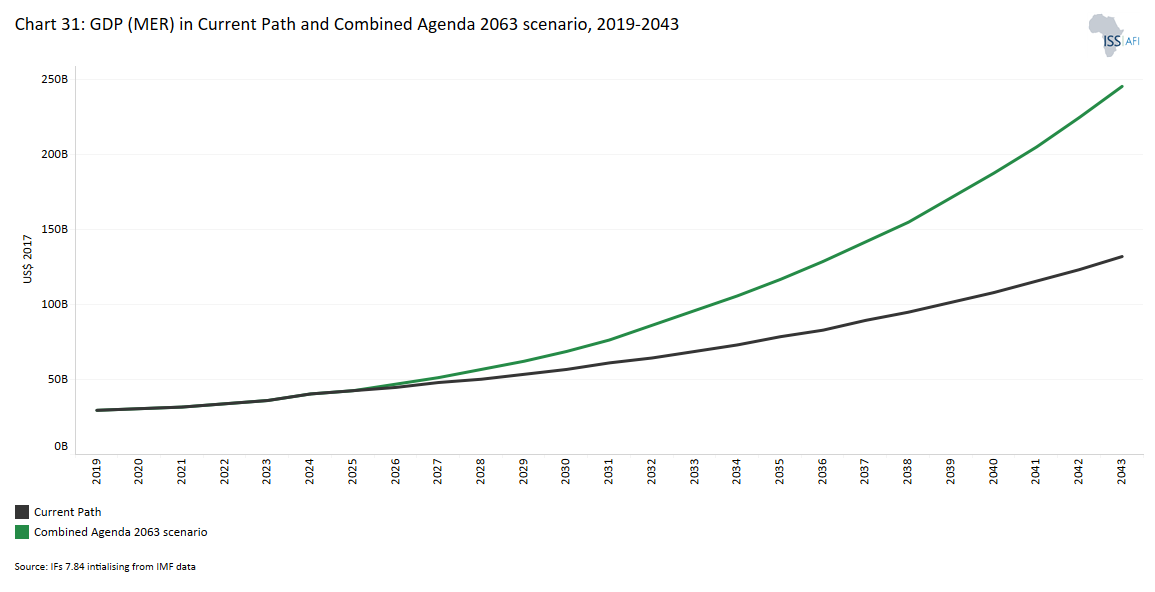
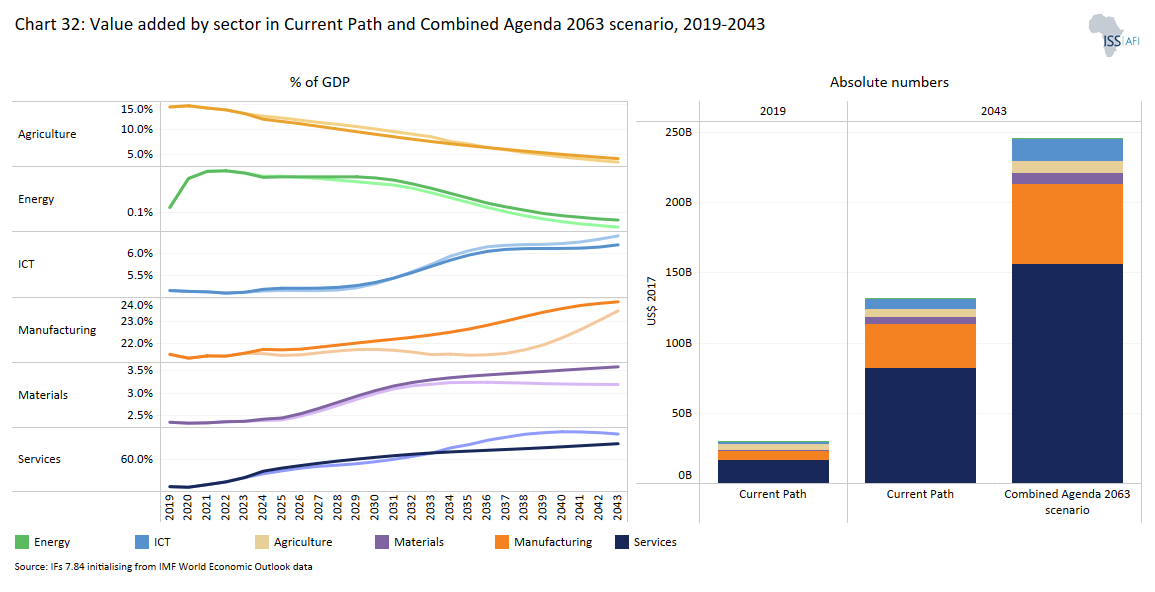
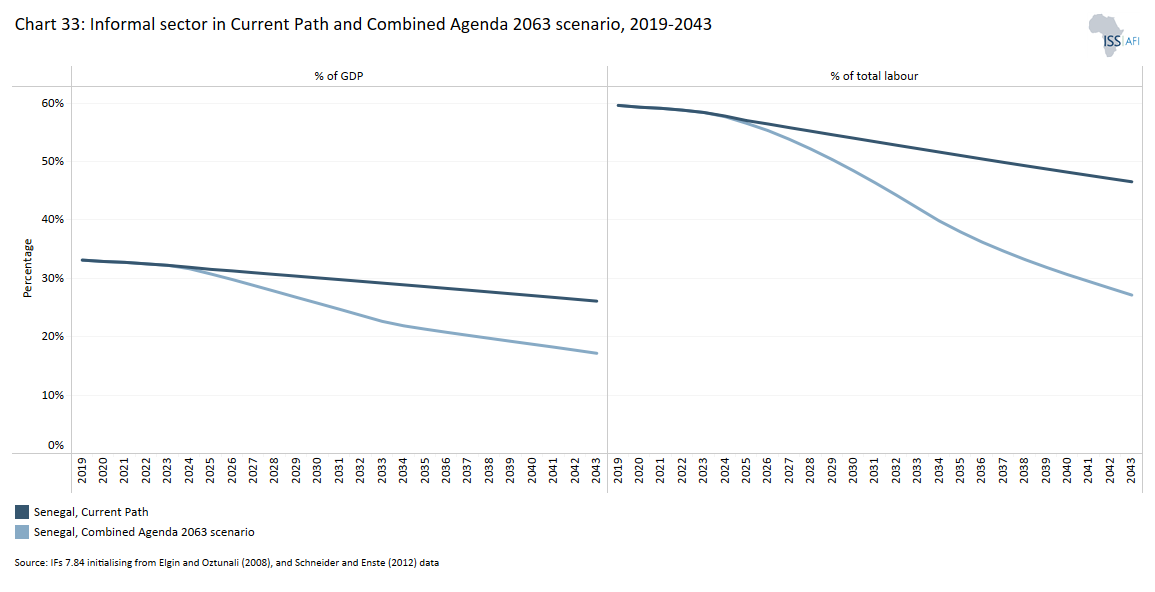
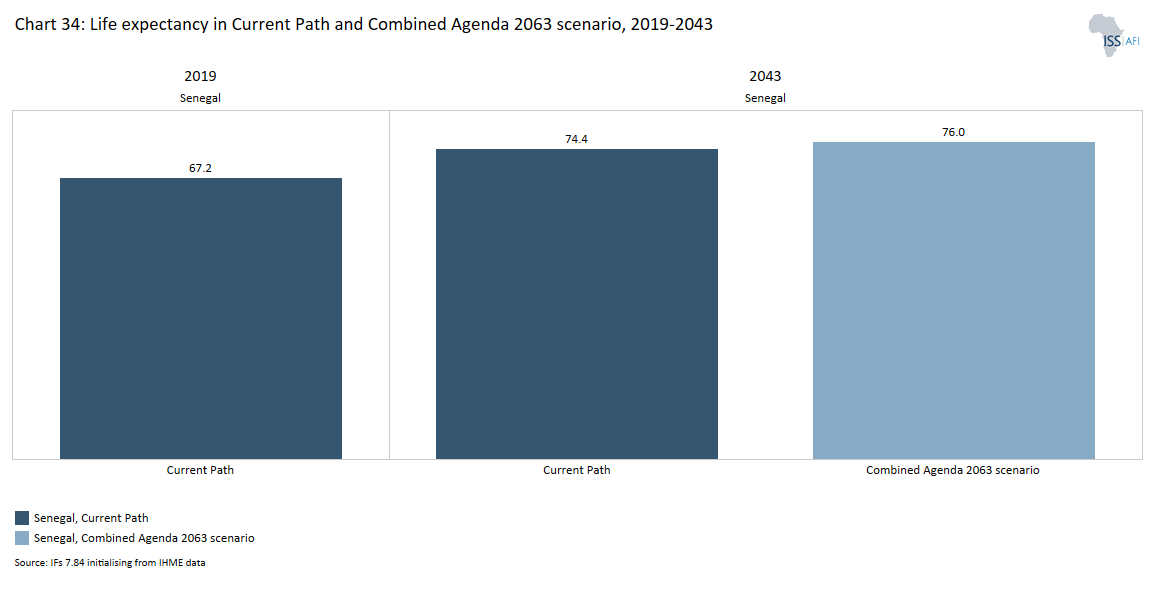
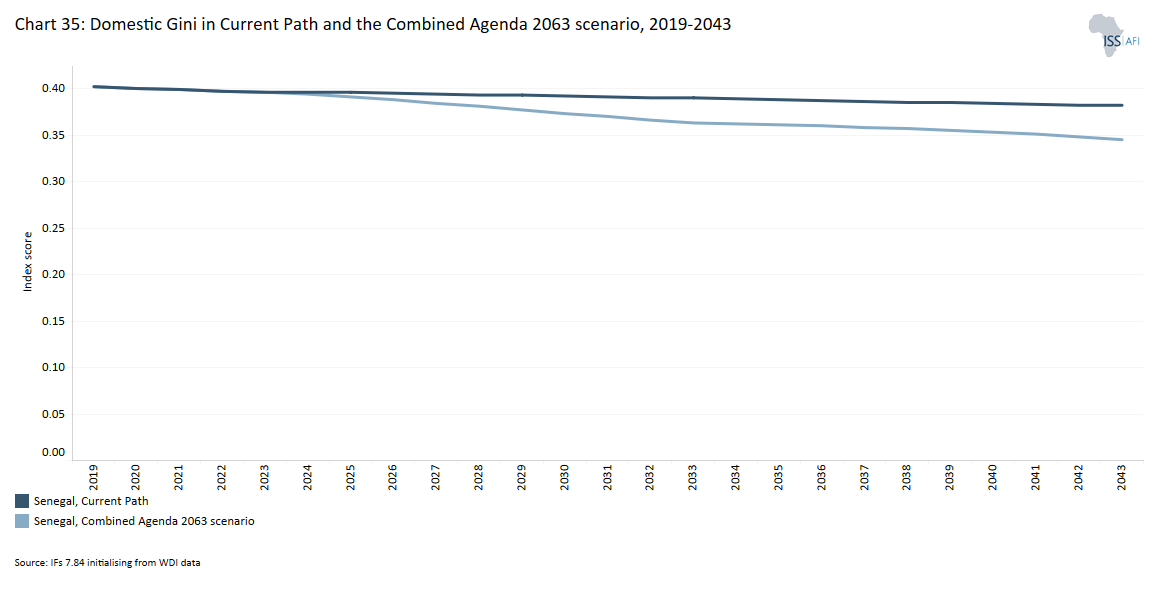
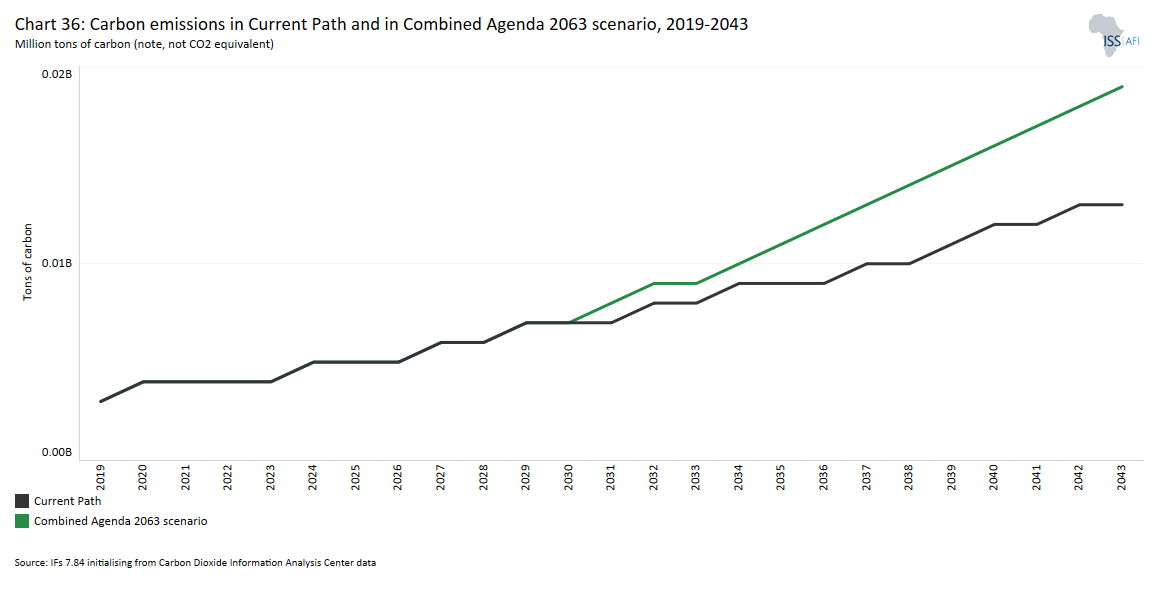
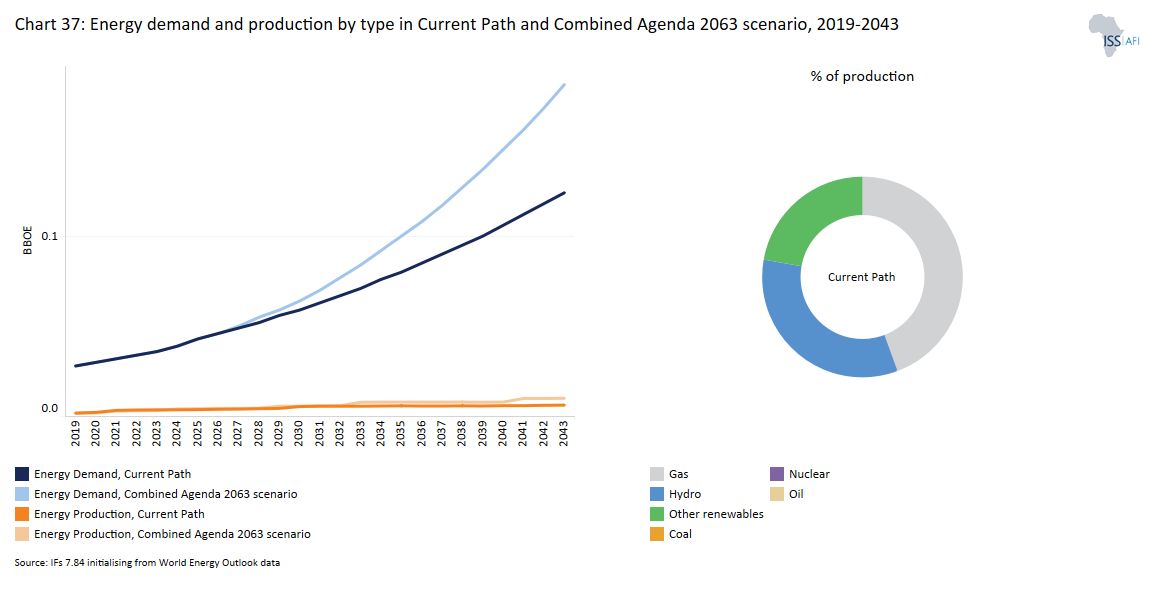
Chart 1 is a political map of Senegal.
Senegal is classified as a lower-middle-income country, located in West Africa and bordered to the west by the Atlantic Ocean, to the north by Mauritania, to the east by Mali and to the south by Guinea and Guinea-Bissau. In addition, Senegal almost enclaves The Gambia, except along its Atlantic western coast. Senegal is a French-speaking country and a member of the Economic Community of West African States (ECOWAS) and the West African Economic and Monetary Union (WAEMU/UEMOA). It has the fourth largest economy in ECOWAS after Nigeria, Ghana and Côte d’Ivoire.
Senegal is a flat country that lies in the depression known as the Senegal–Mauritania Basin. The country has a dry, tropical climate with two seasons: a dry season from November to June and a rainy season from July to October. It also has huge mineral deposits including gold, phosphate, iron, uranium, lithium, tin and molybdenum.
In 1958, the Senegalese electorate voted in favour of joining the French Community, and Senegal became an independent state within the French Community in 1960. Since its independence in 1960, the Parti Socialiste (Socialist Party of Senegal, PSS) which was founded by the country’s first president, Léopold Senghor, ruled the country for 40 years. It initially ruled the country as a one-party state until 1976, where the state authorised the existence of three political parties. As a result, the Democratic Senegalese Party (Parti Démocratique Sénégalais, PDS) became the main opposition party in the country. President Senghor ruled the country for two decades until he voluntarily stepped down in 1980. This led to the full liberalisation of the political party system in Senegal. He was succeeded by President Abdou Diouf from the same PSS party, who ruled the country for another two decades.
The year 2000 marked a significant turning point in the political history of Senegal after a peaceful political transition from the incumbent President Diouf to the longstanding opposition leader Abdoulaye Wade from the PDS, who won the presidential election. This consolidated the country’s democracy and positioned it as a shining example in the West Africa region. In 2008, Macky Sall, who was prime minister of the President Wade administration (2004 to 2007), was dismissed after establishing his own political party, the Alliance for the Republic (APR). He subsequently defeated President Wade in the 2012 presidential elections thereby leading to another peaceful political transition and bringing an end to the 12-year reign of President Wade. In 2019, President Sall’s mandate was renewed by another 5 years after it secured 58% of the total votes in the first round of the elections.
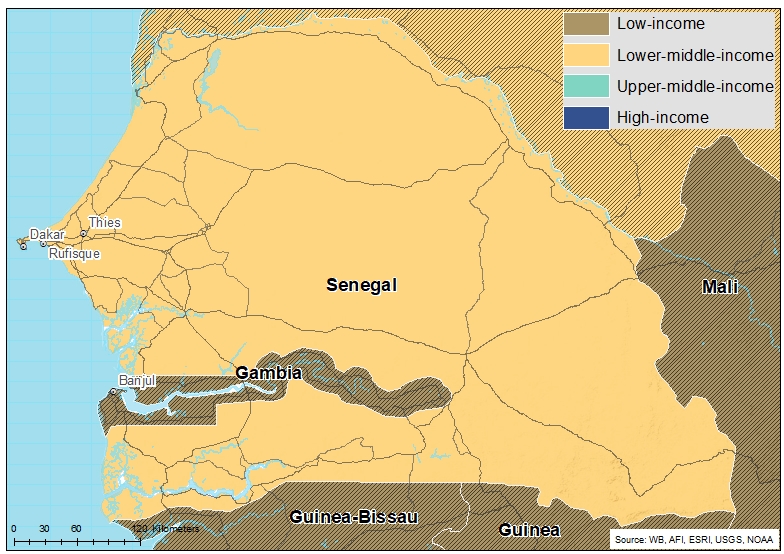
Chart 2 presents the age structure of population to 2043 in the Current Path forecast.
The population of Senegal more than doubled from 7.5 million people in 1990 to 16.3 million in 2019. This makes Senegal the seventh most populous country in West Africa and the 23rd most populous in Africa. In 2019, Senegal’s population growth rate of 2.7% was the eighth highest in West Africa and 17th highest population growth rate in Africa — a decline from 3% in 1990.
The total fertility rate declined from 6.5 births per woman in 1990 to 4.6 births per woman in 2019, which was slightly above the average (of 4.3 births) for lower-middle-income African countries. As a result of this high rate, the population is heavily weighted towards the youth, as are most African populations at low- and lower-middle-income status. In 2019, 43.7% of the Senegalese population was below the age of 15 years, while 55% were in the age cohort 15–64 years (working age) and 3.1% were above the age of 65 years. Comparing this with the structure in 1990 reveals that Senegal’s population structure has not fundamentally changed over the past three decades, likely the result of high fertility rates coupled with poor health outcomes.
The youth bulge (the ratio of its population aged between 15 and 29 to the total adult population) in Senegal stood at about 47.8% in 2019 — a slight decline from 49% in 1990 and above the average of 46% for Africa and 47% for West Africa. The median age in Senegal in 2019 was 18.2 years —a rise from the median of 16.3 years recorded in 1990 and above West Africa’s average of 18 years but below Africa’s median age of 19.7 years. The working-age population group, which represents the largest share of the population coupled with the youthful population, can be a potential source of growth, provided the labour force is well trained and a sufficient number of jobs are created.
However, despite the impressive growth rate over the years, it has not translated into the needed number of jobs to absorb the growing labour force in the country. For instance, the demand for jobs is twice as large as the supply as the rapidly growing youthful population continues to exert pressure on demand for jobs. Unemployment is high among women and youth, estimated to be about 22% and 16%, respectively. This is partly the result of a skills gap in the labour market due to training not matching the labour market requirements.
In the forecast horizon, the structure of Senegal’s population will see modest changes. Senegal’s population growth rate is expected to fall to 1.8% by 2043, with the total population projected to increase to 28.2 million by 2043 on the Current Path. By then, the median age is expected to rise to almost 24 years, and the youth bulge will fall to 42%. The proportion of people under the age of 15 will decline to 32.7%, while the share of the working population and the population aged 65 and older will increase to 62.8% and 4.5%, respectively, by 2043. Such rapid population growth hinders development and condemns Senegal to very modest improvements in average incomes given the demands on the fiscus to cater for its rapidly expanding population.
Chart 3 presents a population density map.
Senegal is relatively dry and its shoreline runs along the Atlantic Ocean at the Sahel’s westernmost point. Senegal was the eighth most densely populated country in West Africa and the nineteenth most densely populated country in Africa in 2019. Its estimated population density of 0.83 people per hectare in 2019 was higher than the average in Africa at 0.44 people per hectare. The Atlantic port city of Dakar has a small total land area of 83 km2 with a very high population of over 1 million people, accounting for over 25% of the total population in Senegal. Indeed, Dakar is the only city with a population over a million, followed by Touba with a population of about 800 000. Other densely populated cities include Pikine and Thies. Other regions are sparsely populated with most cities having populations of less than 300 000. For instance, the Tambacounda region only has a population density of eleven inhabitants per square kilometre. Other sparsely populated areas also include Matam, Kedougou, Pout, Sali and Sebikotane. By 2043, Senegal’s population density is forecast to reach 1.5 people per hectare, which is almost on par with the average for West Africa.
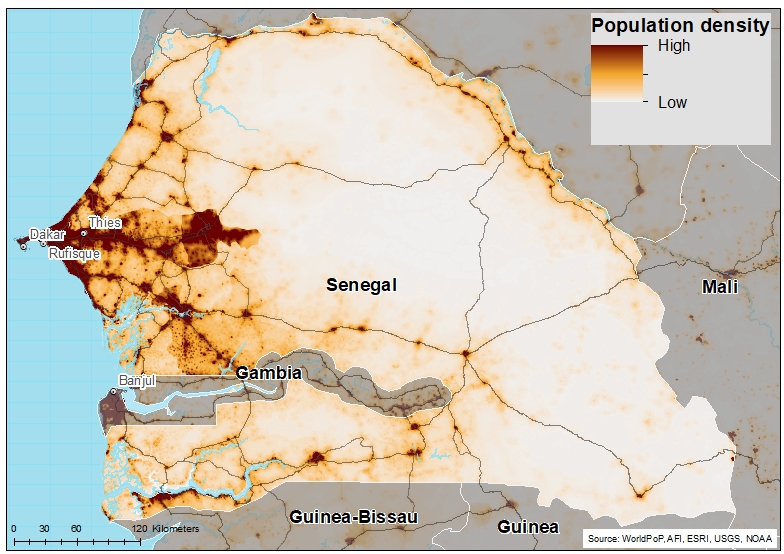
Chart 4 presents the size of Senegal’s economy from 1990 and includes a forecast to 2043 including the associated growth rate.
The Senegalese economy has traditionally revolved around a single cash crop, namely peanuts. This makes the economy vulnerable to international commodity price fluctuations and external shocks. However, the government has worked to diversify both cash crops and subsistence agriculture by expanding into commodities such as cotton and sugar cane, and promoting non-agricultural sectors. Fishing, phosphates and tourism have successfully been turned into major sources of foreign exchange since the beginning of the 21st century.
In 2019, the Senegalese economy was the fourth largest in West Africa after Nigeria, Côte d’Ivoire and Ghana, as well as the thirteenth largest among the 23 lower-middle-income groups in Africa. Its GDP measured in market exchange rates (MER) almost tripled from US$9.2 billion in 1990 to US$29.4 billion in 2019. The average GDP growth rate within this period is estimated at 3.7% per annum, below the average of 3.9% for lower-middle-income countries in Africa. In recent years, the economy has witnessed strong economic growth. Between 2014 and 2018, the economy grew by more than 6% per year — a historic performance which was occasioned by the implementation of the Emerging Senegal Plan (PSE) started in 2014. This remarkable feat can be attributed to various structural reforms in the agriculture and industrial sectors from the PSE.
Like many economies, this strong economic growth prospect was truncated by the COVID-19 pandemic in 2020. The restrictive measures and protocols instituted to control the virus curtailed economic activities, resulting in the GDP shrinking by 1.3% in 2020 — the largest drop in a decade. However, the economy recovered quickly growing at 6.5% in 2021 but dipped to 4.2% in 2022. The slump in 2022 was due to Russia’s invasion of Ukraine, which compounded the economy’s wounds inflicted by the COVID-19 pandemic, especially on commodity prices. This led to unfavourable terms of trade, rising inflation, fiscal deficits and debt stock. Annual inflation reached a multi-decade high of 14.1% in 2022, mainly driven by high food inflation, which accounts for nearly half of the consumer price index basket and rose by 15% in 2022.
Huge public spending, particularly on fuel and electricity subsidies, coupled with the 20% raise in public sector wages has led to a large fiscal deficit and public debt largely financed by external borrowing. From 2010 to 2019, the country’s debt-to-GDP ratio increased from 28.5% to 63.9%, and rose to 69.1% in 2020 due to COVID-19 expenditure. At the end of 2022, total public debt is estimated at about 75.2% of GDP of which external debt constituted about 58.2% above the 70% debt sustainability threshold for emerging economies.
The main structural challenges facing the country include climatic hazards (droughts, floods, sea level rise and coastal erosion), fluctuation in commodity prices, high trade and current account deficit, large fiscal deficit and associated rising debt. Low productivity and high informal sector activities hinder structural transformation of the Senegalese economy. Increased political instability and insecurity in the West African region also threaten the long-term peace, stability and development of Senegal.
The government now faces the hard job of mitigating the socio-economic impact of the COVID-19 pandemic, promoting sustainable and inclusive growth and translating such gains into poverty and inequality reductions while addressing its long-term development needs and ensuring debt sustainability. With the easing of COVID-19 restrictions, and with donor support, the economy is expected to bounce back as Senegal still has strong growth potential. The country faces an optimistic future with economic growth projected to rebound to 5.3% this year to make it one of the fastest growing economies in sub-Saharan Africa. This strong economic growth will be boosted by its emerging oil and gas exploration, which was delayed due to the COVID-19 pandemic. Indeed, economic growth is forecast to accelerate to 10.6% in 2024 and to 7.4% in 2025, mainly as a result of the production of oil and gas in these years. However, this will be short lived.
Also, as part of fiscal consolidation measures, the government has also adopted a roadmap to phase energy subsidies by 2025 and to move away from non-concessional financing to a more domestic regional market financing. In addition, the country signed a 36-month financing agreement with the International Monetary Fund (IMF) worth US$1.5 billion anchored on three main pillars: 1) fiscal consolidation and debt reduction, 2) improving public sector governance and anti-money laundering, and 3) promoting inclusive private sector led growth.
On the Current Path, Senegal’s GDP is estimated to more than quadruple to US$132 billion by 2043. The increase in GDP reflects the higher rate of economic growth expected to occur within the next 24 years.
Chart 5 presents the size of the informal economy as a per cent of GDP and in absolute terms, as well as the per cent of total non-agriculture labour involved in the informal economy. Also see Chart 33 that presents the impact of the combined scenario on the informal sector.
Estimations and data on the informal sector are often unreliable and must be treated carefully. Researchers generally distinguish between the shadow and informal economy. According to the ILO: ’The informal economy refers to all economic activities by workers and economic units that are – in law or in practice – not covered or insufficiently covered by formal arrangements.’ Where data is not available, IFs estimate the size. Note that the ILO definition of employment in the informal economy excludes the agricultural sector.
As is the case in most African countries, the informal sector is a lifeline for many people in Senegal. According to a 2020 ILO report, nine out of ten workers in Senegal are in informal employment and 97% of non-agricultural economic value chains operate in the informal economy. A more recent 2022 ILO report confirms this, indicating that 96% of the economically active population are in the informal sector. The informal economy consists mainly of daily wage workers. Many do not have a contract and do not benefit from any form of social protection nets.
The informal economy in Senegal is also dominated by women, especially in the capital city, Dakar. Some worker groups in the informal sector include domestic workers, market traders, home-based workers, street vendors, waste pickers and transport workers. In Dakar alone, these six groups constitute 77% of all employment in the city.
In 2019, however, IFs estimated the size of the informal sector in Senegal to be approximately 33% of GDP above the average of 29.5% for lower-middle-income countries in Africa. Among Africa’s 23 lower-middle-income countries, Senegal has the ninth highest informal sector, suggesting that it has performed poorly in formalising its economy compared to the average of other African countries within its income group. The size of the informal sector is expected to decline slightly to 26.1% of GDP by 2043, constituting an almost seven percentage point decrease over the 24-year period. This projected reduction in the size of the informal economy augurs well for government revenue. Over the forecast horizon, Senegal will perform relatively poorly compared to its lower-middle-income peers although it eventually closes the gap. Senegal will have the tenth largest informal sector among lower-middle-income countries in Africa in 2043.
Though the informal economy provides a safety net for a large and growing working-age population in the country, it impedes economic growth. Reducing informality will allow more people to benefit from better wages and redistributive measures. Therefore, authorities need to take measures to reduce the size of the informal economy by reducing the hurdles to registering a business, tackling corruption and improving access to finance.
Chart 6 presents average GDP per capita from 1990 and includes the Current Path forecast to 2043.
Despite its limitations, GDP per capita is generally used to measure the standard of living and is the most widely used and accepted indicator to compare welfare among countries. Using the purchasing power parity (PPP) measure, for this analysis, Senegal’s GDP per capita of US$3 546 in 2019 is the seventh lowest GDP per capita among the 23 lower-middle-income countries in Africa and 89% less than the group average of US$6 708 for lower-middle-income countries in Africa. This figure represents a 36% improvement from the US$2 609 it recorded in 1990. The improvement in GDP per capita within the period is mainly due to its economic growth rate averaged at 3.7% surpassing average population growth rate over the period.
On the Current Path, Senegal will witness tremendous improvement in its GDP per capita and gain ground on its income-group peers — a result of the high economic growth rates forecasted. By 2043, its GDP per capita is projected to more than double to US$7 239, placing it 12th highest among lower-middle-income African countries, five places above its 2019 ranking. At this rate, the country’s GDP per capita will be only US$1 663 lower than the average of US$8 902 for its income-group peers in Africa. The higher GDP per capita expected to occur in the next 24 years is due to Senegal’s high economic growth prospects.
Chart 7 presents the number of people living in extreme poverty, also expressed as a per cent of the population.
In 2015, the World Bank adopted US$1.90 per person per day (in 2011 prices using GNI), also used to measure progress towards achieving Sustainable Development Goal (SDG) 1 of eradicating extreme poverty. In 2022, the World Bank updated the US$1.90 to US$2.15 in 2017 constant dollars. They are:
- US$3.20 for lower-middle-income countries, now US$3.65 in 2017 values.
- US$5.50 for upper-middle-income countries, now US$6.85 in 2017 values.
- US$22.70 for high-income countries. The Bank has not yet announced the new poverty line in 2017 US$ prices for high-income countries.
This page still uses US$1.90 and US$3.20.
Senegal ranked 170th out of 191 countries on the Human Development Index in 2022, below the sub-Saharan average. As a lower-middle-income country, Senegal uses the US$3.20 benchmark for extreme poverty. In 2019, 9.3 million Senegalese people, representing 57.3% of the population, lived below the poverty line of US$3.20, which was below the average of 60.6% for lower-middle-income countries in Africa. Poverty is more prevalent in rural areas than in urban centres. About 66% of people residing in rural areas are considered poor compared to the 25% of people living in Dakar.[1] Poverty in Senegal is also concentrated among minority ethnic groups. For instance, ethnic groups like Pulaar and Sareer are at 83% and 80% risk of being chronically impoverished.[2]
The root causes of poverty in Senegal include high unemployment rates, a high dependency on the agricultural sector, environmental factors, and limited access to social services such as healthcare and welfare especially in rural areas. Civic unrest, particularly in the Casamance region, and lack of financial inclusion are also underlying factors of the high poverty rate in the country.[3] Child labour and lack of education are also contributors to poverty in Senegal as well the large informal sector and low skilled labour.
To combat high poverty rates, the Senegalese government initiated the National Programme of Family Security Grants, which aims to build up the resilience of the most vulnerable citizens to chronic poverty and economic shocks. However, the undeveloped agricultural sector poses a significant setback to reducing poverty in the country since almost 75% of poor people reside in rural areas and depend on the sector for livelihood.[4]
As a result of poverty, many Senegalese people migrate to other countries in search of better economic opportunities. Countries such as Libya and Mauritania have been popular destinations in the past because of their booming oil industries. Other Senegalese people emigrate to France, Italy and Spain for better economic opportunities.[5]
On the Current Path, Senegal’s progress in reducing poverty rates will be quicker compared to the average of its income-group peers in Africa such that by 2043, the poverty rate of 23.4% (equivalent to 6.6 million Senegalese people) will be about 15 percentage lower than the average of 38.3% for lower-middle-income countries in Africa.
Chart 8 depicts the National Development Plan of Senegal.
Senegal has a long-term development vision called Plan Senegal Emergent (PSE) that spans from 2014 to 2035. The PSE is a strategic development initiative launched by the government to transform the country’s economy and promote sustainable development. The overarching vision of the plan is to make Senegal an emergent economy by 2035 that will be characterised by inclusive development and growth, which is coupled with improved living conditions. The three pillars are centred around:
1) the structural transformation of the economy
2) human capital, social protection and sustainable development, and
3) institutional reform, governance and security.
In addition, key sectors are identified including agriculture, fisheries, mining, energy, tourism, information and communications technology (ICT) and infrastructure. The government has also established mechanisms for monitoring and evaluating the progress of the plan to ensure effective implementation.
In addition to the long-term vision, Senegal publishes medium-term development plans called Plan d’Actions Prioritaires (PAP). The most recent covers the period from 2025 to 2029. The first sections in that document present on:
- A Fragile Economic Model with Low Value Creation: Key concerns are Economic Freedom; Prosperity; Economic Growth; Public Finances; and Financing the Economy.
- Weak Human Capital and an Inequitable Social Model: Key concerns are Poverty; Human Capital; Health; Social Protection; and Access to Basic Services.
- Poor Land Management with Environmental Challenges: Key concerns are Environmental Sustainability; and Urbanization.
- A Fragile Governance Model Hindering Development: Key concerns are Public Administration; Political and Judicial Governance; and Territorial Governance.
The second part deals with the implementation of the medium-term strategy:
- Strategic Framework: Key concerns are Global, Continental, and National Environment; Long-term Strategy; and Strategic Axes.
- Implementation of the Strategy: Key concerns are Macroeconomic Framework; Debt Policy; Priority Action Plan (PAP); Territorialization of Public Expenditure; and Private Sector Development.
In the past, the country has also implemented other medium-term plans such as the National Strategy for Economic and Social Development (NSESD) from 2013 to 2017 and the Sectoral Policy for the Development of Local Governance, Development and Regional Planning from 2015 to 2020. These plans and strategies aim to transform the economy, improve human capital, promote social protection and sustainable development, ensure good governance and enhance the country’s overall development.
Chart 9 depicts the relationship between the Current Path forecast, the various sectoral scenarios and the Combined Agenda 2063 scenario.
The Current Path forecast is a dynamic scenario in the International Futures forecasting platform that imitates continuing current policies and environmental conditions.
The eight sectoral scenarios are each explained in the various themes on the website and the impact on each is compared with the Current Path forecast and a Combined Agenda 2063 scenario. The eight scenarios are:
- A more rapid demographic transition and investments in better health and water, sanitation and hygiene (WaSH) infrastructure
- Better and more education (looking at quantity, quality and relevance)
- Large infrastructure and leapfrogging (the impact of renewables, ICT and the more rapid formalisation of the informal sector)
- Food security and an agricultural revolution
- A low-end manufacturing transition
- The full implementation of the African Continental Free Trade Area (AfCFTA)
- More inward financial flows (consisting of aid, foreign direct investment, remittances and illicit financial flows) and
- Better governance (consisting of stability, capacity and inclusion).
The Combined Agenda 2063 scenario is a combination of all eight sectoral scenarios.
The impact of these scenarios on jobs/employment and greenhouse gas emissions and energy are presented in separate themes.
A final theme models the effect of alternative global scenarios on Africa’s development potential.
The interventions within IFs are detailed in an annexure at the end of this page.
Chart 10 presents the structure of the Demographics and Health scenario as modelled in IFs that advances the demographic dividend and improves health.
The Demographic and Health scenario consists of reasonable but ambitious reductions in child and maternal mortality ratio, increased access to modern contraception and reductions in the mortality rates associated with both communicable diseases (e.g. AIDS, diarrhoea, malaria and respiratory infections) and non-communicable diseases (e.g. diabetes), as well as improvements in access to safe water and better sanitation.
Visit the themes on Demographics and Health/WaSH for more detail on the scenario structure and interventions.
Over the past ten years, Senegal has achieved significant success in improving health outcomes in the country. The government has implemented various initiatives to improve maternal and child health, such as the National Health Development Plan, which focuses on reducing maternal and child mortality. Strategies include increasing access to skilled birth attendants, promoting antenatal care and providing postnatal support.[1] To successfully address health challenges issues, the Senegalese government has bolstered the primary healthcare system. This includes extending the availability of high-quality care services, enhancing facilities and machinery, and developing healthcare personnel.[2]
Together with global organisations, the government has worked to enhance health surveillance and create efficient reaction plans. In addition, the government has put in place initiatives that emphasise non-communicable disease prevention, health promotion and early detection. These initiatives include fostering a healthy lifestyle, educating people about the risk factors for non-communicable diseases and expanding the availability of screening and treatment options.[3] Despite these efforts by the government, the health sector is confronted with several challenges. These challenges include poor access to high-quality healthcare, and shortage of trained birth attendants.[4] There are frequent geographic and socio-economic disparities in the availability of healthcare services in the country.[5]
IFs uses the International Classification of Disease (ICD) to differentiate between three broad categories: communicable diseases, non-communicable diseases and injuries, as well as 15 subcategories of mortality and morbidity. In 1990, communicable diseases caused about 57 000 deaths, constituting about 65% of total deaths in that year. This was followed by non-communicable diseases that caused 26 000 deaths (29.5% of total deaths) and injuries that caused 5 000 deaths (5.6% of total deaths). Senegal achieved its epidemiological transition in 2014 (a point where deaths from non-communicable diseases outweigh deaths from communicable diseases). By 2019, deaths from non-communicable disease had risen to constitute almost half of all deaths (48 000). Deaths from communicable diseases had steadily declined to 41 000, representing 42% of all deaths.
Infectious illness outbreaks such as Ebola, HIV/AIDS, TB and malaria are some causes of mortality in Senegal.[6] Malaria alone caused about 30 000 deaths in 2019. Deaths from injuries also rose to 8 000 (equivalent to 7.5% of all deaths). These illnesses place a heavy burden on the healthcare system and present serious health hazards. Additionally, the incidence of non-communicable diseases, such as cancer, diabetes and cardiovascular disease, is rising in Senegal. The prevalence of non-communicable diseases are attributable to factors such as urbanisation, sedentary behaviour and unhealthy diets.[7] Maternal and infant mortality also remains high in Senegal. According to IFs, there are an estimated 292 maternal fatalities for every 100 000 live births, compared to 32 infant deaths for every 1 000 live births.
On the Current Path, by 2043, non-communicable diseases will continue to be the highest cause of death in Senegal causing 88 000 deaths, representing about 72.4% of all deaths in the country. The transition to deaths from non-communicable diseases as the main cause of mortality will inevitably increase health sector costs as they are more expensive to treat. By then, deaths from communicable diseases will rapidly decline to 18 000, constituting 14.7% of all deaths, while deaths from injuries will rise to 16 000, constituting the remaining 12.9%.
Access to improved, safe, treated water, such as piped water, is an important means of preventing the spread of communicable diseases. The country has carried out initiatives to provide access to hygienic facilities and clean water, notably in metropolitan areas. The expansion of water supply networks by the National Water Company and the implementation of sanitation programmes to enhance hygiene and waste management.[1] In 2019, 13.8 million people in Senegal (constituting 86.3% of the population) had access to improved water supply. This represents a significant improvement from the 64.8% in 2000. Out of this, 11.9 million people (representing about 74.1% of the population) had access to piped water supply in the country, far above the average of lower-middle-income countries in Africa. The country will make significant advancement towards the attainment of SDG goal 6.1 of universal access to safe drinking water on the Current Path. At the end of the SDG implementation, 91.3% of people in Senegal will have access to improved water. By 2043, it is projected that access to improved water will increase to about 97.6% of which piped water will constitute almost 88% connections.
Regarding sanitation, about 56% of the population (8.9 million people) had access to improved sanitation in 2019 — slightly above the average of 53.2% for its income-group peers in Africa. The share of the population with access to shared sanitation at 17% is on par with Africa’s lower-middle-income group average. On the Current Path, the proportion of the population with improved access to sanitation is estimated to rise to 85.7% by 2043, above the average of 66.5% for lower-middle-income countries in Africa. By this time, the share of the population with access to shared sanitation will decline to 7% below the average for its income-group peers.
Chart 11 compares urban and rural populations in the Current Path and the Demographics and Health scenario.
Senegal is at the cusp of transitioning from a rural to a mostly urban population. In 1990, 77% of Senegalese people lived in rural areas, above the average of 64.2% for lower-middle-income countries in Africa. However, over the years, urbanisation in Senegal has been quite rapid. As a result, by 2019, 8.2 million Senegalese people, equivalent to 52.3% of the population, lived in rural areas — slightly above the 50.4% average for lower-middle-income countries in Africa. Consequently, the urban population stood at 47.6% in 2019, making Senegal the 10th least urbanised country among the lower-middle-income African countries instead of the 11th in 1990.
Urbanisation is concentrated in the coastal zone, especially around Dakar. The Dakar metropolitan area, which serves as the economic and administrative capital, has an urbanisation rate of 98%, leading to almost four million inhabitants. This is mainly due to the over concentration of economic activities in the region as it attracts most investment. Economic activity in the region alone accounts for 55% of GDP and 87% of national tax revenue. Additionally, 80% of all modern businesses and jobs are concentrated in the region. Almost a third (62%) of new businesses opening are in the capital city. The high urbanisation rate in these areas has led to a rise in insecurity and environmental risks such as pollution, flooding and erosion in the cities. There are also large areas of informal settlements estimated to house about 1.8 million people in the outskirts of Dakar and slums in the cities, particularly in areas such as Pikine, Guédiawaye and Rufisque.
On the Current Path, Senegal will achieve parity in urban–rural settlement by 2025 and by 2043, 16.3 million Senegalese people, constituting almost 57.6% of the population, will live in urban areas. This will be lower than the average of 59.4% projected for lower-middle-income countries in Africa. In the Demographics and Health scenario, the proportion of Senegalese people projected to reside in urban areas will slightly increase to 58.6% by 2043.
Chart 12 presents the infant mortality rate in the Current Path and the Demographics and Health scenario.
The infant mortality rate is the probability of a child born in a specific year dying before reaching the age of one. It measures the child-born survival rate and reflects the social, economic and environmental conditions in which children live, including their healthcare. It is measured as the number of infant deaths per 1 000 live births and is an important marker of the overall quality of the health system in a country.
The infant mortality rate is an important marker of the overall quality of a country’s health system. In 2019, the infant mortality rate in Senegal was 31.5 deaths per 1 000 live births — a drop of more than half of the 72 deaths per 1000 live births in 1990. This was 13 deaths fewer than the average of 43.7 deaths for lower-middle-income countries in Africa. On the Current Path, the infant mortality rate is expected to decline further, reaching 11 deaths per 1 000 live births by 2043, which is 2.8 times less than the average for lower-middle-income countries in Africa.
The Demographics and Health scenario will reduce infant mortality rate in Senegal further to 7.8 deaths per 1 000 births by 2043. This is 3.2 deaths fewer than in the Current Path forecast and almost a quarter of the Current Path average of lower-middle-income countries in Africa. In this scenario, Senegal will achieve the SDG target of 12 deaths per 1 000 live births by 2033 instead of by 2040 as in the Current Path forecast.
Chart 13 presents the demographic dividend in the Current Path and in the Demographics and Health scenario
The dividend is the window of economic growth opportunity that opens when the ratio of working-age persons to dependants increases to 1.7-to-1 and higher.
Demographers typically differentiate between a first, second and even a third demographic dividend. The study focuses on the first dividend. There are different ways to conceptualise the first demographic dividend. For example, studies have shown that a promising demographic window occurs when less than 30% of the population falls within the ages 0–14 years (children), while those above the age of 65 years and above (elderly) make up less than 15%. Alternatively, a demographic dividend opens when a country attains an average median age of between 26 and 41 years. The study uses the ratio of working-age persons to dependants, i.e. the size of the labour force (between 15 and 64 years of age) relative to dependants (children and elderly people).
The demographic dividend is the economic growth generated by change in the population structure. It generally materialises when the ratio of the working-age population to dependants is at least 1.7-to-1, meaning that there are 1.7 workers for every one dependant. When there are fewer dependants to take care of, it frees up resources for investment in both physical and human capital formation. Studies have shown that about one-third of economic growth during the East Asia economic ’miracle’ can be attributed to the large worker bulge and a relatively small number of dependants. However, the growth in the working-age population relative to dependants does not automatically translate into rapid economic growth unless the labour force acquires the needed skills and is absorbed by the labour market. Without sufficient education and employment generation to successfully harness their productive power, the growing labour force (especially those in urban areas) could increasingly become frustrated with the lack of job opportunities leading to social tension and even the emergence of civil instability.
In 2019, the ratio of the working-age population to dependants in Senegal was 1.2-to-1 which means that on average, there were only 1.2 persons of working age (15–64 years of age) for every dependant in Senegal. Although this represents an improvement from the ratio of 1-to-0 in 1990, it is lower than the 1.3-to-1 average for lower-middle-income countries in Africa. On the Current Path, Senegal will achieve the minimum ratio of 1.7 working-age persons for each dependant required for the materialisation of the demographic dividend or demographic gift by 2043.
The Demographics and Health scenario pushes the country above this target such that by 2043, the ratio of the working-age population to dependants is projected to be 1.9-to-1 in the scenario instead of the 1.7-to-1 as in the Current Path and above the average of 1.6-to-1 for the country’s income-group peers in Africa by 2043. Indeed, in this scenario, the minimum ratio of 1.7-to-1 working-age persons for each dependant is achieved as early as 2038.
Increasing the size of the working-age population in Senegal can be a catalyst for growth if they are educated and employment opportunities are generated to successfully harness their productive power. Otherwise, it could turn into a demographic ’bomb’, as many people of working age may remain unemployed and in poverty, potentially creating frustration, social tension and conflict.
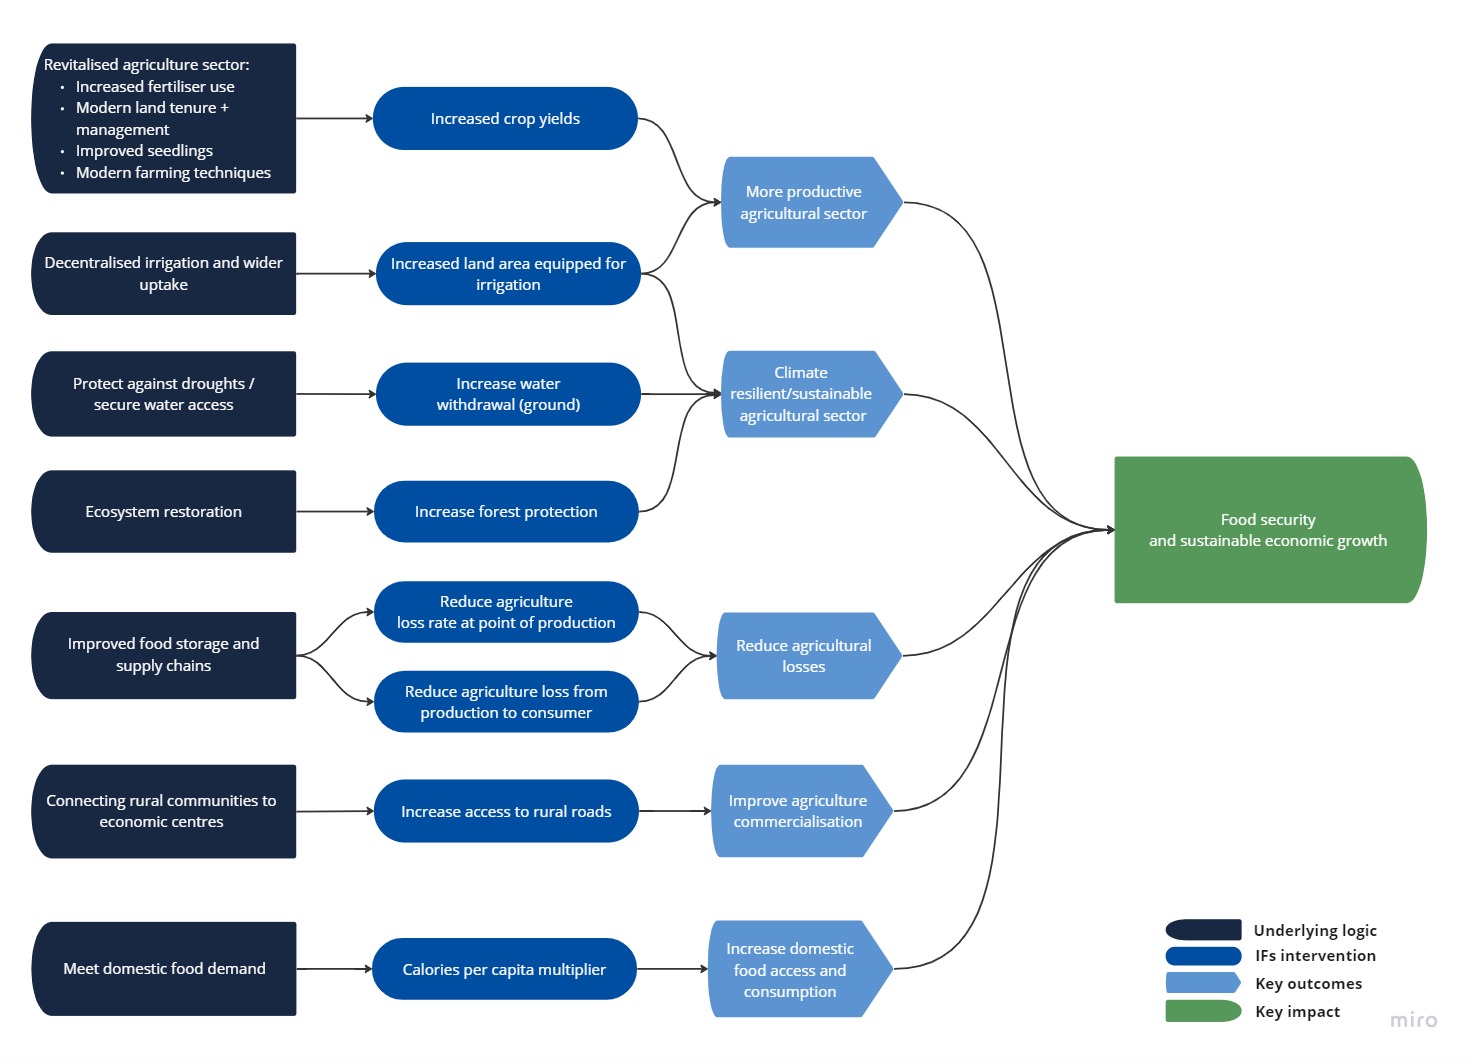
Chart 14 sets out the composition of the Agriculture scenario to advance food security.
The Agriculture scenario represents reasonable but ambitious increases in yields per hectare (reflecting better management and seed and fertiliser technology), increased land equipped and under irrigation and reductions in food loss and waste. We use increased calorie consumption as a proxy for food self-sufficiency above food exports as a desirable policy objective.
The increase in forest protection reflects sustainable land use practices.
Visit the theme on Agriculture for our conceptualisation and details on the scenario structure and interventions.
The agricultural sector is one of the main pillars of the Senegalese economy. More than half of the total labour force in Senegal is employed in the agricultural sector, and about 80% of people in rural areas work in this sector. According to Senegal’s economic growth strategy, agriculture is one of the main factors to reducing poverty and boosting food security in the nation.[2] Rice, peanuts, cotton, fruits, vegetables, sugar cane and gum arabic are some of the agricultural goods grown in Senegal. The country exports cotton, which is a significant agricultural product.
In 1990, Senegal’s average crop yield of 1 metric ton per hectare was 2.4 times lower than the average of 2.4 tons for its income-group peers in Africa. By 2019, the average crop yield per hectare of 3.4 metric tons in Senegal was 52.9% below the average for lower-middle-income countries in Africa. This ranks Senegal 10th lowest among lower-middle-income countries in Africa. On the Current Path, yield per hectare will slightly increase to 3.5 metric tons per hectare by 2043, which is far below the average of 6.4 for its income-group peers in Africa.
Total agriculture production[4] in 1990 stood at about 3.4 million metric tons. Of this, 2.8 million metric tons, representing 82.4%, were crops, with the remainder constituting meat production. By 2019, total agricultural production had grown to 8.8 million metric tons. Of this, crop production constituted 86.7%, equivalent to 7.6 million metric tons, meat production 7.2% and fish production constituted the remainder of the total production. Senegal faces huge agriculture loss and waste estimated at 24% of total production. This is largely due to post-harvest losses of crops estimated at 10% of production and transmission losses of crops estimated at 9.7%. Such losses can be a result of pest and disease infections, spoilage and a lack of adequate and effective storage facilities as well as transportation difficulties.
In terms of demand, the total demand for agricultural products in Senegal, like many African countries, has always been more than the total production. Total demand stood at about 4.2 million metric tons in 1990, of which 3.5 million metric tons, equivalent to 84% of total demand, were for crops. The remaining demand was for meat (425 000 tons) and fish (209 000 tons). Comparing this to the total production (about 3.4 million metric tons) in the same year reveals that Senegal had unmet demand for agricultural products in that year of about 800 000 metric tons. Since then, domestic demand has rapidly outgrown production, and by 2019, agricultural demand exceeded domestic production by almost 3 million metric tons, despite the increase in production. An overwhelming 91.5% of total demand (11.8 million tons) is for crops (10.8 million tons). This is followed by demand for meat (672 000 tons), and the lowest demand is for fish (335 000 tons).
The agricultural sector in Senegal faces numerous challenges that hinder productivity and growth. Senegal is located in the drought-prone Sahel region with erratic rainfall and generally subpar soils. About 90% of agricultural land in Senegal is worked by small-scale, family-based farms engaged in subsistence agriculture and farming systems are mostly rainfed. The majority of producers are smallholder farmers who have limited access to high-quality seeds, fertiliser, machinery, market access, climatic information and financial services, all of which limit their capacity to raise yields and profitability. Limited private sector investment in agricultural and post-harvest operations has also resulted in a shortage of rural infrastructure, including irrigation, post-harvest storage and warehouses, transformation equipment and subpar road conditions.
According to estimates, inadequate infrastructure results in a loss of 20–50% of the production of fruits and vegetables. Constraints to market access include physical infrastructure, as most markets are found along the main, paved roads in the country, limiting access to farmers who live in remote and more isolated areas. Smallholder farmers cannot process, store or distribute products; and processors in Dakar have limited information on the types of crops and quality of production. Beyond these, environmental factors, such as land degradation, affect 34% of the total area, and acidification affects 50% of farmlands in the inner Casamance region, the River Valley, the Sine-Saloum and the Niayes areas. Salinisation affects 9% of degraded lands, mostly in the River Valley.
However, there are efforts to improve agricultural productivity in the country. New initiatives like the Programme d’Accélération de la Cadence de l’Agriculture Sénégalaise (PRACAS) are working in a challenging global context to reach the objective set up by the government to improve the lives and livelihoods of the rural population. In the Senegal River Valley, The Syngenta Foundation for Sustainable Agriculture (SFSA) has been engaged since 2014. The main emphasis of the activity is rice production. The Farmers’ Hub model and the Research Center for Environmental Modeling and Application (CEMA) model contribute to expanding employment options for young people in rural areas. Three Farmers’ Hubs (FHs) were also piloted by SFSA in Senegal in 2017. For agricultural inputs and outputs like tomatoes, onions and chilli seedlings, the FHs offer concentrated commercial units that allow farmers to aggregate products and gain from fairer prices.
On the Current Path, despite the projected increase in domestic production reaching 14.3 million metric tons in 2043, it will not be enough to meet the domestic demand that will rapidly grow to 25.3 million metric tons. As a result, excess demand for agricultural products will reach 10.8 million by 2043. This suggests that Senegal faces the risk of food shortages in the future if drastic measures are not taken to revamp the agricultural sector to increase domestic production. With total agricultural demand outgrowing domestic production, Senegal is likely to depend on imports to meet its domestic consumption. In 2019, Senegal’s net import for crops stood at a whopping 20.7% of total crop demand, which was above the average of 11% for lower-middle-income countries in Africa. Also, net import for meat stood at 3.5% of total fish demand although net exports for meat were estimated at just 73% of total meat demand. In the Current Path forecast, net crop imports will grow rapidly in Senegal to 47.3% of total crop demand by 2043. This suggests a growing level of national food insecurity, which can also result from changes in dietary preferences.
Chart 15 presents import dependence in the Current Path forecast and the Agriculture scenario.
Despite Senegal’s topographical challenges, in the Agriculture scenario, yield per hectare is projected to increase to 5.4 metric tons by 2043 — a 54% improvement, compared to the projections of the Current Path, although it will still be less than the average of 6.4 metric tons per hectare for lower-middle-income countries in Africa. The improvements in yields are expected to lead to an improvement in total agricultural production. By 2043, in the Agriculture scenario, total agricultural production will increase to 17 million tons — almost 2.7 million metric tons or 19% more than the Current Path forecast by 2043. Annual crop production in Senegal will rise by 24% over the Current Path to 14.5 million tons in the Agriculture scenario by 2043.
The projected increases in crop production in the Agriculture scenario reduce the import dependency for crops in the country compared to the Current Path. By 2043, net imports of crops are projected to reach 36.4% in the Agriculture scenario — ten percentage points lower than the Current Path average but slightly above the projection for the average of 34.7% for Senegal’s income-group peers in Africa.
Chart 16 presents the structure of the Education scenario as modelled in IFs. The scenario improves the quantity and quality of education and its relevance to job requirements.
The Education scenario represents reasonable but ambitious improved intake, transition and graduation rates from primary to tertiary levels and better quality of education at primary and secondary levels. It also models substantive progress towards gender parity at all levels, additional vocational training at the secondary school level and increases in the share of science and engineering graduates.
Visit the theme on Education for our conceptualisation and details on the scenario structure and interventions.
The Senegalese educational system is based on the French system. The state is responsible for creating an educational system that gives each citizen access to education. Education in Senegal is free and compulsory until the age of 16. Articles 21 and 22 of the Constitution, ratified in January 2001, guarantee all children access to education. The primary school phase is six years, and the lower and upper secondary levels each last four years.
Senegal, like most African countries, spends a significant proportion of its budget on education. In 2019, the country spent US$1.2 billion, equivalent to 4.2% of GDP, on its education system. At this rate, Senegal’s spending on education was slightly below the average of lower-middle-income countries in Africa. On the Current Path, total expenditure on education in Senegal is projected to reach US$7.1 billion, constituting 5.4% of GDP, by 2043. By this time, Senegal’s spending on education will overtake the average for its income-group peers in Africa.
Given the large annual influx of pupils, a whopping 40% of spending on education in Senegal is on the primary level. This is followed by 35.2% on tertiary level, 18.8% on the upper secondary level and the remainder on the lower secondary. The high expenditure at the tertiary level can be attributed to the high cost of educating a student at that level and growing number of new entrants. On average, it costs US$2 106 to educate a student at the tertiary level. This is almost 4 times what was spent on upper secondary students, 27 times the cost of educating a child at the lower secondary level and 11 times more than the costs of educating a primary level student.
The education system can be viewed as a long funnel, where children enter at the primary level and exit after completing tertiary-level education. However, the education funnel in Senegal, like in many sub-Saharan African countries, is leaky with various cracks along the way. Many children enter the system at the mouth of the funnel, but few complete the entire journey — from primary to secondary school and then university — to eventually graduate with a tertiary or equivalent education at the other end.
Historically, Senegal has struggled with the prospect of developing human capital. The high proportion of youth, coupled with widespread poverty, has left more than 40% of the total population illiterate in recent years.[2] Only 17% of children nationwide attend preschool, with large variations between children in rural and urban areas. Even though the number of children in Senegal who have access to basic education has greatly increased over the past two decades, four out of ten children drop out of primary school.
There has been donor support to improve learning outcomes in Senegal. The Ministry of Education, USAID and UNICEF are partnering to improve children’s foundational reading skills. For instance, USAID provides funding for the national reading programme (Lecture Pour Tous) of the Ministry of Education in the regions of Diourbel, Kaffrine, Kaolack, Louga, Matam and Fatick. This programme aims to enhance children’s fundamental reading skills starting in the earliest learning years. By improving reading instruction, building capacity, boosting processes and increasing the involvement of parents and communities, USAID initiatives are improving reading performance in more than 4 000 schools to help almost half a million primary school students learn how to read.
In 2019, the gross enrolment rate for primary school learners in Senegal was 88.6% — an improvement from 54.7% in 1990 but below the average of 100.4% for lower-middle-income countries in Africa. Comparing this to the net enrolment rate of 76.1% in the same period suggests that a number of children in Senegal who are of school-going age are not in school. Also, many classrooms in Senegal are likely to be crowded by older students. With a net enrolment of 76.1%, the country has the fourth lowest net enrolment rate among the 23 lower-middle-income countries in Africa, only better than Nigeria, Angola and Djibouti. On the Current Path, Senegal’s gross and net enrolment rates are projected to reach 97.6% and 90.6%, respectively, by 2043. At this rate of progress, the country will still lag behind the average of its income-group peers in Africa.
Senegal has the lowest gross primary completion rate among the lower-middle-income countries in Africa. In 2019, its gross primary completion rate stood at almost 56%, indicating that a sizable number of children who enrolled did not complete the last grade of primary school in Senegal. On the Current Path, Senegal’s progress in ensuring more children complete primary school will still lag behind its income-group peers in Africa. By 2043, the primary completion rate in Senegal is expected to rise to 81.3%, and it will still be the lowest among Africa’s lower-middle-income countries at 84.3%. Of those who complete the primary level, it is expected that some will transition immediately to the lower secondary level, some will enrol in the lower secondary level after some years out of school, and some will never enter the lower secondary level and so on through the upper secondary and tertiary levels.
Slightly more students transition from primary level to lower secondary level than they do from lower secondary level to upper secondary level in Senegal. In both cases, the rates are higher than the country’s income-group peers in Africa. Gross enrolment for lower and upper secondary levels in the country stood at 58.9% and 39.1% in 2019, compared to 58.7% and 43.2% in the same period for its income-group peers. By 2043, gross enrolment for the lower secondary level is projected to rise to 79.5%, while that of the upper secondary level will rise to 63.3%. Completion rates drop from 39.6% in the lower secondary phase to 25.5% in the upper secondary phase, indicative of a contraction in the educational funnel in Senegal. Even by 2043, only 63.4% of students are expected to complete their lower secondary education compared to 51.9% at the upper secondary level.
At the tertiary level, the situation is even worse. In 2019, only 12.1% of people within the age group were enrolled in tertiary institutions in Senegal, which is a third of the average rate among the country’s income-group peers. This will only improve to about 26% by 2043 on the Current Path. Worryingly, only 6.1% of the relevant age group in Senegal graduated from a tertiary institution with at least a first degree in 2019. This is below the average of 9.6% for lower-middle-income countries in Africa. On the Current Path, gross tertiary graduation will steadily rise to 16% by 2043, at which time it will catch up with progress within its income-group peers in Africa.
Enrolments in vocational, science and engineering education, which is considered crucial to the future of work, is quite low. In 2019, only 5.4% of upper secondary school students were enrolled in vocational programmes in Senegal. This is less than a quarter of the average for lower-middle-income countries in Africa. At tertiary level, in 2019, 18% of tertiary graduates in Senegal enrolled in science and engineering programmes. This rate is slightly above the average of Senegal’s income-group peers at 16.6%. The majority of Senegalese ethnic groups follow a structured system of apprenticeship, and children begin formal occupational training at the age of five or six.
There is also unequal access to education in terms of gender. Girls have better access to education at preschool and primary levels than young boys, who are typically assigned to the Qur’anic schools or to labour. However, due to gender and school-based violence and discrimination, including early marriage and pregnancy, females transition to higher education at a lesser rate. As a result, there have been efforts to support females in their transition to lower secondary education and work to remove obstacles that prevent both boys and girls from effectively participating in and learning at school, with a focus on preventing violence, reducing opportunity costs, fostering positive social norms and developing gender-sensitive school environments.
In 2019, 114 females were enrolled in primary school for every 100 males in Senegal compared to the almost gender parity in primary enrolment for the average of lower-middle-income countries in Africa. This suggests that unlike most African countries, where access to primary education is limited for females, the reverse is the case in Senegal. At the secondary level also, there were 111 females enrolled in lower secondary schools for every 100 males in Senegal, as opposed to the average of 106 females for every 100 males in lower-middle-income Africa. At the upper secondary level, there are only 103 females for every 100 males in Senegal compared to 99 females to 100 males average for its income-group peers in 2019. However, female enrolment drops at the tertiary level with a ratio of 64 female students for every 100 male students. This is far below the average of 97 female students for every 100 male students for Senegal’s income-group peers on the continent.
Beyond the limited access to education in the country, there are also problems with the quality of education. Most students in the first three grades of school are not learning to read at that level. In 2019, the literacy rate stood at a dismal 53.5%. This has impacted negatively on the academic performance of students. Conflict in southern Senegal has affected enrolment and survival rates in these areas. In addition, despite efforts to build new schools, infrastructure is still lacking and classrooms are frequently overcrowded.[8] In 2019, the average test score for primary students in Senegal stood at 24.8%, which was below the average of 33% for its income-group peers in Africa. The secondary test score for Senegal of 34.6% in 2019 was also below the average of 41.5% of its income-group peers on the continent.
Thus, although Senegal has tried to improve its education system, significant challenges still need to be addressed. These challenges include limited access to education, particularly for males at lower levels and females at higher levels, and low-quality and inadequate resources. These challenges, if not addressed, can reduce the human capital stock in the country and affect the productivity of labour in the country, particularly as the country seeks to benefit from its demographic dividend in the decades to come.
Chart 17 presents mean years of education in the Current Path forecast and the Education scenario for the 15 to 24-year age group.
The average years of education in the adult population aged 15 to 24 is a good first indicator of how the stock of knowledge in society is changing.
In 2019, the mean years of education attained by adults between 15 and 24 years in Senegal stood at 5.5 years — far below the average of 8.5 years for lower-middle-income countries on the continent. On average, males received 0.5 years more schooling than females. On the Current Path, the average Senegalese person between the age of 15 and 24 years is expected to have received 7.7 years of schooling by 2043. This will be 1.6 years less of schooling compared to the average for its income-group peers in Africa. In the Education scenario, Senegal will close this gap as the mean years of adult education rises to 8.4 by 2043. This reduces the gap with its income-group peers to 0.9 years by that period.
The Education scenario further improves average test scores for primary learners to 35.7 in 2043, which is 16% more than in the Current Path forecast, and puts it slightly above the projected average of 34.9% for lower-income countries in Africa in the same year. Likewise, the average test scores for secondary learners in Senegal will increase to 46.2%, which is 15% higher than the Current Path forecast and 11% more than the average for its income-group peers in Africa. It means that the Education scenario has the potential to improve both the quality of education (reflected in the test scores) and literacy rate in Senegal.
Chart 18 presents the structure of the Manufacturing scenario as modelled in IFs.
The Manufacturing scenario represents reasonable but ambitious manufacturing growth through greater investment in the manufacturing sector, in research and development (R&D) as well as improvement in government regulation of businesses. It increases total labour participation rates with a larger increase in female participation rates where appropriate. It is accompanied by increased welfare transfers (social grants) to unskilled workers to moderate the initial increases in inequality typically associated with a manufacturing transition.
Visit the theme on Manufacturing for our conceptualisation and details on the scenario structure and interventions. Chart 18 presents a summary chart that sets out the composition of the scenario.
The manufacturing sector is crucial for the productive transformation of a country’s economy towards sustained high growth, employment creation and improved prosperity. It has backwards and forwards linkages with other sectors, such as the agriculture and service sectors. Senegal has established itself as an emerging industrial centre in West Africa thanks to its consistent growth in manufacturing over the past few years. The sector consists of low-end manufactured goods, such as food processing and handcraft. Senegal is home to a variety of industrial facilities, including flour mills, a textile plant, a sugar refinery, a tobacco factory, a brewery, a navy shipyard, chemical plants and an automobile assembly facility.
Over the years, the government of Senegal has implemented various strategies and policies to promote industrialisation and attract investments in the manufacturing sector. Its industrialisation policy emphasises economic diversification to reduce over-reliance on imports and generate job opportunities. Industrial parks and special economic zones have been developed by the government to offer manufacturing businesses support services, incentives, and infrastructure. The country’s skilled workforce, growing domestic market, and preferential trade agreements further contribute to its manufacturing potential. The agro-industry has been designated as a priority sector, which includes food processing and beverage production.
However, the sector is constrained in many ways. The industry’s main challenges include the small size of its industrial units, high factor costs, underutilisation of production capacity and limited, expensive access to financing for the private sector, which consists of Senegalese citizens. Also, strategies to decentralise industrial activities in other regions to lessen the oppressive concentration of businesses in and around Dakar have also not been implemented successfully. Other challenges include inadequate infrastructure, access to finance and limited technological capabilities.
The major contributor to GDP in Senegal is the service sector. In 2019, the service sector contributed US$16.7 billion to the economy, equivalent to 56.3% of GDP. This is followed by the contribution of the manufacturing sector valued at US$6.4 billion, equivalent to about 21.5% of GDP. The agricultural sector contributed US$4.3 billion, representing 14.6% of GDP in 2019. In the same period, the ICT sector contributed US$1.5 billion, constituting 5.2% of GDP, while the contributions of the materials and energy sectors were valued at US$698.1 million (2.4% of GDP) and US$3237 million (0.1% of GDP), respectively.
On the Current Path, the service sector will extend its dominance in the economy with its contribution to GDP expected to increase more than fivefold in size to US$81.9 billion by 2043 (62.3% of GDP). By 2043, the manufacturing sector will continue to be the second largest contributor and will be valued at US$31.5 billion (23.9% of GDP). The ICT sector will overtake agriculture as the third largest contributor to GDP with its contribution valued at US$8.2 billion equivalent to 6.2% of GDP.
At this rate, ICT’s contribution to GDP will be about three percentage points more than agriculture at US$5.5 billion. The remarkable performance of the ICT sector in Senegal can be an opportunity for the country to leapfrog and advance in digitalisation and innovation provided there is adequate electricity access. By 2043, the material and energy sectors’ contributions will be valued at US$4.7 billion and US$114.4 million, corresponding to 3.6% and 0.9% of GDP, respectively.
Typically when countries embark on a manufacturing transition, inequality and poverty may initially increase. This is because resources and investments are diverted to more capital and knowledge-intensive sectors, which leads to an initial crunch in consumption. However, in the long term, these efforts stimulate inclusive growth with a greater impact on poverty and inequality reduction. Policies aimed at industrialisation, therefore, need to be accompanied by measures to mitigate these initial adverse effects. These could include efforts to directly support extremely poor families through social programmes or welfare spending to cushion vulnerable people.
Senegal has implemented a number of safety net programmes for the poorest households, including free meals at school, food aid, care for the elderly and those with disabilities, and cash transfers for the persistently poor. For instance, in 2014, the International Development Association (IDA), the World Bank Group’s fund for the poorest people, approved a US$40.5 million credit to support the government in establishing a national social safety net system. The programme aimed to improve the livelihoods of poor farmers in Senegal through increased and more efficient investment in their farms. All of these initiatives aimed to make life better for low-income families, encourage them to invest in their human resources and shield them against shocks. But until recently, these initiatives had a narrow focus and were not always successful in focusing on the most vulnerable people. The government also disbursed emergency cash transfers to more than half a million households to ameliorate the impacts of the COVID-19 pandemic and Russia’s invasion of Ukraine.
Despite these efforts, welfare transfers in Senegal are low compared to its income-group peers on the continent. In 2019, the total welfare transfers to households in Senegal amounted to 4.5% of GDP, which was 2.5% lower than average rates in lower-middle-income African countries. On the Current Path, government welfare transfers to households will increase to about 6.5% of GDP. Despite this increase, it will still be below the projected average of 7% of GDP of Senegal’s income-group peers in Africa.
Chart 19 presents the contribution of the manufacturing sector to GDP in the Current Path and in the Manufacturing scenario. The IFs platform uses data from the Global Trade and Analysis Project (GTAP) to classify economic activity into six sectors: agriculture, energy, materials (including mining), manufacturing, services and information and communication technologies (ICT). Most other sources use a threefold distinction between only agriculture, industry and services, with the result that data may differ.
In the Manufacturing scenario, Senegal makes substantial progress on industrialisation such that, by 2043, the share of the manufacturing sector in GDP is about 27.2% (US$41.1 billion), about 3.4 percentage points of GDP above the Current Path forecast and equivalent to an extra US$9.6 billion.
However, industrialisation is a difficult and long-term process. It requires constructive relationships between the private sector and the state, which encourages and supports them. Firms need a state with strong capabilities in setting an overall economic vision and strategy, efficiently providing supportive infrastructure and services, maintaining a regulatory environment conducive to entrepreneurial activity, and making it easier to acquire new technology and enter new economic activities and markets.
Chart 20 presents the structure of the AfCFTA scenario as modelled in IFs. The AfCFTA scenario represents the impact of fully implementing the continental free trade agreement by 2034. The scenario increases exports in manufacturing, agriculture, services, ICT, materials and energy. It also includes an improvement in multifactor productivity growth emanating from trade and a reduction in tariffs for all sectors.
Visit the theme on AfCFTA for our conceptualisation and details on the scenario structure and interventions.
Trade has been a vital component of Senegal’s economy contributing to its growth and development. The country’s trade policies aim to reduce the trade deficit, ensure regular supplies to the domestic market, promote local value chains, strengthen regional integration and access international markets. Senegal’s ratification of regional and international trade agreements has further facilitated its trade integration and provided opportunities for market access. Senegal is a part of many regional trade accords, including the Economic Community of West African States (ECOWAS) and the West African Economic and Monetary Union (WAEMU), which have promoted trade integration within the region of West Africa.
Additionally, Senegal has actively participated in fostering commerce with foreign partners through bilateral and multilateral agreements. It has ratified trade agreements with several advanced countries, including the EU, US, Switzerland, South Korea, Japan and Australia. Furthermore, Senegal’s exports to China have increased, making China an even more vital partner. However, limited and unstable electricity access coupled with the high transportation cost and customs clearance fees are some factors that hinder trade and economic integration in the country.
Historically, Senegal’s economy is less open[5] to trade compared to its income-group peers in Africa. In 1990, the sum of Senegal’s exports and imports stood at 44.8% of GDP, which was below the average of 48.1% for low-income countries in Africa. However, from 2012, this trend reversed so that by 2019, trade openness in Senegal jumped to 62.8% of GDP — far above the 49.9% average for lower-middle-income countries on the continent.
In 1990, the total export value in Senegal stood at US$1.7 billion, constituting 17.1% of GDP, which was below the average of 24% for its income-group peers. Since then, exports from Senegal have grown rapidly. By 2019, Senegal’s exports stood at US$7.2 billion, equivalent to 24.3% of GDP, overtaking the average of 22.8% for lower-middle-income African countries. The agricultural sector has traditionally been a significant contributor to the country’s export earnings, but recent efforts to diversify into new sectors have been successful. It exports commodities such as fish, horticultural goods and peanuts.
The country has also seen the rise of new export industries, such as textiles, ready-made clothing and chemicals, as a result of government initiatives to draw in outside capital and advance industrialisation. Other exports including cement, gold, phosphates and nut oil are among Senegal’s main exports. About 21% of all Senegalese exports are destined for Mali, 14.4% for Switzerland, 9.8% for India, 6.7% for China and 4.2% for Côte d’Ivoire. On the Current Path, total exports from Senegal are projected to reach 24.1% of GDP, equivalent to US$31.8 billion, in 2043 — slightly exceeding the 23.5% average of the country’s income-group peers in Africa.
Regarding imports, Senegal’s total imports grew from US$2.8 billion, equivalent to 27.7% of GDP, in 1990 to US$11.4 billion, representing 38.5% of GDP, in 2019. At that rate, Senegal’s total imports as a proportion of GDP was higher than the estimated 27.1% average for lower-middle-income African countries in the same year. The country imports large volumes of refined petroleum, rice, cars, crude petroleum and packaged medicaments. Imports from France account for 11.4% of total imports into the country, followed by imports from China (accounting for 9.7% of total imports), India (7.1% of total imports), Russia (5.7% of total imports) and Nigeria (5.4% of total imports). On the Current Path, Senegal’s total imports are projected to reach US$45.2 billion, equivalent to 34.3% of GDP.
Like most African countries, Senegal imports large volumes of mostly finished or processed goods. Its export quantities are small, and most of it is raw materials, with little or no value addition occurring within the country. This results in low export revenues and higher import expenditures. The country’s trade deficit in 2019 constituted 14.2% of GDP, which was above the average of 4.3% for lower-middle-income African countries.
Chart 21 compares the trade balance in the Current Path forecast with the AfCFTA scenario.
In the AfCFTA scenario, the sum of Senegal’s exports and imports as a percentage of GDP will reach 77.2% by 2043. This will be about 19 percentage points above the Current Path and 25.6 percentage points more than the Current Path average for its income-group peers.
Throughout the forecast period, the AfCFTA scenario leads to a faster improvement in Senegal’s trade balance than the Current Path forecast. By 2043, Senegal’s trade deficit in the Current Path will constitute about 10.2% of GDP, whereas, in the same year, the AfCFTA scenario will mitigate this situation leading to a slightly lower deficit of 9.2% of GDP — but far higher than the average for its income-group peers in Africa. Exports as a value of GDP can increase to 34% of GDP in 2043, stating the benefit of the full implementation of the AfCFTA. These figures suggest that Senegal stands to benefit from the full implementation of the AfCFTA, which will improve competitiveness, particularly in growing the country’s manufacturing sector.
Chart 22 presents the structure of the Large Infrastructure and Leapfrogging scenario as modelled in IFs.
The Large Infrastructure and Leapfrogging scenario represents a reasonable but ambitious investment in road infrastructure, renewable energy technologies and improved access to electricity in urban and rural areas. The scenario includes accelerated access to mobile and fixed broadband and the adoption of modern technology that improves government efficiency and allows for the more rapid formalisation of the informal sector. A final intervention emulates investments in large infrastructure such as rail, port and airports.
Visit the themes on Large Infrastructure and Leapfrogging for our conceptualisation and details on the scenario structure and interventions. Chart 24 presents a summary chart that sets out the composition of the scenario.
Modern infrastructure can improve productivity, augment healthy lifestyles, boost educational outcomes and facilitate government effectiveness. The study focuses on both physical and digital infrastructure, including roads, electricity access and ICT. Physical infrastructure, such as roads and railways, is a critical driver of economic growth and an important component of development. It facilitates the movement of people, goods and services, promotes intra-country trade and serves as an enabler of social service provision such as education and health.
Senegal has developed its infrastructure significantly in recent years, particularly in the areas of transportation, telecommunications, electricity and water delivery systems. There have been efforts to improve road networks in the country. The Dakar–Diamniadio Toll Highway and the Dakar–Touba Highway, as well as the construction of a toll highway and other interdepartmental highways, have all improved traffic flow. The construction of road networks in six communes has also received funding from the African Development Bank. In 2019, the total length of roads in Senegal was estimated to be 15 324 km of which only 5 516 km, equivalent to 36.6% . This was higher than the average of 31.4% for lower-middle-income countries in Africa. Most of the roads are concentrated in urban areas, particularly Dakar. On the Current Path, by 2043, the total road network in Senegal will increase to 35 090 km, of which 21 494 km, equivalent to 61.3%, will be paved. By this time, paved roads as a percentage of total roads in Senegal will, however, be lower than the average of 61.9% for the country’s income-group peers in Africa.
In 2019, 70.4% of Senegalese people had access to electricity — slightly above the average of 68.3% for lower-middle-income countries in Africa. Consistent with the trend in most African countries, in 2019, an overwhelming 95.2% of urban dwellers had access to electricity compared to 47.8% of rural dwellers. This depicts a locational disparity in favour of urban areas.
The nation has made investments in green energy initiatives, including the Taiba N'Diaye Wind Farm and the increase of rural communities’ access to electricity through the Rural Electrification Agency. On the Current Path, access to electricity is projected to reach 89.4% of the population by 2043, which is above the average of 81.7% for Senegal’s income-group peers. The disparity in electricity access in favour of urban residents will continue as all urban residents will have access to electricity by 2038 compared to 75.3% of rural residents by 2043. Also, electricity transmission and distribution loss in Senegal stands at about 11.7% of all electricity produced meaning that nearly 12% of all electricity produced is lost during transmission and distribution. On the Current Path, this is expected to remain, with no effort to avert these losses.
Aside from physical infrastructure, technological advancement is essential for economic growth. Technology improves productivity and reduces the transaction costs and bottlenecks associated with doing business. Senegal’s communications infrastructure has seen substantial advancements. Rapid growth in mobile phone networks, increasing accessibility to Internet services and adoption of 4G technology to increase Internet connectivity speeds have all taken place in recent times.
However, Senegal’s progress in fixed broadband access, like many other African countries, has lagged. In 2019, the total number of fixed broadband subscriptions in Senegal was estimated at about 1.4 per 100 people. This is less than half the average of 3.3 per 100 people for lower-middle-income countries in Africa. In the Current Path forecast, Senegal will progress in the use of fixed broadband and will be quicker than its income-group peers in Africa. By 2043, fixed broadband subscriptions will rise to 41.6 per 100 people, which is above the average of 28 subscriptions per 100 people for lower-middle-income African economies.
In contrast, mobile broadband subscription in Senegal performs better. In 2019, Senegal had a mobile broadband subscription rate of 31.6 per 100 people, though below the average of 46.5 for lower-middle-income countries on the continent. On the Current Path, mobile broadband subscriptions will rise to 152 per 100 people which is 5.2% higher than the average of its income-group peers. In terms of Internet usage, 40% of Senegalese people had access to the Internet in 2019, which is almost on par with the average for its income-group peers in Africa. On the Current Path, Senegal’s progress is projected to lag behind its income-group peers such that by 2043, the proportion of people with access to the Internet in Senegal will be 27.2% below the average for its income-group peers in Africa at 29.4%.
Chart 23 presents cook stove usage in the Current Path and the Large Infrastructure and Leapfrogging scenario.
The IFs model distinguishes between three types of cookstoves: traditional, improved and modern. In 2019, 48.3% of households in Senegal used traditional stoves such as firewood, charcoal for cooking, while 50.8% used modern stoves for cooking. Only a negligible 1% of the population used improved cookstoves. This is disproportionately low considering the current access rate in the country. A similar trend is observed in most lower-middle-income countries in Africa with 48.5% of people using traditional cookstoves and 47.7% using modern fuel for cooking. The usage of traditional stoves for cooking contributes to pollution and carbon emissions, and negatively impacts the health of these households. However, as access to electricity in urban and rural areas increases, more households will likely switch from traditional cookstoves to improved and modern fuel stoves, such as electric and gas cookers.
Based on the Infrastructure scenario, it is expected that 96.7% of Senegalese people will have access to electricity by 2043, compared to 89.4% in the Current Path forecast. Also, all Senegalese people living in urban areas will have access to electricity in the scenario and the proportion of people with access to electricity in rural areas will improve to 92.2% in the scenario instead of to only 75.3% as in the Current Path.
Consequently, only 13.8% of households will use traditional stoves compared to 17.9% in the Current Path forecast by 2043. As a result, 86% of households in Senegal are expected to use modern fuel for cooking in the Infrastructure scenario. This is above the average of the country’s income-peers at 71.3%, compared to 81.6% in the Current Path forecast by 2043. The high usage of modern fuel for cooking reflects the improvement in the electricity access rate, particularly to rural areas in the scenario. Clearly, this will reduce health-related diseases and carbon emissions arising from the use of traditional cookstoves in the country.
Chart 24 presents access to mobile and fixed broadband in the Current Path and the Large Infrastructure and Leapfrogging scenario.
The Infrastructure scenario will lead to a larger increase in fixed broadband access, so that, by 2043, subscriptions will likely be at 50 per 100 people compared to 40.2 subscriptions on the Current Path, and above the average of 28.2 for lower-middle-income African countries. Due to the high performance in improving access to mobile broadband in the country, in the Current Path forecast, reaching 153 subscriptions by 2043, the Infrastructure scenario has only a marginal impact. In the Infrastructure scenario, the subscription rate will reach 153.3 subscriptions per 100 people by 2043 — higher than the average of 144.7 for Africa’s lower-middle-income countries.
Chart 25 presents the structure of the Financial Flows scenario as modelled in IFs.
The Financial Flows scenario represents a reasonable but ambitious increase in inward flows of worker remittances, aid to poor countries and an increase in the stock of foreign direct investment (FDI) and additional portfolio investment inflows. We reduce outward financial flows to emulate a reduction in illicit financial outflows.
Visit the theme on Financial Flows for our conceptualisation and details on the scenario structure and interventions. Chart 25 presents a summary chart that sets out the composition of the scenario.
FDI can act as a catalyst for economic development as it brings much-needed capital and technology to recipient countries. Senegal offers a stable political environment, a favourable geographic position and strong institutions with growing opportunities for foreign investment. The Senegalese government welcomes foreign investment and has prioritised efforts to improve the business climate.
FDI inflows to Senegal are historically low. In 1990, the total FDI inflow to Senegal was equivalent to a paltry 0.8% of GDP, though slightly higher than the average for lower-middle-income countries in Africa. By 2019, FDI inflows to Senegal reached 4.6% of GDP, which was above the average of 1.3% of GDP for the country’s African income-group peers. On the Current Path, FDI inflows to Senegal are expected to marginally decline to 3.1%, below the Current Path average of 3.5% for lower-middle-income countries on the continent by 2043.
Many countries in sub-Saharan Africa like Senegal are still dependent on foreign aid to provide basic services such as education and healthcare. Historically, foreign aid to Senegal has been relatively high compared to the average of its income-group peers in Africa. In 1990, the total aid received by Senegal constituted 11.5% of GDP, which was more than twice the average of 5.7% received by lower-middle-income African countries in the same period. By 2019, total aid as a percentage of GDP in the country had dropped to 5.1%, equivalent to US$1.5 billion. This was more than three times the average of 1.6% for lower-middle-income countries in Africa. On the Current Path, foreign aid is projected to decline to constitute 1.5% of GDP. The absolute value will increase to almost US$2. billion, which is higher than the average of 0.6% of GDP for its peers in Africa.
In 2019, Senegal received US$2.2 billion in remittances, equivalent to 7.4% of GDP above the average of 4.1% for lower-middle-income African countries. This represents a tremendous increase from the US$68.7 million, representing 0.7% of GDP, that the country received in 1990. The high remittances inflow in Senegal indicates that there are more Senegalese migrants than of income-group peers or that Senegalese migrants sent relatively higher remittances home than those from other lower-middle-income countries. On the Current Path, remittances to Senegal are expected to increase to US$7.9 billion (6% of GDP). This is almost four times the average of 1.5% of GDP projected for lower-middle-income countries.
Chart 26 presents government revenues in the Current Path and Financial Flows scenario.
Wagner’s law, or the law of increasing state activity, is the observation that public expenditure increases as national income rises. It is, therefore, reasonable to expect that government revenues will increase as a per cent of GDP in the Financial Flows scenario compared to the Current Path forecast.
Higher external inflows in the form of FDI, aid and remittances have increased government revenue. For instance, increased FDI means higher GDP growth which in turn increases revenues accrued to the government through corporate and income taxes, royalties and indirectly through value-added tax. In 2019, the government’s total revenue in Senegal amounted to US$7.4 billion, equivalent to 25% of GDP. This amount was higher than the average of its income-group peers in Africa at 21.2%.
Similarly, Senegal’s revenue without aid, estimated at 19.9% of GDP, is slightly above the average of 19.6% for low-income countries in Africa. In the External Financial Flows scenario, government revenue is projected to rise to US$34.8 billion in 2043, representing 25.2% of GDP. This amount is above the average of 23.4% for low-income countries in Africa in the same year. Compared to the Current Path, the External Financial Flows scenario can improve government revenue in Senegal by an extra US$1.9 billion by 2043.
Chart 27 presents a summary chart that sets out the composition of the Governance scenario as modelled in IFs. Thinking of governance in terms of security, capacity and inclusion provides a useful lens to compare how countries have progressed over time, as well as the state of governance between countries and groups of countries.
Visit the theme on Governance for a full conceptualisation and details on the scenario structure and interventions.
In brief, the stability dimension uses data from the Political Instability Task Force on:
- the probability and magnitude of state failure/internal war,
- the probability and magnitude of abrupt regime change, and
- social violence consisting of reductions in conflict and terror and police conflict.
Capacity is enhanced by improving the quality of government regulation, government effectiveness (both from the Worldwide Governance Indicators) and reductions in corruption using data from Transparency International.
Inclusion improves as a result of:
- an improvement in levels of democracy using the Polity IV index applied to those countries that evidence a democratic deficit,
- an improvement in gender empowerment using the gender empowerment measure (GEM) from the United Nations Development Programme (UNDP), and
- more economic freedom (using the associated index from the Fraser Institute).
These IFs indices compare well with the results from others, although IFs adopt a more structural/long-term approach. For example, the Worldwide Governance Indicators published by the World Bank measures six dimensions of governance, many of which overlap with the three IFs indices. These are: voice and accountability; political stability and absence of violence/terrorism; government effectiveness; regulatory quality; rule of law; and control of corruption.
Stability and better governance are generally prerequisites for other aspects of development as they ensure accountability, efficient allocation and distribution of state resources and encourage inflows of foreign direct investment (FDI). To emulate the sequential evolution of governance over time, IFs draw on the establishment of nation-states in the Westphalian tradition that first created a security community (through internal oppression and war with others), built capacity (largely through the collection of taxes and the establishment of a coercive social contract) and then, in time, became more inclusive and eventually, democratic. Traditionally, these transitions occurred sequentially with progress in one dimension providing a basis for the next.
The process of externally imposed state formation during colonialism in Africa did not follow this process. The result was that many African countries do not comprise a security community and have limited capacity. Yet, they are required to democratise without the fundamentals of sufficient security and capacity being in place. The composite ’governance triangle’ in IFs measures a state’s progress using the average of these three indices. To this end, it includes an index (0 to 1) for each dimension, with higher scores indicating improved outcomes.
Being one of the most stable countries in Africa, Senegal’s performance on the governance security index is marginally better than that of its peers on the continent. Its score of 0.75 for 2019 was 4.3% above the average of 0.72 for lower-middle-income countries in Africa. However, since last year Senegal has been experiencing political tension and some form of instability associated with the decision to postpone its general elections which was initially scheduled for February 2023. Prior to that, clashes between the opposition leader Ousmane Sonko and the police led to the deaths of sixteen people with over hundred other people sustaining injuries in June 2023. This was after the sentencing of Mr Sonko for corrupting the youth. In February 2024, protest over delayed elections caused the death of three people with several others injured. These unfortunated recent developments coupled with terrorist groups’ activities in neighbouring countries and cross-border trafficking may fuel the risk of instability in Senegal. On the Current Path, it is projected that Senegal’s score on the governance security index will reach 0.82, which is well above the average of 0.76 for lower-middle-income African countries by 2043.
Regarding governance capacity, Senegal’s score in 2019 of 0.45 was about 29% higher than the average of lower-middle-income African countries. By 2043, the country’s score of 0.49 on the governance capacity score will be 20% higher than its income-group peers in Africa. This is reflected in its government revenue as a percentage of GDP (without aid), which was slightly ahead of that of Senegal’s income-group peers in Africa. Similarly, the country’s performance on the World Bank government effectiveness index is better than its peers. Its score of 1.4 in 2019 ranks Senegal 11th rank out of the 23 low-income countries and above the group average. Moreover, Senegal is among the ten least corrupt countries in Africa. Its socre of 43 on the 2023 Transparency International Corruption Perception Index is the eight highest in Africa and only behind Cabo Verde in the West African region.
Just like the security and capacity index, Senegal’s performance on the Governance Inclusion Index is higher than its income-group peers in Africa. In 2019, Senegal scored 0.56 on the inclusion index, about 17% above its income-group peers on the continent at 0.48. This is not surprising given that the country has experienced three peaceful political transitions since independence in 1960. President Macky Sall has been in power since 2012 and was elected to a second five-year term in February 2019. However, the decision to postpone its February 2024 general elections has dented its imagine at the beacon of democracy in West Africa. There are now fears as to whether the country can consolidate its democratic gains. On the Current Path, Senegal will progress slowly so that by 2043, the country’s score on governance inclusion of 0.59 will be 16.3% above the average of 0.51 for lower-middle-income countries in Africa.
Chart 28 presents progress with the three governance dimensions by 2043 in the Current Path and Governance scenario compared to 2019.
In the Governance scenario, Senegal’s score on the governance security index will improve to 0.84, which is 3.1% above the Current Path forecast by 2043 and about 10.8% above the Current Path average of lower-middle-income African countries in the same year. Governance capacity is also expected to also improve in the Governance scenario, with its score increasing to 0.54 by 2043, constituting a 10.6% improvement above the Current Path forecast and 31.7% above the average of its income-group peers on the continent. Regarding inclusion, the Governance scenario will improve Senegal’s score on the Governance Inclusion Index by 12.8% above the Current Path forecast, reaching 0.67 by 2043. In the scenario, Senegal’s score is 31.2% higher than the average of lower-middle-income countries in Africa in 2043.
Chart 29 presents a stacked area graph on the contribution of each scenario to GDP per capita. The cumulative impact of better education, health, infrastructure, leapfrogging, etc. means an additional benefit in the integrated IFs forecasting platform that we refer to as the synergistic effect.
By 2043, the scenarios with the greatest impact on GDP per capita in Senegal will be the AfCFTA scenario, followed by the Manufacturing scenario and Governance scenario. In the AfCFTA scenario, Senegal’s GDP per capita (PPP) will increase to US$8 016 by 2043, which represents an increase of US$777.2 (or 10.7%) compared to the projections on the Current Path in 2043. It means that Senegal has considerable potential to increase its GDP per capita if it takes advantage of the full implementation of trade agreements. The high impact of the Free Trade scenario in improving the standard of living in Senegal is not surprising, given that trade between African countries has considerable benefits. A regional free trade area such as AfCFTA increases trade openness, accelerating technology diffusions in the country and thereby improving productivity and innovation activities. This ultimately leads to welfare gains as resources flow to their most productive uses and lower consumer prices. It could also increase Senegal’s exports as it provides access to a much larger market and improves the country’s manufacturing sector through competition, which could lead to more rapid economic growth and increased employment in key sectors.
In the Manufacturing scenario, Senegal’s GDP per capita is estimated to increase to US$7 918 by 2043. This is an increase of US$623 or 9.4% compared to the Current Path forecast. Manufacturing is the engine of economic growth according to the economist Nicolas Kaldor (Kaldor’s engine of growth hypothesis). It is historically the largest provider of jobs as it has backward and forward linkages with other sectors and transforms the productivity structures across the economy. It is therefore not surprising that the Manufacturing scenario leads to such an improvement in GDP per capita. Thus, a robust manufacturing sector is crucial to achieve sustained growth and significantly improve the population’s living standard in Senegal.
In the Governance scenario, GDP per capita for Senegal is projected to rise to US$7 846.9 by 2043, representing an 8.4% increase over the Current Path forecast for that year. It means that the Governance scenario can raise GDP per capita in Senegal by an additional US$558 by 2043. Good governance and political stability can inspire investor confidence in the economy and attract more FDI into Senegal, which can lead to growth. Likewise, good governance in the form of adherence to the rule of law, reduced corruption and improved transparency and accountability can lead to more rapid economic growth. As a result, if Senegal can retain its peace and security and promote good governance, it will catalyse the country on the path of sustained economic growth.
Chart 30 presents the impact of each scenario on extreme poverty by 2043. The user can select the number of extremely poor people or per cent of the population.
The Manufacturing scenario has the greatest potential to reduce extreme poverty in Senegal. In the scenario, the number of poor people is projected to decline to 5.1 million (equivalent to 18% of the population), compared to the Current Path forecast of 6.6 million people (22.8%) by 2043. It means that an aggressive industrialisation that is supported by social protection measures such as welfare transfers has the potential to reduce extreme poverty in Senegal by an additional 1.5 million people.
The Governance scenario has the second largest impact on poverty reduction in Senegal. In the scenario, 5.5 million people are projected to live in extreme poverty by 2043, constituting 19.5% of the population. This will be 3.4 percentage points lower than the Current Path forecast and equivalent to a reduction of about 1.1 million people living in extreme poverty. Certainly, better governance ensures that public resources are utilised in an efficient manner to address the needs of the people instead of being diverted into individual pockets, which will impact poverty reduction significantly.
In the Demographics and Health scenario, 20.2% of the Senegalese population are expected to be living in extreme poverty by 2043, making it the scenario with the third largest impact on poverty reduction. This means that extreme poverty in this scenario will be 3.2 percentage points below the Current Path forecast. The reduction in extreme poverty in this scenario follows from the decline in the fertility rates and Senegal’s smaller population as well as increased infant survival and better healthcare access compared with its Current Path forecast. As the population size declines, the benefit to the economy increases, which ultimately reduces extreme poverty.
Chart 30 presents the impact of each scenario on extreme poverty by 2043. The user can select the number of extremely poor people or per cent of the population.
In the Combined Agenda 2063 scenario, both the number and proportion of poor people in Senegal will significantly decline. By 2043, about 863 000 people in the country will be living in extreme poverty, representing only 3.2% of the population. This means that, compared to the Current Path forecast, 5.6 million more people could be lifted out of poverty by 2043 in this scenario. This is equivalent to a decline of 20.2 percentage points compared to the Current Path forecast of 23.4% in 2043. In addition, the projected proportion of poor people in Senegal in the Combined Agenda 2063 scenario will be 35 percentage points below the average (38.3%) for lower-middle-income African countries by 2043.
Chart 31 compares the size of the economy in the Current Path with the Combined Agenda 2063 scenario at market exchange rates (MER).
The Combined Agenda 2063 scenario consists of the combination of all eight sectoral scenarios, namely Governance, Demographics and Health, Education, Infrastructure/Leapfrogging, Agriculture, Manufacturing and Leapfrogging, AfCFTA and Financial Flows.
Senegal’s GDP is projected to rise to US$245.6 billion in the Combined Agenda 2063 scenario, representing an increase of 729% from 2019 to 2043. This will exceed the Current Path forecast of US$132 billion, meaning that the Combined Agenda 2063 scenario will increase the size of the economy by an additional US$113.7 billion by 2043 — an increase of 86% compared with the Current Path forecast.
Similarly, in the Combined Agenda 2063 scenario, the GDP per capita of Senegal is estimated to increase to US$12 502 by 2043. This will be US$5 263, or 73%, more than the projection of US$7 239 in the Current Path forecast, meaning that the materialisation of the Combined Agenda 2063 scenario could significantly improve the living standard of the Senegalese population. The projected GDP per capita in this scenario will be US$3 600, or 40.4%, more than the Current Path forecast average for lower-middle-income countries in Africa by 2043. The massive economic growth projected in the Combined Agenda 2063 scenario indicates that an integrated development push across all development sectors is the best way to achieve sustained inclusive growth and development in Senegal.
Chart 32 presents the change in the economy’s structure, comparing the Current Path forecast with the Combined Agenda 2063 scenario from 2019 to 2043.
The IFs platform uses data from GTAP to classify economic activity into six sectors: agriculture, energy, materials (including mining), manufacturing, services and information and communication technologies (ICT). Most other sources use a threefold distinction between only agriculture, industry and services, with the result that data may differ.
By 2043, the service sector will still be the largest contributor to GDP at 63.4% (valued at US$155.7 billion), slightly above the Current Path forecast of 62.1% (valued at US$81.9 billion). The manufacturing sector will continue to be the second largest contributor to GDP in the scenario by 2043 with a share of 23.5% (equivalent to US$57.6 billion), although still below the Current Path forecast of 23.9% (US$31.5 billion). The share of the agricultural sector will marginally decline to 3.5% (valued at US$8.6 billion) in the Combined Agenda 2063 scenario compared to 4.2% (valued at US$5.5 billion) in the Current Path in 2043. In the Combined Agenda 2063 scenario, the share of the ICT and materials sectors will rise above the Current Path to constitute 6.4% and 3.6%, respectively, although the share of the energy sector will decline below the Current Path to 0.7%.
Chart 33 presents the size of the informal sector as a share of GDP and size of the informal labour force. Data on the contribution of the informal sector is often estimated and should be treated with care.
By 2043, the size of the informal sector in Senegal will decline to 17.2% of GDP although its absolute value will rise to US$42.2 billion. At this rate, the contribution of the informal economy will be lower than the projected 26.1% (valued at US$34.4 billion) on the Current Path and below the average of lower-middle-income countries in Africa at 26.1%. Likewise, the size of the informal labour force in Senegal will decline. By 2043, there will be about 1.7 million fewer people working in the informal sector in the Combined Agenda 2063 scenario compared to the Current Path. This will correspond to informal labour constituting 27.1% of total labour in the Combined Agenda 2063 scenario instead of 46.5% in the Current Path, reflecting the anticipated improvement in state capacity through more tax revenue.
Chart 34 compares life expectancy in the Current Path forecast with the Combined Agenda 2063 scenario.
The quality of a nation’s health system can be gauged through indicators such as life expectancy, maternal mortality and infant mortality, among others. Life expectancy measures the average lifespan of individuals in a country. In 2019, the average Senegalese person was expected to live to 67.2 years, which was almost on par with the average of 67.6 years for the country’s income-group peers in Africa. Women in Senegal generally live longer (68.9 years) than men (65.6 years) meaning the average woman in Senegal lives 3.3 years more than men.
On the Current Path, life expectancy will increase to 74.5 years by 2043, which will be slightly higher than the average of 73.1 years for lower-middle-income African countries. In the Combined Agenda 2063 scenario, life expectancy is expected to increase to 76.1 years by 2043, which will be about two years more than the country’s Current Path forecast. In both the Combined Agenda 2063 scenario and the Current Path forecast, women will be expected to live more than four years longer than men by 2043, in line with global trends.
Chart 35 compares the Gini coefficient in the Current Path forecast with the Combined Agenda 2063 scenario.
High levels of income inequality have many negative effects including a breakdown of social structure and cohesion, which can result in instability. The Gini coefficient is the standard measure of the level of inequality in a country.[1] Historically, inequality in Senegal has been lower than the average of its income-group peers in Africa.
In 2019, Senegal’s Gini coefficient was 0.40, compared to the average of 0.50 for the lower-middle-income countries in Africa. This makes the country the seventh least unequal country among the 23 lower-middle-income countries in Africa. On the Current Path, income inequality in Senegal is projected to fall with a Gini coefficient of 0.38 By 2043. In the Combined Agenda 2063 scenario, reduction in inequality in Senegal in the long term will be quicker than the Current Path forecast with a Gini coefficient of 0.34 by 2043. This means that economic growth in the Combined Agenda 2063 scenario will be broadly shared and to the benefit of many.
The Manufacturing scenario has the greatest potential to reduce income inequality in Senegal followed by the Education and Agriculture scenarios. This indicates that the quickest way for the Senegalese authorities to reduce income inequality is through social transfers and investment in the education and agricultural sectors.
Chart 36 compares carbon emissions in the Current Path forecast with the Combined Agenda 2063 scenario.
Since carbon dioxide (CO2), carbon monoxide (CO) and methane (CH4) have different molecular weights, IFs uses carbon. Many other sites and calculations use CO2 equivalent.
Like most African countries, carbon emissions are very low in Senegal, paling in comparison to large emitters in Africa such as South Africa. This is partly due to the country’s underdeveloped manufacturing sector. In 2019, Senegal released about 3.4 million tons of carbon from fossil fuel use, reflecting the low levels of carbon emissions in the country. This makes it the 15th largest emitter of carbon in Africa and 11th largest emitter among the 23 low-income African countries.
Deforestation is a major contributor to carbon emissions in the country. To mitigate this and to advance sustainable land management, Senegal has developed reforestation programmes. Also, to stop desertification and store carbon, the ’Great Green Wall’ effort plans to plant tens of thousands of hectares of trees throughout the Sahel, including Senegal. Senegal’s carbon emissions are also influenced by the transportation industry. The government has been putting policies into place to support environmentally friendly modes of transportation, such as investing in infrastructure for public transportation and promoting the use of electric vehicles.
The government also works with groups like the Global Environment Facility (GEF) and the United Nations Development Programme (UNDP) to carry out climate-related projects and obtain funding for sustainable development efforts.[3] Despite these initiatives, Senegal faces difficulties in lowering its carbon emissions due to population increase, urbanisation and economic development. However, the government’s dedication to sustainable development and renewable energy, together with outside assistance, points to a promising future for the nation’s efforts to combat climate change and reduce carbon emissions.
On the Current Path, carbon emissions from fossil fuels are projected to increase more than fourfold to 13.5 million tons by 2043 from the low base in 2019. The AfCFTA and Manufacturing scenarios are the most carbon-intensive as they involve aggressive manufacturing of low-end manufacturing goods that will imply more fossil fuel use. On the other hand, the Demographics and Health and Education scenarios are the least carbon-intensive scenarios in Senegal.
In the Combined Agenda 2063 scenario, Senegal’s total carbon emissions will rise to 19 million tons, 46.2% more than what is estimated in the Current Path forecast in the same year. The materialisation of the Combined Agenda 2063 scenario and achieving sustainable economic development will come at the cost of more carbon emissions in Senegal although this is relatively slow. However, the country can rely on its huge renewable energy potential to pursue a green development pathway.
Chart 37 compares energy production in the Current Path forecast with the Combined Agenda 2063 scenario in six types, namely oil, gas, coal, hydro, nuclear and other renewables. The data is converted into billion barrels of oil equivalent (BBOE) to allow for comparisons between different sources. Note that energy production could be for domestic use or export.
According to the IFs forecast, the total energy produced in Senegal in 2019 was equivalent to 900 000 BOE. The main source of energy in Senegal is gas, followed by hydro and other renewables. In 2019, the total amount of gas produced in the country amounted to 400 000 BBOE, constituting 44.4% of total energy production. Senegal aims to boost the amount of renewable energy it can produce while reducing its reliance on fossil fuels, especially with its huge potential for producing solar and wind energy. To achieve this, the country has invested in hydroelectric, wind and solar power projects. The ’Plan Senegal Emergent’ aims to achieve 30% of the nation’s energy coming from renewable sources by 2030. To aid businesses offering solar-powered cooling, the government has also developed programmes like ’Scaling Up Renewable Energy (SURE) Senegal.’ The government has also exempted all solar power kits for lighting, water pumps and water heating from customs taxes to promote renewable energy.
By 2043, the total amount of gas produced is projected to almost quadruple to 1.5 million BOE, with its share slightly increasing to 45.5% of total energy production in the Current Path. Hydro production constituted 33.3% (equivalent to 300 000 BOE) of total energy production in 2019 but is projected to rapidly decline to about 9.1% (valued at 300 thousand BOE) in 2043 in the Current Path. This can partly be attributed to the low investment in hydro energy, although its national development indicates so. Other renewable energy production is currently estimated at 22.2% of total production is projected to grow rapidly to constitute 45.5% of total energy production (1.5 million BOE) by 2043 in the Current Path forecast.
In the same period, total energy demand of 28 million was far in excess of its total production. On the Current Path, total energy demand is projected to outgrow production such that by 2043, excess energy demand will be equivalent to 120.7 million BOE. It means that Senegal will rely heavily on importing energy to power its industrialisation agenda if the status quo remains.
In the Combined Agenda 2063 scenario, energy demand in Senegal will jump to 185 million BOE, which will be 60 million BOE more than the Current Path forecast. Although the total energy production of 1.7 million BOE in the Combined Agenda 2063 scenario will be 19.5 million BOE more than the Current Path forecast, it will fall significantly short of the total demand. Indeed, by 2043, the excess demand for energy of 179 million BOE will be 48.3% higher than the Current Path projections.
The share of other renewable energy in total energy production in the country will double to constitute 60% of total energy production to become the leading contributor. This will be 14.5 percentage points more than its contribution to total energy production in the Current Path. The share of gas in total production in the scenario will also be slightly above its contribution to total energy production in the Current Path. Consequently, the contribution of hydro to energy production in the scenario will decline compared to the Current Path by 2043.
The preceding analysis of Senegal's developmental trajectory analysis identifies several key challenges and opportunities that will shape its future economic landscape and societal well-being. Challenges include undiversified exports, high poverty rates, rising public debt, inadequate infrastructure, poor educational quality and school dropout, weak institutions and climatic hazards.
Our investigation into eight sectoral scenarios illustrates the profound impact that targeted policies can have on accelerating development beyond the current baseline. The Manufacturing, Education, and Governance scenarios, in particular, demonstrate robust potential for increasing average incomes, and improving living standards and poverty reduction:
The Manufacturing scenario suggests that strategic investments in this sector could significantly raise GDP per capita. More importantly, it has the greatest potential to reduce extreme poverty, highlighting the critical role of industrial development in economic transformation.
In the Governance scenario, our analysis indicates that enhancing institutional quality and public administration can lead to higher investor confidence and more efficient resource allocation. Improved governance also facilitates equitable growth, crucial for reducing inequalities and fostering inclusive development.
The Education scenario emphasises the long-term benefits of investing in human capital. It projects that improvements in educational access, quality, and relevance to labour market needs are essential for equipping the workforce with the necessary skills to drive economic innovation and competitiveness.
Our exploration of the Combined Agenda 2063 scenario underscores the synergistic effects of simultaneous investments across multiple sectors. This integrated approach could significantly enhance shared growth and prosperity in Senegal, with an 86% increase in GDP compared to the Current Path forecast by 2043. This scenario also suggests a dramatic reduction in poverty, with only 3.2% of the population expected to live in extreme poverty by 2043, demonstrating the profound impact of holistic development strategies.
Senegal can seize several specific opportunities for a sustainable growth path:
- Demographic Dividend: Senegal's young and growing population could be a significant asset if effectively integrated into the economy.
- Regional Integration: Senegal stands to benefit from deeper regional integration through the African Continental Free Trade Area (AfCFTA).
- Renewable Energy Potential: Senegal has considerable potential to develop renewable energy sources, such as solar and wind.
- Technological Advancements: Leveraging technology for digital transformation presents an opportunity to leapfrog traditional phases of development.
- Agricultural Transformation: Modernising agriculture through technology and improved agricultural practices can increase productivity, ensure food security, and reduce rural poverty.
This report recommends that policymakers in Senegal prioritise a holistic development strategy that integrates improvements across the eight sectors, as discussed above. Such an approach not only aligns with the African Union’s Agenda 2063 but also sets a strategic framework for sustainable growth and shared prosperity in Senegal. Commitment from all levels of government and cooperation with international partners will be crucial in transforming these opportunities into tangible outcomes for all Senegalese citizens.
Specifically, policymakers in Senegal should:
- Diversify the economy to reduce vulnerability to international commodity shocks by focusing on and intensifying the production of other cash crops, such as cotton and sugar, for export.
- Address the numerous challenges confronting its booming tourism industry to continue its role as a major foreign exchange earner.
- Ensure proper and effective management of its emerging oil and gas sector and other minerals, especially the accruing revenues, to achieve shared growth and prosperity.
- Reduce population growth rate to advance the opportunity for a demographic dividend through the use of modern contraceptives.
- Focus on youth employment and skills development that can harness the demographic dividend to fuel economic growth.
- Ensure rapid formalisation of informal sector activities to increase government revenue and improve working conditions. This can be achieved by facilitating business registration and regulation, especially among small businesses.
- Create an enabling business environment to attract foreign direct investment, especially in its emerging oil and gas sector.
- Enact and enforce policies to protect the environment against harmful practices, such as land degradation, to ensure sustainable agriculture practices.
- Modernise agriculture by providing and improving storage facilities, fertilisers, seedlings and irrigation facilities to increase agricultural productivity, ensure food security, and reduce rural poverty.
- Leverage the AfCFTA and the ECOWAS trade liberalisation scheme to drive competitiveness, enhance manufacturing, and trade more, especially in the West African region.
- Improve access to finance and reduce the cost of credit to the private sector to make them more competitive.
- Rely on its vast renewable energy sources, particularly wind power, to improve access to electricity, especially in rural communities and contribute to environmental sustainability.
- Reduce the mismatch between education and labour market requirements, by offering more vocational and technical training instead of singularly focusing on academic teaching. Educational institutions should also liaise with businesses to provide apprenticeship and internship programmes as part of the curriculum.
- Enhance the school feeding programme launched during COVID-19 to improve school attendance and enrolment at the basic levels. Likewise, it should provide free uniforms and other learning materials targeting poorer households.
- Address conflict in the southern part of the country to improve educational enrolment in these areas.
- Senegalese authorities should embark on constitutional and institutional reforms that will improve governance in Senegal, especially reforms to strengthen the independence of the judiciary and legislature to effectively check the executive.
- Strengthen and resource anti-corruption institutions to fight corruption, and create an environment that will enable the media and civil society organisations to thrive and protect the country’s enduring democracy.
- Implement digital solutions to enhance service delivery, improve government efficiency, and foster innovation.
Page information
Contact at AFI team is Enoch Randy Aikins
This entry was last updated on 15 June 2026 using IFs v7.84.
Donors and sponsors


Reuse our work
- All visualizations, data, and text produced by African Futures are completely open access under the Creative Commons BY license. You have the permission to use, distribute, and reproduce these in any medium, provided the source and authors are credited.
- The data produced by third parties and made available by African Futures is subject to the license terms from the original third-party authors. We will always indicate the original source of the data in our documentation, so you should always check the license of any such third-party data before use and redistribution.
- All of our charts can be embedded in any site.
Cite this research
Enoch Randy Aikins (2026) Senegal Development Futures. Published online at futures.issafrica.org. Retrieved from https://futures.issafrica.org/geographic/countries/senegal/ [Online Resource] Updated 15 June 2026.