 Tanzania
Feedback welcome
Our aim is to use the best data to inform our analysis. See our Technical page for information on the IFs forecasting platform. We appreciate your help and references for improvements via our feedback form.
The page provides an in-depth analysis of Tanzania's current and projected future development, examining various sectoral scenarios and their potential impacts on the country's growth. It explores the individual and combined impact of eight sectors including demographic, economic, and infrastructure-related outcomes for Tanzania to 2043. The analysis offers insights into policy actions that could enhance Tanzania's developmental trajectory.
Please see the Technical Site for more information about the International Futures (IFs) modelling platform we use to develop the various scenarios.
Charts: Tanzania Tableau Workbook.
Note: The charts presented in each section are hyperlinked to the corresponding visualisations in the Tanzania Tableau Workbook for easy reference and deeper exploration of the underlying data.
Executive Summary
We begin this page with an introductory assessment of the country’s context by looking at current population distribution, social structure, climate and topography.
- Tanzania is situated in East Africa, bordered by eight countries: Kenya and Uganda to the north, Rwanda, Burundi and the Democratic Republic of the Congo (DR Congo) to the west, Zambia, Malawi and Mozambique to the south. The country’s coastline stretches over 1 400 km along the Indian Ocean, providing access to important ports such as Dar es Salaam, which acts as the main maritime gateway for the country and several landlocked neighbours.
- Tanzania’s landscape is strikingly diverse, encompassing a coastal plain, an extensive central plateau, the Great Rift Valley and several highland zones. In the north-east rises Mount Kilimanjaro, Africa’s highest peak. The country also borders three of Africa’s Great Lakes: Lake Victoria, the continent’s largest; Lake Tanganyika, its deepest; and Lake Malawi, shared with Mozambique and Malawi to the south.
- With a total land size of 947 303 km2, the United Republic of Tanzania is the 13th-largest country in Africa, with the 8th-largest economy in terms of GDP and 5th-largest population. However, the country ranks at only 31st when comparing GDP per capita in PPP. According to the World Bank country income classification, Tanzania is a lower-middle-income country (LMIC) with a Gross National Income (GNI) of US$4 120 in 2024.
This section is followed by an analysis of the Current Path for Tanzania, which informs the country’s likely current development trajectory to 2043. It is based on current geopolitical trends and assumes that no major shocks would occur in a ‘business-as-usual’ future.
- Tanzania has one of the youngest and fastest-growing populations in Africa, with a median age of 18.4 and 43% under 15. Fertility is declining slowly, from 4.6 children per woman in 2023 to a projected 3.3 by 2043, meaning growth will continue. The population will rise from 66.5 million in 2023 to 110.5 million by 2043. The working-age share is expanding, but Tanzania is not expected to reach the demographic dividend threshold until after 2050. Realising this potential will depend on sustained investment in education, job creation and healthcare to harness its large youth population productively. Tanzania’s urbanisation remains relatively slow. The urban population rose from 22% in 2000 to just 38% in 2023—still well below the lower-middle-income Africa average of 49.2%. While urbanisation is projected to reach 51% by 2043, this slower-than-average pace constrains the country’s ability to benefit from the economic agglomeration effects typically associated with urban growth. Without more proactive planning and infrastructure investment, urban centres risk becoming overwhelmed by informal growth and inadequate service provision.
- Tanzania’s economy has expanded rapidly, averaging around 6% annual growth over the past two decades. GDP tripled between 2004 and 2023 to US$69.5 billion and is projected to reach US$230.6 billion by 2043, driven by agriculture, services and industry alongside stable macroeconomic management and growing exports. However, Tanzania also has the second-largest informal sector in Africa, accounting for 46% of GDP and 76% of employment in 2023—constraining productivity, fiscal revenues and structural transformation.
- Despite strong economic performance, growth has not translated into equivalent gains in individual incomes, ranking 31st on the continent. GDP per capita remains low at US$2 582 in 2023 and is projected to reach only US$4 306 by 2043, among the lowest in Africa’s lower-middle-income group. To achieve Vision 2050’s ambition of upper-middle-income status, Tanzania must shift from stability-driven to transformation-led growth by diversifying its economy, expanding formal employment and investing in human capital, innovation and climate resilience.
- Poverty remains widespread despite Tanzania’s strong growth trajectory. At the lower-middle-income poverty line of US$3.65, 71% of Tanzanians (47.5 million) lived in poverty in 2023, falling to 37% by 2043, though rapid population growth means the absolute number of poor people will remain high. Using the international extreme poverty line of US$2.15 a day, 40% of Tanzanians—around 26.8 million people—were extremely poor in 2023. On the Current Path, this will decline to 12% (13.2 million) by 2043.
- Tanzania’s national planning evolved from early post-independence socialist strategies to more market-oriented approaches from the 1990s. Vision 2025 marked a strategic pivot, aiming for middle-income status by 2025 through improved governance, economic competitiveness and social development. While Tanzania made steady progress, including GDP growth of 6% over two decades, it did not reach its middle-income target, with poverty reduction and structural transformation falling short. Successive Five-Year Development Plans (FYDPs) supported Vision 2025, with growing emphasis on industrialisation, infrastructure and human capital. Building on this, the draft Vision 2050 sets a more ambitious course towards an inclusive, resilient and upper-middle-income economy by mid-century. The Vision rests on a foundation of good governance, peace, security and stability, emphasising democracy, human rights and social cohesion. Implementation is structured around three pillars: a strong, inclusive and competitive economy, human capabilities and environmental integrity and climate resilience. These are supported by transformative sectors such as logistics, science and technology, research and development and digital transformation, aimed at driving long-term socio-economic transformation.
The next section compares progress on the Current Path with eight sectoral scenarios. These are Demographics and Health; Agriculture; Education; Manufacturing; the African Continental Free Trade Area (AfCFTA); Large Infrastructure and Leapfrogging; Financial Flows; and Governance. Each scenario is benchmarked to present an ambitious but reasonable aspiration in that sector.
- Tanzania has made steady progress in public health, with declining maternal and child mortality rates and increased access to healthcare. However, challenges persist, including a 66% health workforce gap, high fertility and limited access to safe water and sanitation. In the Demographics and Health scenario, stronger investment in health systems, family planning and WaSH services accelerates demographic change and improves survival outcomes. Infant mortality declines to 17.3 deaths per 1 000 live births by 2043, compared to 22.4 on the Current Path, while fertility falls to 2.7 births per woman, down from 3.3. These shifts lower population growth and bring forward Tanzania’s demographic dividend to 2043, seven years earlier than on the Current Path, unlocking the potential for faster, more inclusive growth if accompanied by sufficient job creation and investment in education and human capital.
- The Agriculture scenario models a revitalised and climate-resilient agricultural sector driven by modern farming techniques, wider irrigation uptake and improved supply chains. By 2043, agricultural crop import dependence declines to 13.5%, compared to 25.4% on the Current Path, reflecting stronger domestic production. Increased yields, better water access and reduced post-harvest losses raise productivity and improve rural incomes. Access to rural roads enhances market linkages, while a focus on meeting domestic food demand boosts per capita calorie availability. Forest protection efforts reinforce long-term sustainability. Together, these interventions reduce food insecurity, strengthen climate resilience and support more inclusive, sustainable economic growth.
- Tanzania has achieved near-universal access to primary education, with gross enrolment reaching 98% in 2023. However, quality, equity and progression beyond primary school remain persistent challenges. Transition to lower secondary remains weak—only 35% complete this level, though this is projected to rise to 54% by 2043. Participation in upper-secondary and tertiary education is even more limited, at 9% and 7% respectively in 2023, underscoring the steep drop-off in the education pipeline. The TVET sector has expanded rapidly, enrolling more than half a million students, yet still faces low coverage, fragmented oversight and poor alignment with labour market needs. The Education scenario models ambitious but achievable improvements in access, completion and learning outcomes across all levels, alongside progress towards gender parity and strengthened vocational training. The mean years of education among youth aged 15-24 have risen to 8.1 in 2023 and are projected to reach 9.3 by 2043. Under the Education scenario, this increases further to 9.7 years.
- The Manufacturing scenario envisions a more dynamic and competitive industrial base driven by greater investment, innovation and labour participation. By 2043, the manufacturing sector’s share of GDP rises to 17.3%, compared to 15.2% on the Current Path. Increased investment, government expenditure on R&D, improved business regulation and improved labour participation enhance productivity and competitiveness, while expanded formal employment opportunities boost incomes and job quality.
- The AfCFTA scenario models deeper regional integration through tariff reductions, productivity gains and export diversification. By 2043, Tanzania’s exports rise to 24.1% of GDP, compared to 21.9% on the Current Path, while the trade deficit narrows slightly to -5.5% from -7.3%. Increased imports of capital and intermediate goods, improved logistics and reduced non-tariff barriers enhance competitiveness and boost overall trade. Although imports remain high, the scenario demonstrates modest but meaningful progress toward a more diversified economy aligned with continental integration goals.
- Tanzania’s infrastructure gap remains a major constraint on inclusive development, with limited access to electricity, modern energy and digital connectivity curbing productivity and opportunity. Reliance on traditional cookstoves is widespread, used by 87% of households in 2023, exposing women and children to severe health risks and driving deforestation. Under the Large Infrastructure and Leapfrogging scenario, this share declines sharply to 36% by 2043, while households using modern fuels rise to 62%, improving both health and environmental outcomes. Digital connectivity also accelerates. Fixed broadband access, currently 2.6 subscriptions per 100 people expands to 23 per 100 by 2043, exceeding the 19 per 100 projected on the Current Path. These advances in infrastructure and connectivity would strengthen economic inclusion and support Tanzania’s transition toward a more resilient, modern economy.
- Tanzania remains fiscally dependent on external financing, with aid still accounting for 23% of government revenue in 2023—among the highest in its peer group. Although its relative weight is declining, the Financial Flows scenario projects cumulative aid inflows US$2.7 billion higher than the baseline by 2043, with aid representing 9% of revenue that year. Remittances, though modest at 1.3% of GDP (US$415 million) in 2023, are expected to rise to nearly 3% of GDP by 2043 as the diaspora expands and transfer systems improve. Foreign direct investment (FDI) has recovered strongly since the pandemic, reaching 3% of GDP in 2023, above the peer average, driven by mining, manufacturing and financial services, mainly from China, India and the UK. Under the scenario, FDI grows to 4.8% of GDP by 2043, raising the investment stock from 38.2% to 48.2% of GDP, an additional US$24.2 billion. Government revenue remains low at 15.5% of GDP in 2023, reflecting a narrow tax base, evasion and inefficient administration. Under the scenario, revenues rise slightly by 0.2 percentage points of GDP, adding US$7.5 billion cumulatively by 2043. While stronger aid, FDI and remittance inflows improve fiscal space, Tanzania’s long-term resilience will depend on expanding its domestic tax base and reducing reliance on external flows.
- By 2043, Tanzania’s composite governance score improves from 0.69 on the Current Path to 0.76 in the Governance scenario, lifting it from 7th to 3rd among Africa’s lower-middle-income countries. The largest gains occur in security and inclusion, supported by more effective public administration, stronger fiscal management and reduced corruption. Enhanced transparency and accountability improve service delivery, while expanded welfare transfers reduce inequality and strengthen resilience. Together, these reforms make growth more efficient, equitable and politically stable, positioning governance as a key driver of Tanzania’s long-term transformation.
In the fourth section, we compare the impact of each of these eight sectoral scenarios with one another and subsequently with a Combined scenario (the integrated effect of all eight scenarios). In our forecasts, we measure progress on various dimensions such as economic size (in market exchange rates), gross domestic product per capita (in purchasing power parity), extreme poverty, carbon emissions, the changes in the structure of the economy, and selected sectoral dimensions such as progress with mean years of education, life expectancy, the Gini coefficient or reductions in mortality rates.
- Across all eight sectoral scenarios, GDP per capita rises above the Current Path by 2043. The Governance and the AfCFTA scenarios generate the largest gains, US$211 and US$203 per person higher, respectively, demonstrating the power of regional integration and institutional reform to drive productivity and inclusive growth. The Agriculture scenario follows, adding US$128 per person through higher yields, improved water use and rural income growth. Education and financial reforms have smaller but vital long-term impacts, strengthening human capital and investment capacity.
- All scenarios also lead to a reduction in poverty. The Governance and Education scenarios deliver the strongest poverty reduction effects. Governance reforms enhance both the efficiency and equity of resource allocation by expanding fiscal space, strengthening tax systems and curbing corruption, ensuring that public funds reach those most in need. The Education scenario has a strong and multidimensional influence on poverty reduction in Tanzania. By enhancing skills, employability and productivity, it raises household incomes and resilience while lowering fertility and dependency ratios—mechanisms that have immediate welfare effects.
- When combined, these reforms yield transformative results. By 2043, GDP per capita (PPP) is US$1 059 higher than the Current Path, and GDP (MER) reaches US$305.2 billion, lifting Tanzania to the 6th-largest economy in Africa. Under the Combined scenario, Tanzania achieves a far greater reduction in poverty than on the Current Path. Using the lower-middle-income poverty line of US$3.65 per day (2017 PPP), the poverty rate falls from 71% in 2023 to 26% in 2043, compared to 37% on the Current Path—an 11 percentage-point improvement, equivalent to around 15 million fewer people living in poverty. Extreme poverty at US$2.15 per day also declines more sharply, from 12% on the Current Path to 6% in the Combined scenario by 2043, translating to about 7.2 million fewer Tanzanians living in extreme poverty. The Combined scenario shows that Tanzania’s transformation depends on sustained, coordinated reforms across all sectors. Growth must become more productive, employment-intensive and inclusive to align with Vision 2050’s goal of a resilient, upper-middle-income economy.
We end this page with a summarising conclusion offering key recommendations for decision-making.
The analysis concludes that Tanzania has achieved strong economic growth over the past two decades, yet this progress has not translated into corresponding gains in income or poverty reduction. The Combined scenario shows that coordinated investments across governance, regional integration, education, infrastructure, energy and agriculture can unlock transformative and inclusive growth. Under this pathway, GDP rises by US$80.4 billion above the Current Path by 2043, advancing Tanzania to the 6th-largest economy in Africa while reducing poverty from 71% to 24%. To realise this potential, Tanzania must prioritise AfCFTA implementation, governance reform, human capital development, industrialisation and agricultural transformation, supported by digital infrastructure, clean energy and climate resilience. With strategic execution, Tanzania can transition from steady growth to a diversified, high-productivity and inclusive development path.
All charts for Tanzania Development Futures
- Chart 1: Political map of Tanzania
- Chart 2: Population structure in the Current Path, 1990–2043
- Chart 3: Population distribution map, 2023
- Chart 4: Urban and rural population in the Current Path, 1990-2043
- Chart 5: GDP (MER) and growth rate in the Current Path, 1990–2043
- Chart 6: Size of the informal economy in the Current Path, 2020-2043
- Chart 7: GDP per capita in Current Path, 1990–2043
- Chart 8: Extreme poverty in the Current Path, 2020–2043
- Chart 9: National Development Plan of Tanzania
- Chart 10: Relationship between Current Path and scenarios
- Chart 11: Mortality distribution in the Current Path, 2023 and 2043
- Chart 12: Infant mortality rate in Current Path and Demographics and Health scenario, 2020–2043
- Chart 13: Demographic dividend in the Current Path and the Demographics and Health scenario, 2020–2043
- Chart 14: Crop production and demand in the Current Path, 1990-2043
- Chart 15: Import dependence in the Current Path and Agriculture scenario, 2020–2043
- Chart 16: Progress through the education funnel in the Current Path, 2023 and 2043
- Chart 17: Mean years of education in the Current Path and Education scenario, 2020–2043
- Chart 18: Value-add by sector as % of GDP in the Current Path, 2020 and 2043
- Chart 19: Value-add by the manufacturing sector in the Current Path and Manufacturing scenario, 2020–2043
- Chart 20: Exports and imports as % of GDP in the Current Path, 2000-2043
- Chart 21: Trade balance in the Current Path and AfCFTA scenario, 2020–2043
- Chart 22: Electricity access: urban, rural and total in the Current Path, 2000-2043
- Chart 23: Cookstove usage in the Current Path and Large Infra/Leapfrogging scenario, 2020–2043
- Chart 24: Access to mobile and fixed broadband in the Current Path and the Large Infra/Leapfrogging scenario, 2020–2043
- Chart 25: FDI, foreign aid and remittances as % of GDP in the Current Path, 1990-2043
- Chart 26: Government revenue in the Current Path and Financial Flows scenario, 2020–2043
- Chart 27: Government effectiveness score in the Current Path, 2002-2043
- Chart 28: Composite governance index in the Current Path and Governance scenario, 2023 and 2043
- Chart 29: GDP per capita in the Current Path and scenarios, 2020–2043
- Chart 30: Poverty in the Current Path and scenarios, 2020–2043
- Chart 31: GDP (MER) in the Current Path and Combined scenario, 2020–2043
- Chart 32: GDP per capita in the Current Path and the Combined scenario, 2020-2043
- Chart 33: Value added by sector in the Current Path and Combined scenario, 2023 and 2043
- Chart 34: Informal sector in the Current Path and Combined scenario, 2020–2043
- Chart 35: Poverty in the Current Path and Combined scenario, 2023 and 2043
- Chart 36: Life expectancy in the Current Path and Combined scenario, 2020–2043
- Chart 37: Carbon emissions in the Current Path and Combined scenario, 2020–2043
- Chart 38: Energy demand and production by type in the Current Path and Combined scenario, 2020-2043
- Chart 39: Policy recommendations
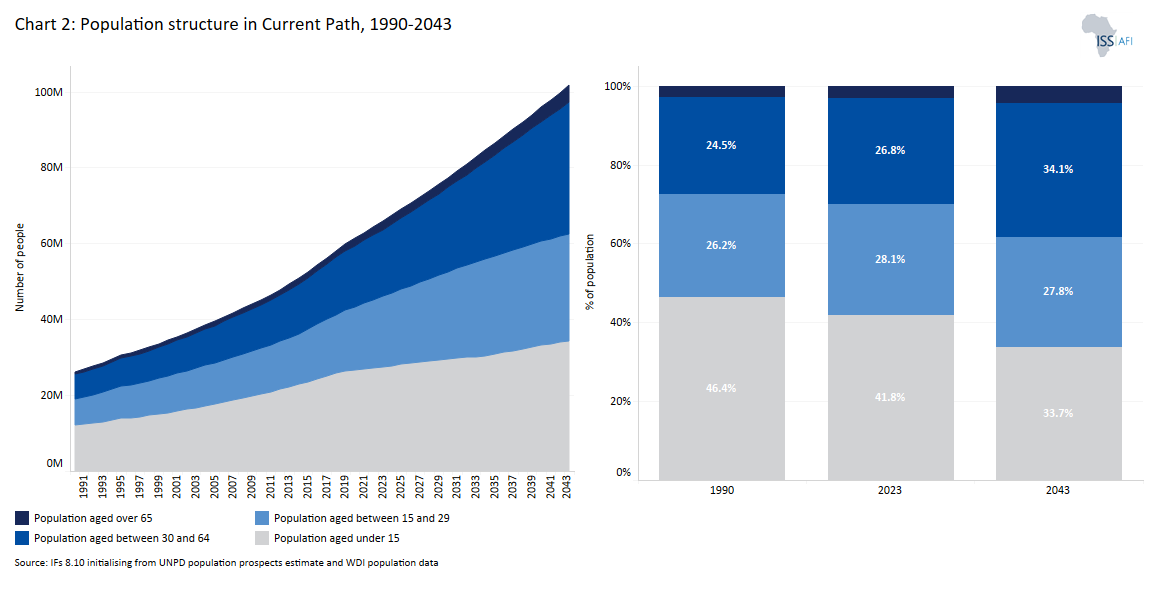
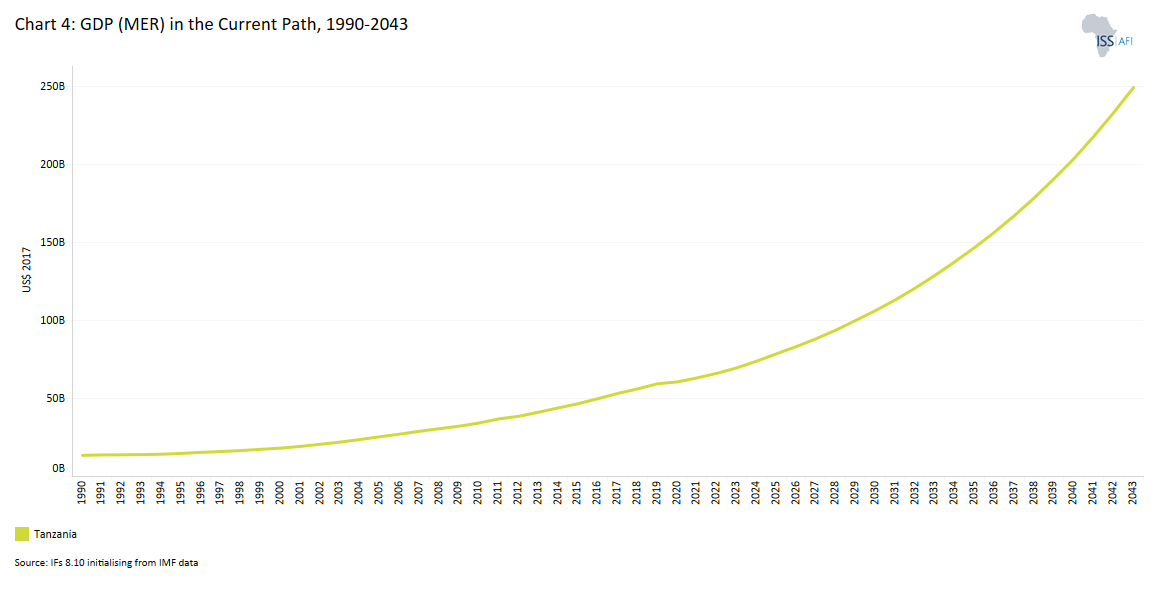
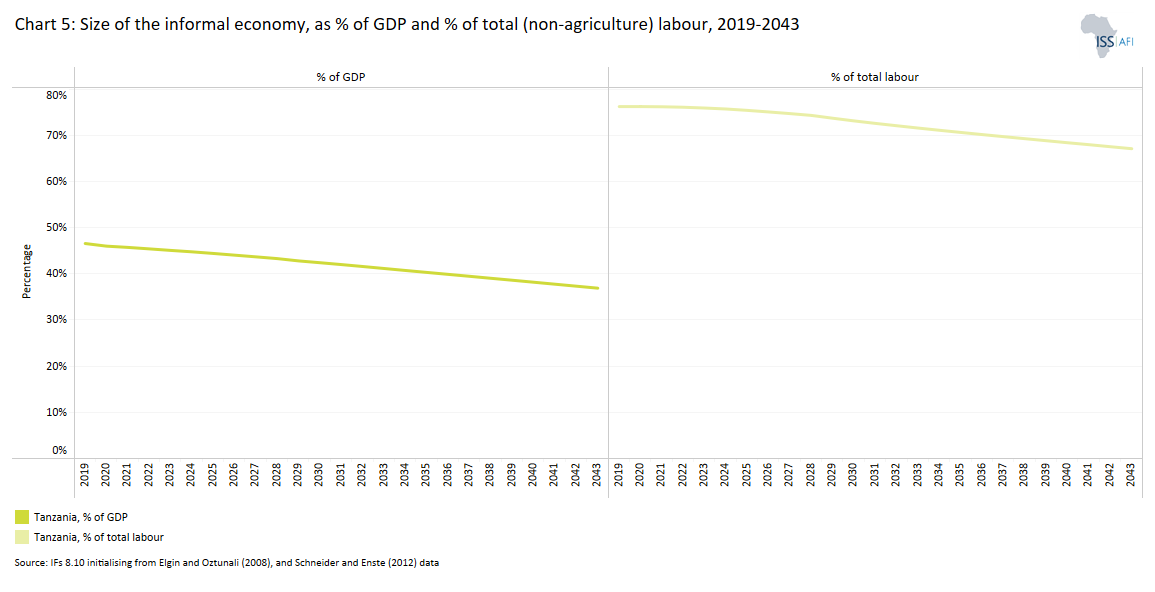
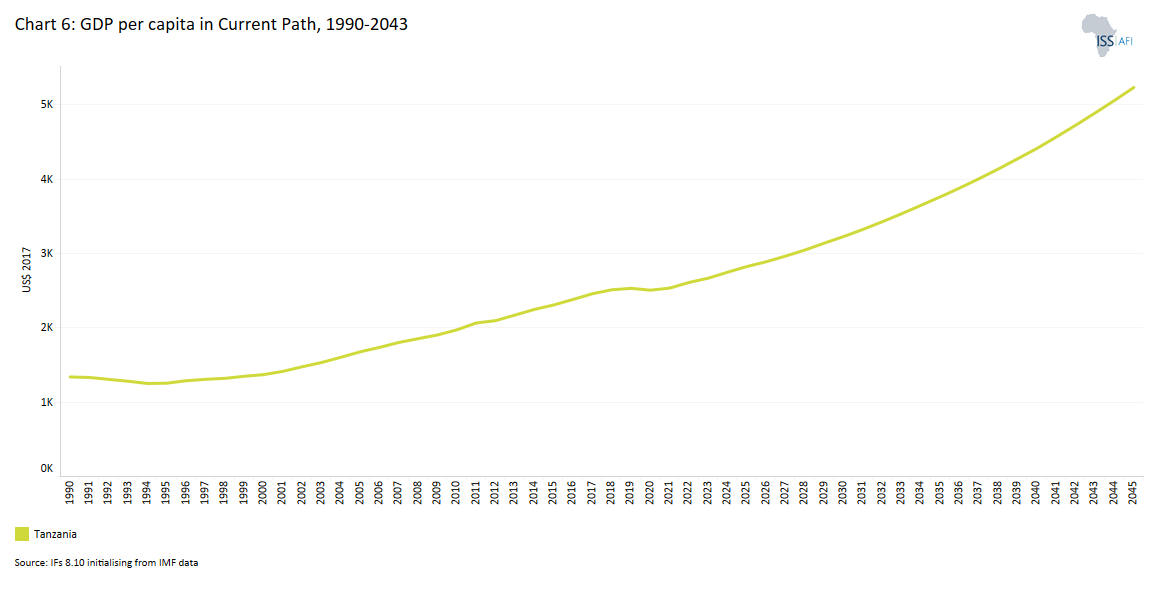
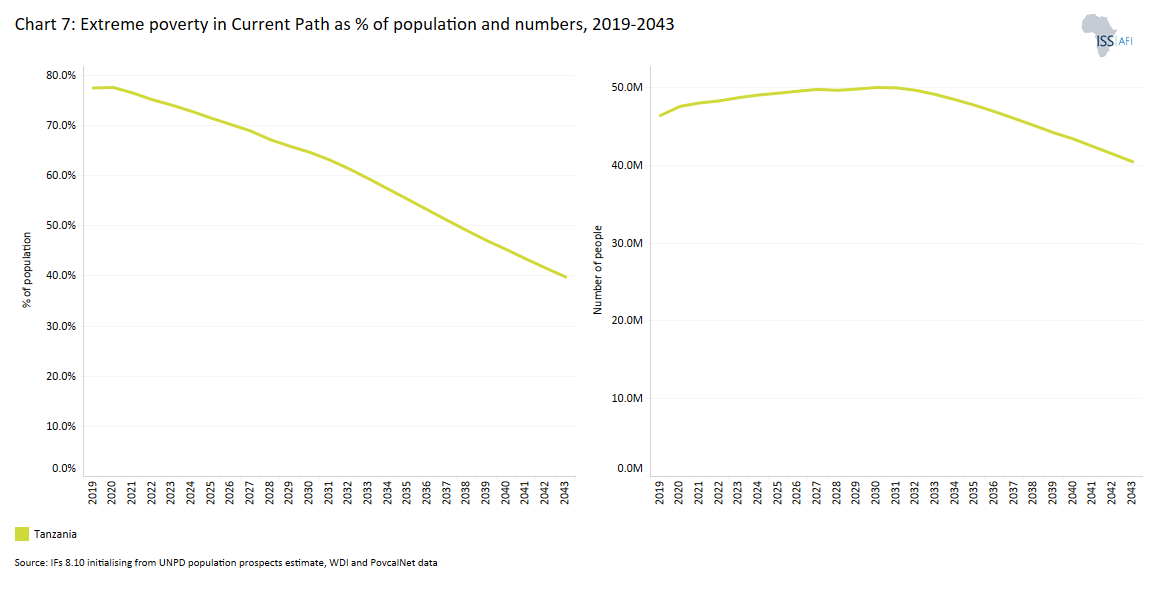
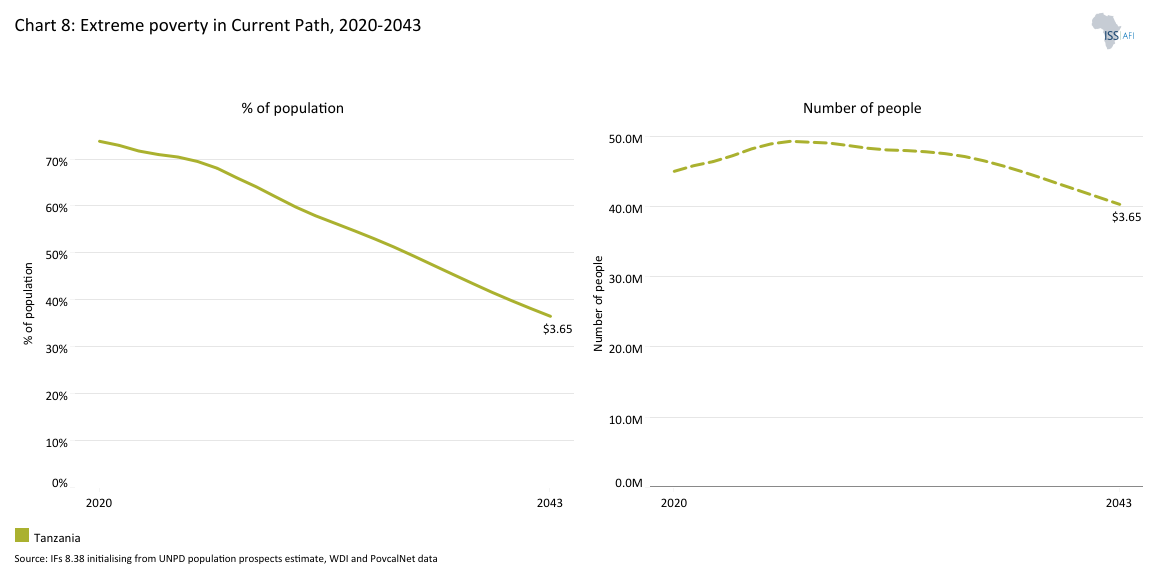
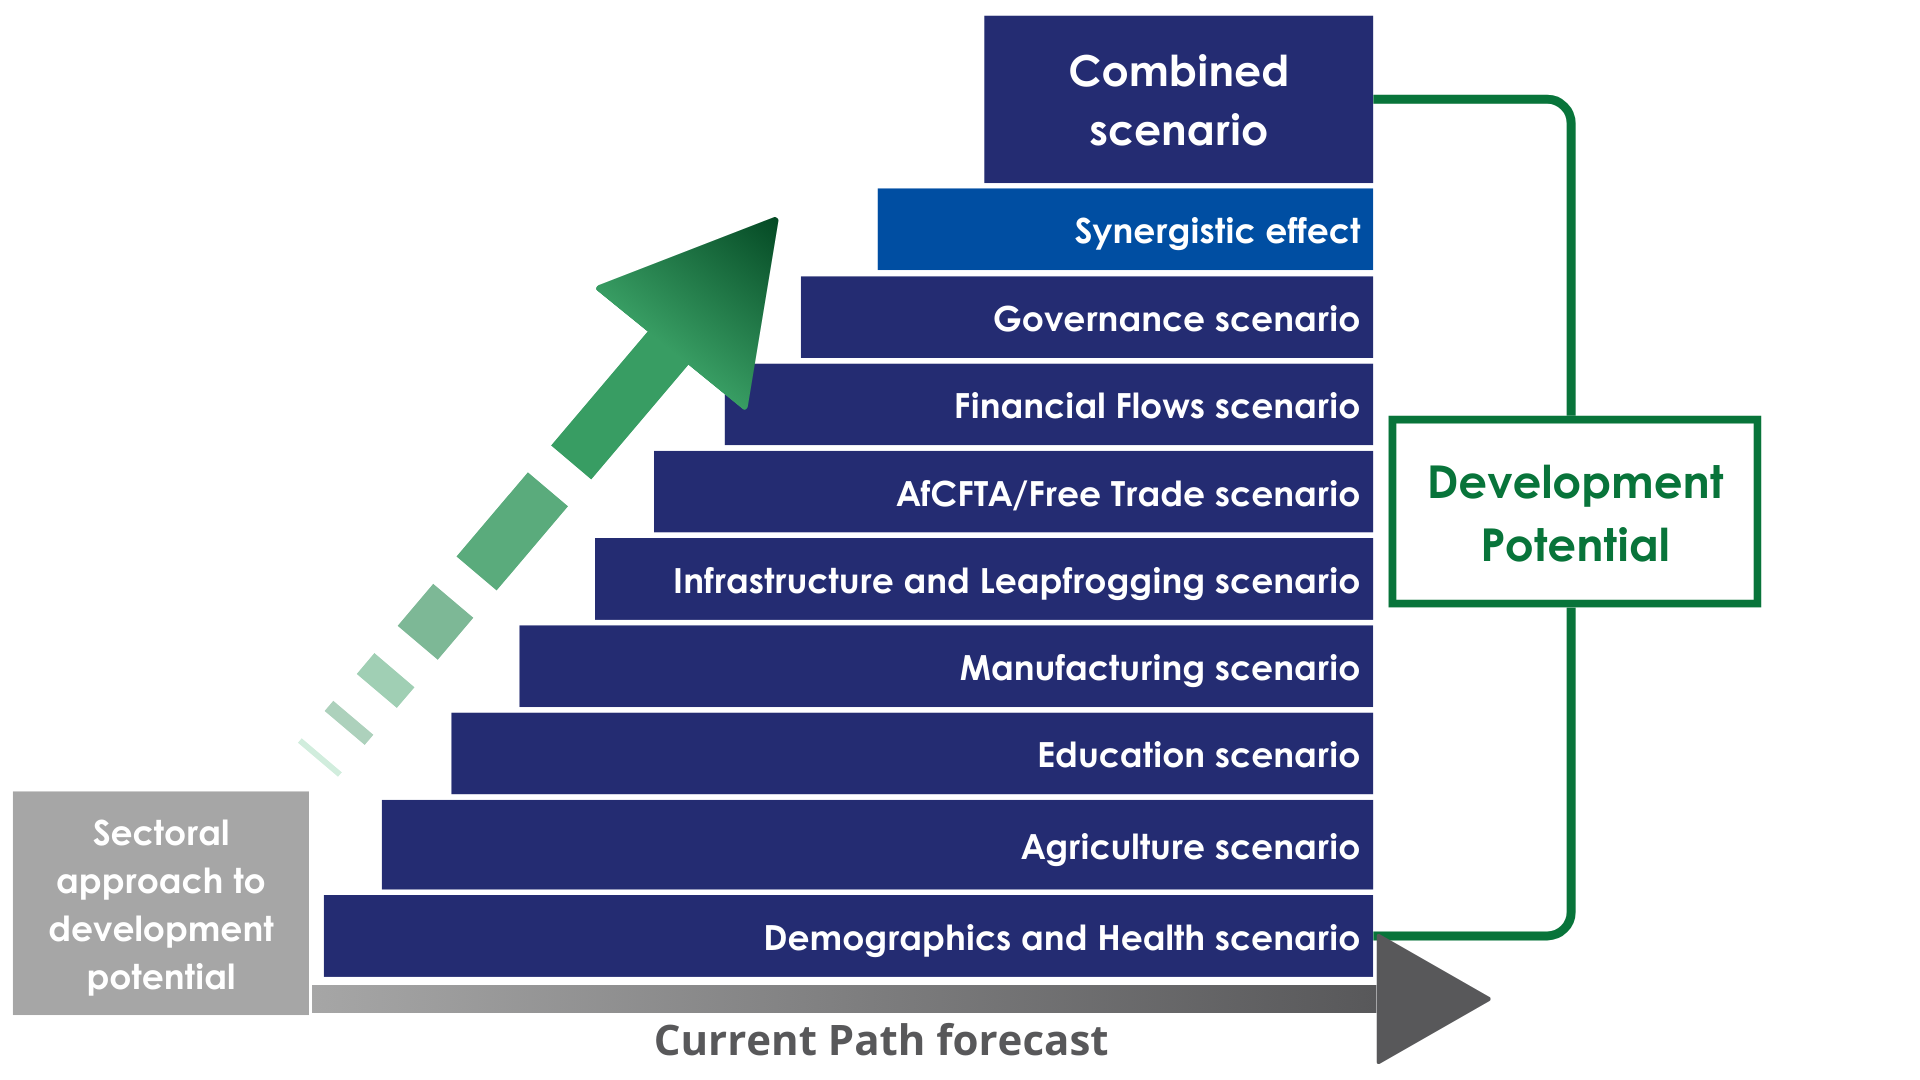
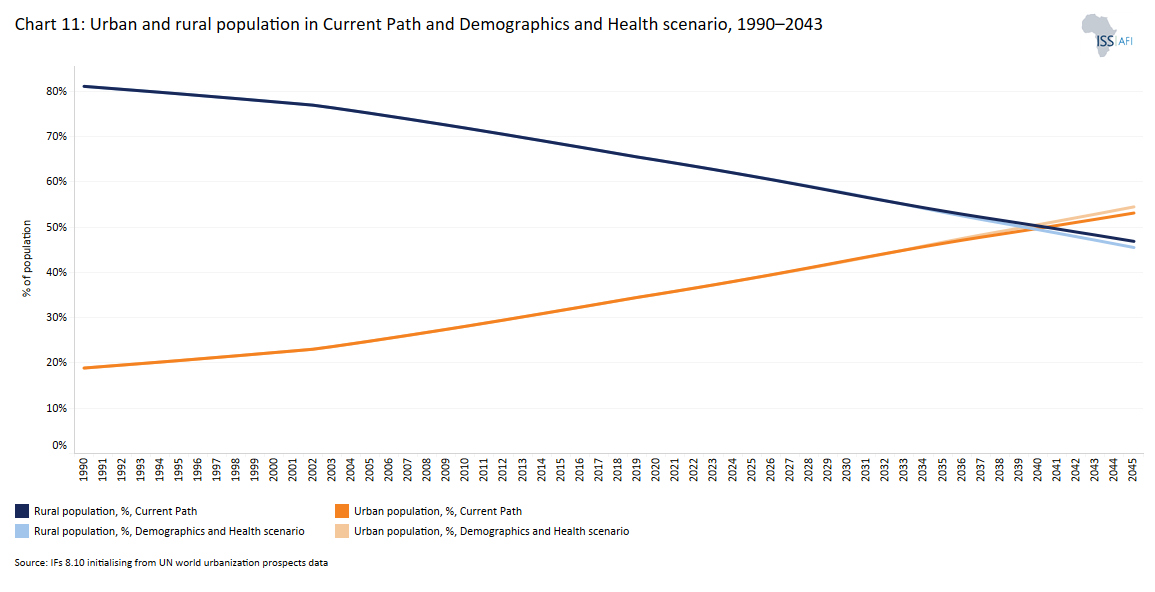
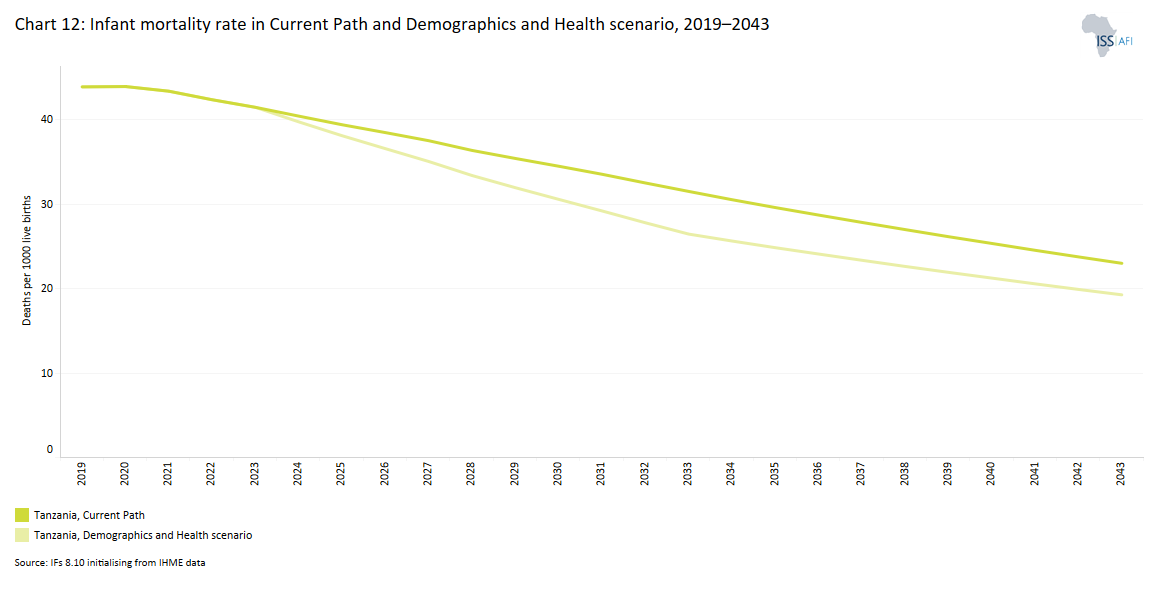
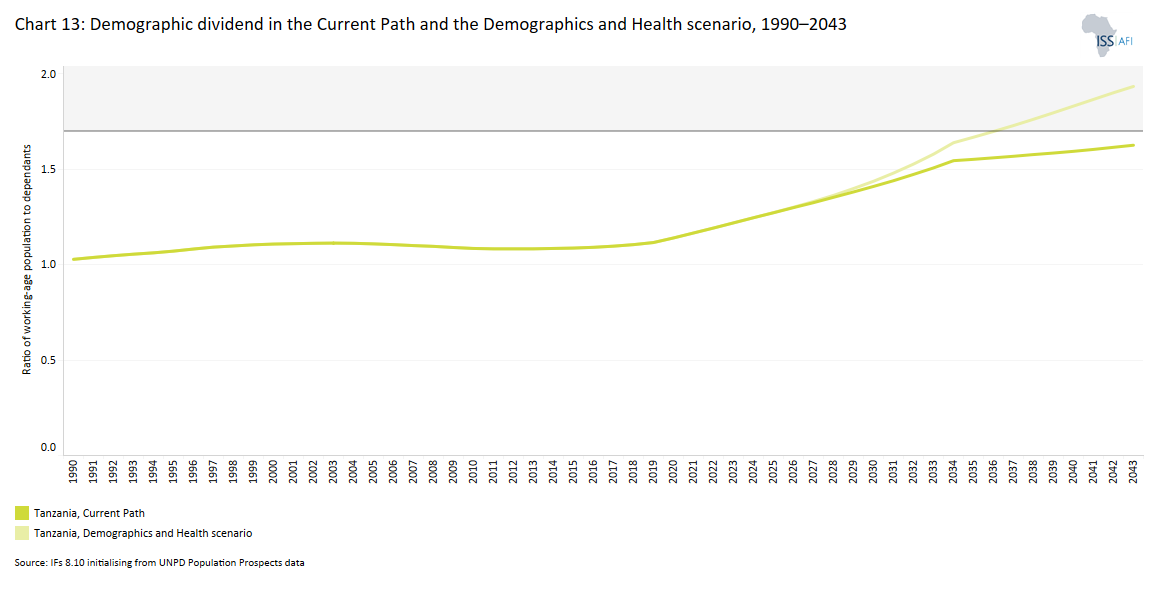
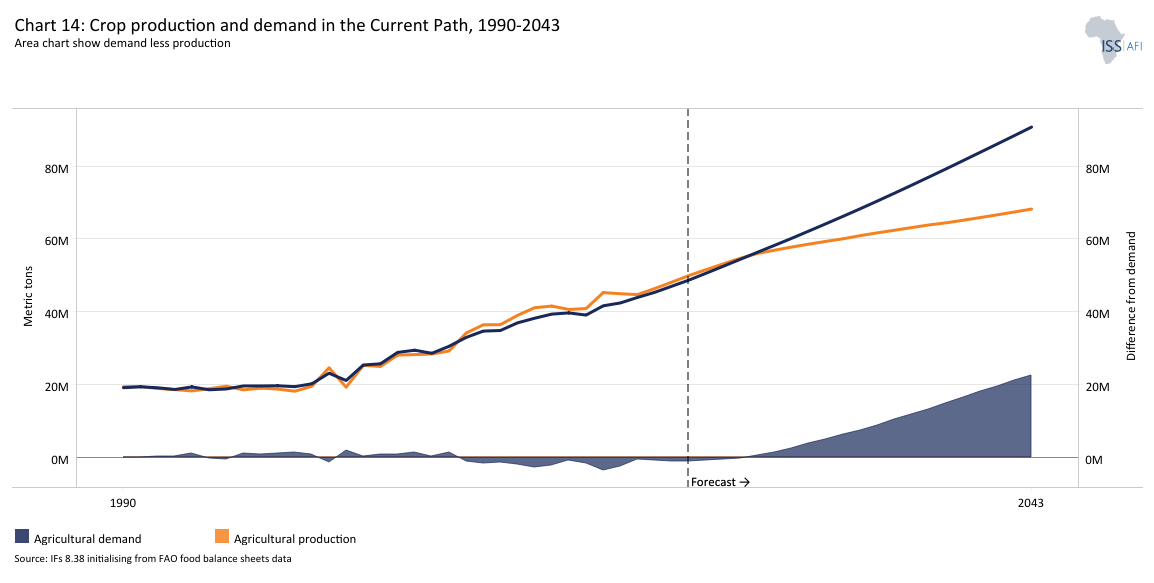
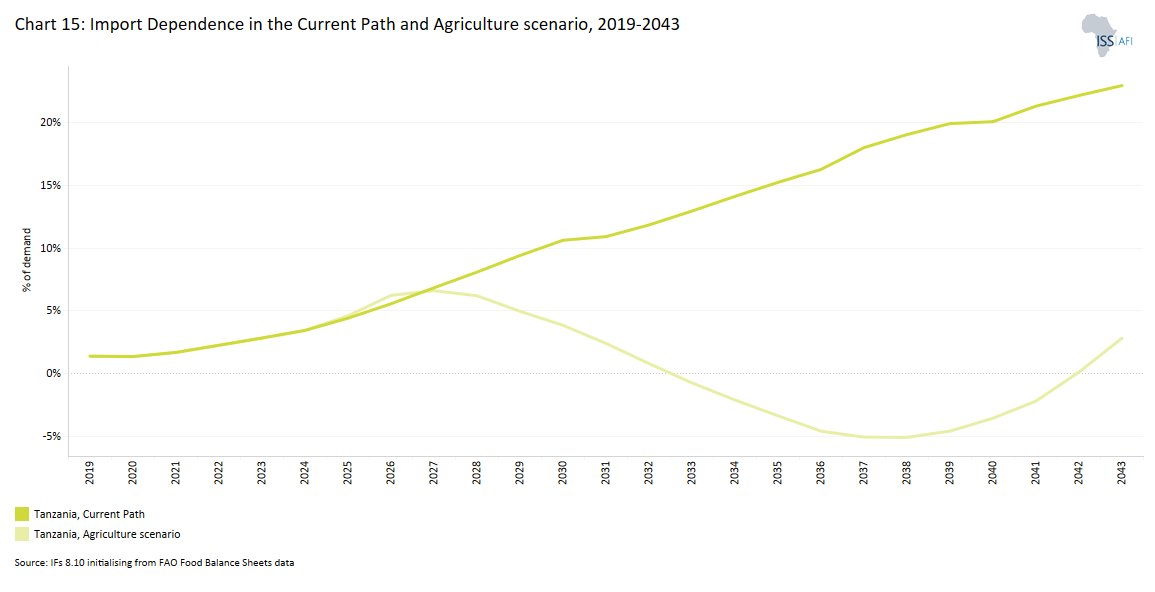
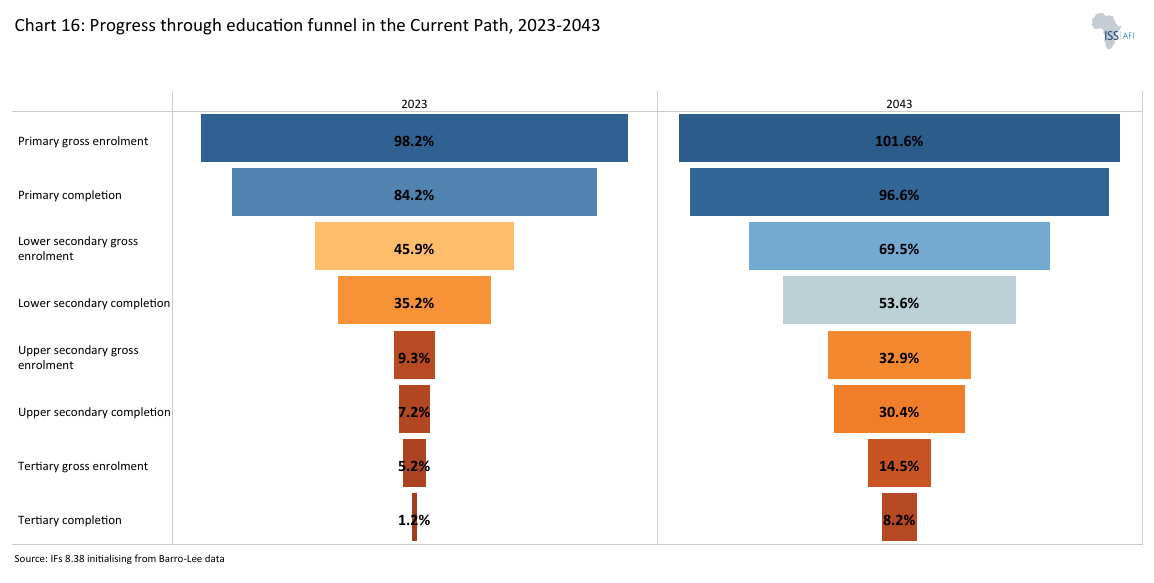
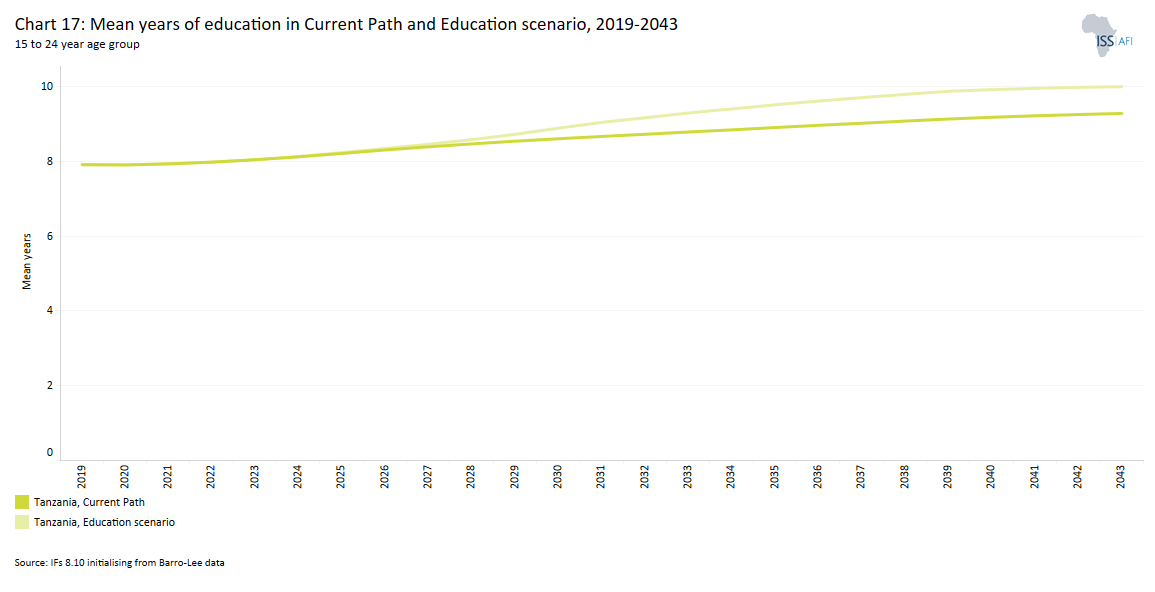
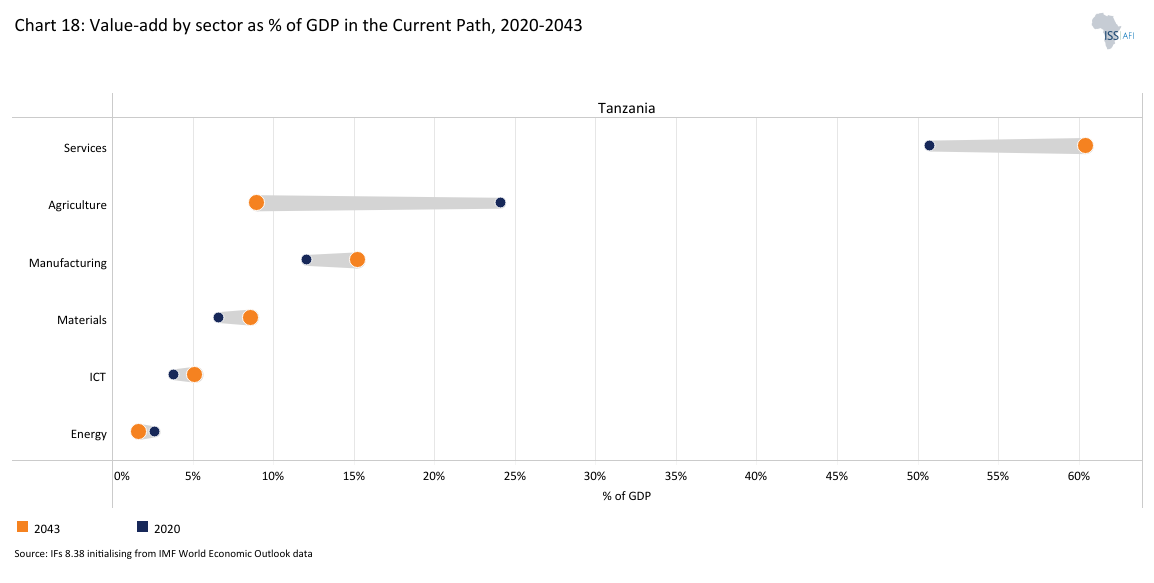
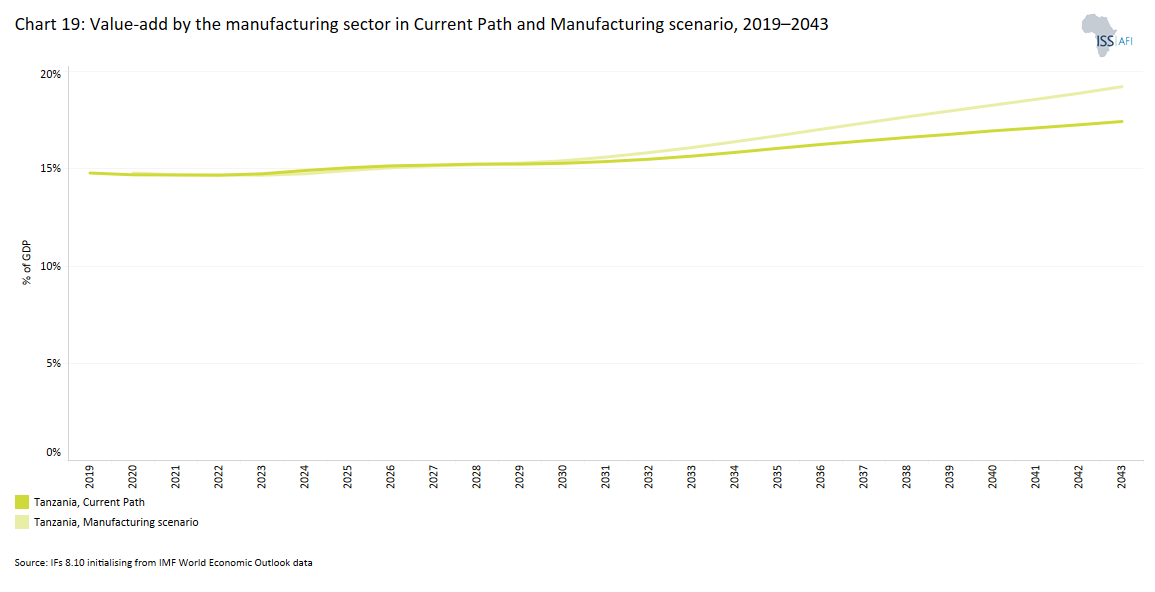
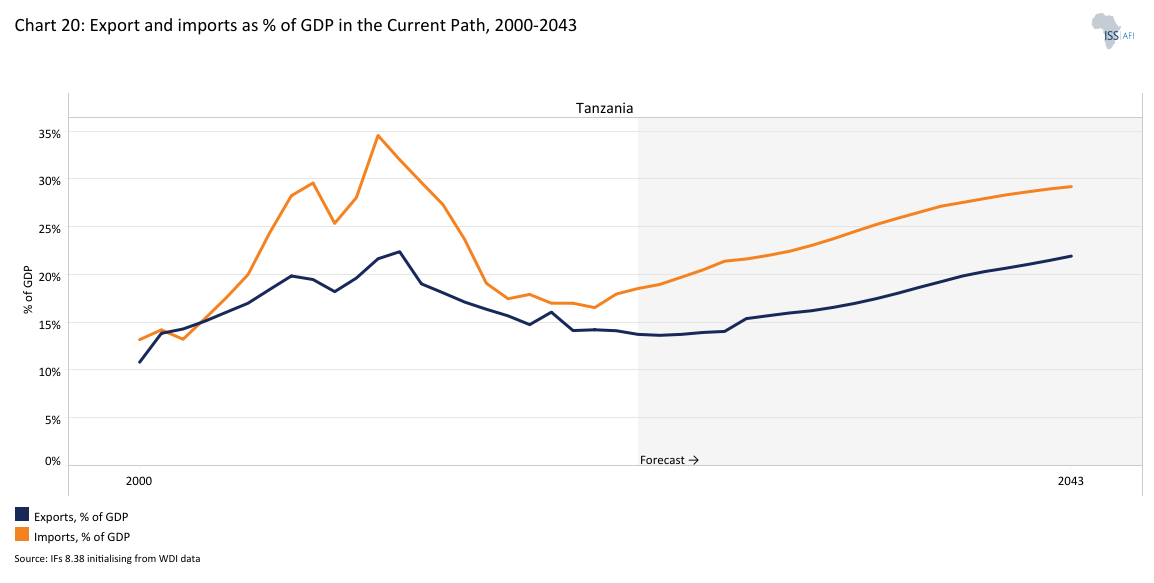
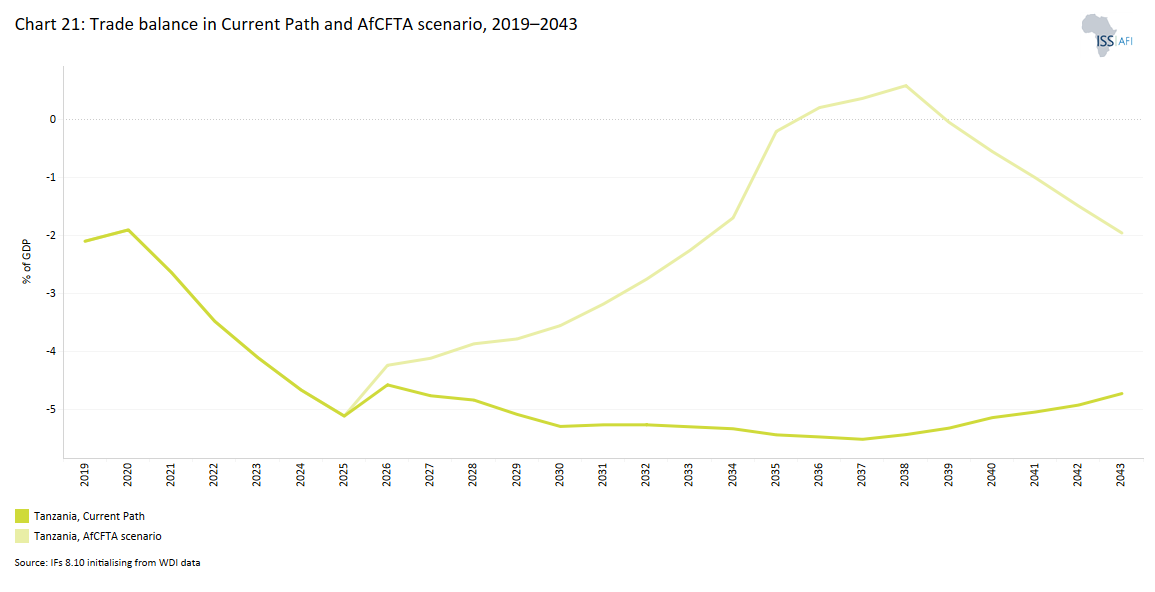
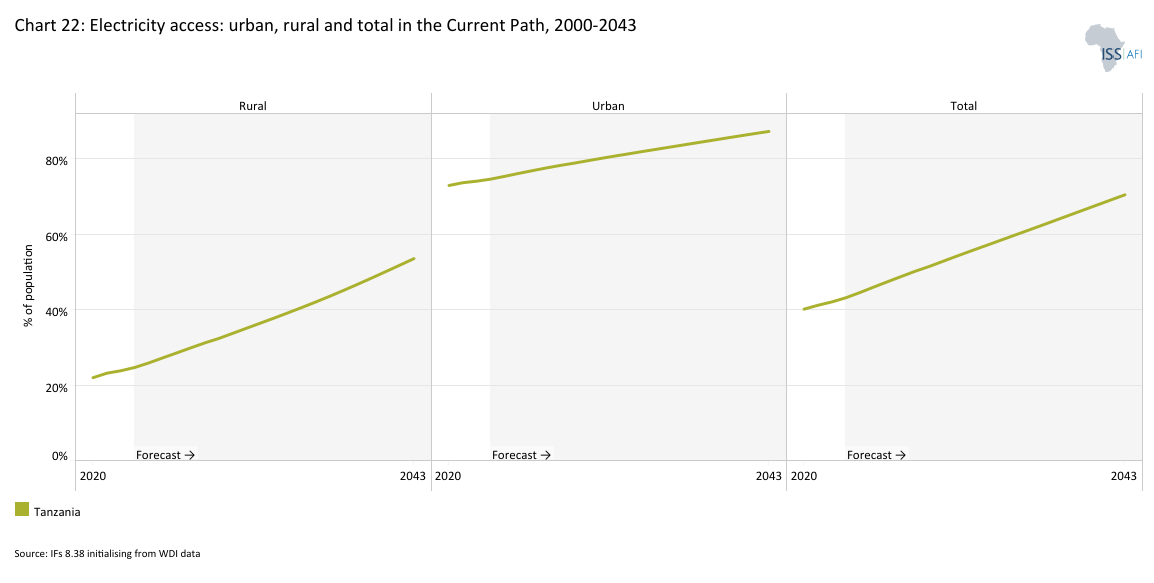
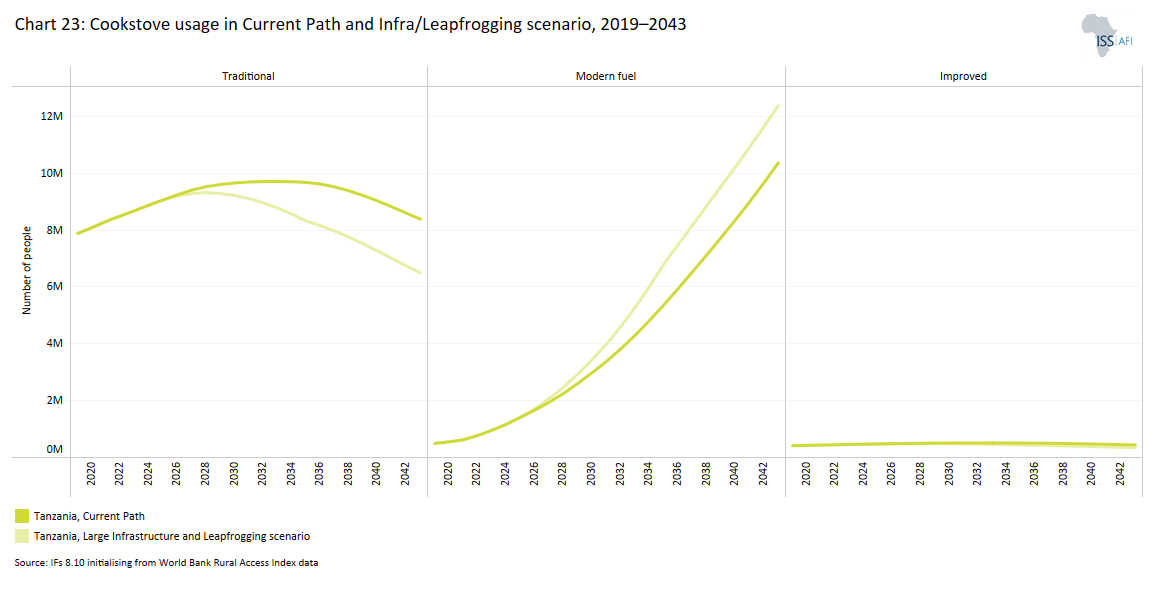
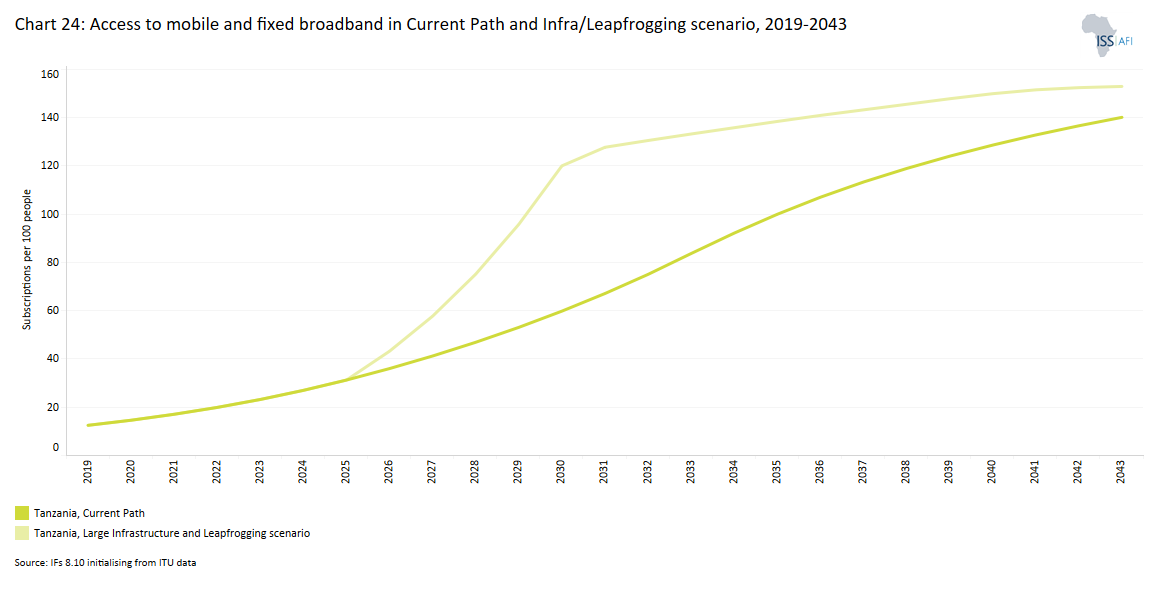
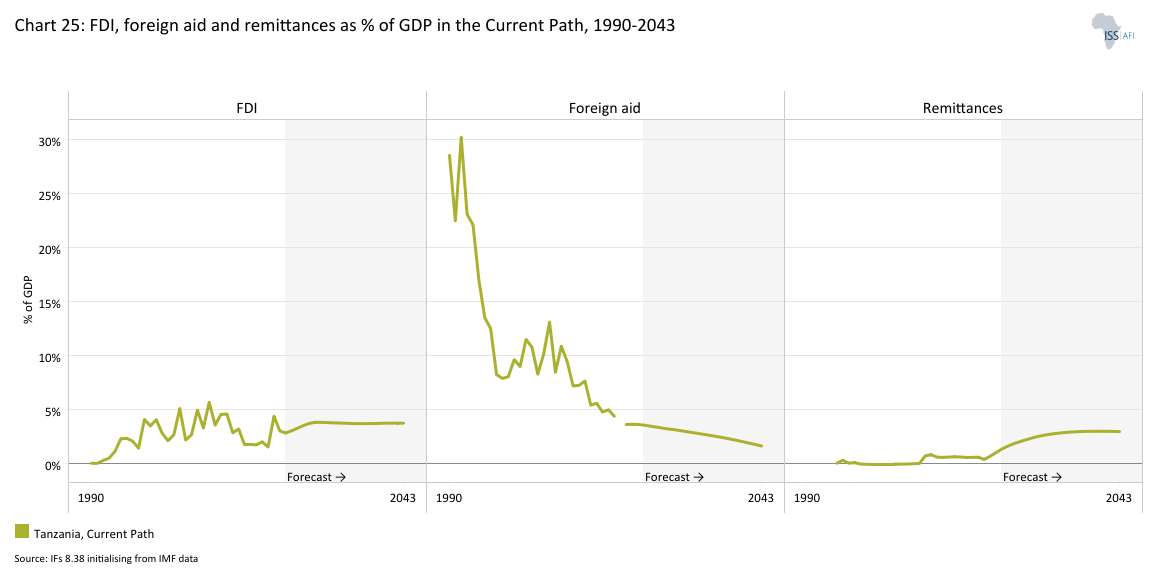
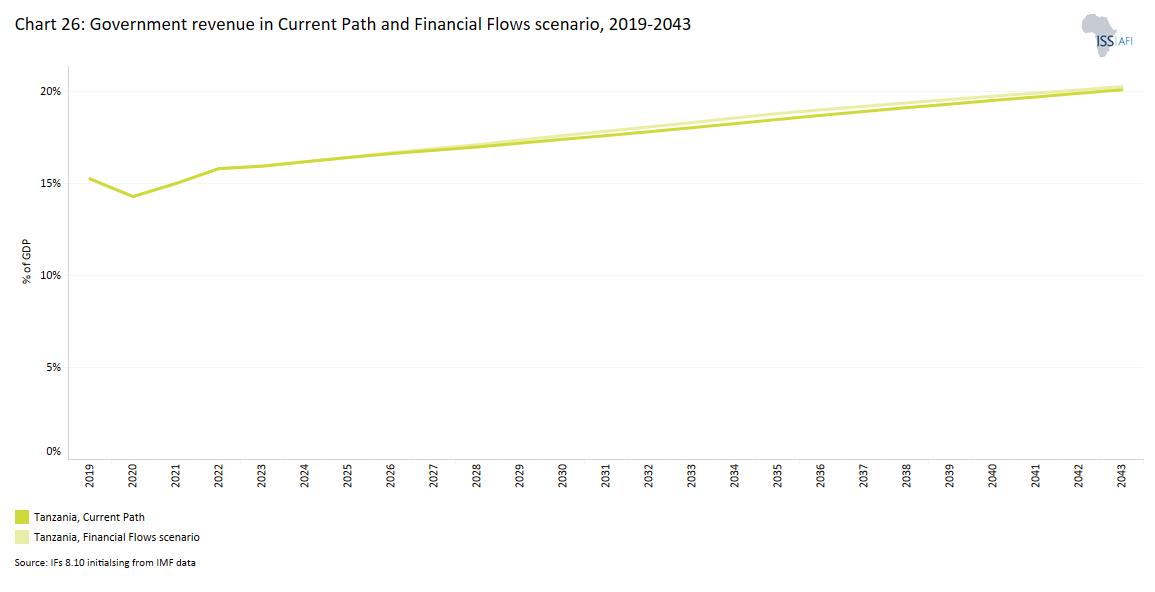
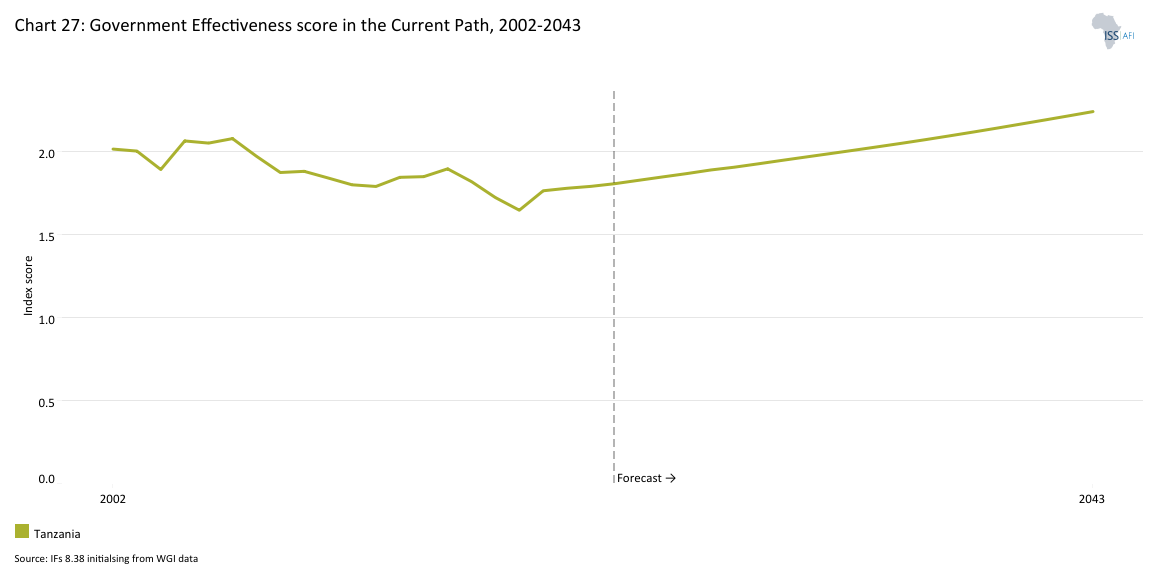
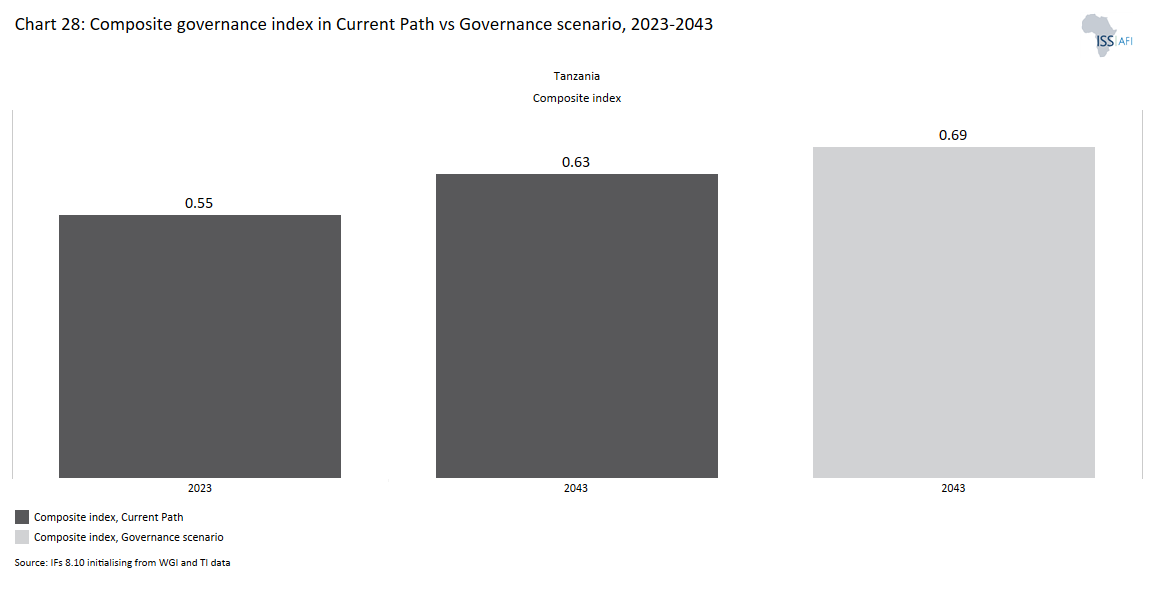
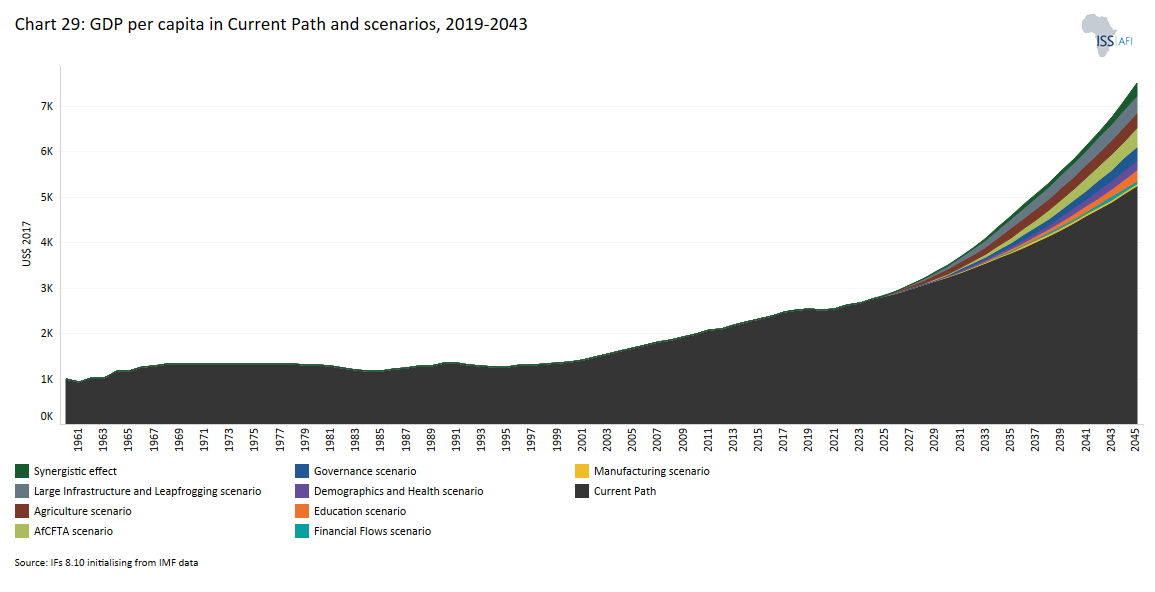
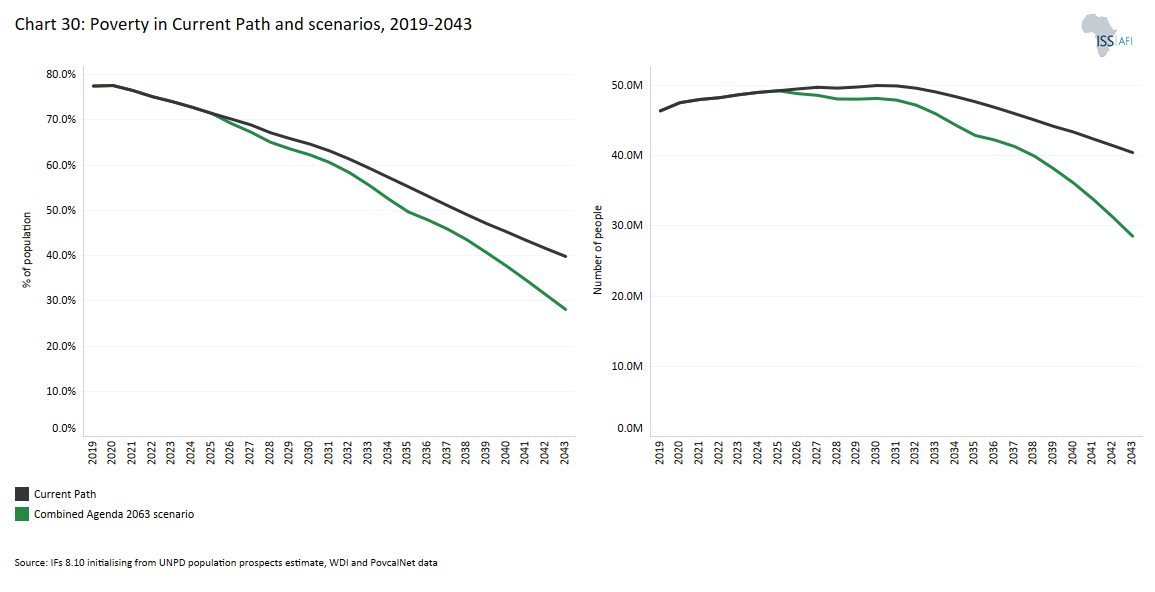
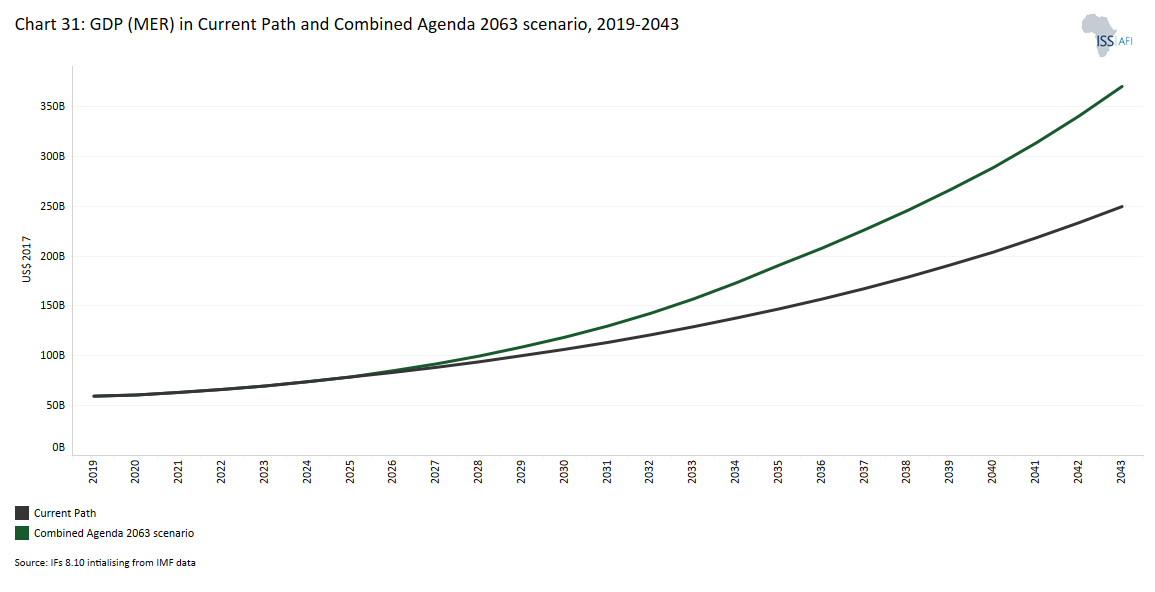
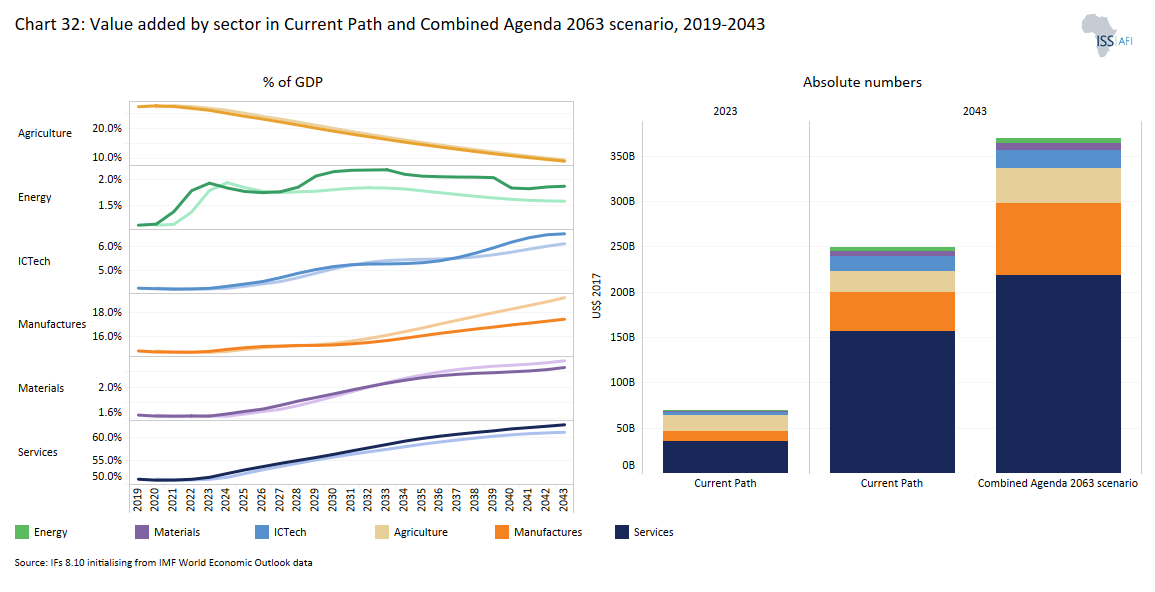
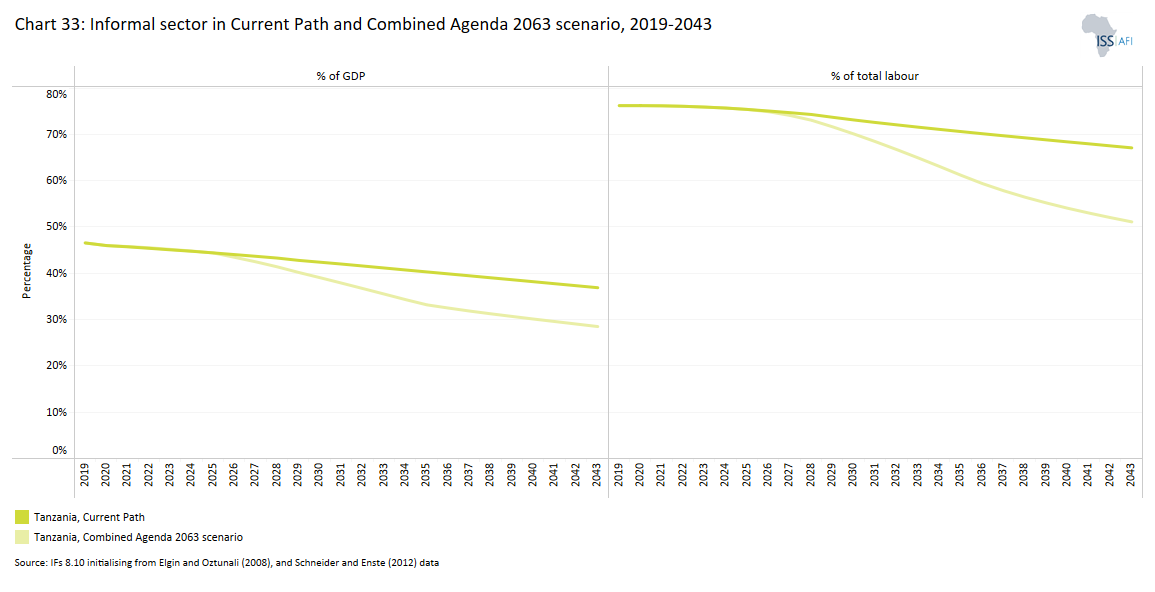
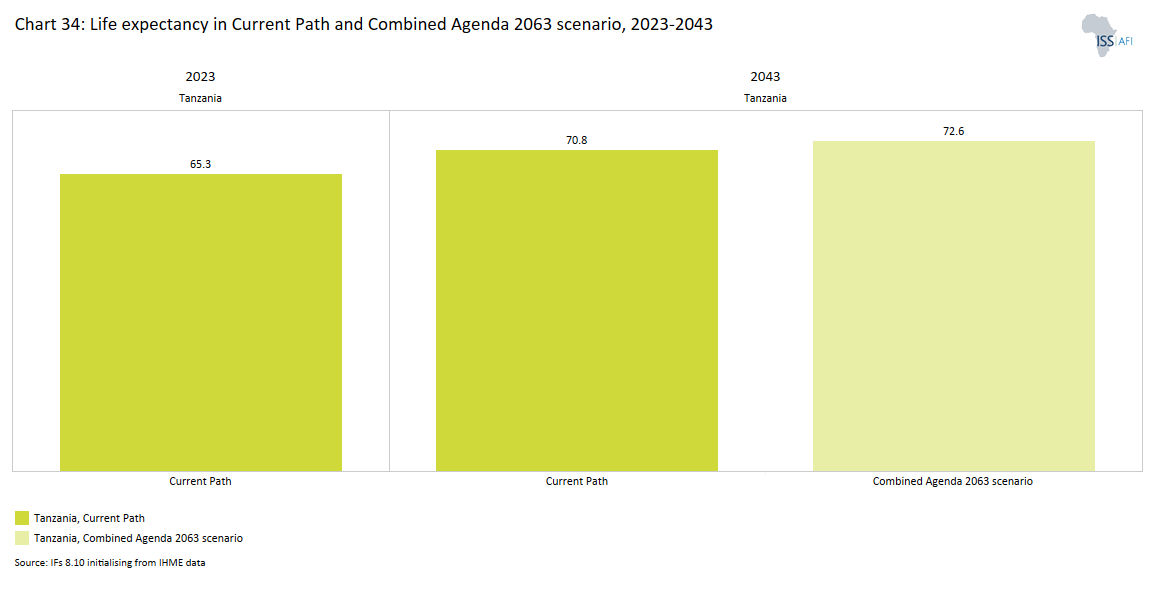
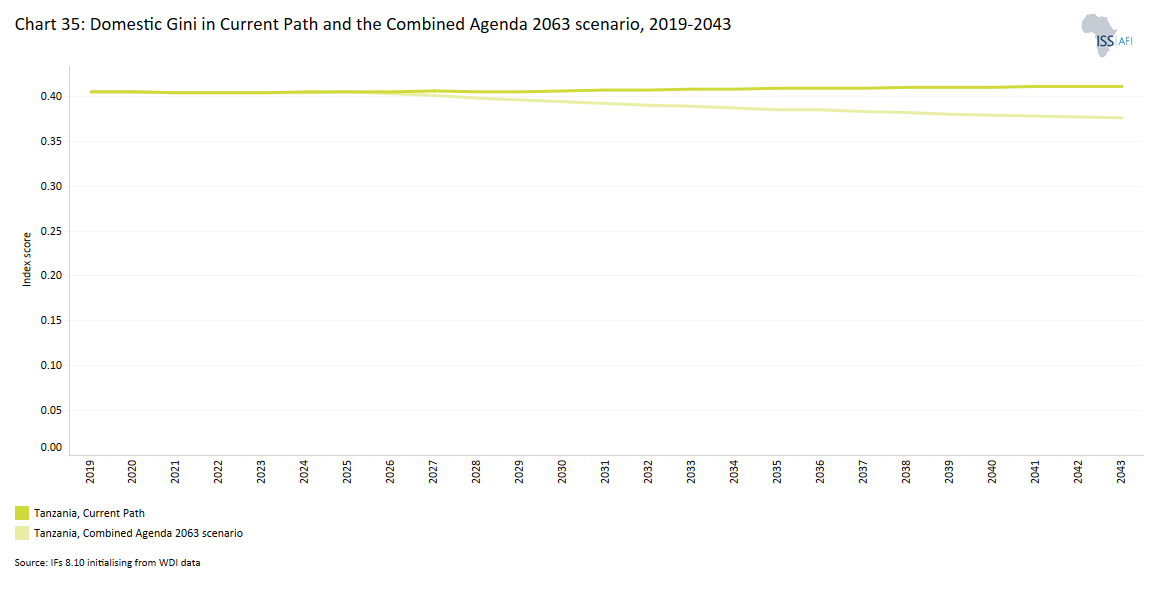
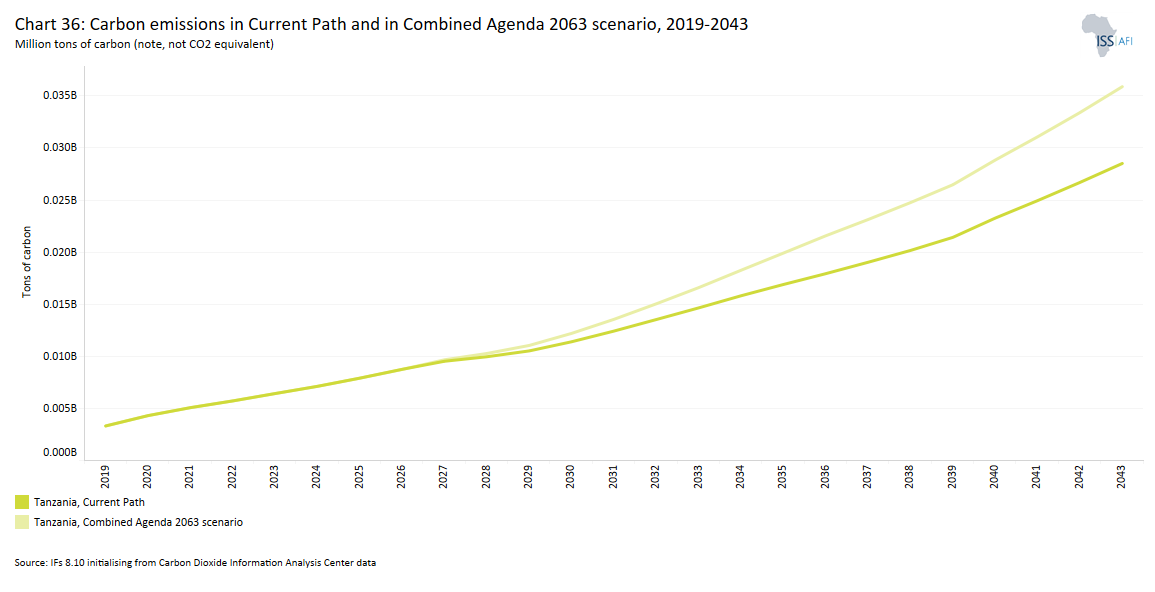
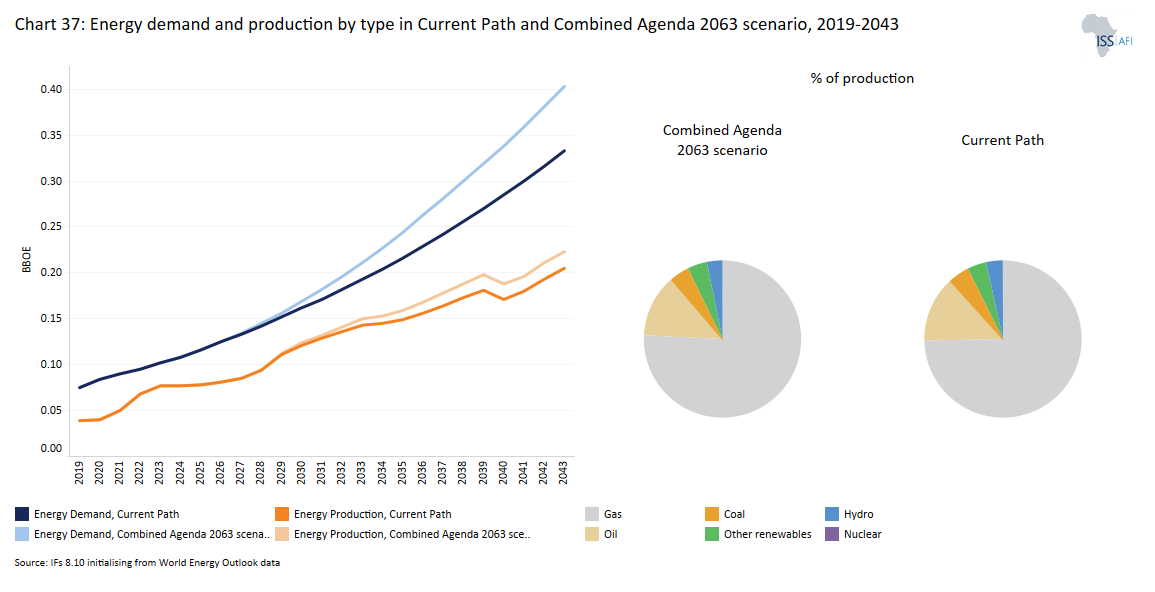
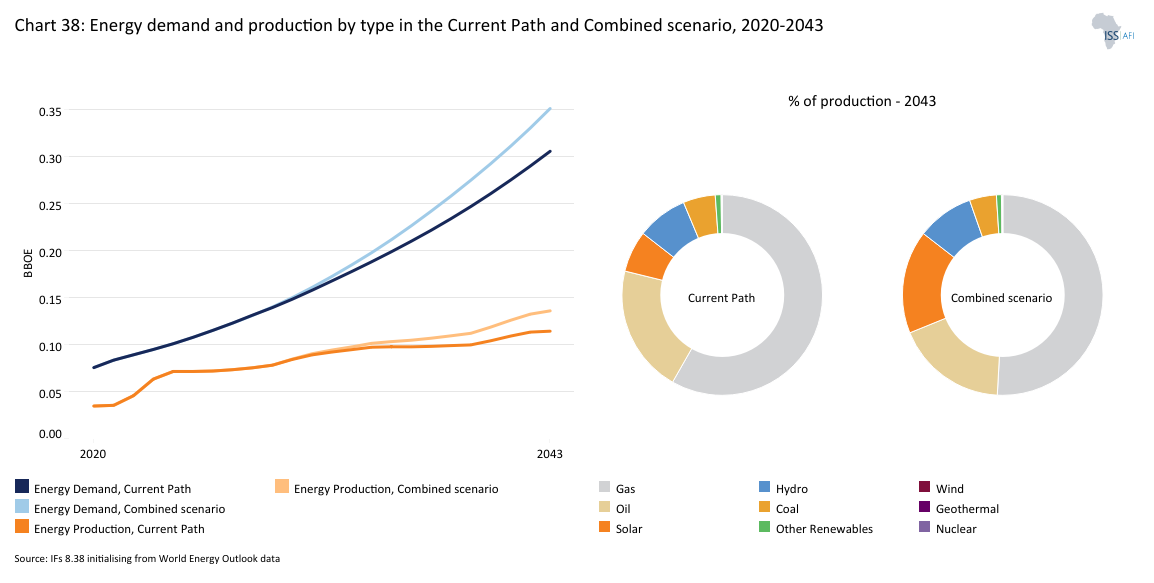
Chart 1 is a political map of Tanzania.
With a total land size of 947 303 km2, the United Republic of Tanzania is the 13th-largest country in Africa, with the 8th-largest economy in terms of GDP and 5th-largest population. However, it still ranks at only 31st when comparing GDP per capita in PPP. According to the World Bank country income classification, Tanzania is a lower-middle-income country (LMIC) with a Gross National Income (GNI) of US$4 120 in 2024.
Tanzania is situated in East Africa, bordered by Kenya and Uganda to the north, Rwanda, Burundi and the Democratic Republic of the Congo (DR Congo) to the west, Zambia, Malawi and Mozambique to the south and the Indian Ocean to the east. The country’s coastline stretches over 1 400 km along the Indian Ocean, providing access to important ports such as Dar es Salaam, which acts as the main maritime gateway for the country and several landlocked neighbours. The landscape is diverse, featuring the coastal plain, central plateau, the Great Rift Valley and highland zones. Mount Kilimanjaro, Africa's highest mountain, is in the mountainous and densely forested north-east of Tanzania. Three of Africa's Great Lakes are partly within Tanzania: Lake Victoria, Africa’s largest lake; Lake Tanganyika, the continent's deepest lake; and Lake Malawi.
The coastal region and islands experience a humid, tropical climate, while the interior has a more temperate or arid environment. Rainfall is unevenly distributed, with bimodal patterns in the north and unimodal patterns in the south and west, leading to periodic droughts and localised flooding. Environmental challenges include deforestation, soil erosion and land degradation, particularly in over-cultivated or densely settled areas.
Tanzania’s political system has evolved through several stages since the 1964 union of Tanganyika and Zanzibar. The country operated under an interim constitution until 1977, when a permanent charter was adopted and later amended to include a bill of rights. Zanzibar maintains its own constitution and governing institutions, with autonomy over domestic matters, though tensions over the balance of power between the mainland and the islands have periodically resurfaced.
For decades, politics was shaped by a one-party system dominated by the Chama Cha Mapinduzi (CCM), itself born from the merger of Tanganyika African National Union (TANU) on the mainland and the Afro-Shirazi Party in Zanzibar. This framework enshrined national unity and stability, often equating dissent with disloyalty. Multiparty politics was only introduced in 1992, and although Tanzania has held regular competitive elections since 1995, CCM has never lost power. Its dominance rests not only on access to state resources but also on its ability to absorb internal divisions and project itself as the custodian of unity and order.
The political opening of the early 1990s allowed for the emergence of opposition parties, but they remain weak. The 2025 elections unfolded in a contested environment. President Samia Suluhu Hassan, in office since 2021, initially signalled a more open political climate, permitting opposition rallies and easing restrictions on the press. However, these moves have been offset by renewed repression, including the disqualification of the main opposition party Chama cha Demokrasia na Maendeleo (CHADEMA), the arrest of its leader Tundu Lissu and restrictions on civic space. Analysts argue this reflects a long-standing consensus model: while Tanzania has avoided ethnic conflict and maintained stability, its political culture continues to prioritise cohesion and discipline over adversarial contestation.
Human rights concerns remain pressing. Reports of arbitrary arrests, violent crackdowns on protests, censorship and the forced eviction of Indigenous Maasai communities illustrate a persistent pattern of repression alongside official narratives of order and unity.
Following the October 2025 general elections, the contrast between institutional continuity and restricted political pluralism has sharpened, underscoring the fragility of Tanzania’s democratic trajectory. The polls, which returned President Samia Suluhu Hassan and the ruling Chama Cha Mapinduzi (CCM) to power with an overwhelming majority (98%), were marred by serious irregularities, an internet shutdown and widespread reports of violence. In the days that followed, nationwide protests erupted across major cities as demonstrators, many of them young Tanzanians, denounced the results and the exclusion of opposition parties from the contest. Security forces responded with force, deploying live ammunition and imposing curfews amid a near-total blackout of communication. Human rights organisations and international media reported numerous deaths and injuries, though the full scale of casualties remains contested. Independent monitors documented arbitrary arrests and alleged instances of unlawful killings.
The African Union’s election observer mission concluded that the polls did not meet democratic standards and that the electoral environment was neither free nor fair. Condemnation from the AU, the UN and international partners has intensified scrutiny of the government’s legitimacy.
These events have reshaped Tanzania’s political landscape. Long regarded as a model of stability, the country now illustrates the limits of controlled pluralism—one that maintains order through coercion rather than legitimacy. The suppression of dissent and erosion of civic freedoms signal a deepening governance crisis and a fraying social contract. As Tanzania enters a new political cycle, the evolving relationship between state and citizen will determine whether stability in the coming years is rooted in consent or sustained by force.
Tanzania’s economy has been on a steady upward trajectory for more than two decades, with GDP growth averaging around 6% annually and total output projected to more than triple by 2043. This performance has underpinned the country’s transition to LMIC in 2020 and reflects relative macroeconomic stability, expanding exports, and investment in infrastructure. Yet these aggregate gains have not translated into commensurate improvements in individual incomes: in 2023, Tanzania ranked 31st among African countries in GDP per capita. The disconnect is driven by rapid population growth, low-productivity agriculture and a large informal economy that limits wages, productivity and fiscal revenues. Extreme poverty remains widespread, while persistent gaps in health, education and nutrition reinforce deprivation, particularly in rural areas.
In 2023, Tanzania ranked 165th out of 191 countries in the UNDP Human Development Report, placing it in the medium human development category. This position reflects slower progress compared to most of its East African neighbours.
Looking ahead, the government’s Third Five-Year Development Plan (FYDP III) and the draft Vision 2050 both acknowledge that sustaining high GDP growth will not be enough. The focus must shift towards structural transformation, job creation and human capital investment if growth is to raise living standards, reduce poverty and capture the demographic dividend.
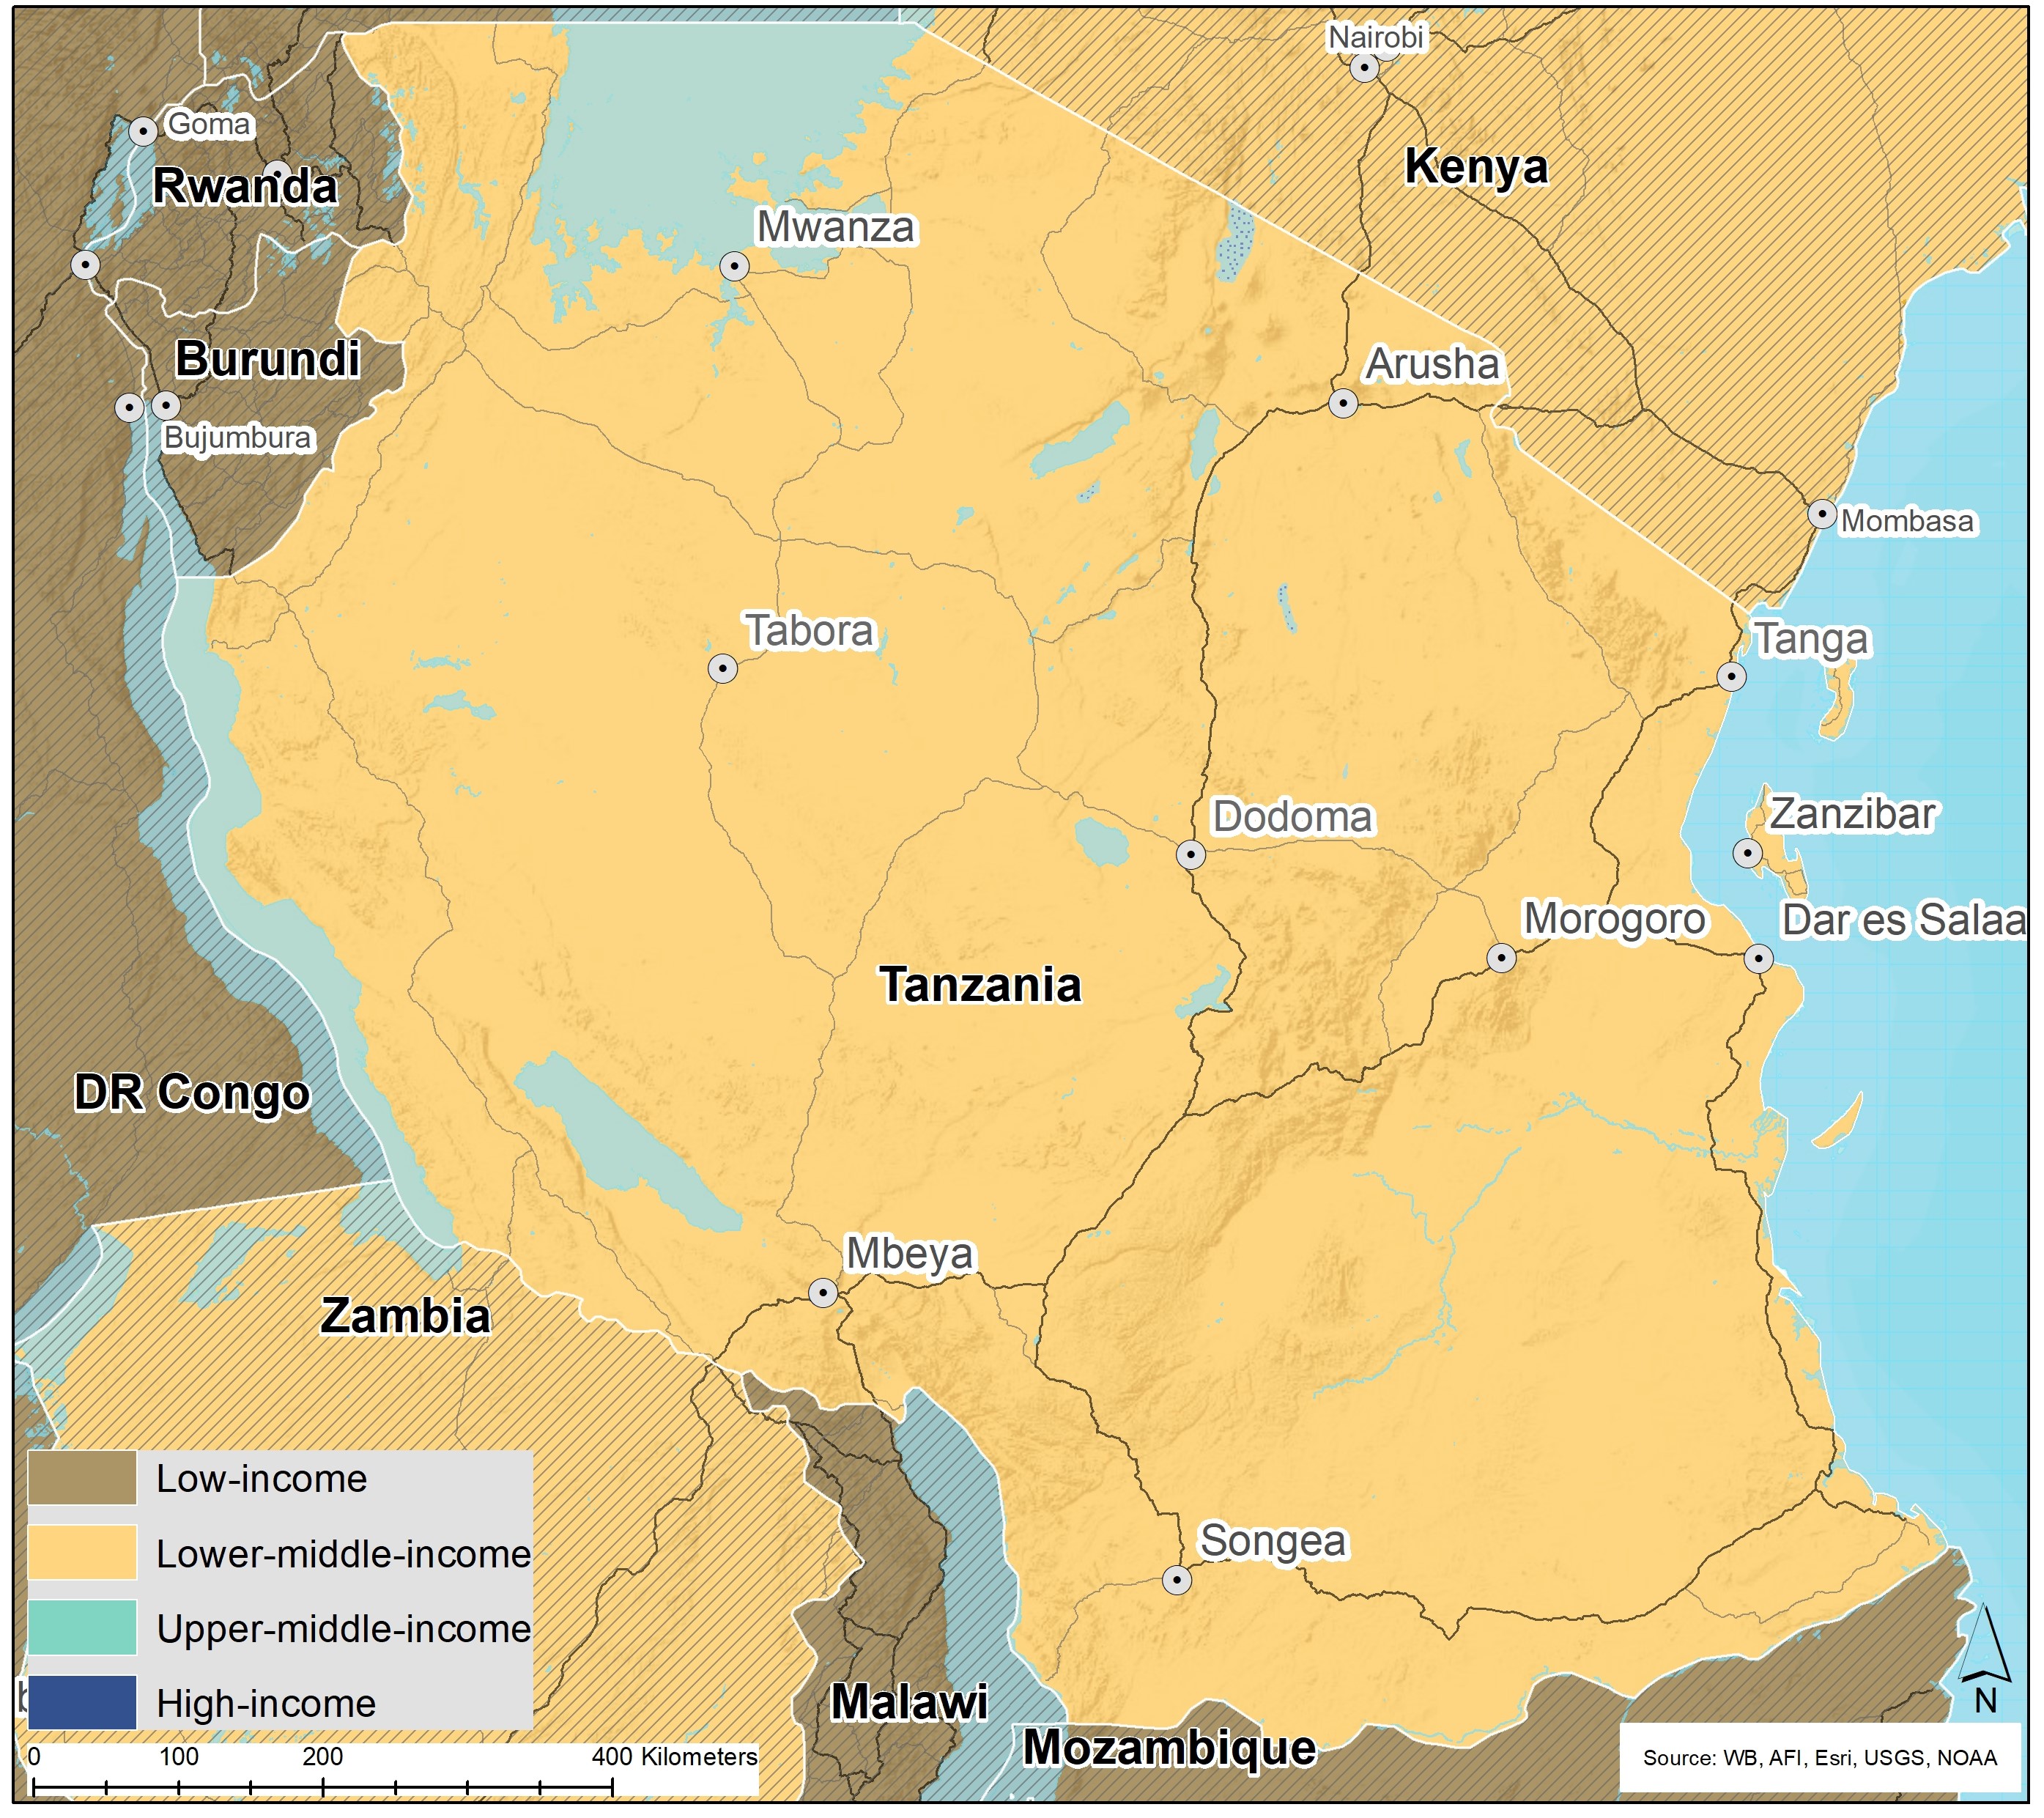
Chart 2 presents the Current Path of the population structure, from 1990 to 2043.
Tanzania has a young and rapidly expanding population, with a median age of just 18.4 years. At independence in 1963, Tanzania’s population stood at around 11 million. By 2000, it had more than tripled to 34.5 million, and by 2023, it had nearly doubled again to reach 65.5 million. On the Current Path trajectory, the population will reach 110.5 million by 2043.
Although fertility rates are gradually declining, the pace remains slow. In 2023, the fertility rate was 4.6 children per woman, and by 2043, it is expected to fall to 3.3. This remains consistently higher than the average for African lower-middle-income countries, indicating that rapid population growth will continue to shape Tanzania’s development outlook. Various factors contribute to Tanzania’s high fertility and rapid population growth, including its large informal economy (46% of GDP in 2023), low levels of urbanisation (38% in 2023) and education (an average of 7.8 years of schooling among adults over 15) also contribute, as does the relatively early age of marriage—two years below the average of its peer group. These structural characteristics are such that they outweigh the fact that Tanzania has slightly higher access to modern contraceptives (at 40% in 2023) than the average for lower-middle-income Africa (at 37%).
Like many countries in sub-Saharan Africa, the population of Tanzania is predominantly young, with 43% under the age of 15 in 2023, gradually declining to 36% in 2043. About 54% of the Tanzanian population is in the 15-64 working-age group, and this will increase to 60% by 2043. The proportion aged 65 and older was 3% in 2023, slightly increasing to 4% in 2043. This gradual shift means the number of working-age Tanzanians will grow faster than the number of dependants. If the economy can absorb these new workers productively, the country can reap what is known as the demographic dividend: a period when a high ratio of workers (15-64 years) to dependants (0-14 years of age and 65+) accelerates economic growth. In practice, this tends to occur once the ratio exceeds about 1.7 workers per dependant, but the dividend is never automatic. It requires heavy, sustained investment in quality education, accessible healthcare, decent job creation and women’s full economic participation. In 2023, Tanzania’s ratio of working-age population to dependants was estimated at 1.2:1, meaning there were 1.2 individuals of working age for every one dependant. It is projected to enter this window only after 2050 under the Current Path. Yet the groundwork must be laid now if the potential of its youthful population is to be unlocked.
Tanzania also has a large youth bulge at 48.9% in 2023, defined as the ratio of the population between 15 and 29 years to the total adult population (15+ years of age). A large number of young adults can lead to positive political change in a country through youth activism, but they can also carry the seeds for socio-political instability in the absence of economic opportunities. On the Current Path, Tanzania’s youth bulge will decline to 43.6% by 2043.
Chart 3 presents a population distribution map for 2023.
Tanzania’s population density is shaped by geographic, economic and demographic factors. As of 2023, Tanzania had an overall average population density of approximately 0.75 persons per hectare, while urban areas recorded a significantly higher average density of 28.3 persons per hectare. Tanzania’s population density remains low compared to the average for LMICs in Africa.
The country is divided into a total of 31 administrative regions, with 26 located on the mainland and 5 in the Zanzibar archipelago. Located on the Swahili coast, Dar es Salaam is the most populous urban region in East Africa, with over 5 million residents (about 8% of the national total), which serves as the economic and former administrative capital. Beyond Dar es Salaam, the only regions with populations above three million are Mwanza, Tabora, Morogoro and Dodoma. Dodoma was designated as Tanzania’s new capital in 1974 by President Julius Kambarage Nyerere, with the goal of fostering more centralised governance and balanced national development due to its strategic central location within the country. However, the relocation process was slow and gradual, with significant progress only happening decades later. Between 2012 and 2022, the population of Dodoma Region increased by just over 1 million people. Other major cities include Arusha, Mbeya and Tanga.
Although Dar es Salaam and Dodoma often attract more attention due to their political and economic significance, it is Geita’s rapid regional demographic expansion that stands out most clearly in the 2022 census results. Between 2012 and 2022, Tanzania’s fastest-growing region in absolute population terms was Geita, which added over 1.2 million people, rising from 1.74 million to nearly 3 million residents. Tabora followed closely, expanding by about 1.1 million people, while Dar es Salaam and Dodoma each grew by just over one million. The Geita region’s population growth is driven largely by the gold mining sector, which directly and indirectly employs over 100 000 people. It has also been fuelled by productive agricultural land supporting surplus crop and livestock output. Yet this expansion has outpaced urban management capacity, as Geita Town has spread into surrounding rural villages that lack basic services. Despite its rich resources, the town remains heavily dependent on agriculture, while mining and agro-processing are not fully leveraged to improve local livelihoods or strengthen value chains. The Geita Town Master Plan (2017–2037) outlines a coordinated strategy to harness the region’s mining and agricultural potential by promoting value addition, strengthening local governance, and guiding sustainable urban development.
The least densely populated areas are Iringa (1.2 million), Katavi (1.2 million) and Njombe (0.9 million).
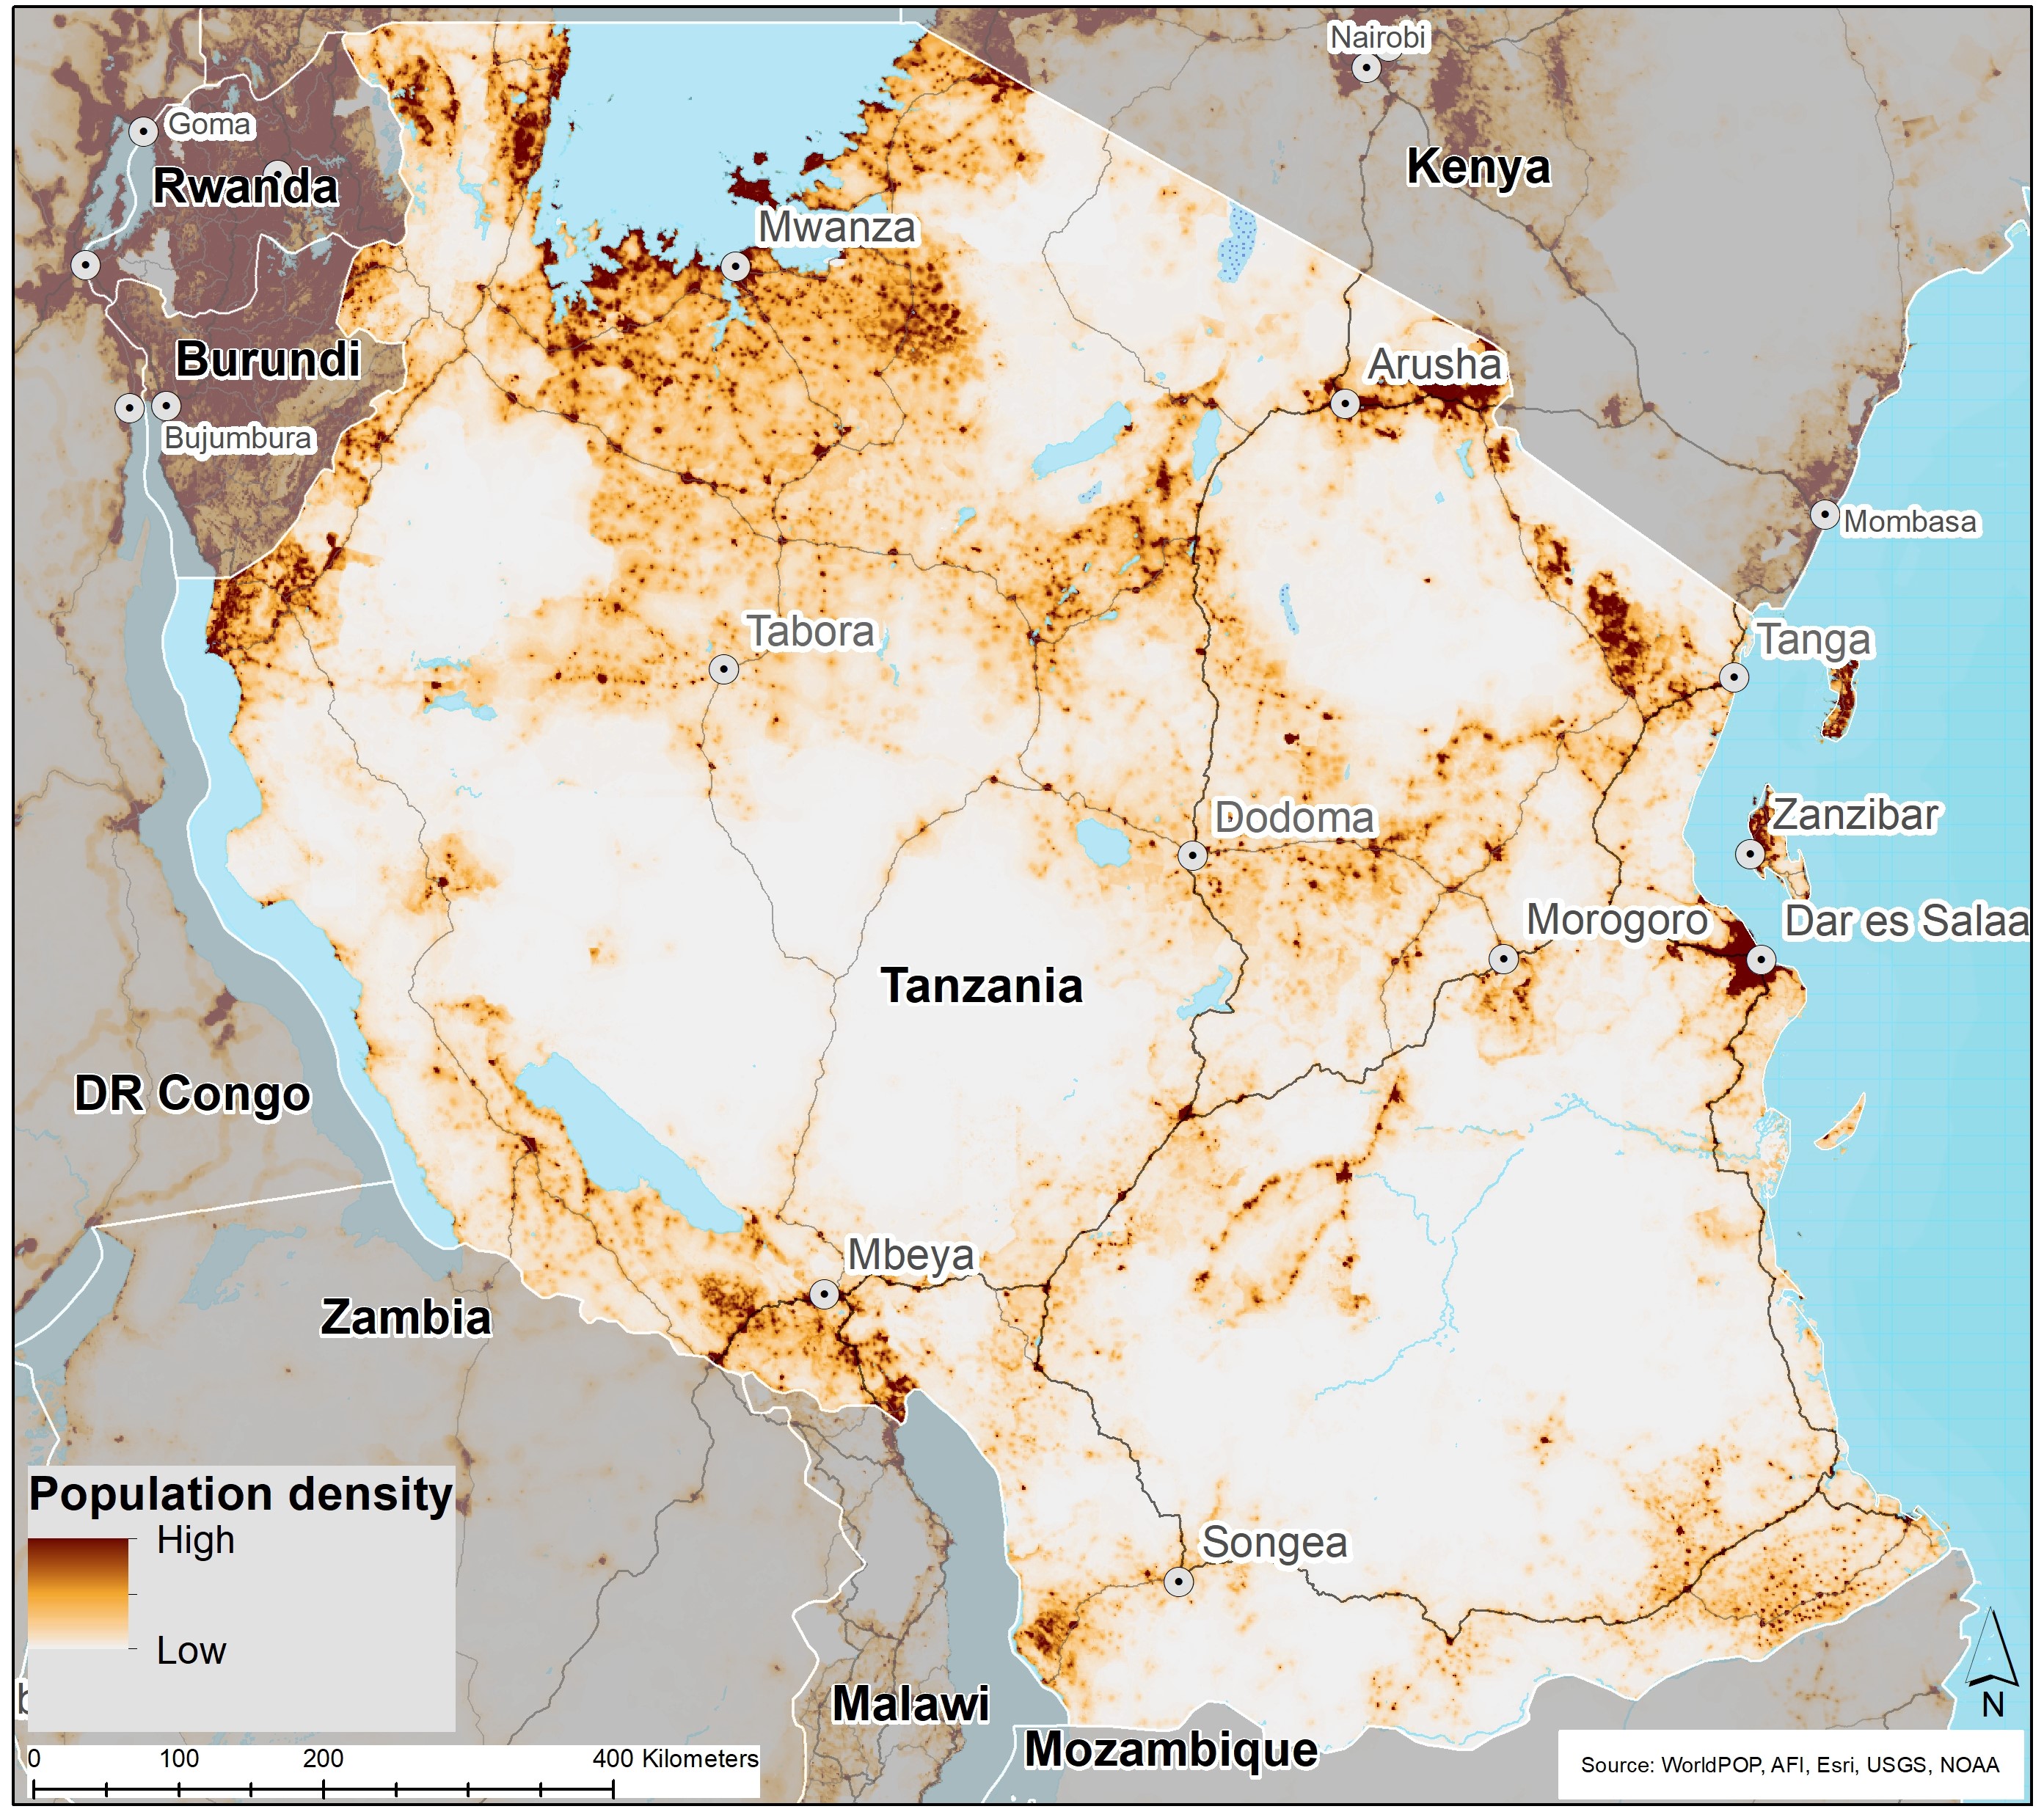
Chart 4 presents the urban and rural population in the Current Path, from 1990 to 2043.
Tanzania’s urban population rose from 22% in 2000 to 38% in 2023 and will reach 51% by 2043. Its urbanisation rate remains below the lower-middle-income Africa average (about 49.2% in 2023).
With around 41 million people still living in rural areas (about 62% of the population), migration to towns and cities is set to remain robust, especially among young people seeking jobs and services. On the Current Path, Tanzania must accommodate more than 30 million additional urban residents by 2043, concentrated in Dar es Salaam and fast-growing secondary cities such as Mwanza, Dodoma, Arusha and Morogoro, alongside extensive peri-urban expansion.
While urbanisation can raise productivity through agglomeration and scale effects, the payoff is not automatic: early, sustained investment in serviced land, affordable housing, public transport, water and sanitation, and policies that expand formal jobs and integrate informal settlements will be essential to realise the benefits.
Tanzania’s updated National Land Policy recognises that rapid urbanisation must be matched with stronger land governance. The 2023 reforms make land registration in planned areas mandatory, aiming to reduce informal transactions, strengthen tenure security and expand the tax base. A new national geospatial system and online geo-portal will integrate maps, surveys and land data, improving planning for urban expansion. The policy also opens space for foreign and diaspora investment in housing, with safeguards to protect citizen interests, and designates land banks to encourage more structured real estate development. In parallel, the reforms tackle weak inheritance rights for women and promote fairer access to land, helping to address gender imbalances that often worsen in urban contexts. By modernising registration systems, streamlining data and clarifying ownership, the policy seeks to guide urban growth more sustainably and inclusively.
Chart 5 presents GDP in market exchange rates (MER) and growth rate in the Current Path, from 1990 to 2043.
Tanzania’s economy is relatively diversified, with the agriculture sector accounting for about 23% of total value addition, industry around 26% and services nearly 51%. Agriculture continues to be Tanzania's primary source of employment, with two in three Tanzanians working in the sector.
Over the past two decades, Tanzania has built a track record of macroeconomic stability, even amid serious economic shocks such as the COVID-19 pandemic. Economic growth has been robust, with an annual average growth of around 6% between 2004 and 2023. Tanzania’s GDP tripled, from US$23.7 billion to around US$69.5 billion during the period. Fiscal balances have generally remained under control, inflation has stayed within single digits, and the investment climate has benefited from improvements in the business environment. This stability, combined with abundant natural resources and favourable demographics, has underpinned high levels of investment and rising productive capacity. Exports of gold, agricultural commodities and tourism services have further boosted growth by improving the country’s terms of trade.
Looking ahead, Tanzania’s economy is projected to expand from about US$69.5 billion in 2023 to roughly US$230.6 billion by 2043—an average annual growth rate of 6.1%. Yet the quality of this growth matters as much as the quantity. According to the World Bank, Tanzania’s progress to date has not translated into the depth of structural transformation or poverty reduction needed to meet its development ambitions. Public sector-led growth has delivered stability but is constrained in its capacity to drive broad-based development. To achieve the objectives outlined in Vision 2050, Tanzania will need to transition toward more inclusive, private sector-driven growth that generates productive jobs, especially for its rapidly expanding youthful workforce. This requires moving labour out of subsistence agriculture and informal activities into higher-value sectors, backed by sustained investment in education, health and infrastructure. Ensuring women and girls have equal access to opportunities will be central to unlocking human capital and capturing the demographic dividend. At the same time, building resilience to climate change will be essential to safeguard gains and prevent economic setbacks.
Chart 6 presents the size of the informal economy as per cent of GDP and per cent of total labour (non-agriculture), from 2020 to 2043. The data in our modelling are largely estimates and therefore may differ from other sources.
Informality in poorer countries stems not only from burdensome regulations or weak enforcement but also from broader conditions of underdevelopment. In wealthier economies, advanced technologies and favourable economic environments encourage workers to pursue formal wage employment, largely due to higher earnings. Likewise, managers are more inclined to register and operate within the formal sector, since the greater income opportunities in developed markets outweigh the costs of taxes and regulations. As economies progress, the informal sector generally contracts. According to a World Bank study, roughly 30% of aggregate output growth driven by productivity gains is associated with about a 25% decline in the average size of informal enterprises.
According to the International Labour Organization (ILO), ‘the informal economy refers to all economic activities by workers and economic units that are–in law or practice–not covered or insufficiently covered by formal arrangements’. The ILO definition of employment in the informal economy excludes the agricultural sector.
Despite ongoing policy initiatives, high informality persists in Tanzania. In recent years, the government has revised its National Employment Policy to expand formal jobs, updated the SME Development Policy to help small businesses move from the informal to the formal sector, strengthened the PPP framework to boost private sector-led employment, and introduced tax and registration reforms to lower barriers for businesses. While these measures aim to promote formalisation, their impact has so far been limited. The informal sector dominates Tanzania’s economy, accounting for 46% of GDP in 2023. This was the second-highest share in Africa, surpassed only by Zimbabwe at 54%. This means that a significant portion of Tanzanians are not registered or taxed. On the Current Path, Tanzania’s informal economy as a percentage of GDP will gradually decline to 39% in 2043.
The informal economy as a percentage of total labour stood at 76% in 2023, more than any African LMIC and ranked 4th highest when compared to all LMICs. Tanzania is expected to remain far above peer levels in the coming decades, declining only to 69% by 2043 compared to an African LMIC average of 54%.
Informality in Tanzania endures because of deep structural and institutional barriers. The economy remains dominated by smallholder agriculture and low-capital enterprises such as petty trade, small services, informal construction and home-based processing—activities that require little investment but yield low productivity. Formal job creation has not kept pace with rapid population growth, leaving the informal sector to absorb the roughly new workers who enter the labour market annually, which was estimated to be about 800 000 annually in 2022.
Complex registration and tax systems, weak enforcement capacity and fragmented policies further discourage formalisation. At the same time, low skills, limited access to finance and the cultural acceptance of informal work—especially among youth and women—sustain its appeal. Rapid urbanisation, combined with external shocks such as climate stress and COVID-19, has only reinforced the role of the informal economy as Tanzania’s shock absorber by providing livelihoods where the formal sector cannot, and making it the default rather than the exception in the country’s labour market.
Chart 7 presents GDP per capita in the Current Path, from 1990 to 2043, compared with the average for the Africa income group.
After two decades of sustained economic growth, Tanzania was reclassified by the World Bank from low-income to lower-middle-income status in July 2020. The shift occurred when its GNI per capita reached US$1 080, surpassing the LMICs threshold of US$1 036 at the time, with a GDP per capita (PPP) of US$2 565 in 2019. Despite this milestone, Tanzania’s GDP per capita remains among the lowest of Africa’s LMICs, higher only than that of Lesotho and Zimbabwe, and is likely to stay at the lower end of the group across many development indicators on the Current Path.
However, this has not translated into improved livelihoods. In 2023, Tanzania’s GDP per capita (PPP) was US$2 582, the third lowest amongst its peer grouping of Africa’s LMICs (ahead of Lesotho and Zimbabwe), and ranking 31st in Africa. By 2043, it will reach US$4 306, maintaining a pattern of underperformance relative to both its peer group (US$7 805) and the continental average (US$6 207).
The persistence of low per capita incomes reflects a pattern of growth that has been narrow, uneven and weakly transformative. Tanzania’s draft Vision 2050 acknowledges that, despite two decades of stable growth averaging 5-7% annually, the impact on poverty reduction has been limited. Growth has not been underpinned by sufficient diversification, productivity or export competitiveness. Much of the labour force remains in low-value agriculture or shifts into informal urban trade rather than higher-productivity manufacturing and services. Women, young people and people with disabilities are disproportionately concentrated in these low-paid informal jobs. Rapid population growth further dilutes output per head, while high levels of informality limit productivity, wages and fiscal revenues. Moreover, Tanzania has underutilised opportunities for value addition, regional integration and global value chains, leaving it vulnerable to shocks and reliant on low-productivity sectors.
Looking ahead, Vision 2050 sets an ambitious aspiration: to reach upper-middle-income status by 2050, which would require sustained annual growth of at least 10%. Achieving this will demand a decisive break from past growth patterns by building a more diversified, inclusive and globally competitive economy. The Vision stresses the importance of strengthening human capital, expanding productive employment and creating a predictable and enabling policy and regulatory environment to attract investment. In short, raising GDP per capita will depend not only on sustaining high growth, but on ensuring that growth is structurally transformative, inclusive and resilient.
Chart 8 presents the rate and numbers of extremely poor people in the Current Path from 2020 to 2043.
In 2022, the World Bank updated the poverty lines to 2017 constant dollar values as follows:
- The previous US$1.90 extreme poverty line is now set at US$2.15, also for use with low-income countries.
- US$3.20 for lower-middle-income countries, now US$3.65 in 2017 values.
- US$5.50 for upper-middle-income countries, now US$6.85 in 2017 values.
- US$22.70 for high-income countries. The Bank has not yet announced the new poverty line in 2017 US$ prices for high-income countries.
Starting with monetary poverty, using US$2.15, 40% of Tanzania’s population was considered extremely poor in 2023, equivalent to 26.8 million people. As a percentage of its total population, only Zambia, DR Congo and Lesotho had higher monetary poverty rates among Africa’s LMICs in 2023. On the Current Path, Tanzania’s extreme poverty rate will decline to 12% (or 13.2 million people) in 2043. Tanzania will still have a sizable extreme poverty burden but rank 10th instead of fourth in the portion of extremely poor people among Africa’s lower-middle-income countries.
While the US$2.15 extreme poverty line is used to monitor progress towards achieving Goal 1 of the Sustainable Development Goals (SDGs) towards eliminating extreme poverty by 2030, Tanzania is now categorised as a lower-middle-income country. The World Bank and others consider US$3.65 a more appropriate monetary poverty line than US$2.15 for these countries.
Using the US$3.65 per day poverty line, Tanzania had the second-highest poverty rate among its peer group in 2023, just behind Zambia. At this threshold, around 71% of Tanzanians (or 47.5 million people) were classified as poor. On the Current Path, this share will decline to 37% by 2043. However, due to rapid population growth, that still translates to 41.1 million people living in poverty.
Tanzania’s national basic needs poverty line was set at 49,320 Tanzanian shillings per adult per month in 2018 (about US$21.2, or roughly US$1.35 per person per day in PPP terms). Using this benchmark—which captures the minimum income required to cover both food and essential non-food needs—the poverty headcount declined from 38.6% of the population in 1991 to 26.4% in 2018, representing around 14 million people.
However, monetary poverty only tells part of the story. The global Multidimensional Poverty Index (MPI) measures acute multidimensional poverty by measuring each person’s overlapping deprivations across 10 indicators in three equally weighted dimensions: health, education and standard of living. The MPI complements the international US$2.15-a-day poverty extreme rate by identifying who is multidimensionally poor and also shows the composition of multidimensional poverty. The headcount or incidence of multidimensional poverty is often several percentage points higher than that of monetary poverty. This implies that individuals living above the monetary poverty line may still suffer deprivations in health, education and/or standard of living.
According to the 2024 Global MPI report, 47.2% of the population in Tanzania is multidimensionally poor, about eight percentage points higher than the monetary extreme poverty rate. An additional 23.1% of the population is also classified as vulnerable to multidimensional poverty. Multidimensional poverty is primarily concentrated on children aged 0-17 years, about 60%.
High poverty levels in Tanzania are shaped not only by the structure of growth, but also by the everyday vulnerabilities households face. Limited access to quality education, healthcare, clean water and electricity constrains human capital and locks many families into low-income trajectories. Rural households are particularly disadvantaged, relying heavily on rain-fed agriculture that is highly exposed to climate variability. Rapid population growth adds pressure on land and services. The government has introduced a range of initiatives to address these challenges, including the Productive Social Safety Net programme (PSSN), agricultural transformation strategies, and investments in health and education, yet coverage and impact remain uneven relative to need.
Chart 9 depicts the National Development Plan of Tanzania.
Tanzania has a long history of national development plans, dating back to the country's independence in 1961. The first five-year development plan was launched in 1964, and it was followed by a series of plans, each of which has been informed by the country's changing development priorities.
The early development plans in Tanzania were focused on achieving economic growth and self-reliance. The Arusha Declaration of 1967, a policy statement issued by the ruling party at the time, enshrined the principles of ujamaa (socialism) and self-reliance as the basis for the country's development. The development plans of the 1970s and 1980s focused on implementing these principles through policies such as the collectivisation of agriculture and the promotion of village industries.
In the early 1990s, Tanzania started to move towards a more market-oriented approach to development. The development plans of this period were therefore focused on promoting economic growth through private-sector investment and trade liberalisation. The National Development Vision 2025, launched in 1999, set a long-term goal for Tanzania to become a middle-income country by 2025. Vision 2025 was built around three pillars: ensuring a high quality of life for all Tanzanians, consolidating good governance and the rule of law, and creating a strong and competitive economy capable of withstanding global pressures.
To operationalise Vision 2025, Tanzania adopted successive Five-Year Development Plans (FYDPs). The First FYDP (2011/12–2015/16) emphasised infrastructure development and industrialisation; the Second FYDP (2016/17–2020/21) focused on advancing an industrial economy; and the Third FYDP (2021/22–2025/26), currently in effect, seeks to consolidate lower-middle-income status by accelerating economic transformation, strengthening human capital and promoting competitiveness.
Most recently, Tanzania has drafted the development Vision 2050, which extends the horizon of national planning and builds on the lessons of Vision 2025. It is built around three pillars supported by good governance, peace and stability:
- a strong, inclusive and competitive economy;
- human capabilities and social development;
- and environmental integrity and climate resilience.
Its six goals prioritise:
- Diversified, resilient, inclusive upper-middle-income economy.
- Eradicate poverty (with focus on women, youth, persons with disabilities) and balanced regional development.
- High quality of life: strong social services, human security, cohesion, cultural diversity, and national unity.
- Human capability maximised: harness women and a growing youth population for national development and global citizenship.
- Inclusive, transparent, accountable governance ensuring lasting peace, freedoms, and citizen security.
- Sustainable management of ecosystems and resources, with climate resilience.
Vision 2050 aspires to achieve upper-middle-income status by mid-century, requiring sustained double-digit growth rates. It diagnoses the limits of past growth—highlighting that while GDP expanded by 5-7% annually over two decades, poverty reduction has been modest and structural transformation limited. The Vision therefore emphasises diversification, productivity and global competitiveness, underpinned by human capital development, social inclusion and resilience to climate and external shocks. Together, Vision 2050 and the FYDP III frame Tanzania’s long-term path towards an inclusive and transformative growth model.
Chart 11 presents the mortality distribution in the Current Path for 2023 and 2043.
Visit the themes on Demographics and Health/WaSH for more details on the scenario structure and interventions.
Tanzania’s health sector has recorded important gains over the past two decades, notably in reducing maternal and under-five mortality and steadily expanding the health workforce. Recent recruitment drives have prioritised rural areas, while new legislation, the Universal Health Insurance (UHI) Act of 2023, establishes a framework for mandatory coverage and subsidised premiums for low-income households. These measures reflect the government’s commitment to universal health coverage and are complemented by plans to train over 100 000 community health workers to strengthen service delivery at the community level.
Despite these advances, the sector continues to face serious systemic constraints. The workforce shortage remains acute: current estimates suggest that closing the 66% human resources gap would require hiring around 200 000 additional health workers, particularly at the primary care level. Infrastructure and supply deficits also persist, with shortages of health facilities, medical equipment and essential drugs undermining service quality. High fertility rates add to the pressure by generating sustained demand for maternal and child health services.
Financing is another weak spot. Tanzania spends less on health than its East African Community peers, translating into fewer doctors, health workers and hospital beds per capita, although life expectancy is slightly higher. Recent increases in government health expenditure—and the gradual reduction in donor dependence—mark a positive shift, but out-of-pocket payments remain significant, leaving many households vulnerable to catastrophic costs.
Nutrition challenges, with stunting rates above 30% in some regions, further compound the picture. Recognising these pressures, Tanzania has embraced digital health innovations, including telemedicine, electronic hospital management systems and the m-mama emergency transport programme to reduce maternal deaths. Yet gaps in ICT infrastructure, electricity supply and health worker skills still constrain their full impact.
Tanzania also needs to improve on various indices of basic infrastructure. For example, among Africa’s 23 LMICs, it had the second-largest population still dependent on unimproved sanitation services and the seventh-largest population dependent on unimproved water supply, at 35% and 14%, respectively, in 2023.
Communicable diseases (CDs) remain the leading cause of illness and death in Tanzania, with lower respiratory infections being a major contributor. In 2023, the country recorded an estimated 37 100 lower respiratory-related deaths. The most common respiratory conditions in the country are pneumonia, tuberculosis and HIV-associated respiratory illnesses. Since 2020, the COVID-19 pandemic has driven a sharp rise in lower respiratory illness and emerged as a leading cause of respiratory morbidity and mortality in Tanzania.
Non-communicable diseases (NCDs), particularly cardiovascular conditions and malignant neoplasms, remain the leading causes of death among the elderly. At the same time, Tanzania has made notable progress in recent years on key health outcomes. The stunting rate among children under five has fallen sharply, from about 49% in the 1990s to 29.1% in 2023, just 2.7 percentage points above the African LMICs average of 26.5%. On its Current Path, Tanzania is projected to meet the SDG target of 25% by 2030, with stunting expected to decline further to 24.1% by 2030 and 16.3% by 2043.
Maternal mortality has declined from 997 deaths per 100 000 live births in 1990 to 213.9 in 2023, compared with an average of 494.2 for LMICs in Africa. The reduction in maternal mortality can be attributed to various factors, including improvements in healthcare systems, policies and community engagement. On the Current Path, Tanzania's maternal mortality rate will decline further, reaching 159 deaths per 100 000 live births by 2030—significantly above the SDG target of fewer than 70 deaths per 100 000 live births—and 68.7 deaths per 100 000 live births by 2043.
Child (under five) mortality has also declined from 198 deaths per 1 000 live births in 1990 to about 100 deaths in 2023, while life expectancy has increased from 50.7 years to 68 years over the same period.
With a declining trend in deaths from CDs and a rising trend in deaths from NCDs, Tanzania is forecast to undergo its epidemiologic transition in 2029, when NCD-related death rates will surpass those from CDs. This transformation is driven by demographic shifts, urbanisation, changing lifestyles and improved access to healthcare. The growing burden of NCDs poses significant challenges for Tanzania's healthcare system, given the higher costs associated with treating NCDs, requiring substantial investments to build the capacity needed to address this evolving health landscape. NCD care is lifelong and monitoring-intensive; without stronger prevention and primary care, the transition will strain an already constrained health budget.
Both Vision 2025 and the draft Vision 2050 place human capital and health at the centre of Tanzania’s development strategy. The emphasis is on universal healthcare, maternal and child survival, prevention and tackling NCDs, alongside systemic reforms to ensure that the health sector can deliver inclusive, resilient and high-quality services.
The Demographics and Health scenario envisions ambitious improvements in child and maternal mortality rates, enhanced access to modern contraception, and decreased mortality from communicable diseases (e.g., AIDS, diarrhoea, malaria, respiratory infections) and non-communicable diseases (e.g., diabetes), alongside advancements in safe water access and sanitation. This scenario assumes a swift demographic transition supported by heightened investments in health and water, sanitation and hygiene (WaSH) infrastructure.
Chart 12 presents the infant mortality rate in the Current Path and in the Demographics and Health scenario, from 2020 to 2043.
The infant mortality rate is the probability of a child born in a specific year dying before reaching the age of one. It measures the child-born survival rate and reflects the social, economic and environmental conditions in which children live, including their health care. It is measured as the number of infant deaths per 1 000 live births and is an important marker of the overall quality of the health system in a country.
Infant mortality in Tanzania is relatively high compared to the average of its peer group, although it has improved drastically since 1990, when it stood at 100.8. This positive trend is expected to continue, with infant mortality estimated at 39 deaths per 1 000 live births in 2023. The contributors to high infant mortality rates in Tanzania include poverty, malnutrition, infectious diseases such as malaria and pneumonia and limited health care access. On the Current Path, it will decline further to around 22.4 by 2043.
In the Demographics and Health scenario, which assumes more ambitious investments in health, Tanzania’s rate could fall even further to 17 deaths per 1 000 live births by 2043, which will be six deaths per 1 000 below the Current Path in the same year.
Chart 13 presents the demographic dividend in the Current Path and in the Demographics and Health scenario, from 2020 to 2043.
The dividend is the window of economic growth opportunity that opens when the ratio of working-age persons to dependants increases to 1.7 or higher.
Greater access to modern contraception, combined with appropriate education and information, will significantly reduce Tanzania’s total fertility rate, which stood at 4.6 births per woman in 2023. Modern contraceptive use is projected to rise from 40.1% in 2023 to 56.6% by 2043.
In the Demographics and Health scenario, fertility declines more rapidly, reaching 2.7 births per woman by 2043, compared to 3.3 on the Current Path. A lower fertility rate will slow population growth, resulting in four million fewer people by 2043 (107 million instead of 111 million). As a result, Tanzania would enter its demographic window of opportunity by 2043, in line with the average for its LMIC peers and seven years earlier than on the Current Path, where this threshold is only reached by 2050.
While entering a demographic window of opportunity is a critical milestone, the demographic dividend is not automatic. Reaping its full benefits depends on the extent to which Tanzania can create the right enabling conditions, such as quality education, accessible healthcare, sufficient job creation, higher labour productivity and strong institutions. Without these foundations, a larger working-age population may translate into rising unemployment and growing inequality, rather than economic gains. It is therefore essential that Tanzania invests in these areas now, well before the window opens, to ensure the workforce is healthy, skilled and productively employed when the opportunity arises.
Chart 14 presents crop production and demand from 1990 to 2043.
The Agriculture scenario envisions an agricultural revolution that ensures food security through ambitious yet feasible increases in yields per hectare, thanks to improved management, seed, fertiliser technology and expanded irrigation. Efforts to reduce food loss and waste are emphasised, with increased calorie consumption as an indicator of self-sufficiency and prioritising it over food exports. Additionally, enhanced forest protection signifies a commitment to sustainable land use practices.
Visit the theme on Agriculture for our conceptualisation and details on the scenario structure and interventions.
Agriculture forms the backbone of Tanzania’s economy, providing employment, food security and foreign exchange earnings. The country’s diverse agro-climatic conditions allow for the cultivation of a wide range of crops, from subsistence staples to commercial cash crops for export. Alongside agriculture, mineral resources, particularly gold, also play a pivotal role in shaping the nation’s export profile.
Tanzania possesses around 44 million hectares of arable land, yet only about a quarter, roughly 10.8 million hectares, is currently cultivated. The country has vast irrigation potential, estimated at 29.4 million hectares, of which 2.3 million are rated high potential and 4.8 million moderate. Despite this resource base, agriculture remains dominated by smallholders, most cultivating less than five hectares under rain-fed conditions, with limited use of fertiliser, improved seed or mechanisation. High post-harvest losses, volatile prices and weak market access continue to suppress productivity and profitability, reinforcing rural poverty and food insecurity. According to the 2022 Population and Housing Census, about 5.1 million households, roughly 40 million people or 65.6% of the population, are engaged primarily in agriculture. Smallholders account for about 80% of cultivated land and produce most of the country’s food supply, though their output fluctuates widely with rainfall variability.
To promote agricultural transformation, Tanzania is expanding the Southern Agricultural Growth Corridor (SAGCOT) model into a nationwide framework, the Agricultural Growth Corridors of Tanzania (AGCOT), covering the Southern, Northern, Lake Zone and Mtwara corridors. The initiative seeks to attract investment, strengthen logistics and align production with regional agro-ecological advantages. While the corridor approach has catalysed investment and export diversification in targeted zones, the benefits remain spatially uneven, with limited spillovers to rain-dependent and food-deficient regions.
Tanzania’s food self-sufficiency ratio (SSR) rose to 128% in 2023/24, up from 124% the previous year, suggesting that national food production exceeded domestic consumption. This surplus was supported by good rainfall, the rollout of fertiliser and seed subsidies and improved management practices. However, the national figure conceals localised food insecurity. The IPC Tanzania Acute Food Insecurity Report found that around 900 000 people (13%) were in crisis (phase 3) and 2.2 million (31%) in stressed (phase 2) conditions during the same period. Such regional disparities reflect systemic weaknesses: the predominance of rain-fed smallholder farming, inadequate irrigation coverage, poor storage and transport infrastructure, and weak market integration that prevents surplus regions from offsetting deficits elsewhere.
At the same time, agricultural exports surged to USD 3.54 billion in 2023/24, up from USD 2.33 billion the year before, driven by strong global demand and high prices for cash crops such as cashew nuts, coffee, tobacco and cotton. These export gains underscore the success of commercial agriculture policies and input support programs but highlight a growing duality within the agricultural sector. Export-oriented crops are concentrated in high-potential regions and produced by better-capitalised farmers, while staple foods, maize, rice, cassava and beans, remain smallholder-dominated and vulnerable to climatic and market volatility. As a result, Tanzania can simultaneously record a rising SSR and booming exports while millions still face food insecurity.
This dual-track agricultural economy, commercial and export-driven on one side, subsistence and fragile on the other, reveals a pattern of progress laced with persistent structural imbalance. National food availability and export earnings are improving, yet household food access and nutritional security lag behind. Addressing this divide will require targeted investment in irrigation, rural infrastructure and storage, together with policies that integrate smallholders into value chains and strengthen resilience to climate shocks. Only then can Tanzania’s agricultural growth become both competitive and inclusive.
In 1990, crop demand stood at 19.1 million metric tons while crop production was slightly higher at 19.3 million metric tons, indicating near parity between the two indicators. This balance persisted through the early and mid-1990s, with both demand and production exhibiting modest fluctuations. Between 2010 and 2020, Tanzania sustained a moderate surplus. In 2023, crop demand stood at 48.6 million metric tons while crop production was slightly higher at 49.9 million metric tons. Agriculture demand will outpace production at an accelerating pace from 2028 onwards. By 2043, demand will reach 90.7 million metric tons compared to 68.2 million metric tons of production. The forecasted deficit of 22.5 million metric tons by 2043 highlights the need for sustained investment in agricultural modernisation, climate-resilient practices and value chain development.
This gap mirrors that of the broader lower-middle-income Africa group, where production has never outpaced demand and the deficit has grown from 14 million metric tons in 1990 to 340 million metric tons by 2043. Both the national and regional trajectories reveal that achieving food security will require not only scaling up aggregate production but addressing the systemic barriers that limit productivity, resilience and inclusive sectoral growth.
Chart 15 presents the import dependence in the Current Path and the Agriculture scenario, from 2020 to 2043.
Despite recent progress in boosting local production, Tanzania remains heavily dependent on agricultural imports for key inputs. In 2023/24, over a fifth of national seed availability came from imports, with particularly high reliance on vegetable seeds (73.5%) and soybeans (70.3%), while even strategic staples such as maize and wheat still required significant external sourcing. Fertiliser dependence is even more pronounced: although domestic output has expanded nearly fourfold in five years, imports continue to account for around 60% of the national supply. The country also faces a structural deficit in edible oil production, with a 350 000-ton annual shortfall met largely through imports of palm oil. This reliance on imported inputs exposes Tanzania’s agriculture to global price shocks and supply disruptions, underscoring the need to accelerate investment in local seed systems, fertiliser production and oilseed processing to strengthen food system resilience.
In 2023, Tanzania’s agricultural crop net import dependence as a percentage of demand was -0.9%—a crop trade surplus. On the Current Path, it will reach a deficit of 25.4% by 2043. The Agriculture scenario will reduce agriculture crop import dependence by 11.9 percentage points compared to the Current Path, to 13.5% in 2043.
Chart 16 depicts the progress through the educational system in the Current Path, for 2023 and 2043.
The Education scenario represents reasonable but ambitious improvements in intake, transition, and graduation rates from primary to tertiary levels and better quality of education at primary and secondary levels. It also models substantive progress towards gender parity at all levels, additional vocational training at the secondary school level, and increases in the share of science and engineering graduates.
Visit the theme on Education for our conceptualisation and details on the scenario structure and interventions.
Tanzania has made significant strides in expanding access across pre-primary, primary and secondary education, but continues to wrestle with quality, equity and outcomes. The newly launched Education Sector Development Plan (ESDP 2025/26–2029/30) seeks to consolidate gains and tackle these challenges with targeted reforms.
The country has made significant progress in primary school enrolment, with gross enrolment increasing from 34% in 1970 to 98% in 2023, slightly below the average of 101% for Africa’s lower-middle-income countries.
Gross enrolment refers to the total number of students enrolled at a given education level, regardless of age, while net enrolment counts only those within the official age group—making net enrolment a better measure of age-appropriate access to education. Tanzania’s net enrollment in primary schools increased substantially from 51% in 1993 to 90% in 2023.
Primary school enrolment increased from 485 470 in 1961 to 11.4 million in 2023. Despite major national progress, enrolment declined in half of Tanzania’s regions between 2022 and 2023, highlighting persistent regional inequalities in access to education. According to the 2022 Population and Housing Census (PHC), the regions with the lowest primary net enrolment were Rukwa, Katavi and Tabora. The highest net enrolment was observed in Mjini Magharibi, Kusini Unguja and Dar es Salaam.
Despite high primary enrolment, the transition to and completion of lower-secondary education remains a major challenge. In 2023, gross enrolment was 46% and the completion rate was just 35%. On the Current Path, completion will reach 54% by 2043, but rural children, especially girls, continue to face barriers such as distance to schools, affordability and cultural norms. Urban areas outperform rural ones across both access and completion, while gender gaps persist: girls are more likely to drop out due to early marriage, pregnancy or household responsibilities.
At the upper-secondary stage, participation is even more limited. Upper-secondary gross enrolment stood at 9% in 2023 and will increase to 33% by 2043, with completion rates at 7% and 30%, respectively. Tanzania lags behind its peer group of lower-middle-income countries that had an average completion rate of 35% and 48% in 2023 and 2043, respectively.
In 2023, tertiary gross enrolment stood at 5%, well below the average of 16% for lower-middle-income African countries and placing it last (23rd) in the group. On the Current Path, tertiary gross enrolment will increase to 15% in 2043, compared to the group average of 23%. This means Tanzania moves up one spot to 22nd out of the 23 lower-middle-income African countries, ahead only of Mauritania. The average tertiary completion for the group was 16% in 2023 and will increase to 23% in 2043.
Tanzania’s technical and vocational education and training (TVET) sector has expanded quickly, with enrolment now exceeding half a million students across more than 1 300 institutions—almost triple the size of the higher education sector. Access has widened through Folk Development Colleges and Vocational Training Centres, which particularly serve rural youth, girls and school dropouts, but overall coverage is far from adequate.
Despite this expansion, participation remains extremely limited: the gross enrolment ratio was only 2.5% in 2020/21, one of the lowest in the region. Training quality and labour market alignment remain weak. Completion rates in critical technical fields such as engineering, petrol and gas are below 50%, and tracer studies show that many graduates struggle to find formal employment, often relying on informal networks rather than structured employer linkages. At the same time, employers tend to value diploma and certificate holders. However, there is strong potential for further development as TVET becomes more established as an important complement to academic education.
Governance and financing challenges further constrain the sector. Oversight is fragmented across multiple ministries. While reforms are underway, structural constraints in financing, institutional authority and alignment with labour market demands continue to limit TVET’s capacity to drive industrialisation and meaningful employment.
Chart 17 presents the mean years of education in the Current Path and in the Education scenario, from 2020 to 2043, for the 15 to 24-year age group.
The average years of education in the adult population aged 15 to 24 is a good first indicator of how the stock of knowledge in society is changing.
Another way of measuring the general level of education in a country is to look at the mean level of adult education. Tanzania’s mean years of education have increased rapidly since 1990, rising from 5 to 8.1 by 2023. In 2023, Tanzania ranked 18th on the continent and 9th among African LMICs for mean years of education in this youth cohort.
This progress reflects sustained policy momentum and a renewed government drive to improve the quality, relevance and inclusivity of education. Tanzania is implementing a comprehensive reform of the 2014 Education and Training Policy, anchored in a new curriculum introduced in 2023, with full execution expected by 2027. At the core of this reform is a restructured education system (1+6+4+2/3+3), comprising one year of kindergarten, six years of primary schooling, four years of lower secondary, two to three years of upper secondary, and three years of tertiary education. Under the new framework, compulsory education will extend from seven to ten years, ensuring that all children complete both primary and lower-secondary levels.
The reform represents a decisive shift from a purely academic orientation to a skills-based learning model, better aligned with labour market demands and the country’s development priorities. To modernise learning content, the curriculum introduces vocational training from the first year of secondary school and expands subject offerings to include business studies, tailoring, performing arts, home economics, food and nutrition, religious education, ICT, languages and life skills. Kiswahili will serve as the medium of instruction for Tanzanian history and ethics, reinforcing cultural identity and national cohesion.
On the Current Path, mean years of education for youth aged 15-24 will rise to 9.3 years by 2043, reaching 9.5 years for females and 9.1 years for males. Under the Education scenario, this increases slightly to 9.7 years for the total cohort, with females averaging 9.8 years and males 9.5 years, reflecting accelerated investment and reform in the education sector.
Chart 18 presents the value-add by sector as share of GDP in the Current Path, for 2023 and 2043.
Tanzania’s economy is undergoing a gradual structural shift, with services already established as the dominant sector. In 2023, services accounted for just over half of GDP (50.8%) and will expand their share to 60.4% by 2043, reflecting the growing role of trade, finance, transport and other service industries in driving growth. Agriculture, by contrast, contributed just under a quarter (23%) of GDP in 2023 but is expected to decline sharply to 9% by 2043, consistent with the long-term transition away from subsistence farming as productivity rises in other parts of the economy.
Industry is set to play an increasing role. Manufacturing was the third-largest contributor in 2023 at 12% of GDP and will rise steadily to 15.2% by 2043, supported by industrialisation strategies and regional integration. The materials sector, which includes mining, is also projected to expand, increasing from 6.5% in 2023 to 8.6% by 2043, reflecting Tanzania’s mineral endowments and rising global demand. Smaller but fast-growing sectors will also gain ground: information and communication technologies (ICTech) are projected to rise from 3.8% to 5.2% of GDP, while energy decreases from 3.8% to 1.7% over the same period.
Chart 19 presents the contribution of the manufacturing sector to GDP in the Current Path and in the Manufacturing scenario, from 2020 to 2043. The data is in US$ and % of GDP.
The manufacturing sector in Tanzania is at a developing stage but has demonstrated significant potential to drive economic growth, diversification and job creation. While the sector currently contributes a modest share to the national GDP compared to agriculture and mining, it is increasingly recognised by policymakers as a cornerstone for industrial transformation under initiatives such as Tanzania’s Industrialization Development Strategy 2025.
One of the most promising areas for growth lies in agro-processing, given Tanzania’s abundant agricultural production. Processing crops such as cashew nuts, coffee, cotton, tea and tobacco not only adds value but also increases export earnings and reduces the country’s reliance on exporting raw commodities. Expanding agro-processing industries could create strong backward linkages with farming communities, enhance food security and support rural development.
In addition, Tanzania’s textiles and apparel industry holds significant potential, especially given the availability of domestically grown cotton. With the right investments in technology, skills and production capacity, Tanzania could leverage regional and global value chains, particularly through trade agreements such as the African Continental Free Trade Area (AfCFTA). Furthermore, renewable energy integration offers a path for strengthening the resilience of manufacturing industries by ensuring a reliable and sustainable power supply—an area that has traditionally been a bottleneck for industrial productivity.
On the Current Path, Tanzania’s share of the manufacturing sector value-added in GDP will increase to 15.2%, below the projected average of 17.2% for LMICs in Africa in 2043. The implementation of the Manufacturing scenario could further push the share of the manufacturing sector in GDP to 17.3% by 2043.
However, several challenges must be addressed for Tanzania’s manufacturing sector to reach its full potential. Infrastructure limitations, including transport and logistics inefficiencies, raise production costs and hinder competitiveness. Access to finance remains a barrier, particularly for small and medium-sized enterprises (SMEs) that form the backbone of industrial activity. Additionally, skills development is a critical need; without a skilled workforce trained in modern manufacturing techniques, productivity gains will remain limited.
Chart 20 depicts exports and imports as a percentage of GDP, from 2000 to 2043, in the Current Path and in the AfCFTA scenario.
Since 1996, Tanzania’s economy has been less open to international trade compared to the averages for both low-income and lower-middle-income countries in Africa, as reflected in its declining trade-to-GDP ratio. The share fell from 65.6% of GDP in 1995 to 51.9% in 1996, and has never returned to its 1995 level, reaching just 32.2% in 2023. This persistent decline is largely explained by structural challenges, including low domestic productivity, a negative trade balance driven by rising imports, heavy reliance on primary commodities with volatile prices and insufficient growth in non-traditional exports.
Agriculture remains central to Tanzania’s export earnings, with cashew nuts, coffee, cotton, tea, tobacco and cloves, all highly valued commodities in the global market, however, subject to global price volatilities. In recent years, however, the mining sector, particularly gold, has surpassed agriculture as the leading source of export revenue. Gold now provides the bulk of foreign exchange, reflecting the country’s growing reliance on mineral wealth alongside its traditional agricultural base.
Tanzania has been a member of the World Trade Organisation (WTO) since 1 January 1995, following the conclusion of the Uruguay Round negotiations and the transition from the General Agreement on Tariffs and Trade (GATT). As a member, Tanzania is bound by WTO rules on trade in goods, services and intellectual property, and participates in multilateral negotiations aimed at promoting free and fair trade. Tanzania is party to several other trade agreements.
It is a full member of the East African Community (EAC), a regional bloc that operates both a customs union and a common market. Through the EAC framework, member states enjoy the free movement of goods, services, people and capital, fostering deeper economic integration and cross-border trade. The country is part of the Southern Africa Development Community (SADC), where it participates in regional trade protocols designed to harmonise tariffs and grant preferential treatment to goods traded among member states. Membership in both the EAC and SADC provides Tanzania with expanded access to regional markets and opportunities to strengthen its role in intra-African trade.
As a member of EAC and SADC, Tanzania is also part of the broader Tripartite framework that brings together EAC, COMESA and SADC into a kind of umbrella free-trade area to harmonise and expand trade within the region (signed but ratification is pending). Tanzania signed the African Continental Free Trade Area Agreement (AfCFTA) on 21 March 2018 and ratified it on 17 January 2022. The AfCFTA represents a major opportunity for African countries, including Libya, to overcome the constraints of narrow domestic markets and boost exports, as tariff and non-tariff barriers are eliminated.
In 2023, Tanzania’s exports accounted for about 13.7% of GDP, a 10.3 percentage point below the 1995 share. One simple way to evaluate whether a country’s exports are concentrated or diversified is to measure the combined share of its top five export products. A higher percentage indicates that a country’s export earnings are concentrated in a small number of products, making the economy more vulnerable to price shocks or demand fluctuations in those sectors. Conversely, a lower percentage suggests greater diversification, meaning the country relies on a wider range of exports and is therefore less exposed to external risks. In 2023, Tanzania’s top five exported products accounted for about 56% of total export earnings, highlighting a moderate level of concentration and the ongoing need to broaden its export base.
Tanzania generally exports commodities. Gold was Tanzania’s most significant export product by value in 2023, accounting for 43% of exports by value, followed by coal briquettes (3.2%), refined petroleum (3.2%), dried legumes (3.1%), refined copper (3.1%) and raw tobacco (3%). Tanzania mainly exported to India (15.7%), Uganda (12.5%), the United Arab Emirates (UAE) (12.4%), South Africa (10.5%) and China (6.4%).
Tanzania’s top imports are refined petroleum (22% of imports), palm oil (2.1%), wheat (2.1%) and cars (2%). The main origins of Tanzania’s imports in 2023 included China (32.3% of imports), India (19.4%), UAE (7.1%), Saudi Arabia (4.4%) and Japan (3.3%).
Tanzania could be a significant food-exporting country, but currently struggles to meet its food requirements due to low productivity and the predominance of subsistence farming. The result, amongst others, is high levels of stunting in the population, particularly among children below five years of age, at 30% in 2023, declining to 17% in 2043.
Chart 21 presents the trade balance in the Current Path and in the AfCFTA scenario, from 2020 to 2043 as a percentage of GDP.
Tanzania’s trade profile over the period from 2003 to 2043 is marked by a persistent negative trade balance, with imports consistently outpacing exports. In 2023, exports accounted for 13.7% of GDP, while imports stood at 18.5%, resulting in a trade deficit of -4.8% of GDP. This gap has remained stable in recent years after significant volatility in the late 2000s and early 2010s, when the trade deficit peaked at -12.9%. By 2043, exports are projected to reach 21.9% of GDP and imports 29.2%, resulting in a trade deficit of -7.3% of GDP.
In the AfCFTA scenario, exports will increase to 24.1% of GDP, while imports remain high at 29.6%, resulting in a slightly lower trade deficit of -5.5% of GDP in 2043 as compared to the Current Path.
The persistent trade deficit reflects a structural dependence on imports for capital goods, fuel and industrial inputs. Implementation of AfCFTA provisions, combined with domestic reforms and infrastructure investments, could gradually expand Tanzania’s export capacity and diversify its trade portfolio. However, current projections indicate that the gap between import and export shares of GDP will continue to widen modestly, with trade openness increasing but the deficit persisting. This mirrors the trajectory seen across other LMICs in Africa, where the trade deficit remains persistent, though the gap between imports and exports narrows modestly by 2043.
Chart 22 presents the Current Path of access to electricity for urban, rural and the total population from 2000 to 2043.
Tanzania’s infrastructure landscape is expanding rapidly, but access and efficiency remain uneven. In 2024, the country ranked 41st of 54 on the Africa Infrastructure Development Index (AIDI), reflecting persistent gaps in transport connectivity, energy distribution and digital access.
Alongside challenges, Tanzania is undertaking ambitious infrastructure investments. Government allocations and MoUs initiated work on Bagamoyo Port in 2024-25; its development will be phased, with an ultimate capacity projected at 20 million TEU over time.
Passenger services on the Standard Gauge Railway (SGR) between Dar es Salaam and Dodoma began in July 2024, and freight services followed in mid-2025. Extensions toward Mwanza and Kigoma are in progress. Notably, construction has now commenced on the Uvinza-Musongati cross-border SGR, linking Tanzania to Burundi over roughly 240 km at an estimated cost of US$2.15 billion. The project is led by China Railway Group Limited (CREC), a major global contractor and leading player within China’s construction industry. In June 2025, Tanzania inaugurated the John Pombe Magufuli Bridge, a 3 km crossing that is the longest in East Africa and the sixth longest on the continent. The bridge resolves long-standing transport bottlenecks in the Lake Zone, replacing decades-old ferry services with a permanent and more reliable connection for people, goods and services. Progress in the energy sector has been equally notable. The Julius Nyerere Hydropower Project (2 115 MW) reached full operational status in April 2025. Meanwhile, the Kakono (87.8 MW) hydropower plant is under development, with completion expected from 2028 onwards, while Rumakali (222 MW) remains at an uncertain stage of implementation. Aviation infrastructure is also being expanded. Airport upgrades are underway in Mwanza, Arusha, Mtwara, Bukoba and Kilimanjaro, while at Msalato International Airport in Dodoma, runway works were about 85 % complete and terminal construction 51 % complete by March 2025. And the Dodoma Outer Ring Road, a flagship AfDB-supported project, was 86 % complete as of June 2025.
Yet, while physical capacity is increasing, infrastructure access remains deeply uneven, particularly for electricity. Nationally, only 43% of Tanzania’s population had access to electricity in 2023, leaving roughly 38 million people without a reliable supply. This places Tanzania at the bottom of its African LMIC peer group, where the average access rate was 68%. The divide between rural and urban areas remains stark: just one in four rural residents (25%) had access to electricity in 2023, compared to three in four urban residents (75%). In the Current Path, 70% of Tanzanians will have access to electricity by 2043. Rural access is projected to increase to 54% and urban access to 87%.
Chart 23 presents the number of people using cookstoves in the Current Path and in the Large Infrastructure and Leapfrogging scenario, from 2020 to 2043.
Traditional cookstoves are prevalent in rural areas, where approximately 62% of Tanzania’s population resides, and access to electricity is limited. These stoves are associated with significant health risks, including respiratory illnesses from indoor air pollution, as well as environmental stress through deforestation and soil degradation. Women and children are disproportionately affected, as they are chiefly responsible for cooking and are exposed to smoke and particulate matter for extended periods. The country’s high fertility rate and youthful population profile intensify household energy demands and amplify the associated environmental and health challenges.
In 2023, the majority of Tanzanian households (86.9%) continued to depend on traditional cookstoves, which use biomass fuels such as wood and charcoal. This rate remains higher than the average among African LMIC countries (59.4%). Tanzania had the second-highest share of traditional cookstove use among this group, beaten only by Guinea with 91%.
In comparison to the LMIC Africa average, Tanzania’s transition away from traditional cookstoves is slower in the Current Path but accelerates significantly in the Large Infrastructure and Leapfrogging scenario. In 2043, the percentage of households using traditional cookstoves will decline from 49% to 36%, or 2.6 million fewer Tanzanians in absolute terms. The share of households using modern fuel will increase from 48% to 62% in 2043 (equivalent to 2.7 million people).
Chart 24 presents the percentage of the population and number of people with access to mobile and fixed broadband in the Current Path and in the Large Infrastructure and Leapfrogging scenario, from 2020 to 2043. The user can toggle between mobile and fixed broadband.
Fixed broadband subscription is particularly important for the private sector and to enable the expansion of business in the formal sector. Mobile broadband, on the other hand, is important for the informal sector, and small and medium-sized businesses, as well as to unlock educational and other opportunities.
Tanzania, like most African lower-middle-income countries, had a very low fixed broadband rate of 2.6 per 100 people in 2023, ranking 13th out of 23 LMIC African countries. The global average in 2023 was 19 subscriptions per 100 people. In the Large Infrastructure and Leapfrogging scenario, Tanzania’s fixed broadband will increase to 23 subscriptions per 100 people by 2043, compared to only 19 per 100 people in the Current Path.
In 2023, Tanzania had a mobile broadband subscription rate of 34 subscriptions per 100 people. This rate was significantly lower than the average rate of 62 subscriptions per 100 people for Africa’s lower-middle-income economies. Only Congo, Angola and Cameroon had a lower mobile broadband subscription rate in that year. On the Current Path, Tanzania’s mobile broadband subscription will reach a saturation rate of 150 subscriptions per 100 people in 2043. The average rate for lower-middle-income countries in 2043 will be slightly below that, at 149 per 100 people.
Chart 25 presents the trends in FDI, aid and remittances in the Current Path and in the Financial Flows scenario as a percentage of GDP, from 1990 to 2043.
Although recent global crises, such as the COVID-19 pandemic, climate change and the ongoing Russia-Ukraine war, have affected foreign aid flows, many African countries continue to depend heavily on this support to provide essential services like education and healthcare. Like many other African countries, Tanzania has long been a major recipient of development assistance. Aid peaked at a significant 30% of GDP in 1992 (US$4.2 billion), before falling sharply to US$1.37 billion in 1998 and then rising again in absolute terms, reaching US$3.8 billion by 2007.
In 2023, foreign aid accounted for nearly a quarter of government revenues, underscoring its continuing importance despite steady economic growth that has reduced its relative weight over time. Recent shifts in donor priorities, including reductions in US assistance and reallocation of funds towards global crises, have further contributed to this trend. Even so, Tanzania ranked 10th out of 23 LMICs in Africa in 2023 for aid receipts as a share of government revenue at 22.9%, well above the peer group average of 10.5%. By 2043, this figure is expected to decline to 8.4% on the Current Path and 8.8% under the Financial Flows scenario, equivalent to an additional US$280 million in that year. Over the two decades from 2024 to 2043, Tanzania would receive a cumulative US$2.7 billion more in aid under the Financial Flows scenario compared to the baseline.
Remittances are a smaller but increasingly significant source of external financing. In 2023, inflows were valued at 1.3% of GDP (US$415 million), well below the lower-middle-income peer average of 3.7%. On the Current Path, remittances are projected to rise to 2.9% of GDP by 2043. Although modest compared to aid, remittances provide direct household-level support and are likely to grow in importance as Tanzania’s diaspora expands and financial transfer systems improve.
Foreign Direct Investment (FDI) inflows to Tanzania as a percentage of GDP have steadily increased since democratisation in 1992. However, they declined during the global financial crisis in 2007/08, and later during the COVID-19 pandemic from 2020, which saw a sharp drop to 0.8% in 2020 before a robust recovery to 3.8% in 2021. FDI flows to Tanzania accounted for 2.8% of GDP in 2023, 0.5 percentage points above the average for Africa’s LMICs. Much of this capital has been channelled into mining and quarrying, manufacturing and financial services, reflecting the government’s push for industrialisation and the growth of domestic financial markets.
By 2043, FDI flows will account for 4.8% of Tanzania’s GDP in the Financial Flows scenario compared to 3.7% in the Current Path. The impact will be a substantial increase in the stock of FDI in Tanzania from 38.2% of GDP in 2043 on the Current Path to 48.2% under the Financial Flows scenario. The corresponding amounts in 2043 will be US$112.3 billion in the Financial Flows scenario compared to US$88.1 billion in the Current Path.
Yet, the scale of external inflows alone will not determine Tanzania’s developmental trajectory. Their long-term impact will depend on the country’s ability to manage, regulate and productively absorb these resources. Illicit financial outflows continue to erode scarce resources, underscoring the importance of stronger governance, transparency and financial oversight to safeguard and optimise the use of available funds. Strengthening absorptive capacity, therefore, requires not only curbing leakages through illicit flows but also ensuring that legitimate inflows are effectively channelled into productive sectors. Greater alignment of aid, FDI and remittance inflows with industrialisation, skills development and domestic value-chain growth would help translate short-term fiscal relief into long-term structural transformation.
Chart 26 presents government revenue in the Current Path and in the Financial Flows scenario, from 2020 to 2043. The data is in US$ 2017 and % of GDP.
Wagner's law, or the law of increasing state activity, is the observation that public expenditure increases as national income rises. It is, therefore, reasonable to expect that government revenues will increase as a percentage of GDP in the Financial Flows scenario compared to the Current Path.
Between 1999/00 and 2020/21, public expenditure in Tanzania rose 26-fold, while the government's revenue from taxes and other sources rose 20-fold. This led to a 15-fold increase in the budget deficit, although still below the 3% of GDP target set by the East-African Community and generally financially manageable. An analysis by REPOA on Tanzania's budget deficit points to the challenge of a shrinking operational budget inadequate to support the expanding infrastructure, a repeat of the 1970s when capacity expansion went hand in hand with high capacity underutilisation. They highlight 'a seemingly contradictory phenomenon in which public facilities are expanding at the same time as public services are declining.'
Government revenues in Tanzania were 15.5% of GDP in 2023, slightly below the average for Africa’s LMICs at 16.2% of GDP. Despite efforts at reform, Tanzania’s tax system remains structurally constrained. A dominant informal economy—employing the bulk of the labour force—largely falls outside the tax net, substantially narrowing the effective tax base. Revenue mobilisation is further hindered by complex procedures, frequent policy changes and administrative inefficiencies that raise compliance costs and discourage formalisation. Capacity shortages within the Tanzania Revenue Authority, together with weak enforcement and unpredictable policy shifts, undermine consistent collection. As a result, revenue performance remains vulnerable and insufficient to meet the country’s developmental and governance needs.
Without foreign aid, government revenues will decline to below 11.9%, reflecting the extent to which Tanzania depends on aid to fund government expenditures. The average contribution of aid to GDP amongst Africa’s 23 lower-middle-income countries will be slightly higher at 14.5%.
In the Financial Flows scenario, government revenues will increase by 0.2 percentage points of GDP in 2043, equivalent to US$1.1 billion—a cumulative increase of US$7.5 billion in revenues from 2024 to 2043.
Chart 27 presents the Current Path of government effectiveness comparing the country to the average for the African income group, from 2002 to 2043.
Effective governance is a core determinant of long-term development. It underpins stability, investor confidence and the ability of governments to design and implement coherent strategies for inclusive growth. Tanzania stands out for its relative political stability and institutional continuity compared with many of its regional peers. The long-standing dominance of the Chama Cha Mapinduzi (CCM) party has provided continuity and predictability in policymaking, but it has also limited the extent of political competition and slowed the development of a more pluralistic political landscape.
Opposition parties operate within a highly regulated political environment, which, while intended to maintain stability, can constrain participation and limit diversity in policy debate. This dynamic can reduce the degree of political accountability and the incentive for institutional innovation. Tanzania’s stable political order continues to support long-term planning and policy consistency, yet sustained democratic consolidation will depend on progressively widening space for competition, dialogue and inclusion.
These structural dynamics are reflected in comparative governance metrics. The World Bank’s Government Effectiveness Index captures perceptions of the quality and independence of public services, policy implementation and government credibility. In 2023, Tanzania ranked 12th out of 23 African lower-middle-income countries, with a score of 1.8 out of 5. By 2043, the score is projected to improve modestly to 2.2, but without a shift in its relative position.
The 2024 Bertelsmann Transformation (BTI) Index similarly notes that while Tanzania maintains nationwide administrative reach, effectiveness is undermined by political interference, misuse of funds and limited institutional capacity. The report further notes that while gradual progress in service delivery, particularly in education, health and infrastructure, is offset by persistent disparities between urban and rural areas.
The Ibrahim Index of African Governance (IIAG) ranks Tanzania 15th of 54 African countries, reflecting a steady but uneven performance: advances in inclusion and rule of law coexist with weaknesses in participation, gender equality and the business environment.
Together, these indicators underscore a central paradox. Tanzania’s governance system combines political stability with administrative fragility. Its institutions can sustain order and deliver incremental improvements, yet they often struggle to coordinate reforms, enforce accountability and translate national strategies into measurable outcomes. As Tanzania navigates its middle-income transition, strengthening bureaucratic capability, transparency and intergovernmental coordination will be critical to convert stability into transformative development capacity.
Chart 28 presents the security, capacity and inclusion index for the Current Path versus the Governance scenario, for 2023 and 2043.
In our modelling, governance is conceptualised along three dimensions–security, capacity and inclusion–reflecting the traditional sequencing of the state formation process. The score for each dimension of governance ranges from zero (bad) to one (good). The security dimension measures the probability of intra-state conflict and the general level of risk. The second dimension, capacity, is related to government revenue, corruption, regulatory quality, economic freedom and government effectiveness. The third dimension, inclusiveness, measures the level of democracy and gender empowerment. In addition, the Governance scenario also includes an aggressive increase in welfare transfers to unskilled workers to reduce inequality and poverty. Visit the theme on Governance for a full conceptualisation and details on the composition of the scenario.
In the Current Path, Tanzania’s composite governance index is projected to rise from 0.55 in 2023 to 0.63 in 2043, keeping the country within the top 10 governance performers among its LMIC African peers (8th place in 2023 and 7th by 2043). Under the Governance scenario, the score will improve to 0.68, elevating Tanzania to 3rd place—behind only Lesotho and Cabo Verde.
Tanzania’s location, bordering eight countries and with access to the Indian Ocean, gives it considerable influence in the security dynamics of East, Central and Southern Africa. As part of the Great Lakes Region, it has long acted as a stabilising force in regional politics, using diplomacy and mediation to defuse tensions. Notably, the Rwandan peace talks that produced the Arusha Accords before the 1994 genocide, and later played a central role in brokering the 2000 Burundi peace agreements, were also signed in Arusha.
Tanzania’s regional weight is also shaped by its dual membership of both the East African Community (EAC) and the Southern African Development Community (SADC). This position allows it to act as a bridge between the two blocs, particularly on complex issues such as the crisis in eastern Democratic Republic of Congo. In practice, it has pursued a balancing strategy: backing the EAC-led process diplomatically while committing troops to the SADC mission, SAMIDRC, in 2023. Some observers see this as evidence of a tilt towards SADC, reflecting Tanzania’s historical and geographic ties, raising questions about neutrality in regional conflicts. Under President Samia Suluhu Hassan, Tanzania has sought to project regional leadership more actively. In 2024, she assumed the chair of SADC’s Politics, Defence and Security Cooperation Troika and convened EAC foreign ministers in Zanzibar to forge a coordinated approach to the DR Congo peace process.
At the same time, its geography exposes it to significant risks. Fragile borders, limited surveillance and weak institutional capacity leave the country vulnerable to illicit flows of arms, minerals, drugs and people. Conflict and instability in neighbouring states create pressures from refugee inflows and raise the risk of spillover violence. Tanzania also faces growing environmental stressors, including resource degradation and climate-induced displacement, which compound these security challenges.
While Tanzania’s diplomatic tradition is built on non-alignment and pan-African solidarity, its ability to manage these threats is constrained by underfunded institutions, outdated legal frameworks and weak coordination between agencies. To fully harness its geostrategic advantages, the country will need to strengthen border security, modernise intelligence systems and prioritise human security, particularly in vulnerable regions.
Despite these pressures, Tanzania performs relatively well in broader peace indicators. In the 2024 Global Peace Index, it ranked 65th out of 163 countries worldwide and 7th in sub-Saharan Africa.
In the 2023 Organised Crime Index, Tanzania scored 6.2 for criminality, ranking 11th in Africa and 5th in East Africa, while its resilience score was a low 4.1, placing it mid-range on the continent. Tanzania’s geography, porous borders and strategic Indian Ocean coastline serve as a key hub for smuggling, spanning human trafficking, arms smuggling, counterfeit goods, drug trafficking, environmental crimes and illicit trade in minerals. Governance responses remain uneven. The government has pledged to accelerate organised crime investigations and launched reforms to modernise the legal framework. However, implementation is hampered by weak institutional capacity, selective enforcement and the influence of political and business elites with links to criminal networks. Corruption within the police and judiciary further undermines public trust. Civil society plays a role in awareness, harm reduction and victim support, but its space is restricted by regulatory and political barriers.
Overall, Tanzania reflects a paradox of relative political stability combined with entrenched criminal markets. While legal structures and reform efforts exist on paper, the absence of consistent transparency, accountability and effective enforcement leaves the country highly vulnerable to organised crime, with serious implications for governance, state revenues and long-term development.
In a significant move to strengthen its coastal and offshore security, Tanzania recently established a National Maritime Security Centre, aimed at coordinating maritime surveillance, intelligence and law enforcement across territorial waters. This centre reflects recognition that combating maritime crime, such as smuggling, illegal fishing and trafficking, requires integrated capacity beyond what any single agency or ministry can achieve. Tanzania intends that the centre will serve as a hub for coordinating domestic efforts and deepening regional cooperation with neighbouring littoral states.
The October 2025 general election took place in a deeply contested environment characterised by restrictive political manoeuvres: authorities have imposed social media clampdowns, arrested critics and exerted tighter control over digital content and communication platforms.
The ruling Independent National Electoral Commission (INEC) disqualified the main opposition party, CHADEMA (Chama Cha Demokrasia na Maendeleo), in April 2025 for failing to sign a mandatory electoral code of conduct. That ban extends to by-elections through 2030. Around the same time, CHADEMA’s leader, Tundu Lissu, was arrested and charged with incitement and treason following calls for electoral reform.
Into this constricted field stepped Luhaga Mpina, the presidential candidate of ACT-Wazalendo (the country’s second-largest opposition party). In September 2025, INEC disqualified him for a second time, citing an objection from the Attorney General. His candidacy had briefly been reinstated by a High Court ruling earlier in the month, but that decision was overturned. The reversal fully removed Mpina from contention in the October race.
These exclusions, combined with broader reports of arbitrary arrests, abductions and restrictions on civic freedoms, underscore how electoral exclusion is reshaping Tanzania’s political landscape. In effect, what might appear as political contestation is increasingly mediated through legal and institutional gatekeeping. The disqualifications raise acute risks of political tension turning into security flashpoints, especially in an environment where state actors already control key levers of surveillance and enforcement.
These risks materialised in the aftermath of the October 2025 election, when widespread unrest and the state’s forceful crackdown exposed the underlying fragility of Tanzania’s political order. While long-standing structures have maintained surface-level stability, recent events show that control cannot substitute for legitimacy.
On the Current Path, Tanzania’s score on the security dimension of the governance index is 0.72 (out of 1) and will increase slightly to 0.79 by 2043. In the Governance scenario, the score is expected to reach 0.85 by 2043.
Tanzania performs poorly in terms of capacity compared to other dimensions of governance, with a score of 0.32 out of 1. This reflects persistent institutional weaknesses, including centralised decision-making, limited coordination across ministries and inadequate mechanisms for performance monitoring and accountability. While administrative structures exist across the country, their ability to translate policy into effective implementation is constrained by poor resource allocation, political interference and a legacy of clientelist governance. Reform efforts have often been ad hoc and selectively applied, lacking sustained commitment or follow-through. Civil society, which could play a role in improving accountability and public service delivery, remains tightly regulated and largely excluded from meaningful policy influence. Despite incremental improvements in infrastructure and service access, particularly in health and education, institutional capacity remains a binding constraint on more transformative governance outcomes.
By 2043, capacity will increase to 0.4 on the Current Path, and slightly higher to 0.44 in the Governance scenario.
Tanzania’s legal framework affirms equality before the law and recognises the right of citizens to vote and participate in politics. The Constitution prohibits discrimination on the basis of gender, ethnicity or disability and guarantees equal protection under the law. Citizens gain the right to vote at 18 and may stand for Parliament at 21, while electoral law requires polling stations to provide assistance for voters with disabilities. A system of reserved “special seats” ensures women’s representation in Parliament, and at sub-national levels, women currently hold more than a third of seats in the National Assembly. The Political Parties Act also requires parties to promote democracy, gender equality, youth participation and social inclusion within their policies and leadership structures. While some parties have introduced provisions in their constitutions or manifestos to encourage greater representation of women and young people, these commitments are uneven and rarely take the form of binding voluntary quotas.
Yet, the reality is more complex. Political rights are constrained by restrictions on media, civil society and opposition activity, many of which remain in place despite some relaxation under President Samia Suluhu Hassan. This creates a situation where rights exist on paper but are not always fully realised in practice. Patterns of participation also vary across society. In rural areas, engagement in decision-making is often limited, with women and younger people less involved than men or older adults. Legislation, such as the Persons with Disabilities Act (2010), provides a statutory basis for equal access to services, training and employment, but weak enforcement and lack of resources hinder implementation.
These dynamics highlight the gap between formal guarantees and substantive inclusion. While Tanzania has made progress in widening opportunities, particularly for women and people with disabilities, structural barriers remain.
In 2023, Tanzania scored 0.6 out of 1 on the inclusion dimension, placing 6th among 23 lower-middle-income African countries. On the Current Path, this is projected to rise to 0.69 by 2043, lifting Tanzania to 3rd place. In the Governance scenario, the country could achieve a score of 0.76, ranking 2nd after Tunisia.
Chart 29 presents GDP per capita in purchasing power parity (PPP) in the Current Path and each of the eight sectoral scenarios. The data is from 2020 with a forecast to 2043.
GDP per capita increases in all the scenarios above the Current Path. However, the Governance and the AfCFTA have the most significant positive impact with an increase of US$211 and US$203 per person above the Current Path in 2043, respectively.
Improved governance contributes directly to higher GDP per capita by strengthening state capacity, reducing corruption and ensuring more effective delivery of public goods. In the Governance scenario, reforms enhance the quality of regulation and the professionalism of the public administration, while curbing rent-seeking and leakages. These shifts expand fiscal space and enable more productive investment in infrastructure, health and education. Stronger institutions also reduce business costs, create a more predictable regulatory environment and attract higher levels of private and foreign investment, which in turn stimulate productivity growth. The dividends are not only economic: greater inclusion and accountability underpin political stability, reduce the risk of conflict and provide a more reliable foundation for long-term planning. The scenario’s emphasis on transparency, civic inclusion and institutional legitimacy is particularly relevant in light of the 2025 election crisis, which exposed deep public mistrust and the fragility of state-citizen relations. In this context, governance reform becomes not just a technical fix but a political necessity to restore stability, reduce exclusion and rebuild the social contract.
The AfCFTA indicates a general improvement in productivity and potential income. The findings are in line with many other studies that point out that deepening regional trade through AfCFTA presents a major opportunity for Tanzania to advance its economic prosperity.
The Agriculture scenario has the third most significant impact on GDP per capita, with an additional US$128 above the Current Path by 2043. Higher yields from modern farming techniques and better inputs raise overall productivity, boosting farm incomes and reducing rural poverty. Expanded irrigation, improved water management and ecosystem restoration strengthen climate resilience, lowering the vulnerability of smallholder farmers to droughts, pests and other shocks. Investments in storage, supply chains and rural roads reduce post-harvest losses and connect farmers more effectively to markets, enabling greater commercialisation and diversification beyond subsistence farming. At the same time, improved food access and nutrition enhance human capital and labour productivity. Stronger exports of cash crops such as cashew, coffee and cotton generate foreign exchange and government revenues, reinforcing fiscal capacity for investment in public goods. Together, these dynamics reduce food insecurity, raise rural incomes and stimulate demand across the economy, driving higher long-term growth.
The Manufacturing and Financial Flows scenarios have a comparatively modest impact on Tanzania’s GDP per capita by 2043. In the Manufacturing scenario, GDP per capita rises only modestly (US$71) above the Current Path, reflecting the low base and that structural constraints take time to ease. In Tanzania, the manufacturing sector remains dominated by low- to medium-skill activities—notably agro-processing and textiles—where productivity gains are slow and firms are yet to move into higher-value, technology-intensive production. Upgrading requires sustained investment in infrastructure, energy, finance and skills, all of which progress gradually over the forecast period. The continued presence of a large informal sector also limits the broader economic spillovers from industrialisation. Even so, the scenario represents an important step towards a more diversified and resilient economy. As productivity rises and industrial capabilities deepen, manufacturing could become a key driver of inclusive growth beyond 2043, creating better jobs and accelerating structural transformation.
The Financial Flows scenario delivers only a modest gain in GDP per capita for Tanzania (US$53). Foreign direct investment continues to flow mainly into extractive industries such as mining and gas, which are capital-intensive and generate limited employment or supply-chain spillovers. Aid remains important, particularly for fiscal space in health and infrastructure, but its share of GDP declines as the economy grows. Remittances provide household resilience but are modest compared to regional peers and do little to drive structural transformation. Meanwhile, illicit financial outflows continue to erode scarce resources, underscoring the importance of stronger governance and financial oversight.
So far, the analysis has focused on the individual sectoral scenarios. These sectors are, however, not isolated; they are strongly interlinked. The Combined scenario envisions an integrated implementation of sectoral reforms. If this scenario were realised, Tanzania could expect a significant improvement in its human and economic development prospects. By 2043, GDP per capita (PPP) will be US$1 059 higher than in the Current Path in 2043, indicating that an integrated push across all the development sectors could significantly improve the living standard of the people of Tanzania.
Chart 30 presents poverty in the Current Path and for each scenario, from 2020 to 2043. The user can select the number of extremely poor people or the percentage of the population.
Poverty reduction remains one of Tanzania’s most urgent policy challenges. Despite two decades of robust economic growth, high population expansion, low productivity and uneven access to opportunity have kept millions trapped in deprivation. While all interventions reduce poverty relative to the baseline, the extent and inclusiveness of these gains vary, highlighting how institutional quality, human capital and structural transformation interact to shape development outcomes.
The Governance scenario delivers the strongest impact on poverty reduction, underscoring how institutional quality remains central to both growth and inclusion—an insight made even more urgent in light of Tanzania’s recent political upheavals. Institutional reforms strengthen both the efficiency and equity of resource use. Stronger tax systems expand fiscal space, while reduced leakages and corruption ensure that public funds reach the sectors and communities most in need. These improvements translate into better access to education, healthcare and infrastructure for low-income households. At the same time, governance reform lowers the transaction costs of doing business, broadens financial inclusion and enhances social protection systems.
In Tanzania’s context, where a large informal economy and weak service delivery constrain the benefits of growth, effective institutions act as a powerful multiplier. They accelerate economic expansion while ensuring that its dividends reach a wider share of society, improving the quality of essential public services and enabling more inclusive participation in the economy.
Education (the second most significant scenario) has a strong and multidimensional influence on poverty reduction in Tanzania. Enhancing skills, employability and productivity raises household incomes and resilience while lowering fertility and dependency ratios—mechanisms that have immediate welfare effects. Over time, education supports structural transformation by expanding the skilled labour force, improving institutional performance and broadening the tax base. Tanzania has made major strides in expanding access to primary education, but secondary enrolment remains low and tertiary access is minimal. This sharp drop-off limits the long-term developmental impact of education. Yet, expanding access without quality delivers limited results. Overcrowded classrooms, undertrained teachers and weak learning outcomes have constrained the poverty-reducing potential of past enrolment gains. Addressing quality alongside access is therefore critical.
The AfCFTA and the Large Infrastructure and Leapfrogging scenarios had the third-highest impact on reducing poverty. Regional integration expands markets for Tanzanian producers, encouraging a shift of labour from low-productivity subsistence farming into higher-wage sectors, such as agro-processing and manufacturing. This transition raises household incomes directly through job creation, while lower tariffs also cut the cost of imported consumer goods, making essentials more affordable. For Tanzania, with its heavy reliance on agriculture and persistent food insecurity, the combined effect of higher earnings and lower living costs is particularly powerful for poverty reduction. The Large Infrastructure and Leapfrogging scenario reduces poverty by easing structural constraints on productivity and inclusion. Expanding electricity access, broadband connectivity and transport networks lowers transaction costs, boosts enterprise activity and improves access to jobs and markets. Rural households gain from better energy and mobility, while digital access opens new income opportunities and financial inclusion. Together, these advances enhance livelihoods, stimulate local economies and reduce spatial inequality, accelerating the transition toward more inclusive growth.
Chart 31 presents GDP in the Current Path and in the Combined scenario from 2020 to 2043. The data is in US$ 2017 and at market exchange rates (MER).
The Combined scenario combines all eight sectoral scenarios: Governance, Demographics and Health, Education, Large Infrastructure and Leapfrogging, Agriculture, Manufacturing, AfCFTA and Financial Flows.
If fully implemented, this integrated reform pathway would substantially enhance Tanzania’s growth prospects. Between 2023 and 2043, the economy will grow at an average rate of 7.6%, compared to 6.1% on the Current Path. By 2043, Tanzania’s GDP at market exchange rates (MER) will reach US$305.2 billion—around US$75 billion larger than in the Current Path. Under this scenario, Tanzania will advance from being the 11th-largest economy in Africa to the 6th, behind only Nigeria, Egypt, South Africa, Ethiopia and Algeria.
However, while this trajectory marks a strong improvement, it remains below the double-digit growth rate envisaged in Tanzania’s Vision 2050. The Vision targets sustained annual growth of at least 10% to achieve upper-middle-income status by mid-century. The gap highlights both the ambition and the scale of the challenge: even under a best-case reform scenario, Tanzania will need to deepen productivity gains, diversify its economic base and accelerate value addition to fully realise its long-term transformation goals.
Chart 32 presents GDP per capita in purchasing power parity (PPP) in the Current Path and the Combined scenario. The data is from 2020 with a forecast to 2043.
In the Current Path, Tanzania’s GDP per capita (PPP) will rise from approximately US$2 582 in 2023 to US$4 306 by 2043. While this represents steady progress, it reflects incremental rather than transformative growth.
By contrast, the Combined scenario delivers a more ambitious outcome. GDP per capita (PPP) increases to US$5 365 by 2043, US$1 059 higher than in the Current Path, driven by compounding gains in productivity, institutional efficiency, human capital and deeper integration into regional and global markets. Crucially, this trajectory reflects not only faster income growth but a qualitative shift in Tanzania’s development model. Higher per capita income under the Combined scenario is associated with stronger job creation, accelerated poverty reduction, and a narrowing of inequality gaps as growth becomes more inclusive.
On the Current Path, Tanzania will rank 34th in Africa by 2043 in terms of GDP per capita (PPP). Under the Combined scenario, its position will improve markedly to 24th, reflecting the cumulative effect of simultaneous reforms across multiple sectors that together raise productivity and convergence with Africa’s more advanced economies.
In line with Vision 2050 and the African Union’s Agenda 2063, the Combined scenario underscores that sustained and coordinated reforms can unlock shared prosperity and long-term structural transformation. Yet, achieving the Vision’s ambition of upper-middle-income status will require not only continued expansion but a shift in the drivers of growth—toward innovation, skills and productivity-led development. Continued investment in education, technology and institutional reform will be essential to ensure that higher GDP per capita translates into enduring gains in wellbeing.
Chart 33 presents the value added by sector in the Current Path and in the Combined scenario, for 2023 and 2043. The data is in US$ 2017 and as a percentage of GDP.
In 2023, Tanzania’s service sector accounted for just over half of the country’s GDP (US$35.3 billion), followed by the agriculture sector, which accounted for 23% (US$16 billion). Manufacturing contributed 12% to GDP (US$8.4 billion). The energy sector was small, contributing 3.8% to GDP in 2023 (US$2.7 billion), translating, among other issues, into low levels of electricity access and inhibiting growth in the manufacturing sector. The ICT sector contributed 3.8% (US$2.7 billion).
Compared to the Current Path in 2043, the Combined scenario would see the following changes in the structure of Tanzania’s economy:
- the manufactures sector will contribute 17.1% of GDP, 1.9 percentage points higher than the Current Path projection, equivalent to an increase of US$17 billion.
- the ICTech sector will contribute 5.7% of GDP, 0.6 percentage points higher than the Current Path, equivalent to an increase of US$5.5 billion.
- the energy sector will contribute 1.6% of GDP, -0.1 percentage points smaller than the Current Path projection but equivalent to an increase of US$1.1 billion.
- the materials will contribute 8.1% of GDP, -0.5 percentage points smaller and equivalent to an increase of US$5 billion.
- agriculture will contribute 8.5% of GDP, be -0.5 percentage points smaller, equivalent to an increase of US$5.3 billion.
- The services sector will contribute 58.9% of GDP, will be -1.5 percentage points smaller, with an increase of US$40.5billion.
The evolution of Tanzania’s economy roughly mirrors that of its lower-middle-income peer group, with the service sector representing both the current and future lion’s share of contribution to GDP. With its sizeable informal services sector, low-productivity agricultural sector and relatively small manufacturing sector, Tanzania should invest in improvements in agriculture and grow its ICT sector to improve productivity and enhance livelihoods in other sectors, particularly manufacturing.
Chart 34 presents the size of the informal sector in the Current Path and in the Combined scenario, from 2020 to 2043.
Tanzania’s informal sector plays a dual role in the economy. It serves as a vital safety net for livelihoods, absorbing much of the workforce excluded from formal employment, but it also constrains productivity, structural transformation and domestic revenue mobilisation.
In 2023, the informal sector accounted for approximately 45.5% of GDP—the second-highest share in Africa after Zimbabwe, and well above the LMIC Africa average of 30.5%. On the Current Path, this share will decline modestly to 38.7% by 2043, while under the Combined scenario, it will fall further to 35.3%, reducing Tanzania’s ranking to the fifth-highest informal sector in Africa.
Informal employment likewise dominates the labour market. In 2023, 75.9% of Tanzania’s labour force, or 11.7 million people (excluding agriculture), worked informally. On the Current Path, this share will decline to 68.5% by 2043, and to 56.6% under the Combined scenario.
While informal work provides essential income opportunities, it is typically characterised by low productivity, limited access to finance and social protection and high vulnerability to economic shocks. Because most informal enterprises operate outside the tax system, informality constrains fiscal capacity and perpetuates underinvestment in public services. A smaller informal sector would deliver tangible benefits: broader tax revenues, stronger social protection, higher productivity and a more resilient labour market. The challenge is to ensure that formalisation is not merely administrative, but translates into better jobs, stronger firms and more inclusive growth.
The decline in informality under the Combined scenario reflects the compounded impact of reforms across multiple sectors. Productivity gains in manufacturing and agro-processing, better governance and regulatory efficiency, stronger regional integration through AfCFTA, and sustained investment in education and skills development all work together to expand formal employment and enterprise capacity. These dynamics reinforce each other: improved governance and access to finance lower the costs of doing business, while education and digital connectivity enhance employability and innovation. The result is a gradual but sustained shift from survivalist informal activity toward more productive, formalised participation in Tanzania’s growing economy.
Chart 35 presents poverty in the Current Path and the Combined scenario, 2020 to 2043.
In the Combined scenario, Tanzania will achieve a far greater reduction in poverty than on the Current Path. Using the LMIC poverty line of US$3.65 per day (2017 PPP), the poverty rate will decline from 71% in 2023 to 26% by 2043. This represents a 12.6 percentage-point improvement compared to the 2043 Current Path projection of 37%, translating to roughly 15 million fewer Tanzanians living in poverty.
When applying the international extreme poverty line of US$2.15 per day (2017 PPP), the Combined scenario will reduce extreme poverty from 12% on the Current Path to 6% by 2043—equivalent to around 7.2 million fewer Tanzanians living in extreme poverty.
These gains reflect the cumulative impact of coordinated reforms across all eight sectors, each reinforcing the others to boost productivity, employment and household incomes. Governance reforms improve the efficiency of public spending and service delivery, while investments in education and health strengthen human capital and resilience. Expansion of infrastructure and regional trade integration through AfCFTA stimulate industrialisation, job creation and income diversification, especially outside agriculture. Together, these dynamics accelerate structural transformation, narrow rural-urban income gaps and strengthen the link between growth and poverty reduction.
Crucially, the Combined scenario shows that poverty reduction is not only possible through faster growth, but through better quality growth that is inclusive, employment-intensive and supported by capable institutions. This pathway aligns with Tanzania’s Vision 2050 goal of eradicating extreme poverty and achieving an equitable, high-quality standard of life for all citizens.
Chart 36 compares life expectancy in the Current Path with the Combined scenario from 2020 to 2043.
In 2023, the life expectancy at birth for the average Tanzanian was 68 years, with women having almost four years higher life expectancy than men. On the Current Path, average life expectancy in Tanzania will increase to 73 years in 2043, with female life expectancy 4.2 years above that of men.
Under the Combined scenario, life expectancy in Tanzania will increase by 2 years, from 73 to 75 years in 2043. Female life expectancy will continue to be 4 years longer than men’s in 2043.
These improvements are driven by coordinated interventions across health, education, infrastructure and governance. In the health sector, reforms expand access to quality care, strengthen disease prevention and surveillance, and improve the availability of essential medicines and services. Investments in education, particularly in girls’ education and public health awareness, promote healthier behaviours and long-term wellbeing. Broader access to clean water, sanitation, nutrition and electricity, especially in rural areas, further reduces health risks and enhances living standards. Governance reforms increase the efficiency and accountability of public spending, while poverty reduction and social protection programmes extend access to healthcare for vulnerable groups.
Rising life expectancy is more than a measure of improved health; it is a cornerstone of Tanzania’s long-term development. A healthier and more productive population contributes to stronger human capital, higher labour force participation and intergenerational progress. These trends align with the objectives of Vision 2050, which emphasises a resilient, inclusive and productive population as the foundation for sustainable growth and national transformation.
Chart 37 compares carbon emissions in the Current Path with the Combined scenario from 2020 to 2043. Note that the data is in million tons of carbon, not CO2 equivalent.
Tanzania’s Vision 2050 frames economic transformation and industrialisation within a green growth agenda, emphasising low-carbon development, climate resilience and sustainable resource use. As the country continues to urbanise and expand energy-intensive sectors, managing its emissions profile will be essential for balancing growth with environmental sustainability, both for domestic environmental goals and regional climate commitments under the Paris Agreement and SADC Green Economy Strategy.
In the Current Path, Tanzania’s total carbon emissions from fossil fuels will increase substantially, reaching approximately 26.6 million tons by 2043, up from an estimated 5.9 million tons in 2023. In the Combined scenario, due to fast economic growth and increased energy demand, carbon emissions from fossil fuels will increase to 29.5 million tons by 2043.
To remain on a sustainable development path, Tanzania will need to align its rising energy demands with climate-smart policies and technologies. Priorities include improving emissions monitoring, investing in low-emission transport systems like mass rapid transit and the electric Standard Gauge Railway, and scaling up renewable energy deployment. Establishing a National Climate Change Financing Mechanism and a consolidated Climate Change Fund will be vital to mobilise public and private investment. Further reforms to institutional governance, including stronger accountability, transparency and localisation of Nationally Determined Contributions (NDC) actions, can accelerate the transition toward a resilient, low-carbon economy.
Chart 38 compares energy demand and production in the Current Path with the Combined scenario from 2020 to 2043.
Production is done in nine types, namely oil, gas, coal, hydro, nuclear, solar, wind, geothermal and other renewables. The data is converted into billion barrels of oil equivalent (BBOE) to allow for comparisons. Note that energy production could be for domestic use or for export.
In 2023, Tanzania’s total energy production was approximately 63 million barrels of oil equivalent (MBOE), compared to a total energy demand of 95 MBOE, leaving a production deficit of 32 MBOE. On the Current Path, energy production remains below demand. By 2043, production is projected to reach 115 MBOE, while demand is expected to rise to 339 MBOE.
Tanzania’s electricity mix is currently dominated by hydro and natural gas, with smaller contributions from oil, biomass cogeneration and emerging solar power. As of December 2024, the country’s total installed generation capacity stood at 3 404 MW, comprising 2 011 MW (59%) from hydro, a share that continues to rise with the phased commissioning of the Julius Nyerere Hydropower Plant, and 1 199 MW (35%) from natural gas, which remains central to Tanzania’s energy security and base-load supply. The remainder of capacity comes from heavy fuel oil and diesel plants (3%), biomass and cogeneration (2.6%) and a small but growing solar PV segment (0.1%), which is expected to expand significantly over the coming decade.
Renewables already account for 61.8% of installed capacity, and the government aims to raise this to 75% by 2030, supported by a pipeline of 880 MW of new large hydro, 463 MW of solar, 500 MW of wind and 130 MW of geothermal generation. The medium-term expansion strategy envisions an additional 2 463 MW from solar, wind, natural gas and geothermal by 2030, reinforcing efforts to diversify the mix and strengthen resilience to climate and supply shocks. Tanzania is also advancing regional power interconnections with Kenya, Rwanda and Burundi already operational, and new links to Zambia and Uganda under development—to enhance system reliability, enable energy trade and optimise dispatch across the regional grid.
Under the Combined scenario, both production and demand will grow more rapidly, reaching 136 MBOE and 351 MBOE in 2043, respectively.
Chart 39 summarises the policy recommendations for Tanzania.
The preceding analysis of Tanzania's developmental trajectory identifies several key challenges and opportunities that will shape its future economic landscape and societal well-being.
Tanzania has recorded impressive GDP growth over the past two decades, yet this has not translated into comparable gains in GDP per capita or poverty reduction, reflecting deep, interlinked structural constraints that limit productivity and inclusion. The most binding is extreme informality, accounting for 46% of GDP and 76% of employment, the second highest in Africa, which narrows the tax base and traps most workers in low-value activities. Structural transformation remains slow, with limited industrial expansion, declining trade openness and most employment concentrated in low-productivity or informal sectors. Education outcomes beyond the primary level remain weak, with low transition and completion rates in secondary and tertiary levels, while vocational training has not yet developed its full potential to provide job-ready skills and meet labour-market needs. Inadequate electricity access, along with transport and digital infrastructure gaps, further constrain competitiveness and industrialisation. Agriculture is still dominated by smallholder, rain-fed production, while rural–urban divides in income, opportunity and service access persist. Rapid population growth keeps dependency ratios high and strains social services.
Our analysis of eight sectoral scenarios demonstrates the transformative potential of targeted policy interventions to accelerate Tanzania’s development beyond the current baseline.
- Among the individual scenarios, the AfCFTA delivers the largest improvement in GDP per capita and the second-largest reduction in poverty, reflecting the powerful growth effects of deeper regional integration.
- The Governance scenario produces the greatest decline in poverty and the second-highest gain in GDP per capita, underscoring the central role of institutional quality and effective public management in driving inclusive growth.
- The Agriculture scenario ranks third in GDP per capita gains, reflecting its potential to reduce food insecurity, raise rural incomes and generate wider economic linkages that drive long-term growth.
- The Education scenario achieves the third-largest reduction in poverty, illustrating the long-term impact of human capital investment.
The Combined scenario highlights the synergistic impact of simultaneous investment across multiple sectors, showing that coordinated reforms can yield far greater outcomes than isolated efforts.
Under this integrated pathway, Tanzania’s GDP rises by US$80.4 billion above the Current Path by 2043, elevating the country from the 11th to the 6th-largest economy in Africa.
Poverty declines sharply, from 71% in 2023 to 24% in 2043, equivalent to 15 million fewer Tanzanians living in poverty (using the LMIC poverty line of US$3.65 per day).
To unlock the full potential of the Combined scenario, Tanzania should prioritise several key activities:
- The government should deepen regional integration by fully implementing AfCFTA commitments, improving trade logistics and enhancing export competitiveness. Streamlining border procedures and harmonising standards will strengthen Tanzania’s position as a regional trade hub.
- Governance and public management should be strengthened by improving fiscal capacity, transparency and accountability. Enhancing local government efficiency and citizen participation will improve service delivery and trust in public institutions.
- There is a need to lower barriers to formality by simplifying business registration, rationalising taxes and extending social protection and credit access to small enterprises. Formalisation will broaden the fiscal base, boost productivity and enhance job quality.
- The country should invest in human capital by improving lower- and upper-secondary completion rates, expanding vocational and STEM education and aligning skills with market demand. Stronger education–industry linkages are essential to sustain long-term growth and innovation.
- Tanzania can drive structural economic transformation by revitalising the manufacturing sector through targeted industrial policy, infrastructure investment and SME support. Expand agro-processing, mineral beneficiation and digital services to shift the economy toward value-added production and reduce overreliance on gold exports and low-value commodities.
- Agriculture should be modernised to raise productivity and resilience through investment in irrigation, local seed and fertiliser production and post-harvest infrastructure. Integrating smallholders into value chains and expanding agro-processing will increase rural incomes and food security.
- Tanzania’s industrialisation can be accelerated by expanding access to affordable finance, energy and serviced industrial zones. Promoting linkages between manufacturing, agriculture and mining can enhance local value addition and employment creation.
- Infrastructure and digital transformation should be enhanced to drive productivity and inclusion, prioritising rural electrification, transport corridors, broadband expansion and ICT-enabled enterprise growth. Closing infrastructure gaps will unlock domestic markets and regional connectivity.
- Energy security needs to be ensured by diversifying supply through renewables, natural gas and regional interconnections. Expanding off-grid systems will accelerate rural electrification and support inclusive industrialisation.
- The country should enhance climate resilience by mainstreaming adaptation into planning, investing in sustainable land use and low-carbon infrastructure, and localising implementation of the Nationally Determined Contributions (NDCs). Scaling up nature-based solutions will protect livelihoods and critical ecosystems.
- The demographic transition can be supported through investments in healthcare, girls’ education and voluntary family planning. Harnessing the demographic dividend will require parallel job creation and expanded social protection to absorb the growing labour force.
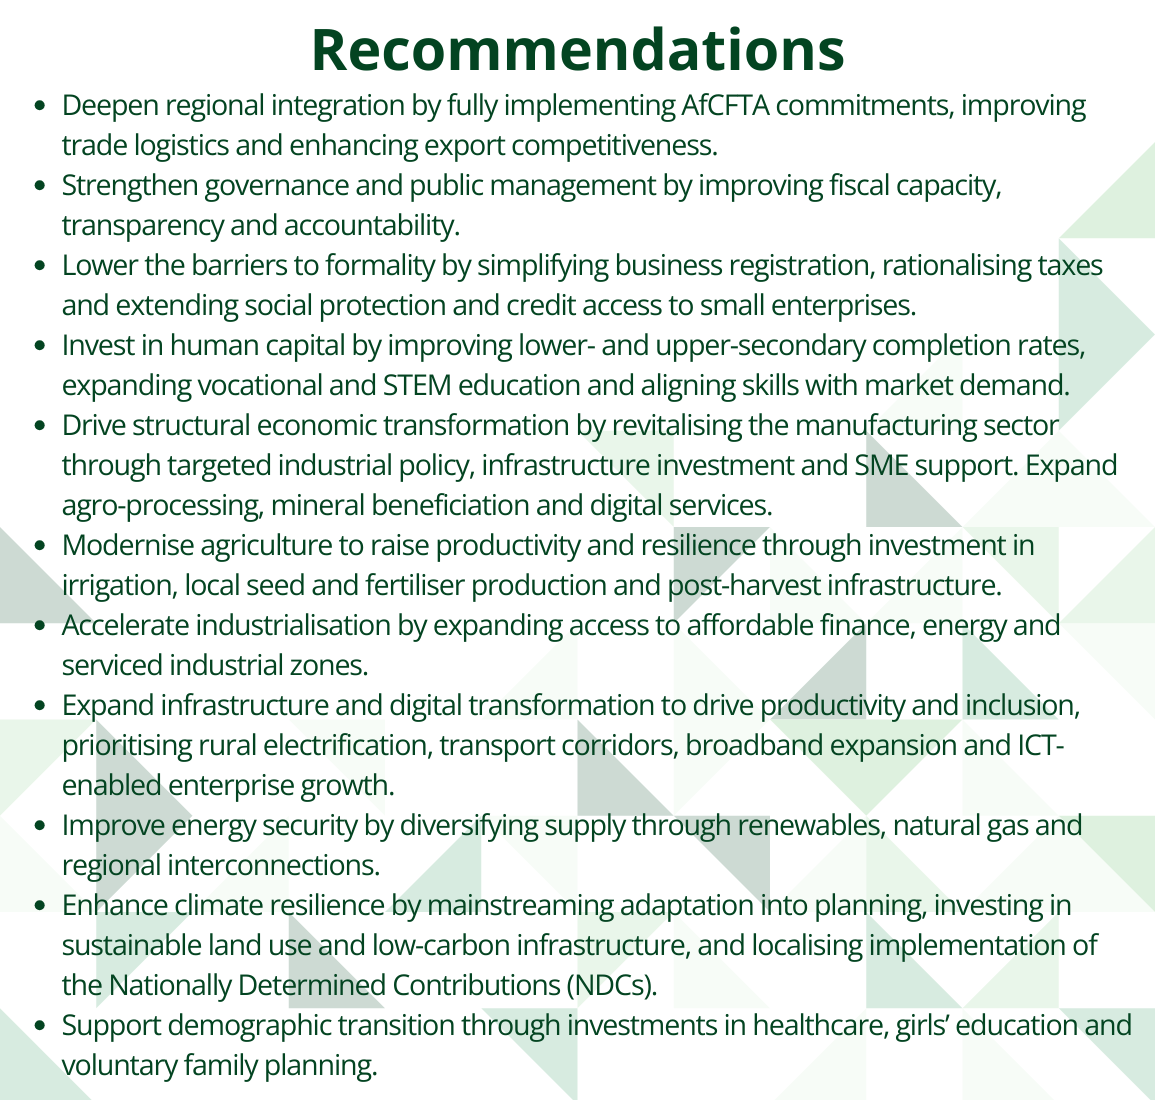
Page information
Contact at AFI team is Michelle van Rooyen and Blessing Chipanda
This entry was last updated on 15 June 2026 using IFs v8.38.
Donors and sponsors


Reuse our work
- All visualizations, data, and text produced by African Futures are completely open access under the Creative Commons BY license. You have the permission to use, distribute, and reproduce these in any medium, provided the source and authors are credited.
- The data produced by third parties and made available by African Futures is subject to the license terms from the original third-party authors. We will always indicate the original source of the data in our documentation, so you should always check the license of any such third-party data before use and redistribution.
- All of our charts can be embedded in any site.
Cite this research
Michelle van Rooyen and Blessing Chipanda (2026) Tanzania Development Futures. Published online at futures.issafrica.org. Retrieved from https://futures.issafrica.org/geographic/countries/tanzania/ [Online Resource] Updated 15 June 2026.