 Morocco
Feedback welcome
Our aim is to use the best data to inform our analysis. See our Technical page for information on the IFs forecasting platform. We appreciate your help and references for improvements via our feedback form.
This report examines Morocco's current and projected future development. It presents eight sectoral scenarios to forecast progress by 2043, including demographic, economic and infrastructure-related outcomes. Morocco faces challenges with water scarcity, energy dependence, and regional disputes but offers significant growth potential based on its unique geographical position and diversified economy, which has strengths in agriculture, manufacturing, and tourism sectors. The analysis further considers the implications of the Agenda 2063 goals, aiming to offer insights into policy actions that could enhance Morocco's developmental trajectory and guide the country towards a more prosperous future.
Please see About this Site for more information about the International Futures modelling platform we use to develop the various scenarios.
Executive Summary
This page begins with an introductory assessment of the Kingdom of Morocco’s context, looking at current population distribution, social structure, climate and topography. Morocco is the only African country with Atlantic and Mediterranean coastlines and the only one with a land border with a member state of the European Union, Spain. It claims the disputed Western Sahara territory as part of its territory.
The Current Path forecast for Morocco presents its likely development trajectory to 2043. It is based on current geopolitical trends and assumes that no major shocks would occur in a ‘business as usual’ future.
- On the Current Path, Morocco’s population will increase from 36.5 million in 2019 to 43.3 million in 2043. With a median age of 28.4 years in 2019, Morocco is in a favourable window of demographic opportunity, contributing to steady economic growth.
- Between 1990 and 2019, Morocco’s GDP increased almost threefold from US$48.64 billion to US$133.4 billion, at which point it was the fifth largest economy in Africa. By 2043, the country’s GDP will have expanded to US$253.4 billion. The informal sector will account for 18% of GDP in 2043, down from 30% in 2019.
- The World Bank classifies Morocco as a lower-middle-income country with a GDP per capita of US$8 368. On the Current Path, its GDP per capita will increase to US$10 718 in 2043.
- In 2019, 211 000 people lived below the poverty line of US$1.90 and 1.9 million below US$3.20 per day, equivalent to 0.6% and 5.1% of the population. By 2043, the share of people living below the US$3.20 poverty line will decline to 1.3% (582 000) compared to 5.1% (1.9 million) in 2019.
- The national development plan published in 2021 is known as the New Development Model.
The third section compares progress on the Current Path with eight sectoral scenarios. The eight sectoral scenarios are Demographics and Health; Agriculture; Education; Manufacturing; the African Continental Free Trade Area (AfCFTA); Large Infrastructure and Leapfrogging; Financial Flows; and Governance. We benchmark each scenario to present an ambitious but reasonable aspiration in that sector.
- Morocco has a more mature population structure than most African countries and is already benefiting from the advantage of a large working-age population relative to dependents. The Demographics and Health scenario will ensure Morocco benefits from an even larger demographic dividend and better health than the Current Path. In this scenario, infant mortality rates in Morocco will reduce to 8.1 deaths per 1 000 live births by 2043 compared to 9.2 deaths in the Current Path.
- The Agriculture scenario, will significantly improve Morocco’s food security. By 2043, exports will exceed imports by 1.3% of demand. On the Current Path, Morroco would have imported 9.6% of its agriculture demand by 2043. Water and land ownership patterns are two large constraints on improved agricultural production.
- Morocco’s educational attainment for the 15 to 24 age group was nine years in 2019, increasing to 9.7 years in 2043 on the Current Path and 9.9 years in the Education scenario. In the scenario, Morocco improves its mean years of education in the 15 to 24 age group to surpass neighbouring Algeria by 2043.
- The Manufacturing scenario increases the size of Morocco’s economy by 6.8% in 2043 (to US$270.6 billion instead of US$253.4 billion). The service sector will remain the largest contributor to Morocco’s GDP by 2043. Still, instead of contributing 55% of GDP on the Current Path, its share will decline to 50.5%. The manufacturing sector will increase its contribution to GDP to 30.3% (US$82 180.43 billion) instead of 24.3% (US$61.45 billion) by 2043.
- Morocco mainly trades with Europe and has large opportunities in Africa. In the AfCFTA scenario, Morocco’s exports will increase by 70% in value by 2043 (US$163.1 billion instead of US$95.26 billion) and imports by 57% (US$197 billion instead of US$125.8 billion). Morocco will also improve its trade openness ranking.
- Given that Moroccans already enjoy universal access to electricity with above-average ICT, the Large Infrastructure and Leapfrogging scenario has a marginal impact but increases paved roads by 11.6%.
- In the Financial Flows scenario, 2043 foreign direct investment inflows will account for 4.4% of GDP compared to 3.1% in the Current Path, boosting government revenues to US$87.1 billion instead of US$84.4 billion.
- Morocco already does better than its peers on security (10% better in 2019 and 8% better by 2043) and capacity (60% better in 2019 and 40% better in 2043) but worse in inclusion (-34% in 2019 and -16% in 2043), the three dimensions used to compare progress. In the Governance scenario, security in Morocco will be 11% better by 2043, capacity will be 50% higher and Morocco will only be 9% less inclusive than its peers. Morocco is generally better governed than most other lower-middle-income countries in Africa and the positive situation improves further in the Governance scenario.
The subsequent section compares the impact of each of the eight sectoral scenarios with one another and with a Combined Agenda 2063 scenario (the sum effect of all eight scenarios).
- Morocco’s GDP per capita was US$8 368 in 2019, and the Current Path for 2043 is US$10 718. Among the sectoral interventions, the AfCFTA scenario will have the greatest positive impact on the GDP per capita, taking it to US$11 859, followed by the Governance and Manufacturing scenarios.
- The Manufacturing scenario has the largest impact on extreme poverty, followed by the Agriculture scenario.
- In the Combined scenario, Morocco’s economy will be more than 51% larger than the Current Path for that year. In 2019, Morocco’s economy was the 5th largest in Africa. In the Combined scenario, it would be Africa’s 6th largest economy by 2043 instead of the 11th largest in the Current Path.
- In 2019, Morocco emitted 18 million tons of carbon from fossil fuels making it the fifth largest emitter in Africa. On the Current Path, emissions will increase to 30 million tons of carbon by 2043. Emissions in the Combined scenario is 38 million tons of carbon (i.e. a 24% increase above the 2043 Current Path) and the 6th largest in Africa.
We end this page with a summarising conclusion offering key recommendations for decision-making. Morocco's strategic investments in infrastructure, education and governance reforms present substantial opportunities for sustainable growth and development, positioning it for long-term stability and success by 2043.
All charts for Morocco Development Futures
- Chart 1: Political map of Morocco
- Chart 2: Population structure in Current Path, 1990–2043
- Chart 3: Population distribution map, 2022
- Chart 4: GDP in MER and growth in the Current Path, 1990–2043
- Chart 5: Size of the informal economy, as per cent of GDP and per cent of total labour, 2019-2043
- Chart 6: GDP per capita in Current Path, 1990–2043
- Chart 7: Extreme poverty in Current Path as per cent of population and numbers, 2019–2043
- Chart 8: National Development Plan of Morocco
- Chart 9: Current Path and scenarios
- Chart 10: Demographics and Health scenario
- Chart 11: Urban and rural population in Current Path and Demographics and Health scenario, 1990–2043
- Chart 12: Infant mortality rate in Current Path and Demographics and Health scenario, 2019–2043
- Chart 13: Demographic dividend in the Current Path and Demographics and Health scenario, 2019–2043
- Chart 14: Agriculture scenario
- Chart 15: Import dependence in the Current Path and Agriculture scenario, 2019–2043
- Chart 16: Education scenario
- Chart 17: Mean years of education in Current Path and Education scenario, 2019–2043 15 to 24 year age group
- Chart 18: Manufacturing scenario
- Chart 19: Value-add by the manufacturing sector in Current Path and Manufacturing scenario, 2019–2043
- Chart 20: AfCFTA scenario
- Chart 21: Trade balance in Current Path and AfCFTA scenario, 2019–2043
- Chart 22: Infrastructure and Leapfrogging scenario
- Chart 23: Rural road access in Current Path and Infra/Leapfrogging scenario, 2019–2043
- Chart 24: Access to mobile and fixed broadband in Current Path and Infra/Leapfrogging scenario, 2019–2043
- Chart 25: Financial Flows scenario
- Chart 26: Government revenue in Current Path and Financial Flows scenario, 2019–2043
- Chart 27: Governance scenario
- Chart 28: Composite governance index in Current Path vs Governance scenario, 2019–2043
- Chart 29: GDP per capita in Current Path and scenarios, 2019–2043
- Chart 30: Poverty in Current Path and scenarios, 2019–2043
- Chart 31: GDP (MER) in Current Path and Combined Agenda 2063 scenario, 2019–2043
- Chart 32: Value added by sector in Current Path and Combined Agenda 2063 scenario, 2019–2043
- Chart 33: Informal sector as % of total economy in Current Path and Combined Agenda 2063, 2019–2043
- Chart 34: Life expectancy in Current Path and Combined Agenda 2063 scenario, 2019–2043
- Chart 35: Domestic Gini in Current Path and the Combined Agenda 2063 scenario, 2019–2043
- Chart 36: Carbon emissions in Current Path and in Combined Agenda 2063 scenario, 2019–2043
- Chart 37: Energy demand and production by type in Current Path and Combined Agenda 2063 scenario, 2019-2043
- Chart 38: Recommendations
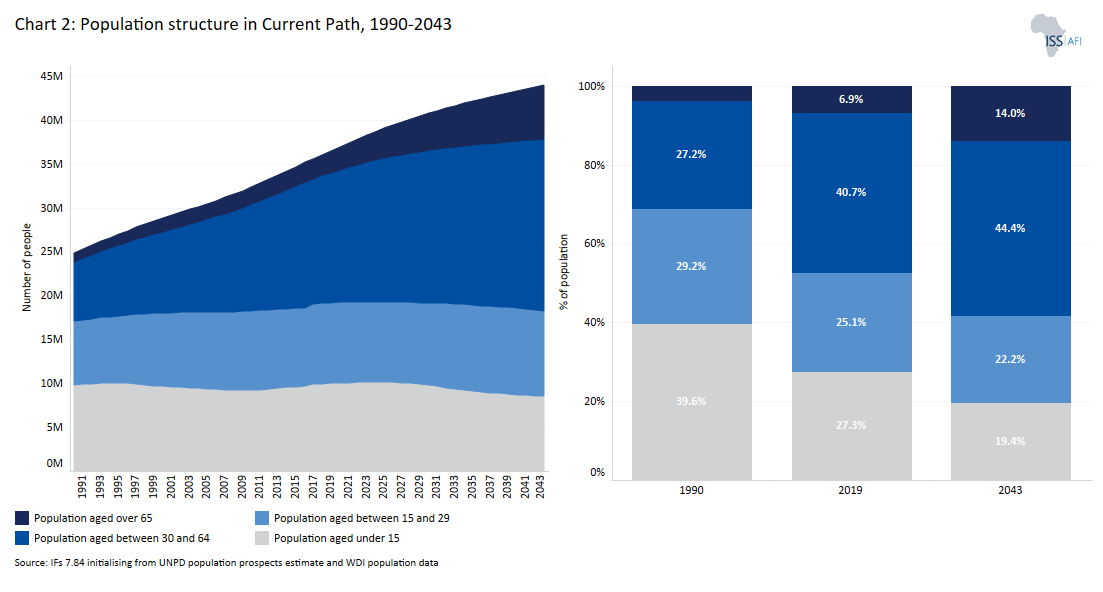
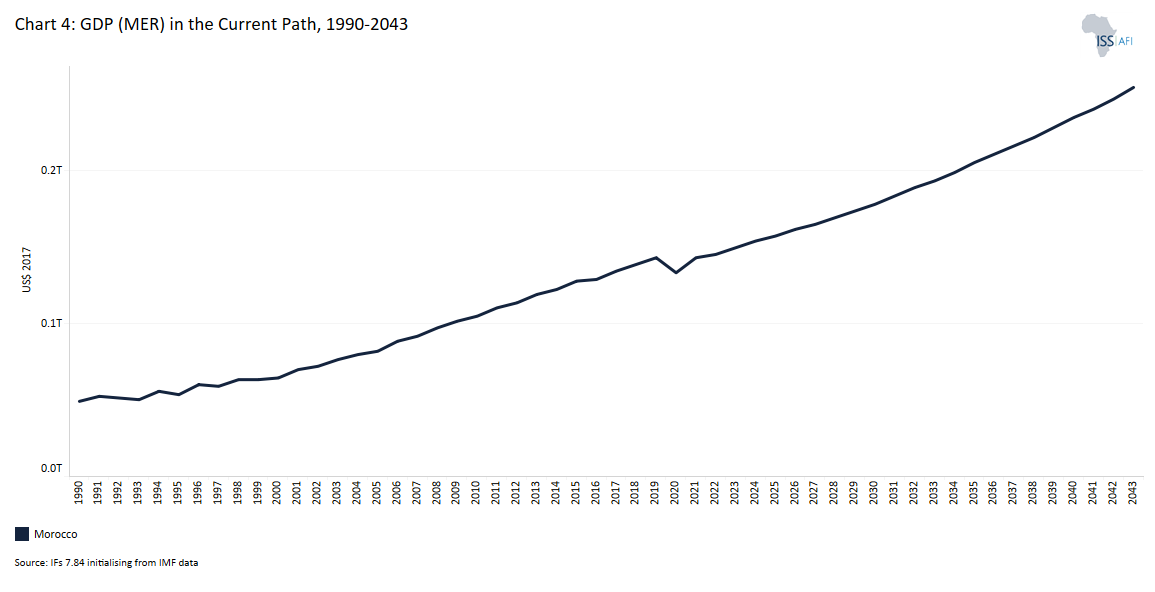
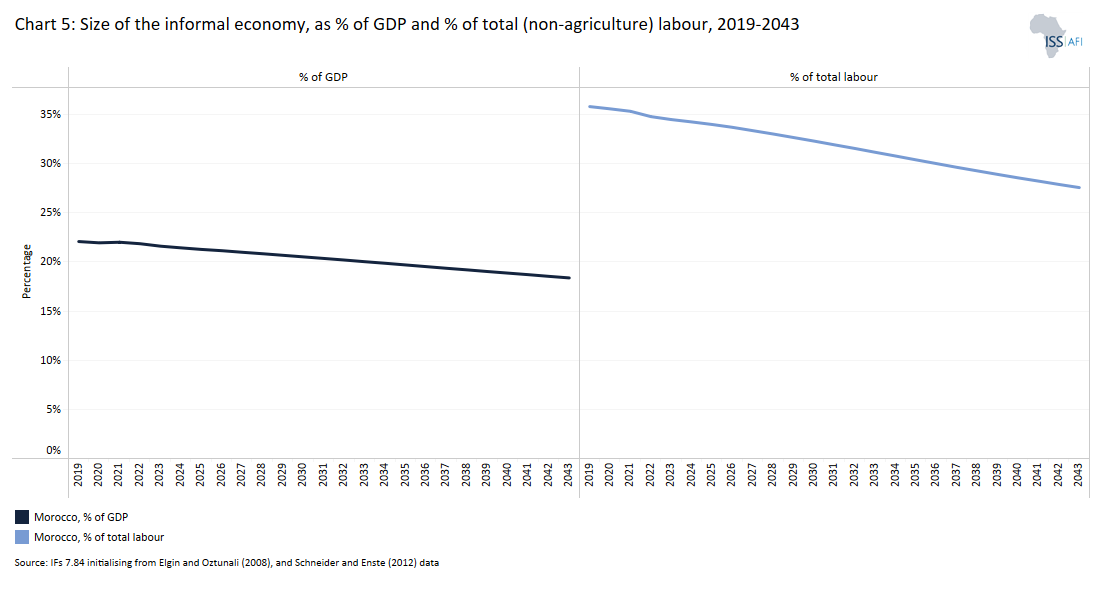
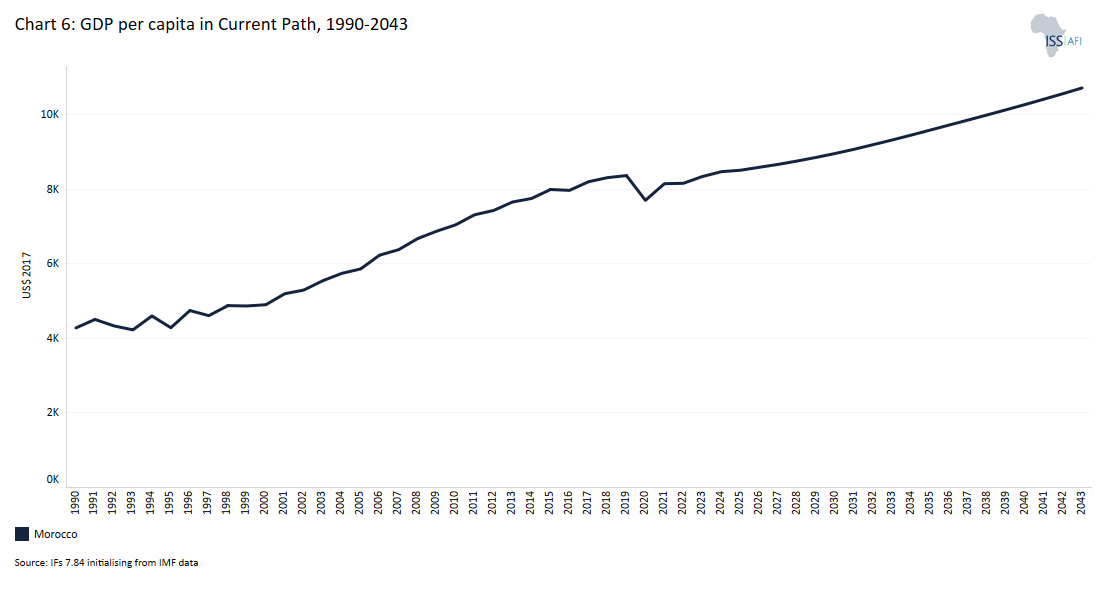
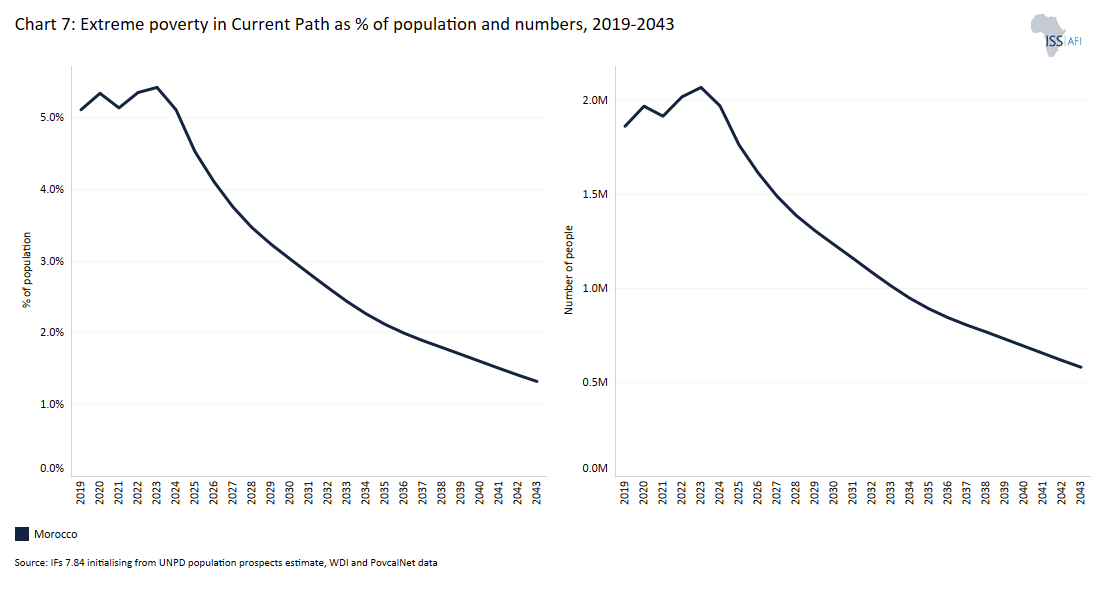
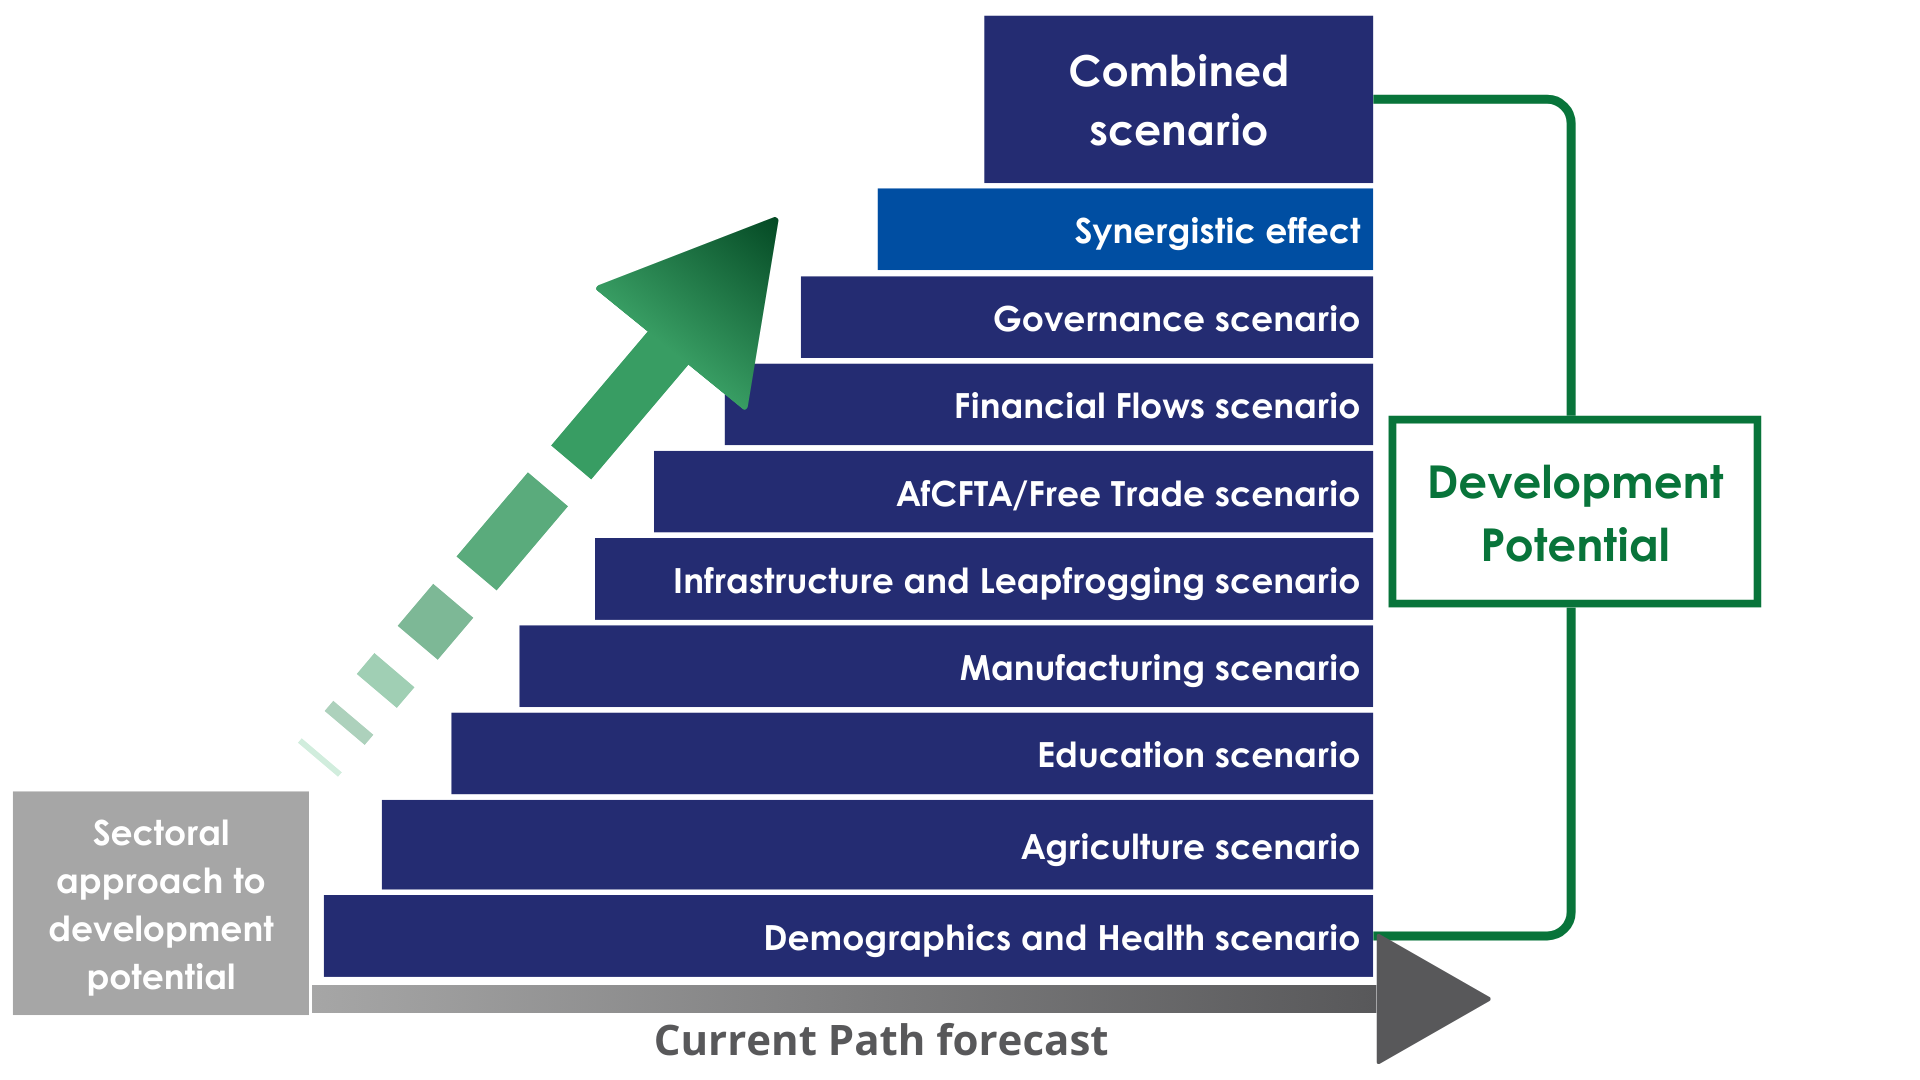
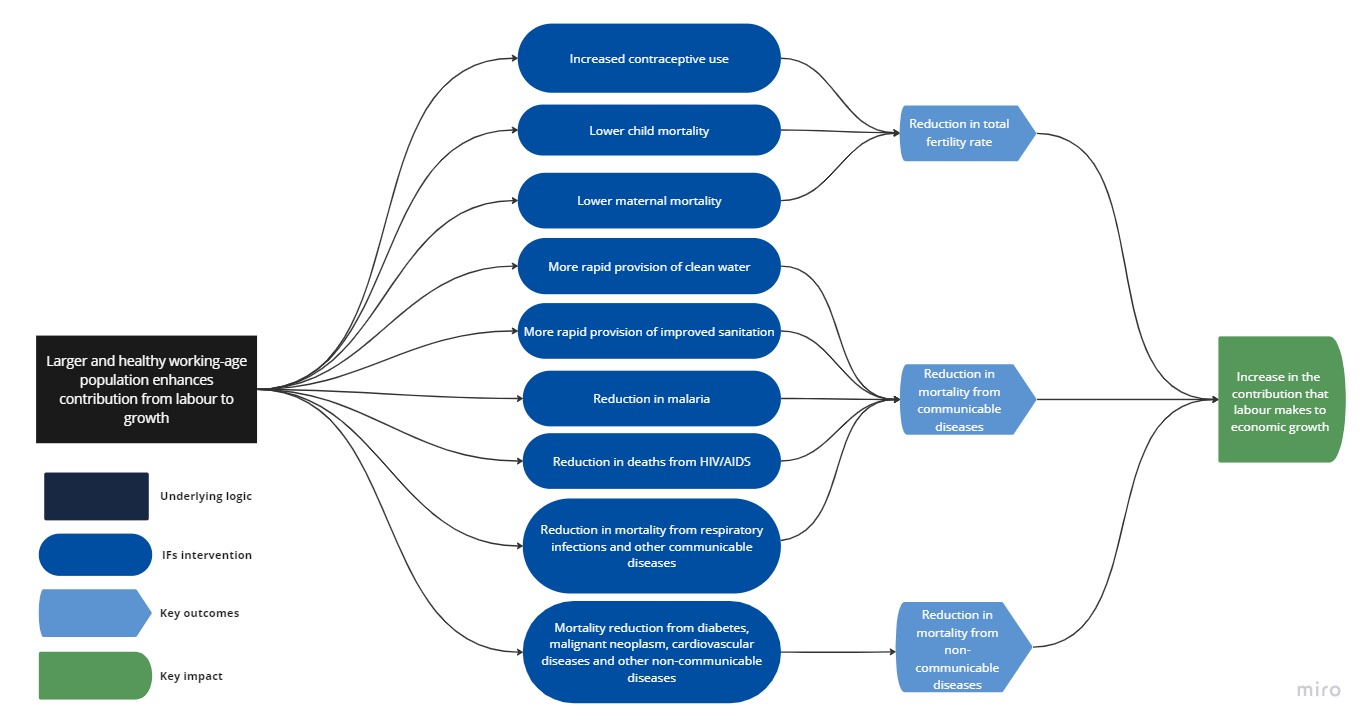
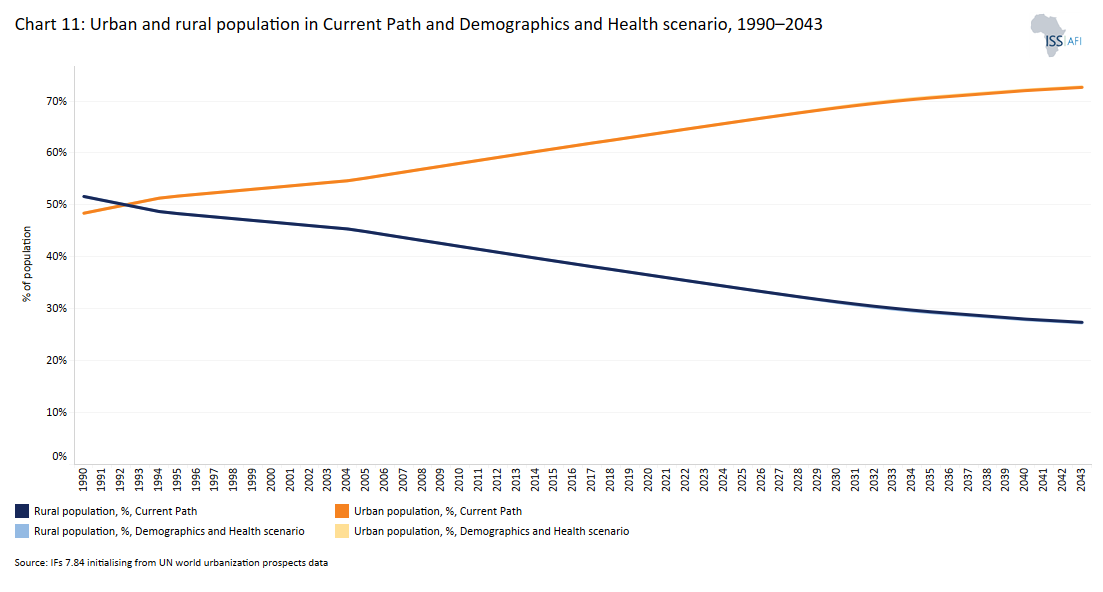
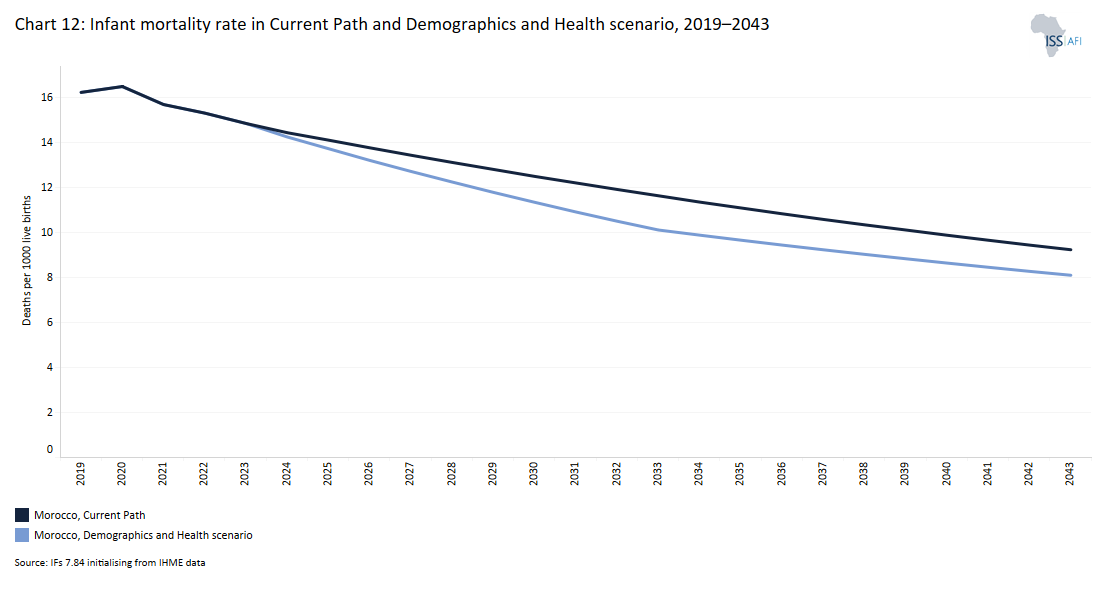
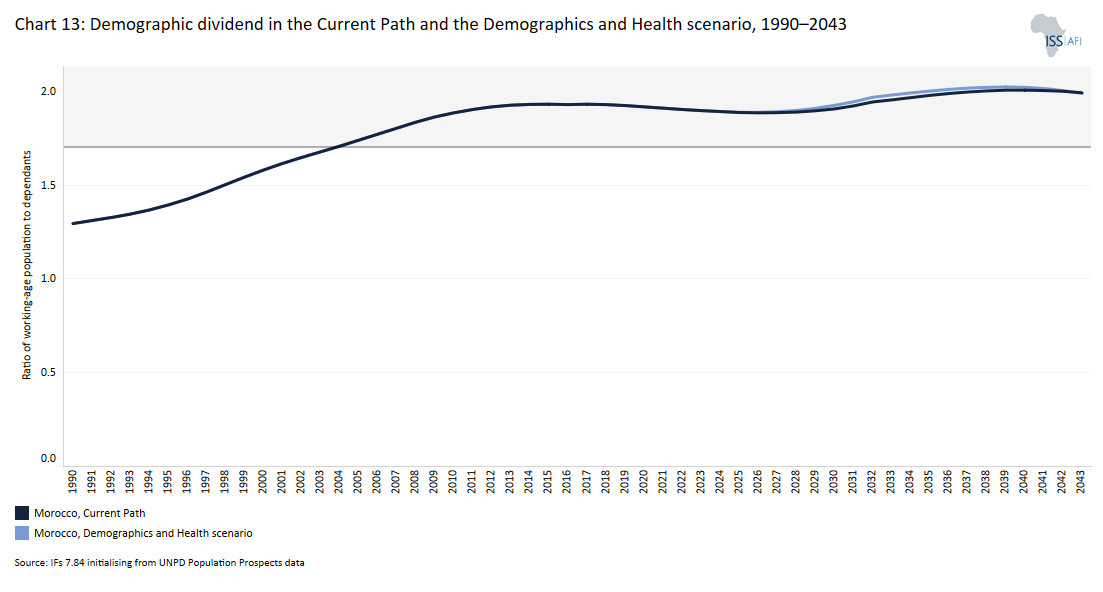
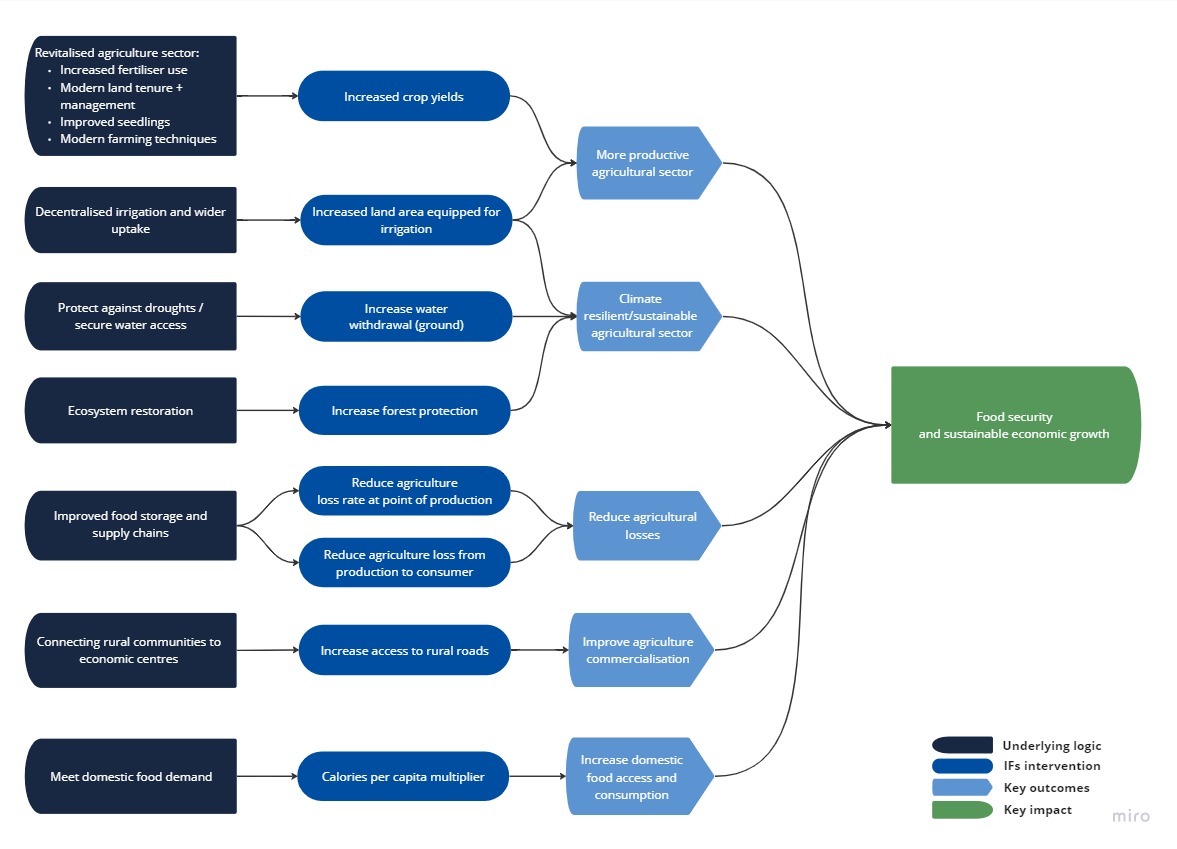
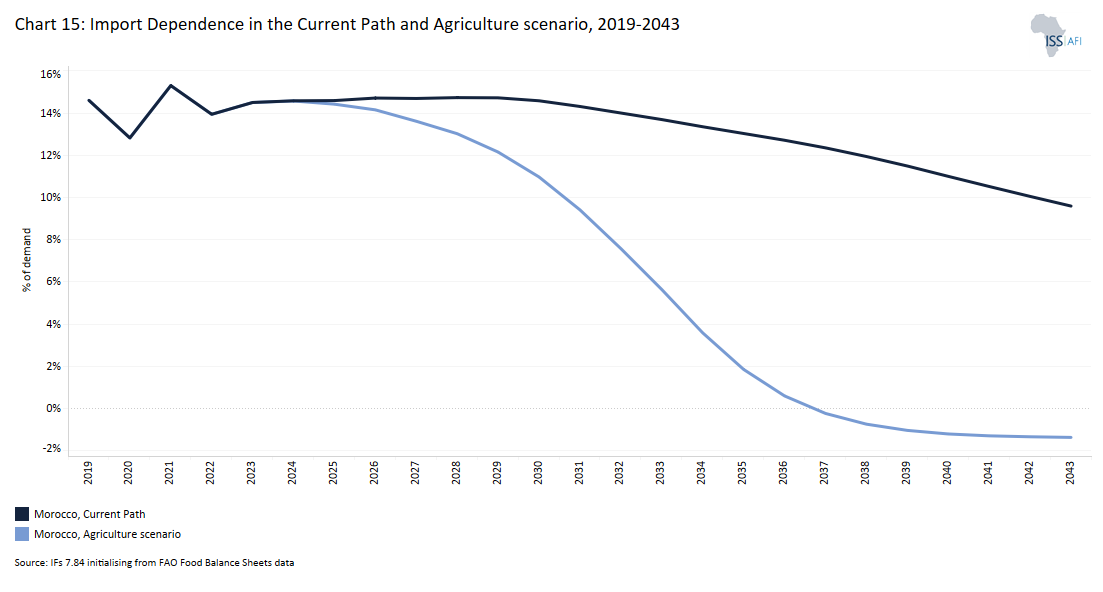
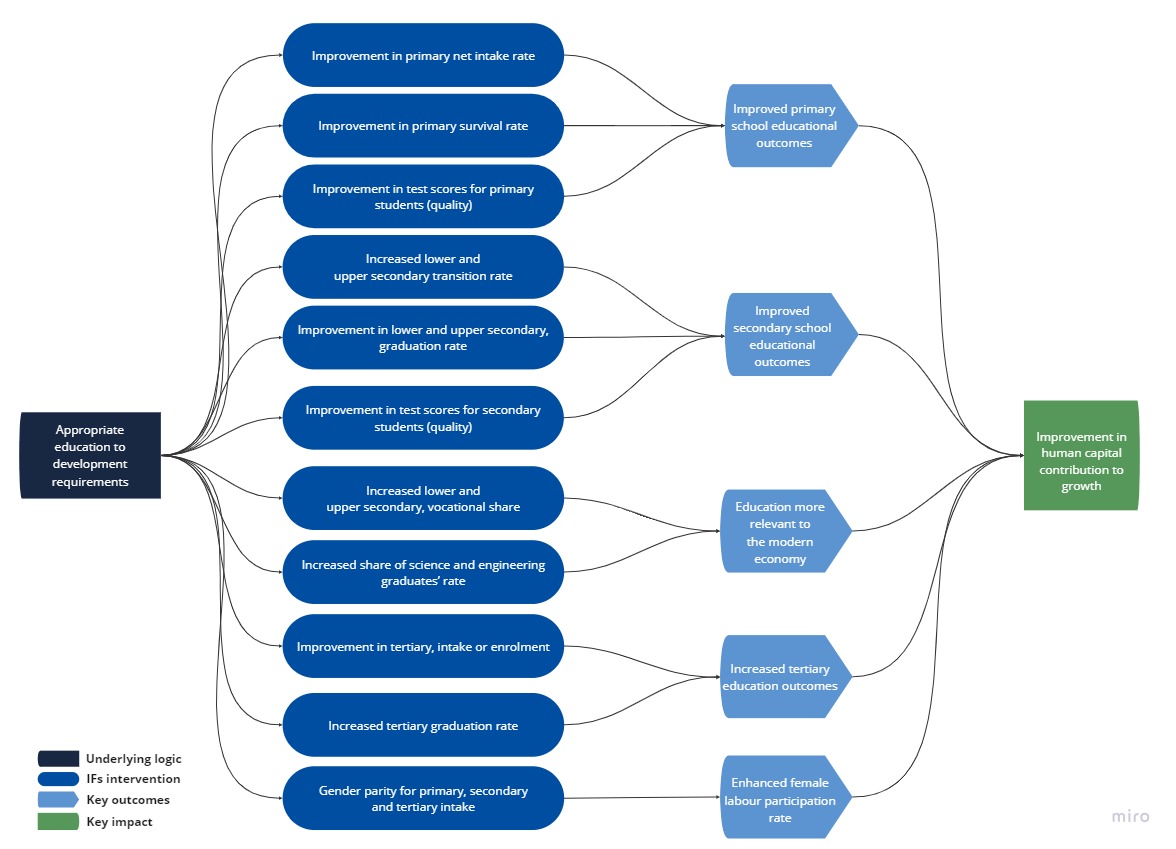
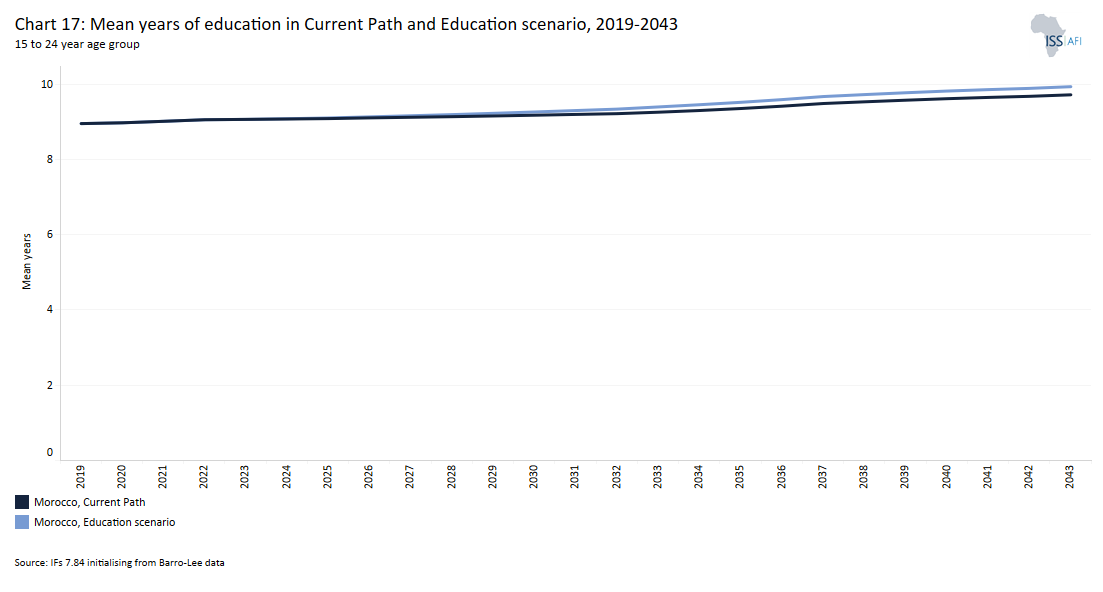
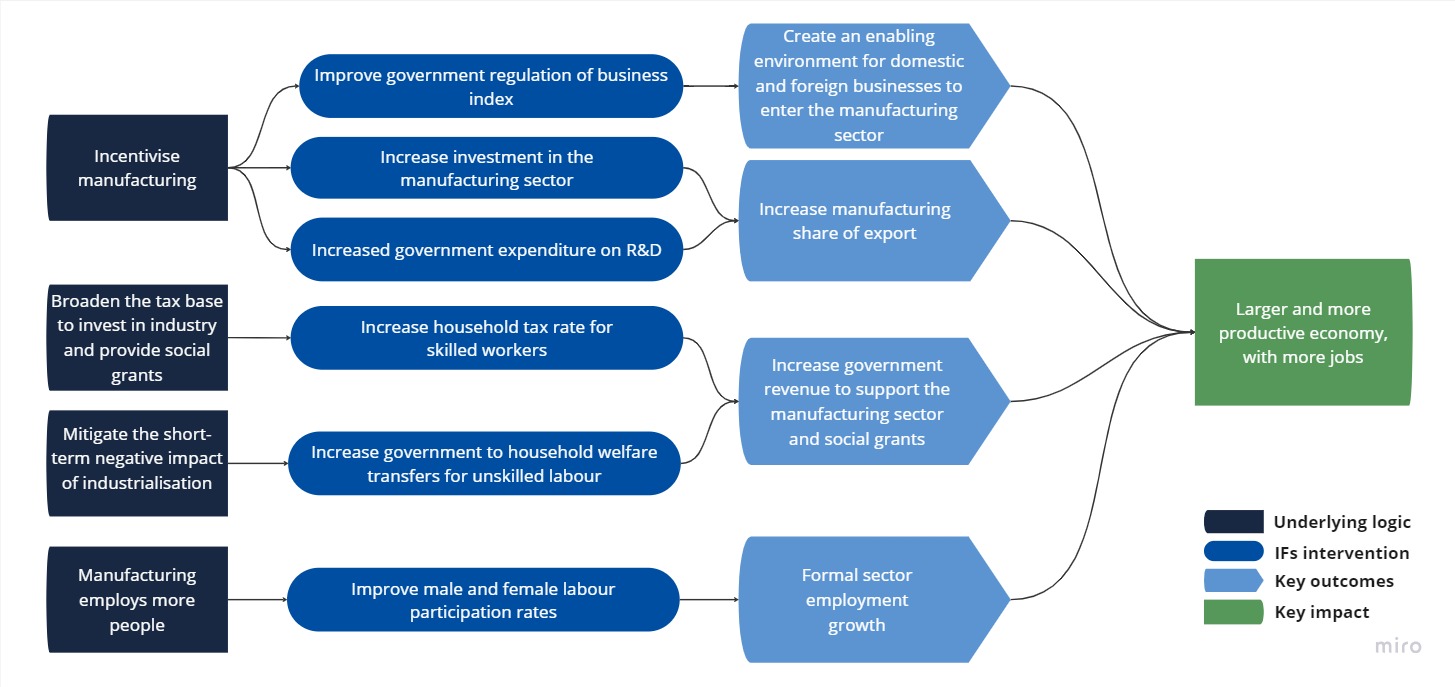
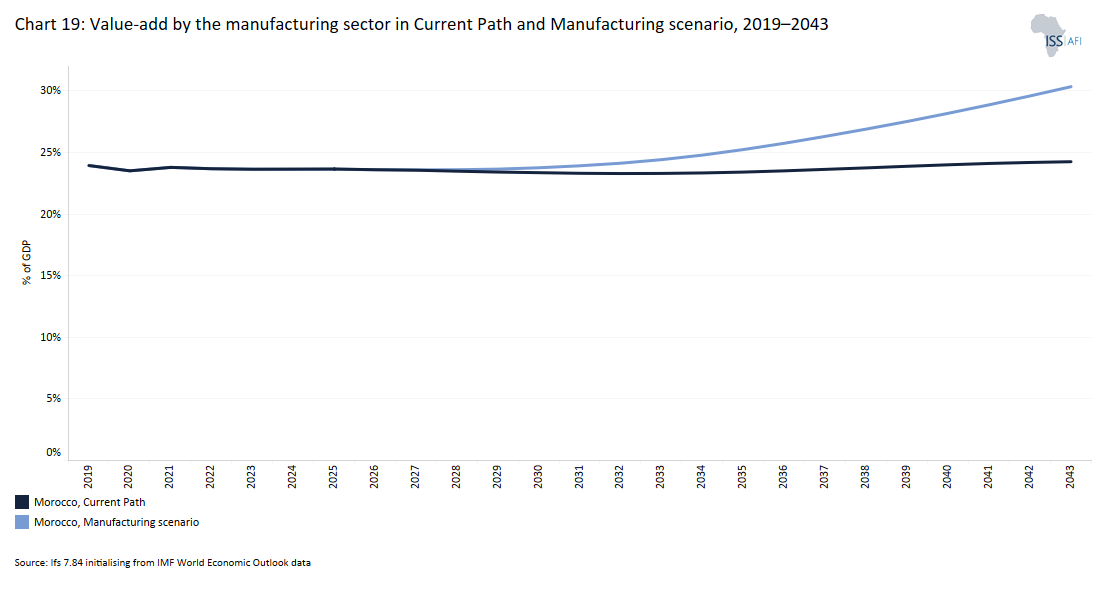
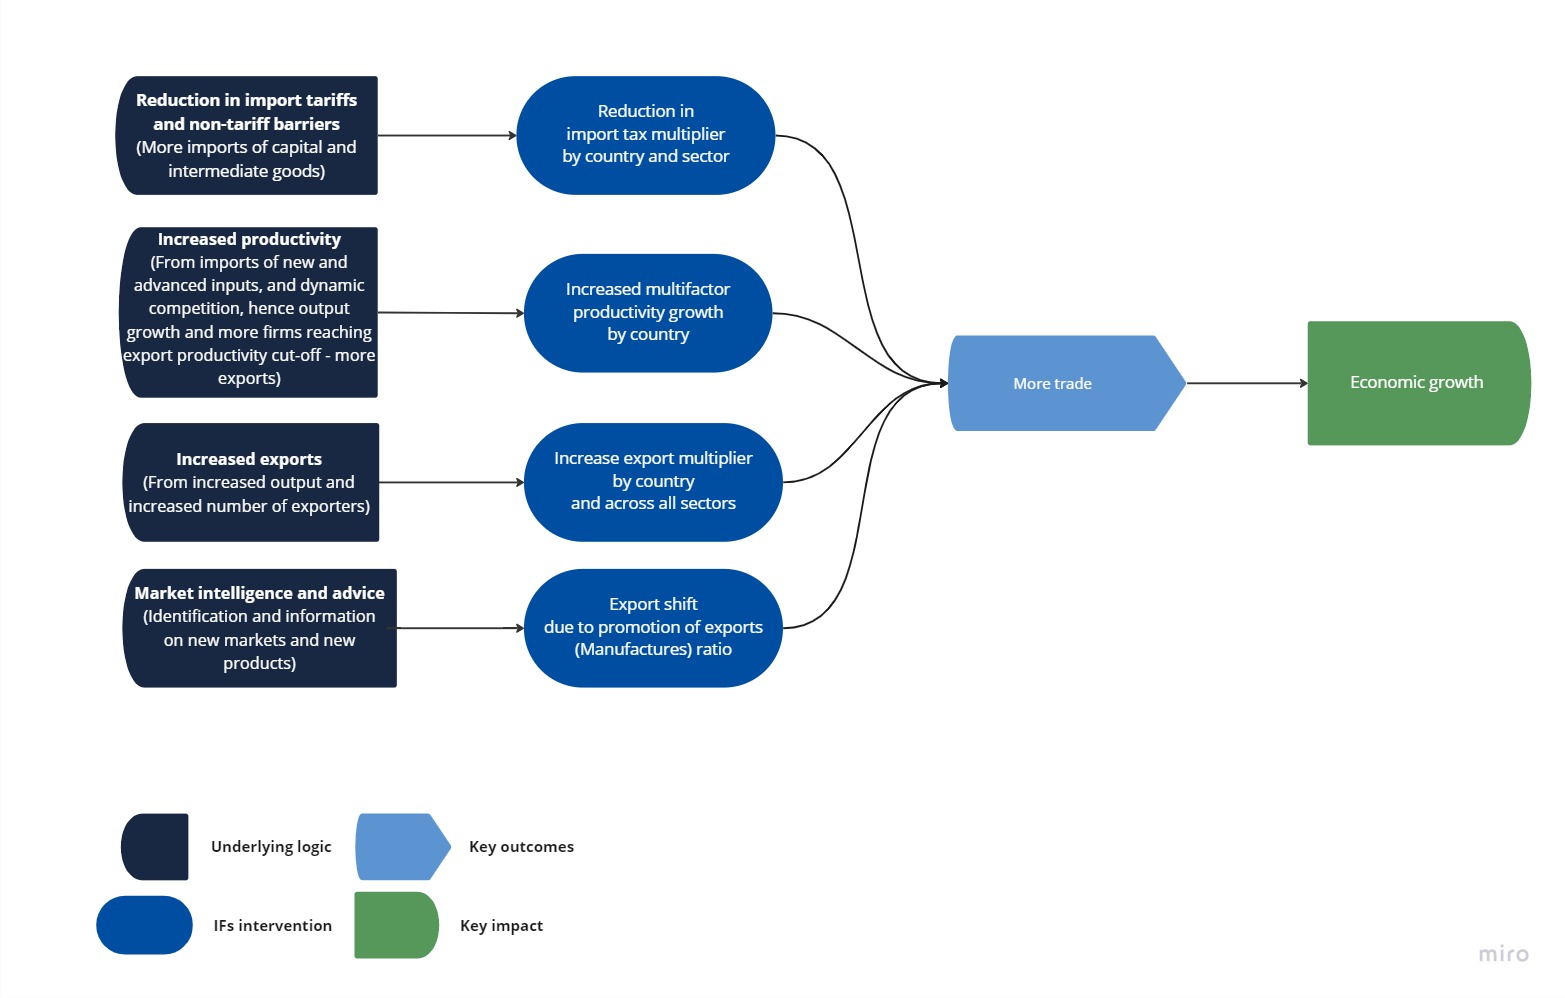
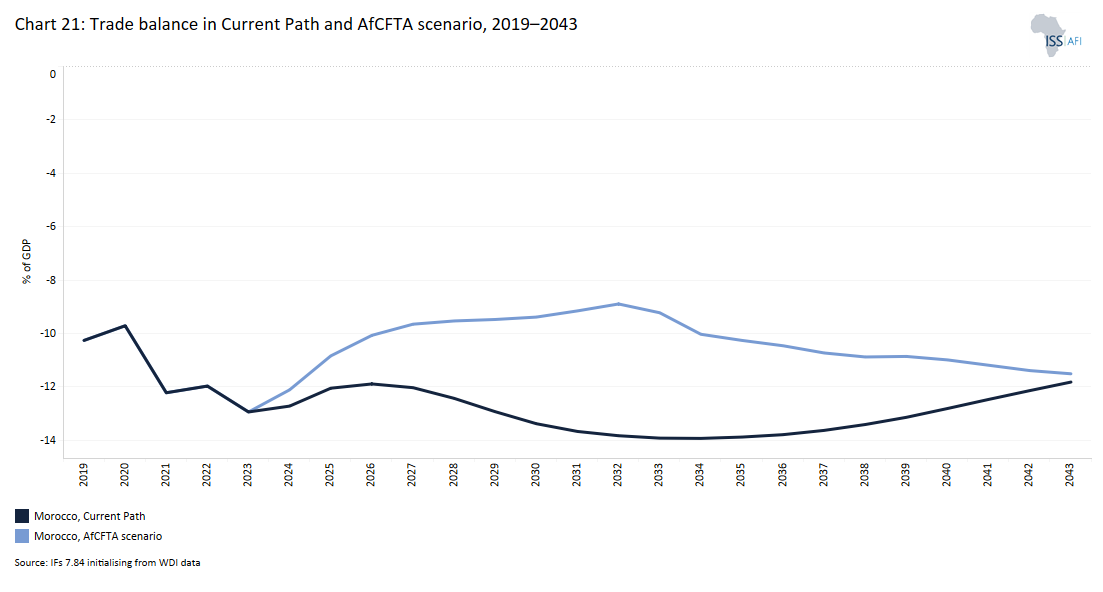
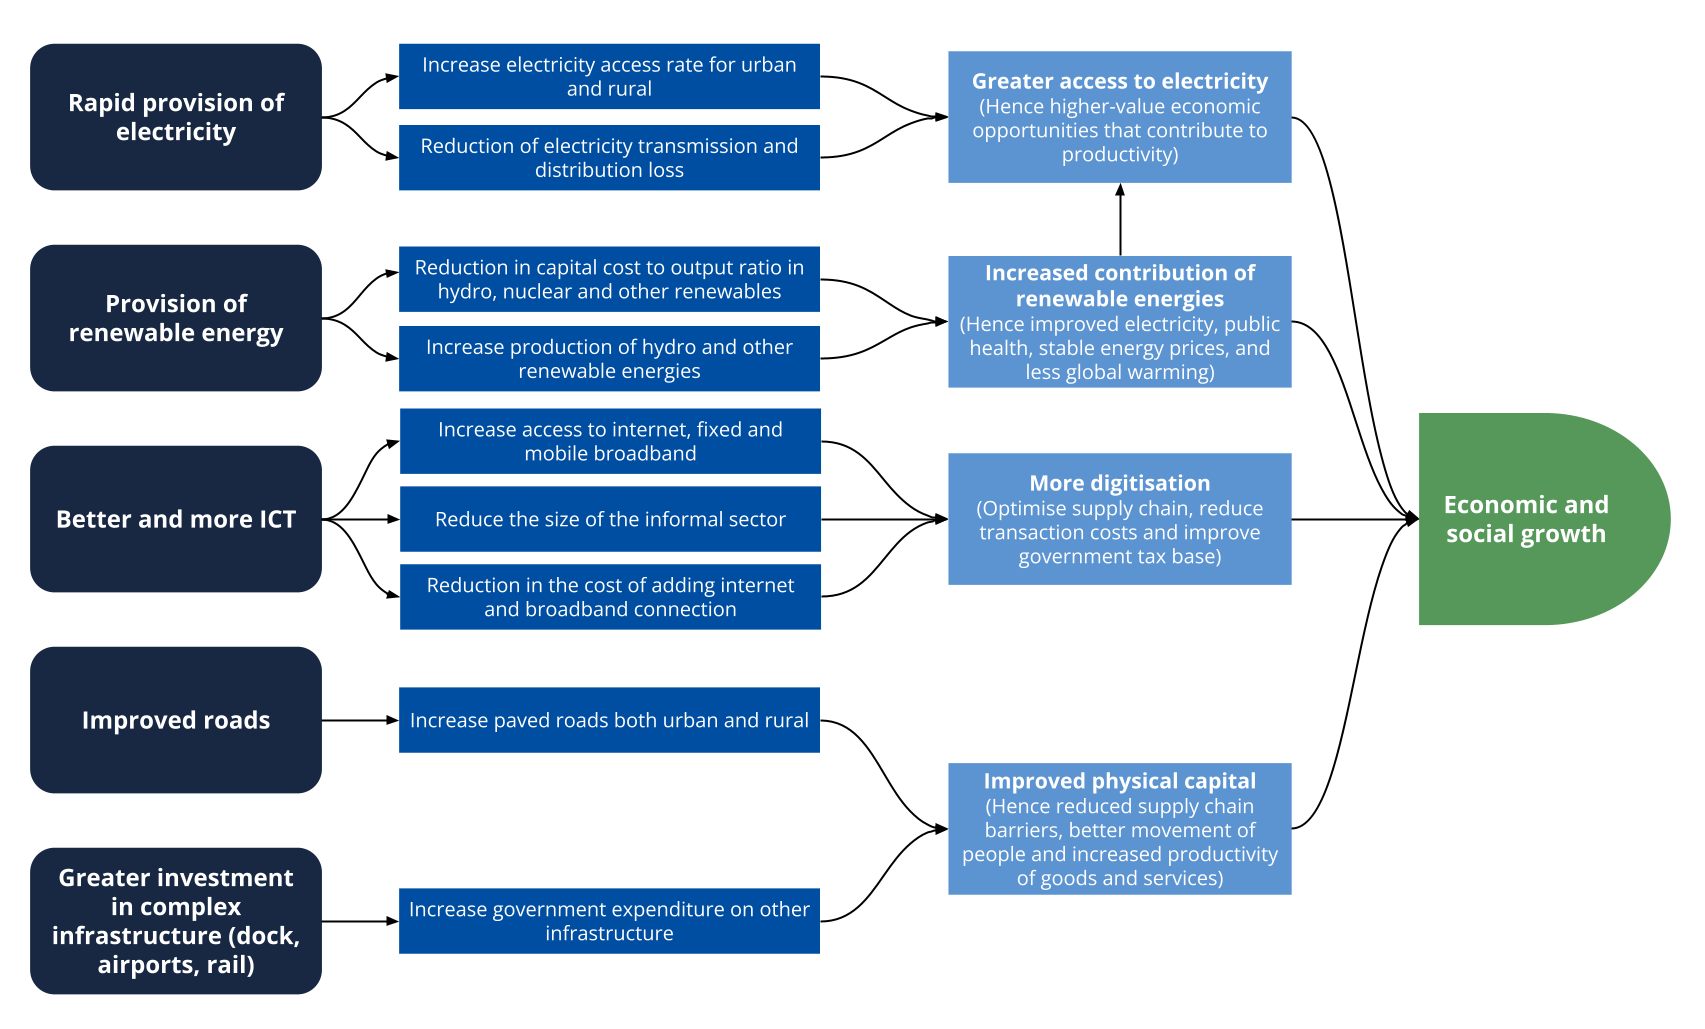
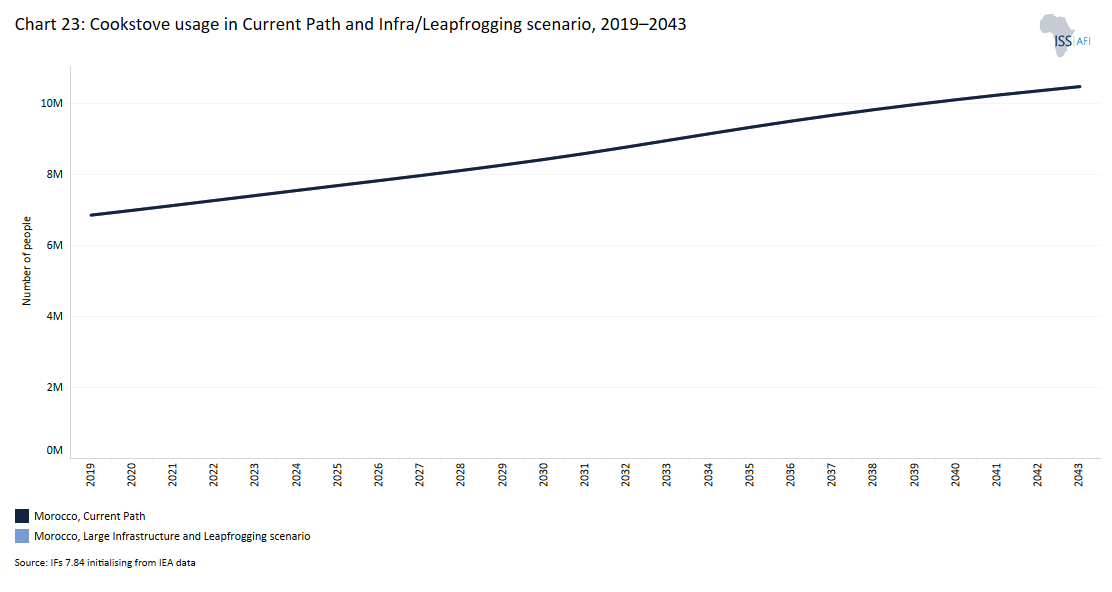
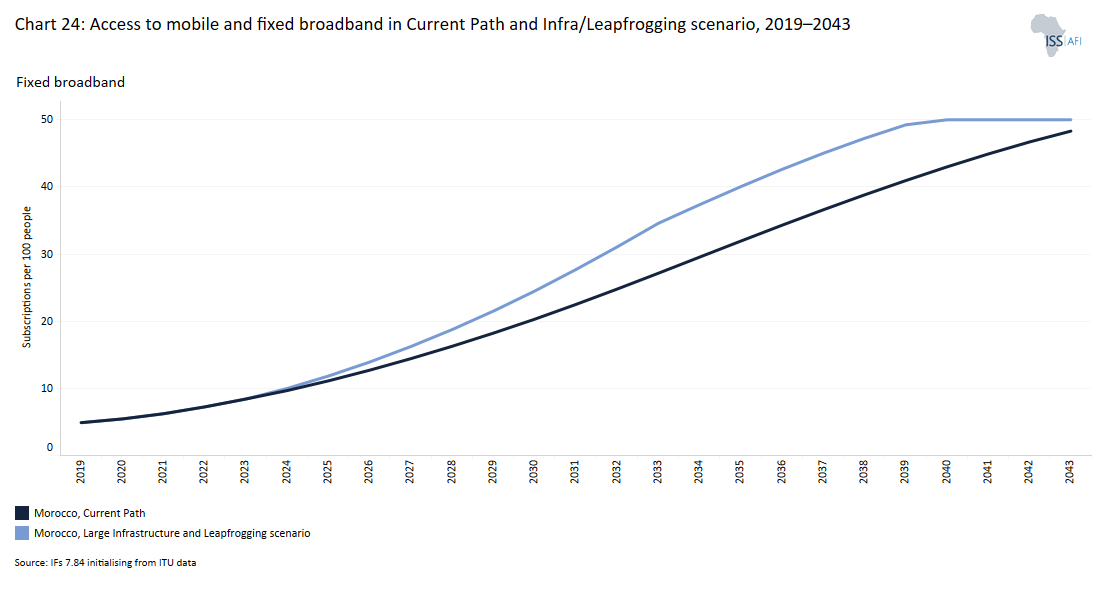
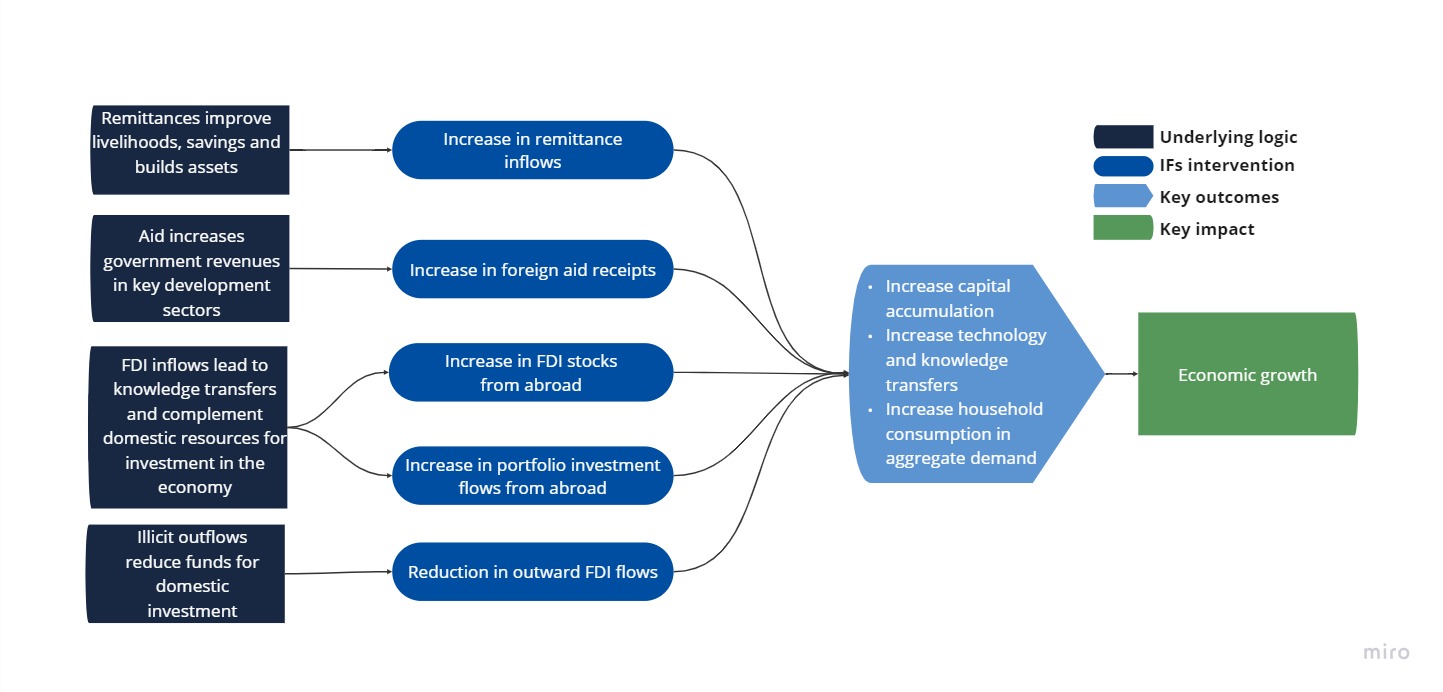
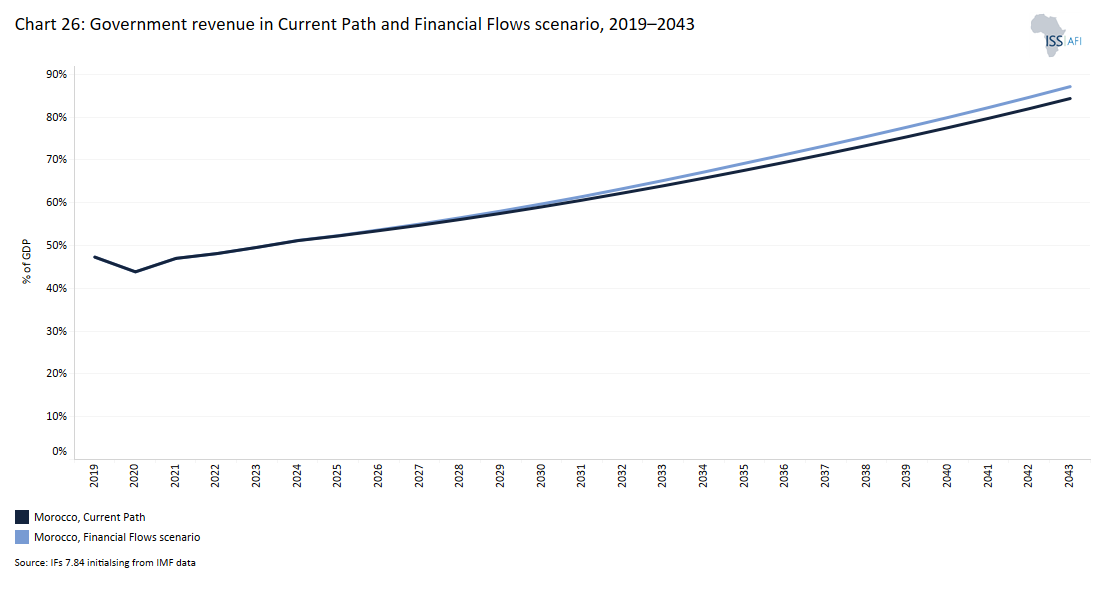
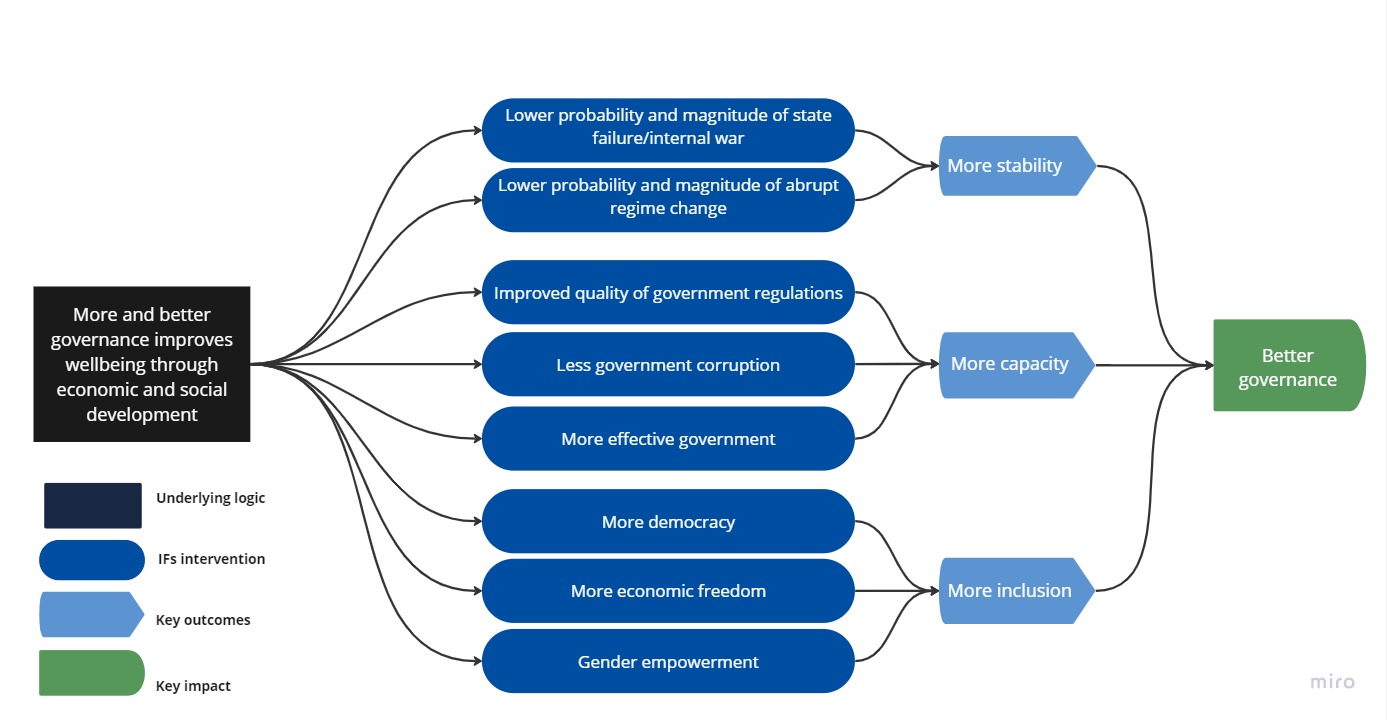
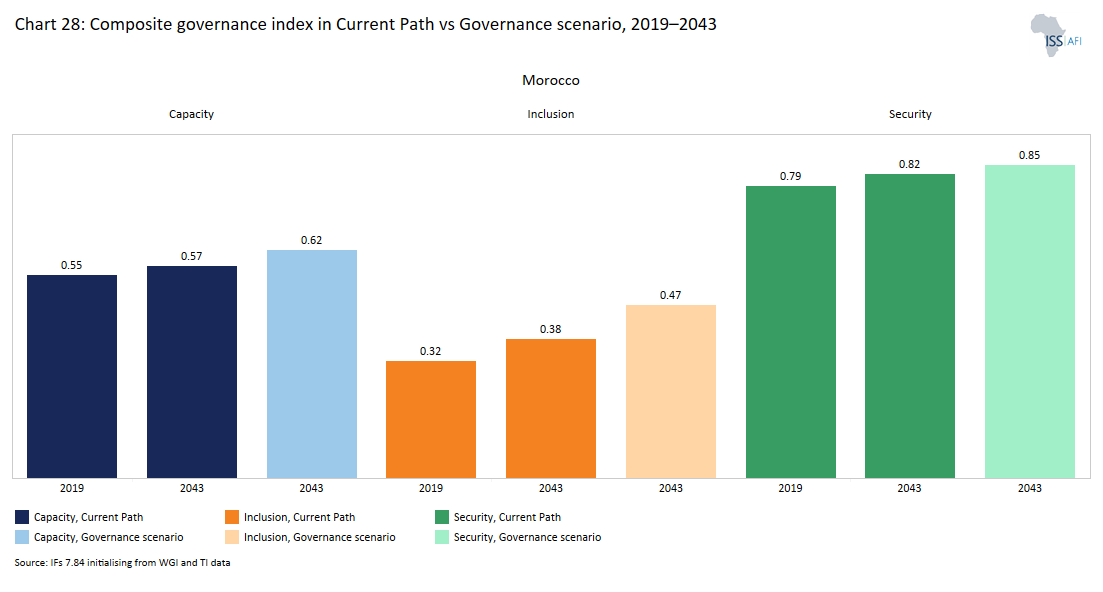
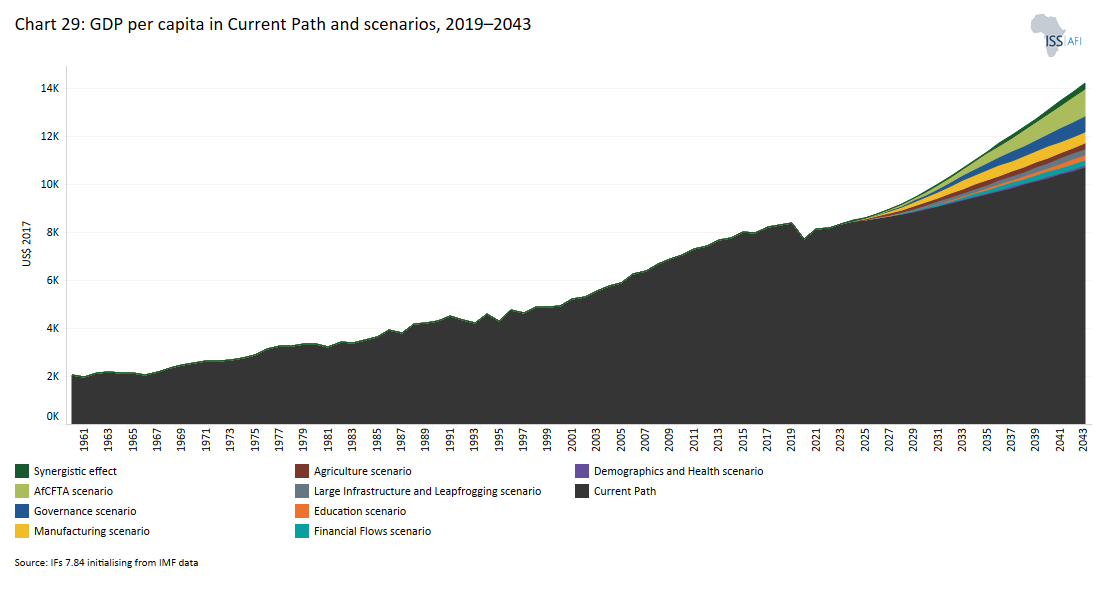
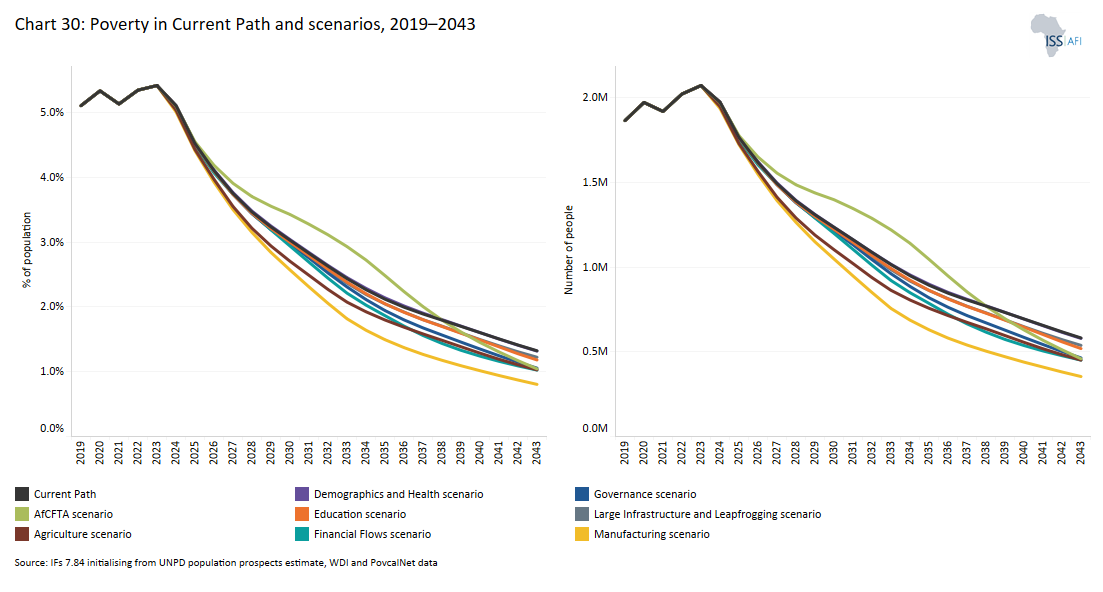
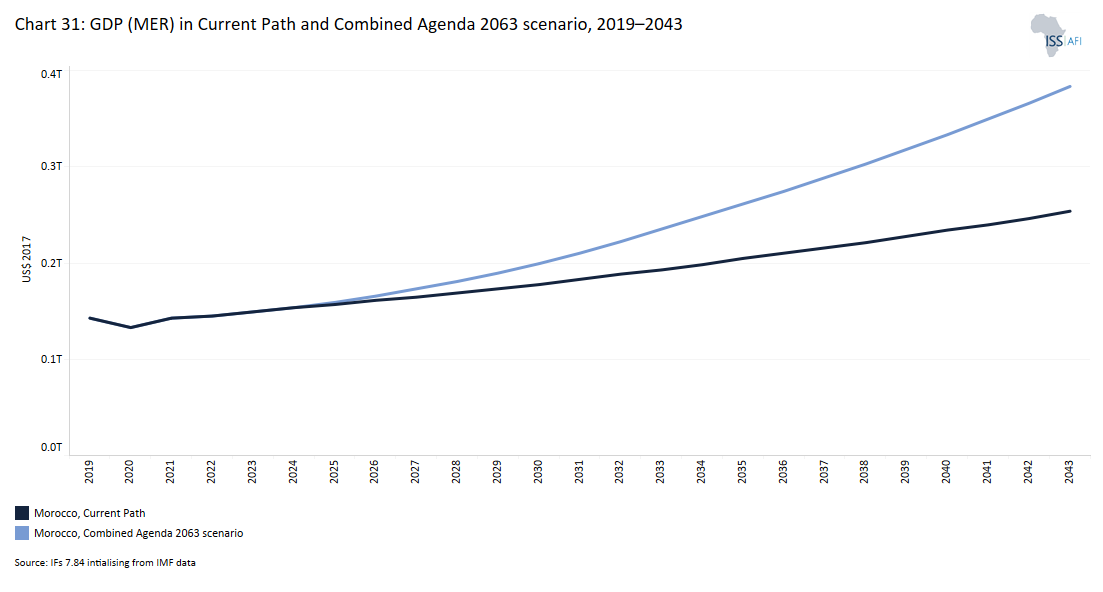
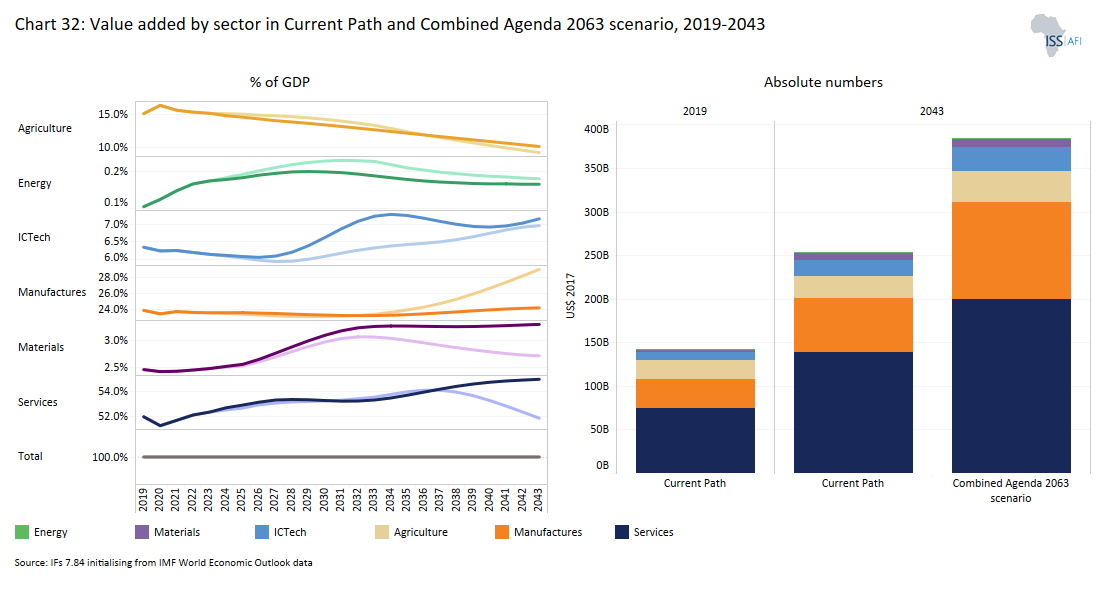
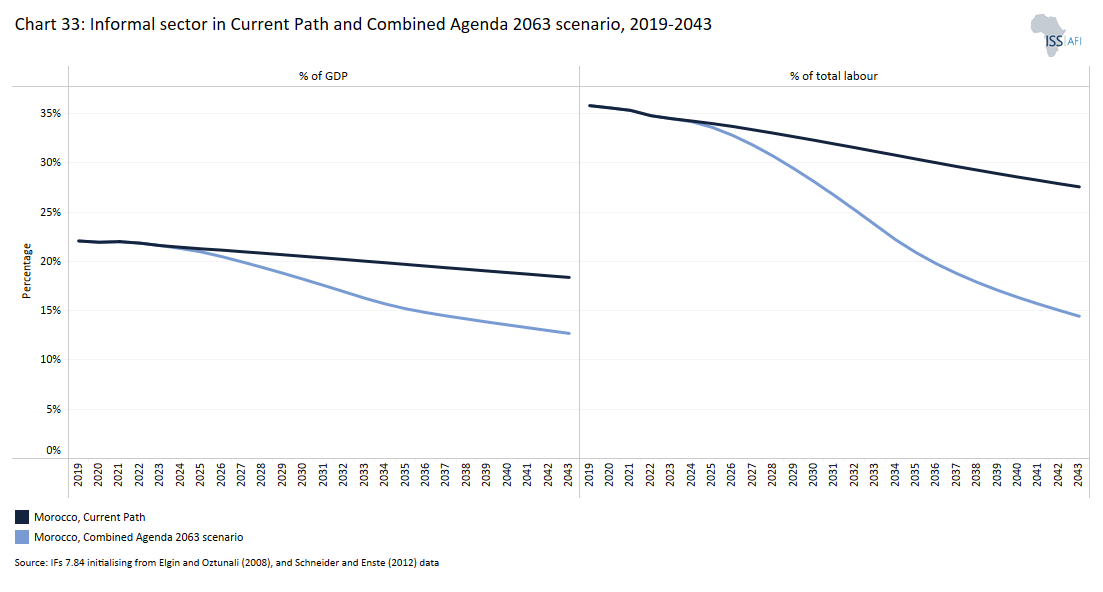
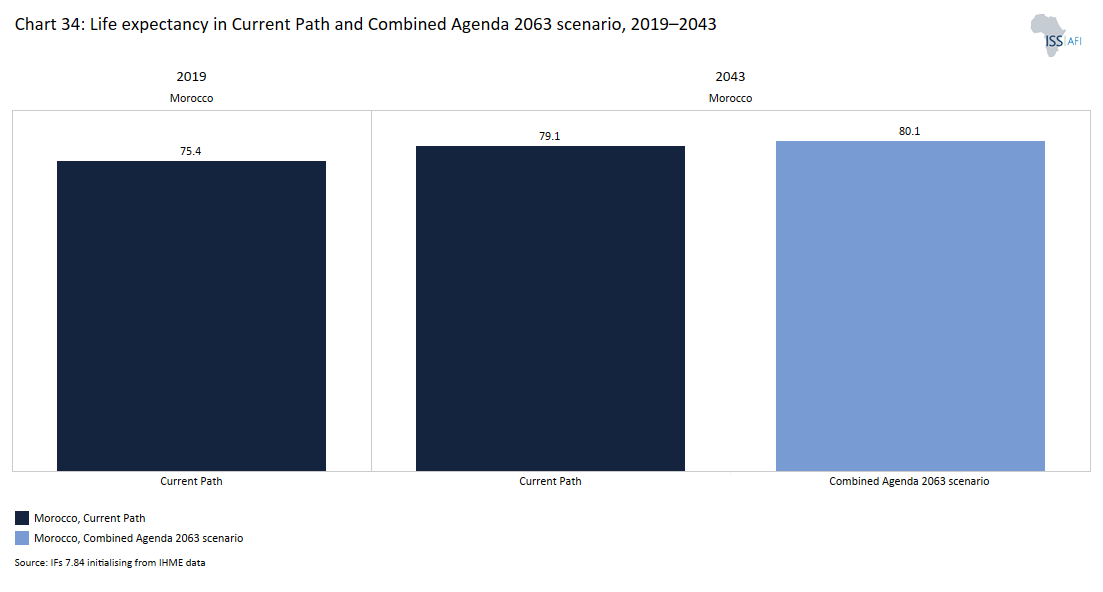
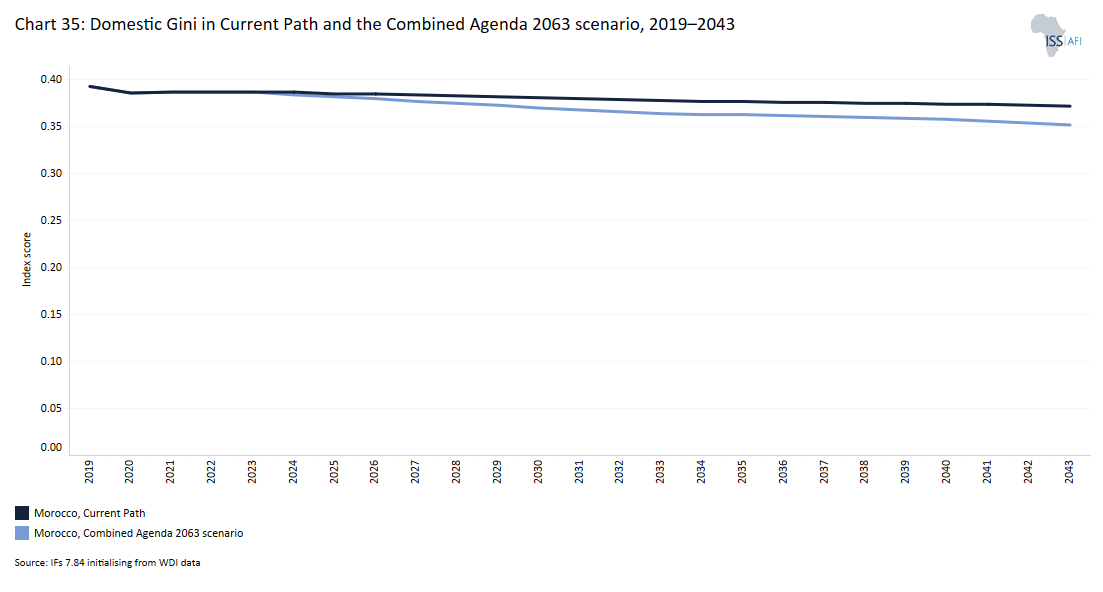
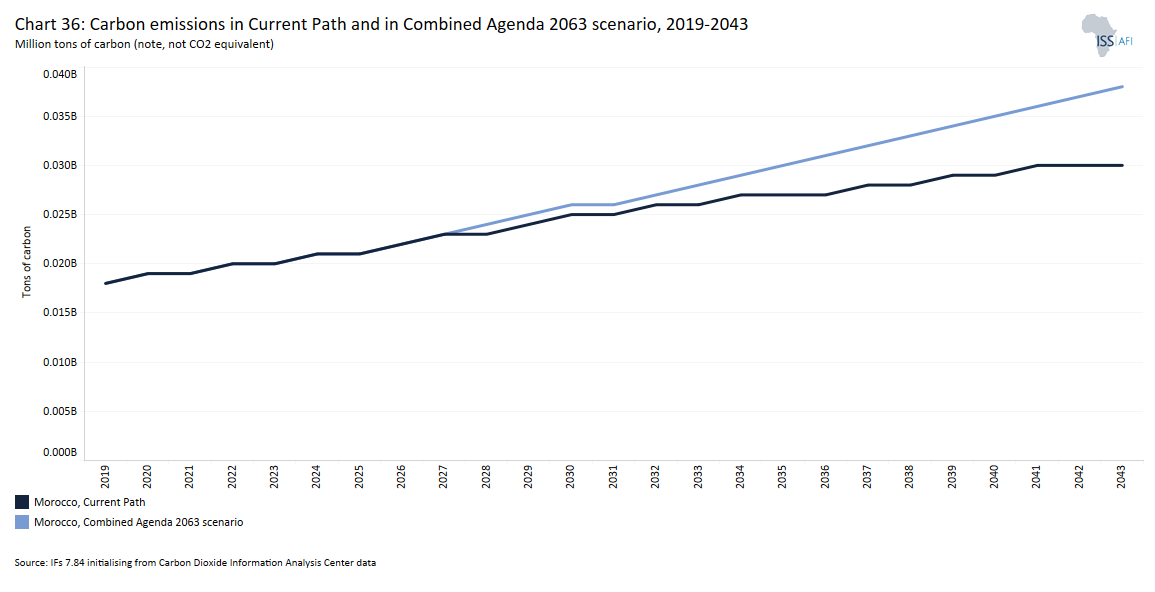
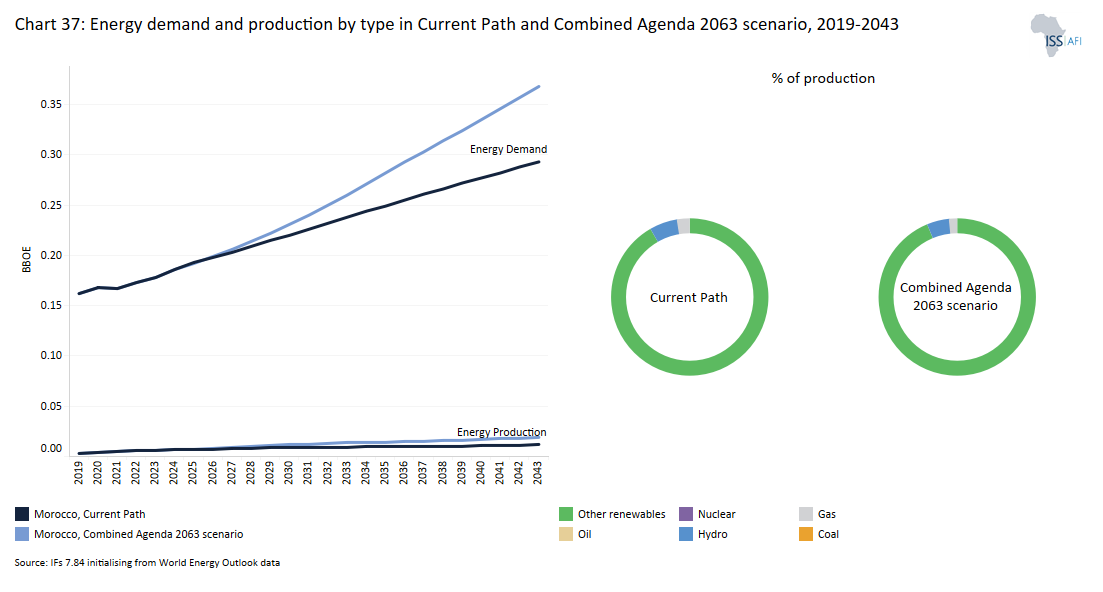
Chart 1 is a political map of Morocco.
The Kingdom of Morocco is the only African country with Atlantic and Mediterranean coastlines, totalling 1 835 km. It is also the only African country with a land border with the European Union, namely with the tiny Spanish enclaves of Ceuta and Melilla both on the northern shores of Morocco's Mediterranean coast. Morocco’s land area covers approximately 446 300 km2.. In 2019, the country had a population of about 36.5 million people. Its official and predominant religion is Islam, and the official languages are Arabic and Tamazight, spoken by the Berber people, which became an official language in 2011. The Moroccan dialects of Arabic and French are also widely spoken.
Morocco claims ownership of the territory of Western Sahara, a sparsely populated area of mostly desert and a former Spanish colony that is rich in phosphates and fisheries. Western Sahara was annexed by Morocco in 1975 and has since been the subject of a long-running territorial dispute between Morocco, its indigenous Saharawi people, led by the Polisario Front and neighbouring Algeria. After Spain’s departure, Morocco and Mauritania partitioned the territory. In 1979, Mauritania withdrew from the territory. Over time Rabat solidified control over the area with the Polisario Front retaining control over some 20%. A UN-mediated Settlement Plan includes a ceasefire, a buffer zone and a provision for a referendum. Morocco's stance on the Western Sahara is that it is an integral part of its territory and it has proposed a plan for limited autonomy and a degree of self-government for Sahrawis, provided it remains under Moroccan sovereignty.
Morocco is also in dispute with Spain over the territories of Ceuta, Penon de Velez de la Gomera and Melilla.
Morocco’s largest city and port is Casablanca; however, the capital city is Rabat. Morocco is a unitary semi-constitutional monarchy with an elected parliament. The King of Morocco and the prime minister lead the executive branch. Legislative power sits with the two chambers of parliament: the House of Representatives and the House of Councillors. Judicial power rests with the Constitutional Court.
The king holds significant executive and legislative powers, especially over the military, foreign policy and religious affairs. He can issue decrees that are de facto laws and dissolve the parliament after consulting the prime minister and the president of the Constitutional Court. See the section on governance below (charts 27 and 28) for more detail.
The country experiences a typical Mediterranean climate with mild wet winters and hot dry summers. October to April is usually the rainy season.
Morocco is expected to be severely affected by climate change, both in terms of an increase in temperature and less rain.
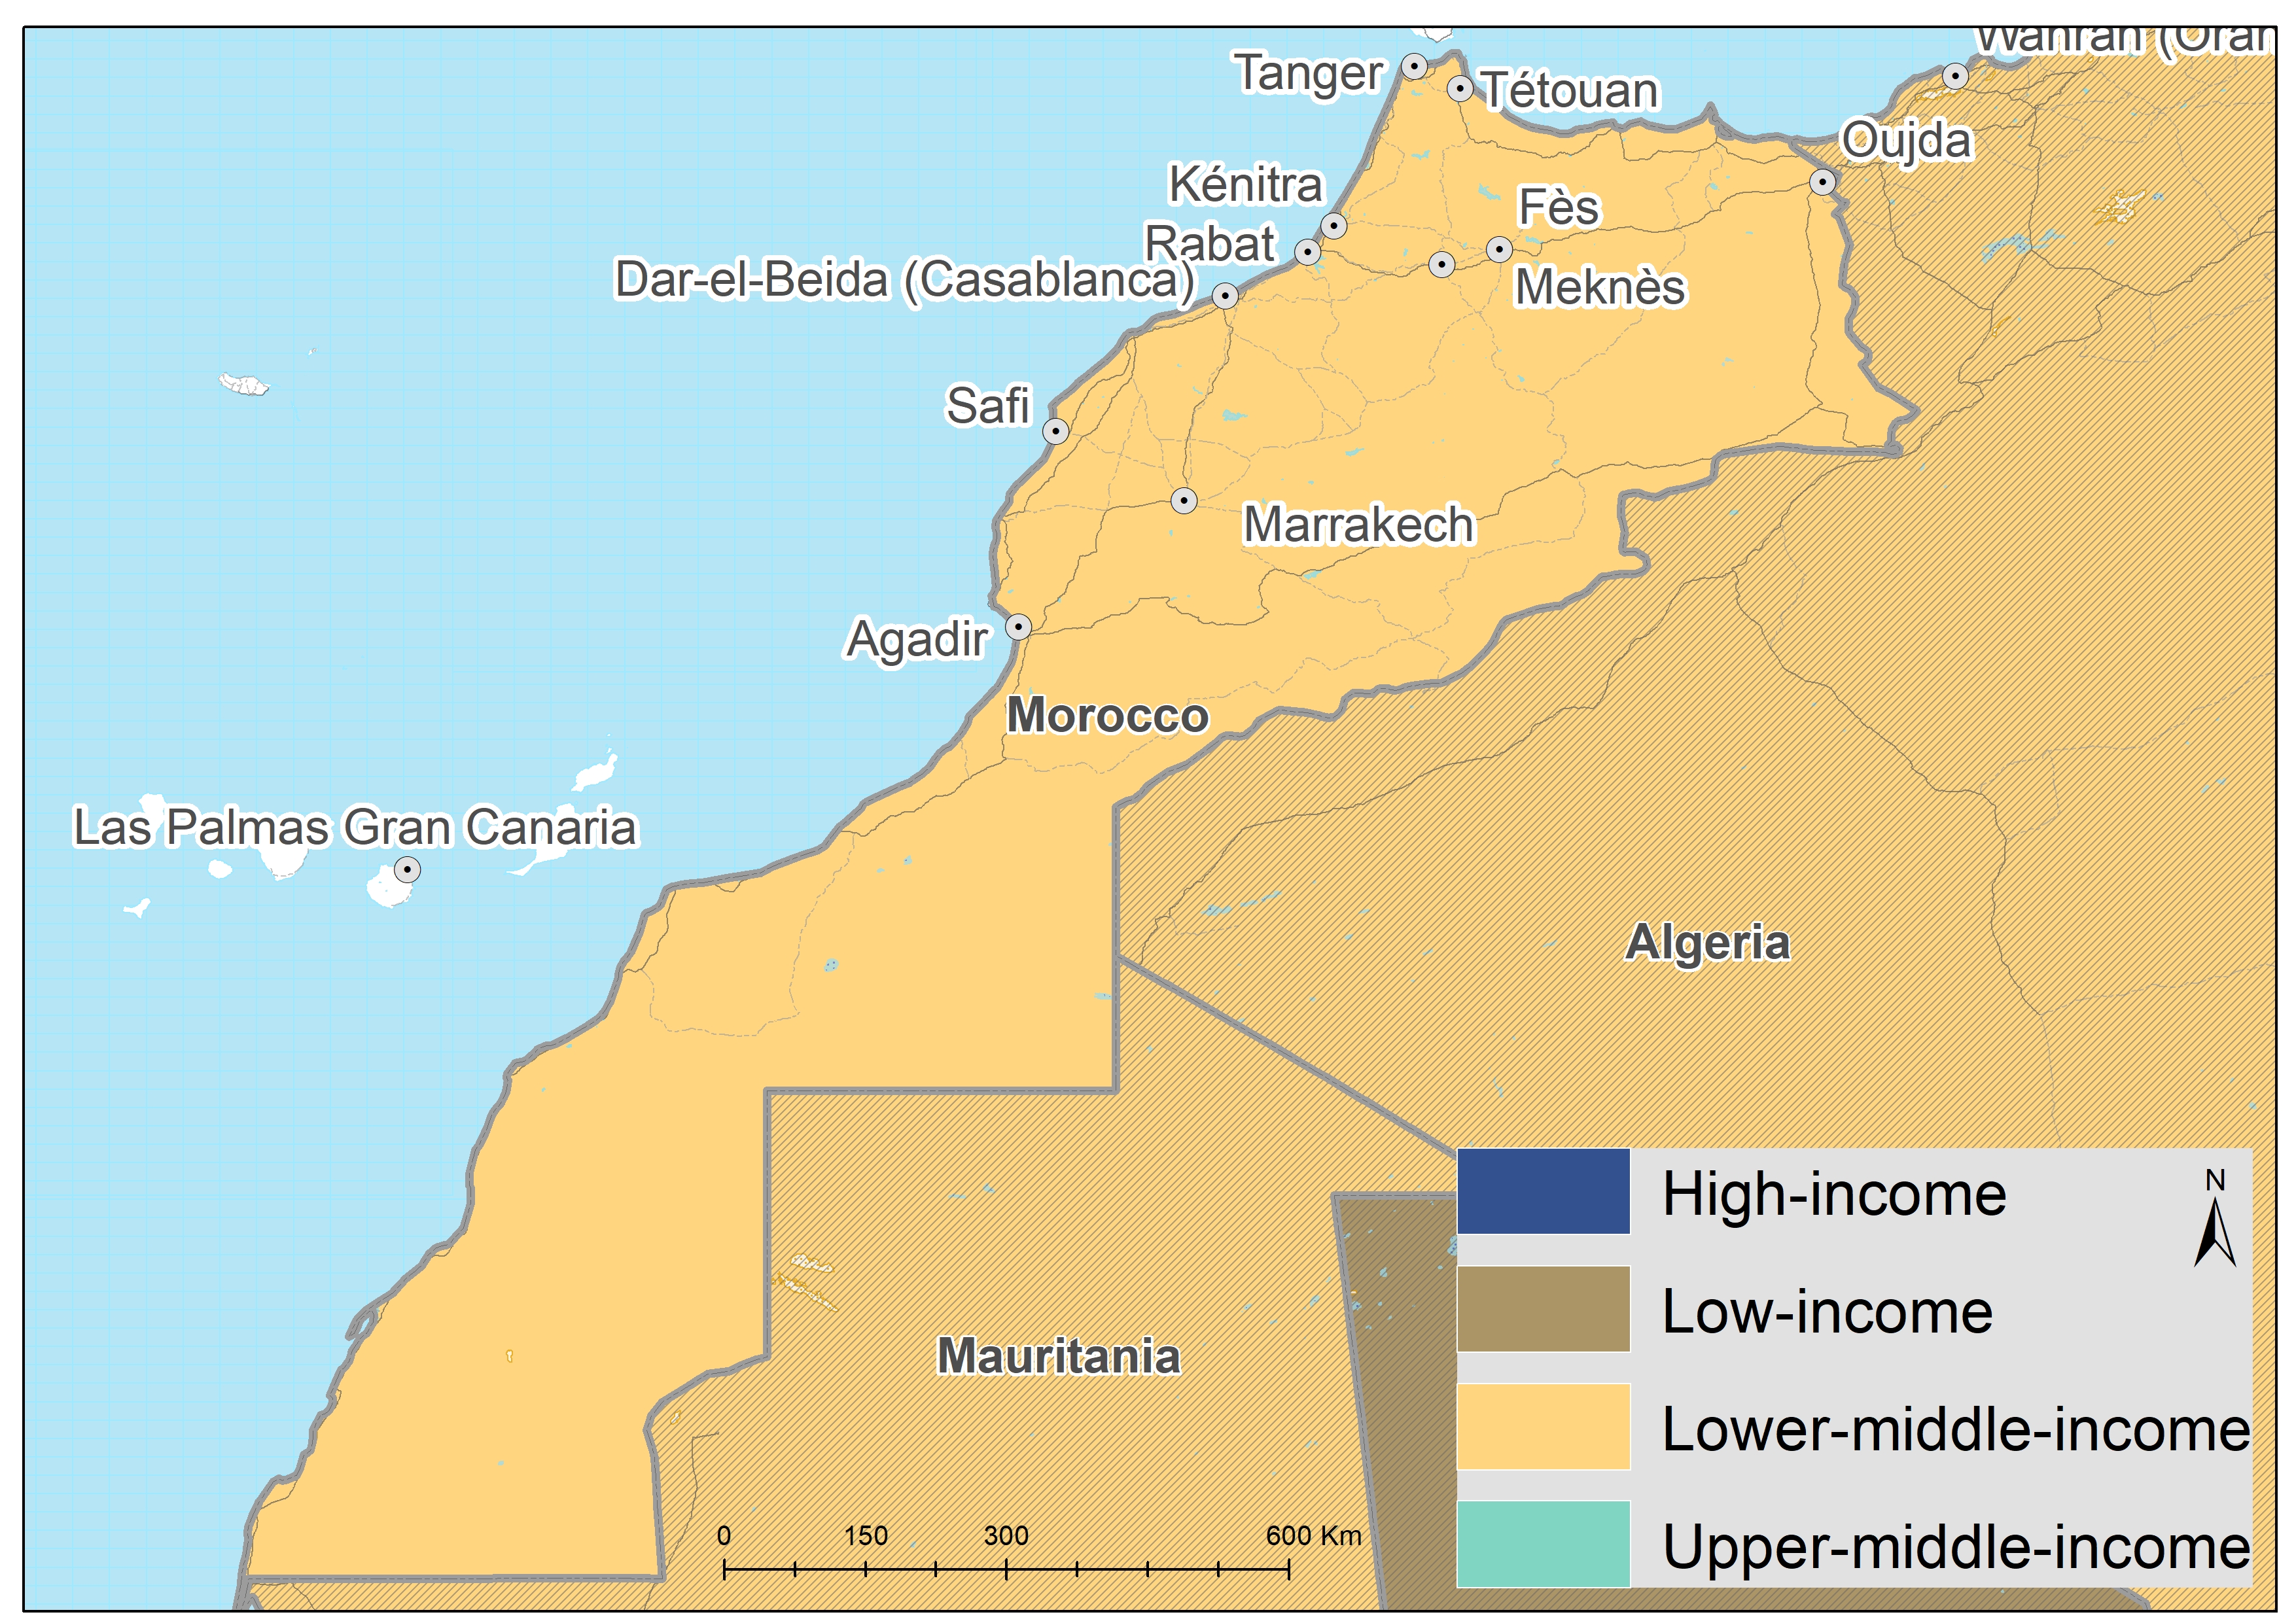
Chart 2 presents the population structure to 2043 in the Current Path.
In 1990, Morocco had a population of 24.8 million people. By 2019 it had increased to 36.5 million. The country is going through the third stage of the demographic transition, which is characterised by low death rates and diminishing birth rates due to economic progress, improvements in women's status and education, as well as access to contraception. In 2019, Morocco’s average total fertility was 2.4 births per woman, down from 4.4 births per woman in 1990. Morocco will likely reach replacement-level fertility of 2.1 births around 2028. By that time, the country’s total population will be 40.11 million.
With a median age of 28.4 years in 2019, Morocco is still relatively young, albeit with the fourth oldest population on the continent, and has entered a favourable window of demographic opportunity, reflected in steady economic growth since the government is investing in education and health to further benefit from its growing labour force. Only Tunisia has a higher median age in North Africa. The median age for the North Africa region in 2019 was 26.4 years.
Over time, Morocco’s population age structure has shifted: in 2019, 51% of the population was younger than 30 years, compared to 69% in 1990. By 2043, only 41% of the population will be younger than 30. The share of the population that is 65 years and older, on the other hand, has increased from 4% in 1990 to 7% in 2019 and will account for 14% of the population by 2043. By then, 43.9 million people will live in Morocco.
In 2019, the average life expectancy for Moroccans was 75.4 years, ranking fourth highest in North Africa. On the Current Path, life expectancy will increase to 79.1 in 2043.
Chart 3 presents a population density map.
In 2019, 63% (23 million) of Morocco’s population was considered urban, set to increase to 72.6% (31.9 million) in 2043. Its large arid interior means that the majority of Morocco's population live to the west of the Atlas Mountains. This large range protects much of the country from the effects of the Sahara Desert. Casablanca is the country’s largest city and commercial and financial hub. Rabat, the political capital, is home to about 1.4 million citizens. Other major cities include Tangier, Fez and Marrakech.
Much of the southern provinces are scarcely populated.
Contrary to most other Maghreb countries, Morocco has adopted a more welcoming approach to migrants, although tensions remain in a country that is itself a significant generator of migration to Europe and retains strict security-driven migration laws on its statute books. The centrepiece of Morocco’s migration policy is its 2014 National Strategy on Integration and Asylum that guarantees access to public services for all regular migrants, and even some benefits for the unregistered. Morocco has cultivated links with African countries to its south, boosted by its targeted provision of aid, university opportunities and investments. Senegalese citizens can enter Morocco visa-free, and represent the largest slice of African migrants registered in the country.
Morocco has also run two large-scale “regularisation campaigns”, in 2014 and 2017, to register irregular and undocumented migrants. These resulted in more than 50 000 people – mainly from Mali, Niger and Burkina Faso – achieving formal status.
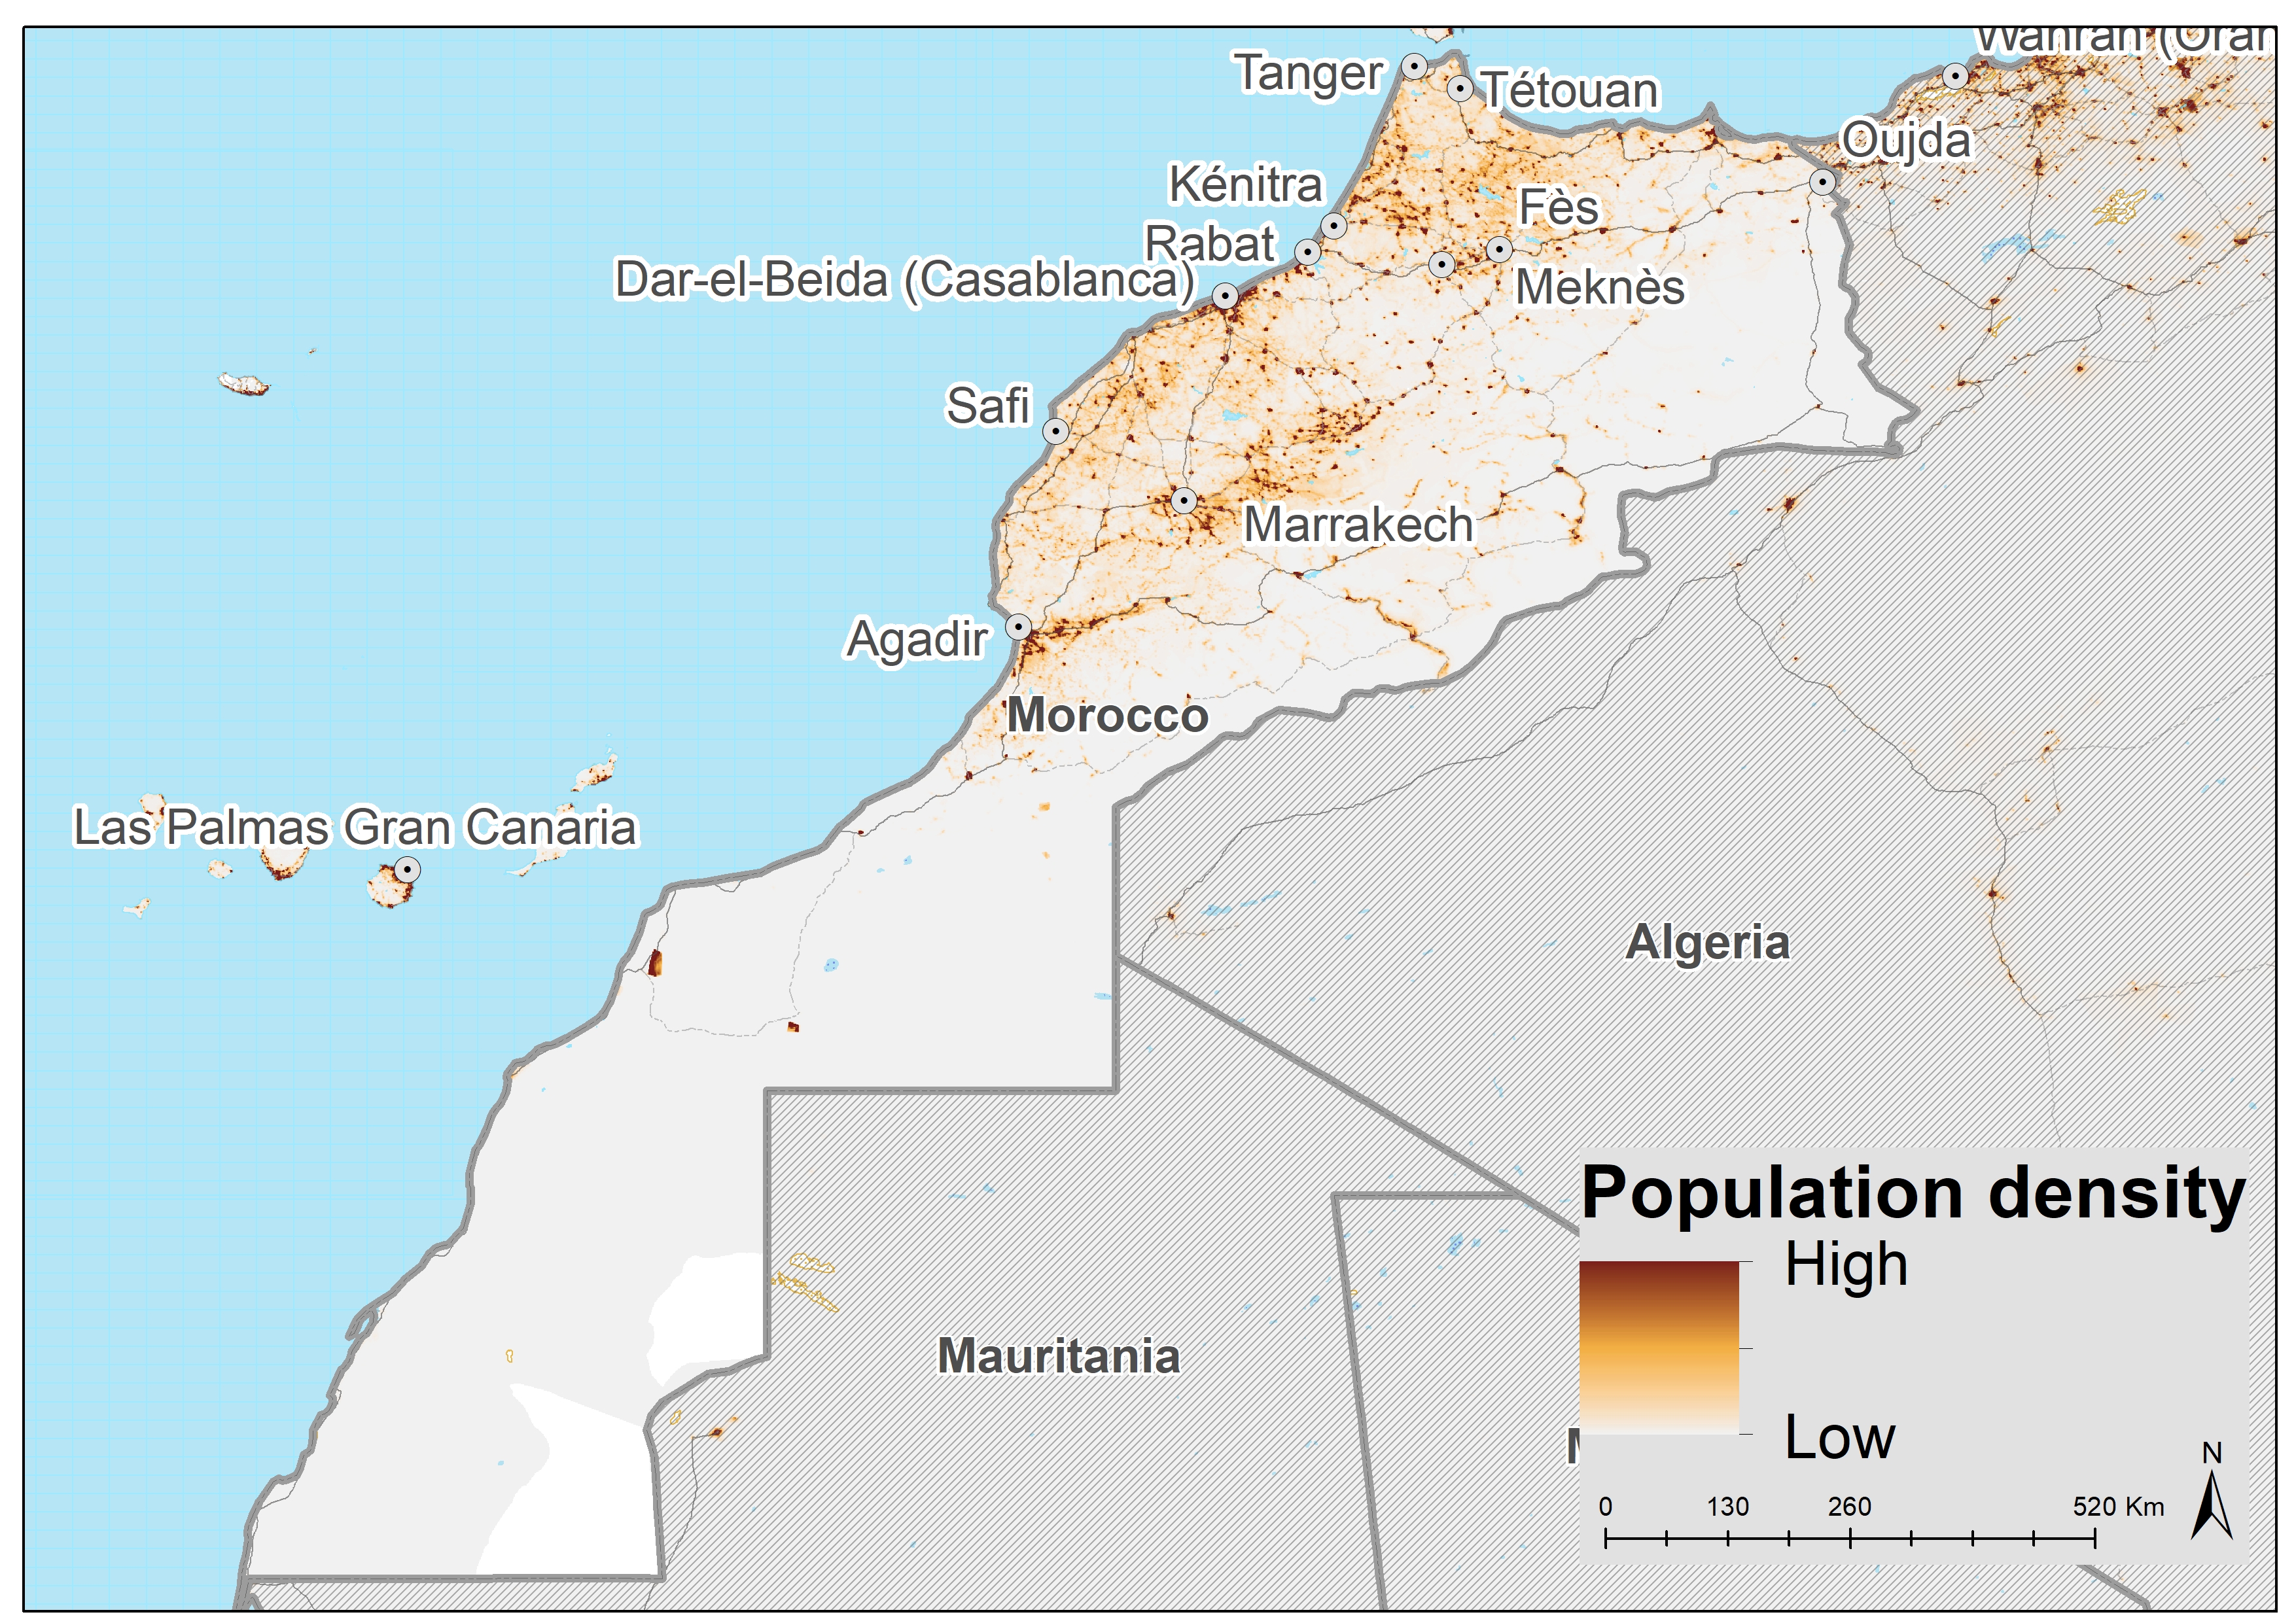
Chart 4 presents the size of Morocco’s economy from 1990 and includes a forecast to 2043, including the associated growth rate.
Between 1990 and 2019, Morocco’s GDP increased almost threefold from US$48.64 billion to US$133.4 billion; at this point, it was the fifth largest economy in Africa, behind only South Africa, Nigeria, Egypt and Algeria. However, Morocco experienced a sharp economic deceleration in 2022 due to domestic and international shocks – a drought and high commodity prices. By 2043, the country’s GDP will have expanded to US$253.4 billion but, largely because of its slower population growth compared to most other African countries, will have slipped down to be the 11th largest. However, it will retain its position as the African country with the 13th highest GDP per capita. In addition to its large, working-age population and associated investments in education, health and ICT, Morocco is opening its economy up to allow for greater private sector participation and investment. Competitiveness has improved, and its productivity base has diversified. However, Morocco struggles with an inflexible labour market; a substantial component of its labour force is in the informal sector, not the formal sector. Located on the periphery of the European Union, Morocco's economic success has largely been built on low-cost manufacturing of food, textiles and other goods that benefited from its trade agreement with the EU. Lately, its focus has switched to higher-value goods, such as in the pharmaceutical, aerospace and automotive sectors, working with international partners to build integrated supply chains. Here, improvements in national infrastructure, such as the new port of Tanger Med, have complemented its geographic advantage. It is now the largest container port in Africa. Improved road and rail infrastructure within Morocco has also made it easier for manufacturers nationwide to access the port. The result is rapid growth in Morocco's automotive export sector, with Renault and Stellantis the largest investors. Exported vehicles now contain an average of 63% Moroccan-made components. Rabat is now banking on the growing demand for electric vehicles to drive growth in the industry, including investment in an electric battery plant, microchip plant and use of Morocco's cobalt reserves.
Public companies have played a large role in Morocco’s economy, although less in recent years. Founded in 1920, the OCP Group (OCP S.A.) (formerly Office Chérifien des Phosphates, Office of Moroccan Phosphates) occupies an exceptional position, claiming it represents 5% of Morocco’s GDP. OCP is majority-owned by the state (95%), with sole access to more than 70% of the world’s phosphate reserves and almost a third of the world's phosphate product market.
Chart 5 presents the size of the informal economy as a per cent of GDP and in absolute terms, as well as the per cent of the non-agriculture labour force involved in the informal economy.
Also, see Chart 33 that presents the impact of the Combined scenario on the informal sector.
Estimations and data on the informal sector are often unreliable and must be treated carefully. Researchers generally distinguish between the shadow and informal economy. According to the ILO, the informal economy refers to all economic activities by workers and economic units that are – in law or in practice – not covered or insufficiently covered by formal arrangements. Where data is not available, our modelling estimates the size. Note that the ILO definition of employment in the informal economy excludes the agricultural sector.
According to the Central Bank of Morocco the informal economy as a portion of the formal economy has declined since 2009 to roughly 30% of GDP in 2018. These results suggest that the strategies implemented by national authorities since the early 2000s to improve the institutional, economic and financial environment have been effective. However, the persistence of important shadow (illegal) activities requires additional structural reforms particularly those related to education, the judiciary system, tax policy and the labour market.
Similar to the situation in other countries, Morocco’s informal sector burdens the formal economy because of low contributions to tax revenues and its generally lower productivity. According to the government, labour productivity in the formal sector is 3.7 times higher than in the informal sector. By 2043, the contribution of the informal sector to the country’s GDP will fall to 18% (US$46.56 billion) and government estimates that it deprives the economy of US$3.4 billion annually, particularly in the agriculture sector.
In 2019, 36% of Morocco’s non-agriculture labour force, approximately 2.4 million people, worked in the informal sector. This will drop to 28% by 2043 (3 million people) by 2043.
The government estimates that up to two-thirds of Moroccan jobs were in the ‘grey economy’. A 2022 World Bank report confirms these findings, with up to 77% of employment informal (total, i.e. including the agricultural sector) and it argues that an important reason is that the dominance of state-owned enterprises that receive favourable treatment and are exempt from the competition laws that apply to the private sector, squeeze out job creation. Typically, those workers are vulnerable to losing their jobs/income and lack pensions or health insurance.
The latter rate is significantly lower than the lower-middle-income average in Africa and the female share of labour in Morocco is low with less than 5% of companies led by women compared to a global average for lower-middle-income countries of 20%.
Chart 6 presents the average GDP per capita from 1990 and includes the Current Path to 2043.
In 2019, Morocco’s GDP per capita (US$8 368) was the 13th highest in Africa and ranked 6 out of 23 Africa’s lower-middle-income countries. On the Current Path, Morocco’s per capita income will increase to US$10 718 by 2043, but because of slower population growth compared to most other lower-middle-income countries will still be the African country with the 13th highest GDP per capita in Africa.
Chart 7 presents the number of people living in extreme poverty, also expressed as a per cent of the population.
In 2015, the World Bank adopted US$1.90 per person per day (in 2011 prices using GNI) to measure progress towards achieving Sustainable Development Goal (SDG) 1 of eradicating extreme poverty. In 2022, the World Bank updated the US$1.90 to US$2.15 in 2017 constant dollars. They are:
- US$3.20 for lower-middle-income countries, now US$3.65 in 2017 values.
- US$5.50 for upper-middle-income countries, now US$6.85 in 2017 values.
- US$22.70 for high-income countries. The Bank has not yet announced the new poverty line in 2017 US$ prices for high-income countries.
This website still uses US$1.90 and US$3.20.
In 2019, 211 000 Moroccans lived below the US$1.90 poverty line and 1.9 million below US$3.20. This equals 0.6% and 5.1% of the population and is significantly below the average poverty rate for Africa’s lower-middle-income economies, behind only Algeria, Tunisia and Mauritius. Over time, the share of Moroccans living in extreme poverty will further decrease. In the Current Path, only 34 000 Moroccans will live below US$1.90 and 582 000 will live below the US$3.20 poverty line in 2043 — this is equivalent to only 0.08% and 1.3% of the population.
The country’s mountainous areas, steppes and arid south are home to most of the poorest Moroccans. The most vulnerable groups include smallholders, people engaged in artisanal fishing, landless people, rural wage earners, unemployed young people and women.
The New Development Model, April 2021
King Mohammed VI established a Special Commission in November 2019 to review the state of play of the Kingdom’s development and to sketch the guidelines for the future. The Commission’s mandate calls for a review that is i) strategic, focusing on identifying and resolving systemic problems; ii) global and integrated, apprehending development through its various dimensions; iii) prospective, taking stock of mid-long-term evolutions of the national and international contexts; and finally, iv), and citizen-centred. The subsequent general report The New Development Model was published in April 2021 with a vision to 2035 and includes four priority areas, each listing key strategic choices:
- A productive and diversified economy that creates added value and quality jobs;
- Enhanced human capital that is better prepared for the future;
- Opportunities for all and a stronger social bond;
- Resilient territories, anchorage points for development.
The report concluded with various levers of change that included transformative projects to launch the new development model and a national compact for development. The transformative projects comprised digital technology, administration, financing, diaspora, and international partnerships.
According to The New Development Model, the country '... suffers from constantly growing water stress. … [that] poses a direct threat to the country’s economic, environmental, and social balances, particularly in arid and semi-arid regions and those whose income depends heavily on water resources.’ To this end, the Model proposed the reorganisation of the water sector, introduced a pricing system to reflect the real price of water, established a National Water Management Agency, and proposed various measures to conserve and protect supply including reuse.
Water is already a large constraint on expanding agricultural production with the result that the country is increasingly looking at desalination but progress is difficult without a solution to its domestic energy shortages.
Shortly before the publication of the New Development Model, the government released the National Drinking Water Supply and Irrigation Program (PNAEPI) 2020-2027 to accelerate investment in the water sector, to strengthen the supply of drinking water and irrigation and ensure resilience to climate hazards and disruptions.
To access the full report, click on the logo below:
![]()
Chart 9 depicts the relationship between the Current Path forecast, the various sectoral scenarios and the Combined Agenda 2063 scenario.
The Current Path is a dynamic scenario that imitates continuing current policies and environmental conditions, updated with more recent national data.
The eight sectoral scenarios are each explained in the various themes on the website, and the impact on each is compared with the Current Path and a Combined scenario. The eight scenarios are:
- A more rapid demographic transition and investments in better health and water, sanitation and hygiene (WaSH) infrastructure,
- Better and more education (looking at quantity, quality and relevance),
- Large infrastructure and leapfrogging (the impact of renewables, ICT and the more rapid formalisation of the informal sector),
- Food security and an agricultural revolution,
- A low-end manufacturing transition,
- The full implementation of the African Continental Free Trade Area (AfCFTA),
- More inward financial flows (consisting of aid, foreign direct investment, remittances and illicit financial flows), and
- Better governance (consisting of stability, capacity and inclusion).
The Combined Agenda 2063 scenario is a combination of all eight sectoral scenarios.
The impact of these scenarios on jobs/employment and greenhouse gas emissions and energy are presented in separate themes.
A final theme models the effect of alternative global scenarios on Africa’s development potential.
The interventions are detailed in an annexure at the end of this page.
Chart 10 presents the structure of the Demographics and Health scenario that advances the demographic dividend and improves health.
The Demographic and Health scenario consists of reasonable but ambitious reductions in child and maternal mortality ratio, increased access to modern contraception and reductions in the mortality rates associated with both communicable diseases (e.g. AIDS, diarrhoea, malaria and respiratory infections) and non-communicable diseases (e.g. diabetes), as well as improvements in access to safe water and better sanitation.
Visit the themes on Demographics and Health/WaSH for more detail on the scenario structure and interventions.
Chart 11 compares urban and rural populations in the Current Path and the Demographics and Health scenario.
In line with its demographic profile, Morocco already is a predominantly urban country: 63% of the population lives in cities and towns and only 37% inhabit rural areas. Out of the 23 million Moroccans that live in urban areas, about 3.8 live in Casablanca, the country’s largest city, port and financial centre. Casablanca is followed by Fez, Tangier and Marrakech, also important urban population centres.
The Demographics and Health scenario has little impact on urbanisation. By 2043, the share of Moroccans living in cities and towns will increase to 72.7%, which is the equivalent of 31.3 million people, only 0.1 percentage points above the Current Path. This is significantly above the anticipated average rate of 59.4% for its lower-middle-income peer group on the continent. In North Africa, however, Libya, Algeria and Tunisia are more urbanised than Morocco.
Chart 12 presents the infant mortality rate in the Current Path and the Demographics and Health scenario.
Infant mortality rate is the probability of a child born in a specific year or period dying before reaching the age of one. It measures the child-born survival rate and reflects the social, economic and environmental conditions in which children live, including their health care. It is measured as the number of infant deaths per 1 000 live births and is an important marker of the overall quality of the health system in a country.
At 16.2 infant deaths per 1 000 live births in 2019, infant mortality in Morocco was much better than in Mauritania and slightly lower than that of Algeria but worse than rates in Egypt, Tunisia and Libya. Morocco does much better than the average lower-middle-income African country, at 43.6. Infant mortality in Morocco has improved greatly since 1990 when it stood at 59.6 deaths per 1 000 live births. The Demographics and Health scenario will reduce infant mortality rates in Morocco to 8.1 deaths per 1 000 live births by 2043 compared to 9.2 deaths in the Current Path.
Chart 13 presents the demographic dividend in the Current Path, and in the Demographics and Health scenario.
The demographic dividend is the window of economic growth opportunity that opens when the ratio of working age persons to dependents increases to 1.7:1 and higher.
Morocco has already entered a demographic window of opportunity, meaning that the ratio of working-age persons to dependents is above 1.7:1. Given Morocco’s current stage in the demographic transition, increased access to modern contraception will only have a modest impact on the country’s total fertility rate which was estimated at 2.4 children per fertile woman in 2019. In the Demographics and Health scenario, fertility rates will decline more quickly than on the Current Path. By 2029, the average fertility rate will already be 1.9 births per woman. On the Current Path, that rate will only be achieved five years later. A lower average fertility rate slows population growth and translates into a slightly smaller population by 2043: 43.9 million instead of 43.93 million people.
The interventions in the Demographics and Health scenario have a marginal impact on Morocco’s demographic dividend, with a slightly earlier and higher peak, translating into a GDP per capita gain of US$63 in 2043, reflected in Chart 29.
Morocco is well into an epidemiological transition characterised by a shift in the overall burden of morbidity and mortality from infectious diseases to non-communicable diseases and injuries. Chronic diseases now account for more than 80 % of all deaths meaning that expanding healthcare to the underserved is a high priority.
Chart 14 sets out the composition of the Agriculture scenario to advance food security.
The Agriculture scenario represents reasonable but ambitious increases in yields per hectare (reflecting better management and seed and fertiliser technology), increased land equipped and under irrigation and reductions in food loss and waste. We use increased calorie consumption as a proxy for food self-sufficiency above food exports as a desirable policy objective.
The increase in forest protection reflects sustainable land use practices.
Visit the theme on Agriculture for our conceptualisation and details on the scenario structure and interventions.
In 2019, Morocco’s agriculture sector accounted for 15.2% of GDP, roughly in line with the average for lower-middle-income economies on the continent. Its crop yields at 3.2 tons per hectare are comparable to countries such as Kenya, Comoros and Algeria, i.e. towards the low end of the group. The average for African low-income countries is just over 5 tons, but the group includes high-yield countries such as Eswatini and Egypt.
The reason for the relatively low yields is that many of Morocco’s agriculture producers are in the informal sector and still rely on traditional technologies, have limited access to fertilisers, pesticides and mechanisation and effectively farm small plots of un-irrigated arable land, which has poor agricultural potential. Because farmers often lack formal title to land, it is difficult for them to obtain credit necessary to diversify their sources of income.
According to the US International Trade Administration ‘The prevalence of small farms, complicated land title issues, and increasing land prices pose serious challenges .... Policymakers struggle with the conflicting principles of economies of scale, the capitalization requirements necessary to modernize the agricultural sector, and the desire to alleviate poverty and maintain the social structure of traditional rural society’. The challenges of achieving an agricultural transformation are highlighted by the irony that Morocco is the world's biggest exporter of Phosphoric Acid and Calcium Phosphates.
Food security is an important strategic objective for Morrocco and the country has seen several strategies and policies to improve its situation in this regard since independence. The Agriculture scenario emulates the successful implementation of the government's second agricultural strategic plan, launched in February 2020. “Generation Green 2020-2030” sets out an agricultural development strategy through 2030, resting on two pillars:
- ‘Develop a new agricultural middle class representing between 350 000 and 400 000 households by supporting young entrepreneurs through the mobilization of one million hectares of collective lands and the creation of 350 000 jobs with a focus on high-value agriculture.
- Promote human and social development.’
The strategy includes the digital transformation of Moroccan agriculture, particularly since smallholder farms are in the middle of the approaching climate change challenges. Implementation depends on expanded water access and harnessing innovation to support agriculture, national resource management and rural development in Morocco.
Chart 15 presents import dependence in the Current Path and the Agriculture scenario.
The data on agricultural production and demand in our modelling initialises from data provided on food balances by the Food and Agriculture Organization (FAO). The model contains data on numerous types of agriculture but aggregates its forecast into crops, meat and fish, presented in million metric tons.
Morocco is a net importer of agriculture and related products, with most of its related trade occurring with the European Union.
In 2019, Morocco’s post-loss agricultural production (crop, meat and fish) stood at 35.6 million metric tons, falling short of matching agricultural demand of 41 million tons. The Current Path is for an unmet demand gap of more than 5 million metric tons by 2043. At this point, Morocco will produce the equivalent of 48.3 million metric tons compared to a demand of 53.4 million metric tons. Cereals and sugar beet are among Morocco's leading agricultural products. In 2021, the country produced over 7.5 million metric tons of wheat, around 2.8 million metric tons of barley, and 2.6 million metric tons of sugar beet. Other major crops in the country were potatoes, olives, tomatoes and citrus fruit.
Instead of yields improving to 4 tons per hectare by 2043, in the Agriculture scenario, they will improve to 4.9 tons. The impact is an increase of 21.4% in production (a total of 58.6 instead of 48.3 million metric tons for crop, meat and fish), with crop production increasing by 25.3% and meat by 10.7%. These numbers already account for reduced agriculture losses that decline by 14% in 2043.
The Agriculture scenario will significantly improve Morocco’s food security. By 2043, exports will exceed imports by 1.3% of demand. On the Current Path, Morroco would have imported 9.6% of its agriculture demand.
Chart 16 presents the structure of the Education scenario. It improves the quantity and quality of education and its relevance to job requirements.
The Education scenario represents reasonable but ambitious interventions for improved intake, transition and graduation rates from primary to tertiary levels, and better quality of education at primary and secondary levels. It also models substantive progress towards gender parity at all levels, additional vocational training at the secondary school level and increases in the share of science and engineering graduates.
Visit the theme on Education for our conceptualisation and details on the scenario structure and interventions.
Education is among the top priorities for the Moroccan Government, reflected in its 2015–2030 education vision plan and the new Education Act passed in 2019. Education is mandatory for all children between the ages of seven and 16. After five years of primary education, students attend lower-secondary education for four years. Tertiary enrollment has increased significantly recently, particularly among women.
Reflecting the situation in most North African states, mean years of education in Morocco have improved rapidly in the last three decades, although Morocco is below the average for the region. Historically levels of adult education (i.e. for +15 year age cohort) in Morocco were more than a year below the educational average of Africa’s lower-middle-income countries and comparable to Kenya and Eswatini but the situation with its younger cohort improving rapidly (see Chart 17).
In North Africa, total adult education years in Libya are higher than in any other country (followed by Tunisia). In this region, only Mauritania has lower mean education years than Morocco.
Chart 17 presents mean years of education in the Current Path and the Education scenario for the 15 to 24-year age group.
The educational attainment in Morocco for the 15 to 24 age group was 9 years in 2019, increasing to 9.7 years in 2043 on the Current Path and 9.9 years in the Education scenario. In the scenario, Morocco improves its mean years of education in the 15 to 24 age group to surpass neighbouring Algeria by 2043. The rapid improvements in Morocco’s younger population cohorts point to imminent improvements in workforce productivity.
In 2019, females in this age group had 8.9 years of education vs 9 years for men, but average female educational attainment in Morocco will shortly surpass that of men. It is already better than that of males at lower-secondary, upper-secondary and tertiary levels. In the Current Path, female education attainment for the 15 to 24-year age cohort will improve to 9.9 years compared to 9.6 years for men in 2043. In the Education scenario, the mean years of female education is 10.1 years in 2043 compared to 9.9 years for men.
In 2019, 190 000 fewer girls enrolled in primary education than boys. The gap is forecast to remain largely constant until 2043 even as primary enrollments decline in line with Morocco’s more mature population and is also evident, although smaller, at lower-secondary and upper-secondary levels.
In 2021, around 1.3 million students were enrolled in tertiary education in Morocco. This was a significant increase from only 295 634 students in 2000 and reflected the benefits of investment in this sector.
Looking at the quality of education, Morocco’s primary test score in 2019 was 29.1 and, therefore, lower than the average for Africa’s lower-middle-income countries, which was 33.1, but improving rapidly. On the Current Path, Morocco will perform above average, reaching a score of 38.1 by 2043 compared to the average score of 35.2 for its peer group. In the Education scenario, Morocco surpasses the average primary test score of lower-middle income African countries in 2025.
The average test score for secondary learners in Morocco is already higher than that for lower-middle-income African countries and will be significantly better, even in the Current Path by 2043. Instead of 19% above the average for lower-middle-income Africa in 2043, it will be 35%.
The Education scenario improves GDP per capita by US$225 above the 2043 Current Path.
Chart 18 presents the structure of the Manufacturing scenario as modelled in IFs.
The Manufacturing scenario represents reasonable but ambitious manufacturing growth through greater investment in the manufacturing sector, in research and development (R&D), as well as improvement in government regulation of businesses. It increases total labour participation rates with a larger increase in female participation rates. It is accompanied by increased welfare transfers (social grants) to unskilled workers) to moderate the initial increases in inequality typically associated with a manufacturing transition.
Visit the theme on Manufacturing for our conceptualisation and details on the scenario structure and interventions. Chart 18 presents a summary chart that sets out the composition of the scenario.
Morocco’s expected trajectory roughly mirrors that of its low-middle-income peer group, with the service sector representing both the current and future lion’s share of contribution to GDP. Regarding its per cent contribution to GDP, Morocco’s manufacturing sector is the fourth largest in North Africa and the fifth largest among its low-middle-income peers.
In 2020 the Ministry of Industry, Trade, Green and Digital Economy launched the Plan for Industrial Recovery, 2021-2023 in the wake of the COVID-19 pandemic, built around 3 pillars: to support market expansion; increase competitiveness; and to decarbonise. The plan is a follow-on to the Industrial Acceleration Plan, 2014-2020.
The Manufacturing scenario increases the size of Morocco’s economy by 6.8% in 2043 (to US$270.6 billion instead of US$253.4 billion). In addition to a larger economy, the scenario also reduces extreme poverty. Instead of 582 000 persons living below US$3.20 in 2043, only 354 000 will live below the low-middle-income poverty threshold, the result of the inclusion of social transfers to unskilled workers and more rapid economic growth.
Chart 19 presents the contribution of the manufacturing sector to GDP in the Current Path and the Manufacturing scenario. The IFs platform uses data from the Global Trade and Analysis Project (GTAP) to classify economic activity into six sectors: agriculture, energy, materials (including mining), manufacturing, services and information and communication technologies (ICT). Most other sources use a threefold distinction between only agriculture, industry and services, with the result that data may differ.
In 2019, Morocco’s service sector accounted for more than half of the country’s GDP (US$74.05 billion), followed by the manufacturing sector, which represented 23.9% (US$34.08 billion). Agriculture constitutes the third largest sector at 15.2% (US$21.57 billion). The energy, ICT and materials sectors account for the remainder.
The service sector will remain the largest contributor to Morocco’s GDP by 2043. Still, instead of contributing 55% of GDP on the Current Path forecast, its share will decline to 50.5% in the Manfucturing scenario while the manufacturing sector increases its contribution to GDP to 30.3% (US$82.1 billion) instead of 24.3% (US$61.45 billion) by 2043.
A manufacturing transition generally results in an initial increase in inequality before more rapid economic growth compensates. Therefore the scenario includes additional welfare transfers to unskilled workers to offset the potential negative impact. In the Manufacturing scenario, government-to-household welfare transfers will more than double over the coming two decades from US$6.811 billion in 2019 to US$15.1 billion in 2043. On the Current Path, government-to-household transfers grow at a slower rate reaching US$11.9 billion in 2043.
Chart 20 presents the structure of the AfCFTA scenario. The AfCFTA scenario represents the impact of fully implementing the continental free trade agreement by 2034. The scenario increases exports in manufacturing, agriculture, services, ICT, materials and energy. It also includes an improvement in multifactor productivity growth emanating from trade and a reduction in tariffs for all sectors.
Visit the theme on AfCFTA for our conceptualisation and details on the scenario structure and interventions.
According to the Observatory of Economic Complexity (OEC) the top exports of Morocco in 2021 were Cars (US$5.19 billion), Mixed Mineral or Chemical Fertilizers (US$5.18 billion), Insulated Wire (US$3.58 billion), Phosphoric Acid (US$2.25 billion), and Non-Knit Women's Suits (US$1.81 billion), exporting mostly to Spain (US$8.53 billion), France (US$7.9 billion), India (US$2.1 billion), Brazil (US$2.06 billion), and Italy (US$2.01 billion). In 2021, Morocco was the world's biggest exporter of Phosphoric Acid (US$2.25 billion), Calcium Phosphates (US$1.62 billion), and Legumes (US$272M).
In 2021, according to OECD, Morocco's exports amounted to US$41.9 billion, making it the number 61 exporter globally, and imported US$57 billion, the number 54 trade destination globally. None of Morocco’s fastest-growing export or import markets is in Africa, however, pointing to the future opportunities with the AfCFTA.
The top imports of Morocco in 2021 were Refined Petroleum (US$5.02 billion), Cars (US$2.12 billion), Motor vehicles; Parts and Accessories (US$1.92 billion), Petroleum Gas (US$1.68 billion), and Wheat (US$1.36 billion), importing mostly from Spain (US$11.1 billion), China (US$6.43 billion), France (US$5.42 billion), Turkey (US$3.14 billion), and United States (US$3.01 billion). We examine Morocco’s energy import dependence in Chart 37.
Morocco has a number of free trade agreements.
The United States (US) and Morocco signed a Free Trade Agreement (FTA) on June 15, 2004, that entered into force on January 1, 2006. The agreement is comprehensive and supports the significant economic and political reforms that are underway in Morocco and provides for improved commercial opportunities for US exports to Morocco by reducing and eliminating trade barriers.
The EU and Morocco established an FTA as part of the EU-Morocco Association Agreement in 1996, which entered into force on March 1, 2000. The EU and Morocco also signed an agreement on additional liberalisation of trade in agricultural products, processed agricultural products, and fish and fisheries products, which entered into force in October 2012. Trade in industrial products is entirely liberalised, while market opening for agricultural products is also substantial. A protocol establishing a Dispute Settlement Mechanism entered into force in 2012. Negotiations for a Deep and Comprehensive Free Trade Area (DCFTA) started in 2013 but were put on hold the year thereafter at Morocco’s request. An Amendment of the protocols of the EU-Morocco Association Agreement, which extended the tariff preferences laid down in the Association Agreement to products originating in Western Sahara, entered into force on July 19, 2019.
The EU established its privileged partnership with the Eastern and Southern shores of the Mediterranean in 1995 with the launch of the Euro-Mediterranean Partnership at the Barcelona Conference, aiming to establish an area of peace, stability and economic prosperity that upholds democratic values and human rights.
In November 2020, a Joint Communication by the European Commission and the High Representative of the Union for Foreign Affairs and Security Policy referred to ‘A renewed partnership with the Southern Neighbourhood – A new Agenda for the Mediterranean’ and the annexed ‘Economic and Investment Plan for the Southern Neighbours’ in February 2021.
In addition to the Euro-Mediterranean Partnership, Morocco signed the Agadir Agreement with Jordan, Egypt and Tunisia in 2004. The agreement committed all parties to remove all trade tariffs and harmonise their legislation concerning standards and customs procedures. The Agreement entered into force in July 2006, and an Agadir Technical Unit in Amman ensures its implementation. Lebanon and Palestine joined the agreement in 2020 but tangible effects appear to be limited.
The pan-Euro-Mediterranean cumulation system of origin was created in 2005. It brings together the EU, Morocco, and other partners in Europe and the Mediterranean to support regional integration by creating a common system of rules of origin. Rules of origin are technical criteria determining whether a specific product qualifies for duty-free or other preferential access under a given trade agreement.
These individual origin protocols are being progressively replaced by the Regional Convention on pan-Euro-Mediterranean preferential rules of origin (PEM Convention), which was established in 2011 to provide a more unified framework for origin protocols. Morocco acceded to the Regional Convention on April 18, 2012.
Morocco is the EU’s 21st biggest trade partner, representing 1% of the EU’s total trade in goods with the world in 2022.
The EU is Morocco's largest trade partner, accounting for 49% of its goods trade in 2022. 56% of Morocco's exports went to the EU, and 45% of Morocco's imports came from the EU. Total trade in goods between the EU and Morocco in 2022 amounted to €53.3 billion. The EU's imports from Morocco amounted to €21.7 billion, and were led by transport equipment (€5.1 billion, 23.5%), machinery and appliances (€4.6 billion, 21.2%), and textiles (€3.1 billion, 14.3%). The EU's exports to Morocco amounted to €31.6 billion. Exports were led by machinery and appliances (€6.7 billion, 21.2%), followed by mineral products (€4.9 billion, 15.5%), and transport equipment (€3.5 billion, 11.1%).
Two-way trade in services amounted to €7.7 billion in 2021. EU imports of services represented €4.4 billion and exports amounted to €3.3 billion.
Morocco’s trade relations with the EU have not translated into economic growth diversification to the degree anticipated. Recent years have, as a result, seen a determined effort to turn more towards trade and investment in Africa which offers large opportunities.
During a meeting with his Cabinet of Ministers, Russian President Vladimir Putin announced his intention to sign free trade agreements with several North African countries, namely Algeria, Morocco, Tunisia and Egypt. Trade between Morocco and Russia is limited. It peaked in 2021 at US$1.6 billion but is heavily skewed in favour of the latter.
Chart 21 compares the trade balance in the Current Path with the AfCFTA scenario.
In the AfCFTA scenario, Morocco’s exports will increase by 70% in value by 2043 (US$163.1 billion instead of US$95.26 billion) and imports by 57% (US$197 billion instead of US$125.8 billion). Morocco’s 2019 trade deficit stood at −10.3% of GDP. In the AfCFTA scenario, that deficit will peak at 13.9% in 2034 before declining to -11.8% in 2043. Even in the AfCFTA scenario Morocco would require ongoing capital inflows to fill the gap.
Morocco has steadily opened its economy up to trade and foreign investment. However, trade with the rest of Africa remains low, and regional trade integration in North Africa (within the moribund Arab Maghreb Union) is absent, largely due to the dispute with Algeria over Western Sahara representing a huge lost opportunity.
Trade openness is generally measured as exports plus imports as a per cent of GDP. Morocco was the 78th most open economy in 2019 (out of 186 within the IFs system) and will modestly regress to 84th on the Current Path by 2043. In the AfCFTA scenario, Morocco would improve its position significantly to 33rd by 2043. These findings are confirmed by the economic freedom score (Heritage Foundation) for Morocco at 58.4 (2023), which approximates the global average. The Fraser Index of Economic Freedom gives Morocco a similar global ranking at 99th (for 2020), which also indicates steady and consistent progress since 1980.
Chart 22 presents the structure of the Large Infrastructure and Leapfrogging scenario as modelled in IFs.
The Large Infrastructure and Leapfrogging scenario represents a reasonable but ambitious investment in road infrastructure, renewable energy technologies and improved access to electricity in urban and rural areas. The scenario includes accelerated access to mobile and fixed broadband and the adoption of modern technology that improves government efficiency and allows for the more rapid formalisation of the informal sector. A final intervention emulates investments in large infrastructure such as rail, port and airports.
Visit the themes on Large Infrastructure and Leapfrogging for our conceptualisation and details on the scenario structure and interventions. Chart 22 presents the composition of the scenario.
Morocco already does well in many of the traditional and ICT infrastructures used in this scenario. For example, Morocco has achieved universal electricity access and has high mobile broadband rates. Fixed broadband is also forecast to increase rapidly. The impact of the scenario is that Morocco reaches a penetration saturation rate of 50 subscriptions per 100 persons in 2040, seven years earlier than on the Current Path forecast.
Road infrastructure is associated with positive socio-economic impacts, such as increased rural incomes and poverty reduction, improved maternal health as well as paediatric health and increased agricultural productivity. In 2019 Morocco had 42 905 km of paved roads, set to increase to 77 630 km by 2043. The Large Infrastructure and Leapfrogging scenario increases paved roads to 86 659 km (i.e. by 11.6%).
In the Large Infrastructure and Leapfrogging scenario, energy demand in Morocco increases by 6 million barrels of oil equivalent to 299 million barrels by 2043, i.e. by 2%. Domestic production increases by 42.2% to 18 million barrels of oil equivalent by 2043, implying ongoing heavy reliance on imported energy. Morocco’s efforts to respond to its heavy reliance on energy imports are discussed with Chart 37.
Chart 23 presents cook stove usage in the Current Path and the Large Infrastructure and Leapfrogging scenario.
Because of universal electricity access, most households in Morocco use modern fuel and not cook stoves.
Chart 24 presents access to mobile and fixed broadband in the Current Path and the Large Infrastructure and Leapfrogging scenario.
Morocco had a very low fixed broadband rate of less than 5 subscriptions per 100 people in 2019, although above the low-middle-income average in Africa. On the Current Path, the subscription rate will increase to 48 by 2043, much more rapidly than its peer African group. In the Leapfrogging scenario, fixed broadband is set to increase tenfold to a saturation rate of 50 subscriptions per 100 people by 2040. Significantly above the average of low-middle-income countries in Africa, that would only be half of that.
In 2019, Morocco had a mobile broadband subscription rate of 77.4 subscriptions per 100 people. This rate was significantly higher than the average of 49.5 subscriptions per 100 people for Africa’s low-middle-income economies. Mobile broadband in Morocco will increase rapidly and reach 138 subscriptions per 100 people by 2025, both in the Current Path forecast and the Large Infrastructure and Leapfrogging scenario. Thereafter, subscriptions increase more slowly as the saturation effect sets in, reaching 150 subscriptions per 100 people by 2033.
Chart 25 presents the structure of the Financial Flows scenario.
The Financial Flows scenario represents a reasonable but ambitious increase in inward flows of worker remittances, aid to poor countries and an increase in the stock of foreign direct investment (FDI) and additional portfolio investment inflows. We also reduce outward financial flows to emulate a reduction in illicit financial outflows.
Visit the theme on Financial Flows for our conceptualisation and details on the scenario structure and interventions.
Compared to the average for Africa’s lower-middle-income countries of 1.6% of GDP, foreign aid accounts for a slightly higher share of GDP in Morocco at 1.9% in 2019 (US$2.664 billion). Morocco is one of the largest recipients of EU funds under the European Neighbourhood Policy. Aid from the EU to Morocco is part of the Neighbourhood, Development and International Cooperation Instrument (NDICI). Morocco gets a cumulative increase of US$2 billion more aid in the period 2024 to 2043 in the Financial Flows scenario compared to the Current Path. By 2032 aid is at 0.6% of GDP in both the Current Path and the Financial Flows scenario although the economy is 3% larger in the latter.
Attracting foreign investment is, of course, much more important than aid. FDI flows to Morocco accounted for 3.2% of GDP in 2019, 0.6 percentage points above the average for Africa’s lower-middle-income economies. The impact of the COVID-19 pandemic on FDI flows manifests in the sharp drop to 1.6% of GDP in 2020 before recovering. By 2043 FDI inflows are expected at 3.1% of GDP on the Current Path and 4.4% in the Financial Flows scenario, a cumulative difference of US$28.9 billion from 2024 to 2043. Whereas the total stock of FDI in 2019 was US$62.1 billion, set to increase to US$118.6 billion on the Current Path, in the Financial Flows scenario it gets to US$161 billion.
Measured as a percentage of GDP, remittance inflows to lower-middle-income countries, including Morocco, have steadily increased over time, as have ways to capture these flows. In 2019, remittance inflows to Morocco accounted for 6.3% of GDP (US$9.01 billion). By 2043, remittance as a percentage of GDP will increase to 7.8% (US$19.8 billion) in the Current Path and 8.5% (US$22.31 billion) in the Financial Flows scenario. The forecast for ongoing increases in remittance inflows for Morocco diverts for lower-middle-income countries, where it moderates and slowly declines. The reason could be linked to future migration flows. Still, since migrant outflows from Morocco are forecast to be lower than the average for lower-middle-income countries, further exploration is required.
Without data on illicit financial outflows, we reduce FDI outflows, using that as a proxy. The difference, for Morocco, would be US$336 million less outflows in 2043.
Chart 26 presents government revenues in the Current Path and Financial Flows scenario.
Wagner's law, or the law of increasing state activity, is that public expenditure increases as national income rises. It is, therefore, reasonable to expect that government revenues will increase as a percentage of GDP in the Financial Flows scenario compared to the Current Path.
Measured as a per cent of GDP, government revenues in Morocco stood at 33.3% in 2019 (US$47.3 billion). On the Current Path, revenues will remain constant as a percentage of GDP but increase in size to US$84.4 billion in 2043. In the Financial Flows scenario, government revenues increase by 0.053 percentage points to US$87.1 billion, much of that due to foreign aid and the effect of more inward investment on growth.
Chart 27 presents a summary chart that sets out the composition of the Governance scenario as modelled in IFs. Thinking of governance in terms of security, capacity, and inclusion provides a useful lens to compare how countries progressed over time, as well as the state of governance between countries and groups of countries.
Visit the theme on Governance for a full conceptualisation and details on the scenario structure and interventions.
In brief, the stability dimension uses data from the Political Instability Task Force on:
- the probability and magnitude of state failure/internal war,
- the probability and magnitude of abrupt regime change, and
- social violence consisting of reductions in conflict and terror and police conflict.
Capacity is enhanced by improving the quality of government regulation, government effectiveness (both from the Worldwide Governance Indicators) and reductions in corruption using data from Transparency International.
Inclusion improves as a result of:
- an improvement in levels of democracy using the Polity IV index applied to those countries that evidence a democratic deficit,
- an improvement in gender empowerment using the gender empowerment measure (GEM) from the United Nations Development Programme (UNDP), and
- more economic freedom (using the associated index from the Fraser Institute).
Morocco is a relatively stable country and has steadily improved on all three indices.
Chart 28 presents progress with the three governance dimensions by 2043 in the Current Path and Governance scenario compared to 2019.
In the wake of the Arab Spring that started in Tunisia in December 2010, Morocco also witnessed street protests demanding, among other things, the removal of the executive powers from the King. Morocco was eventually less affected by the widespread popular revolt and dissatisfaction than other countries in the region, likely because it had experienced several years of solid economic growth. King Mohammed VI, who ascended to the throne in 1999 upon the death of his father, King Hassan II, also adopted a number of reforms early in his reign that served to soften the harsh authoritarianism evident previously.
Adopted by referendum on 1 July 2011, the Moroccan Constitution was prepared through a consultative commission and reflected some of the demands for political reform. The Constitution specifically outlaws single-party rule. It requires that political parties not be founded on a religious, ethnic or regional basis and provides for various rights granted to the political opposition, 'free, honest and transparent' elections, equality between men and women and various personal and political rights including the right to strike.
The constitution also encourages local democracy and notes, in Article 1 that “the territorial organization of the Kingdom is decentralized”. It was followed, in 2015, by three laws at the municipal, regional, and prefectural levels. Progress in this area, the government believes, is the key to addressing international and domestic concerns about ruling Western Sahara from Rabat.
The security index within IFs indicates that Morocco was 10% more secure than the average for low-middle-income Africa in 2019. On the Current Path forecast, Morocco will be 8% more stable than its peers in 2043 and 11% more stable in the Governance scenario. However, it faces a range of security threats which are related to its political system, economic challenges and corruption, radical Islam, organised crime, as well as the ongoing dispute over the status of Western Sahara. Youth unemployment is a significant concern. Further, the country faces threats of terrorism from Islamist extremism. Al-Qaeda in the Islamic Maghreb (AQIM) have repeatedly called Moroccans to carry out terrorist attacks. Domestic Salafiya-Jihadiya cells also pose a threat.
The capacity index within IFs indicates that Morocco had almost 60% more government capacity in 2019 than the average for low-middle-income Africa. On the Current Path forecast, Morocco will have 40% more capacity in 2043 than its African peers and 50% more in the Governance scenario.
The inclusion index within IFs indicates that Morocco has 34% less inclusion in 2019 than the average for low-middle-income Africa. On the Current Path forecast, Morocco will have 26% less inclusion in 2043 than its peers and 9% less in the Governance scenario. Various measures of democracy confirm the deficit as well as steady progress. The country holds regular multiparty elections for Parliament, and constitutional reforms in 2011 shifted some authority over government from the king to the elected legislature. Nevertheless, the king retains significant formal and informal power. Freedom House, in its 2023 report, considers Morocco partly free. V-Dem scores Morocco 0.25 (out of 1) on liberal democracy and 0.26 on electoral democracy. The Polity V project (used within IFs) classifies Morocco as an anocracy (mixed regime type) with a score of -4 out of a range of -10 (full autocracy) to +10 (liberal multiparty democracy), implying that the country has a democratic deficit of around 9 points on its 20-point scale, meaning that the country is significantly less democratic than expected given its levels of education and income.
The composite IFs governance index is an average of the scores for stability, capacity and inclusion. In 2019 Morocco was 7% above the average for low-middle-income countries in Africa, indicating that Morocco generally is better governed than most other low–middle-income countries. On the Current Path forecast, that number is still positive but reduces to +5% by 2043. The 2043 score for Morocco improves to +15% above the average for low-middle-income countries in the Governance scenario.
These IFs indices compare well with the results from other organisations that measure various aspects of governances, although IFs adopts a more structural/long-term approach. For example, the Worldwide Governance Indicators published by the World Bank measure six governance dimensions: voice and accountability; political stability and absence of violence/terrorism; government effectiveness; regulatory quality; rule of law; and control of corruption. According to the Bank, governance in Morocco was considered 26% more effective in 2019 than the average for low-middle-income African countries, and regulatory quality was 23% better. Both decline on the Current Path forecast (they are included in IFs) but improve in the Governance scenario.
Chart 29 presents a stacked area graph on the contribution of each scenario to GDP per capita. The cumulative impact of better education, health, infrastructure, leapfrogging, etc., means an additional benefit in the modelling that we refer to as the synergistic effect.
In 2019 GDP per capita was US$8 368, and the Current Path for 2043 is US$10 718. Among the sectoral interventions, the AfCFTA scenario will have the greatest positive impact on the GDP per capita, taking it to US$11 859. The second and third largest impact on GDP per capita will be achieved by the Governance and the Manufacturing scenarios, followed by the Large Infrastructure and Leapfrogging scenario. In these scenarios, GDP per capita will increase to US$11 369, US$11 205 and US$10 965, respectively. Given its relatively mature population structure and increased expenditure on non-communicable diseases that follow the Demographics and Health scenario will have the smallest effect on GDP per capita by 2043.
In the Combined scenario, Morocco’s GDP per capita in 2043 will be US$13 996 — 33%, or US$3 495, higher than the Current Path. The average GDP per capita of its lower-middle-income peer group in 2043 will be significantly lower at US$8 904.
Chart 30 presents the impact of each scenario on extreme poverty by 2043. The user can select the number of extremely poor people or % of the population.
Morocco has already achieved the SDG goal of eliminating extreme poverty. In 2019, 0.6% of the population lived below US$1.90, equivalent to 211 000, and 5.1% (1.865 million) using the US$3.20 income poverty line. By 2043 the Current Path is that these numbers will decline to 0.08% (using US$1.90) and 1.3% (using US$3.20), which translates to 34 000 and 582 000 people. In the Combined scenario, by 2043, 0.2% of Moroccans, or 79 000 people, will live in extreme poverty (using US$3.20). The 2043 numbers using US$1.90 are 2 000 people (or 0.005% of the population).
Because of rapid progress in the Current Path, the impact of the Demographics and Health scenario on extreme poverty is minimal.
The scenario with the largest impact on extreme poverty is the Manufacturing scenario, followed by Agriculture.
Chart 31 compares the size of the economy in the Current Path with the Combined Agenda 2063 scenario at market exchange rates (MER).
The Combined scenario consists of the combination of all eight sectoral scenarios, namely Demographics and Health, Education, Large Infrastructure/Leapfrogging, Agriculture, Manufacturing, AfCFTA, Financial Flows and Governance.
In 2019, Morocco’s GDP was US$142.4 billion. On the Current Path, Morocco’s GDP will grow to US$253.4 billion by 2043. In the Combined scenario, it will be US$384 billion, with the largest contribution coming from the AfCFTA scenario, followed by the Governance scenario. In other words, in the Combined scenario, Morocco’s economy will be 2.7 times its 2019 size in 2043 and more than 51% larger than the Current Path for that year. In 2019, Morocco’s economy was the 5th largest in Africa. In the Combined scenario, it would be Africa’s 6th largest economy by 2043 instead of the 11th largest in the Current Path.
Chart 32 presents the change in the economy's structure, comparing the Current Path with the Combined Agenda 2063 scenario from 2019 to 2043.
Our modelling uses data from GTAP to classify economic activity into six sectors: agriculture, energy, materials (including mining), manufacturing, services and information and communication technologies (ICT). Most other sources use a threefold distinction between only agriculture, industry and services, with the result that data may differ.
In the Combined scenario, the manufacturing sector will experience a substantial increase in its contribution to Morocco’s GDP compared to the Current Path, being 4.8 percentage points larger in 2043. This will translate into an increase in GDP of US$50 billion attributable only to the manufacturing sector above the Current Path for 2043. The increase confirms the decision, by government, to pursue a manufacturing growth path given its geographic position in respect to the European Union and supply of cheaper labour able to cost compete with expensive labour in the Union. Since the services sector is much larger than any other, it will contribute an additional (i.e. above the Current Path) US$60 billion to GDP in 2043. However, its contribution to GDP will decline from the 2043 Current Path of 55% to 51.9% in the Combined scenario. The remaining sectors will remain largely stable regarding their value-added contribution to GDP. In absolute terms, however, all sectors will grow.
Chart 33 presents the size of the informal sector as a share of GDP and the size of the informal labour force in the Current Path and in the Combined Agenda 2063 scenario. Formalising the economy is an ongoing priority and the government has launched repeated efforts to help small companies through subsidising rent payments to leave the informal sector and integrate into the formal sector. These measures include efforts to improve the business climate in Morocco. The country’s ranking according to the Ease of Doing Business Index developed by the World Bank went from 177rd place in 2006 to 52nd place in 2019, which proves that the measures taken have had favourable effects. In addition, an ambitious strategy was designed in 2018 to guarantee access for all individuals and businesses to financial products and services (transactions, payments, savings, financing and insurance, etc..).
The experience with the Tayssir and later the Tademon cash transfer programs, the latter in response to the COVID-19 pandemic and the former to assist with primary school completion, has led Morocco to launch a program to expand social security coverage. This program, currently underway consists of: (i) the extension of the health insurance consisting of Compulsory Heath Insurance, (ii) the generalization of family allowances, (iii) the expansion of the retirement system, and (iv) the enlargement of access to compensation for job loss.
Morocco had the third largest informal sector in North Africa (as per cent of GDP) after Mauritania and Tunisia, dropping to the fourth spot on the Current Path for 2043. The average value for Africa’s lower-middle-income economies in 2019 is at 29.5%.
On the Current Path, the size of the informal sector will reduce to 12.7% (but increase in value to US$46.6 billion) in 2043.
The contribution of the informal sector to GDP reduces to 12.8% in the Combined scenario, equivalent to USS$49 billion in 2043.
Informal labour constituted 35.8% of total labour in 2019. It will decline to 27.6% on the 2043 Current Path and 14.4% in the Combined scenario. These numbers are conservative. The Morocco High Commissioner for Planning (HCP) estimated that two-thirds of Moroccan jobs were in the ‘grey economy’, including most (97%) in the agricultural sector which is excluded from the data on informality used in our modelling.
Chart 34 compares life expectancy in the Current Path with the Combined Agenda 2063 scenario.
In 2019, the average life expectancy for Moroccans was 75.4 years, ranking fourth highest in North Africa and more than two years above the global average. Life expectancy in Egypt and Mauritania was below Morocco. Tunisia had the highest life expectancy in the region at 77.8 years. On the Current Path, life expectancy in Morocco will increase to 79.1 years in 2043. In the Combined scenario, average life expectancy is expected to increase to 80.1 years. This is almost 7 years above the average life expectancy for Africa’s lower-middle-income economies, which will be 73.2 years by 2043. The 2043 global median will be 76.3 years, illustrating how well Morocco is doing in this dimension.
Chart 35 compares the Gini coefficient in the Current Path with the Combined Agenda 2063 scenario.
Inequality in Morocco, using Gini, is historically slightly higher than the average for lower-middle-income countries in Africa but significantly higher than the average for North Africa. The Current Path shows a modest decline in inequality in Morocco that will accelerate in the Combined scenario. The trend for lower-middle-income countries is for a marginal increase in GINI.
A 2021 report released by the High Commission for Planning (HCP) revealed large disparities between the different strata of Moroccan society. Factors such as age, sex, education and location (urban vs rural) of the household affect earned income. Rural households account for 66.4% of the low-income population or approximately 4.5 million people. The report found that, in 2019, Morocco exceeded the Gini Index’s “socially tolerable threshold” for household income inequality with a 46.4% rate of inequality, 4.4% over the maximum threshold.
The government has enacted various social welfare programs, including a restructuring of the social security program that promises to offer universal health care, new government allowances, update the current pension program, and increase benefits to those unemployed for completion in 2025.
Chart 36 compares carbon emissions in the Current Path with the Combined Agenda 2063 scenario.
Since carbon dioxide (CO2), carbon monoxide (CO) and methane (CH4) have different molecular weights, our modelling uses carbon. Many other sites and calculations use CO2 equivalent.
In 2019, Morocco emitted 18 million tons of carbon from fossil fuels making it the fifth largest emitter in Africa. On the Current Path, emissions will increase to 30 million tons of carbon by 2043, and Morocco will then have declined to the number eight spot in Africa. In the Combined scenario, Morroco will release 38 million tons of carbon (i.e. a 24% increase above the 2043 Current Path) and release the 6th most carbon in Africa.
Among the sectoral interventions, the AfCFTA scenario will release more carbon than any other scenario, resulting in additional emissions of 2.6 million tons above the 2043 Current Path.
Chart 37 compares energy demand and production in the Current Path with the Combined Agenda 2063 scenario in six types, namely oil, gas, coal, hydro, nuclear and other renewables. All energy data is converted into billion barrels of oil equivalent (BBOE) to allow for comparison between the energy produced by different means.
Morocco depends heavily on imported hydrocarbons to meet its energy needs. While the share of renewables in electricity production is improving steadily, its share in total final consumption (TFC) is decreasing, given the expanding energy demand. Morocco’s total energy production was equivalent to only about 3 million barrels of oil equivalent in 2019. By 2043, production is estimated to increase threefold to 12 million barrels of oil equivalent in the Current Path and 19 million in the Combined scenario, but still only constitute a relatively small percentage of demand.
Morocco’s energy demand was equivalent to 162 million barrels of oil equivalent in 2019, meaning that its domestic production only came to 4% of demand. By 2043, demand will increase to 293 (Current Path) and 368 million barrels of oil equivalent (Combined scenario), pointing to a future of ongoing energy import dependence. In 2043 Morocco will import 96% of its energy requirements in the Current Path and slightly less (95%) in the Combined scenario given the larger increase in domestic production modelled in the latter.
The contribution of renewables (excluding hydro) to Morocco’s energy production was equivalent to 2 million barrels of oil equivalent in 2019 (52% of energy production), set to increase to 11 million in 2043 (92%) followed by hydro at 29% and gas at 19%. However, once the imported energy mix from hydrocarbons is taken into account (i.e. its TFC), Morocco’s energy balance is heavily skewed towards fossil fuels consisting of 55% oil, 32% coal, 6% biofuels and waste, 3.5% wind and solar, 3% natural gas and only 0.4% hydro.
The government intends to increase the security of supply by ramping up the use of renewables and increasing energy efficiency, with much of the former likely to come from the private sector, ongoing search for its hydrocarbons (gas and oil) and oil and gas imports from Nigeria. The Combined scenario models the impact of the associated efforts, reflected in a 65% increase in renewable production above the Current Path. However, it is insufficient to offset the increase in fossil fuel import dependence.
Rather than dependence upon Algeria, where relations are fraught, the government is seeking alternative sources of gas supply such as an extension of the existing West African Gas Pipeline, which runs from Lagos, Nigeria, connecting to Cotonou, Benin; Lomé, Togo; and Tema and Takoradi, Ghana. In August 2017, NNPC and ONHYM began a feasibility study for the pipeline. The proposed Nigeria-Morocco Gas Pipeline would additionally connect to Côte d'Ivoire, Liberia, Sierra Leone, Guinea-Bissau, The Gambia, Senegal, Mauritania and Morocco with possible extension to Europe through Cádiz, Spain. The pipeline will cost US$25 billion and could be completed in stages over 25 years.
For Morocco, the Nigeria-Morocco pipeline is an alternative to the Trans-Saharan Gas Pipeline being considered by Nigeria, arguing that the latter would have to pass through a region with significant militant activity. The current global context makes such projects difficult to finance, however.
Morocco is actively also trying to expand its search for hydrocarbons. According to the Ministry of Energy and Renewables, the country has major sedimentary basins whose geology is comparable to that of neighbouring oil-producing countries but is under-explored. Attracting investors in the current context is proving difficult although. These efforts have recently been scaled up. In 2017, the government issued various research and exploration permits and subsequently entered into oil agreements with various companies and, by 2021, 13 oil companies were operating in Morocco engaged in 53 exploration permits that included 26 offshore areas.
Morocco stands at a significant crossroads, poised for substantial growth and development by 2043. With a unique geographic position, bordering both the Atlantic and Mediterranean and the EU via Spanish enclaves, Morocco has considerable geopolitical and economic leverage. Its population will increase to 43.9 million by 2043, accompanied by ageing, a declining fertility rate and increasing life expectancy. Urbanisation will rise to 72.6% by 2043, reflecting the country's progressive migration and urban development policies.
Significant investments in education, health and ICT have enabled a transition from low-cost manufacturing to higher-value sectors such as pharmaceuticals, aerospace and automotive. The GDP is projected to reach US$253.4 billion by 2043, with GDP per capita increasing to US$10 718 in 2043.
The sectoral scenarios forecast varied impacts on Morocco. Improving health outcomes and reducing mortality rates will yield a modest GDP per capita gain, though the country faces an epidemiological shift towards chronic diseases. Enhancing agricultural productivity through better management, technology, and irrigation will significantly improve food security, making Morocco a net exporter of agricultural products by 2043. Ambitious improvements in education quality, access and gender parity will boost GDP per capita by US$225 above the Current Path forecast.
Increased investment in manufacturing, R&D and better regulations will grow Morocco’s economy by 6.8% by 2043 and reduce inequality through increased welfare transfers. Full implementation of the AfCFTA will increase exports by 70% above the Current Path forecast, enhancing trade openness and African integration. Investments in infrastructure, renewable energy and broadband will yield socio-economic benefits, including poverty reduction and improved health outcomes.
Increased inward financial flows from remittances, foreign aid, and FDI will boost government revenues and economic growth. Enhancements in security, capacity and inclusion will improve governance, making the country more stable and reducing corruption by 2043.
In the Combined scenario, which integrates all sectoral interventions, Morocco's GDP per capita will reach US$13 996 in 2043, a 33% increase above the Current Path forecast. The economy will grow to US$384 billion, making it Africa’s sixth-largest economy.
Despite challenges like water scarcity, energy dependence and regional disputes, Morocco's strategic investments in infrastructure, education and governance reforms present substantial opportunities for sustainable growth and development, positioning it for long-term stability and success by 2043.
Key recommendations for policymakers in Morocco are:
- Focus on reducing child and maternal mortality rates, increasing access to healthcare and modern contraception and addressing the growing burden of chronic diseases to improve overall health outcomes and advance the demographic dividend.
- Invest in better management practices, advanced seed and fertiliser technologies and expanded irrigation to improve agricultural yields. These investments will enhance food security and make Morocco a net exporter of agricultural products by 2043.
- Implement policies to increase educational attainment, gender parity and vocational training. Enhancing education quality from primary to tertiary levels will significantly contribute to economic growth and workforce productivity.
- Increase investments in manufacturing and research and development (R&D). Improve government regulations to stimulate economic growth and address inequality through welfare transfers, thus enhancing economic inclusivity.
- Fully implement the agreement on the African Continental Free Trade Area (AfCFTA) to boost exports, improve multifactor productivity and enhance trade openness and integration within Africa.
- Prioritise investments in road infrastructure, renewable energy technologies and broadband access to reduce poverty, improve health outcomes and provide energy security.
- Attract more inward financial flows, such as foreign aid and foreign direct investment (FDI). Additionally, reduce illicit financial outflows to enhance government revenues and stimulate economic growth.
- Enhance government capacity, regulatory quality and efforts to reduce corruption to foster a stable political environment.
- Reorganise the water sector, introduce cost-based water pricing, and establish a National Water Management Agency. Promote water conservation and reuse to mitigate the economic and social impacts of water stress.
- Continue to develop progressive migration policies and support urbanisation efforts. Ensure that infrastructure and services in urban areas keep pace with population growth to maintain quality of life and economic opportunities.
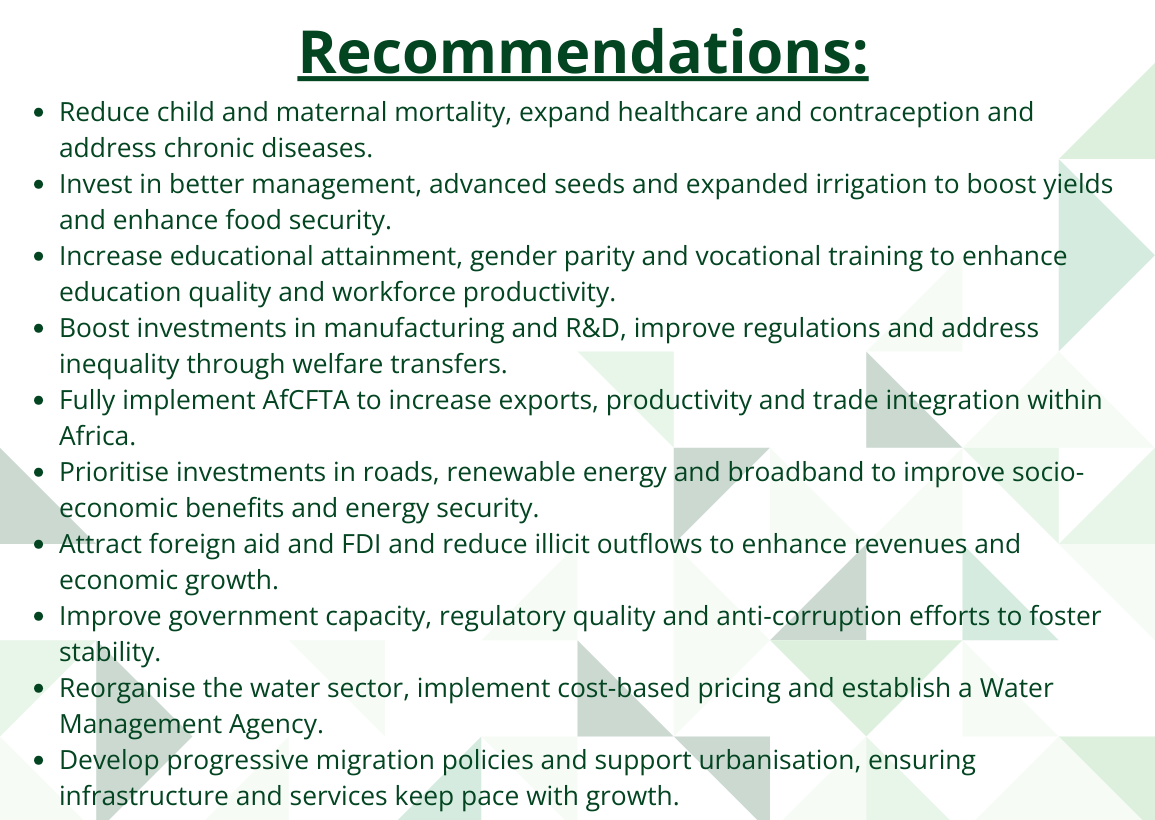
Page information
Contact at AFI team is Jakkie Cilliers
This entry was last updated on 31 May 2026 using IFs 7.84.
Donors and sponsors


Reuse our work
- All visualizations, data, and text produced by African Futures are completely open access under the Creative Commons BY license. You have the permission to use, distribute, and reproduce these in any medium, provided the source and authors are credited.
- The data produced by third parties and made available by African Futures is subject to the license terms from the original third-party authors. We will always indicate the original source of the data in our documentation, so you should always check the license of any such third-party data before use and redistribution.
- All of our charts can be embedded in any site.
Cite this research
Jakkie Cilliers (2026) Morocco Development Futures. Published online at futures.issafrica.org. Retrieved from https://futures.issafrica.org/geographic/countries/morocco/ [Online Resource] Updated 31 May 2026.