 SADC
SADC
Feedback welcome
Our aim is to use the best data to inform our analysis. See our Technical page for information on the IFs forecasting platform. We appreciate your help and references for improvements via our feedback form.
Please note: This regional report was developed using African Futures’ previous analytical framework, which organised the assessment across 11 sectoral scenarios. We have since updated and streamlined the analytical architecture to 8 sectoral scenarios. While the two frameworks remain broadly aligned, the current structure improves consistency, comparability and integration across themes and geographic studies. This page will therefore be updated to the current framework in due course. Read more about our analytical framework on the Technical Page.
In this entry, we first describe the Current Path forecast for the Southern African Development Community (SADC) as it is expected to unfold to 2043, the end of the third ten-year implementation plan of the African Union’s Agenda 2063 long-term vision for Africa. The Current Path in the International Futures (IFs) forecasting model initialises from country-level data that is drawn from a range of data providers. We prioritise data from national sources.
The Current Path forecast is divided into summaries on demographics, economics, poverty, health/WaSH and climate change/energy. A second section then presents a single positive scenario for potential improvements in stability, demographics, health/WaSH, agriculture, education, manufacturing/transfers, leapfrogging, free trade, financial flows, infrastructure, governance and the impact of various scenarios on carbon emissions. With the individual impact of these sectors and dimensions having been considered, a final section presents the impact of the Combined Agenda 2063 scenario.
We generally review the impact of each scenario and the Combined Agenda 2063 scenario on gross domestic product (GDP) per person and extreme poverty except for Health/WaSH that uses life expectancy and infant mortality.
The information is presented graphically and supported by brief interpretive text.
All US$ numbers are in 2017 values.
Executive Summary
- Current Path forecast
- SADC is a regional intergovernmental organisation and regional economic community (REC) with 16 member states: Angola, Botswana, Comoros, the Democratic Republic of the Congo (DR Congo), eSwatini, Lesotho, Madagascar, Malawi, Mauritius, Mozambique, Namibia, Seychelles, South Africa, Tanzania, Zambia and Zimbabwe. Jump to forecast: Current path
- The total population of SADC in 2019 was 354 million and is expected to increase to 618 million by 2043. Because of its youthful population, SADC will only benefit from a demographic dividend during the second half of the 21st century. Jump to Demographics: Current path
- SADC has an aggregate economy standing at US$924.3 billion in 2019; in the Current Path forecast it is projected that the aggregate SADC economy will likely be US$2.1 trillion by 2043. South Africa will continue to be the largest economy in SADC well into 2043 and beyond, with a value of approximately US$733.7 billion. Jump to Economics: Current path
- In 2019, extreme poverty levels (people living on less than US$1.90 per day) were at 51%. The percentage of poor people will continue to decline in the near future, reaching 34% by 2043 but the number of extremely poor people will climb from 180.5 million to 209.8 million by 2043. Jump to Poverty: Current path
- SADC relies, and will continue to rely in the Current Path forecast, on fossil fuels well into the future for the lion’s share of its energy needs. SADC’s carbon emissions are likely to increase from 169 million tons of carbon to 263 million tons by 2043. Jump to Carbon emissions/Energy :Current path
- Sectoral Scenarios
- The Stability scenario sees SADC’s regional GDP per capita increase to US$6 068 by 2043 compared to US$5 719 for the Current Path forecast, an increase of US$349. Jump to Stability scenario
- The Demographic scenario could see SADC entering a demographic dividend of 1.7 by 2042, approximately ten years earlier than in the Current Path forecast. Jump to Demographic scenario
- Infant mortality improves in the Health/WaSH scenario by 2.7 births compared to the Current Path forecast (down from 25.1 deaths per 1000 live births to just over 22 deaths by 2043). Jump to Health/WaSH scenario
- The agricultural import dependence for SADC could drop to under 4% by 2043 in the Agricultural scenario, as opposed to 33% in the Current Path forecast. Jump to Agricultural scenario
- SADC sees a 2.5 percentage point reduction in extreme poverty rates as a result of the Education scenario, compared to the Current Path forecast. This translates to 16 million fewer people in poverty by 2043. Jump to Education scenario
- The Manufacturing/Transfers scenario has the potential to increase the GDP per capita by 2043 to US$6 103, up from US$5 719 in the Current Path forecast. This is an aggregate increase in GDP per capita of US$384 across the region. Jump to Manufacturing/Transfers scenario
- In 2019, less than 40% of people in SADC had access to electricity, with rural rates below 22%—far lower than urban rates of 62.8%. The Leapfrogging scenario increases electricity access across SADC from 62.3% of the population on the Current Path to 74% by 2043. Jump to Leapfrogging scenario
- The Free Trade scenario translates to significant improvements in income across SADC. GDP per capita has the potential to increase from US$5 719 in the Current Path forecast to US$6 314 in the Free Trade scenario, an increase of US$595 by 2043. Jump to Free Trade scenario
- The Financial Flows scenario would have a modest impact on SADC’s incomes, with an increase of US$130 to the regional GDP by 2043 above the Current Path forecast. Jump to Financial Flows scenario
- SADC had an aggregate electricity access rate of 39.1% in 2019. This is likely to rise to 62.3% in the Current Path forecast by 2043 but could rise to 66.6% in the Infrastructure scenario. Jump to Infrastructure scenario
- The Governance scenario has the potential to increase GDP per capita from US$5 719 in the Current Path forecast to US$5 863 in the Governance scenario by 2043. This translates to an aggregate improvement of US$144. Jump to Governance scenario
- The Free Trade scenario will increase SADC’s carbon emissions the most from a baseline of 169 million tons of carbon in 2019 to 283 million tons by 2043. Jump to Carbon emissions/Energy: Current Path
- Combined Agenda 2063 scenario
- SADC could see a substantial increase in incomes by 2043 by implementing the Combined Agenda 2063 scenario. Instead of achieving incomes of US$5 720 by 2043 in the Current Path forecast, the Combined Agenda 2063 scenario could see SADC reaching incomes of US$9 360 per capita. Jump to Combined Agenda 2063 scenario
- The Combined Agenda 2063 scenario could see extreme poverty rates plummet across the region. By 2043, rates of extreme poverty would be approximately 9.4% in this scenario, compared to 34% in the Current Path forecast. Jump to Combined Agenda 2063 scenario
- SADC is expected to see a tremendous increase in the aggregate size of its economy under the Combined Agenda 2063 scenario. In the Combined Agenda 2063 scenario, SADC is likely to have an economy of US$3. 9 trillion, as opposed to US$2.1 trillion in the Current Path, an 81% increase by 2043. Jump to Combined Agenda 2063 scenario
All charts for SADC Development Futures
- Chart 1: Political map of SADC
- Chart 2: Population structure in CP, 1990–2043
- Chart 3: Urban and rural population in CP, 1990–2043
- Chart 4: Population density map for 2019
- Chart 5: GDP in CP, 1990–2043
- Chart 6: GDP per capita in CP, 1990–2043
- Chart 7: Informal sector value in CP, 2015–2043
- Chart 8: Value added by sector in CP, 2015–2043
- Chart 9: Agriculture production/demand in CP, 1990–2043
- Chart 10: Poverty in CP, 2015–2043
- Chart 11: Energy production by type in CP, 1990–2043
- Chart 12: Carbon emissions in CP, 1990–2043
- Chart 13: Governance security in CP and Stability scenario, 2019–2043
- Chart 14: GDP per capita in CP and Stability scenario, 2019–2043
- Chart 15: Poverty in CP and Stability scenario, 2019–2043
- Chart 16: Demographic dividend in CP and Demog scenario, 2019–2043
- Chart 17: Infant mortality in CP and Demog scenario, 2019–2043
- Chart 18: GDP per capita in CP and Demog scenario, 2019–2043
- Chart 19: Poverty in CP and Demog scenario, 2019–2043
- Chart 20: Life expectancy in CP and Health/WaSH scenario, 2019–2043
- Chart 21: Infant mortality in CP and Health/WaSH scenario, 2019–2043
- Chart 22: Yield/hectare in CP and Agric scenario, 2019–2043
- Chart 23: Agriculture imports in CP and Agric scenario, 2019–2043
- Chart 24: GDP per capita in the CP and Agric scenario, 2019–2043
- Chart 25: Poverty in CP and Agric scenario, 2019–2043
- Chart 26: Mean years of education in CP and Educ scenario, 2019–2043
- Chart 27: Education quality in CP and Educ scenario, 2019–2043
- Chart 28: GDP per capita in CP and Educ scenario, 2019–2043
- Chart 29: Poverty in CP and Educ scenario, 2019–2043
- Chart 30: Value added by sector in CP and Manufac/Transfers scenario, 2019–2043
- Chart 31: Gov welfare transfers in CP and Manufac/Transfers scenario, 2019–2043
- Chart 32: GDP per capita in CP and Manufac/Transfers scenario, 2019–2043
- Chart 33: Poverty in CP and Manufac/Transfers scenario, 2019–2043
- Chart 34: Fixed broadband access in CP and Leapfrogging scenario, 2019–2043
- Chart 35: Mobile broadband access in CP and Leapfrogging scenario, 2019–2043
- Chart 36: Electricity access in CP and Leapfrogging scenario, 2019–2043
- Chart 37: GDP per capita in CP and Leapfrogging scenario, 2019–2043
- Chart 38: Poverty in CP and Leapfrogging scenario, 2019–2043
- Chart 39: Trade balance in CP and Free Trade scenario, 2019–2043
- Chart 40: GDP per capita in CP and Free Trade scenario, 2019–2043
- Chart 41: Poverty in CP and Free Trade scenario, 2019–2043
- Chart 42: Foreign aid in CP and Financial Flows scenario, 2019–2043
- Chart 43: Inflow of FDI in CP and Financial Flows scenario, 2019–2043
- Chart 44: Remittances in CP and Financial Flows scenario, 2019–2043
- Chart 45: GDP per capita in CP and Financial Flows scenario, 2019–2043
- Chart 46: Poverty in CP and Financial Flows scenario, 2019–2043
- Chart 47: Electricity access in CP and Infrastructure scenario, 2019–2043
- Chart 48: Rural road access in CP and Infrastructure scenario, 2019–2043
- Chart 49: GDP per capita in CP and Infrastructure scenario, 2019–2043
- Chart 50: Poverty in CP and Infrastructure scenario, 2019–2043
- Chart 51: Gov effectiveness in CP and Governance scenario, 2019–2043
- Chart 52: GDP per capita in CP and Governance scenario, 2019–2043
- Chart 53: Poverty in CP and Governance scenario, 2019–2043
- Chart 54: Carbon emissions in CP and scenarios, 2019–2043
- Chart 55: GDP per capita in CP and scenarios, 2019–2043
- Chart 56: GDP per capita in CP and Combined scenario, 2019–2043
- Chart 57: Poverty in CP and Combined scenario, 2019–2043
- Chart 58: Value added by sector in CP and Combined scenario, 2019–2043
- Chart 59: GDP in CP and Combined scenario, 2019–2043
- Chart 60: Carbon emissions in CP and Combined scenario, 2019–2043


This page provides an overview of the key characteristics of SADC along its likely (or Current Path) development trajectory. The Current Path forecast from the International Futures forecasting (IFs) platform is a dynamic scenario that imitates the continuation of current policies and environmental conditions. The Current Path is therefore in congruence with historical patterns and produces a series of dynamic forecasts endogenised in relationships across crucial global systems. We use 2019 as a standard reference year and the forecasts generally extend to 2043 to coincide with the end of the third ten-year implementation plan of the African Union’s Agenda 2063 long-term development vision.
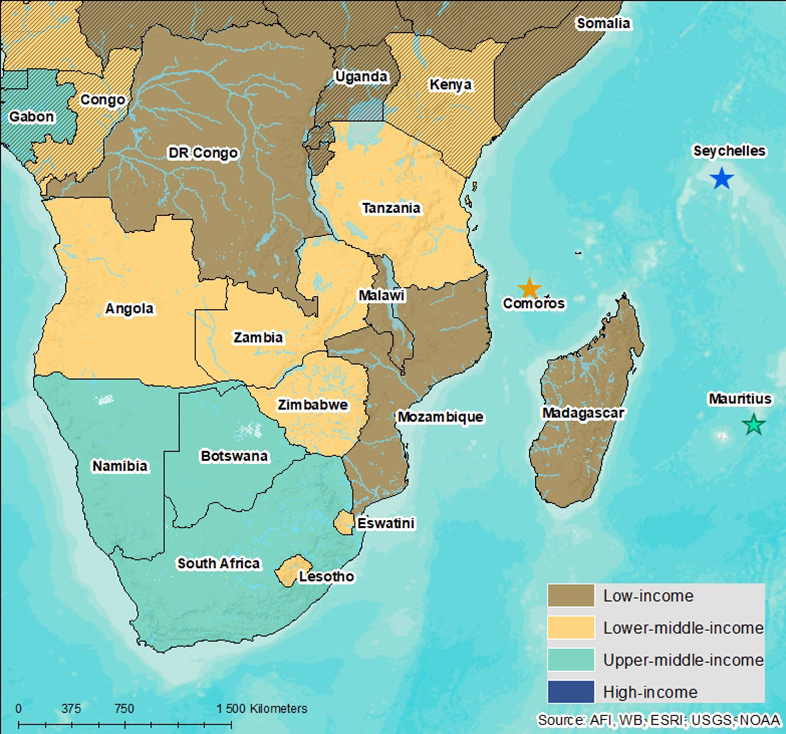
The Southern African Development Community (SADC) is a regional intergovernmental organisation and regional economic community (REC) with 16 member states: Angola, Botswana, Comoros, the Democratic Republic of the Congo (DR Congo), eSwatini, Lesotho, Madagascar, Malawi, Mauritius, Mozambique, Namibia, Seychelles, South Africa, Tanzania, Zambia, and Zimbabwe (Chart 1).
SADC was established in 1980 as the Southern African Development Coordination Conference (SADCC) and became SADC in 1992. Its main objectives are to achieve ‘development, peace and security, and economic growth, to alleviate poverty, enhance the standard and quality of life of the peoples of Southern Africa, and support the socially disadvantaged through regional integration, built on democratic principles and equitable and sustainable development.’
SADC includes Africa’s only high-income country (Seychelles), four upper middle-income countries (Botswana, Namibia, Mauritius and South Africa), seven lower middle-income countries (Angola, Comoros, eSwatini, Lesotho, Tanzania, Zambia and Zimbabwe), while the remaining four (DR Congo, Madagascar, Malawi and Mozambique) are low-income countries, according to the World Bank’s income classification. SADC thus represents an extremely diverse set of countries in terms of wealth, geographic and population sizes, systems of government and energy endowments, as will be explored in the various sections.
In 2019, SADC’s aggregate population was 354 million people (Chart 2). The DR Congo had the single largest population among member states at 87 million people, while South Africa and Tanzania had approximately 58 million each. Seven of the 16 member states have populations below three million, including Namibia, Botswana, Lesotho, Mauritius, eSwatini, Comoros and Seychelles. In the Current Path forecast, relatively aggressive population growth in the region is expected to continue in the future, with the population nearly doubling to 618 million people by 2043. This growth is likely to be led by the DR Congo, which will more than double its population to 173 million. Tanzania will overtake South Africa as the second most populous country in SADC with 106 million people by 2043. South Africa will remain in third place at almost 70 million, followed closely by Angola with 67 million (up from only 32 million in 2019). SADC’s seven smallest countries will all remain below 4 million people by 2043, with Seychelles experiencing little growth. SADC’s working-age population (people aged between 15- and 64 years) made up 55% of the population in 2019, implying that 45% of the population are dependants, mostly children under 15 who made up 41% of the population. This translates to a ratio of 1.2 working-age persons to dependant, far from the coveted ratio of 1.7 working-age persons to dependant that has the potential to reap a demographic dividend.
This aggregate figure belies the diversity of the region on this variable. The percentage of SADC’s working-age population is far higher for high-income countries (average of 70%) and upper middle-income countries (average of 62%) than lower middle-income (average of 58%) and low-income countries (average of 54%). The DR Congo has the smallest proportion of working-age persons at only 51% of the country’s population, and with the largest population in the region, the DR Congo drags the regional weighted average down considerably.
Only South Africa, Seychelles and Mauritius are currently experiencing a demographic dividend of more than 1.7, while the DR Congo has a very low ratio of 1 (implying a nearly 1-to-1 ratio of workers to dependants).
Even in the Current Path forecast, the demographic structure is likely to improve for most countries across SADC, with eSwatini, Lesotho, Botswana, South Africa, Namibia, Zimbabwe and Malawi reaching, exceeding or remaining within the demographic sweet spot by 2043. This creates a window of opportunity for development in these countries.
As is typical for high-income countries, Seychelles will in fact leave the demographic sweet spot with a demographic dividend of just under 1.7 in 2043 as its population begins to age and the elderly live longer. Mauritius will remain above the demographic dividend sweet spot threshold, but this dividend will reduce to 1.8 by 2043.
By 2043, SADC will reach an aggregate demographic dividend of 1.55 on an upward trend, with approximately 61% of its population of working age. While this represents an improvement from the 2019 figure, this demographic structure suggests a challenge for development in the region without intervention for the foreseeable future, particularly for the DR Congo and Angola, which will languish behind in the Current Path forecast with demographic ratios of only 1.4 and 1.3 respectively.
SADC, a predominantly rural region at 55%, is swiftly urbanising and by 2030 the scale will have shifted to 50.5% urban; by 2043, this figure will be 56% (Chart 3). SADC’s rural population on average will continue to grow steadily, although in Mauritius, Seychelles and South Africa, a decline in rural population numbers is likely to occur throughout the next two decades to 2043.
In 2019, Botswana, South Africa and Angola were SADC’s most urbanised countries, each with more than 66% of their population living in cities. Low-income Malawi was the least urbanised country in SADC at only 17%, most likely a result of many years of an aggressive rural investment strategy. South Africa will be the most urban country with 77% of its citizens living in urban areas, while Malawi will remain the least urbanised, though urbanising only 5 percentage points more to 23% by 2043.
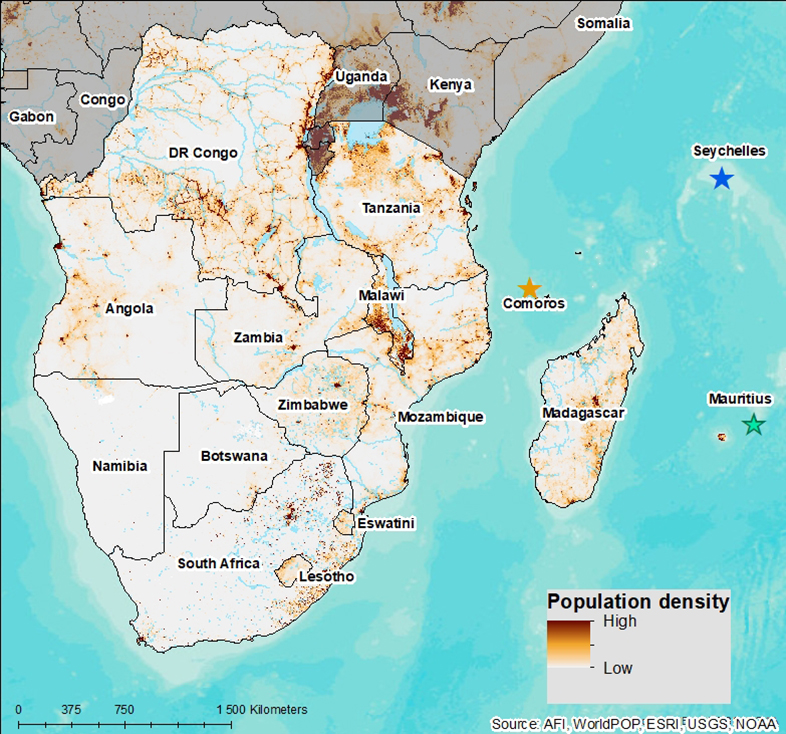
SADC is diverse in population density, ranging from highs in 2019 of 6.3 people per hectare in Mauritius to lows of 0.031 in Namibia. The six highest population densities can be found in the six smallest countries within SADC, namely Mauritius, Comoros, Seychelles, Malawi, Lesotho and eSwatini. The four most populous countries in 2019, namely the DR Congo, South Africa, Tanzania and Angola all have densities below 0.66 people per hectare due to their large geographical size. The Kalahari Desert and its harsh climate dominates much of Namibia and Botswana explaining both relatively low population sizes and densities despite relatively large landmasses (Chart 4).
SADC’s aggregate economy was worth US$413.11 billion in 1990, faltering somewhat in the early 1990s in the wake of the global recession and as South Africa transitioned from minority rule and international sanctions into democracy. Growth stagnated in the wake of the 2007 financial crisis but continued slowly in the years leading up to the COVID-19 pandemic at a rate of 1.4% per annum on average (Chart 5).
These relatively low growth rates were impacted by a variety of member states’ internal issues. The region’s largest economy, South Africa, had a strong negative impact on the regional average. South Africa’s very disappointing economic growth came on the back of pervasive state corruption under the presidency of Jacob Zuma, regulatory uncertainty and the decline of key infrastructure (particularly electricity generation) and public utilities. Angola’s oil-dependent economy also suffered prior to 2019, recording economic contractions since 2016 as a result of low oil prices and related issues with debt.
Other SADC states have had better economic fortunes. Tanzania has led the region in economic growth with growth rates of over 5% between 2015 and 2019. Madagascar, Malawi, Seychelles, the DR Congo, Mauritius and Botswana all grew at over 3% in 2019.
In 2019, South Africa and Angola, while faltering, maintained the largest regional economies at US$503.7 billion and US$138.8 billion respectively, while Tanzania, the DR Congo, Zambia, Mozambique and Botswana followed in size with GDPs ranging between US$60 billion and US$23 billion. Comoros had the smallest economy in the region with a GDP of only US$1.4 billion, and, while much wealthier per capita, Seychelles had the second smallest economy in the region at only US$1.6 billion.
When the COVID-19 pandemic hit in 2020, all SADC countries except Tanzania and Malawi saw a contraction in their economies. More advanced, wealthier countries were hit harder than others. Mauritius and Seychelles saw the biggest proportional contractions, at 14% each, with Zimbabwe, Botswana and South Africa contracting at 10%, 9% and 8% respectively. South Africa’s large economy saw the single biggest aggregate drop in value from US$503.7 billion to US$463.4 billion, a US$40 billion drop in value year-on-year. This resulted in an aggregate economy for SADC standing at US$924.3 billion in 2019. The COVID-19 pandemic impacted the aggregate economy of SADC, retracting it to US$867.6 billion in 2020. It is expected that in the Current Path forecast the aggregate SADC economy will likely be US$2146.2 billion by 2043. South Africa will continue to be the largest economy in SADC well into 2043 and beyond, with a value of approximately US$733.7 billion.
Although many of the charts in the sectoral scenarios also include GDP per capita, this overview is an essential point of departure for interpreting the general economic outlook of SADC.
GDP per capita in the region has followed a similar path to GDP, impacted by the same financial crises discussed for Chart 5. The average GDP per capita for SADC was above Africa’s average in 1990 at US$4 077 compared to US$3 808. By 2019 the average GDP per capita for SADC had fallen below the average for Africa at US$4 660 compared to US$5 289. In the Current Path forecast, it is projected that SADC will continue to fall further behind in average GDP per capita and that by 2043 the gap would have grown, resulting in a GDP per capita of US$5 719 compared to Africa’s US$7 157 (Chart 6).
In 2019, high-income Seychelles had a GDP per capita of US$30 673, while Mauritius, recently demoted from high-income to upper middle-income, had an GDP per capita income of approximately US$23 784. The island nations were followed by Botswana, South Africa and Namibia at US$18 138, US$13 080 and US$10 419 respectively. The DR Congo was the poorest of the group with a GDP per capita of less than US$1 000 in 2019, preceded by Malawi, Mozambique and Madagascar at between US$1 288 and US$1867.
In the Current Path forecast, each SADC country will grow with regard to their GDP per capita. South Africa’s GDP per capita will grow marginally, reaching US$15 173 by 2043. Botswana, Eswatini and Namibia will overtake the region’s largest economy on GDP per capita, with Botswana reaching US$24 056 by 2043. On the lower end of the spectrum, Malawi will see larger improvements relative to its low-income peers but will remain relatively poor with a GDP per capita of US$4 033 by 2043.
The informal sector in SADC constituted 22.1% of the economy in 2019. In the Current Path forecast it is likely to continue to grow, peaking at 24.2% in 2036 then gradually tapering off to 24% by 2043.
This growth in the informal sector is driven entirely by the growth of South Africa’s relatively small informal sector, which will grow from about 13% in 2019 to 21% by 2043. All other countries in the region will shrink the size of their informal sector over this same time period. Only Mauritius and Seychelles have informal sectors smaller than 10% in the region, while Zimbabwe, Tanzania and the DR Congo have the largest informal sectors at 53%, 45% and 42% of GDP respectively, though these sectors will shrink to 31%, 36% and 34% respectively.
The IFs platform uses data from the Global Trade and Analysis Project (GTAP) to classify economic activity into six sectors: agriculture, energy, materials (including mining), manufactures, services and information and communications technology (ICT).
SADC’s economy has been, and will continue to be, dominated by the services sectors, constituting 55.2% of GDP in 2019, dropping only slightly to 54% of GDP by 2043. This is a value of US$510 billion in 2019 doubling to a value of US$1 160 billion by 2043. This is driven in a large part by the high value financial, advisory and similar services which dominate the economies of Seychelles, Mauritius, South Africa, Botswana and Namibia (59% and 78% of their economies are contributed to by this sector). However, low-value informal services also constitute a large part of the economy in the above-mentioned countries but also in poorer countries. Comoros, Zimbabwe, Malawi, Lesotho and Madagascar each have services sectors constituting more than 50% of GDP. Even the DR Congo, with the smallest services sector by proportion of GDP in the region, owes 31% of its GDP to this sector.
Manufacturing is the second largest sector in the region at 19.2% in 2019, followed by agriculture at 8.6%, energy at 6.5% and ICT and materials constituting 5.3% of GDP each. This will change only gradually over time, as agriculture and energy drop in value and ICT, materials and marginally also manufacturing grow in their contribution to the economy. By 2043, manufacturing will constitute 22.2% of SADC’s aggregate economy, materials 7.9%, ICT 6.2% and agriculture 5.2%.
The data on agricultural production and demand in the IFs forecasting platform initializes from data provided on food balances by the Food and Agriculture Organization (FAO). IFs contains data on numerous types of agriculture but aggregates its forecast into crops, meat and fish, presented in million metric tons.
Agricultural demand and supply within SADC has been growing steadily since the early 1990s. Until 2015, domestic agricultural demand and production were more or less equal. From 2015, however, the gap between demand and production in terms of metric tons of agricultural products has been gradually growing with demand outstripping production. In 2019, the agricultural demand in SADC measured at 309 million metric tons while production only measured 296.4 million metric tons, indicating a shortfall of more than 12 million metric tons. Agricultural production was further negatively affected by the COVID-19 pandemic lockdowns in 2020.
In the Current Path forecast, the gap is forecasted to continue to grow over the coming decades as growing populations and per capita incomes lead to higher demand for agricultural products. Agricultural production will remain under pressure in part due to climate change, particularly in water scarce countries such as South Africa, Botswana and Namibia, and yields per hectare will, in the Current Path forecast, grow only marginally, emblematic of Africa’s continued failure to pursue an agricultural revolution. By 2043, SADC will produce approximately 413 million metric tons of agricultural products while demanding 610.9 million metric tons, a nearly 200-million (or 33%) deficit, up from the much smaller 13-million metric ton (or 6%) deficit in 2019.
Between 2019 and 2043, yields per hectare will increase somewhat for less developed countries by between 30% and 35% for the DR Congo, Comoros, Madagascar, Mozambique, Seychelles, Malawi and Botswana. However South Africa’s already underperforming agricultural sector is expected to see a drop in agricultural yields per hectare, as will Mauritius’s highly productive agricultural sector.
While Zambia, Malawi, South Africa and Eswatini were the region’s net food exporters in 2019 (and then only by a small margin), there will not be a single net food exporter in the region by 2043 in the Current Path forecast. The island nations of Mauritius, Seychelles and Comoros will be closest to meeting domestic demand with a marginal deficit in domestic production. Angola and the DR Congo will be the largest food importers in terms of metric tons of product at 37 million metric tons and 51 million metric tons respectively.
There are numerous methodologies and approaches to defining poverty. We measure income poverty and use GDP per capita as a proxy. In 2015, the World Bank adopted the measure of US$1.90 per person a day (in 2011 international prices), also used to measure progress towards the achievement of Sustainable Development Goal 1 of eradicating extreme poverty. To account for extreme poverty in richer countries occurring at slightly higher levels of income than in poor countries, the World Bank introduced three additional poverty lines in 2017:
- US$3.20 for lower middle-income countries
- US$5.50 for upper middle-income countries
- US$22.70 for high-income countries.
However, for the purposes of assessing SADC as a region, we will adopt the lowest extreme poverty line of US$1.90. For a more detailed analysis of appropriate poverty lines in high- and middle-income countries, please refer to the pages focused on these countries specifically.
In the Current Path forecast, it is likely that SADC will continue to suffer from endemic poverty and high levels of inequality. In 2019, extreme poverty levels (i.e. people living on less than US$1.90 per day) were at 51%. The recession associated with the COVID-19 pandemic increased this figure to 53.2%, and it is expected that figures will only return to pre-pandemic levels by 2024. The percentage of poor people will continue to decline in the near future reaching 34% by 2043, but the number of extremely poor people will climb from 180.5 million to 209.8 million by 2043, in keeping with the growth in population in the region.
Extreme poverty will drop most rapidly in Malawi, which will decrease rates of poverty on the US$1.90 line by 51.4 percentage points between 2019 and 2043. Mozambique, the DR Congo, Tanzania and Zimbabwe will also see dramatic drops in poverty (of 20 percentage points or more). Nevertheless, the DR Congo will continue to have high rates of poverty (at approximately 47% in the Current Path forecast in 2043). South Africa and Madagascar will see the smallest drops in extreme poverty at only 2.3% and 6.6% respectively. This is deeply concerning for Madagascar, which comes off a low base and should find it relatively easy to bring down extreme poverty with the right policies. While South Africa’s rate is lower, it is also an upper middle-income country and the most unequal country in the world on several measures; its meagre drop in poverty rates suggests current social unrest linked in large part to extreme poverty and inequality will likely continue long into the future without a dramatic shift in circumstances.
The IFs platform forecasts six types of energy, namely oil, gas, coal, hydro, nuclear, and other renewables. To allow comparisons between different types of energy, the data is converted into billion barrels of oil equivalent. The energy contained in a barrel of oil is approximately 5.8 million British thermal units (MBTUs) or 1 700 kilowatt-hours (kWh) of energy.
In the Current Path forecast, SADC relies, and will likely continue to rely, on fossil fuels well into the future for the lion’s share of its energy needs. As displayed in Chart 11, coal contributed 56.4% to the region’s energy mix in 2019, while oil contributed 33.2% and gas 5%. While the composition will change, SADC is likely to remain fossil fuel-dependent in the Current Path forecast with coal contributing 34%, oil 27.7% and gas 20.3% by 2043.
On the back of natural gas discoveries in South Africa and Mozambique in particular, gas will grow to become a substantial contributor to energy production. Renewable energy will also continue to grow, though at a relatively slow rate. SADC has the continent’s only nuclear power station in Koeberg, South Africa. In the Current Path forecast, it seems that nuclear will stagnate at a negligible contribution to the region’s power needs.
SADC’s future energy mix relies heavily on South Africa’s ability to break free from its coal dependency and Angola’s ability to break free from its oil dependency.
Carbon is released in many ways, but the three most important contributors to greenhouse gases are carbon dioxide (CO2), carbon monoxide (CO) and methane (CH4). Since each has a different molecular weight, IFs uses carbon. Many other sites and calculations use CO2 equivalent.
The Current Path forecast implies a growing carbon footprint for the region into 2043, as displayed in Chart 12. SADC’s carbon emissions are likely to increase from 169 million tons of carbon to 263 million tons by 2043. The vast majority of SADC’s carbon emissions come from Africa’s single biggest carbon emitter, South Africa, which contributed 147 million tons of carbon in 2019, compared to the second biggest contributor in the region, Angola, at 12 million tons. South Africa’s slow economic growth as well as its increasing investment in renewable energy will see its carbon emissions tapering off from 2030 onwards. By 2043, South Africa, in the Current Path forecast, will be emitting 110 million tons of carbon while Angola is likely to emit 45 million tons of carbon.
While the region contributes very little compared to the developed world (especially excluding South Africa), it faces high risks as a result of the impacts of climate change. Climate change is likely to impact the SADC region through the expansion of the Kalahari Desert, increased water security issues, increased temperatures and wildfires, rising sea levels and increases in storm surges.
Sectoral Scenarios for SADC Development Futures
Download to pdfThe Stability scenario represents reasonable but ambitious reductions in risk of regime instability and lower levels of internal conflict. Stability is generally a prerequisite for other aspects of development and this would encourage inflows of foreign direct investment (FDI) and improve business confidence. Better governance through the accountability that follows substantive democracy is modelled separately.
The intervention is explained in here in the thematic part of the website.
Chart 13 shows SADC’s aggregate government security index out of a maximum score of 1 and a minimum of 0. In 2019, the region had an aggregate score of 0.66. The DR Congo performs worst in this regard, with a score of 0.55. Mauritius, Seychelles and Botswana are all the most stable on this measure, each with scores of over 0.8. In the Current Path forecast, the score will gradually improve (ignoring a temporary dip coinciding with instability associated with the COVID-19 pandemic and its impacts). By 2043, this score will improve by approximately 0.05 points representing a general trend towards more stability in the region. This forecast has not, however, considered the recent jihadist insurgency in Mozambique nor the civil unrest in South Africa in mid-2021.
The Stability scenario would have a more dramatic increase in this index reaching levels of 0.82 by 2043, compared to the levels of 0.71 in the Current Path forecast. This is driven primarily by an increase in stability in the DR Congo, an increase of 0.16 index points by 2043, and to a lesser extent in Angola, Malawi, Madagascar and Mozambique. The rest of the region, being relatively peaceful, sees only marginal improvement brought about by the Stability scenario interventions.
As demonstrated in Chart 14, the Stability scenario demonstrates the potential for increased incomes across the region. SADC’s regional GDP per capita increases to US$6 068 by 2043 in this scenario compared to US$5 719 in the Current Path forecast, an increase of US$349. This improvement is driven primarily by increases above US$600 (or 8%) in eSwatini, Angola and Botswana. The effect on comparatively peaceful countries such as Angola and Botswana demonstrates the high impact of increased regional stability of economies throughout SADC.
Increases in GDP per capita are accompanied in this case by a significant number of people leaving extreme poverty, especially in the DR Congo and Madagascar. By 2043, both of these countries see a drop of poverty of over 7.3 percentage points below the Current Path forecast. Overall, the Stability scenario causes a nearly 4-percentage point drop, compared to the Current Path forecast, in poverty rates across the region, equating to 25 million fewer people in extreme poverty, as set out in Chart 15.
This scenario has a dramatic impact on instability-prone countries such as the DR Congo. More peaceful countries benefit as a result of improving perceptions of the region, leading to increased foreign direct investment.
Beyond endemic instability in the DR Congo and Zimbabwe, SADC also faces jihadist insurgencies in Mozambique, which have not been factored into this forecast, the impact of which can lead to billions of dollars of investment and economic losses. Uprisings in South Africa in mid-2021 also threaten the prosperity of peace in the region’s economic powerhouse if not contained.
This section presents the impact of a Demographic scenario that aims to hasten and increase the demographic dividend through reasonable but ambitious reductions in the communicable-disease burden for children under five, the maternal mortality ratio and increased access to modern contraception.
The intervention is explained in here in the thematic part of the website.
Demographers typically differentiate between a first, second and even a third demographic dividend. We focus here on the first dividend, namely the contribution of the size and quality of the labour force to incomes. It refers to a window of opportunity that opens when the ratio of the working-age population (between 15 and 64 years of age) to dependants (children and the elderly) reaches 1.7.
As mentioned in the Current Path section for SADC, the region is home to several countries which are already reaping the benefits of a demographic dividend of greater than 1.7 (Mauritius, Seychelles and South Africa), with two others on the cusp of entering this dividend (Botswana and Lesotho). However, the region is diverse, with both Angola and the DR Congo still near the 1-to-1 ratio of workers to dependants. As a result, and despite the more advanced demographic structures of a few countries in the region, Chart 16 shows that the region’s aggregate demographic dividend was only 1.2 in 2019. The region will only just exceed a dividend of 1.5 by 2043, suggesting that SADC may have to wait decades to reap the benefits of a demographic dividend, even as labour productivity becomes less and less important to modern, mechanised and automated economies.
The Demographic scenario, however, would accelerate this demographic transition on the back of reductions in total fertility (primarily through reductions in child mortality and increased access to contraceptives). In this scenario, as shown in Chart 16, SADC could enter the demographic dividend of 1.7 as a region by 2042, approximately ten years earlier than in the Current Path forecast. This would be driven primarily through accelerated transition in Zimbabwe, Malawi and Madagascar, who would be most dramatically impacted by this scenario.
The infant mortality rate is the number of infant deaths per 1 000 live births and is an important marker of the overall quality of the health system in a country.
A key component of this change will be improvements to basic health care which reduces infant mortality in the region. As demonstrated in Chart 17, the Demographic scenario brings about a greater reduction in deaths per 1 000 live births compared to the Current Path forecast. The Demographic scenario has the potential to reduce infant mortality from 46.2 deaths per 1 000 live births in 2019 to 20.4 deaths by 2043, 4.7 deaths fewer by 2043 compared to the Current Path forecast.
Chart 18 shows a US$219 improvement above the Current Path to SADC’s aggregate GDP per capita as a result of the Demographic scenario by 2043. This scenario will improve GDP per capita from US$5 719 in the Current Path forecast to US$5 938 under the Demographic scenario. Each of eSwatini, Malawi, Zimbabwe and Zambia receive boosts above this average.
As shown in Chart 19, the Demographic scenario has the potential to reduce the poverty rate by 2 percentage points below the Current Path forecast by 2043. This translates to 21.8 million fewer people living in extreme poverty under the Demographic scenario compared to the Current Path forecast by 2043. The Demographic scenario has the biggest impact on Madagascar, which sees an improvement of over 5 percentage points over the Current Path forecast, followed by the DR Congo at just under 3 percentage points by 2043.
This section presents reasonable but ambitious improvements in the Health/WaSH scenario, which include reductions in the mortality rate associated with both communicable diseases (e.g. AIDS, diarrhoea, malaria and respiratory infections) and non-communicable diseases (NCDs) (e.g. diabetes), as well as improvements in access to safe water and better sanitation. The acronym WaSH stands for water, sanitation and hygiene.
The intervention is explained here in the thematic part of the website.
Gains made from the Health/WaSH scenario are relatively modest in SADC compared to other sub-Saharan regions as SADC contains several countries with relatively good endowments of WaSH infrastructure. This scenario sees an improvement in life expectancy reaching 70.29 years by 2043, compared to 69.5 years in the Current Path forecast. South Africa, Lesotho, Zambia, Eswatini and Botswana all see the largest improvements in life expectancy in this scenario—all countries with high levels of endemic diseases.
Infant mortality improves in the Health/WaSH scenario by 2.7 births compared to the Current Path forecast by 2043 (down from 25.1 deaths per 1 000 live births to just over 22 deaths). Improvements are strongest for Madagascar, Angola, Zambia and Lesotho, which all see above-average improvements on this measure. Wealthier countries such as Botswana, Seychelles and Mauritius gain less than others, but surprisingly relatively wealthy South Africa still sees a strong improvement of two fewer deaths per 1000 live births by 2043 for this scenario compared to the Current Path forecast.
The Agriculture scenario represents reasonable but ambitious increases in yields per hectare (reflecting better management and seed and fertilizer technology), increased land under irrigation and reduced loss and waste. Where appropriate, it includes an increase in calorie consumption, reflecting the prioritisation of food self-sufficiency above food exports as a desirable policy objective.
The intervention is explained in here in the thematic part of the website.
The data on yields per hectare (in metric tons) is for crops but does not distinguish between different categories of crops.
Chart 22 demonstrates the aggressive potential improvements of an agricultural revolution in SADC. This scenario has the potential to increase yields per hectare by nearly 63% by 2043 from Current Path levels. Mozambique sees the most aggressive improvement at approximately 114% by 2043 from the Current Path forecast. Countries which are already very productive, specifically Eswatini and Mauritius, have marginal improvements above the Current Path forecast. The Agricultural scenario would raise SADC’s average yields per hectare to levels similar to South Asia in 2019 by as early as 2037, representing an aggressive but realistic possible improvement to yields.
A doubling of yields for several SADC countries, and dramatic improvements in most others, will have a dramatic impact on food security and food independence in the region. As demonstrated in Chart 23, agricultural import dependence (that is net imports as a per cent of demand) could drop to under 4% by 2043 in the Agricultural scenario, as opposed to 33% in the Current Path forecast. Should reductions in population size contemplated in the Demographic scenario be combined with this scenario, SADC could have the potential to become a net food exporter. In this scenario, Comoros, Mozambique, Tanzania and Zambia could become net food exporters by 2043.
While the Agriculture scenario has a limited impact on countries that already have very efficient agricultural sectors (particularly Mauritius, Seychelles, Eswatini and South Africa), it has a remarkable impact on those countries that have much to improve. Tanzania, which becomes a net food exporter under the Agriculture scenario, receives a US$886 increase to its GDP per capita by 2043 compared to the Current Path forecast, followed by an increase for Namibia of US$730 in the same year. Overall, SADC sees an aggregate improvement of US$373 to its GDP by 2043 over the Current Path forecast, as demonstrated in Chart 24.
The Agriculture scenario is most impactful for SADC’s poor countries; the impact on extreme poverty in the region is dramatic, with more than 54 million fewer people in extreme poverty by 2043 compared to 2019, as indicated on Chart 25. This equates to a 9-percentage point drop in poverty rates across the region. Madagascar benefits the most from the Agricultural scenario with 16.7% fewer people living in poverty by 2043 compared to the Current Path forecast. The DR Congo and Tanzania also benefit greatly from the Agricultural scenario with 15- and 10-percentage point drop respectively compared to the Current Path forecast by 2043. The Agricultural scenario can see 54 million fewer people in SADC in poverty by 2043 compared to the Current Path forecast. Getting an agricultural revolution right, even for SADC, thus remains a low hanging fruit which could bring tens of millions of people out of poverty in the region.
The Education scenario represents reasonable but ambitious improved intake, transition and graduation rates from primary to tertiary levels and better quality of education. It also models substantive progress towards gender parity at all levels, additional vocational training at secondary school level and increases in the share of science and engineering graduates.
The intervention is explained in here in the thematic part of the website.
As demonstrated by Chart 26, the Education scenario contemplates improvements to the education system such that SADC would see an aggregate increase of 0.3 years of education to mean total years of education over the Current Path by 2043. The increase would be slightly more noticeable among females. These improvements in the quantity of education would be most drastic for poorer countries, with Tanzania receiving an additional half-year of education under this scenario by 2043.
Importantly, quality of education must also improve with quantity. The Education scenario has the potential to increase primary and secondary average test scores across the region by 5 and 8 percentage points respectively above the Current Path forecast by 2043.
As seen in Chart 28, the Education scenario causes a small but not insignificant improvement for the region in GDP per capita of US$202 over the Current Path by 2043. In this scenario, wealthier countries coming off a higher education base appear to benefit most, demonstrating the potency of a well-educated population in a more advanced economy. Indeed, Seychelles benefits most with an increase of US$741 over the Current Path by 2043, and each eSwatini, Botswana, Namibia, Mauritius, Angola, South Africa, Malawi and Tanzania receive benefits above the region's average.
Chart 29 shows that the region sees a 2.5 percentage point reduction in extreme poverty rates as a result of the Education scenario, compared to the Current Path forecast by 2043. This translates to 16 million fewer people in poverty. Despite receiving smaller GDP per capita benefits than wealthier countries, poorer countries benefit more with respect to extreme poverty rates under the Education scenario, with Zambia, the DR Congo, Tanzania and Madagascar all reducing their extreme poverty rates below the Current Path forecast rate by 3 percentage points by 2043.
The Manufacturing and Transfers scenario represents reasonable but ambitious manufacturing growth through greater investment in the economy, investments in research and development, and promotion of the export of manufactured goods. It is accompanied by an increase in welfare transfers (social grants) to moderate the initial increases in inequality that are typically associated with a manufacturing transition. To this end, the scenario improves tax administration and increases government revenues.
The intervention is explained in here in the thematic part of the website.
Chart 30 should be read with Chart 8 that presents a stacked area graph on the contribution to GDP and size, in billion US$, of the Current Path economy for each of the sectors.
As demonstrated in Chart 30, this scenario contemplates an aggressive investment in the broad manufacturing sector, such that SADC’s aggregate manufacturing sector contribution to GDP increases by approximately 0.7% by 2037 and by approximately 0.3% by 2043, compared to the Current Path forecast. The services sector increases from 2039 onwards as the manufacturing sector slowly tapers off as a more developed, urbanised economy (commensurate with a more industrialised economy) has greater need of and a greater income to spend in the services sector. Other sectors, particularly material, energy and agriculture decline in terms of proportional contribution to GDP as a result of the growing manufacturing and services sector.
South Africa sees the largest nominal growth to its manufacturing sector compared to the Current Path in the Manufacturing/Transfers scenario, with an increased value of US$18.2 billion by 2043, with Angola not far behind. The DR Congo and Tanzania also see significant increases in their manufacturing sectors with values of US$5.7 billion and US$6.8 billion respectively. Proportional dynamics brought about by the Manufacturing/Transfers scenario are more complex, however, as, despite having only marginal nominal increases, Seychelles and Mauritius see 0.5 and 0.2 percentage point increases in the contribution of the manufacturing sector to their GDPs above the Current Path forecast.
To address increases in poverty associated with rapid industrialisation, this scenario also contemplates greater welfare transfers to unskilled workers. Industrialising economies would see welfare transfers drop as a proportion of GDP in the region on both the Current Path forecast and in the Manufacturing/Transfers scenario. The value in terms of billions of dollars would rise in both but more aggressively in the Manufacturing/Transfers scenario, such that by 2043, the region would, in aggregate, spend US$232.9 billion on welfare rather than US$178.1 billion on the Current Path forecast.
The Manufacturing/Transfers scenario has the potential to increase GDP per capita to US$6 103 by 2043, up from US$5 719 in the Current Path forecast for the same year. This is an aggregate increase in GDP per capita of US$384 across the region, as shown in Chart 32.
The Manufacturing/Transfers scenario is likely to see Seychelles, Namibia and Botswana increasing their GDP per capita between US$1 275 and US$1 613 by 2043 over the Current Path forecast. Mozambique benefits the least from the Manufacturing/Transfers scenario, seeing growth of only US$72 over the Current Path forecast by 2043.
This Manufacturing/Transfers scenario has an interesting impact on poverty in the SADC region, in that poverty rates in the region remain relatively static in the short term (until 2034). Poverty rates increase in the short term were it not for welfare transfers, a common occurrence in rapidly industrialising economies as investment into productive capital takes priority over public infrastructure and public services, often benefiting a small capitalist elite over the larger population. By 2043, however, poverty rates drop as jobs are created, the investment blitz abates and greater revenue is extracted from the more productive manufacturing sector to provide public services and infrastructure. By 2043 the region sees a drop of 3 percentage points to the aggregate poverty rate (from 34% in the Current Path forecast to 31% in this scenario). This translates to approximately 21 million fewer people in extreme poverty in the region. Malawi, the DR Congo and Madagascar benefit most in this respect, with reductions of 6%, 5% and 4% respectively.
The Leapfrogging scenario represents reasonable but ambitious adoption of and investment in renewable energy technologies, resulting in better access to electricity in urban and rural areas. The scenario includes accelerated access to mobile and fixed broadband and the adoption of modern technology that improves government efficiency and allows for the more rapid formalisation of the informal sector.
The intervention is explained in here in the thematic part of the website.
Fixed broadband includes cable modem Internet connections, DSL Internet connections of at least 256 KB/s, fibre and other fixed broadband technology connections (such as satellite broadband Internet, ethernet local area networks, fixed-wireless access, wireless local area networks, WiMAX, etc.).
The scenario represents a dramatic acceleration of the roll out of ICT infrastructure, as seen in Chart 34. In 2019, there were only three fixed broadband subscriptions per 100 people in SADC, though even in the Current Path forecast, this rises rapidly to reach 27 connections per 100 people by 2043. However, this figure is reached more than 10 years earlier in SADC in the Leapfrogging scenario, and by 2043 there will be almost 50 fixed broadband subscriptions per 100 people. This would represent an aggressive push across the region, with all SADC states, excluding both the already well-connected Mauritius and Seychelles, boosting the number of subscriptions by at least 20% above the Current Path forecast by 2043, with both Angola and Zambia pushing subscriptions up by more than 50%.
Mobile broadband refers to wireless Internet access delivered through cellular towers to computers and other digital devices.
In 2019, there were 37 mobile broadband subscriptions per 100 people in SADC, a figure which will reach 136 on the Current Path by 2043. This figure is only marginally higher in the Leapfrogging scenario, at 138 subscriptions. In the Leapfrogging scenario, the 100 subscriptions per 100 people figure is reached in 2028, four years earlier than in the Current Path forecast. The DR Congo, Mozambique and Madagascar lag behind slightly in this scenario at between 126 and 133 subscriptions each, but nevertheless achieve higher figures than the Current Path, especially in the early 2030s.
The Leapfrogging scenario sees an aggressive push in electricity access, accelerating improved access across the region dramatically. In 2019, less than 40% of people in SADC had access to electricity, with rural rates below 22%, far lower than urban rates at 62.8%. Smaller countries find it easier to provide this access, with the high-income Seychelles and Mauritius having nearly 100% and 89% access respectively, while Eswatini and even low-income Comoros having rates of 68% and 76% respectively. The small landlocked nation of Lesotho, however, only has 38% access, and the relatively small state of Malawi has only 16% electricity access. Larger countries such as the DR Congo and Madagascar struggle to provide access with less than 25% access in 2019, while South Africa has the most proportional access of the larger countries at 82% in 2019.
The potential impacts of the Leapfrogging scenario are displayed in Chart 36. This scenario contemplates an acceleration in the roll out of renewable energy such that electricity access across SADC is improved from 62.3% of the population in the Current Path forecast to 74% by 2043. The scenario is most aggressive for countries lagging behind, including Malawi which sees an 18-percentage point improvement in access and the DR Congo which sees a 10-percentage point improvement (the sheer size of the country making it difficult to accelerate more aggressively than this).
Chart 37 demonstrates the potential benefit of accelerated ICT and renewable technology roll out in SADC. The Leapfrogging scenario has the potential to increase GDP per capita by US$362 in 2043 over the Current Path forecast, pushing GDP per capita to US$6 081. The countries which benefit most in the Leapfrogging scenario are countries which have the most aggressive increase, or already have higher incomes (as this infrastructure appears to have a multiplicative instead of an additive impact on incomes), or both. Eswatini benefits the most from the Leapfrogging scenario with an improvement of US$807 to GDP per capita by 2043, showing the huge benefit of rolling out this infrastructure in a relatively small country. Despite its low-income status, an aggressive push in Malawi sees the country receiving a US$549 improvement (a 14% boost to GDP per capita) in 2043. Madagascar receives the single biggest proportional boost of 20% or US$602. While receiving comparatively smaller boosts, the wealthier nations of Namibia and Botswana see increases of US$720 and US$480 respectively.
The income benefits from the Leapfrogging scenario also translate directly into poverty reduction. Chart 38 shows a 3.8 percentage point decrease in extreme poverty rates by 2043 compared to the Current Path forecast, implying 23.9 million fewer people in poverty. The Leapfrogging scenario also greatly benefits Madagascar, the DR Congo and Malawi by 2043 with reductions of 13%, 5% and 3% respectively over the Current Path forecast.
The Free Trade scenario represents the impact of the full implementation of the African Continental Free Trade Area (AfCFTA) by 2034 through increases in exports, improved productivity and increased trade and economic freedom.
The intervention is explained in here in the thematic part of the website.
In 2019, SADC maintained an aggregate trade balance of -2.8% of GDP. Only Mauritius and Botswana maintained positive trade balances in 2019, with South Africa having a small proportional deficit, while Lesotho, Mozambique and Malawi maintained a trade deficit of more than 20% of GDP.
In the Current Path forecast, regional trade deficits will likely reach 2019 levels again by 2029 and continue to drop to -4.2% by 2035, before rebounding upwards. In the Free Trade scenario, this minimum trade deficit would be slightly deeper at -4.4% of regional GDP by 2037 and for a few years, but a smaller trade deficit would be maintained for over a decade. In 2033, Mauritius, Seychelles, South Africa, Botswana and Angola would maintain positive trade balances, with all countries in the region (except Malawi) seeing a decrease to their trade deficit of up to 4.2 percentage points.
The Free Trade scenario translates to significant improvements in income across SADC. As seen in Chart 40, regional GDP per capita has the potential to increase from US$5719 in the Current Path forecast to US$6314 under the Free Trade scenario, an increase of US$595 in 2043. Wealthier economies benefit most in the Free Trade scenario, with Seychelles, eSwatini, Namibia, Botswana, South Africa and Mauritius seeing improvements of between US$1 003 and US$1 613. Yet all states in the region benefit from improvements of at least US$200. Malawi benefits significantly from the Free Trade scenario, receiving an US$824 increase above the Current Path forecast, a 20% improvement.
The Free Trade scenario translates to significant reductions in poverty rates across the SADC region. This is a reduction of 7 percentage points or 45 million fewer people in poverty by 2043 compared to the Current Path forecast, shown in Chart 41. In the Free Trade scenario, the number of people living in poverty is reduced from 180.5 million in 2019 to 165.3 million by 2043. While wealthy countries may receive the largest nominal income benefits from the Free Trade scenario, poorer countries see large decreases in poverty, with the DR Congo and Madagascar seeing the largest drop of approximately 12 percentage points over the Current Path forecast in 2043.
The Financial Flows scenario represents a reasonable but ambitious increase in worker remittances and aid flows to poor countries, and an increase in the stock of foreign direct investment (FDI) and additional portfolio investment inflows to middle-income countries. We also reduced outward financial flows to emulate a reduction in illicit financial outflows.
The intervention is explained in here in the thematic part of the website.
Foreign aid as a percentage of GDP is expected to decline in the Current Path forecast from 2019 levels of 2.5% of GDP to 1.8% in 2043. Chart 42 shows that in the Free Trade scenario, foreign aid receipts for the region would increase by 6% by 2043, an increase of 0.1 percentage points. The biggest recipients of aid in the region were low-income countries, with Malawi receiving aid to the value of 24% of its GDP in 2019. High- and middle-income countries receive very little aid.
The Financial Flows scenario would also boost FDI inflows, as shown in Chart 43. FDI inflows as a percentage of GDP into SADC have been trending upwards since the early 1990s, though there have been significant fluctuations in this regard year-on-year. The COVID-19-related economic recession took the 2019 aggregate inflow figure of 2.8% of GDP to only 0.9%, however, a quick rebound is expected with steady growth in the Current Path forecast into the foreseeable future. In 2019, the leaders in FDI inflows in the region were the diverse group of the tax haven of Seychelles (14%) and Mozambique (13%) where large gas discoveries and a small GDP make for large proportional FDI inflows. Comoros and South Africa brought up the rear with less than 2% of GDP, though South Africa’s very large economy means that despite this low proportional ranking it retained the highest nominal FDI inflows in the region. The rankings will remain relatively similar in 2043 in the Current Path forecast, though Mozambique would likely take the first place with 15% of GDP by 2043 and Angola, Eswatini and Botswana could also see significant increases to their proportional FDI inflows.
The Financial Flows scenario would see FDI boosted in the region by approximately 1 percentage point from 3.9% in the Current Path forecast to 5% in 2033. Only Mauritius, Seychelles and Comoros would see improvements of less than 0.3 percentage points by 2043, while Namibia would benefit most with a 2.7 percentage point increase in 2033 and a 1.8 percentage point increase in 2043 above the Current Path forecast.
While remittances are a major source of income across much of Africa, SADC is unusual as a region in that it sees net aggregate outflows of remittances. Whereas Malawi, eSwatini, Comoros, Madagascar, Tanzania, Lesotho and especially Zimbabwe receive net positive remittance inflows (with Zimbabwe receiving over US$2.1 billion in remittances in 2019 by itself), SADC’s other countries see net negative flows. Angola, Mauritius and South Africa saw outflows of US$1 515 million, US$545 million and US$509 million in 2019 respectively. In total in 2019, 0.1% of SADC’s GDP left the region in the form of remittances, and this figure will climb to 0.4% by 2043 in the Current Path forecast.
The Financial Flows scenario would see aggregate remittance outflows in terms of GDP slightly diminished by 2043 (by less than 0.1 percentage points), though US$840 million more will leave the region nominally, a difference due in part to the larger GDP of the countries in this scenario. In this scenario, most SADC countries would see higher inflows proportional to GDP by 2043 compared to the Current Path forecast (by up to 0.6 percentage points higher in Comoros), while Mauritius, Seychelles, Angola, Botswana, Namibia and South Africa would see slightly increased outflows.
Chart 45 shows the impact of the Financial Flows scenario on SADC’s GDP per capita. The Financial Flows scenario would have a modest impact on SADC’s incomes, with an increase of US$126 to the regional GDP by 2043 above the Current Path forecast. Wealthier countries tend to benefit more from this scenario, with the larger nominal FDI inflows a potent stimulant to these economies. High-income country Seychelles benefits most with an US$643 increase, while poorer countries like Comoros, the DR Congo and Mozambique see limited benefits in this scenario, showing the limits of increased aid and remittances.
Reductions in poverty are modest for SADC in the Financial Flows scenario, though despite limited improvements to GDP per capita, poorer countries do see a reduction in poverty thanks to increased aid and remittances. Madagascar, Malawi and the DR Congo all see drops of between 1.5% and 3% in poverty rates by 2043 in this scenario compared to the Current Path forecast.
The Infrastructure scenario represents a reasonable but ambitious increase in infrastructure spending across Africa, focusing on basic infrastructure (roads, water, sanitation, electricity access and ICT) in low-income countries and increasing emphasis on advanced infrastructure (such as ports, airports, railway and electricity generation) in higher-income countries.
Note that health and sanitation infrastructure is included as part of the Health/WaSH scenario and that ICT infrastructure and more rapid uptake of renewables are part of Leapfrogging. The interventions there push directly on outcomes, whereas those modelled in this scenario increase infrastructure spending, indirectly boosting other forms of infrastructure, including that supporting health, sanitation and ICT.
The intervention is explained in here in the thematic part of the website.
As shown in Chart 47, SADC had an aggregate electricity access rate of 39.1% in 2019. This is likely to rise to 62.3% in the Current Path forecast by 2043 but could rise to 66.6% in the Infrastructure scenario. Improvements would be largest in rural areas and in less developed countries. Zambia and Zimbabwe stand to benefit most in this scenario with increases of almost 11 percentage points over the Current Path forecast.
Indicator 9.1.1 in the Sustainable Development Goals refers to the proportion of the rural population who live within 2 km of an all-season road and is captured in the Rural Access Index.
54% of the rural population in SADC had access to an all-season road in 2019. Access is highly correlated with wealth: Seychelles, Botswana, South Africa, Mauritius and Eswatini achieved access rates of 75% in 2019. The sprawling and relatively poorer DR Congo with its equatorial climate and impenetrable forests had the worst access figure at 33% in 2019.
In the Current Path forecast, rates of access should improve across the region to 57% by 2043, though in the Infrastructure scenario, these rates could exceed 58% by this date instead. The scenario specifically targets roads and other basic infrastructure for poorer countries. As such, it is not surprising that countries such as Comoros, Malawi and Eswatini all see increases of more than 3 percentage points to access rates in the scenario above the Current Path forecast. The DR Congo sees a modest improvement of only 0.7 percentage points, demonstrating the difficulty of providing universal basic infrastructure access in such a large and geographically challenging jurisdiction.
Chart 49 displays the impact of the Infrastructure scenario on GDP per capita of SADC and its member states. The Infrastructure scenario sees a modest increase of US$186 to the region’s GDP per capita, increasing the average income from US$5 719 in the Current Path forecast to US$5 906 in this scenario by 2043. eSwatini, Seychelles, Angola and Mauritius benefit most with increases of between US$$273 and US$610, suggesting that investments in advanced infrastructure, such as rail and ports will continue to yield benefits to wealthier countries. However, the proportional top gainers include Zambia, Angola, Malawi, Madagascar and Zimbabwe, which also suggests that getting basic infrastructure right first could have large proportional benefits for poorer countries.
The Infrastructure scenario has the potential to reduce extreme poverty rates in the region by almost 2 percentage points by 2043 compared to the Current Path forecast. Poorer countries such as Zambia, Madagascar and the DR Congo would benefit most in this regard with decreases in poverty of over 2% compared to the Current Path forecast, again showing the importance of basic infrastructure for poorer countries. Wealthier countries see only negligible decreases in poverty as a result of this scenario, demonstrating that advanced infrastructure, like a push on industrialisation, is likely to disproportionately benefit the wealthy.
The Governance scenario represents a reasonable but ambitious improvement in accountability and reduces corruption, and hence improves the quality of service delivery by government.
The intervention is explained in here in the thematic part of the website.
As defined by the World Bank, government effectiveness ‘captures perceptions of the quality of public services, the quality of the civil service and the degree of its independence from political pressures, the quality of policy formulation and implementation, and the credibility of the government’s commitment to such policies’.
In 2019, SADC had a higher government effectiveness quality score of 2, relative to the African average of 1.7, though it remains below the world average of 2.5. Wealthier countries in the region have higher scores, with Mauritius, Botswana, Seychelles, South Africa and Namibia all having scores above the world average. The DR Congo, Comoros, Madagascar, Zimbabwe and Angola had the least effective governments in 2019 on this measure with scores below the continental average.
In the Current Path forecast, SADC would almost reach the 2019 world average of 2.5 by 2043, while in this scenario we simulate a slightly improved governance reality for the region, accelerating the trajectory of improvement from 2023 onwards so that the 2.5 level is reached two years earlier. Relatively effective governments of wealthier countries in the region benefit least, while this scenario sees more significant improvements for governance challenged countries such as the DR Congo and Zimbabwe.
As seen in Chart 52, even marginal improvements to governance on the above measure could lead to respectable income gains for the region. The Governance scenario has the potential to increase GDP per capita from US$5 719 in the Current Path forecast to US$5 863 in the Governance scenario by 2043. This translates to an aggregate improvement of US$144. While receiving small, nominal boosts, Malawi, Angola, the DR Congo and Madagascar receive the best proportional increases to their GDP per capita with improvements of over 3% by 2043 over the Current Path.
The Governance scenario has the potential to reduce extreme poverty rates for the region by almost 1.5 percentage points over the Current Path forecast by 2043. Poorer countries such as Madagascar and the DR Congo would benefit most in this regard with decreases in poverty of over 2% over the Current Path forecast by 2043, again showing the importance of basic infrastructure for poorer countries. Wealthier countries see only negligible decreases in poverty, demonstrating that advanced infrastructure, like a push in industrialisation, is likely to disproportionately benefit the wealthy.
This section presents projections for carbon emissions in the Current Path for SADC and the 11 scenarios. Note that IFs uses carbon equivalents rather than CO2 equivalents.
Chart 54 shows that the scenarios which have the strongest impact on incomes also have the worst impact on carbon emissions. The Free Trade scenario alone will increase SADC’s carbon emissions from a baseline of 169 million tons of carbon in 2019 to 283 million tons by 2043. The Manufacturing/Transfers scenario will increase carbon emissions to 276 million tons by 2043 while the Agriculture and Stability scenarios will likely increase the emissions to 271 million tons each. The Demographic scenario, which contemplates a smaller population in SADC by 2043 than in the Current Path forecast, is the only scenario which results in less carbon emissions (2 million fewer tons per year by 2043).
The Combined Agenda 2063 scenario consists of the combination of all 11 sectoral scenarios presented above, namely the Stability, Demographic, Health/WaSH, Agriculture, Education, Manufacturing/Transfers, Leapfrogging, Free Trade, Financial Flows, Infrastructure and Governance scenarios. The cumulative impact of better education, health, infrastructure, etc means that countries get an additional benefit in the integrated IFs forecasting platform that we refer to as the synergistic effect. Chart 55 presents the contribution of each of these 12 components to GDP per capita in the Combined Agenda 2063 scenario.
Should all of the above-discussed scenarios be implemented simultaneously, SADC could see a substantial increase in incomes by 2043. Instead of achieving incomes of US$5 719 by 2043 in the Current Path forecast, a Combined Agenda 2063 scenario could see SADC reaching incomes of US$9 361 per capita.
As is the case for most regions, trade is the most impactful of the scenarios, represented as the Free Trade scenario. Greater regional and extra regional linkages and the dropping of trade barriers have the potential to greatly increase wealth across the continent. As a relatively wealthy region, the impact of the Free Trade scenario on high- and upper middle-income countries, particularly the large South African economy, could be substantial, though SADC’s many poor but resource rich countries will benefit as well.
SADC is an unusual region in that the Manufacturing/Transfers scenario is the second most impactful. The region has great potential for industrialisation (and in South Africa’s case, reindustrialisation). The Agriculture scenario is the third most impactful, showing the need and potential for an agricultural revolution among SADC’s low-income and lower middle-income member states.
Least impactful are the Health/WaSH, Financial Flows, Governance and Infrastructure scenarios which each contribute less than US$200 to GDP per capita in the region by 2043 above the Current Path forecast. This largely speaks to the fact that SADC, particularly SADC’s largest economy, South Africa, already has relatively good levels of infrastructure, governance quality and FDI flows. Nevertheless, these gains are worth pursuing and are more meaningful proportionally for SADC’s smaller economies. Good governance and basic infrastructure (especially WaSH infrastructure) in particular are arguably prerequisites for more advanced development.
Finally, the synergistic impact of the scenarios (that is the additional impact arising from the multiplicative interaction between the scenarios) is a further US$631. This speaks to the need for integrated and comprehensive development planning and the need to push development across all the discussed sectors and not look for a single magic bullet.
Chart 55 presented a stacked area graph on the contribution of each scenario to GDP per capita as well as the additional benefit or synergistic effect, whereas Chart 56 presents only the GDP per capita in the Current Path forecast and the Combined Agenda 2063 scenario.
As alluded to above, SADC will see a US$3 642 increase in GDP per capita across the region in the Combined Agenda 2063 scenario, a 64% increase from the Current Path forecast by 2043. The biggest proportional gainers will be poorer countries, with Malawi, Madagascar and the DR Congo seeing significant increases of 147%, 122% and 86% respectively.
In the Combined Agenda 2063 scenario, Seychelles remains the highest income country at over US$40 319 GDP per capita, followed by Mauritius with just under US$34 500. Botswana, Eswatini and Namibia would all exceed South Africa’s GDP per capita income by 2038, with Botswana coming in at just under US$30 000 GDP per capita. South Africa would improve from the Current Path forecast of US$15 173 but remain at just under US$18 966 GDP per capita under the Combined Agenda 2063 scenario. Despite great gains, the DR Congo, Mozambique and Madagascar would remain the poorest economies in the region. Malawi, however, which was the second poorest SADC country in 2019, will become the 8th wealthiest (in terms of GDP per capita) by 2043 on the Combined Agenda 2063 scenario with a GDP per capita of just under US$10 000.
The Combined Agenda 2063 scenario would also see extreme poverty rates plummet across the region. By 2043, rates of extreme poverty (using the US$1.90 per day poverty line) would be approximately 9.4% in this scenario compared to 34% in the Current Path forecast. Remarkably, two of SADC’s poorest countries, Madagascar and the DR Congo, will see drops of poverty of 50 and 39 percentage points respectively compared to the Current Path. Extreme poverty could be almost eliminated in Mauritius, Malawi, Zimbabwe and Seychelles, with rates under 1%. South Africa could continue to see stubborn rates of poverty at 11% by 2043, speaking to the endemic structural issues South Africa faces with respect to poverty.
These percentages mean that 155 million fewer people would find themselves in poverty in 2043 if the Combined Agenda 2063 scenario is fully implemented, compared to the Current Path forecast. This is again driven primarily by the DR Congo which will see nearly 69 million people come out of extreme poverty in these scenarios by 2043.
See Chart 8 to view the Current Path forecast of the sectoral composition of the economy.
In the short to medium term, the Combined Agenda 2063 scenario will see SADC’s agricultural sector contributing more as a proportion of GDP compared to the Current Path forecast. Growth in terms of proportion of GDP in this sector would peak under the Combined Agenda 2063 scenario in 2033 contributing an additional 1 percentage point above the Current Path forecast and then taper off in the long term.
Services will continue to dominate SADC’s economy and will grow at an exponential rate both in terms of value added and contribution to GDP, accelerating into the long term. This is consistent with economies becoming more advanced and service dependent, as well as due to urbanisation and the continued growth of the urban service industries. The sector could contribute well over US$1 trillion more to SADC’s economy by 2043 than in the Current Path forecast.
Manufacturing will be the second biggest nominal contributor to GDP by 2043 as SADC industrialises (or reindustrialises in the case of South Africa), contributing US$353.2 billion more to SADC’s GDP than in the Current Path forecast, though its contribution as a proportion of GDP will diminish in light of the growing services economy.
ICT will be the only sector besides services to grow as a proportion of GDP in the Combined Agenda 2063 scenario by 2043, though its nominal contribution will be US$116.7 billion more than in the Current Path forecast.
The energy sector would see the biggest proportional drop in contribution to GDP in the Combined Agenda 2063 scenario, yet it will still contribute US$18.9 billion more to SADC’s GDP than in the Current Path forecast.
SADC is expected to see a tremendous increase in the aggregate size of its economy under the Combined Agenda 2063 scenario. In the Combined Agenda 2063 scenario, SADC is likely to have an economy of US$3 873.8 billion, as opposed to US$2 146.2 billion in the Current Path forecast, an 81% increase by 2043.
Despite seeing quite modest results in GDP growth in the above-discussed scenarios, South Africa will remain the largest economy, but by a much smaller margin when compared to 2019. It is likely to have an economy valued at US$1 041 billion in 2043 (as opposed to US$733.7 billion in the Current Path forecast), followed by Angola (US$877 billion, as opposed to US$433.3 billion), Tanzania (US$514.9 billion, as opposed to US$258 billion) and the DR Congo (US$413.1 billion, as opposed to US$182.8 billion). Seychelles would remain a wealthy but small economy at only US$3.1 billion. The largest proportional increase would be seen in Madagascar, which could nearly triple the size of its economy compared to the Current Path forecast, followed by Malawi and the DR Congo which both more than double the size of their economies.
The scenarios discussed above imply aggressive acceleration of development and thus unsurprisingly are accompanied by a significant increase in contribution of carbon emissions. If the scenarios are combined into the Combined Agenda 2063 scenario, SADC will generate 344 million tons of carbon per year by 2043, as opposed to 263 million in the Current Path forecast, a 31% increase. As in the Current Path, South Africa will remain the worst contributor and, while its carbon emissions will be tapering down, in both the Current Path forecast and Combined Agenda 2063 scenarios, emissions will be 5 million tons higher per year in the Combined Agenda 2063 scenario compared to the Current Path forecast by 2043.
Page information
Contact at AFI team is Alize le Roux
This entry was last updated on 28 May 2026 using IFs v7.63.
Donors and sponsors


Reuse our work
- All visualizations, data, and text produced by African Futures are completely open access under the Creative Commons BY license. You have the permission to use, distribute, and reproduce these in any medium, provided the source and authors are credited.
- The data produced by third parties and made available by African Futures is subject to the license terms from the original third-party authors. We will always indicate the original source of the data in our documentation, so you should always check the license of any such third-party data before use and redistribution.
- All of our charts can be embedded in any site.
Cite this research
Alize le Roux (2026) SADC Development Futures. Published online at futures.issafrica.org. Retrieved from https://futures.issafrica.org/geographic/recs/sadc/ [Online Resource] Updated 28 May 2026.