 10 Financial Flows.
Feedback welcome
Our aim is to use the best data to inform our analysis. See our Technical page for information on the IFs forecasting platform. We appreciate your help and references for improvements via our feedback form.
This theme on Africa’s financial flows explores the key inward monetary flows shaping Africa’s development, namely official development assistance (aid), foreign direct investment (FDI) and remittances, while also assessing the scale and impact of illicit financial flows. The analysis considers the size and impact of these flows at the regional and country level. A Financial Flows scenario is modeled subsequently to assess the potential impact of ambitious increases in aid, FDI, remittances and portfolio investments to Africa and a reduction in illicit financial flows.
For more information about the International Futures (IFs) modelling platform used for the forecasts and scenarios, please visit the Technical page.
Summary
This theme begins with an introductory overview of the history and current context of financial flows to and from Africa.
- Africa faces a significant financing gap estimated at US$402 billion by 2030. Domestic revenue mobilisation is critical but constrained by narrow tax bases, informality and corruption, contributing to a low tax-to-GDP ratio of 16%—well below global peers.
- Historically dominated by aid, financial flows to Africa have shifted, with gross remittances now surpassing both aid and FDI as the largest source of external capital.
Subsequently, the first half of this report provides assessments of the current status and likely future development in a business-as-usual forecast (Current Path) for each type of financial flow.
- In 2023, Africa received approximately US$90 billion in gross remittances, with US$20 billion being intra-African flows; North and West Africa were the top receiving regions.
- Remittances play a crucial role by funding current account deficits, supporting foreign exchange reserves and enlarging the tax base through consumption. Despite these benefits, there is limited evidence that remittances contribute to robust economic growth.
- Given its high levels of poverty and instability, Africa remains the largest recipient of development aid amongst comparable regions, far exceeding South Asia and South America. Aid reform means that most aid now goes to low-income African countries, where it constitutes a significant share of GDP and government revenue. Recent aid cuts, especially by the United States under the Trump administration, threaten critical sectors in fragile African states, notably health services.
- Despite Africa's vast opportunities and economic potential, foreign direct investment (FDI) inflows remain modest, both in absolute terms and as a share of global investment, accounting for just 3.5% in 2022, although they are gradually improving.
- Intra-African FDI is growing, driven by countries like South Africa, Kenya and Nigeria, mainly in IT, finance and manufacturing. It is critical for regional integration and job creation, with the AfCFTA expected to boost this trend further.
- Illicit financial flows (IFFs) from Africa, estimated at up to US$89 billion annually, significantly undermine the continent’s development by depriving governments of vital tax revenues needed for health, education and poverty reduction.
The second half of this theme report then models a positive Financial Flows scenario and its impacts on the economy and poverty. This scenario explores the extent to which larger external inflows to Africa, through FDI, aid, remittances and a reduction in illicit financial flows, can drive economic growth and reduce poverty, with remittances playing a powerful role in alleviating poverty.
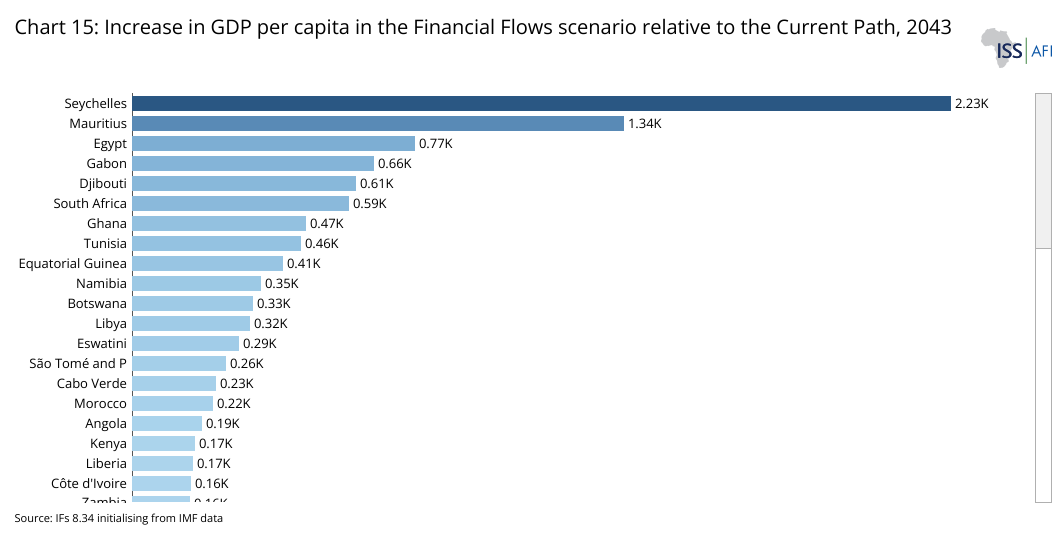
- As a result, Africa’s GDP would be US$243.5 billion larger in 2043 compared with the business-as-usual scenario, and average GDP per capita will increase by US$160, with Seychelles (the only high-income country in Africa) and several upper-middle- and lower-middle-income countries doing exceptionally well.
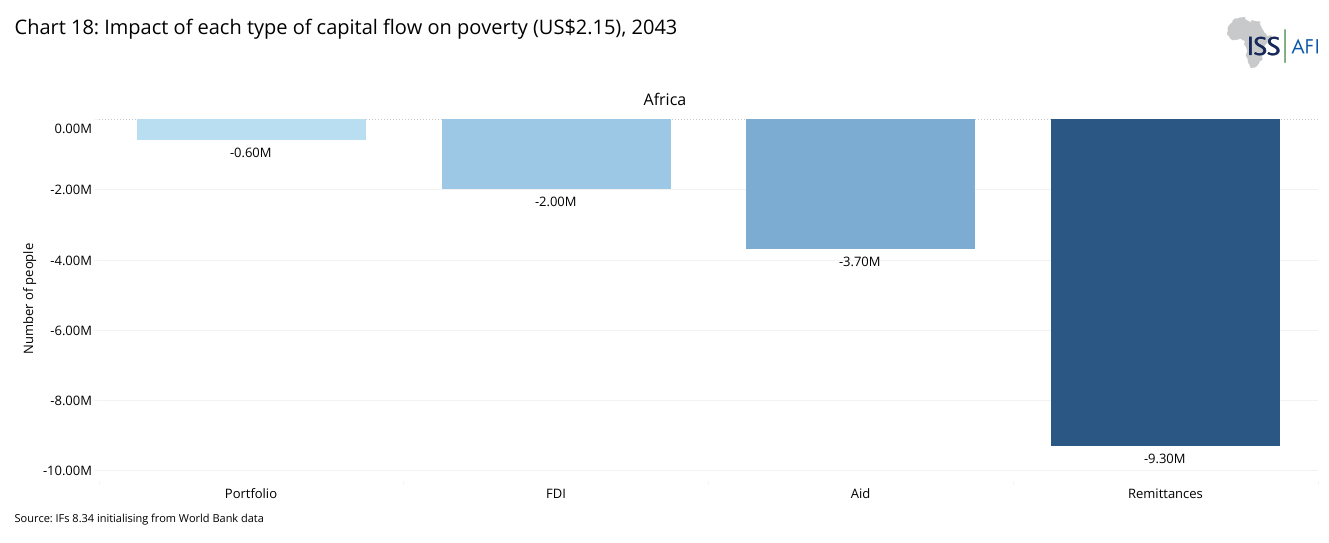
- The Financial Flows scenario will decrease poverty rates by about one percentage point below the Current Path. However, without effective domestic policies in place, the potential impact of these inflows will be constrained.
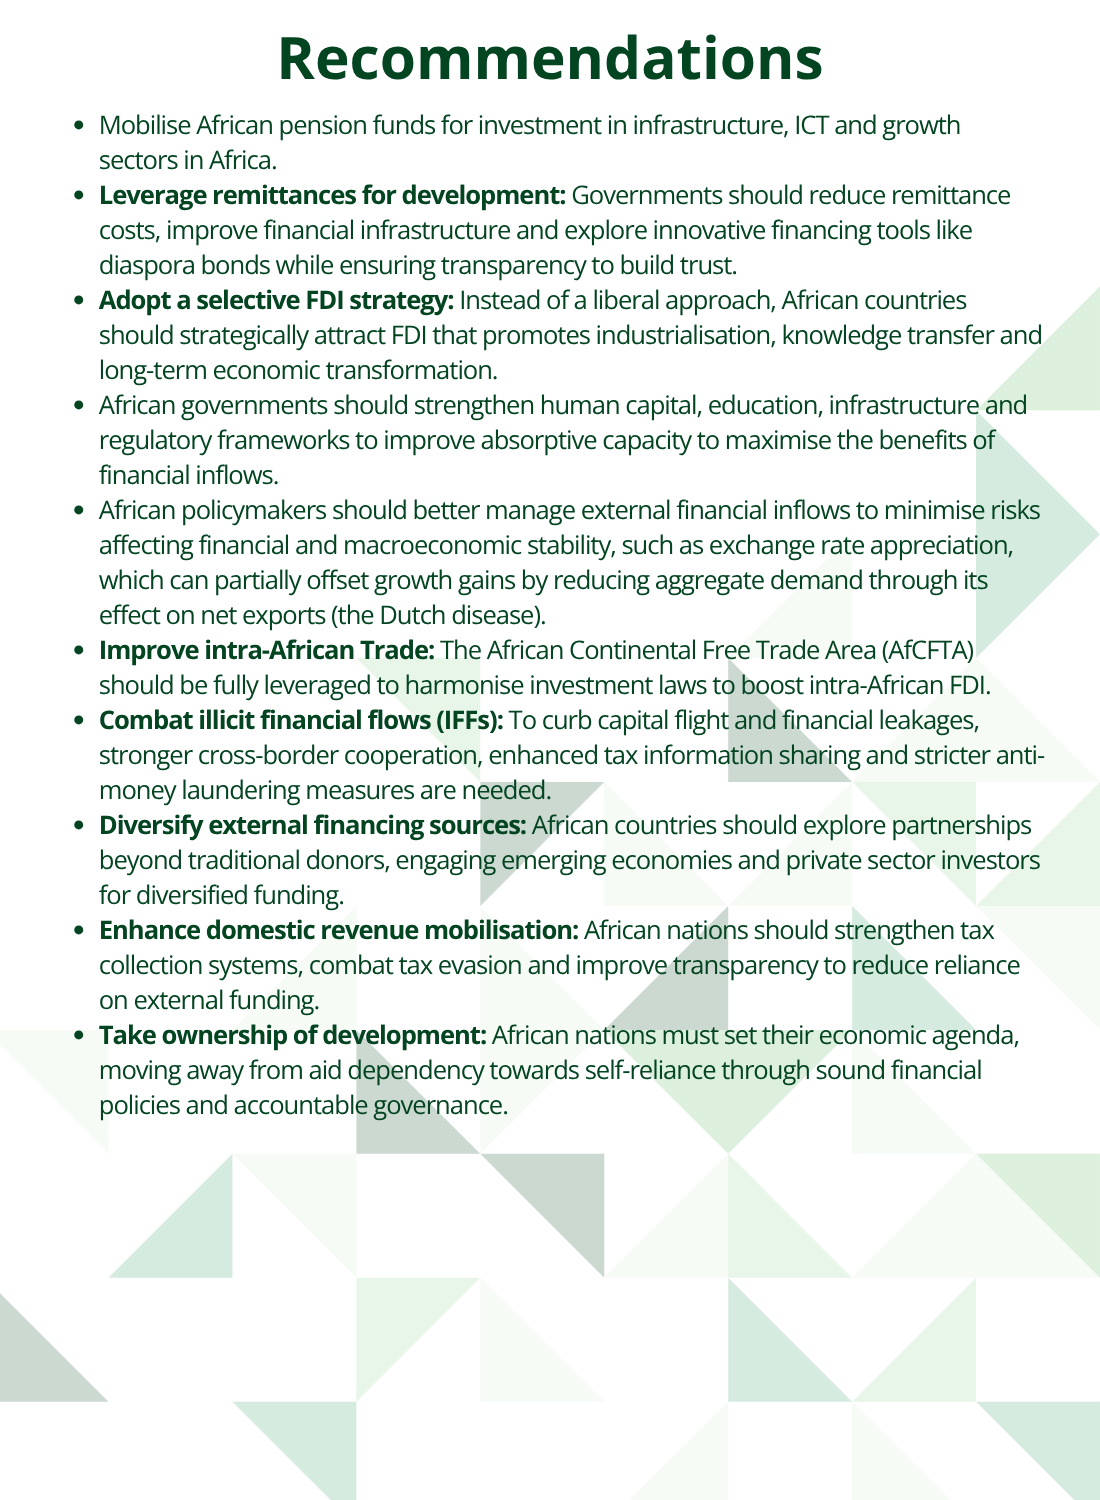
The theme ends with a conclusion, offering recommendations to African policymakers. While external financial flows—remittances, aid and FDI—offer important support for Africa’s development, they cannot substitute for strong domestic institutions and revenue mobilisation. To maximise their impact, African countries must improve governance, enhance absorptive capacity and actively combat illicit financial flows. Strategic partnerships and policy alignment are essential to ensure that these financial flows contribute to inclusive and sustainable growth.
All charts for Financial Flows.
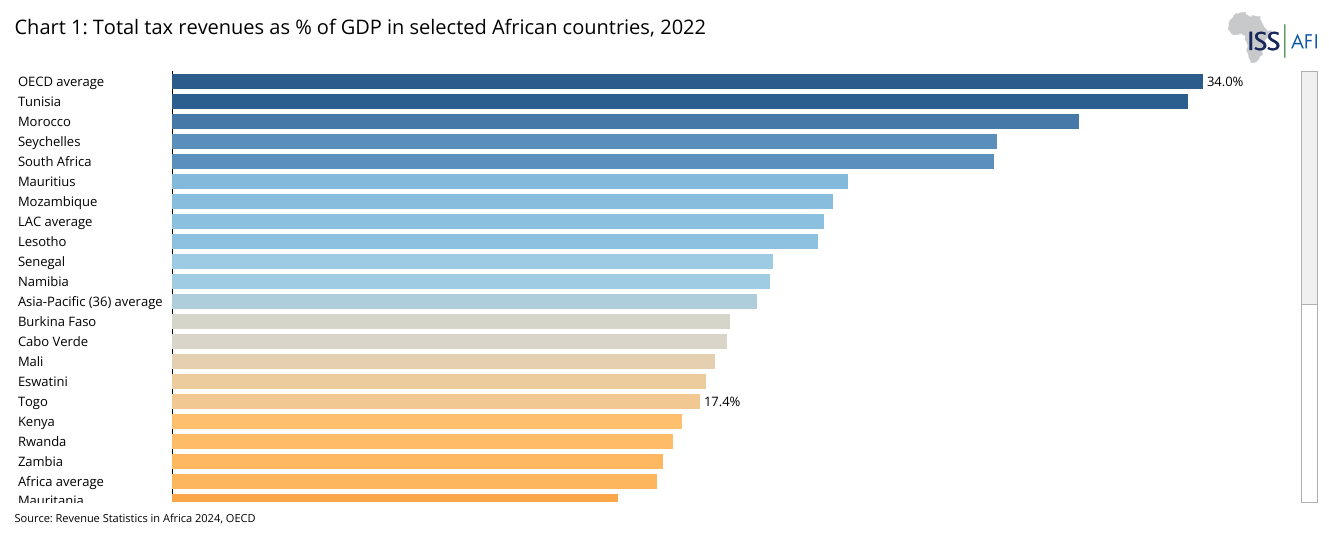
- Chart 1: Total tax revenues as % of GDP in selected African countries, 2022
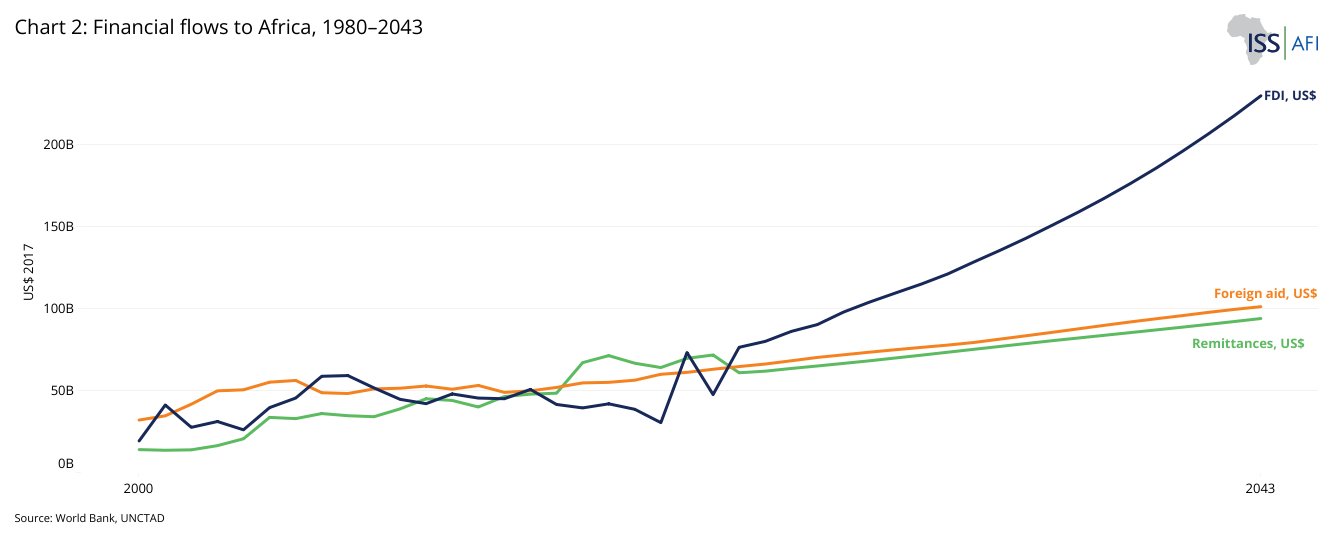
- Chart 2: Financial flows to Africa, 2000–2043
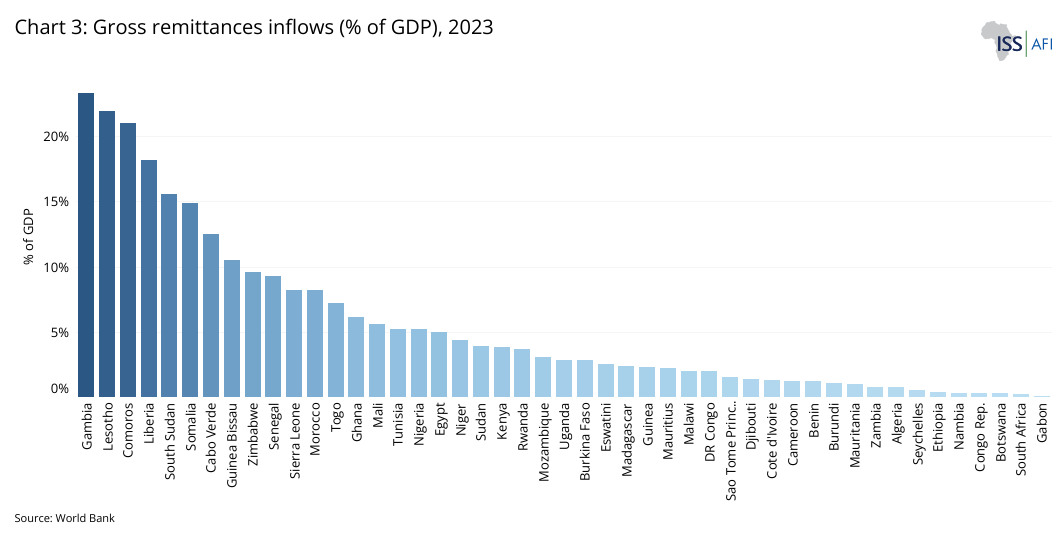
- Chart 3: Gross remittances inflows (% of GDP), 2023
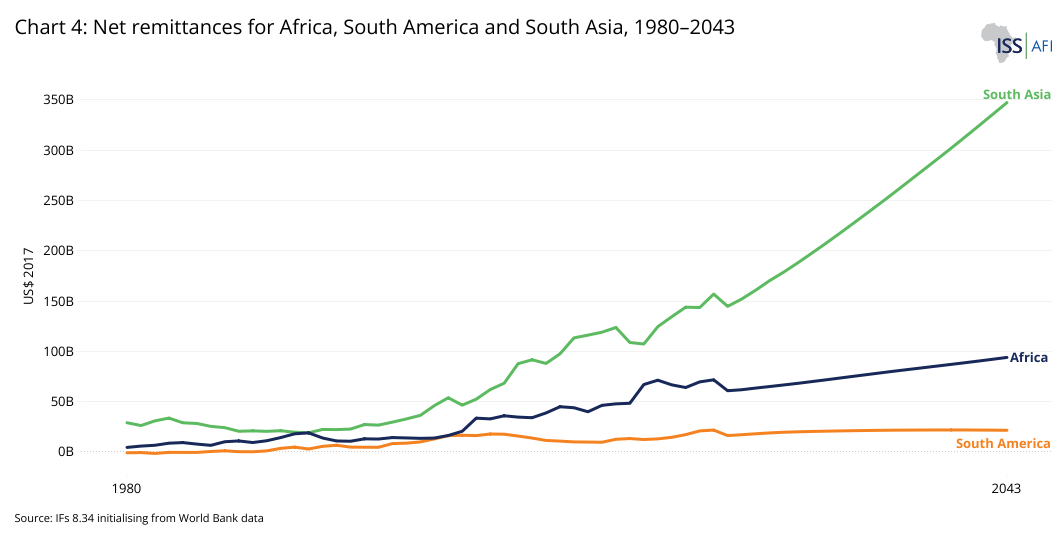
- Chart 4: Net remittances for Africa, South America and South Asia, 1980–2043
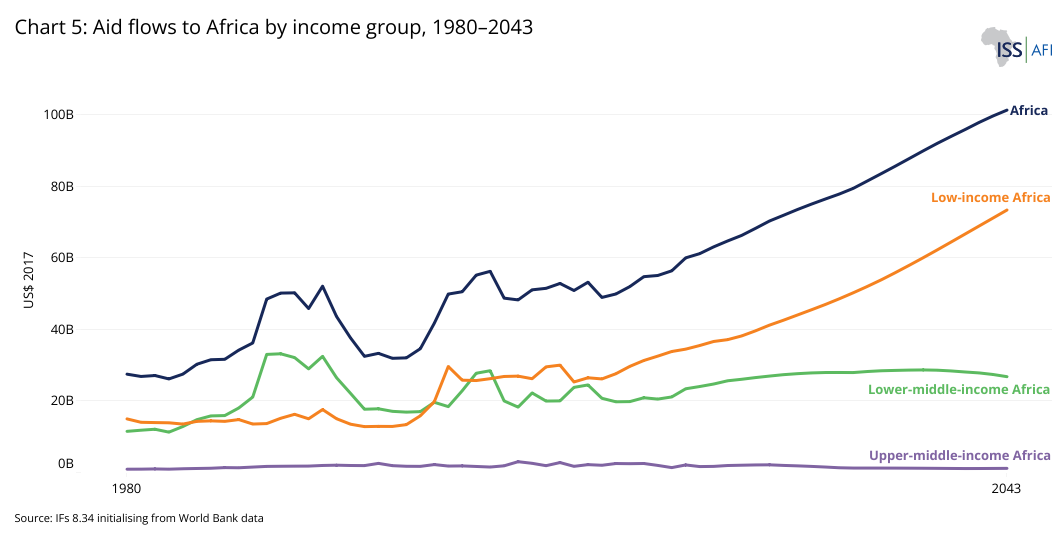
- Chart 5: Aid flows to Africa by income group, 1980–2043
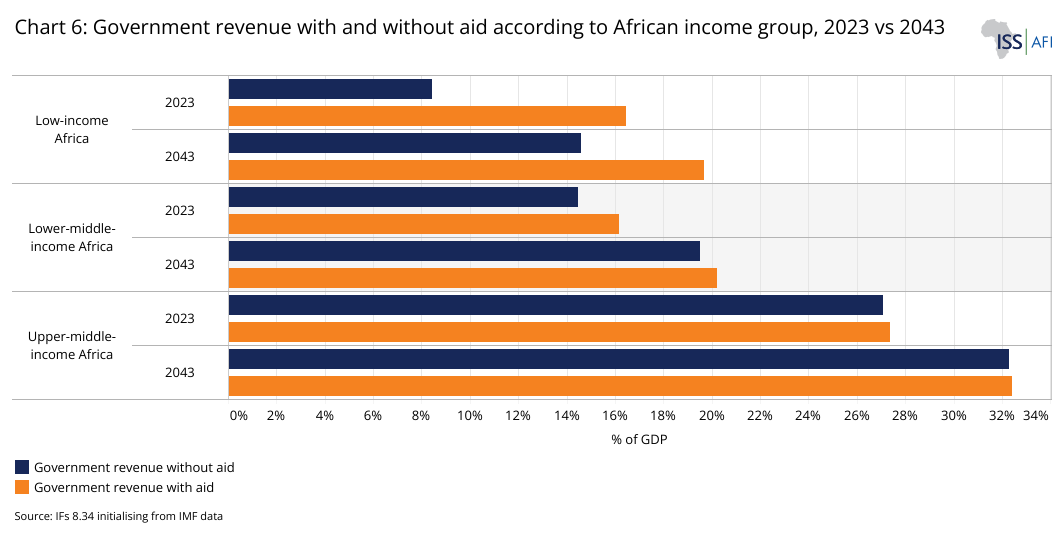
- Chart 6: Government revenue as % of GDP with and without aid according to income grouping in Africa, 2023 and 2043
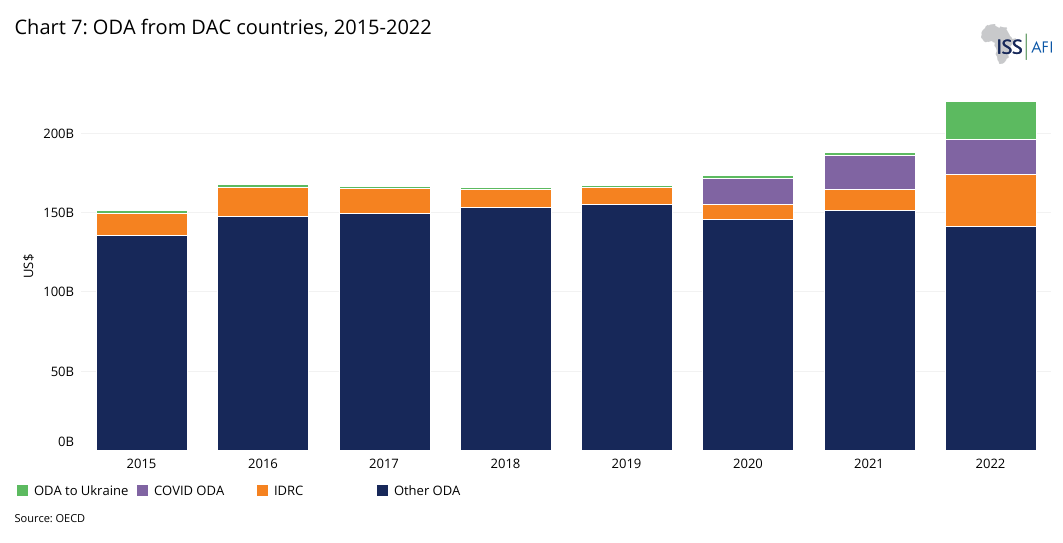
- Chart 7: ODA from DAC countries, 2015-2022
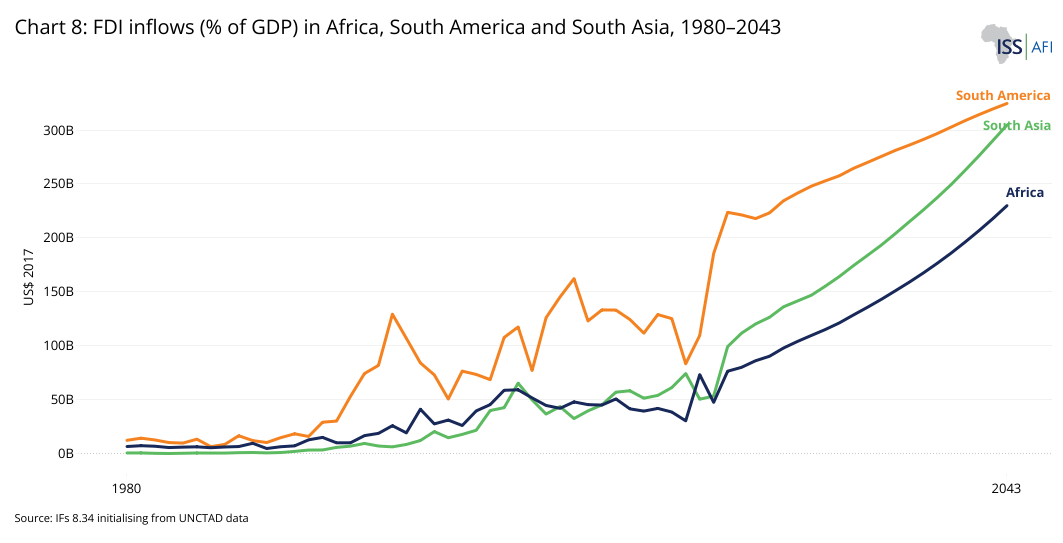
- Chart 8: FDI inflows (% of GDP) into Africa, South America and South Asia, 1980–2043
- Chart 9: Chinese, EU28 and US investment flows to Africa, 2003–2023
- Chart 10: Top 5 FDI sources in Africa, by jobs created
- Chart 11: Share (%) of intra-regional FDI in total FDI stocks by developing region
- Chart 12: Sources of illicit financial flows in Africa
- Chart 13: Financial Flows scenario
- Chart 14: History and forecast of Current Path and scenarios on Aid, Remittances and FDI
- Chart 15: Increase in GDP per capita in the Financial Flows scenario relative to the Current Path, 2043
- Chart 16: Net exports in the Current Path and Financial Flows scenario, 2020-2043
- Chart 17: Impact of individual capital flows on Africa's GDP per capita vs Current Path, 2043
- Chart 18: Impact of each type of capital flow on poverty (US$2.15), 2043
- Chart 19: Summary of recommendations


Various themes on this website present Africa’s tremendous opportunities and significant challenges. Boasting abundant natural resources, a dynamic, youthful population and expanding markets, the continent has the potential to become an essential player in the global economy.
Yet, in spite of its potential, Africa struggles to achieve sustainable economic and social transformation. Growth rates have not kept pace with population expansion, resulting in only modest improvements in per capita GDP. Economic diversification remains limited, with many countries still dependent on low-productivity sectors such as agriculture and low-skilled services for growth and employment. For example, according to the African Development Bank, economic growth in Africa is expected to increase from a modest 3.8% in 2024 to 4.2% in 2025. Although these rates make the continent the second-fastest-growing region globally, they are significantly below what is required to provide jobs, rapidly grow incomes or reduce poverty when considering Africa’s development challenges.
To drive meaningful structural transformation, Africa must prioritise strategic investments in agriculture, health, education, energy, technology, innovation and infrastructure. However, funding these critical investments presents a significant challenge, with an estimated annual financing gap of about US$402 billion until 2030. Domestic revenue mobilisation—primarily through taxation and other government revenue-generating mechanisms—is key to meeting these pressing development needs.
Tax revenues account for over 75% of Africa's domestically generated revenues. However, most African nations face structural and systemic challenges, including narrow tax bases, widespread informal economic activities, weak tax administration systems, tax evasion and corruption that limit their ability to mobilise sufficient domestic revenue. Chart 1 depicts total tax revenues as a percentage of gross domestic product (GDP) in selected African countries for 2022. At 16% of GDP, Africa’s average tax-to-GDP ratio is lower than other regions such as Asia-Pacific (19.1%), Latin America and the Caribbean (LAC) (21.5%) and the Organisation for Cooperation and Development (OECD) countries (34%).
Africa needs external financial resources to complement its domestic revenue shortfall, support sustainable growth and reduce its high poverty level. International capital inflows—including foreign direct investment (FDI), portfolio investments, remittances and development aid—play a pivotal role in shaping Africa's growth and development path. The continent also needs to stem its illicit financial outflows (IFFs).
This theme examines how these financial resources can help bridge funding gaps, drive industrialisation and advance development while addressing the risks of dependency and mismanagement. Examining both the opportunities and challenges associated with external capital inflows provides a perspective on the role of financial flows in unlocking Africa's development potential. The Combined scenario then compares the impact of financial inflows with the contribution from other sectors, such as investments in health and education, allowing for a comparative perspective.
Two developing regions (South Asia and South America) are used to compare Africa's historical and future progress in attracting external financial inflows.
Chart 2 shows financial flows to Africa as a percentage of GDP from 1980 to 2043. While aid accounted for the largest share of capital inflows into Africa in the 1980s, the structural composition of financial flows to Africa has, over time, shifted towards a greater role for private flows in the form of FDI. Yet it is remittances, i.e., money from migrants who move abroad for work and often send funds back to support their families and communities, that have become Africa's largest source of external financial inflows. Since 2007, gross international remittances inflows into Africa have surpassed official development assistance levels and recently overtook FDI. Furthermore, the data from the IMF in Chart 2 probably underestimates remittance flows since a significant share occurs via informal channels, which may represent between 35% and 75% of formal channels, implying that total remittance flows to Africa may exceed FDI and aid combined. This trend will likely continue as remittance volumes grow, driven by the recovery of the job markets in the high-income countries following the onset of the COVID-19 pandemic, and the significant migration pressures resulting from demographic changes, income disparities and climate change.
As African Development Bank President Akinwumi A. Adesina pointed out, ‘The African diaspora has become the largest financier of Africa! And it is not debt; it is 100% gifts or grants, a new form of concessional financing that is the key for livelihood security for millions of Africans.’
However, as we examine below, the challenge is that remittances' contribution to economic growth is typically modest.
Remittances to Africa
Download to pdfIn 2023, approximately 184 million people worldwide were migrants, driven by economic opportunities, conflict, violence and other factors. Regardless of income level, many countries simultaneously serve as places of origin, transit and destination for migrants. In 2023, global remittances reached around US$656 billion (in current dollars), comparable to the GDP of countries such as Poland, Argentina and Belgium.
Remittances are a crucial lifeline for millions of people across the globe, particularly in developing countries. About 75% of remittances are used to put food on the table and cover medical expenses, school fees or housing expenses. In times of crisis, migrant workers will likely send more money home to cover crop losses or family emergencies. In over 60 countries globally, remittances are equivalent to 3% or more of the Gross Domestic Product (GDP), with small and fragile states relying even more heavily on these inflows.
Destination countries can also significantly benefit from migrants whose skills and qualifications align with their labour market needs, especially when migrants are permitted and able to work in roles that match their expertise. However, there are also associated costs, including the strain on public services, support for affected citizens and challenges related to social integration.
Capturing data on remittance flows is challenging, as they mostly occur through informal channels via diaspora networks and are driven by the size of the migrant population, for which data is often also unreliable. According to the United Nations, the African diaspora worldwide is around 150 million people, with the majority residing in the Americas (North, Central, South America and the Caribbean). However, the community responsible for remittances is much smaller, coming from recent migrants. According to the World Migration Report 2024, about 21 million Africans live in another African country. Approximately 19.5 million Africans reside outside continent, most in Europe, an increase on the estimate of 17 million in 2015.
In 2023, the gross remittance inflows into Africa were about US$90 billion in current US dollars (or about US$72.7 billion in constant 2017 dollars, generally used on this website), with about US$20 billion (or US$16 billion in constant 2017 dollars) being intra-Africa flows. North Africa received the largest share of remittances, followed by West Africa. Chart 3 presents gross remittances inflows as a percentage of GDP.
When measured as a percentage of GDP, the top remittance-receiving countries in Africa—each exceeding 15% of GDP—are Gambia, Lesotho, Comoros, Liberia, and Somalia. In contrast, countries like South Africa, Botswana, Gabon, Equatorial Guinea, Côte d’Ivoire, Libya, Seychelles and Mauritius are net remittance senders, meaning they send more remittances than they receive.
Many of these nations host large populations of migrants from other African countries. For example, Côte d’Ivoire’s relatively strong economy attracts immigrants from neighbouring countries such as Burkina Faso, Mali and Guinea. Migrants account for between 10% and 25% of the population of Côte d’Ivoire. In 2023, remittances outflows from Côte d’Ivoire represented about 2% of its GDP, while remittances inflows accounted for just 1.3% of GDP. Only South Africa, which has more than double Côte d'Ivoire's population and a much bigger economy, has more migrants.
Chart 3 shows that about 20 African countries receive remittances amounting to at least 3% of their GDP, highlighting the importance of remittances for funding the current account and fiscal shortfalls. At the regional level, remittances accounted for an average of 7.6% of GDP in West Africa, 6.8% in East Africa, 4.4% in North Africa, 3.7% in Southern Africa and 1.4% in Central Africa in 2023. In absolute terms, Egypt is Africa's largest destination of remittances, primarily from Egyptian workers living in Gulf countries.
Diaspora finance has many benefits. It can, for example, be mobilised for infrastructure development. Countries with large diaspora populations can tap into the funds within that community to invest locally by benefiting from a patriotic dividend, but they must then maintain a strong and positive relationship with the diaspora community.
Ethiopia crossed a vital hurdle when, in 2011, it floated a diaspora bond to help fund the Grand Ethiopian Renaissance Dam. The Kenyan diaspora sent an estimated US$3 billion in remittances back home in 2019. In 2020, Kenya followed up on its successful 2009 diaspora bond by introducing a licensed investment fund for overseas citizens to invest in development projects.
Nigeria raised US$300 million from its first-ever diaspora bond for infrastructure projects in 2017. In July 2024, the Nigerian Government announced plans to issue a US$500 million diaspora bond to finance its budget and support infrastructure and other development needs from Nigerians living abroad. In February 2025, Kenya’s Treasury also stated that it looked at diaspora bonds as a series of instruments to help tackle the country’s debt crisis, with gross government debt increasing from 34% of GDP in 2007 to 70% in 2024.
In addition to their potential to contribute to poverty reduction by supporting household income, remittance inflows serve as a stable source of foreign exchange, playing a crucial role in supporting macroeconomic stability. They bolster foreign exchange reserves, enabling countries to finance imports. Also, through value-added taxes, remittances can enlarge the tax base and increase government revenue.
Remittances are less volatile than FDI and other cross-border capital flows. Their substantial size relative to other foreign exchange sources, countercyclical nature and indirect support for public finances can also enhance a country’s sovereign credit ratings and debt repayment capacity. Additionally, future remittance inflows can be leveraged as collateral to reduce the cost of international borrowing, but it all depends on what use remittances are put to.
Remittances can also reduce gender disparities. According to studies cited in a recent World Bank report, in Morocco, families with low educational backgrounds who receive remittances are more likely to delay their daughters' entry into the workforce, allowing them to remain in school longer.
However, remittances can also produce unintended adverse effects without appropriate domestic policies. Some studies suggest that economies heavily reliant on remittances risk falling into a "remittance trap," where growth remains low. Since remittances are primarily used for household consumption, rising demand for goods and services can increase prices. The influx of foreign currency and inflation can make exports less competitive, leading to a decline in export production—a phenomenon known as Dutch disease. Resources then flow away from industries producing tradable (export) products that face international competition toward those that serve the domestic market. The result is a decline in the number of better-paid, high-skill jobs, typical in the traded sector, and an increase in low-skill, poorly paid jobs in the non-traded sector.
This shift in the labour market encourages higher-skilled workers to emigrate for better-paying jobs. Meanwhile, the cost of living for most families rises along with domestic prices, and the loss in competitiveness means that more products must be imported, hurting economic growth. This, in turn, increases the incentive for family members to emigrate so that they can send money home to help relatives shoulder the burden of the higher cost of living.
In effect, countries heavily reliant on remittances may become dependent on exporting labour instead of goods produced domestically by that labour.
Remittances can also have significant political and economic side effects, such as large inflows that allow governments of the recipient country to be less responsive to the needs of society. The reasoning is that families which receive remittances are somewhat insulated from economic shocks and are less motivated to demand change from their governments; the government, in turn, feels less obligated to be accountable to its citizens. Politicians may welcome remittance inflows that reduce public scrutiny and political pressure and enable them to continue spending on things that will win them popular support and re-election.
Despite its positive consumption effects, there is little evidence linking remittances to robust economic growth and no examples of countries that experienced remittance-led growth in the literature.
Chart 4 depicts net remittances as a percentage of GDP for Africa compared to South America and South Asia, the two most comparable regions. It includes a forecast to 2043.
Net remittances to Africa (inflows minus outflows) will likely continue to increase. On the Current Path, Africa will likely remain a net remittance recipient for the foreseeable future, with net inflows estimated at approximately US$94 billion by 2043. If informal remittances represent 75% of formal transactions, the total African remittance market could reach US$500 billion by 2035. While the absolute amount of remittance flows to Africa will continue to increase, remittance as a share of GDP will decline from 2.3% to about 1.5% by 2043, as reflected in Chart 4.
Foreign Aid to Africa
Download to pdfForeign aid has played an essential role in shaping Africa's development, with billions of dollars allocated to the continent each year. Often promoted as a crucial tool to combat poverty, tackle health crises and stimulate economic growth, its impact is contested.
The historical trends of aid to Africa, shown in Chart 5 based on income groups from 1980 with a forecast to 2043, reflect an interesting geopolitical story. After an initial period of benign aid neglect following African independence, the Cold War sustained ever-higher levels of aid until the collapse of the Soviet Union in 1989, which effectively robbed Africa of its strategic relevance but provided an opportunity to reform aid away from strategic considerations towards the development needs of poor countries, allowing the aid community (then essentially consisting of OECD countries) to also pay greater attention to aid effectiveness and value for money.
The United Nations Millennium Summit in New York in 2000 was followed by the Report of the Commission for Africa, released in 2005, and the European Consensus on Development, also issued that year. Collectively, these efforts paved the way for the 2005 World Summit in New York, which called for increased aid transfers to achieve the eight Millennium Development Goals (MDGs) set in 2000. The 2005 Paris Declaration on Aid Effectiveness subsequently outlined five fundamental principles (developing country ownership, alignment to developing country objectives, harmonisation among donors, results-based aid and mutual accountability) that established a critical framework that included both donor and recipient countries.
The 2011 Busan Partnership for Effective Development Cooperation expanded the Paris Agreement by establishing, for the first time, an internationally agreed framework for development cooperation, which included traditional and new donors from the Global South, civil society organisations and private philanthropy. Donors agreed to allow aid recipients to use aid to procure from the cheapest suppliers rather than those prescribed by donors, and measures that harmonised aid modalities among donor countries.
Some years later, the 2015 Addis Ababa Action Agenda (AAAA) was crafted following the Third International Conference on Financing for Development hosted in Ethiopia, which would see aid to Africa’s low-income countries increase to almost 8% of their GDP in 2019 (pre-pandemic level), equating to about 35% of government revenue. In contrast, aid has dropped to about 6% of government revenue in lower-middle-income African countries and below 1% in upper-middle-income African countries, illustrating the progress made in shifting aid to where the need is greatest.
The environment for progress towards the SDG targets and goals on development aid had deteriorated significantly at the time of the Fourth International Conference on Financing for Development (FfD4), held in Seville, Spain, from 30 June to 3 July 2025. Yet the 42-page Compromiso de Sevilla that emerged from the meeting was surprisingly upbeat, given the disbandment of USAID and announcements by key donors such as the UK and Germany to prioritise defence spending at the expense of development assistance. Amongst others, the Compromiso de Sevilla encouraged multilateral development banks to triple their lending capacity, promoted blended finance strategies to attract private sector investment in infrastructure, health and climate adaptation, supported initiatives to reform credit ratings methodologies to better reflect the realities of developing nations, sought to address debt relief, and reform of the international financial architecture. Partners are also committed to assist developing countries towards robust domestic tax systems, with a target of achieving tax revenues equivalent to at least 15% of GDP and the outcomes document supported a potential UN framework convention on international tax cooperation
The Compromiso de Sevilla, therefore, marks a strategic shift from traditional development aid models toward investment-driven development, emphasising the importance of sustainable and equitable economic growth. Shortly thereafter, the US revealed plans to supercharge the US International Development Finance Corporation (DFC), America's premier development finance institution. The proposals include a much larger DFC, including raising its total exposure, or maximum portfolio size, from US$60 billion to US$250 billion. The only problem is that poor countries do not attract much investment and have little to trade beyond low-value commodities, which are often subject to wild fluctuations on the commodity markets. The proposals on DFC would now be allowed to also invest in high-income countries, watering down its original focus on developing countries.
Comparatively, aid flows to Africa are above those to South America and South Asia in various metrics: in absolute amounts, percentage of GDP, percentage of government revenue and on a per capita basis. Africa receives more aid than any other developing region, driven by factors such as its colonial legacy, debt burden, high poverty levels, recurrent conflicts, instability, humanitarian crises and geopolitical interests.
From 2000 to 2023, Africa received a cumulative amount of US$1.3 trillion in aid. South Asia received US$332 billion, while South America received only US$96 billion over the same period. Globally, foreign aid hit a record high of US$161.2 billion in 2020, a 3.5% increase in real terms from 2019. On the Current Path forecast, aid to Africa is projected to fall from 2.4% of GDP in 2023 (US$60 billion) to 1.6% by 2043 (US$95 billion). The increase in the dollar amount is not due to an increase in the portion of GNI allocation from donors (which steadily declines), but rather a function of economic growth in the OECD countries. In addition, more aid from China, India, and the Persian Gulf States (from Saudi Arabia and the UAE in particular) will fill some of the gaps left by USAID and other traditional donors, although these countries are more cautious, commercial, and focused on blended finance.
On the Current Path, aid inflows into Africa will reach US$101 billion in 2043, up from US$64.7 billion in 2023. As a percentage of Africa’s GDP, aid will decline from 2.4% of GDP in 2023 to 1.6% by 2043, compared with 0.1% of GDP for South Asia and 0.03% in South America. Similarly, aid as a share of government revenue in Africa will decrease from 12.5% in 2023 to around 7% in 2043.
Chart 6 presents Government revenue with and without aid according to income grouping for 2023 (as announced by the World Bank for 2024-2025), including a forecast to 2043. It illustrates how aid now targets poorer, low- and lower-middle-income countries. While foreign assistance remains the primary source of external finance for low-income countries, the role of ODA is less critical for lower-middle- and upper-middle-income countries, which now rely more on FDI. In 2023, government revenues in Africa’s low-income countries averaged 8.4% of GDP without aid, compared to 16.4% with aid. For lower-middle-income countries, government revenue stood at 14.5% of GDP without aid, and 16.2% with aid.
By 2043, aid will almost entirely shift to the remaining low-income countries. Consequently, government revenues in low-income countries will reach 14.6% of GDP without aid, and 19.7% with aid.
Despite its crucial role in supporting government budgets in poor African countries, foreign aid is controversial. Critics argue that aid has had a limited long-term impact, often fostering dependency rather than promoting self-reliance. Prolonged reliance on external assistance weakens local governance and reduces the government’s incentive to mobilise domestic resources. Corruption and mismanagement further exacerbate these challenges, with aid funds sometimes diverted from their intended purposes.
Aid can also have unintended consequences, such as disrupting local economies by flooding markets with free or subsidised goods, undermining local producers. For instance, while food aid programs address immediate hunger, they often harm local agriculture by creating unfair competition.
Yet it is clear that aid to sub-Saharan Africa contributes to economic growth and poverty reduction, although usually in modest measure and conditional on sound domestic policies and institutions. There is evidence of significant successes – for instance, aid-funded programs have expanded schooling, reduced disease and lifted millions out of extreme poverty. There are also many instances where aid failed to catalyse growth or was siphoned off, leaving inequalities unchanged or even worsened. The consensus is that aid is neither a panacea nor a plague: it can be effective, but its success hinges on context. Areas of ongoing debate revolve around optimising aid allocation, improving conditionality (or “selectivity”) and ensuring the sharing of its benefits in society.
Ethiopia under Meles Zenawi is an example of the efficient use of foreign aid to drive economic growth and development. His tenure (1991–2012) saw significant improvements in infrastructure, agriculture, education and healthcare, supported by well-managed aid programs. Unlike many African countries, Prime Minister Zenawi negotiated aid terms strategically to retain control over its development agenda. The government emphasised that aid should complement, not replace, domestic efforts. In this way, Meles ensured alignment between donor priorities and Ethiopia’s needs. The Ethiopian experience is that aid can contribute to social and economic transformation with strong leadership, strategic planning and local ownership. Bill Gates, an avowed pro-market fundamentalist who has apposed aid in favour of market-based solutions, stated the following in testimony to the US Congress in June 2025:
People in global health argue about a lot of things, but here’s one thing everyone agrees on: Health aid saves lives. It has helped cut the number of children who die each year by more than half since 2000. The number used to be more than 9 million a year; now it’s fewer than 5 million. That’s incontrovertible.
Recent empirical studies suggest that aid’s effectiveness in promoting economic growth and reducing infant mortality is conditional on domestic policy and institutional capacity. With appropriate policies and genuine donor intentions, aid can be more than a temporary relief measure—it can catalyse and sustain inclusive economic growth. This was evident in the Marshall Plan in Europe after World War II and the vast amounts of aid and technology transferred to South Korea and Japan. In these cases, recipient governments used aid strategically, focusing on key sectors such as manufacturing and transportation while striving for financial independence. By contrast, similar strategic use of aid has been rare in Africa. Scholars agree that improving governance and accountability in Africa is pivotal for aid to contribute to robust growth, poverty reduction and equitable development. To that end donors and African governments continually refine how assistance is delivered and used, to realise its potential as a catalyst for development rather than a source of dependency or division.
Cutting off aid, as announced by the US administration under President Trump, as well as reductions in aid announced by the United Kingdom and the Netherlands shortly therafter will worsen the lives of millions of Africans. Most US support went to the health sector and it accounted for a big chunk of the national budget in countries such as Somalia, the Central African Republic, Burundi and Liberia, among others.
The absolute amount of aid flows to Africa could be significantly larger (US$197 billion) if developed countries met the target of 0.7% of their Gross National Income (GNI). But that is unlikely to happen anytime soon, even though climate change and geopolitical conflicts/tension may prompt a reassessment of these contributions and boost aid. Chart 7 reflects ODA from DAC countries between 2015 and 2022. Over the last decade, aid as a share of donors’ national income (ODA/GNI) has barely risen, from 0.31% in 2010 to 0.37% in 2023. As of 2023, the OECD reports indicate that only Norway (1.09%), Luxembourg (0.99%), Sweden (0.91%), Germany (0.79%) and Denmark (0.74%) have met this goal.
In recent years, aid for COVID-19, Ukraine and spending on refugee costs in donor countries have absorbed all increases in aid spending from DAC countries (Chart 7).
At around €20 billion, the EU’s assistance to Africa is the most critical single aid flow globally and accounts for around 46% of global aid to Africa, the bulk of which goes to sub-Saharan Africa. The reasons are apparent: Europe is connected with Africa through shared histories, languages and physical proximity. The dramatic ODA cuts from the US to Africa in 2025 mean that aid from Europe will become even more important.
For its 2021–2027 Multiannual Financial Framework, the EU is merging several development instruments into a consolidated body, the Development and International Cooperation Instrument, which will receive €70.8 billion (US$83.6 billion). Of this amount, €26.0 billion (US$30.7 billion) will go to sub-Saharan Africa. The 2022 EU–AU Summit subsequently approved partnerships in five key areas: green transition, digital transformation, sustainable growth and jobs, peace and governance, and migration and mobility. The EU’s intent to move beyond a donor–recipient relationship to achieve a more mature engagement was first captured in the 2007 Joint Africa–EU Strategy (JAES).
However, recent domestic budgetary pressures have led many European countries, like Germany, the second-largest ODA provider in absolute terms, to cut more than €4.8 billion (US$5.3 billion) in development and humanitarian assistance between 2022 and 2025. Similarly, France reduced its 2024–2025 ODA budget by over US$1 billion, while the United Kingdom (UK) cut more than US$900 million after almost £1 billion (US$1.28 billion) was diverted to housing asylum-seekers in the country. In 2025, the UK government also announced that it would reduce its development cooperation budget from 0.5% of GNI to 0.3% by 2027 to accommodate an increase in defence spending. Similarly, in 2024, the Netherlands' Minister for International Trade and Development Aid announced a planned annual reduction of €2.4 billion in Official Development Assistance (ODA) by 2027. Finland will also cut its ODA budget by 25% between 2024 and 2027, while Belgium has announced a similar 25% reduction over five years, starting in 2024.
Smaller donors, including Denmark, Ireland, Italy and Norway, have opted to increase or maintain their funding levels.
Early in 2025, US President Donald Trump abruptly halted all foreign development assistance funding for 90 days, with limited exemptions for vital humanitarian aid, while determining whether to continue, modify or cancel future assistance. The decision marked a stark departure from previous aid policies, justified by the second Trump administration's claim that US foreign assistance was misaligned with American interests and global stability.
On the one hand, the Trump administration’s decisions on aid present other partners, Europe and China in particular, with significant opportunities to advance their influence in Africa. However, the dramatic reductions will severely affect Africa. Before the 2025 cuts, annual US aid allocations for Africa typically fluctuated between US$7.7 billion and US$8.3 billion in inflation-adjusted dollars from FY2012 to FY2022. While not a traditional aid donor in the OECD sense, China remains a significant source of concessional loans, infrastructure financing and grants through its Belt and Road Initiative. Its focus areas are transport, energy, digital infrastructure and medical aid.
In 2018, China established the China International Development Cooperation Agency (CIDCA) to coordinate aid and, early in 2021, published a White Paper on development cooperation that outlines its support for endogenous growth. However, unlike most Western countries, Chinese development assistance is managed by several government departments, with the bulk handled by the Ministry of Commerce.
Sources differ widely in their calculations of the amount of Chinese money that qualifies as aid instead of loans, estimated at US$3.01 billion in 2023. The bigger portion likely went to Africa, but how much of this would qualify as aid is unclear.
Most of the aid (roughly 70%) from the US supported health programs, particularly HIV/AIDS relief, followed by efforts to combat malaria. US assistance has also sought to foster agricultural development and economic growth; strengthen peace and security; improve access and social service delivery; and strengthen democracy, human rights and governance. Broadly consistent with funding trends over the past decade, health programs comprised approximately 73% of the FY2024 proposal for Africa.
Ironically, the previous Biden administration had sought to revitalise ties with Africa. However, it has maintained and sharpened the focus to counter China and Russia’s growing influence on the continent. Its 2022 Strategy towards sub-Saharan Africa sought to reframe Africa’s importance to US national security interests.
Foreign Direct Investment
Download to pdfFDI is an investment made with the ultimate objective of possessing a lasting management interest (usually a minimum threshold of 10% of voting stock) in a firm operating in a country different from the investor's. FDI is typically discussed as flows and stocks. FDI flows refer to the value of cross-border transactions related to direct investment over a specific period, such as a year, and are often characterised by large year-to-year volatility.
FDI stocks refer to the total accumulated value of foreign investments in a country at a given time. It represents the cumulative value of all past FDI inflows, minus any disinvestments, and indicates a country's overall level of foreign investment, or long-term attractiveness. In 2023, Africa had an FDI stock of about 42% of GDP, significantly below South America’s 74% but almost double that of South Asia (22%). According to UNCTAD, EU28 (i.e. including the UK) members own 40-45% of that stock, given Europe’s colonial history, and Asian countries around 25%, reflecting recent increases.
In contrast to FDI flows and stocks, short-term financial flows such as international portfolio investments are generally motivated by profitable hit-and-run strategies or the boom-and-bust cycles of economies. FDI is more stable, with several benefits for the recipient economies. It promises better technology, new production processes and managerial know-how to domestic firms, that generate productivity gains and create jobs. FDI can help recipient developing countries develop more sophisticated industries, such as electronics (Costa Rica) and automotive manufacturing (South Africa and Morocco).
These well-advertised gains from FDI have triggered competition between countries to attract FDI through policies such as tax reduction and subsidies. In 2022, 66 countries adopted 146 investment policy measures, and about 70% were favourable to FDI. In regional terms, Asian countries continued to be the most active reformers, followed by Africa, Latin America, and the Caribbean. For example, Algeria implemented a law on free trade zones, which exempts activities in these zones from most taxes, duties and levies, except for taxes related to vehicles and passenger cars. Ethiopia implemented an income tax exemption for investors who could not obtain a business licence or expansion permit for up to six years. It allowed investors to import capital goods, construction materials and motor vehicles free from customs duties. It also announced the partial privatisation of Ethio Telecom, its public telecommunication operator. The process is open to foreign investors.
However, only attracting FDI is insufficient to generate robust economic growth and development. Domestic factors, generally discussed as the absorptive capacity of recipient countries, are often a determining factor in translating FDI inflows into growth and development. Typically, productivity spillovers of FDI can materialise only in an environment that promotes quality education, sound and credible institutions, good infrastructure, and well-functioning local financial markets, among others. Weaknesses in these areas undermine the ability of local firms to adopt advanced technologies and reduce their capacity to respond to the challenges associated with FDI inflows, such as intense competition, which can crowd out domestic investment.
With appropriate domestic conditions and policies, Asian countries such as China, South Korea, Singapore, Malaysia and Taiwan successfully directed FDI into strategic sectors that aligned with their development objectives. For example, South Korea focused on export-oriented FDI, which has the most significant potential for creating jobs and generating foreign exchange. Specific sectors were restricted from FDI due to concerns over national security, the protection of nascent domestic industries (such as steel, automotive and shipbuilding), and the preservation of economic sovereignty. In sectors open to FDI, joint ventures with domestically owned firms were encouraged to optimise technology transfer and managerial expertise. Thus, in the mid-1980s, only 5% of transnational corporations’ subsidiaries in South Korea were wholly under foreign ownership. The corresponding numbers were 50% in Mexico and 60% in Brazil. South Korea improved domestic conditions to maximise technology spillovers, and transnational corporations ready to transfer technology were selected against those unprepared. In addition, screening policies were used to ensure that FDI does not hurt domestic investments or firms. Due to appropriate domestic policies, China has also successfully used FDI to stimulate domestic investments.
A 2000 study by UNCTAD (and others) finds strong ‘crowding in’ of domestic investments by FDI in Asia, while ‘crowding out’ of domestic investments by FDI is the norm in Latin America and many African countries. The potential of FDI to unlock growth and development and reduce poverty in Africa is, therefore, not straightforward — several prerequisites and factors should be in place or considered.
Given that Africa is rich in cheap labour and natural resources, the continent should offer a high marginal return on capital, to ensure that it is an attractive destination for international investment. For instance, from 2006 to 2011, the global average rate of return on FDI was 7%, with 5.1% for developed economies and a higher 11.4% for Africa. However, actual FDI inflows to Africa remains disproportionately low, having increased from roughly US$2 billion per year in the 1980s to about US$18 billion in the early 2000s. Inflows peaked at US$98 billion in 2013 during the commodity boom, declined and then rebounded in 2021 to US$83 billion (3% of GDP) — a significant jump after dropping to less than half that in 2020. Despite Africa's vast opportunities, economic potential, FDI inflows remain low, both in absolute terms and as a share of global investment (at 3.5% in 2022), although steadily improving.
This phenomenon exemplifies the “Lucas Paradox”, highlighting why capital does not flow more readily to developing regions despite economic theory suggesting otherwise.
The irony is that Africa has billions of dollars in pension funds that should flow to the convenient. In May 2025, the Managing Director of the Ghana Stock Exchange, told a panel discussion hosted by the African Development Bank that Ghana and Nigeria, alone had pension funds amounting to almost US$40 billion but that more than 90% was “parked” in government securities ‘because there are no available investment opportunities. He added that in 2024, Africans invested US$125 billion in cryptocurrency assets, with Nigeria alone contributing over $65 billion, making it the second-largest cryptocurrency investor base globally after India.
FDI flows to Africa depend on several factors, including market size and growth, human capital costs and skills, infrastructure quality and quantity, economic and political uncertainty, administrative procedures, corruption, investment promotion efforts, investment incentives and regulations, international treaties and guarantees, and the availability of natural resources.
The need is significant. The African Development Bank estimates that Africa needs between US$130 billion and US$170 billion annually to close its infrastructure gap.
Chart 8 shows the trends in FDI inflows (% of GDP) into Africa compared to South America and South Asia from 1980 to 2023 and includes a forecast to 2043. While FDI flows to Africa as a percentage of GDP have been consistently below those to South America, they remain slightly above those to South Asia. In the Current Path, FDI inflows into Africa will increase across the forecast horizon to reach 3.6% of GDP in 2043. Still, they will remain below those to South America yet above those to South Asia in the same year. However, in absolute numbers South America received almost four times more FDI inflows than Africa and South Asia twelve times.
Most African countries received significant amounts of FDI only from the 1990s, following the waves of liberalisation and privatisation brought about by the Washington Consensus, much of that in the form of investments in resource extraction.
Although the business climate in many African countries is now similar to that of developing countries elsewhere, the continent continues to suffer from a bad image as an investment destination. As UNCTAD outlines:
Too often, many people outside the continent refer to Africa as a place of civil unrest, war, poverty, and mounting problems. This has given many investors a negative image of the continent. While this image reflects the reality in some countries, it is not true for all African countries.
Analysing inward FDI in Africa as a percentage of Gross Fixed Capital Formation (GFCF) provides valuable insights into the role of foreign investment in domestic capital formation. A higher share of FDI in GFCF indicates a greater reliance on foreign capital for new infrastructure, machinery and equipment investments. In 2023, FDI accounted for 8.5% of Africa’s total GFCF, down from its peak of 14.7% in 2007. However, this average conceals significant variations across countries. In nations such as Namibia, Angola, the Republic of the Congo, Mozambique and Somalia, FDI inflows represent a much larger share of capital formation than most countries in South America and South Asia, highlighting the importance of FDI in Africa compared to domestic sources. In many African countries FDI is, therefore, an essential supplement to domestic investment, helping fund new projects and infrastructure.
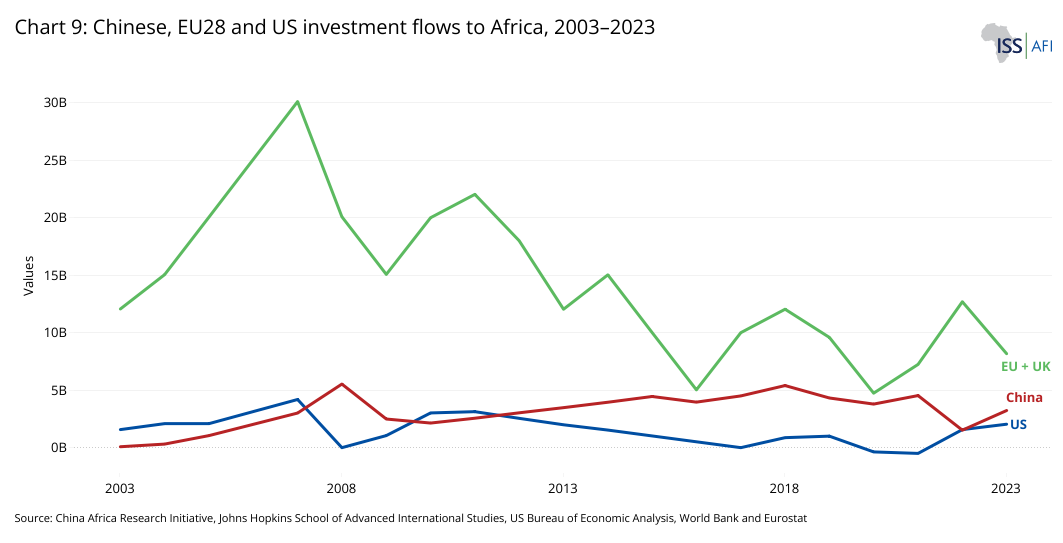
Chart 9 illustrates the contrasting trends in investment flows to Africa from China, the US and the EU28, i.e. including the UK, from 2003 to 2023. Europe was the leading investor in Africa throughout the period. The US saw a relative decline (even becoming a net dis-investor in some recent years), and China emerged rapidly to become a major investor by 2010. Since then, Chinese FDI to Africa has consistently outpaced the US's, as American investment flows have generally declined. Chinese FDI grew significantly from just US$75 million in 2003 to a peak of US$4.5 billion in 2021 but dropped to US$1.5 billion in 2022. The highest annual inflow occurred in 2008, reaching $5.5 billion, mainly due to the Industrial and Commercial Bank of China (ICBC) acquiring a 20% stake in Standard Bank of South Africa. The UAE, India, Turkey, Japan, Russia and Brazil have also emerged as important investors in Africa, most of which focus on infrastructure, services and consumer markets. Their flows are not included in Chart 9.
The recent uptick in US foreign direct investment flows to Africa is unlikely to continue under the second Trump administration. It follows a decade of decline until the US-Africa Leaders’ Summit in December 2022 (under the Biden administration) that saw the US commit to investing US$55 billion in Africa through 2025. At the time, US$15 billion was supposed to be in trade and investment commitments, deals and partnerships that advanced key priorities in sustainable energy, health systems, agribusiness, digital connectivity, infrastructure and finance.
Historically, US investments were heavily concentrated in the oil and gas sector, but recent trends show a significant shift toward non-mining industries. The decline in US investment in African mining is mainly due to a strategic shift toward domestic energy sources. The top destinations for these investments are South Africa, Mauritius and Nigeria, which have emerged as attractive hubs for US investors.
Europe still has the most extensive stock of FDI in Africa, accounting for about 40-45% of total FDI stocks in Africa, led by the UK, France and the Netherlands. European FDI has also been primarily focused on oil and gas and other extractive sectors, and generally in low-value-added, low-tech activities.
Several efforts have been made to change this trajectory. In February 2022, the European and African Unions hosted their sixth joint summit since 2000, marking a “reset” in Europe–Africa relations. Initially scheduled for 2020 but delayed due to COVID-19, the summit was accompanied by significant announcements, including the EU’s pledge to allocate half of its €300 billion Global Gateway Initiative, aimed at global development between 2021 and 2027, to Africa, combining public finance and private investment.
Recent European energy investments in Africa have followed, such as natural gas projects in Senegal and increased interest in solar and green hydrogen in northern and southern Africa. A 2022 survey covering 85% of German companies operating in Africa found that 43% planned to expand their activities, particularly in green hydrogen and liquefied natural gas.
Rather than the US or Europe, it is China that is leading in new investment in Africa, leveraging its best-known early infrastructure project, the TAZARA railway line, built to reduce landlocked Zambia’s economic dependence on export infrastructure linkages through Zimbabwe and South Africa. The single-track line of approximately 1 860 km connected Zambia to the port of Dar es Salaam in Tanzania. It was completed in 1975 at a cost of about US$406 million (US$2.67 billion today) — provided as an interest-free loan to Zambia and Tanzania. The expenditures of TAZARA and other solidarity projects greatly burdened the Chinese economy, with foreign aid amounting to 5.9% of total government spending from 1971 to 1975, peaking at 6.9% in 1973.
The partnership between China and Africa has progressively deepened since establishing the Forum on China–Africa Cooperation in 2000. Today, the forum serves as a vehicle for strategic collaboration in trade, investment and finance and a basis for diplomatic and political cooperation. With the ongoing privatisation of the Chinese economy, the number of Chinese firms active on the continent increases yearly. In 2017, McKinsey estimated that more than 10 000 privately owned small Chinese companies operate in Africa, several times the number registered with the Ministry of Commerce in Beijing.
China’s demand for commodities, its positive balance of payments and ability to extend credit, and its coordinated effort to export its surplus construction capacity (which eventually culminated in the Belt and Road Initiative) have greatly benefited Africa, despite the continent not initially included in the scheme. China has since become Africa's biggest single-country financer and builder of infrastructure projects, spending about US$11.5 billion annually from 2012 to 2018. Recent indications are that investments are shifting from physical infrastructure to digital industries.
As China seeks to expand its influence and secure vital resources, Africa will continue to play a pivotal role in its strategy. However, to fully benefit from Chinese investments, African nations must ensure that they align with local and regional priorities, prioritise local ownership and guarantee equitable resource distribution to ensure that they improve competitiveness on the continent. Key areas of focus should include renewable energy and green infrastructure, advancements in the digital economy and industrialisation and infrastructure development. By aligning foreign investments with local priorities through actionable insights, Africa can harness external partnerships to realise the ‘Africa We Want’ vision.
The full implementation of the African Continental Free Trade Area (AfCFTA) agreement has significant potential to attract FDI, as a larger market can increase profit margins for external investors. The AfCFTA will encourage firms to establish a subsidiary on the continent rather than exporting from outside Africa, where the unified African market can be accessed more easily and at lower costs. The associated knowledge spillover benefits will follow.
In sub-Saharan Africa, countries like Nigeria, South Africa, Angola, Ghana and recently Mozambique have been major recipients of FDI in the extractive industries. Few of these traditional, resources-seeking FDI generated jobs and had limited broader development impact as they were not part of local value chains.
For example, in 2010, Mozambique made significant discoveries of natural gas totalling approximately 150 trillion cubic feet (Tcf), situated off the northern Cabo Delgado province. This potentially positions Mozambique as Africa's third-largest holder of natural gas reserves, following Nigeria and Algeria. The associated investment at US$30 billion is one of Africa’s most significant energy projects, with a final investment decision now scheduled for 2026, with production likely to start in 2030 after an Islamic insurgency in the Cabo Delgado province brought the project to a halt pending improvements in the security situation. However, the extent to which these significant investments will be linked to local value chains and transform Northern Mozambique's economy is uncertain.
The example of Mozambique-type resource-seeking investment is slowly changing, which is very promising regarding technology transfer, sustainable growth and job creation in Africa.
Thus, over the last 10 years (2013–2023), FDI in Africa has shifted from a heavy concentration in extractive industries (oil, gas and mining) toward a more diversified portfolio that includes renewable energy, telecommunications, infrastructure, manufacturing and financial services. Key trends are as follows:
- Diversification away from extractives: especially in East and North Africa, although extractives still constituted 35-40% of total FDI in the last decade.
- Greenfield investments are rising in manufacturing, logistics and renewables, consisting of establishing or constructing new firms.
- Digital infrastructure and fintech are booming, particularly post-COVID.
- FDI is increasingly driven by consumer demand, urban growth and infrastructure gaps, not just natural resources.
China has become a leading source of greenfield FDI in Africa, investing more than US$71 billion from 2016 to 2020, accounting for about 20% of total greenfield FDI on the continent. It is vital for African countries where unemployment is rampant because it generates additional production capacity, promotes job creation and increases capital accumulation in the host country. The recipient economy also benefits from the associated knowledge transfer. US greenfield FDI amounted to US$23 billion, 6.6% of total greenfield FDI in Africa. Russian greenfield investment was also high from 2016 to 2020 due to a one-time announcement of US$30 billion in 2017 to build a US$30 billion nuclear power plant near El Dabaa, on Egypt's Mediterranean coast. The plant will generate over 10% of Egypt's electricity, supply baseload power to 20 million people and have significant desalination capacity to alleviate Egypt’s long-term water security and address concerns related to Ethiopia's Grand Ethiopian Renaissance Dam.
Empirical research shows that FDI in manufacturing tends to have a strong positive effect on GDP growth, suggesting that Africa’s long-term growth gains from FDI have been higher when investments went into industries with more value-added and spillovers (e.g. factories, infrastructure) instead of enclave extractive projects, such as in Mozambique.
Key regions such as North and West Africa and prominent countries like Egypt, South Africa, Nigeria and Mauritania have showcased strong investment appeal, underscoring Africa’s diverse opportunities across strategic sectors ranging from renewable energy to manufacturing and business services.
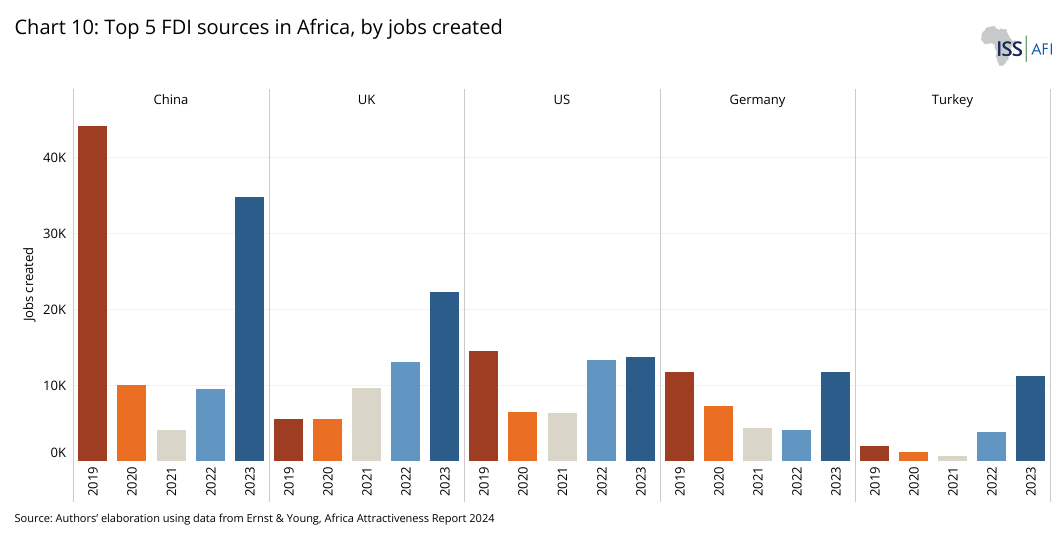
Chart 10 shows the top five FDI sources in Africa by jobs created for 2019 to 2023. Over the past two years, China, the United States, and the United Kingdom have emerged as the leading contributors to job creation through their investments. The impact of these countries' investments on African economic growth has yet to be empirically examined.
The North Africa region leads in terms of jobs created, accounting for 48% of the 2023 total, followed by West Africa. Sectors like food and beverage, software and IT services, metals, textiles and renewable energy supported job growth.
South Africa, Kenya and Nigeria created the most FDI-related jobs among African investors in 2023. South African FDI created 3 543 jobs in Africa in 2023, followed by Kenyan FDI (3 024 jobs) and Nigerian FDI (1 717 jobs). Although intra-African FDI currently contributes just 5% of employment and less than 3% of capital investment, cross-border investments by African firms hold significant potential to strengthen local economies, enhance economic integration and drive sustainable growth across the continent.
Intra-African FDI occurs when businesses or investors from one African nation invest in another by establishing subsidiaries, acquiring companies or expanding operations. It is crucial for regional economic integration, industrialisation and job creation, as it fosters stronger trade and business linkages within the continent. Key sectors attracting intra-African FDI include banking, telecommunications, manufacturing, infrastructure and energy.
In absolute value, intra-Africa FDI stocks have gradually increased from US$19 billion in 2010 to US$88 billion in 2022 before retreating to US$76 billion in 2023. Intra-African investment accounted for 14% of all new FDI projects in Africa in 2023, with South Africa, Kenya and Nigeria leading the way.
Intra-African FDI has surged in recent years. South Africa, Morocco, Kenya, Nigeria and Mauritius have emerged as key sources of FDI within Africa. On top of the Dangote petroleum refinery and fertilizer plants in Nigeria, Nigerian billionaire Aliko Dangote has established cement plants in Nigeria, Cameroon, Ghana, Togo, Zambia, DR Congo, Tanzania, Ethiopia, Senegal, South Africa, Sierra Leone and Cote d’Ivoire. Regional giants such as South Africa’s MTN telecom group is active in 18 African countries while Togo-based financial firm Ecobank have expanded their presence across the continent. Generally South African companies dominate intra-African investment, followed by Moroccan and Egyptian firms.
Unlike FDI from outside the continent, which is heavily focused on extractive industries, intra-African greenfield FDI is primarily directed toward IT infrastructure and services. This contrast highlights the crucial role of fostering intra-African investments to drive growth across various sectors.
The full implementation of the AfCFTA agreement could also boost intra-African FDI. A study by UNECA highlights that trade openness, infrastructure, logistics performance, business environment and education policies—particularly girls' education—play a crucial role in improving intra-African FDI.
Chart 11 depicts the share of intra-regional FDI stocks by developing region globally for the periods from 2010-2019 and from 2020-2023. Intra-regional FDI as a share of total FDI stock is more significant in sub-Saharan Africa than in any other developing region, serving as a solid base for establishing the AfCFTA. Between 2020 and 2023, intra-sub-Saharan African FDI accounted for an average of 21% of the region’s total inward FDI stock, up from 14.7% in 2010-2019. This share was more than double the 8.5% recorded in Latin America and the Caribbean, and four times higher than the 4.9% in the Middle East and North Africa during the same period.
Source: World Bank based on the IMF Coordinated Direct Investment Survey.
Note: LAC is Latin America & Caribbean, EAP is East Asia Pacific, ECA is Europe and Central Asia, MENA is Middle East and North Africa, and SAR is South Asia.
Illicit Financial Flows
Download to pdfIllicit financial flows (IFFs) are broadly defined as cross-border movements of money or value that are illicitly earned, transferred or utilised, including proceeds of crime, corruption and practices that violate laws (e.g. tax evasion through fraudulent trade invoicing). Goal 16 of the SDGs includes a target to reduce illicit financial and arms flows, strengthen the recovery and return of stolen assets and combat all forms of organised crime by 2030. The use of the word illicit is important in this context, implying more than only illegal financial flows, such as from organised crime or drug trafficking, to include matters such as aggressive tax avoidance.
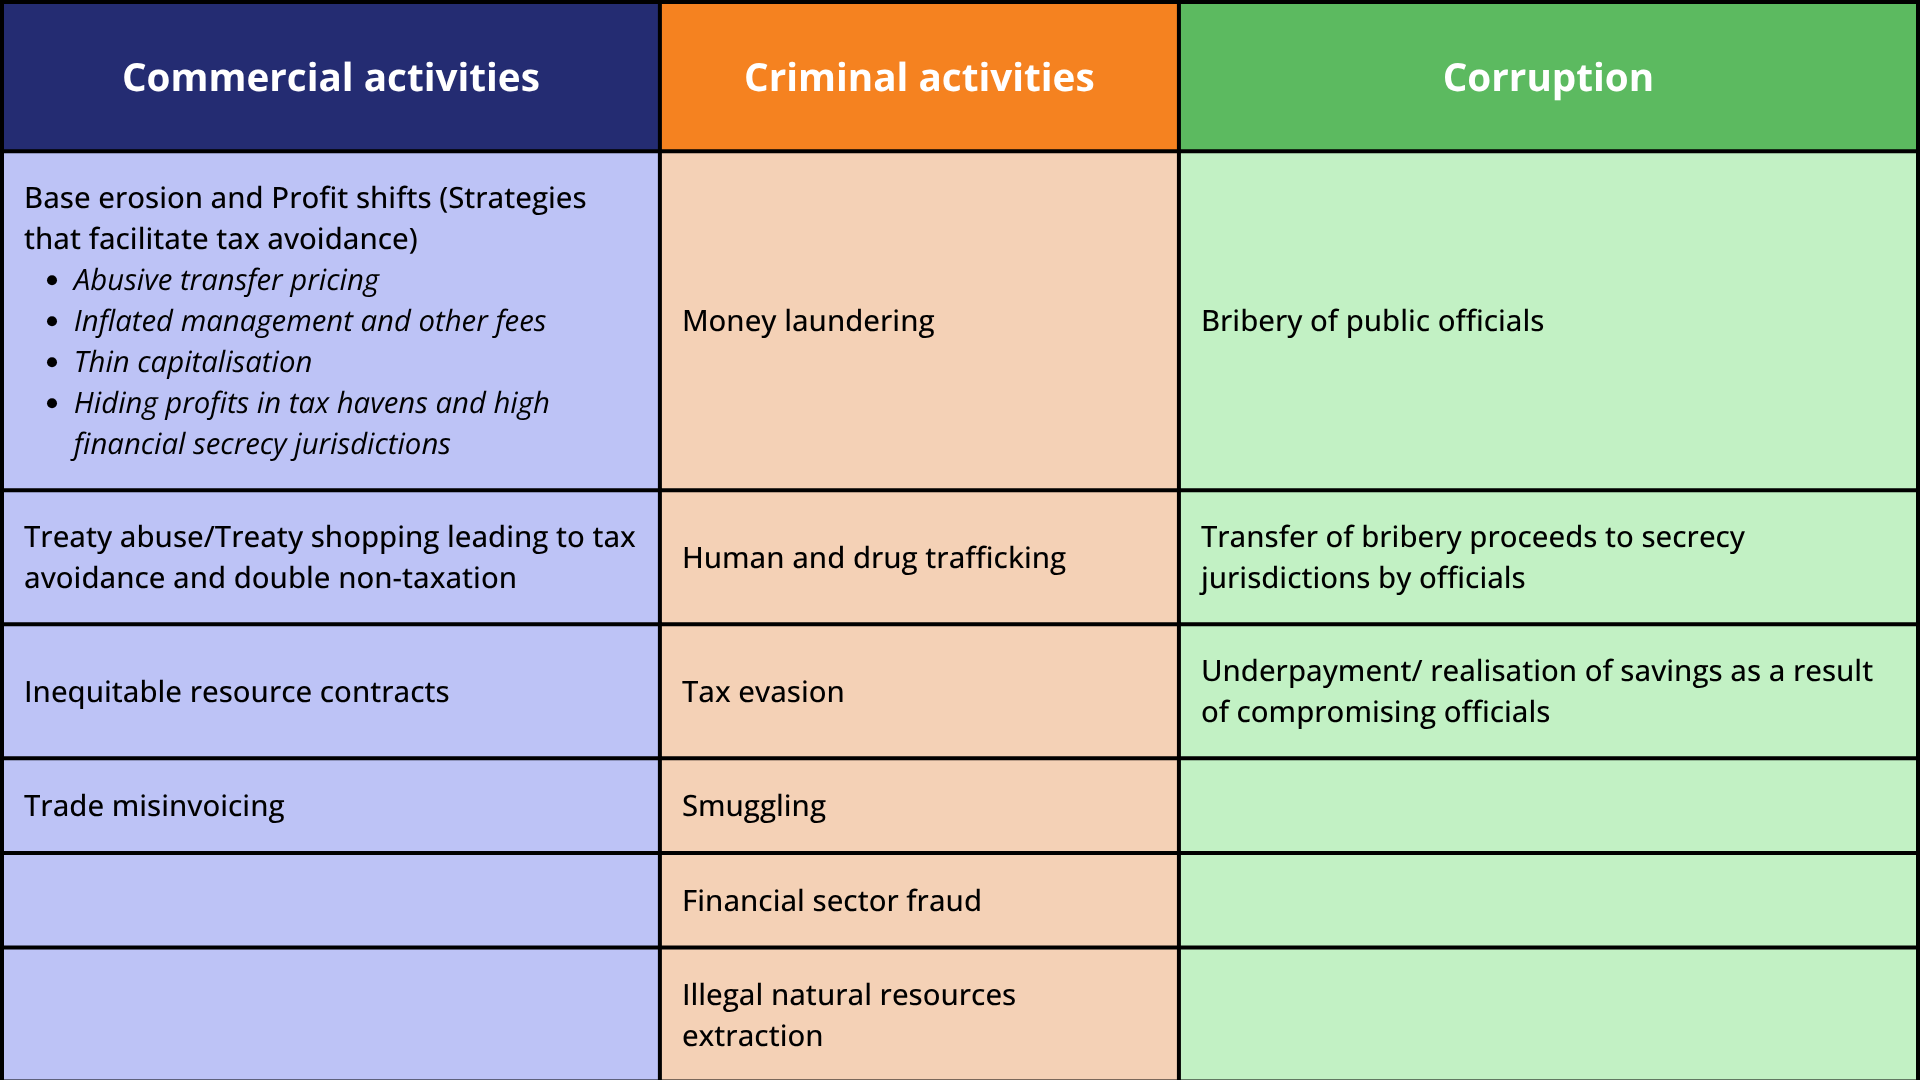
Chart 12 summarises the sources of illicit financial flows (IFFs) in Africa.
IFFs from Africa represent a significant leakage of resources from the continent, undermining development and governance. The 2015 Report of the High-Level Panel on Illicit Financial Flows from Africa (HLP), chaired by former South African president Thabo Mbeki, raised awareness of how an estimated US$50 billion left the continent annually. According to a more recent 2020 report by UNCTAD, approximately US$89 billion leaves the continent annually as IFFs, equivalent to 3.7% of Africa’s GDP and nearly matching the combined annual inflows of aid and FDI. However, it is essential to emphasise that, due to the hidden nature of IFFs, these figures (and the earlier numbers from the Mbeki report) are conservative estimates, and the actual revenue losses for Africa are likely significantly higher.
It is estimated that 65% of IFFs originate from multinational companies' commercial activities through transfer mispricing, trade misinvoicing, misinvoicing of services and intangibles, tax treaty shopping and unequal contracts. The remaining 35% is linked to criminals and funds stolen by government officials, including through bribery, theft of state assets and embezzlement. In all these instances, crucial public revenues are diverted for the private gain of individuals and multinational entities involved.
Total tax losses across all sectors are estimated at US$17.1 billion annually. These losses deprive governments of the resources to finance investments in critical programs such as education, health, gender inclusion and poverty eradication. Thus, UNCTAD estimates that countries with high IFFs spend, on average, 25% less on health and 58% less on education than their peers - illustrating how illicit outflows directly crowd out social investment. Furthermore, the revenue deficits caused by IFFs compel many African nations to resort to borrowing on onerous and often predatory terms, exacerbating their macroeconomic vulnerabilities. IFFs weaken African countries' capacity to maintain economic and financial stability by draining foreign exchange reserves, distorting competition and undermining asset prices.
Commercial activities giving rise to IFFs mainly take the form of aggressive tax avoidance, which occurs in abusive transfer pricing, thin capitalisation, exaggerated payments for use of intangible assets and inflated management fees. These practices are broadly categorised as Base Erosion and Profit Shifting (BEPS) strategies, i.e., tax planning strategies that exploit gaps and mismatches in tax rules to make profits ‘disappear’ for tax purposes or to shift profits to locations where there is little or no real activity. Subsequent taxes are low, resulting in little or no overall corporate tax being paid. The other forms of commercial practice through which IFFs in Africa are perpetrated are trade misinvoicing and mispricing. This involves falsifying prices, quality and quantity of traded goods and services. Treaty abuse or treaty shopping can also be used for tax avoidance practices. Inequitable resource contracts also form another channel for IFFs. The problem is enormous, with UNCTAD research indicating that up to a quarter of all FDI in developing countries has no real economic activity associated with it.
The misinvoicing of commodity exports exploits the power imbalance between multinational corporations that dominate resource extraction and African states, compounded by the opacity of global trading and financial systems, such as banking secrecy and offshore financial centres. For instance, the status of the US as a “secrecy jurisdiction” facilitates private offshore tax evasion. The US Foreign Account Tax Compliance Act requires foreign financial institutions and signatory governments to disclose information about US citizens’ assets in their jurisdiction to the US government. However, the US government is not providing reciprocal information to the 113 participating governments on the assets held in the US and has resisted joining the OECD Common Reporting Standard for the automatic exchange of information on foreigners’ financial accounts with their home country governments. As if that is not enough, early in 2025, President Donald Trump issued an executive order (regarding the Foreign Corrupt Practices Act) that effectively ceased enforcement of bribery-related offences.
A significant portion of IFFs is linked to organised crime and illegal markets, including money from activities such as drug trafficking, arms smuggling, human trafficking, illicit wildlife trade, money laundering, stock market manipulation, forgery and smuggling of valuable commodities (like conflict minerals). Funds from these criminal enterprises are often laundered and transferred abroad. Criminal activities driving IFFs in Africa include human trafficking, drug trafficking, smuggling and financial sector fraud. The AU Economic Commission’s High-Level Panel (HLP) on Illicit Financial Flows from Africa has noted that while generating IFFs may not be the primary objective of these criminal acts, they significantly contribute to such outflows due to efforts to conceal the illicit proceeds.
Illicit outflows are not uniform across countries. Historically, a large share has been concentrated in Africa’s biggest economies. Nigeria, Egypt and South Africa have led the region in absolute illicit outflows over the past decades. Nigeria, Africa’s most populous nation and largest economy, lost US$2.2 billion from IFFs in 2014, equal to 4% of total government revenue. South Africa, one of the most economically unequal countries in the world, reported an average of US$7.4 billion per year lost to IFFs from 2010 to 2014.
Drivers of IFFs also include a lack of transparency and information asymmetries, which hinder governments' ability to detect tax schemes and commercial practices designed to keep the income and profits of multinational enterprises beyond their reach. These asymmetries are particularly prevalent in the extractive industries, making this sector one of the most significant sources of IFFs.
When effectively leveraged, the digital revolution can be crucial in combating IFFs. However, it has also significantly heightened the risk of IFFs in many African countries. Multinational businesses can now trade virtually across borders, making it challenging for African governments to detect their activities or trace their income. Compounding the issue, no international framework regulates the digital economy. Multinational enterprises in the digital sector have exploited this regulatory gap, enabling them to perpetuate IFFs on an even larger scale.
Capacity constraints are a common challenge, however. Many tax authorities and enforcement agencies lack resources and the required specialised skills. The African Tax Administration Forum (ATAF) comprises African tax and revenue authorities to overcome some obstacles. It aims to enhance capacity for revenue mobilisation, improve tax administration and ensure citizen accountability. In addressing IFFs, ATAF promotes transparency and intergovernmental cooperation in information exchange. It plays a key role in capacity-building by training tax officers on transfer pricing, treaty abuse, harmful tax practices and customs management. ATAF has also supported the establishment of transfer pricing units in several African countries and conducts regular studies on these topics, contributing to efforts to combat tax-related IFFs.
On the global stage, ATAF is a partner and one of the organisations behind the African Initiative of the Global Forum on Transparency and Exchange of Information for Tax Purposes. The Global Forum is a 171-member organisation focused on global transparency to combat tax evasion and bank secrecy. The forum promotes two key standards: Exchange of Information upon Request (EOIR) and Automatic Exchange of Information on Financial Accounts (AEOI), which help countries exchange financial information and enhance access to data held by financial institutions.
The initiative offers African governments access to critical data such as legal and beneficial ownership, banking information and taxpayer affairs to combat IFFs. As a result, African countries have raised about €1.7 billion in additional tax revenues through offshore tax investigations, exchange of information requests and voluntary disclosure programs. The extra revenues raised are in the form of taxes, interest and penalties.
At the international level, the United Nations General Assembly (UNGA) has, on various occasions, identified IFFs as a worldwide problem that requires global cooperation. In its resolution A/RES/71/213 of 21 December 2016, the Assembly called for the “promotion of international cooperation to combat illicit financial flows to foster sustainable development”. The Assembly has also recommended that UN member countries “develop effective tools and create a policy environment for combating illicit financial flows, in accordance with the existing relevant international frameworks, including the United Nations Convention against Corruption.” More recently, in December 2020, the UNGA called for “countries to work together to eliminate base erosion and profit shifting and to ensure that all companies, including multinationals, pay taxes to the Governments of countries where economic activity occurs and value is created, by national and international laws and policies.”
The OECD/G20 Inclusive Framework on BEPS is an international platform allowing over 140 countries to combat IFFs by implementing measures to ensure profits are taxed during economic activities. Its two-pillar approach includes reallocating profits from multinational enterprises to market jurisdictions (Pillar One) and introducing a global minimum corporate tax rate of 15% for all companies with over €750 million (Pillar Two). However, African countries face challenges in adopting these measures due to limited administrative capacity, budget constraints and concerns about the framework’s fairness. In particular, Africa and other developing countries see the proposed 15% global minimum corporate tax rate as insufficient compared to their average corporate tax rates of 25–35%. African nations advocate for a higher rate of at least 20%.
Another important initiative is the Extractive Industries Transparency Initiative (EITI), a global standard for the responsible governance of oil, gas and mineral resources. It requires full disclosure of revenues generated throughout the extractive industry value chain to ensure transparency, accountability and public benefit. An independent party, overseen by a Multi-Stakeholder Group (MSG), reconciles these figures. This process helps identify tax irregularities and revenue leakages, making it an effective tool in combating illicit financial flows.
Currently, 52 countries are members of the EITI, including 26 from Africa. EITI has uncovered significant discrepancies in various countries, such as a US$55 million payment gap in Ghana, US$2.4 billion in recovered tax payments in Nigeria, and missing funds of over US$100 million in the Democratic Republic of Congo.
However, several resource-rich African countries have not yet joined the EITI even though membership would enhance accountability and reduce the secrecy associated with non-disclosure, fostering greater trust and good governance in the extractive sector.
All these initiatives represent a multi-faceted approach to addressing IFFs. Still, challenges remain, such as weak enforcement mechanisms, limited resources and a lack of global cooperation in tackling tax havens and multinational abuses.
Following the preceding analysis of Africa's current situation and prospects regarding remittances, aid, FDI and IFFs, this section presents the components of the Financial Flows scenario, in which we model the impact of ambitious positive interventions in each. Similar to other themes on the website, we use the International Futures (IFs) forecasting platform, for which additional information is available in the Technical section.
The purpose of the scenario is to assess the impact that aggressive but reasonable additional inward flows of aid, FDI and remittances, plus reductions in IFFs, have on various development indicators such as GDP per capita and poverty reduction. The IFs forecasting does not model illicit financial flows per se, as there is no global dataset or substantive methodology to estimate its extent, although UNCTAD and the UN Office on Drugs and Crime (UNODC) recently finalised a conceptual framework to measure illicit financial flows that will eventually contribute to producing global data estimates.[1] In the scenario, we therefore reduce the outward flow of FDI stocks as a proxy for illicit financial flows, while acknowledging that it does not perfectly capture the nature and scope of such outflows.
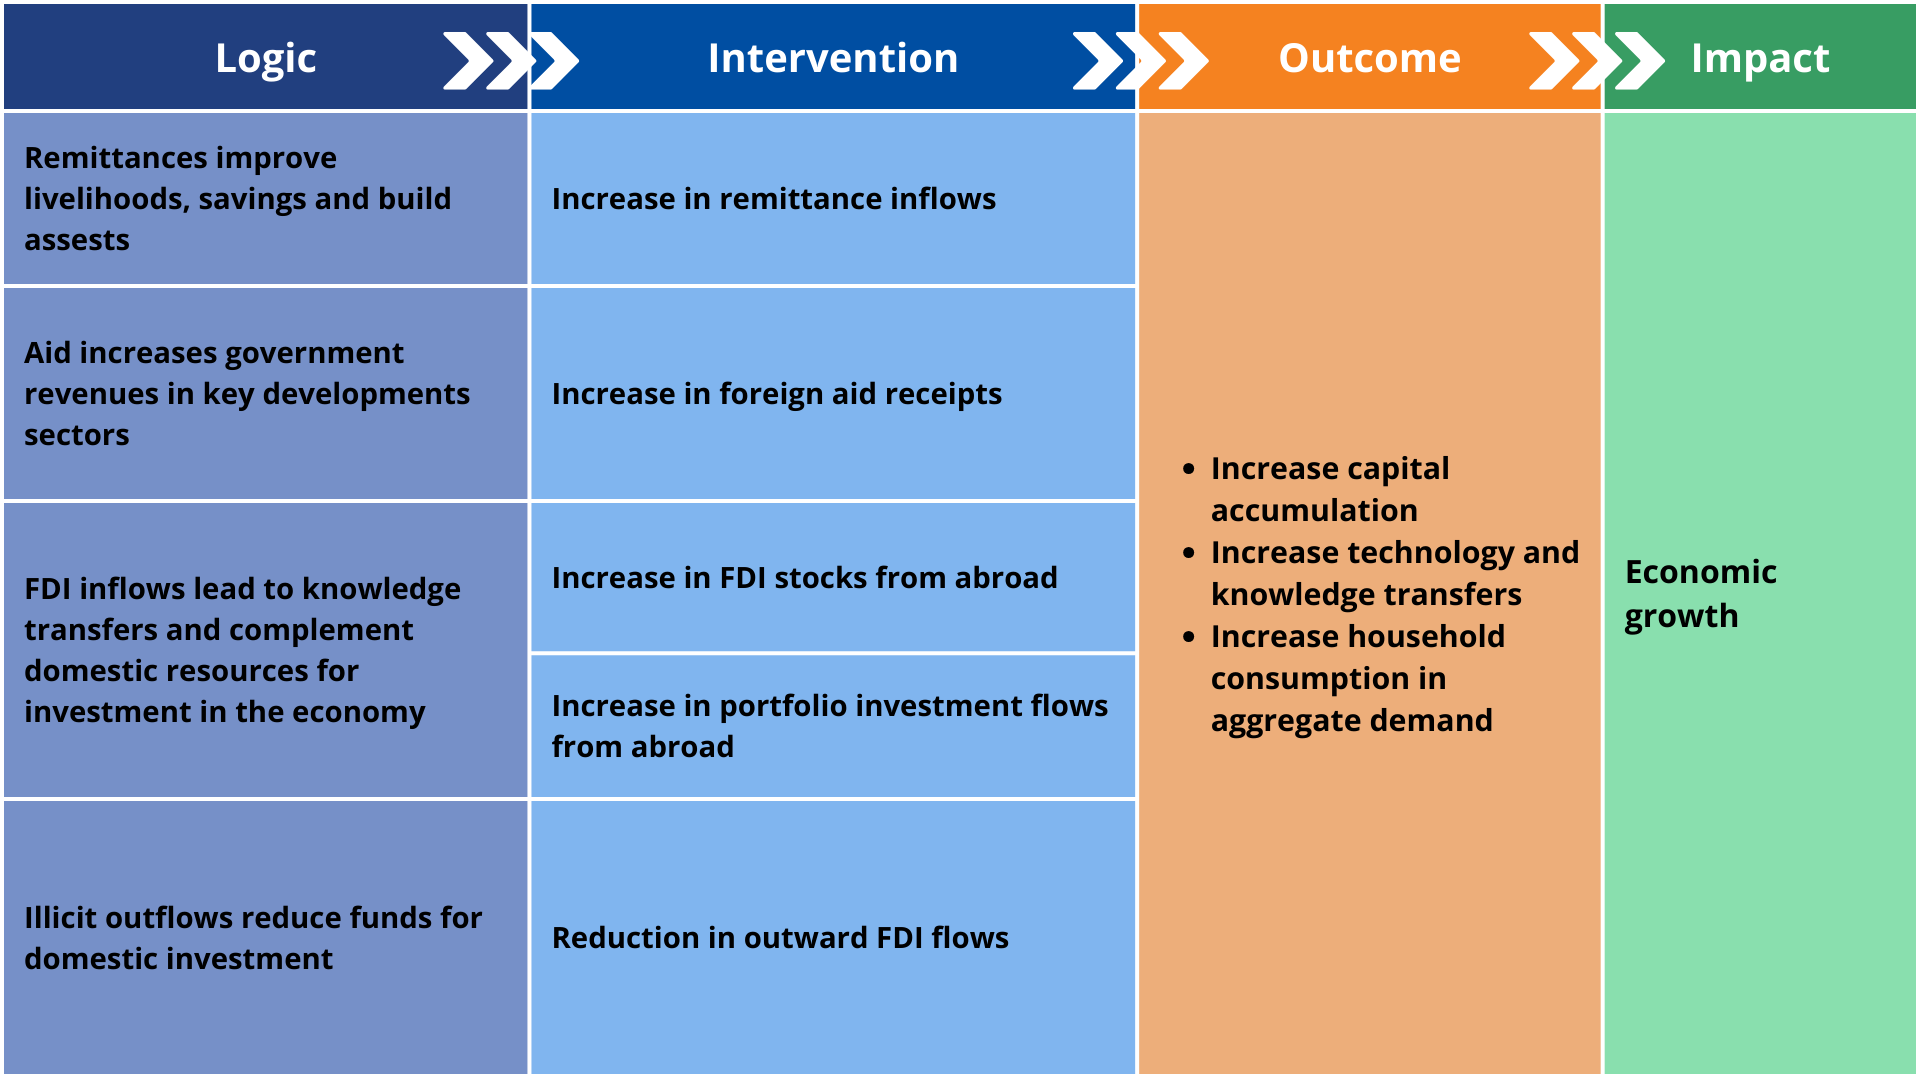
The logic underpinning the Financial Flows scenario is presented in Chart 13. Read more about the scenario on our Technical page.
Whereas interventions to increase FDI, portfolio investment and reductions in illicit financial outflows all start in 2027, the increase in aid starts three years later in acknowledgement of the impact of reduced aid with Donald Trump's second presidency. Effectively, the aid scenario is based on an expectation that the US returns as a donor once Trump is no longer the US president.
With that exception, other interventions ramp up over 10 years and are maintained at that level thereafter.
The scenario modestly increases aid. Previous sections have explained the general slow upward trend in aid to Africa (expressed in constant US$ amounts) over successive decades, with the portion of aid going to low- and lower-middle-income countries increasing at the expense of aid to upper-middle-income countries. Therefore, although aid is declining when expressed as a portion of GDP or a percentage of government revenues, the actual amounts continue to increase. While some partners pulling back on aid, such as the US and UK, other major donors such as Japan, Germany and Norway maintain the portion of Global National Income (GNI) allocated to aid, with additional developing countries also expected to contribute more aid (so-called emerging donors), such as China, India, Brazil, Turkey and the Gulf Countries. In other words, total aid provided to Africa (expressed in constant US$ amounts) will likely continue its steady historical increase, most of which will go to low-income countries, with Sudan, Mozambique, the Democratic Republic of the Congo and Somalia benefiting the most.
There is also every chance that the trend towards reduced aid amongst some traditional European donors would reverse as efforts to deal with migration at its source increase. Inevitably, the EU will then consider how best to improve the ability of African governments to constrain migration. That, and the renewed great power competition between the West, China and Russia in Africa, could, in time, increase rather than decrease aid flows to Africa to a much larger extent than modelled in the Financial Flows scenario.
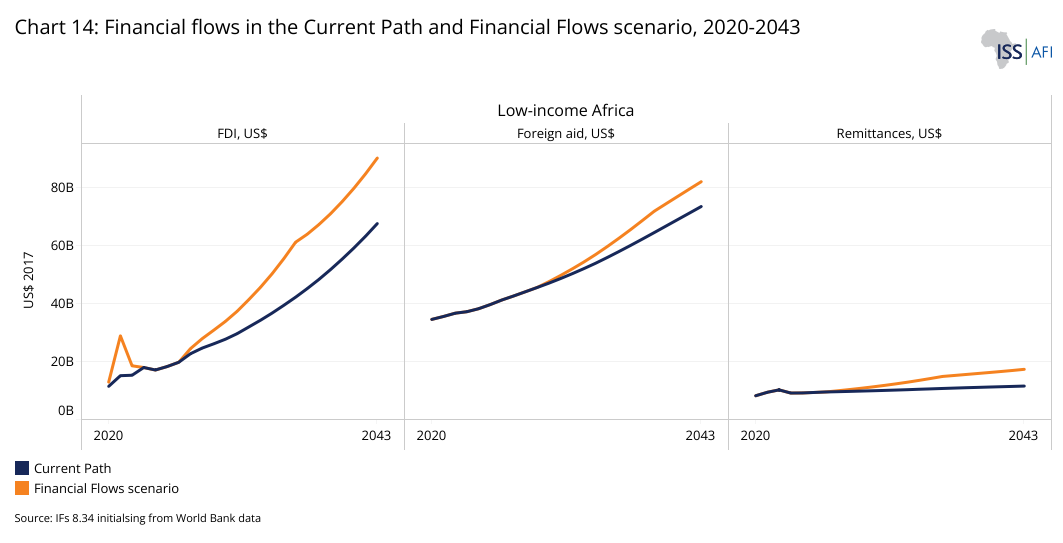
Chart 14 presents a history and forecast of the Current Path and all eight sectoral scenarios for aid, remittances and FDI. In 2023, Africa received US$64.7 billion in aid. On the Current Path, aid to Africa will increase to US$104.4 billion in 2043. In the Financial Flows scenario, aid to Africa will increase to US$113.5 billion, targeted at low-income African countries that will experience an increase of 12% in 2043. Additional aid flows to lower-middle-income countries are only 1% above the Current Path.
Whereas the increase in aid in the scenario is modest and overwhelmingly affects low-income countries, almost all African countries benefit from FDI. In low-income countries, FDI is almost exclusively directed at the extractives sector, but with limited spillover benefits to the broader economy. It is more diverse in lower-middle- and upper-middle-income African countries. FDI in Africa has steadily increased since the mid-1980s, but it comes from a low base with huge future potential. In 2023, FDI inflows into Africa represented 1.9% of GDP. On the Current Path, this figure is expected to rise to 3.6% of GDP by 2043. Under the Financial Flows scenario, however, inward FDI is projected to reach 5.3% of GDP, 1.7 percentage points higher than the Current Path in 2043. The scenario increases the stock of FDI to low-income Africa by 79% (or US$222 billion) above the Current Path, by 68% (or US$703 billion) for lower-middle-income Africa, and 71% for upper-middle-income Africa (or US$211 billion). Although large, Africa’s stock of FDI in 2043 in the Financial Flows scenario is still significantly below that of South America in total amount, and slightly less than half if expressed as a percentage of GDP in 2043 (57% vs 75%). However, Africa’s foreign direct investment inflows (as a percentage of GDP) surpass South America from 2033, yet Africa would still only have 4.3% of the global stock of FDI by 2043. An increase of such magnitude would require more political and economic stability, an improved business climate and likely the full implementation of the AfCFTA, which would serve as a powerful magnet attracting FDI.
Net remittance inflows are projected to reach US$121.5 billion by 2043 under the Financial Flows scenario, compared to approximately US$94 billion in the Current Path, an increase equivalent to 29%. This represents an additional US$27.5 billion in remittances beyond the business-as-usual scenario.
Because we use a proxy (outward FDI) to emulate a reduction in IFFs, the scenario is conservative, reducing outflows by 13% (or US$7 billion).
Impact of the Financial Flows Scenario
Download to pdfIncreased capital inflows into Africa will drive economic growth, boosting the continent’s total GDP by an additional US$243.5 billion in 2043 compared with the business-as-usual scenario. The largest economies, including Nigeria, Egypt and South Africa, are expected to see the most significant absolute gains. Also, Africa's average GDP per capita increases by US$160 in 2043 compared to the Current Path. This is a notable increase as the continent’s total population will 2043 exceed two billion people. The improvement in GDP per capita for each African country compared with the Current Path in 2043 is presented in Chart 15, with Seychelles (the only high-income country in Africa) and many lower-middle- and upper-middle-income countries doing exceptionally well in the scenario.
The Financial Flows scenario improves GDP and GDP per capita in all African countries, but the magnitude of the impact varies. Upper-middle-income countries typically have more developed infrastructure, financial systems and institutions, allowing them to absorb and allocate capital inflows more efficiently. In contrast, low-income countries often face challenges such as institutional weaknesses, limited financial depth, inadequate infrastructure and a shortage of skilled labour, which hinder their ability to transform capital inflows into productive investments, thereby reducing their impact on GDP. Also, high- and middle-income countries attract higher levels of FDI and portfolio investments, which directly enhance productivity, create jobs and drive economic diversification. On the other hand, low-income countries rely more on aid.
While significant capital inflows can drive economic growth and development, poor management may lead to financial and macroeconomic stability risks. One such risk is exchange rate appreciation, which typically follows large capital inflows. This can partially offset the growth gains by reducing aggregate demand through its effect on net exports.
Chart 16 shows the trends in net export (as a percentage of GDP) in the Current Path and the Financial Flows scenario from 2020 to 2043. The net export in the scenario remains below the Current Path over the forecast horizon. By 2043, the net export is estimated to be −4% of GDP in the scenario, compared to −2.8% of GDP on the Current Path in the same year. These findings are in line with the literature. A recent study shows that, in development countries, (1) a one percent increase in total financial flows appreciates the real exchange rate by 0.5 percent; (2) the real exchange rate appreciation effect of remittances is twice the effect of aid and ten times greater than the effect of FDI; (3) an increase of US$10 per capita financial flows leads to a gain of 0.08 points of annual growth. This gain amounts to 0.15 points without the negative impact of the genuine exchange rate appreciation.
In 2043, the number of Africans living in extreme poverty (based on the US$2.15 benchmark) in the Financial Flows scenario will be about 16 million fewer than the Current Path forecast. This corresponds to a poverty rate of 17% in that year, about one percentage point lower than the Current Path. Since extreme poverty at the US$2.15 threshold has already been eliminated in much of North Africa, most of those lifted out of poverty will be in sub-Saharan Africa, particularly in low-income countries, followed by lower-middle-income countries. In low-income nations, where a large portion of the population lives below the poverty line, aid and remittances are more likely to be allocated to essential services such as health, education and social protection, benefiting the most vulnerable.
At the country level, and as a percentage of population, the most significant poverty reduction is in Somalia (5.7 percentage points lower than the Current Path in 2043), followed closely by Liberia and Burundi. Somalia has Africa's lowest tax revenue to GDP ratio (2.5%). It relies heavily on external financial inflows, especially aid, which support the provision of critical public services such as health and education. However, when considering the absolute number of poor people, Nigeria sees the most significant poverty reduction in the Financial Flows scenario by 2043 (2 million fewer extremely poor people compared to the Current Path), followed by the Democratic Republic of Congo, Somalia, Sudan, Uganda and Burundi. The extreme poverty rate of US$2.15 has already been eliminated in countries such as Seychelles, Mauritius, and many North African countries. As a result, the scenario has a marginal impact on extreme poverty reduction in these countries.
Thus far, we have presented the combined effects of capital flows consisting of various components, such as aid. However, aid, remittances and FDI are bound to affect economic growth and poverty differently. This section extends the analysis by investigating the effects of each type of capital flow on Africa’s socio-economic development prospects.
Chart 17 depicts the impact of individual capital flows on Africa’s GDP per capita compared to the Current Path development trajectory. The chart shows that an increase in each type of financial flow (aid, remittances, portfolio investment and FDI) could improve Africa’s GDP per capita above the Current Path in 2043, with most gains made by upper-middle-income countries. However, the effect of aid and remittances on growth and GDP per capita differs by country income category. At the continental level, it is much weaker than that of FDI, implying that the latter has the potential to substantially improve growth and GDP per capita in Africa.
In 2043, for low-income African countries (where most aid goes) the aid component of the scenario improves GDP per capita among by almost 10% (or US$70 per person) and by about US$5 compared with the Current Path, as well as by 10% (US$214 per person) for Africa’s lower-middle-income countries. Most empirical studies provide no robust evidence of the aid–growth effect. Some studies have found that aid fosters growth in countries with good domestic policies, but it has no or a weaker impact in countries suffering from poor governance. Poor governance in most African countries may explain the marginal impact of aid on growth and GDP per capita. In the presence of strong institutions that limit diversion and appropriation, aid can contribute to human capabilities and infrastructure development with a positive effect on growth. In their absence, aid may ameliorate their impact, essentially alleviating suffering, hunger and other effects of slow growth and poor governance. Aid would be more effective if it were more systematically conditioned on sound policy.
In the remittances component of the scenario, Africa’s GDP per capita is only about US$3 higher compared to the Current Path in 2043. This marginal effect of remittances on growth and GDP per capita aligns with the literature. The World Bank observed that the impact of remittances on growth and employment in developing countries is somewhat ambiguous. In a recent IMF study, the authors conclude as follows in considering the impact of remittances on growth:
We cannot find a robust and significant positive impact of remittances on long-term growth, and often find a negative relationship between remittances and growth. Perhaps the most persuasive evidence in support of this finding is the lack of a single example of a remittances success story: a country in which remittances-led growth contributed significantly to its development. Given that some countries’ remittance receipts exceeded 10% of GDP for long periods of time, we should expect to find at least one example of this phenomenon during the past four decades. But no nation can credibly claim that remittances have funded or catalysed significant economic development.
A significant share of remittances is spent on daily needs (consumption) rather than on productive investment, and their informal nature often limits their integration into the formal economy, thereby reducing their potential to drive broader economic growth. The growth gain from remittances can also be partially offset if it is spent on imported consumer goods rather than stimulating domestic investment or if it leads to an appreciation of the real exchange rate. Moreover, the ‘brain drain’ associated with a loss of productive capacity due to the migration of skilled workers can partially offset the positive effect of remittances on economic growth.
Remittances may harm growth by reducing incentives for labour market participation. They may equally hurt growth in developing countries that are net remittance senders, such as South Africa, Côte d’Ivoire and Equatorial Guinea, as they reduce the already low domestic resources available for investment. In this vein, a recent study reveals a certain minimum threshold beyond which each dollar remitted will harm economic growth in Côte d’Ivoire.
An aggressive but realistic increase in international portfolio investment (debt and equity) would improve Africa’s GDP per capita by US$12 above the Current Path in 2043. Foreign portfolio investments (FPIs) are limited in Africa, especially in low-income African countries. For instance, debt portfolio investments via corporate bonds are typically invested productively in the real economy to increase productive capacities, which increase economic growth. However, the same benefits cannot necessarily be expected in the case of pure financial investment, such as equity portfolio investment. In contrast to FDI, FPIs are short-term financial flows and are more liquid, offering investors a chance for quicker returns on their money or a faster exit. As such, they can destabilise the host economy as they quickly depart the country of investment whenever there is uncertainty or negative news.
Compared to other types of capital flows, policies to attract more FDI will have the biggest impact on Africa’s growth. Here, it is essential to note that the FDI intervention in the scenario is significantly more aggressive than that for aid or remittances. In the FDI scenario, Africa’s GDP per capita increases by US$132 above the Current Path in 2043. Through their FDI activities, transnational corporations fuel economic growth because they contribute to capital accumulation and the transfer of superior technology and management skills in the host country. Launching an African Credit Rating Agency (AfCRA) in 2025 is an important step. The agency is designed to be private sector-driven, self-funded and self-sustaining, ensuring its independence and credibility. Rather than compete with the “Big Three” international credit rating agencies, the AfCRA is intended to complement and augment their work. A study by the Economic Commission for Africa suggests that more objective credit ratings could save African countries up to US$75 billion in interest payments, funds that could be redirected toward infrastructure and human capital development.
The impact of each type of capital flow on GDP per capita varies according to the income groups in Africa. For the upper-middle- and lower-middle-income groups, FDI has the most significant impact on GDP per capita, followed by portfolio investment flows. At the same time, aid and remittance have the lowest impact compared to the Current Path in 2043.
As for the low-income group, FDI has the most significant impact on GDP per capita, followed by aid, while remittance has the lowest impact in 2043, compared to the Current Path.
Chart 18 presents the impact of each type of capital flow on poverty in 2043. The chart shows that all types of capital flows in the scenario contribute to poverty reduction in Africa, with the most significant impact from remittances, followed by aid. While the impact of remittances on long-run economic growth is limited, their poverty-alleviating effects on recipient households are undeniable. Remittances directly augment the income of those households that receive them, and they are a crucial lifeline for many people, especially in low-income countries. At the same time, recent studies suggest that aid reduces poverty when targeted at the right programs and objectives, including social expenditure on health and education.
While FDI significantly impacts growth in the scenario, its overall impact on poverty alleviation is marginal. In some African countries, FDI contributes to poverty reduction, while in others, it has little to no effect or even exacerbates poverty. This suggests that the relationship between FDI, growth and poverty reduction is not homogenous across the continent, as its effectiveness depends on varying domestic conditions and policies.
The effects of FDI on poverty reduction depend on the type of inflow and domestic policies. FDI has the potential to significantly reduce poverty through the direct channel by creating jobs in the private sector. Transferring knowledge and technology can also enable domestic firms to create more jobs. However, for FDI to directly reduce poverty through job creation, labour-intensive FDI is required. When FDI is concentrated in extractive industries, its benefits tend to be confined to a small elite, offering little economic relief to the broader population. Equatorial Guinea is one of the African countries that exemplify this issue: despite having one of the highest GDP per capita levels in Africa, poverty remains widespread. This is mainly due to the unequal distribution of wealth generated from the oil sector, which has failed to create broad-based employment opportunities, leaving a significant portion of the population in poverty. More labour-intensive manufacturing FDI, such as in the case of Asian countries, could significantly reduce poverty in Africa.
The impact of each type of capital flow on poverty varies according to the income groups in Africa:
- For the upper-middle-income group, FDI significantly impacts poverty reduction, followed by portfolio investment flows. In contrast, aid and remittance have the lowest impact compared to the Current Path in 2043.
- For the low- and lower-middle-income groups, remittance significantly impacts poverty reduction, followed by aid.
- Aid has the most significant impact on poverty reduction in low-income countries ince this is where most aid is allocated, followed closely by FDI. Portfolio flow has the lowest impact in 2043, compared to the Current Path.
Overall, the Financial Flows scenario shows that increased external financial inflows into Africa in the form of FDI, aid, remittances and reduced illicit financial flows will promote growth and reduce poverty, with remittances being significant for poverty reduction. However, the benefits of these financial flows may be severely limited without appropriate domestic policies.
Africa has received significantly more aid per capita than regions such as South America and South Asia, but has attracted less FDI than other developing regions, despite the high rate of return on investment it offers.
Given rapid population growth, African countries require substantial investments to drive transformative change, stimulate economic growth, strengthen resilience against shocks and transition toward a low-carbon, digital and sustainable development pathway. The first port of call is to look inward and to improve and optimise domestic revenue mobilisation. A concerted effort can unlock African pension funds that amount to between US$400 to US$500 billion, a figure projected to grow to about $.3 trillion by 2050. Most follow a conservative investment strategy with a strong bias towards domestic government securities and cash, and could pursue higher returns through investments in infrastructure, private equity/venture capital and green energy projects. In addition, Africans need to leverage external financial flows, particularly FDI and remittances, use aid more effectively and reduce IFFs.
The analysis highlights that, over the past decades, workers’ remittances have emerged as the largest source of external financial flows to the continent, surpassing both FDI and official development assistance. The growth impact of remittances is, however, limited and complex. It depends on how they are used and the country's conditions. For example, remittances can promote growth in countries with underdeveloped financial systems by providing an alternative source of investment financing when credit is scarce. Where remittances fund business startups or education (instead of merely consumption), they contribute more significantly to long-term GDP growth. Conversely, if remittances largely finance household consumption and imports or reduce labour force participation, their contribution to growth may be negligible or harmful. But generally, remittances contribute less to growth than FDI or aid.
Countries that channel remittances into investment tend to see stronger GDP growth payoffs, whereas those where remittances primarily fuel consumption see little growth benefit. Encouraging savings and investment of remittances (for example, via diaspora investment programs, matching schemes or reducing remittance costs to increase disposable funds) can amplify their development impact.
Thus, while remittances already play a crucial role in supporting households and stabilising economies, policies that channel this income into growth-enhancing uses can strengthen their contribution to GDP growth.
For diaspora bonds to become a viable funding source, African governments must build credibility, demonstrate accountability and convince their diaspora that their contributions will be used effectively for development.
Much can be done to improve remittance flows, given their role in reaching rural, poor people, particularly during tough times. Governments, regulators, financial institutions and development partners can collaborate to overcome the challenges and barriers that hinder remittance inflows. Reducing remittance costs is a key priority in this regard, as sending money to the continent remains among the highest globally, and moving money legally between neighbouring African countries is even more expensive. Regions with high levels of terrorism, such as the Horn of Africa, struggle most. In the first quarter of 2023, the average cost of sending US$200 to Africa was 7.39%, well above the global average of 6.65%. Various factors contribute to these high costs, including limited competition, concerns about money flows to groups and individuals associated with terrorists, exchange rate control policies, regulatory barriers and an underdeveloped financial infrastructure. According to the World Bank, cutting prices by at least five percentage points can save up to US$16 billion annually.
Affordability is expected to improve with enhanced mobile money interoperability and streamlined regulations.
Beyond major mobile money providers like Safaricom, MTN and Airtel, new fintech companies are addressing the demand for accessible remittance services. Zepz offers fast, secure and affordable remittance options to over 130 countries. LemFi, a Nigerian startup, bridges traditional banking and mobile money for seamless cross-border transactions. The cross-border payment app, Chipper Cash, allows users to send and receive money across several African countries. It has recently partnered with TBD, a digital payment platform owned by Block, to expand its network to 40 countries on the continent. Tanzania’s fintech company Nala focuses on user-friendly remittance solutions for underserved East African communities. South Africa’s Mukuru operates in over 20 African countries, providing remittance services and banking and insurance products.
Business-to-business (B2B) fintechs also support the remittance market. CAB Plc offers payment processing and financial services to streamline business operations. Onafriq connects 500 million mobile wallets to improve payment interoperability. VertoFX facilitates cross-border business payments with competitive rates. Cellulant provides a single API integrating mobile money, bank transfers, and cards to simplify business payments. These fintech innovations make remittances across Africa more affordable, efficient and accessible.
Additionally, promoting financial literacy and education will help individuals understand and trust digital remittance channels, fostering adoption and usage.
The effect of FDI is more positive than remittances if it triggers broader productivity gains. The growth dividends from FDI are larger when countries have the right complementary conditions, such as skilled human capital, well-developed financial markets and stable governance. FDI accelerates growth only above a certain education threshold in the host country, and FDI’s benefits are greater when domestic financial systems can efficiently channel and absorb the investment.
To better leverage growth, many African nations have strengthened their fundamentals over time, for instance, improving macroeconomic stability and regulatory frameworks. However, despite growing investment flows from China, Africa’s share in global FDI inflows remains modest. It will take a considerable effort to increase current levels to 5.2% of GDP in the 2043 modelled in the scenario. Though FDI in Africa is now diversifying into sectors such as manufacturing and services, the large share of FDI flows to the continent still comes via the extractive sectors (oil and mining). African countries should continue implementing policies to attract FDI; however, these efforts must be accompanied by policies to improve domestic conditions and enhance absorptive capacities. This dual approach is essential to mitigate potential adverse effects and maximise the economic benefits of FDI. In particular, priority should be given to fostering an environment that supports quality education and infrastructure, strong institutions and well-functioning local financial markets.
However, this does not suggest that, once domestic conditions improve, all types of FDI are suitable for Africa. African countries must move away from a liberal approach and adopt a more selective FDI strategy, similar to East Asian nations. These countries have successfully leveraged FDI to acquire advanced technologies and knowledge, strengthening their global competitiveness. Due to their strategic approach and sufficient absorptive capacities, FDI has been more effective in Asia, particularly China, Taiwan and South Korea. While FDI is not the only solution for Africa’s development, it can be a powerful catalyst when aligned with domestic priorities. African governments should, therefore, focus on improving domestic policies and targeting FDI that aligns with their long-term development objectives, particularly those that support structural transformation, industrialisation and job creation.
While international capital inflows can drive economic growth, poor management can expose African economies to financial and macroeconomic instability risks. One key challenge is the potential appreciation of the real exchange rate, which can erode competitiveness and reduce net exports, partially offsetting the growth benefits of external financial inflows.
The third component modelled is aid. Aid is not a silver bullet for Africa’s development, but when strategically deployed, it can play a crucial role, particularly for the poorest countries. Historically, much of the aid given to African nations was driven by strategic interests rather than genuine development goals, but this changed. In many cases, African governments misused aid as a resource for personal or political gain, neglecting good governance and sustainable development.
Aid and FDI should complement each other, improving infrastructure and human capital to create favourable conditions for FDI. Ultimately, the most effective strategy involves a combination of targeted or innovative aid programs and FDI that aligns with the country's development priorities.
However, the future of aid is uncertain. It is difficult to predict whether reductions in aid from the world’s largest donor, the US, will be temporary or permanent, and the extent to which the EU would be able and willing to make up for the associated shortfall. Meanwhile, countries such as China, the UAE and Russia, among others, are unlikely to fill the gap left by the West, as their interests primarily focus on infrastructure, security and political influence rather than broader development benefits. As a result, the public finances of many poor African recipient countries, where other funding is limited, will be strained.
The aid challenge should serve as a wake-up call for Africa. African countries should take advantage of the end of support from the US to propose new partnerships made up of direct investment and fairer trade. By strengthening domestic revenue mobilisation, investing in local industries, enhancing intra-African trade and promoting transparent governance, African nations can transform this challenge into an opportunity for long-term prosperity. Instead of lamenting the loss of foreign aid from the US, African countries must rethink their economic strategies, prioritise self-sufficiency and take ownership of their development.
In the interim, many critical health, education and food security programs previously supported by USAID face disruptions, placing vulnerable populations at risk. Achieving self-reliance will require strategic planning, substantial investment in local capacities and a long-term commitment to sustainable growth rather than short-term fixes.
Many advocates support reform of development assistance. To date, aid effectiveness has been driven by a belief in recipient ownership, which allows African nations to set the associated development priorities, leading to significant levels of budget support. The general approach is that aid should complement domestic resources by funding essential services that would otherwise remain underfunded.
It is debatable if this approach suffices in an era when aid is constrained amidst a clamour for value for money. Rather than budget support, it may be time to consider an approach that sees aid funds spent on a limited number of highly effective projects to ensure the benefits of scale, and increase the portion of aid money that goes to recipient countries, the current practice of numerous small projects funded on a bilateral basis by a large number of donors. The result is that the median ODA project is worth less than US$100 000. Radically simple projects that do one thing on a large scale and where all donor money is managed by a single agency in a sector such as health can provide significant improvements. Aid should also go to fewer countries. Rather than support for democracy and human rights, aid should focus on good governance practices and be conditional in requiring minimum probity.
Finally, IFFs are a major global challenge, severely impacting Africa’s socio-economic development, given how much they drain substantial resources. This raises serious concerns, given the significant financing needed to reignite the growth momentum curtailed by the recurrent and overlapping crises in recent decades. Discussions on strategies to mobilise adequate funding to meet Africa’s needs in this challenging global context must put the problem of IFFs squarely at the centre of the debate. Tackling IFFs is essential to improving domestic revenue mobilisation, unlocking Africa's development potential, ensuring economic stability and creating the fiscal space needed to address key social and economic challenges effectively.
Given their significant impact on development, African initiatives to combat IFFs have grown in scope and sophistication over the years, consisting of efforts to:
- Strengthen tax administration and compliance;
- Beneficial ownership transparency and establish an anti-money laundering framework to detect and deter the movement of illicit monies through domestic banks and businesses;
- Crackdown on corruption and public-sector leakages;
- Trade and customs reforms;
- Harness technology and data.
While progress has been made, the increasing sophistication and frequency of IFFs call for renewed commitment. Combating this issue requires a collective effort from African countries, the AU, civil society, the UN and other global institutions. Tackling tax evasion, for instance, necessitates collaboration with developed nations to strengthen local tax authorities, improve cross-border tax information sharing, combat money laundering and establish global tax transparency standards.
The AfCFTA presents an opportunity to fight IFFs by harmonising investment laws, facilitating information exchange, enhancing institutional capacity and promoting transparency and accountability. Additionally, African countries should adopt automatic information exchange on customs values and invest in training customs officials on proper commodity valuation. These measures are crucial to addressing trade misinvoicing, which accounts for over 50% of Africa’s IFFs.
The road ahead is demanding, but it promises a more resilient and self-sufficient future for the continent.
In sum, Africa should work more diligently in setting the terms for how best it can benefit from aid, FDI and the flow of remittances. Africa needs to become a rule-maker and assume a larger role in its destiny, particularly in the mode of development it pursues. The best strategy to ensure inclusive and sustainable growth in Africa likely lies in a hybrid model, where trade, smart aid and public and private investment complement each other.
Page information
Contact at AFI team is Kouassi Yeboua and Jakkie Cilliers
This entry was last updated on 28 May 2026.
Donors and sponsors


Reuse our work
- All visualizations, data, and text produced by African Futures are completely open access under the Creative Commons BY license. You have the permission to use, distribute, and reproduce these in any medium, provided the source and authors are credited.
- The data produced by third parties and made available by African Futures is subject to the license terms from the original third-party authors. We will always indicate the original source of the data in our documentation, so you should always check the license of any such third-party data before use and redistribution.
- All of our charts can be embedded in any site.
Cite this research
Kouassi Yeboua and Jakkie Cilliers (2026) Africa Financial Flows Forecast . Published online at futures.issafrica.org. Retrieved from https://futures.issafrica.org/thematic/10-financial-flows/ [Online Resource] Updated 28 May 2026.