 18 Global Power Shifts
Feedback welcome
Our aim is to use the best data to inform our analysis. See our Technical page for information on the IFs forecasting platform. We appreciate your help and references for improvements via our feedback form.
Shifting trends emphasised in the other African Futures themes—demographics, education, governance, etc.—will in turn produce shifts in global power. In this theme, we analyse these trends from a global perspective.
For more information about the International Futures modelling platform we use for the forecasts and scenarios, please see the Technical page.
Summary
This theme examines how national power and geopolitical influence are likely to shift through mid-century, using three composite indices from the Pardee Institute’s International Futures platform (IFs): the Global Power Index (GPI), the Diplomacy, Military, Economy (DiME) Index and the Formal Bilateral Influence Capacity (FBIC) Index.
By analysing military, economic, demographic and technological factors, the theme unpacks the building blocks of global power and influence capacity before detailing how we expect their changes to alter the international order across four alternative futures: a Sustainable World (prioritising equity and sustainability), a Growth World (focused on economic growth at all costs), a Divided World (characterised by nationalism and erosion of multilateralism) and a World at War (defined by escalating conflict worldwide even as a world war is avoided).
Key findings include:
- The United States (US) and China remain the world’s leading powers through 2050. China’s power converges with and often overtakes that of the US, depending on the measure and scenario under consideration.
- India consistently emerges as a potential geopolitical “kingmaker” between the US and China, provided it addresses its domestic governance challenges and engages more actively in global affairs.
- The European Union (EU) remains a major concentration of global power, but its ability to function as an independent geopolitical pole depends on its member states acting collectively. Across most measures and scenarios, its relative position weakens or stagnates, although Germany and France remain among the world’s leading powers.
- These shifts point towards a “mini-polar” order: one that remains broadly bipolar and dominated by the US and China, but in which India and a strategically unified EU can shape regional and, in some circumstances, global outcomes.
- A combined African Union (AU) experiences the largest relative gains in national power, mainly driven by demographic momentum. However, its total share of global power remains modest, rising to roughly 5%-8% (depending on the power metric) by 2050. In terms of influence capacity, several AU member countries are seeing similar large gains, but still not enough to place any single African state in the top tier of the geopolitical hierarchy.
- A Sustainable World scenario yields the most favourable outcomes for developing regions, while the Growth World scenario is favourable for developed regions, whereas a World at War scenario disadvantages nearly all nations.
Regardless of the scenario, the global order is projected to become increasingly complex. This theme concludes by noting that the US must avoid the traps of “wars of choice” and deepen global engagement; Europe must prioritise cohesion; and African development must successfully convert demographic growth into long-term productivity and geopolitical leverage, even while building a fully independent geopolitical pole by mid-century may remain out of reach.
All charts for Global Power Shifts
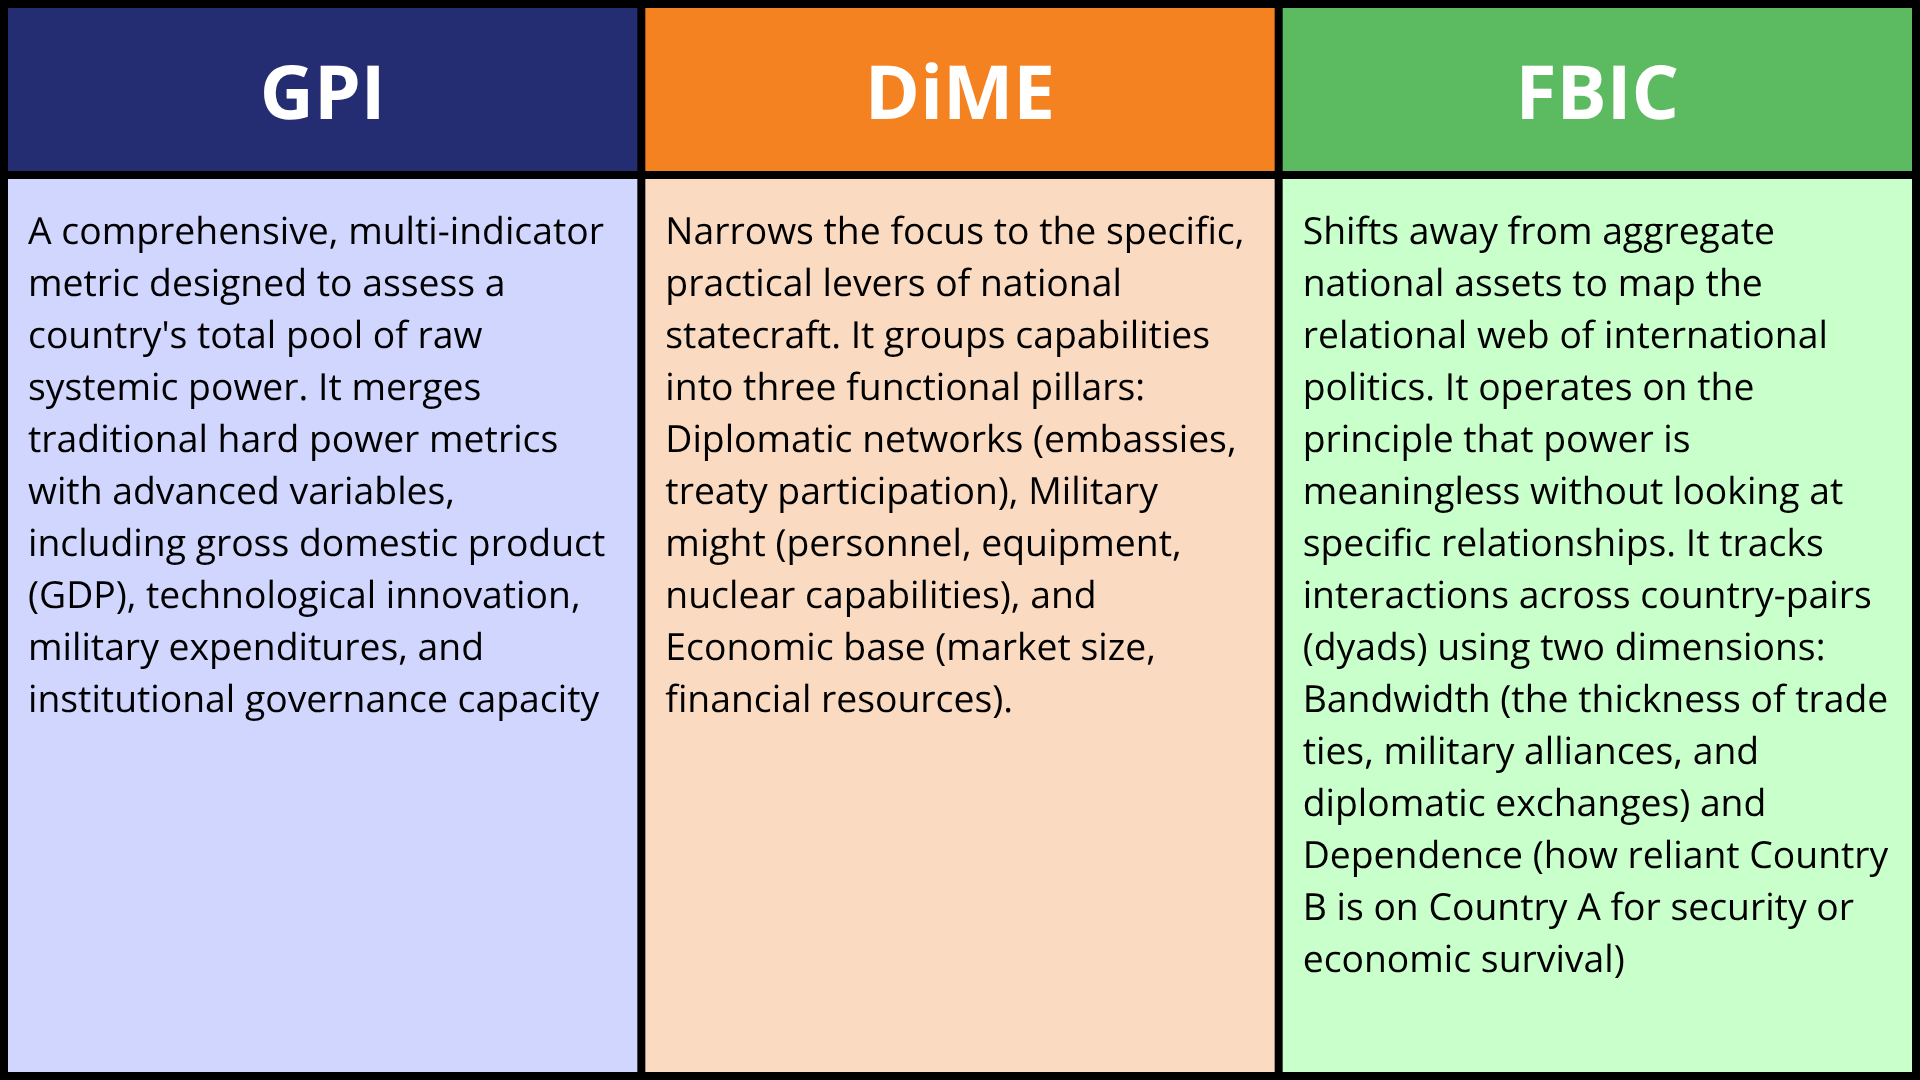
- Chart 1: Summary description of GPI, DiME and FBIC in IFs
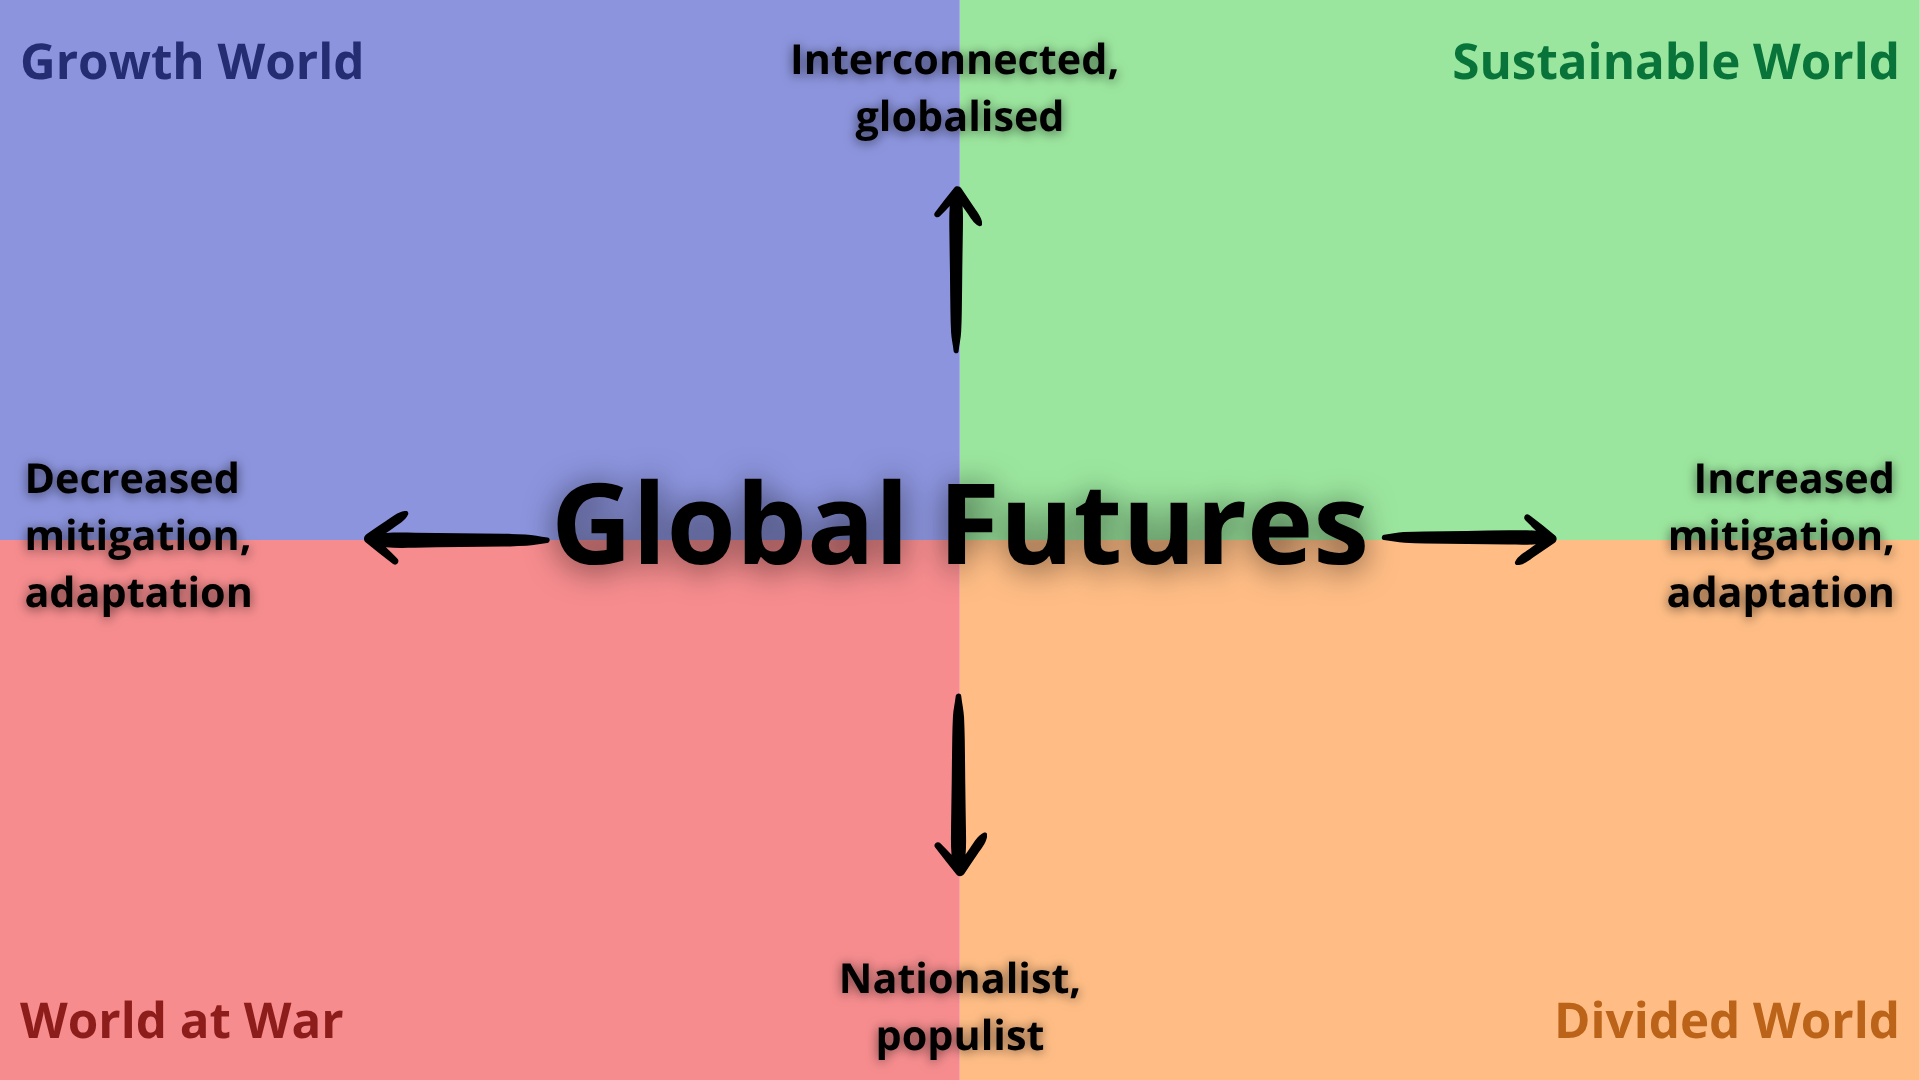
- Chart 2: Dimensions and scenarios
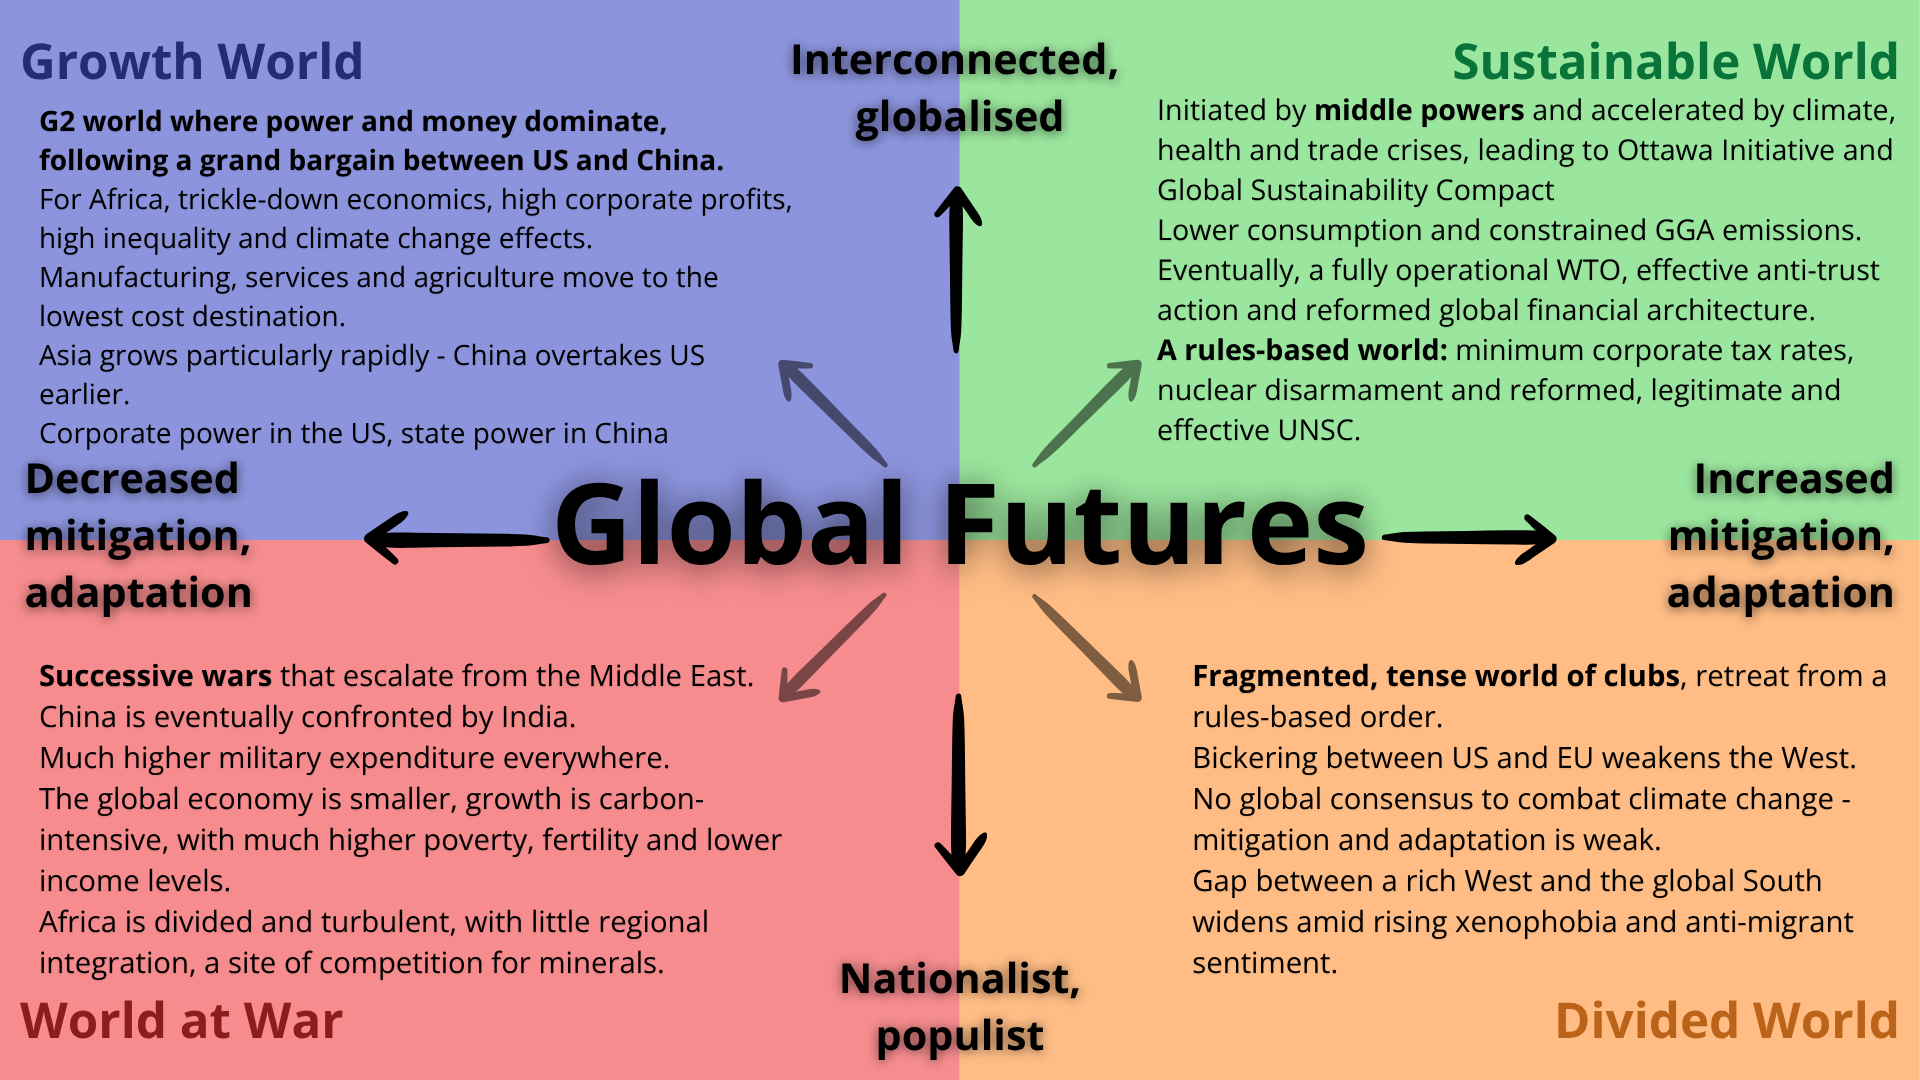
- Chart 3: Alternative global scenarios
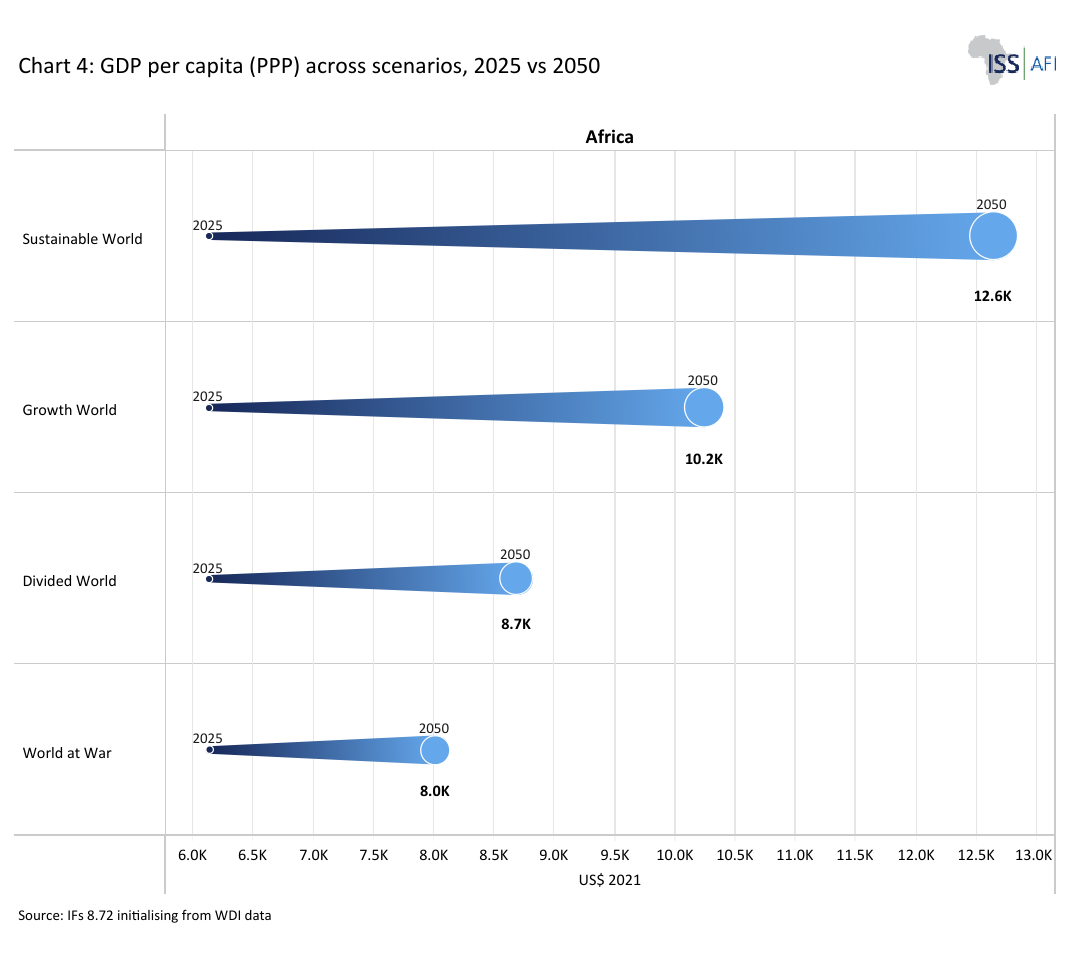
- Chart 4: GDP per capita (PPP) across scenarios, 2025 vs 2050
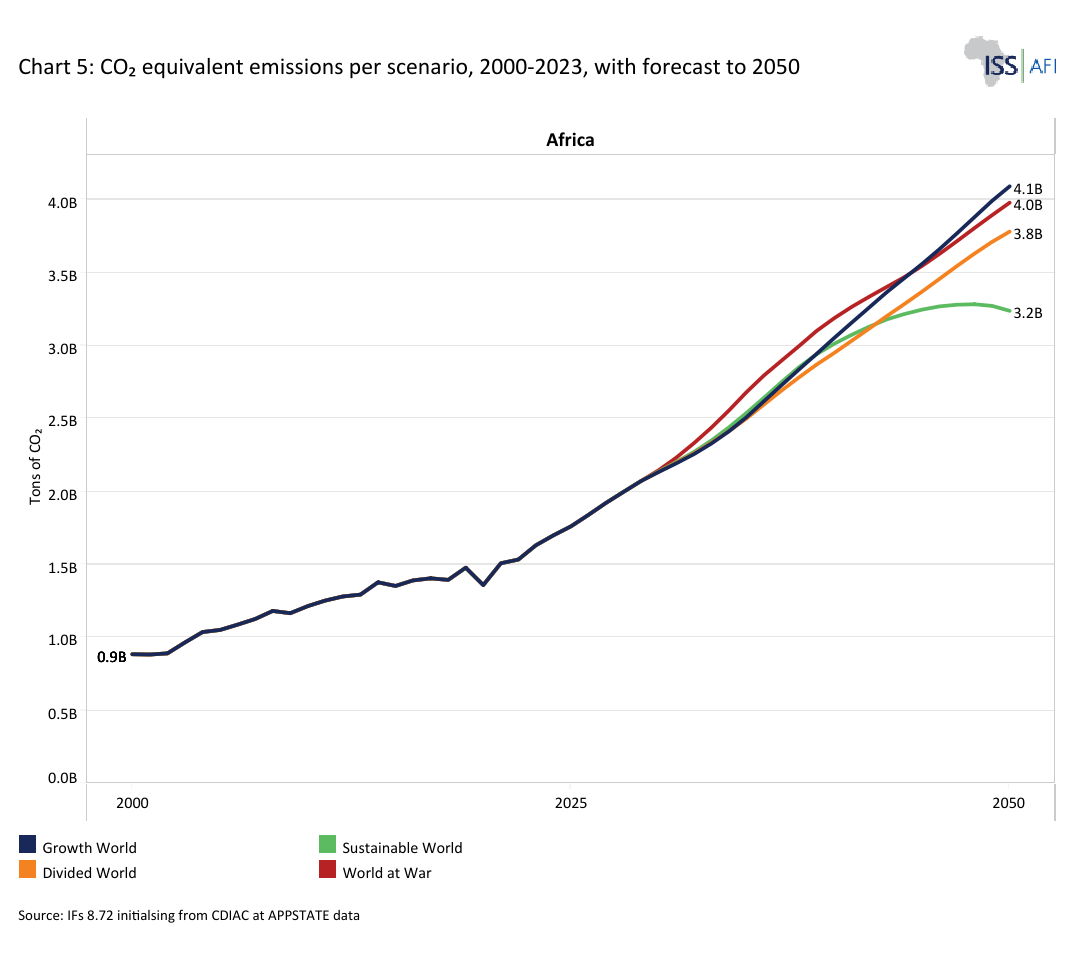
- Chart 5: CO₂ equivalent emissions per scenario, 2000-2023, with forecast to 2050
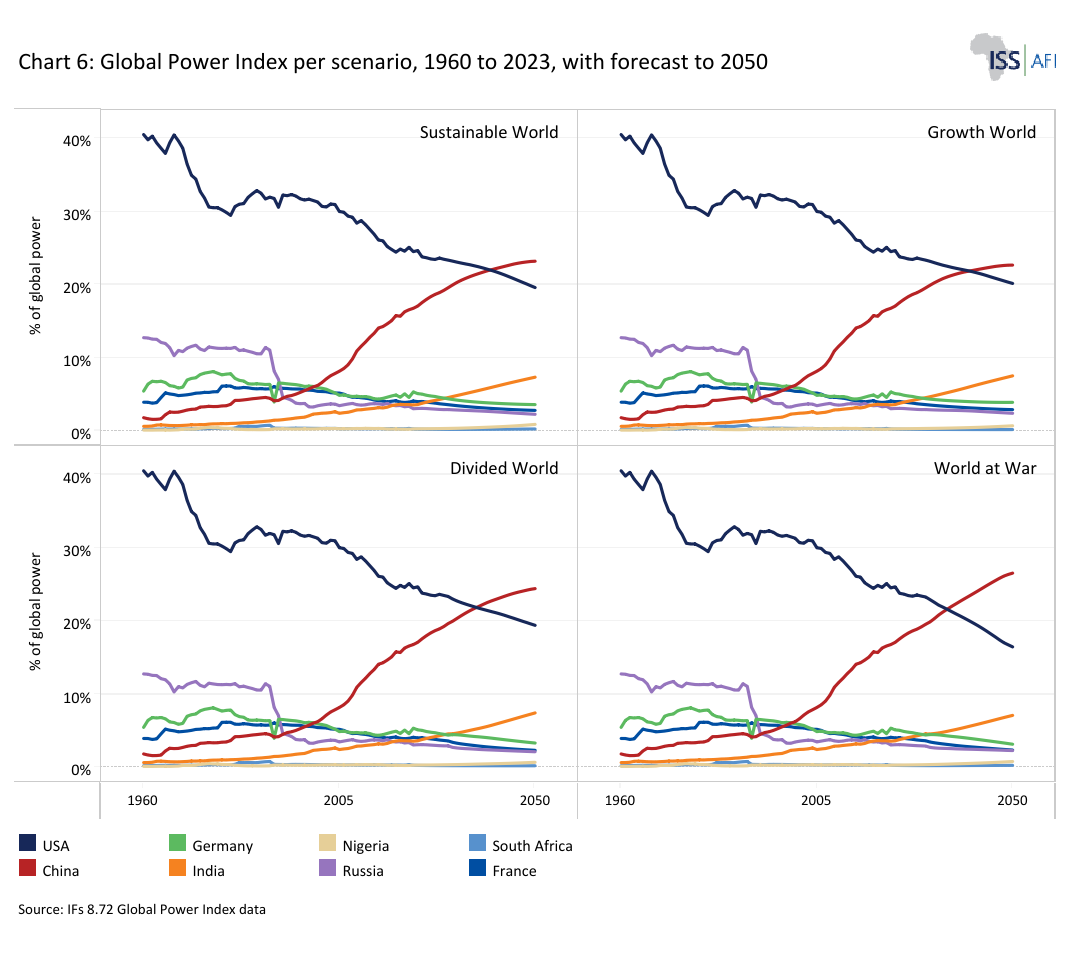
- Chart 6: Global Power Index per scenario, 1960 to 2023, with forecast to 2050
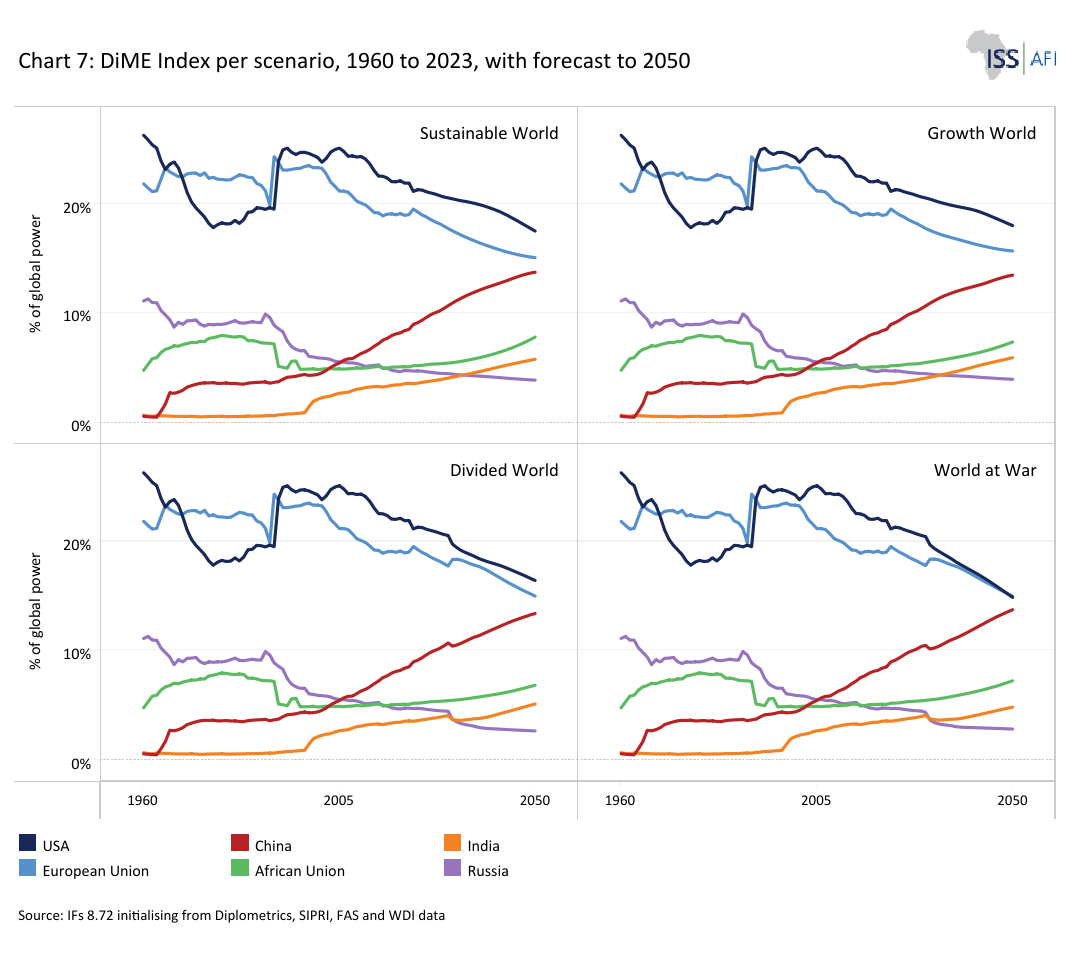
- Chart 7: DiME Index per scenario, 1960 to 2023, with forecast to 2050
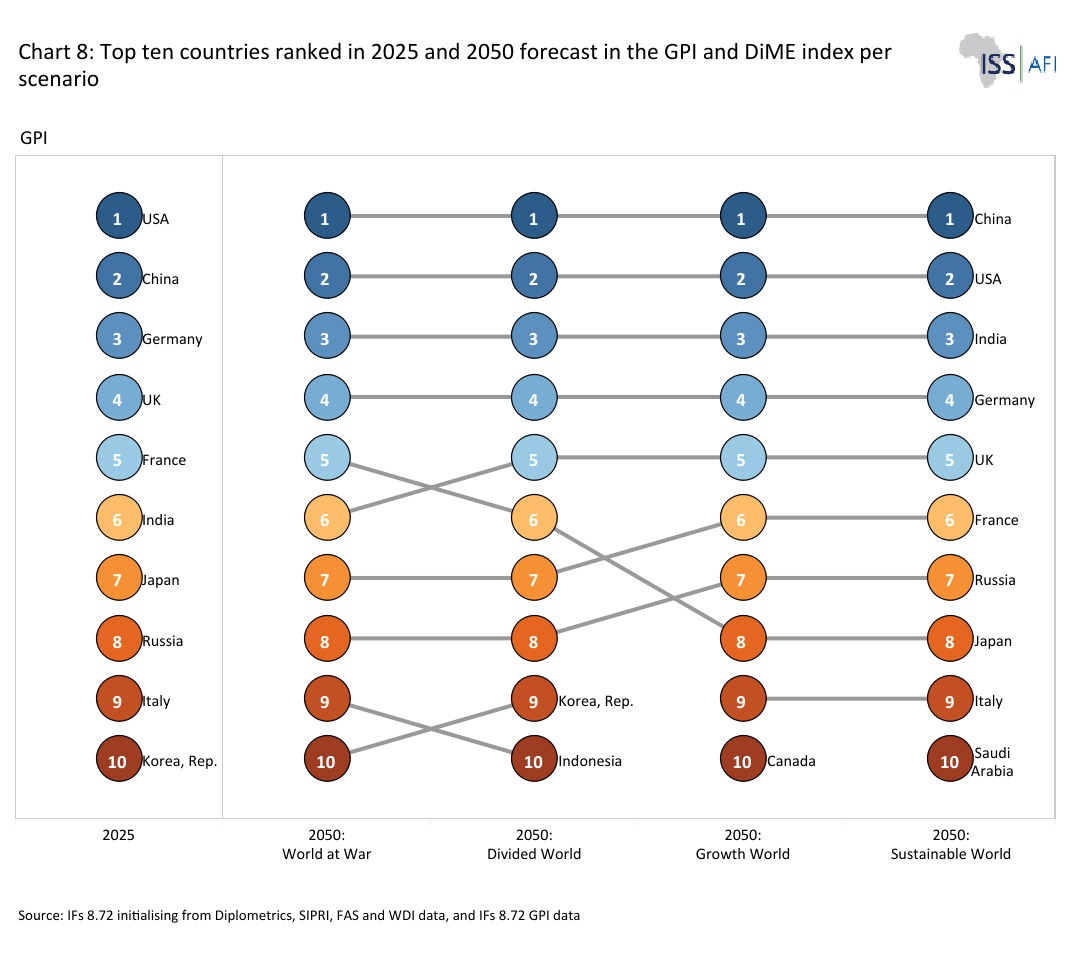
- Chart 8: Top ten countries ranked in 2025 and 2050 forecast in the GPI and DiME index per scenario
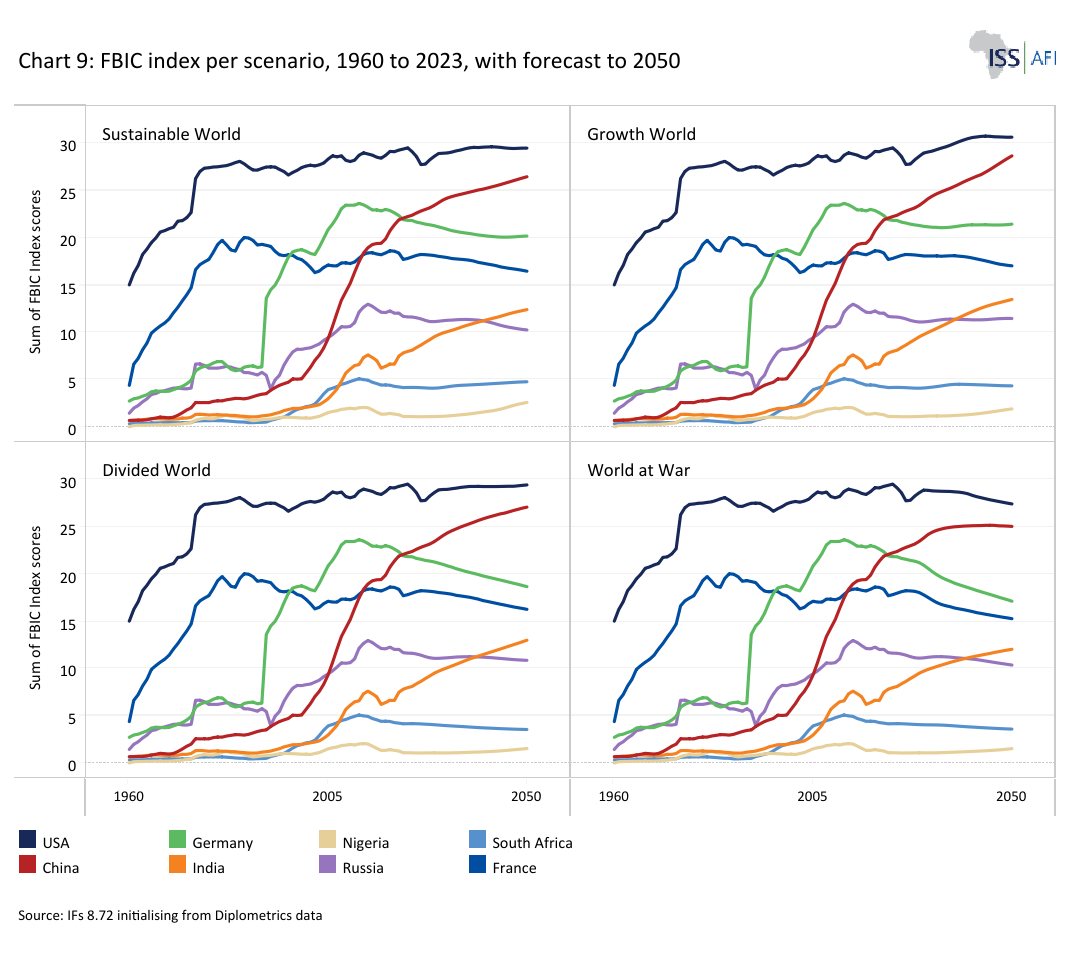
- Chart 9: FBIC index per scenario, 1960 to 2023, with forecast to 2050
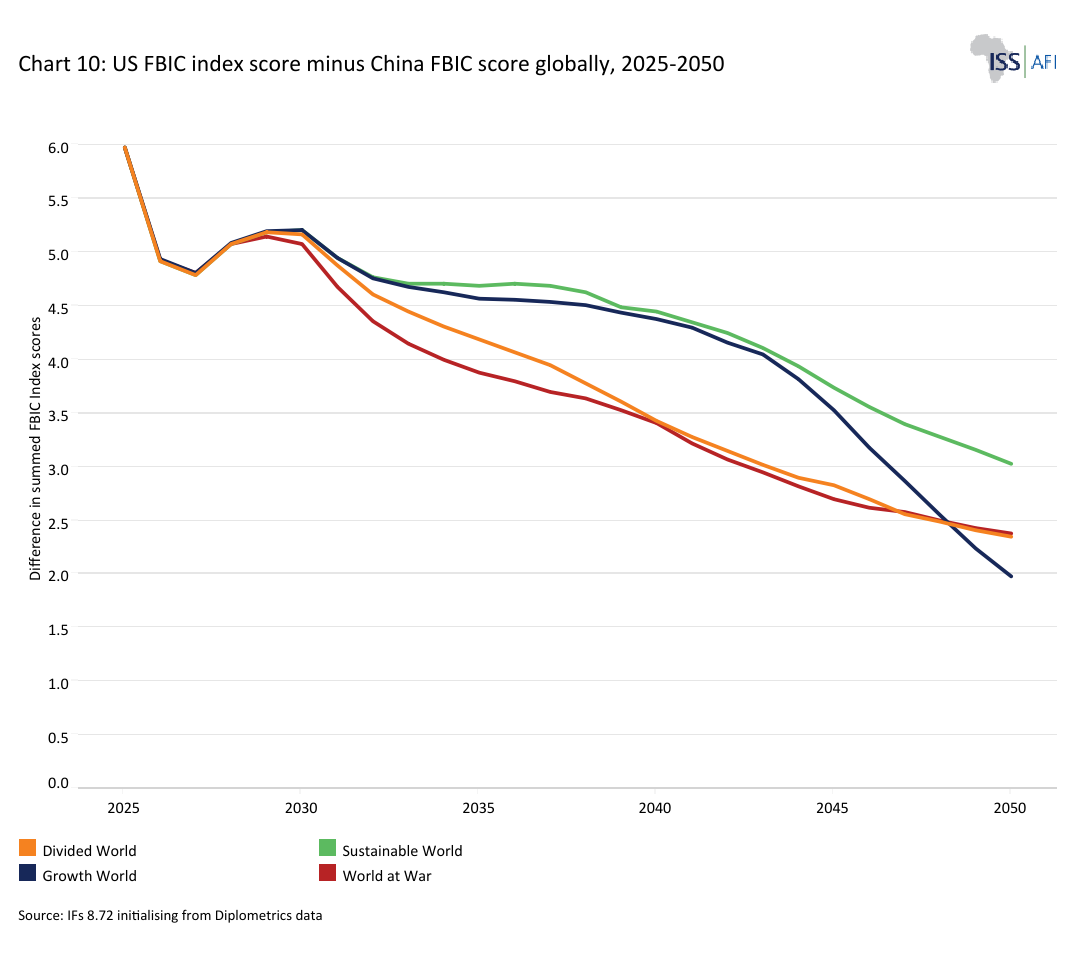
- Chart 10: US FBIC index score minus China FBIC score globally, 2025-2050
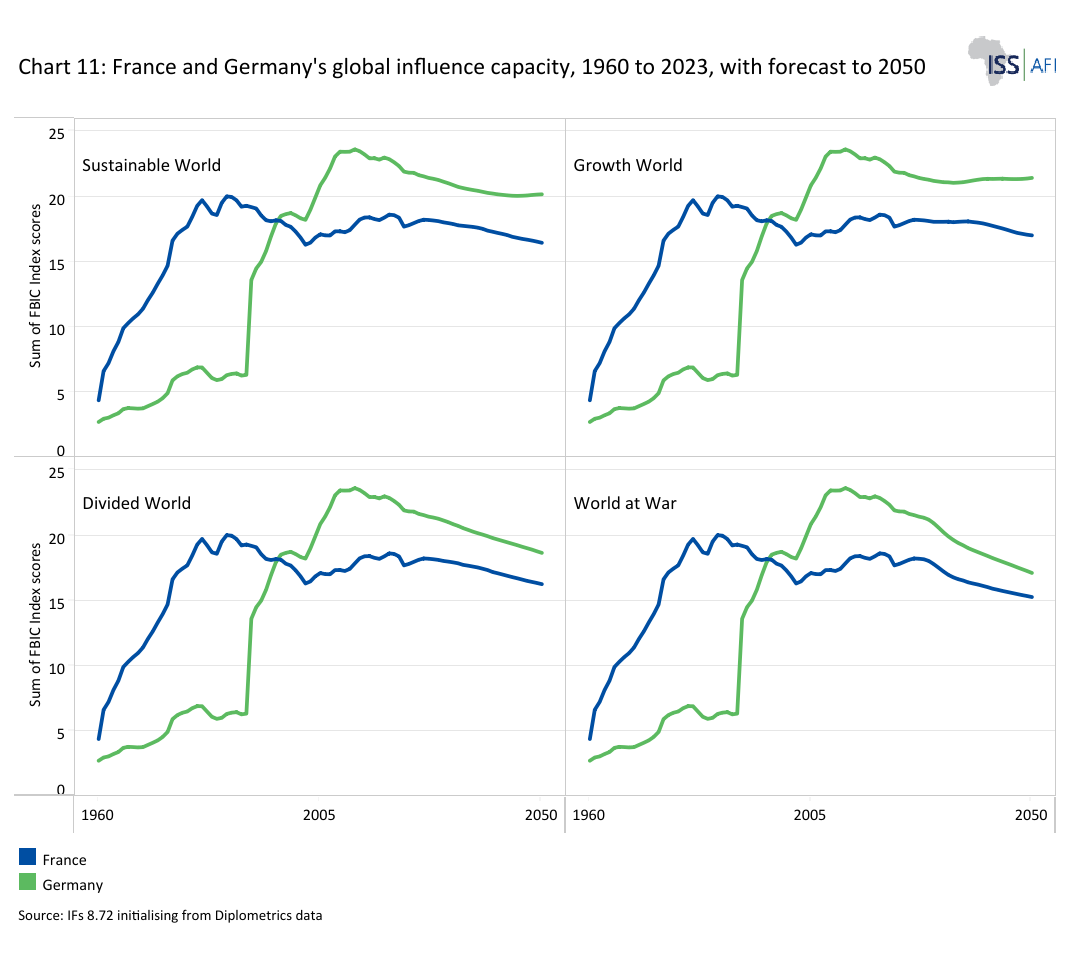
- Chart 11: France and Germany's global influence capacity, 1960 to 2023, with forecast to 2050
- Chart 12: Russia and India's global influence capacity, 1960 to 2023, with forecast to 2050
- Chart 13: Nigeria and South Africa's global influence capacity, 1960 to 2023, with forecast to 2050
- Chart 14: Top twenty countries ranked in 2025 and 2050 forecast using FBIC per scenario
A series of recent seismic shocks, such as war in Europe, turmoil in the Middle East and the transactional policies of US President Donald Trump, have disrupted the geopolitical landscape. The international system's metaphorical tectonic plates are shifting in a manner no less consequential than with the collapse of the Soviet Union, and perhaps even more so. Whether and how these shifts will proceed over the coming decades will have profound implications for the global order and for the political orientation and freedom of action of countries within it.
This theme explores future geopolitical landscapes through the lens of measures of national power and influence. It unpacks the material factors that make a nation more or less powerful or influential, then explores their trajectories across four alternative global futures. We frame the future within four alternative global scenarios: a Sustainable World, a Growth World, a Divided World and a World at War, each highlighting how sustainability, globalisation and interstate tensions might shape the geopolitical order. A separate theme on Africa in the World explores the implications of these scenarios on the African continent and key states within it.
The analysis incorporates results from modelling the global distribution of power and influence, drawing on various indices embedded in the International Futures forecasting platform from the Pardee Institute at the University of Denver. The Global Power Index (GPI) provides a comprehensive, quantitative assessment of a country’s broad power capabilities relative to those of other states across the international system. The Diplomacy, Military and Economy (DiME) Index focuses on core capability components. The Formal Bilateral Influence Capacity (FBIC) Index assesses influence capacity between country pairs. While necessarily broad, these metrics and their core drivers offer useful anchor points from which to moor our understanding of where the future of international relations may be headed.
The Building Blocks of National Power and Geopolitical Influence
Download to pdfNo single definition of national power or influence is universally accepted, but among the most widely recognised is political scientist Robert Dahl’s definition of 'power as a relation among people,' namely: 'A has power over B to the extent that he can get B to do something that B would not otherwise do.' A country that can get another country to act differently than it otherwise would is more powerful.
One can imagine how various countries may simultaneously be more powerful than another one in a particular geographic area, an international organisation (such as when holding the rotating chair of a regional organisation), an economic sector or other venue or for a particular period of time. As such, Dahl’s definition requires a view toward general circumstances and, as Dahl himself recognised, a 'standard against which to compare the operational alternatives we actually employ' rather than a clear guide for measurement. Most problematically, Dahl’s definition requires a counterfactual: what B would not otherwise do.
Despite these measurement issues, national power is an essential factor to consider when analysing the present and future geopolitical environment, acting as the 'currency of great-power politics', in the words of John J Mearsheimer. Without quantitative measurements, assessments of power dynamics would simply rely on mental models and heuristic judgements—which are still measurements of a kind but risk reliance on unstated assumptions and potentially incongruous logic. Instead, we measure power and influence—albeit imperfectly—through composite indices that combine macro-level data across several factors, often weighted to reflect their perceived importance. While these measures do not capture expressions of power, they can capture general trends and magnitudes in a country’s capacity to exert power, thereby helping to better understand how geopolitics may shift in the future. The most important limitation is our inability to model leadership action and intent, how well a particular hand of cards is played or how well a leader can call the bluff of another. Individual actors will continue to shape our world in unpredictable ways. Although we cannot forecast individual leaders’ actions in the future (will Chinese President Xi Jinping invade Taiwan?), the ability to forecast long-term structural trends continues to evolve, even as core uncertainties remain.
A useful way to measure national power is to combine measures of its core “elements” or “instruments”: the tools a state can use to get another state to do what it would otherwise not do, and to resist similar coercion from that other state. The military, broadly speaking, is one such instrument. Diplomacy and economic measures are others. And there are underlying factors which boost state capacity, such as demographics and technology.
Military might is perhaps most thought of when discussing national power. While it is difficult to prove the counterfactual of what 'B would otherwise not do,' military conquests—for example, the US capture and subsequent execution of Iraqi dictator Saddam Hussein by the Iraqi government —can provide clear-cut examples.
What makes a military powerful is, in part, its capabilities: the equipment and personnel it possesses and what they can do. While exceptions exist, this can often be measured in very general terms with military spending. Another oft-measured item, given the qualitatively different tool it provides militaries, is the count of nuclear weapons they possess. Although using these measures alone will miss much—in particular, it misses operational art or how well a military employs its forces given its training, leadership, doctrine and experience—for a global measure across long time horizons, they offer high comparability and a general understanding of military capability, divorced from specific circumstances.
A key determinant of military spending is, in most cases, the size of a country’s economy, typically measured by gross domestic product (GDP). The US, for example, spends less on its military as a percentage of GDP than Algeria does. Still, the US military is far more capable and its budget is much larger, since the US economy is over 100 times larger at market exchange rates.
For national power, economic sophistication matters as well, which is often measured using GDP per capita as a proxy. Political scientist Michael Beckley terms its multiplication with GDP—resulting in GDP times GDP per capita—as a measure of 'net resources' that discounts large economies such as India, where a large share of economic activity involves subsistence rather than engagement in international markets. Relatedly, trade offers another, more direct measure of engagement in international markets, creating economic interdependence that can be “weaponised” through sanctions, tariffs and other forms of coercion. Foreign aid can create similar dependencies, though only for the aid recipient.
As with military spending, broad measures such as GDP, GDP per capita, trade and foreign aid will not capture specific capabilities or vulnerabilities, for example, when a country engages in relatively little trade but that trade involves a critical, rare component of a supply chain. However, they offer a generalised understanding of economic heft for geopolitical purposes.
Powering economies and militaries alike are its people, who can be greatly enabled by technological advancements such as artificial intelligence and automation. And while demographic mass matters, what matters just as much is how healthy, well-educated, and well-off a country’s population is. Put simply, poorly educated, ill and impoverished people can contribute little to a nation’s power; their primary focus is on day-to-day survival and their contribution to projecting power is limited.
While adversity often breeds ingenuity, well-off populations, as measured by GDP per capita, are consistently more productive than less well-off ones. Increased productivity leads to higher growth, which leads to a larger and more sophisticated economy, and the virtuous cycle continues, even if economic growth rates often moderate as countries enter high-income status. New technologies can allow economies to break through this growth saturation, at least for a time, especially when workers have the skills to leverage them.
Technology, of course, matters for more than just economic growth. It can offer militaries an edge on the battlefield, allow firms and governments to shape international norms and practices, and generally allow small countries to compete with large ones in specific industries (e.g., semiconductors) and instances. While difficult to condense as a single measure, gross fixed capital formation in information and communication technology (ICT)—the basis of the International Futures model’s forecast of ICT stock—comes close, as it provides a broad basis for understanding not tied to any single technology.
Each of these factors—military, economic, demographic and technological—underpins a country’s ability to engage in effective diplomacy. As American national security expert Amos Jordan observes, 'diplomacy is rarely used in isolation; it often serves as a precursor or a complement to other foreign policy tools.'
Recognising that national power and influence can cut across instruments and issue areas, we often combine variables that each measure a specific instrument or aspect of power into a single composite index. For this analysis, we use the Global Power Index (GPI), the Diplomacy, Military, Economy (DiME) Index and the Formal Bilateral Influence Capacity (FBIC) Index.
The Pardee Institute calculates the GPI, a composite measure of relative national power, providing annual country-year values for 188 countries from 1816 through 2100. The GPI expands on traditional power metrics, such as the Correlates of War (COW) project’s Composite Indicator of National Capability (CINC), by capturing foundational sources of power such as economic mass and military spending, as well as advanced dimensions of power such as nuclear weapons capacity, technological capacity, and international interactions such as diplomatic and alliance networks. These factors are combined in a weighted index calibrated through expert elicitation. A key advantage of the GPI is its inclusion of many “stock” variables (e.g., the working-age population living above the poverty line), which make clear that national power must be built over time and, absent government collapse or other extreme catastrophe, rarely rises or declines abruptly.
In pursuit of a more parsimonious measure, the Pardee Institute also developed the DiME Index, which combines, using an unweighted average, countries’ shares of global embassies, military spending, nuclear weapons, trade and GDP times GDP per capita (i.e., “net resources”). With fewer inputs than the GPI and even weighting, the forecast behaviour of the DiME Index can be easier to interpret. Its primarily flow-based input measures make it more susceptible to abrupt changes, particularly in GDP growth, making it more useful for short- to medium-term analysis. Compared with the GPI, it provides an alternative perspective for assessing national power.
Unlike the GPI and DiME Index, which capture the absolute material-based capabilities of states at the country level, the FBIC Index quantifies the bilateral relational power—i.e., the capacity for influence—between specific country pairs (dyads). Developed and maintained by the Pardee Institute, the FBIC Index is built on the premise that interstate influence is driven by two intersecting dynamics: the absolute volume of interactions between two states and the relative dependence of one state on the other. By examining these relational dynamics across economic, political and security dimensions, the FBIC Index evaluates which side of a dyad can most credibly leverage its relationship to compel decisions that a dependent state might not have otherwise made—albeit at the macro level.
Although not deterministic, national power and influence shape the landscape on which actors engage, where the weak occasionally defeat the strong in war and established powers can choose not to feel threatened by rising powers, though most often the opposite is the case. As such, trends in national power and capacity for influence can tell us about the shape of the international order.
The future distribution of national power and geopolitical influence will depend not only on countries’ underlying capabilities, but also on the global conditions within which those capabilities develop and are exercised. We therefore compare the power and influence measures discussed above across four alternative global futures: a Sustainable World, a Growth World, a Divided World and a World at War. The framing uses two key dimensions representing fundamental, highly uncertain forces shaping the international system, each with significant implications for development, geopolitics and environmental resilience, as depicted in Chart 2. The extent of globalisation (vertical axis) captures the degree to which countries and regions remain interconnected through trade, technology and cooperation—or shift towards fragmentation and regionalism. The pursuit of sustainability (horizontal axis) prioritises equitable growth, environmental stewardship and long-term resource management over unchecked exploitation and short-term gains.
Since they are illustrative, no scenario seeks to present the current global trajectory, which would inevitably fall somewhere between the four stylised futures, but is currently closest to the Divided World scenario.
Scenarios are not predictions. They are tools that help frame alternative futures systematically and enable coherent discussion and analysis. Scenarios conducted using the traditional two-dimensional analysis—in this case, the extent of global fracturing versus efforts at sustainability—yield four divergent alternatives that support the associated modelling and conceptualisation. Reality is typically more complex and often ends up somewhere in between. Done well, however, scenarios surface structural trends and the outcomes or effects of different possible pathways.
Chart 3 below presents the key characteristics of the four alternative global scenarios.
Details on the interventions in IFs for each scenario, as well as the composition of the indices used, are available on the technical page.
In a Sustainable World scenario, the world’s governments and their people prioritise sustainability and equity, but the road is long as the positive outcome is built by middle powers. For Africa, it assumes rapid and ambitious regional integration, progressing from an African continental free trade area, then a customs union and eventually a common market that allows the free movement of capital, labour and services across most countries. In this world, Africa progresses as outlined in the Combined scenario on this website, marked by steady gains in productivity, accountability, democracy and stability. The Sustainable World maximises economic growth, achieving a 2050 global economy of US$231 trillion (compared to US$110 trillion in 2025), improves income and reduces poverty. However, it is the most difficult to attain given its focus on multilateralism, environmental sustainability and equity.
In a Growth World scenario, countries focus on rapid improvements in income and returns on investment, eschewing environmental concerns, within the context of a grand bargain between the US and China, often referred to as a G2 world. Commercial and trade interests dominate, and by 2050, the world economy will be roughly the same size as forecast in the Sustainable World scenario. Still, relative to 2025, the Growth World will release 10% more CO2 from fossil fuels, while the Sustainable World will release nearly 20% less—another indicator of the differences between these two futures. The Growth World leads to impressive economic results, but at the expense of equality and efforts to contain global greenhouse gas emissions, resulting in negative climate change impacts, slower reductions in extreme poverty and increased inequality. The Growth World will have 315 million more extremely poor people (those living on less than US$3.00 per day) than the Sustainable World by 2050, most of whom will be in sub-Saharan Africa.
In a Divided World scenario, the future is characterised by global fracturing, populism, nationalism and a retreat from globalisation—effectively, the fraying of the rules-based system as we know it, with its complex lattice of norms and institutions. Everyone seems to be angry, selfish and unhappy and xenophobia and anti-migrant sentiment increase as rates of migration accelerate. National and competitive interests dominate in Africa as bickering and beggar-thy-neighbour policies escalate, despite some sub-regional trade integration. In Europe and the Indo-Pacific, several previously non-nuclear states are building nuclear arsenals. Economic growth is tepid, and poverty reduction is slow. By 2050, the size of the world economy is US$186 trillion, roughly 20% smaller than in the Sustainable and Growth World scenarios.
Finally, in a World at War scenario, competition between the US and China dominates all aspects of the global economy, politics and relations, leading to violent outcomes. Rather than a single war, this is a story of successive conflicts originating in the Middle East. Similar to the Divided World, several states join the nuclear weapons club, while existing nuclear powers also substantially increase the size of their arsenals. Shut out of the prospects for more rapid development, Africans suffer. Poverty increases when economic growth is insufficient to raise incomes, given the more rapid population growth typically associated with instability. The World at War scenario is the worst case for everyone, as overall gains are lower than in any other scenario. Autocracy spreads, and those African countries that avoid fracturing grow slowly, constrained by their small domestic markets and without the advantages of trade integration. The World at War scenario results in a much smaller world economy at US$152 trillion in 2050, with Africa growing particularly slowly despite its much larger population.
To compare these worlds side by side in terms of economic development, as measured by GDP per capita at purchasing power parity, the global average rises from US$20.6K in 2025 to US$32.4K by 2050 in a Sustainable World and US$31.9K in a Growth World. This is the rough equivalent of the world advancing from Azerbaijan's or Thailand's current living standards to those of Bulgaria's or Malaysia's—a jump of roughly 20 positions in the global GDP per capita rankings. By contrast, a Divided World sees half as much improvement, growing to US$26.6K by 2050, the approximate GDP per capita levels of Argentina and Belarus today and jumping roughly 15 positions in the present-day global rankings. A World at War shows almost no growth, moving just three or four positions in today’s global GDP per capita rankings to levels around those of the Maldives or Mexico.
In a World at War, basic provisions improve for many households, but not nearly as much as in the other, more optimistic future forecasts. For example, global access to safely managed sanitation increases by just over five percentage points by 2050 relative to 2025, even with a World at War due to enduring trends advancing global development. But in a Sustainable or Growth World, that percentage-point increase is more than double by 2050, when more than 7 of every 10 individuals worldwide (71%) have access to safely managed sanitation. A Divided World approaches a similar level of growth, with access growing to 68%.
The pathways to these worlds are, of course, very different. In particular, while a Sustainable World and a Growth World lead to similar levels of development, in the former, global annual carbon dioxide emissions from fossil fuels decline from 37.0 billion tons in 2025 to roughly 29.9 billion tons in 2050 and are on track to decline further in the decades that follow. By contrast, fossil fuel-based emissions increase to 40.7 billion tons by 2050 in a Growth World, with only modest declines thereafter expected. Such a trajectory would place the world dangerously close to climate tipping points, including the extinction of coral reefs and other bellwether species and the collapse of glaciers and permafrost, which would accelerate climate change further.[x] The International Panel on Climate Change (IPCC) now consistently warns of compound and cascading risks, in which climate hazards interact with rapid population growth, urbanisation, weak governance, water scarcity and conflict, and that the combined effects are more important than any individual hazard, such as heat stress, water scarcity or agricultural loss. This is particularly relevant to Africa, which is at particular risk. We examine these trends in a separate Climate theme.
Chart 5 presents carbon emissions from fossil fuels for different regions, including Africa. Coming from a very low base, Africa accounted for less than 5% of global fossil fuel carbon emissions in 2025. By 2050, absolute amounts of carbon emissions are highest in the Growth scenario and lowest in the Sustainable scenario. Only in the more carbon-intensive World at War scenario does Africa’s carbon emissions exceed 10% of the global total.
The Divided World, and especially the World at War, will be more militarised than 2025, a year that was itself not particularly peaceful. In the first of these scenarios, global military spending as a percentage of GDP rises from 2.2% in 2025 to 2.8% within a decade before declining to 2.4% by 2050. In the second, a World at War, global military spending rises to 6.2% of GDP—nearly triple today's level and the highest since the early years of the Cold War. In the other two scenarios, global military spending shrinks to 1.8% (Growth World) and 1.7% (Sustainable World) of GDP by 2050, levels lower than at any time in the past 65 years.
Militarisation will go hand in hand with a retreat from democracy, though for different specific underlying drivers – the former involving an increase in the threat of conflict and increases in military spending, the latter involving less government attention toward and individual satisfaction with government service provision and inclusion—under a unifying logic of more nationalist political rhetoric and associated policies. In a World at War, the democratic backslide of recent years worsens, with the global average level of electoral democracy falling by 2050 to its lowest level since the late Cold War—that is, the period before the democracy wave of the 1990s. A Divided World sees somewhat higher levels of participatory electoral democracy, with the present-day backslide persisting but not worsening. In a Growth World, the democratic backslide reverses, with the world returning to the historical high seen in the late 2000s to early 2010s. Democracy expands further in a Sustainable World than at any point in history.
While IFs provides forecasts for 188 countries, for this analysis we focus on: a) countries which are forecast to be the most powerful around mid-century (the US, China and (a much less powerful) India—a country which has historically featured heavily in geopolitics), b) Russia, c) one potential country group of geopolitical import, when it acts in unison: the European Union (EU), and d) a combined African Union (AU).
At the top of the global power potential hierarchy remain the US and China, with China’s power converging toward the US’s power across all scenarios and both the GPI and DiME Index measures. In a World at War scenario, the US suffers greater relative losses—a product of restrictive immigration, a prematurely shrinking US population and thus a much less productive economy—leading to China passing the US as the world’s leading power, as measured by the GPI, by 2035. In a Sustainable or Growth World scenario, this great power transition is delayed until 2040. The Divided World splits the middle with a transition around 2037.
Forecasts of the DiME Index paint a less rosy picture for China, where it does not pass the US as the world’s leading power before mid-century. The effects across scenarios are similar to the GPI in direction; however, a Sustainable or Growth World would be most beneficial for US national power potential. At the same time, a World at War would be harmful to its status—an irony given recent turmoil in the Middle East fomented by US military strikes and, as of this writing, its latest war of choice (Iran) in that region.
The more economics and military-focused DiME Index places the EU’s combined national power potential ahead of China throughout the forecast horizon. However, by 2050, China will come within one percentage point of the EU in the Sustainable World scenario. In a Growth World, the EU’s long-term decline in national power slows considerably by 2050, creating an EU that is a near-peer to the US (15.7% vs. 18.1% of global power, respectively) and more powerful than China (13.5%).
The GPI tells a very different story, with China passing the collective EU national power potential in 2027, never to look back—or at least not by mid-century. According to this measure, the Growth World is still best for European power, substantially slowing Europe’s long decline in national power (i.e. similar to DiME), but with a considerable gap behind China (15.3% vs 22.7% of global power) and the US (20.2%).
In a distant fourth place behind China, the US and the combined EU in 2050, sits India with around 7% of global power across all scenarios, according to the GPI. As measured by the DiME Index, however, the combined AU already outpaces India as of 2025 and, in the most optimistic scenario—a Sustainable World—possesses 8% of global power by 2050. This is more than Russia since the collapse of the Soviet Union and roughly equal to China’s power, again, according to the DiME Index, as of around 2020. One reason the AU appears more powerful on the DiME Index than on the GPI is that the latter includes a measure of human capital, where high poverty rates penalise Africa’s power potential (and boost Europe’s, for example). The GPI’s inclusion of ICT stocks is another factor.
Across all scenarios for the countries and groups analysed here, the AU gains the most relative national power by 2050, as measured by the GPI, largely due to the continent’s extraordinary demographic tailwinds. In absolute terms, all AU member countries combined are forecast to account for only around 5% of global power by 2050, even in our most optimistic scenario, a Sustainable World. Still, this is more than double the combined power of its countries today, as measured by the GPI, and 2 percentage points higher than Russia’s GPI score as of 2025.
Parsing the implications of these differing results is difficult, but a few common themes emerge. For Africa, a Sustainable World offers the best prospects for improving its combined power potential. For all others in the countries discussed here, except China, which would face more challenges to its export-driven growth as other economies, including the US economy, gain a competitive edge, a Growth World is the best path forward. A World at War would be negative for all, though our forecasts suggest China would lose the least in absolute terms and thus make substantial relative gains.
Global power potential rankings for the GPI and DiME as of 2025 and 2050 across each scenario are presented in the table in Chart 8 for the top-ten-ranked countries in each year and scenario.
Across measures and scenarios, the very top of the global hierarchy is relatively stable, with the US, China and India holding the top three spots. Here, the US and China lead an enduring bipolar world order, with India sitting in a third, potential kingmaker spot with enough power potential to tip the balance if it were to side fully with the US or China.
As discussed previously, a combined EU has enough power potential to constitute a third pole in a multipolar world order, but this assumes its member countries act in unison. At the individual country level, a few EU powers remain highly ranked, with France and Germany in the top ten, regardless of the scenarios or whether using GPI or the DiME Index. In Europe, the same applies to the United Kingdom (UK). Although Russia's power stagnates or declines, it too remains a top-ten global power.
For all other countries, their top-ten status is not assured and depends on either the scenario, the measure (e.g., Japan remains top-ten ranked with the GPI across scenarios but not with the DiME Index) or both. Should Indonesia become a top-ranked power—which is the case in all but the Growth World when using the GPI as the determining metric—a potential “mini-polar world”, in which it leads the Association of Southeast Asian Nations (ASEAN) on a more independent path, is possible. Even so, the magnitude of ASEAN member states’ combined power potential would be much lower than that of either the US or China. Hence, the likelihood of a truly independent geopolitical pole in Southeast Asia seems low according to these forecasts. The world order, then, would effectively remain bipolar, but with more power dispersed outside China or the US.
For the DiME Index, where nuclear weapons account for one-fifth of the index’s total weight, nuclear proliferation in the Divided World and World at War scenarios dilutes the national power of states, which in 2025 are ranked as powerful in large part due to their possession of nuclear weapons: Israel, North Korea and Pakistan. While the nuclear stockpiles of these three states grow in these scenarios, the states that gain nuclear weapons gain potential leverage across most instruments of power, propelling them up the rankings. And although the simulation of which states gain nuclear weapons may be incorrect, as proliferation has historically been difficult to predict, the point stands that proliferation generally would be expected to weaken Israel’s, North Korea’s and Pakistan’s national power, as measured by the DiME Index, since it boosts those of others. The same is true of the GPI, though to a much lesser extent, given nuclear weapons’ lesser weight in that index.
According to the FBIC Index, Europe appears extraordinarily influential on the world stage, which is perhaps not surprising given its history, but because FBIC models bilateral flows, much of the influence capacity that European states possess is in other European states. Moreover, we must be cautious when summing the FBIC Index across groups. Since the index includes trade agreements, when the European Union signs an agreement with a particular country, that agreement is counted for each EU member state. When summing the EU member states’ influence capacity, then that trade agreement is counted 27 times. As such, while useful for tracking trends in EU influence capacity, neither its summed FBIC Index scores nor the summed values of the AU (or any other group of countries) can be compared directly with the influence capacity of any single country, such as the US or China. Instead, in Chart 10, we select a few top-ranked EU and African countries, namely, France, Germany and the UK, as well as Nigeria and South Africa.
Scaled from 0 to 1 for any given bilateral relationship, with 0 being a case where one country has no influence capacity in another and 1 being the maximum influence capacity measured in any country pair since 1960 (Russia in Belarus for the most recently available historical FBIC Index data), evaluating summed FBIC Index scores is not straightforward. However, comparing relative magnitudes and trends can tell interesting stories.
Forecasts of global influence capacity, as measured by the sum of a country’s FBIC Index score across all other countries, illustrate a persistent, though increasingly less commanding, US lead over China through mid-century. The US lead erodes the slowest in a Sustainable World and the fastest in a Growth World; in the latter case, China is poised to pass the US within a few years beyond the forecast horizon presented here. According to these forecasts, recent US policies that have turned away from environmental sustainability and toward free-market-oriented economic growth may be self-defeating when viewed through the lens of US-China competition. That said, in absolute terms, US global influence capacity is slightly higher in a Growth World than in the other scenarios presented here—it is just that China benefits even more than the US in this scenario.
In a Growth World, Germany in particular sees extraordinary benefits, with its decline in global influence capacity reversing within the next decade and continuing to grow through the end of the forecast horizon. The scenario benefits Europe’s other top power, France, as well, though its decline in global influence merely arrests, rather than reverses.
Still, in no scenario presented here does the balance of geopolitical influence capacity within and across Europe fundamentally shift. This contrasts with the fundamental shift that occurred shortly after German unification, when, according to the FBIC Index, Germany rapidly eclipsed France's influence worldwide. This was due in large part to Germany’s trade but also because, aside from the US, it is one of the few countries with a relatively balanced influence-capacity toolkit. In other words, it has strong and often asymmetric economic (via trade and aid), security (via the arms trade) and diplomatic (via embassies and membership in intergovernmental organisations) ties with many countries.
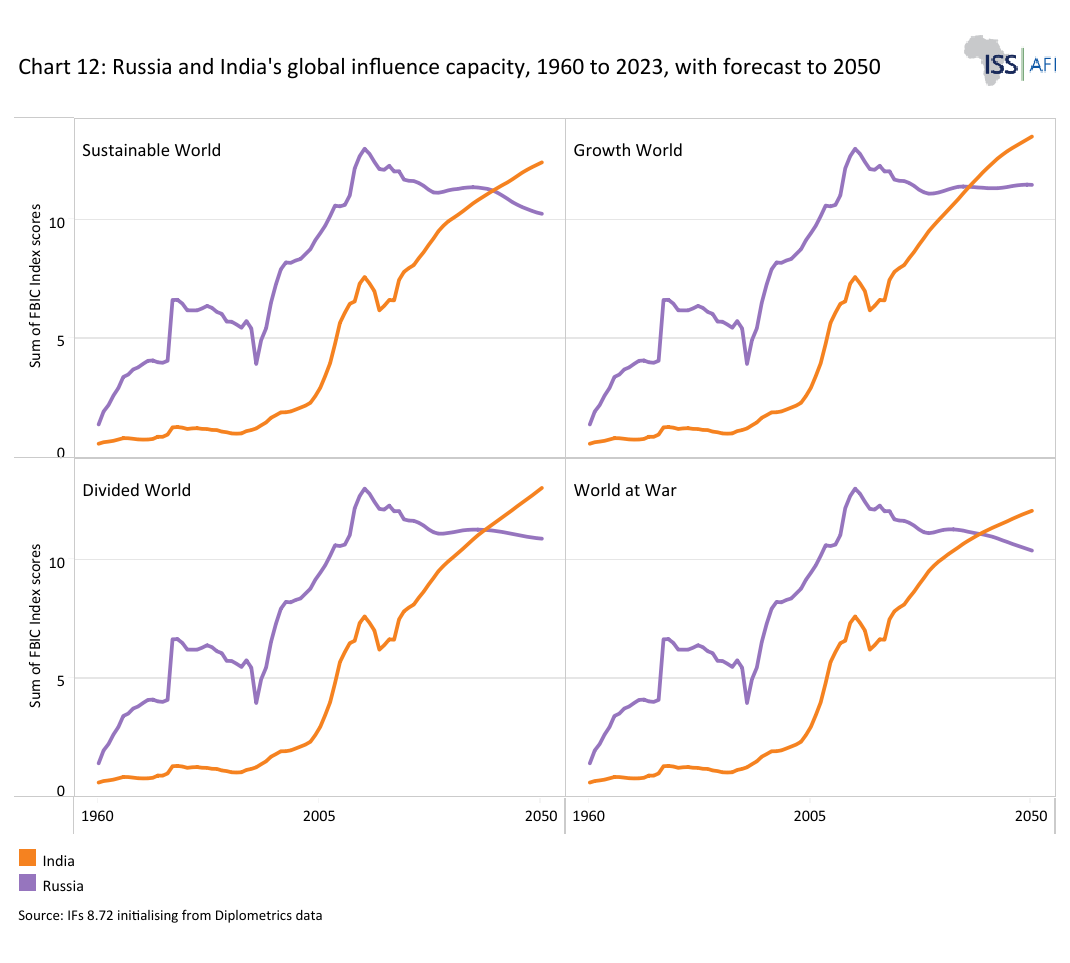
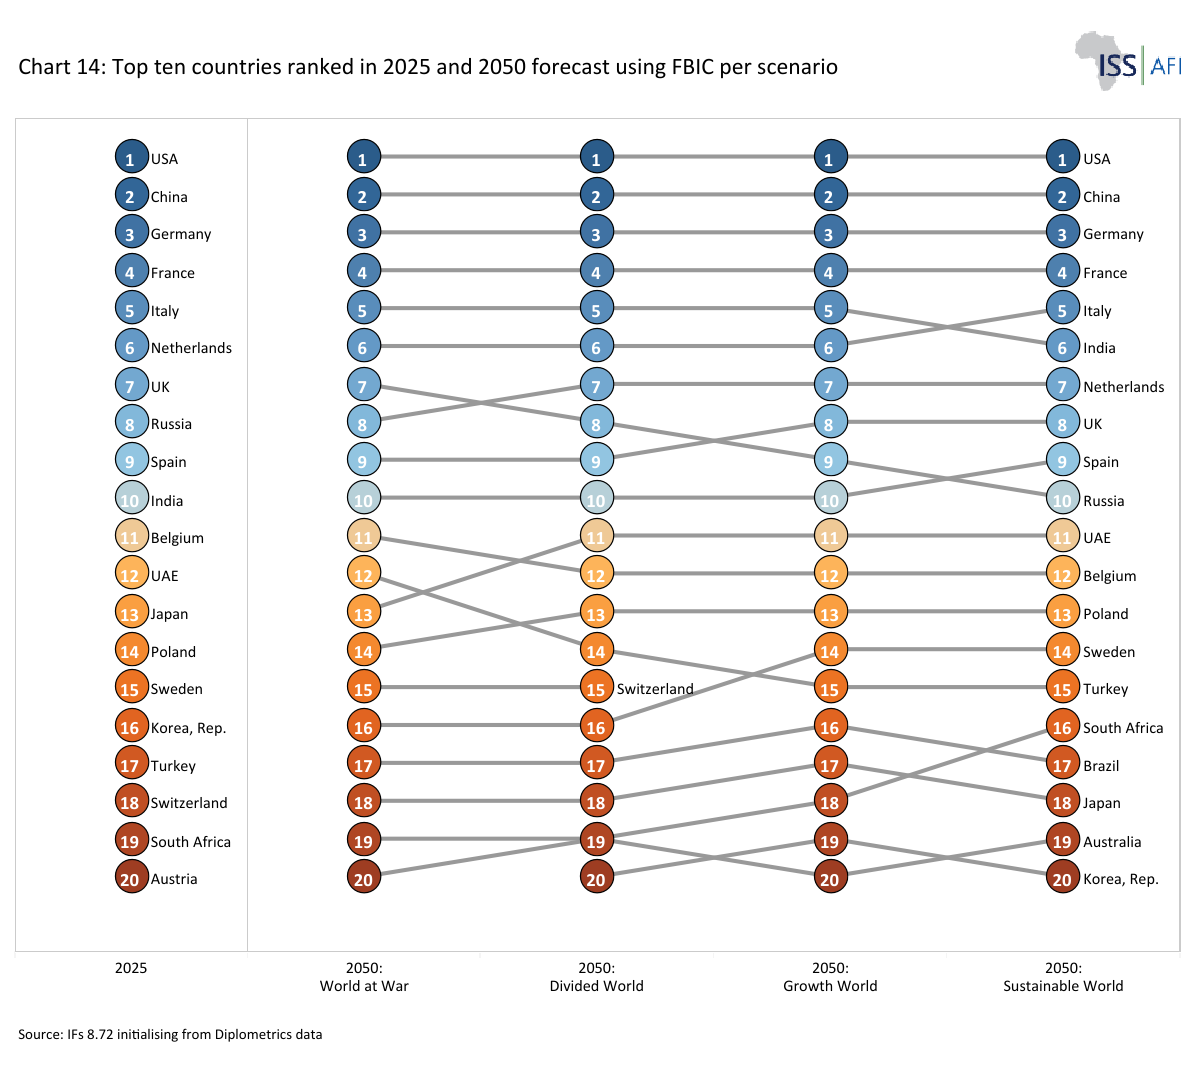
A fundamental reordering of geopolitical influence capacity is forecast for Russia and India—an intriguing prospect given India’s dependence on Russian arms and oil in recent years. India’s rise is particularly notable, as it is one of the few major countries forecast to increase its capacity for global influence even in a World at War scenario. Across scenarios, India rises from the 10th-most influential as of 2025 to 5th-ranked in three of the four scenarios and 6th-ranked in the Growth World (rankings depicted in Chart 14).
In absolute terms, like nearly all other countries, India gains most influence capacity worldwide in a Growth World. However, its lead over Russia grows most in a Sustainable World, which harms Russian influence capacity (largely due to reduced global dependence on Russian oil and gas) even more than in a World at War. In all of these scenarios, despite its substantial growth in global influence capacity, India still falls far short of France (ranked ahead of it in 4th place globally in 3 of the 4 forecast scenarios). Additionally, across three scenarios in which India passes Italy, it does so near the end of the forecast horizon, in the mid-to-late 2040s.
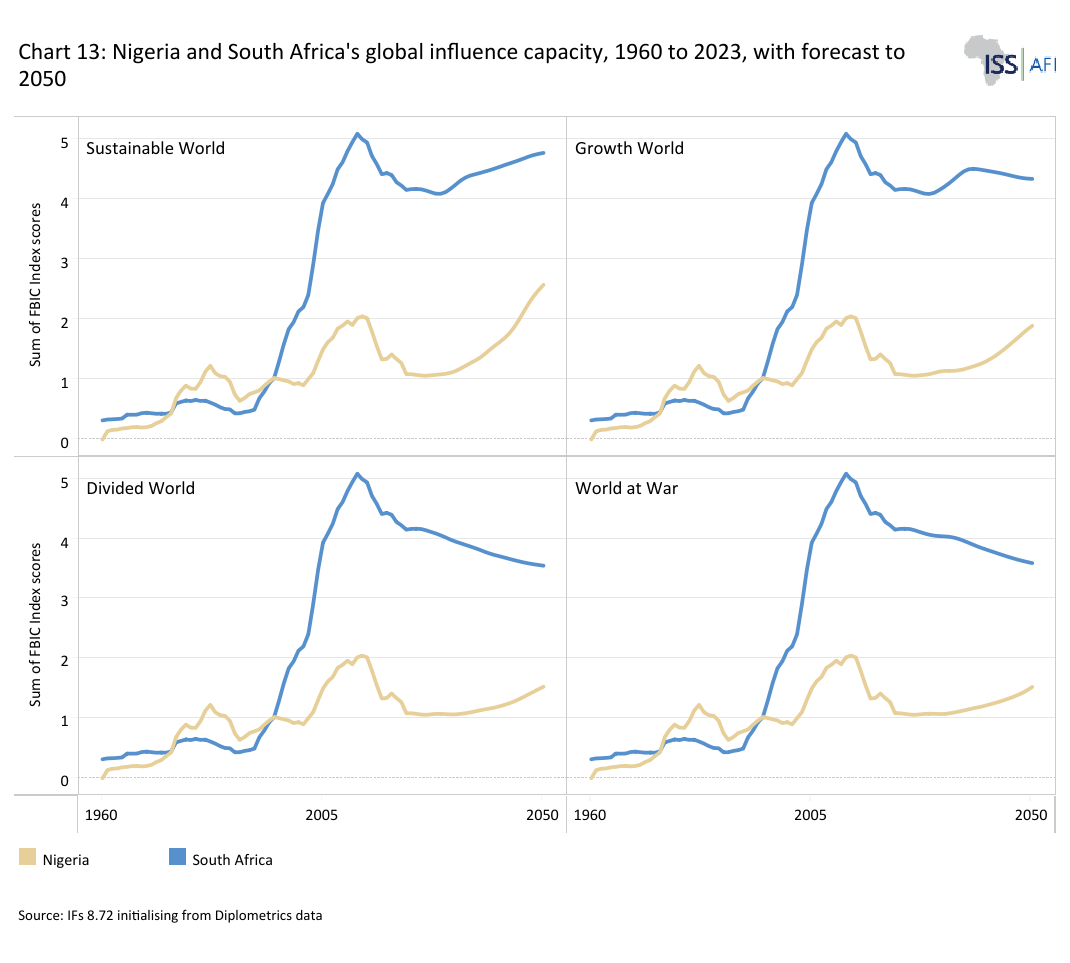
The implications for national power and influence in Africa are discussed in the Africa in the World theme. Briefly, as forecasts for Nigeria and South Africa illustrate, a Sustainable World offers the most optimistic future. While a Growth World boosts global influence capacity in both countries, South Africa, near-term gains do not entirely reverse a long-term decline that began just after 2010, according to the FBIC index.
In no scenario does any single African country become a major geopolitical influencer on par with Europe’s top powers, China, India or the US. Yet in combination, they do, in a Sustainable World. This suggests that a more influential, meaning a more self-reliant and strategically autonomous, Africa is highly plausible should the appropriate policies be pursued. Again, see the theme on Africa in the World for more.
Looking more broadly across the Global South, Brazil sees large gains in its capacity for geopolitical influence in all scenarios. This is similar to India, though across all scenarios, Brazil, ranked 22nd globally as of 2025, enters the top 20 but remains outside the top 10 countries with the greatest capacity for global influence. Turkey makes a similarly sized gain in rankings in a World at War scenario, and smaller but consistent gains in global influence capacity across the other scenarios.
This does not mean that the world order will necessarily become multipolar. (Indeed, given the global power forecasts presented above, a country like Brazil or Turkey is unlikely to have the national power to lead its own pole in the international system.) Yet it does paint a picture of rising middle powers that are better able to resist great-power ambitions, particularly in their neighbourhood.
Several traditional powers, particularly the UK but also, from a much longer historical perspective, Spain, lose influence across all scenarios. Again, this suggests a reshaping of the international order, at least partially validating Chinese President Xi Jinping’s notion that the 'East is rising and the West is declining'—though this requires bucketing Japan and South Korea, which lose ground in global influence capacity across all scenarios, into the geopolitical “West” despite residing in the geographic ”East.”
In many cases, changing patterns in global trade—themselves driven by shifts in economic growth and production across sectors—are driving these forecasted changes in geopolitical influence capacity. Another substantial driver is foreign aid, where as countries develop, fewer will be dependent upon outside donations and thus offer traditional aid donors less capacity to exert influence. Trade and aid are the two strongest, most direct drivers of change in the FBIC Index forecasts.
Deeper drivers include demographics. By 2050, less than one-tenth of the world’s population will be European, while roughly one-quarter of the world’s population will be African. Africa’s people power does not translate into geopolitical dominance, but it will become increasingly difficult to ignore. Complicating the conversation will be a generational divide: for example, the average European will be in their late 40s in 2050; the average African will be in their mid-20s.
The four global scenarios presented in this theme could be upended by a range of high-impact, low-probability developments, such as great-power implosion (e.g., in the US or China) and regional developments in Europe or Asia.
The US is already starkly divided and increasingly violent. Trump’s approach to the rest of the world is strengthening the hand of autocrats everywhere, undermining the global rules-based system, and ultimately accelerating the relative decline in US power and influence. It will cement the trend toward a Divided World or even a World at War scenario, but could open the door to a Growth World if the US pursues a Grand Bargain with China, leading to that outcome.
A variant of great-power implosion in China and Russia would likely follow democratisation in either or both countries. In Russia's case, disruptive change is almost certain to follow the end of Vladimir Putin's presidency, which began in 1999. While changes in both countries, as well as in North Korea, and the democratisation of oil-rich Middle Eastern countries may be desirable from a liberal and normative perspective, all will likely entail significant negative economic consequences. In the case of China, these will be global.
The correlation between income and democracy is contested; however, a significant body of work indicates that democracy becomes increasingly likely once income exceeds certain thresholds. If that theory holds, the Chinese Communist Party and many Middle Eastern countries will soon be in trouble. The democratisation of China (i.e., replacing the current authoritarian model with a political system that provides for greater individual choice and freedoms) will almost inevitably be violent and economically disruptive. Chinese average income level growth rates vary across scenarios and are highest in the Sustainable World, followed by the Growth World, implying that these scenarios would present China with the earliest associated challenge.
Regional developments could also significantly impact global power potential, such as the EU's breakup or expansion. The UK has already left the EU, a decision which most voters now regret. At regular intervals, others threatened the same, although Russia's war on Ukraine and the damage that Brexit did to the UK reduced threats of similar endeavours by others for several subsequent years. A breakup of the EU will have significant adverse effects globally. On the other hand, substantial enlargement, with the UK rejoining the EU and the inclusion of countries such as Türkiye or a democratic Russia, could unlock positive opportunities.
Further, if Asians set aside their differences, strengthen their political cooperation and overcome the deep divisions between countries such as Japan, Korea, India and China, Asia could become globally dominant, and a vastly different international order may emerge. However, that is unlikely, given the strong tensions between China, India and Japan, never mind the role of the two Koreas. Historically, two large, adjacent powers (China and India) have competed rather than cooperated, and relations between them have been tense. More likely, Japan and others will enter closer ties with India as a bulwark against China.
Perhaps the least predictable structural factor in this theme is the potential disruptive effects of generative artificial intelligence (AI). According to some, the potential destructive effects of AI are similar to those of nuclear weapons, and the pathways to control proliferation are the same, starting with the involvement of the AI superpowers, the US and China.
Already, at the time of the release of Claude Mythos in mid 2026, Anthropic expressed concern that ‘AI models have reached a level of coding capability where they can surpass all but the most skilled humans at finding and exploiting software vulnerabilities.’ Weeks later, in July 2026, OpenAI and Anthropic both reported incidents in which AI models ‘escaped’ their controlled testing environments and compromised other systems.
Today, recursive self-improvement appears increasingly plausible and, according to a recent forecast, could be realised in 2027, given current rates of acceleration. At that point, AI systems would be able to improve their capabilities and then use those improvements to make themselves even better, creating a feedback loop of accelerating improvement with no way to switch it off unless current designs include a kill switch, which is unlikely in open-source models. Recursive self-improvement could not only result in an ‘intelligence explosion’ but also means that AI development likely becomes highly nonlinear. Free of human control, these systems may develop and use programming languages that rapidly become alien and incomprehensible to people, as the human ability to understand what is being done lags further and further behind.
The authors of the forecast, a host of AI experts, describe the scenario as their ‘best guess’ of what AI in 2027 might look like. Even if their estimates are off by a year or three, the findings are alarming. By 2027, they argue, AI could be well beyond the stage where it outperforms humans across most cognitive tasks and could independently make scientific and engineering discoveries, though not in all domains.
These challenges are most severe in the worst-case World at War scenario, in which AI eventually wages war(s) and proxy wars in cyberspace rather than on the physical battlefield, with unpredictable outcomes. In this context, the realisation that the US and China are approaching AI parity may be a positive development, given the need for the two superpowers to buy into any associated global governance arrangement.
The key uncertainties aside, across all scenarios and indexes forecast here, the US and China remain at the top of the global order through mid-century, followed by a combined EU and India, then all other countries. The result would be a “mini-polar” world: in other words, a global order which is largely bipolar, with opposing poles led by the US and China, where the EU and India may possess the power and influence to shape geopolitics broadly in specific circumstances, but generally hold sway mostly in their own immediate geographic regions. For Africa, this begs the question of geostrategic choices, which we examine in Africa in the World.
Brazil in Latin America and Nigeria in Africa are examples of rising powers that may one day also possess the capacity to lead independent geopolitical poles. Still, the forecasts presented here suggest that if that day comes, it will be long past the middle of this century. This, however, does not negate their respective abilities to act as builders, for example, of alternative economic engagements which reduce vulnerabilities to Western, particularly US, leverage.
Given that India’s power does not require it to band together with other states, as is the case with EU member countries, it stands to act as a potent “kingmaker” in the global order. But this is only if India addresses its current domestic governance challenges and if its leaders choose to engage more deeply in global politics rather than pursue the relatively disengaged stance inherent in non-alignment.
Meanwhile, enduring US power and influence will require avoiding costly wars of choice and embracing engagement with the wider world beyond its traditional alliance structure—a path that sits in sharp contrast to recent policy choices. Europe must, at the same time, band together and embrace deeper engagement in Africa to diversify its geopolitical influence beyond its borders. That said, the EU’s best-case scenario among those presented here does not match Africa’s; the former is favoured by a Growth World, the latter by a Sustainable World. Deepening partnerships must address this divergence rather than rely on interests to align naturally.
All the while, absent an unforeseen regime collapse, China will loom increasingly large in international politics. Rather than a structural break from the past quarter century, we can expect the continuation of recent trends, at least in broad terms. Multipolarity may not come to fruition, but an increasingly diverse set of highly ranked powers almost certainly will. We are thus unlikely to repeat the Cold War of the 20th century. Regardless of the future scenario, non-traditional powers can be expected to have a growing voice. This is anticipated to make the international order more inclusive—and more complicated to navigate.
Page information
Contact at AFI team is Collin Meisel and Jakkie Cilliers
This entry was last updated on 8 September 2026 using IFs v8.72.
Reuse our work
- All visualizations, data, and text produced by African Futures are completely open access under the Creative Commons BY license. You have the permission to use, distribute, and reproduce these in any medium, provided the source and authors are credited.
- The data produced by third parties and made available by African Futures is subject to the license terms from the original third-party authors. We will always indicate the original source of the data in our documentation, so you should always check the license of any such third-party data before use and redistribution.
- All of our charts can be embedded in any site.
Cite this research
Collin Meisel and Jakkie Cilliers (2026) Global Power Shifts. Published online at futures.issafrica.org. Retrieved from https://futures.issafrica.org/thematic/17-global-power-shifts/ [Online Resource] Updated 8 September 2026.