 Africa
Feedback welcome
Our aim is to use the best data to inform our analysis. See our Technical page for information on the IFs forecasting platform. We appreciate your help and references for improvements via our feedback form.
In this entry, we first describe the Current Path forecast for Africa as it is expected to unfold to 2043, the end of the third ten-year implementation plan of the African Union’s Agenda 2063 long-term vision for Africa. The Current Path in the International Futures (IFs) forecasting model initialises from country-level data that is drawn from a range of data providers. We prioritise data from national sources.
The Current Path forecast is divided into summaries on demographics, economics, poverty, health/WaSH and climate change/energy. A second section then presents a single positive scenario for potential improvements in stability, demographics, health/WaSH, agriculture, education, manufacturing/transfers, leapfrogging, free trade, financial flows, infrastructure, governance and the impact of various scenarios on carbon emissions. With the individual impact of these sectors and dimensions having been considered, a final section presents the impact of the Combined Agenda 2063 scenario.
We generally review the impact of each scenario and the Combined Agenda 2063 scenario on gross domestic product (GDP) per person and extreme poverty except for Health/WaSH that uses life expectancy and infant mortality.
The information is presented graphically and supported by brief interpretive text.
All US$ numbers are in 2017 values.
Summary
- Current Path forecast
- Africa is a predominantly rural continent with a population of 1.3 billion people in 2021. It is the continent with the highest percentage of young people at 40.17%. Due to high fertility rates (4.46 live births per woman), the population is expected to rise to 2.2 billion people by 2043. There are 23 low-income countries and 23 lower middle-income countries in Africa with a high extreme poverty rate of 34.77%, more than three times the average poverty rate for the world. Life expectancy in Africa is low, at 65.8 years in 2019, due to the high disease burden and low accessibility to improved sanitation. The average GDP per capita for Africa was US$5 089 in 2019. Jump to forecast: Current path
- In the Current Path forecast, Africa is expected to experience a population increase of 940 million people, resulting in a population of 2.24 billion people by 2043, as well as an increase in life expectancy and a drop in fertility rates, resulting in 72.08 years and 3.15 live births per woman by 2043, respectively. Africa will have predominantly urban settlements with an urbanisation rate of 51.79% by 2043. Jump to Demographics: Current Path
- By 2043, Africa sees aggressive GDP growth amounting to a US$1.5 trillion economy, and experiences an increase in the GDP per capita, reaching US$7 217 per capita in the Current Path forecast. The continent also experiences a decline in its informal sector contribution to GDP, shrinking the informal labour force from 57.8% to 52.11% by 2043. Jump to Economics: Current Path
- In the Current Path forecast, Africa sees poverty rates decreasing by a third, dropping to 20.9% by 2043. Jump to Poverty: Current Path
- Sectoral Scenarios
- In the Stability scenario, it is expected that the number of people in extreme poverty will decrease to about 436.5 million people by 2043, down from 455 million people in 2019. Jump to Stability scenario
- The Demographic scenario could see Africa reaching its demographic dividend by 2038, 12 years earlier than in the Current Path forecast. Jump to Demographic scenario
- Life expectancy will increase from 65.8 years in 2019 to 72.82 years by 2043 in the Health/WaSH scenario. Jump to Health/WaSH scenario
- The Agriculture scenario has the potential to reduce Africa’s net agricultural import dependency to 8.01% in 2043 from 10.85% in 2019; however, it is projected that the continent will continue to be a net agricultural importer. Jump to Agriculture scenario
- The Education scenario will benefit Africa by raising average the GDP per capita to US$7 397 by 2043. Jump to Education scenario
- The Manufacturing/Transfers scenario results in a 2.37 percentage point improvement in extreme poverty compared to the Current Path forecast, resulting in 53.2 million fewer people living in poverty by 2043. Jump to Manufacturing/Transfers scenario
- The Leapfrogging scenario has the potential to drastically improve electricity access from 72.69% in 2019 to 83.78% by 2043, 11.09 percentage points above the Current Path forecast. Jump to Leapfrogging scenario
- The GDP per capita is expected to increase to US$7 880 by 2043 in the Free Trade scenario, compared to a per capita income of US$4 715 in the Current Path forecast. Jump to Free Trade scenario
- Foreign direct investment inflows represent 4.24% of GDP by 2043 in the Financial Flows scenario, compared to the Current Path forecast at 3.75% of GDP during the same period. Jump to Financial Flows scenario
- The Infrastructure scenario positively influences rural accessibility, and by 2043 it is projected that 60.86% of the rural population will have access to an all-weather road, compared to 59.05% in the Current Path forecast. Jump to Infrastructure scenario
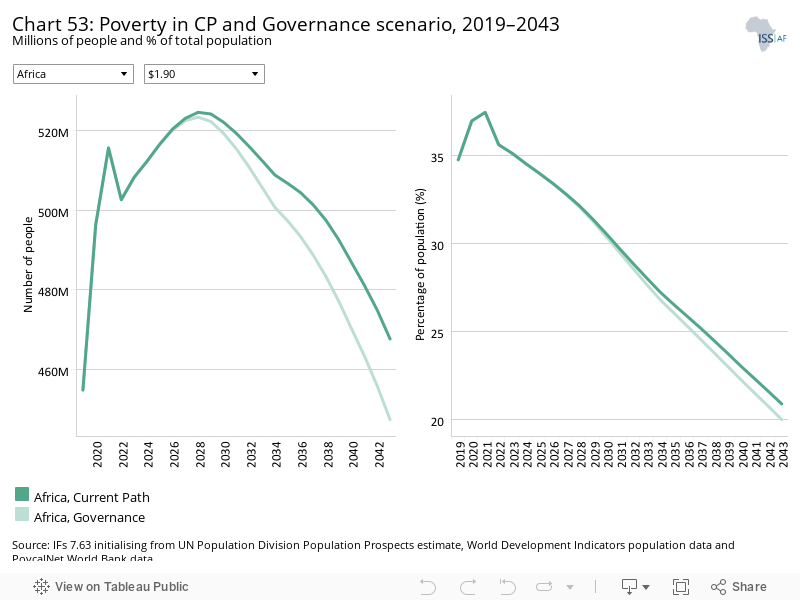
- The number of people in poverty reduces to 447.5 million people by 2043 in the Governance scenario. Jump to Governance scenario
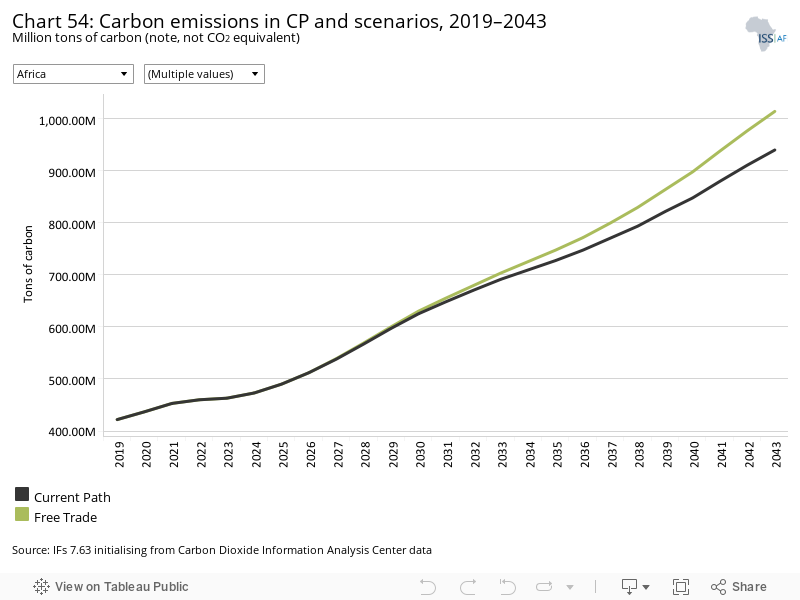
- In 2043, the Free Trade scenario will release the most carbon (1 013 million tons), followed by the Manufacturing/Transfers scenario (985 million tons). Jump to Impact of scenarios on carbon emissions
- Combined Agenda 2063 scenario Jump to Combined Agenda 2063 scenario
- In the Agenda 2063 scenario, carbon emissions increase by an additional 270 million tons by 2043, and there is a significant increase in the GDP per capita, reaching US$11 216 per capita by 2043, an increase of US$4 059 per capita above the Current Path forecast. Compared to the Current Path forecast of 20.88% in 2019, extreme poverty decreases drastically to 6.4% by 2043. In the Combined Agenda 2063 scenario, there is aggressive economic growth reaching GDP (MER) of US$15.238 trillion by 2043.
All charts for Africa
- Chart 1: Political map of Africa
- Chart 2: Population structure in CP, 1990–2043
- Chart 3: Urban and rural population in CP, 1990–2043
- Chart 4: Population density map for 2019
- Chart 5: GDP in CP, 1990–2043
- Chart 6: GDP per capita in CP, 1990–2043
- Chart 7: Informal sector value in CP, 2015–2043
- Chart 8: Value added by sector in CP, 2015–2043
- Chart 9: Agriculture production/demand in CP, 1990–2043
- Chart 10: Poverty in CP, 2015–2043
- Chart 11: Energy production by type in CP, 1990–2043
- Chart 12: Carbon emissions in CP, 1990–2043
- Chart 13: Governance security in CP and Stability scenario, 2019–2043
- Chart 14: GDP per capita in CP and Stability scenario, 2019–2043
- Chart 15: Poverty in CP and Stability scenario, 2019–2043
- Chart 16: Demographic dividend in CP and Demog scenario, 2019–2043
- Chart 17: Infant mortality in CP and Demog scenario, 2019–2043
- Chart 18: GDP per capita in CP and Demog scenario, 2019–2043
- Chart 19: Poverty in CP and Demog scenario, 2019–2043
- Chart 20: Life expectancy in CP and Health/WaSH scenario, 2019–2043
- Chart 21: Infant mortality in CP and Health/WaSH scenario, 2019–2043
- Chart 22: Yield/hectare in CP and Agric scenario, 2019–2043
- Chart 23: Agriculture imports in CP and Agric scenario, 2019–2043
- Chart 24: GDP per capita in the CP and Agric scenario, 2019–2043
- Chart 25: Poverty in CP and Agric scenario, 2019–2043
- Chart 26: Mean years of education in CP and Educ scenario, 2019–2043
- Chart 27: Education quality in CP and Educ scenario, 2019–2043
- Chart 28: GDP per capita in CP and Educ scenario, 2019–2043
- Chart 29: Poverty in CP and Educ scenario, 2019–2043
- Chart 30: Value added by sector in CP and Manufac/Transfers scenario, 2019–2043
- Chart 31: Gov welfare transfers in CP and Manufac/Transfers scenario, 2019–2043
- Chart 32: GDP per capita in CP and Manufac/Transfers scenario, 2019–2043
- Chart 33: Poverty in CP and Manufac/Transfers scenario, 2019–2043
- Chart 34: Fixed broadband access in CP and Leapfrogging scenario, 2019–2043
- Chart 35: Mobile broadband access in CP and Leapfrogging scenario, 2019–2043
- Chart 36: Electricity access in CP and Leapfrogging scenario, 2019–2043
- Chart 37: GDP per capita in CP and Leapfrogging scenario, 2019–2043
- Chart 38: Poverty in CP and Leapfrogging scenario, 2019–2043
- Chart 39: Trade balance in CP and Free Trade scenario, 2019–2043
- Chart 40: GDP per capita in CP and Free Trade scenario, 2019–2043
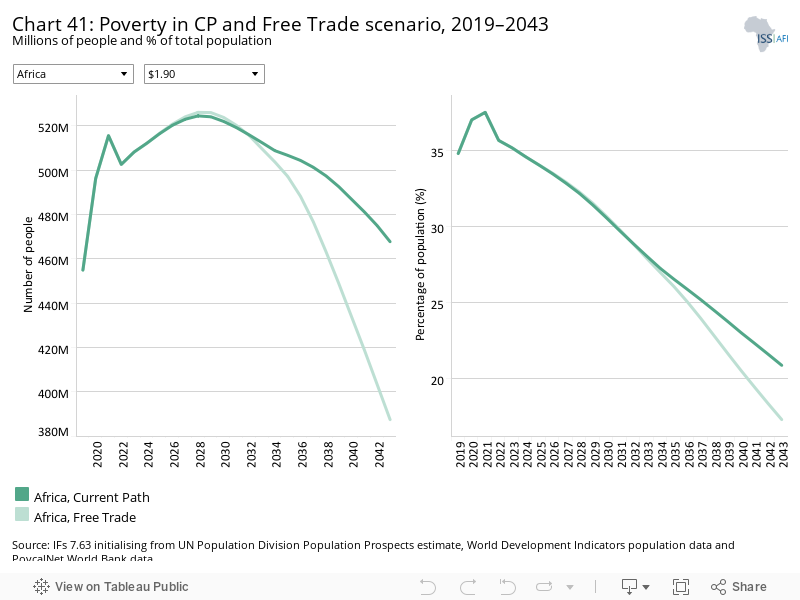
- Chart 41: Poverty in CP and Free Trade scenario, 2019–2043
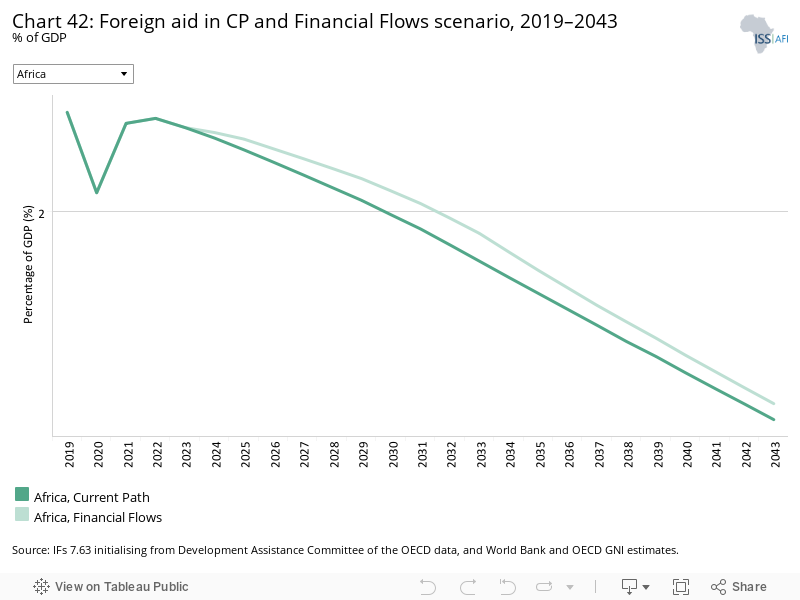
- Chart 42: Foreign aid in CP and Financial Flows scenario, 2019–2043
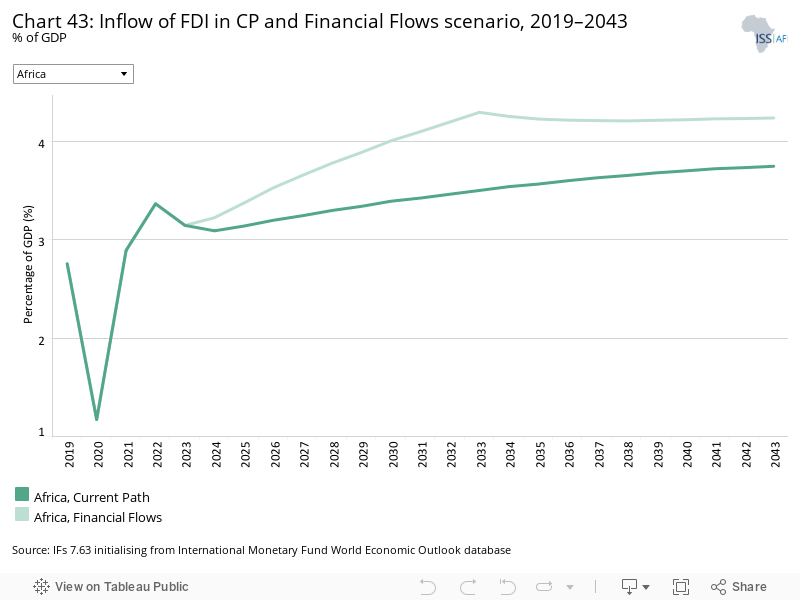
- Chart 43: Inflow of FDI in CP and Financial Flows scenario, 2019–2043
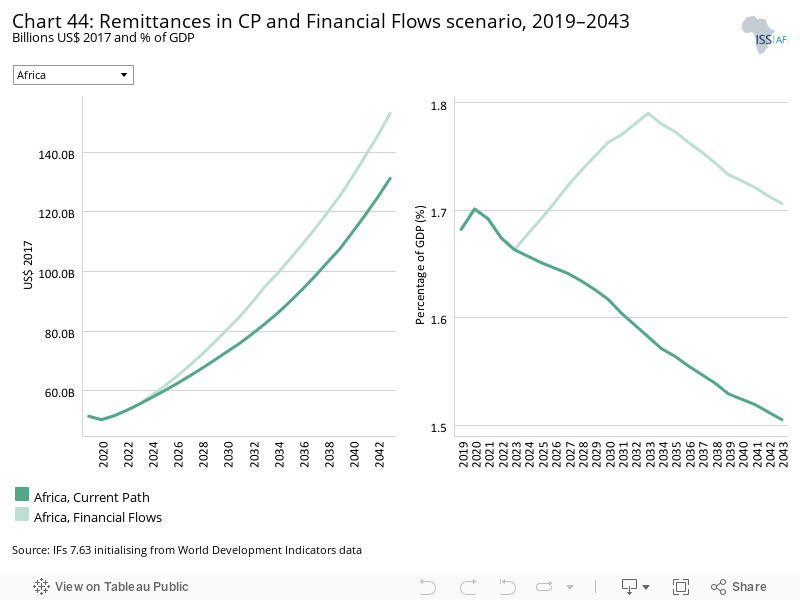
- Chart 44: Remittances in CP and Financial Flows scenario, 2019–2043
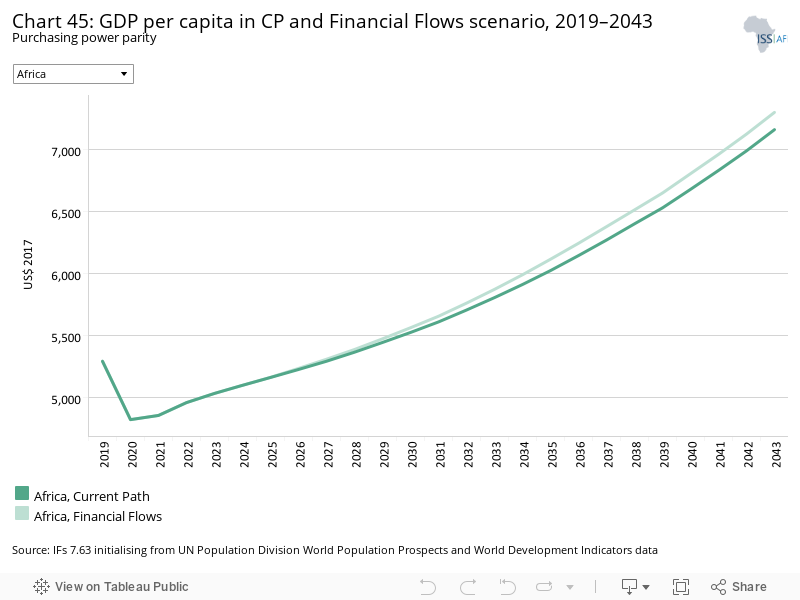
- Chart 45: GDP per capita in CP and Financial Flows scenario, 2019–2043
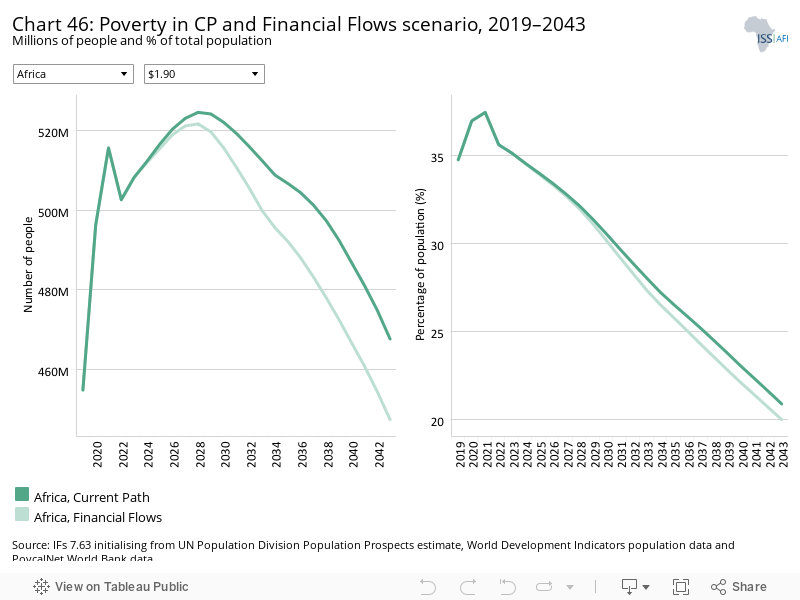
- Chart 46: Poverty in CP and Financial Flows scenario, 2019–2043
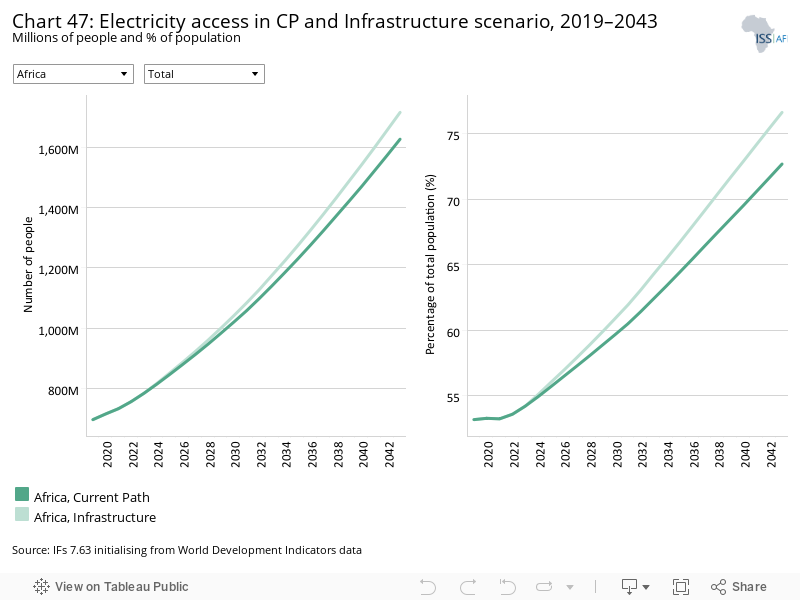
- Chart 47: Electricity access in CP and Infrastructure scenario, 2019–2043
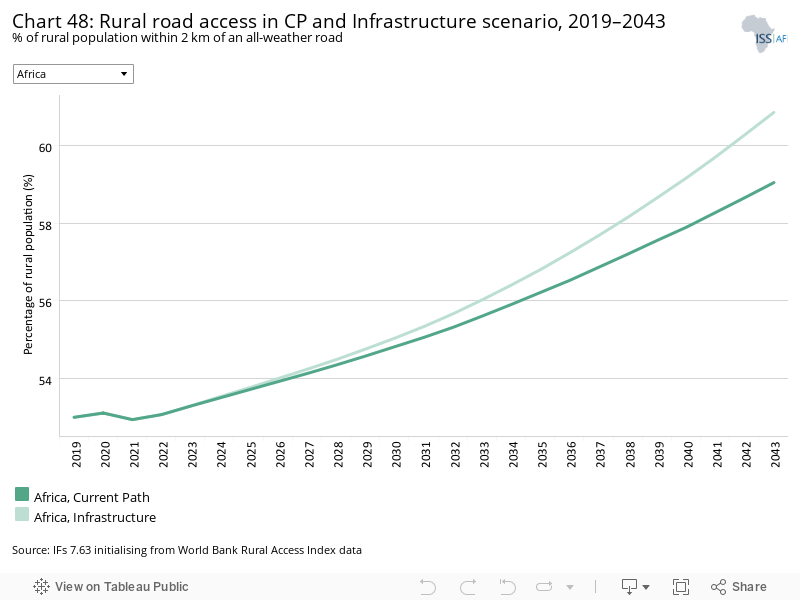
- Chart 48: Rural road access in CP and Infrastructure scenario, 2019–2043
- Chart 49: GDP per capita in CP and Infrastructure scenario, 2019–2043
- Chart 50: Poverty in CP and Infrastructure scenario, 2019–2043
- Chart 51: Gov effectiveness in CP and Governance scenario, 2019–2043
- Chart 52: GDP per capita in CP and Governance scenario, 2019–2043
- Chart 53: Poverty in CP and Governance scenario, 2019–2043
- Chart 54: Carbon emissions in CP and scenarios, 2019–2043
- Chart 55: GDP per capita in CP and scenarios, 2019–2043
- Chart 56: GDP per capita in CP and Combined scenario, 2019–2043
- Chart 57: Poverty in CP and Combined scenario, 2019–2043
- Chart 58: Value added by sector in CP and Combined scenario, 2019–2043
- Chart 59: GDP in CP and Combined scenario, 2019–2043
- Chart 60: Carbon emissions in CP and Combined scenario, 2019–2043
This page provides an overview of the key characteristics of Africa along its likely (or Current Path) development trajectory. The Current Path forecast from the International Futures forecasting (IFs) platform is a dynamic scenario that imitates the continuation of current policies and environmental conditions. The Current Path is therefore in congruence with historical patterns and produces a series of dynamic forecasts endogenised in relationships across crucial global systems. We use 2019 as a standard reference year and the forecasts generally extend to 2043 to coincide with the end of the third ten-year implementation plan of the African Union’s Agenda 2063 long-term development vision.
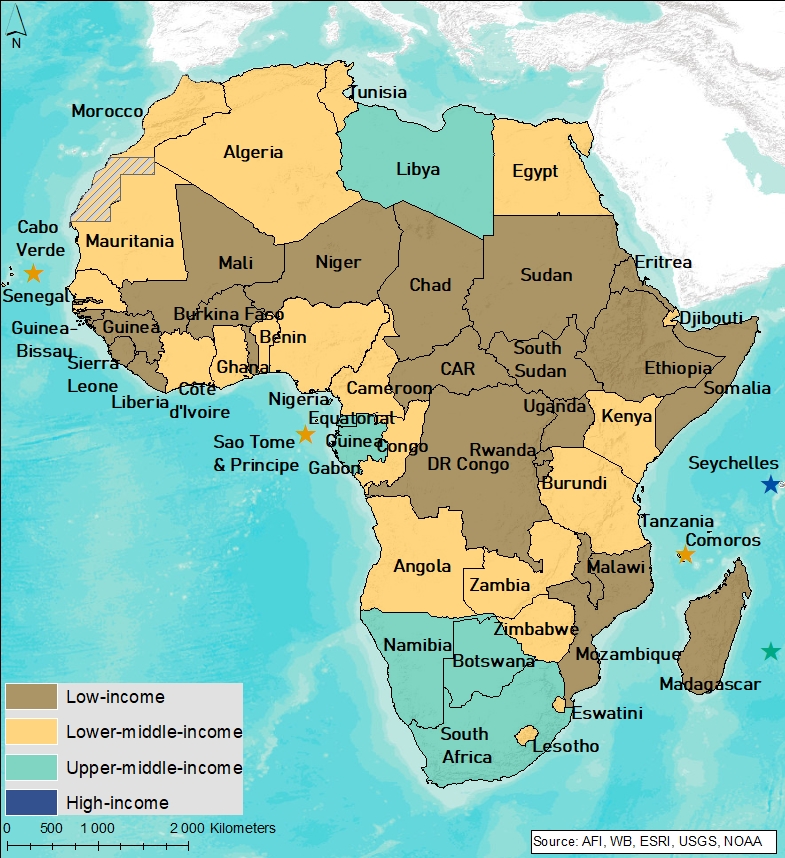
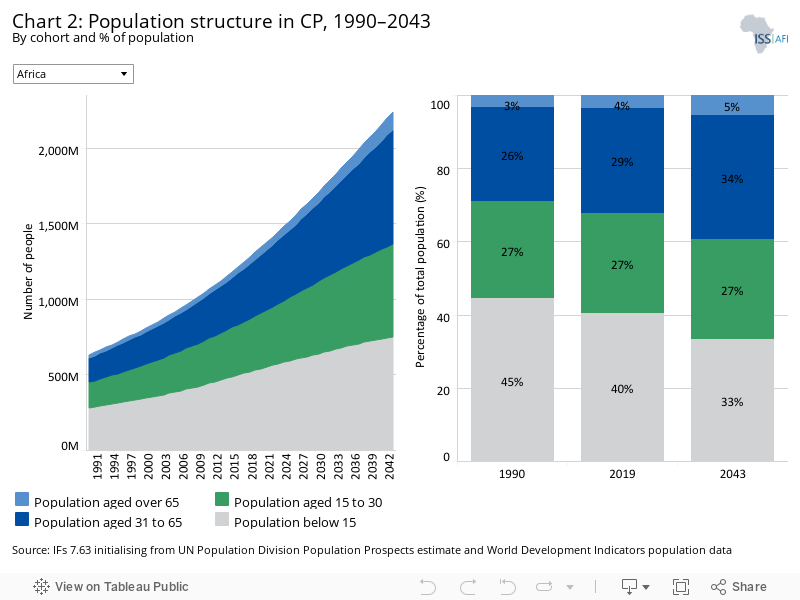
Africa has population of 1.3 billion people, with Nigeria (203.8 million), Ethiopia (112 million) and Egypt (100.5 million) the most populous countries in 2019. In 2019, the under-15 population formed 40.4% of the population; by 2043 this figure falls to 30.4%. The continent comprises 54 countries, of which 46 countries are classified as sub-Saharan Africa Jump to SSA report, excluding Algeria, Djibouti, Egypt, Libya, Morocco, Somalia, Sudan and Tunisia. Africa has 23 low-income countries Jump to Low-income Africa, 23 lower middle-income countries Jump to Middle-income Africa, seven upper middle-income countries Jump to Upper middle-income Africa, and one high-income country Jump to Seychelles. The region has 13 small states that have a small population and land area, with limited human capital.
Africa has a large number of regional economic communities, but the African Union recognises only eight, namely the Economic Community of West African States (ECOWAS) Jump to West Africa/ECOWAS; the Economic Community Of Central African States (ECCAS) Jump to ECCAS; the Common Market for Eastern and Southern Africa (COMESA) Jump to COMESA; the East African Community (EAC) Jump to East Africa; the Arab Maghreb Union (AMU) Jump to AMU; the Southern African Development Community (SADC) Jump to SADC; the Community of Sahel Saharan States (CEN-SAD) Jump to sub-Sahara Africa; and Intergovernmental Authority and Development (IGAD) Jump to IGAD. Membership to these organisations is not mutually exclusive, and some states have multiple memberships in these organisations.
Most of the continent lies within tropical regions. The climate ranges from hot deserts to icy glaciers, and from rainforests to grassy plains. The equator cuts across Africa, making it the world’s most tropical continent with only its northern edge and southern tip outside the tropics. There is symmetry at the equator, with half of the continent lying north and half lying south of the equator. In the centre of the continent is a wet tropical climate, characterised by heavy rainfall. Beyond that are belts of tropical climate with longer dry periods and occasional droughts, such as in the Sahel. To the north of the Sahel is the Sahara Desert that has little to no rainfall. However, further south, cool and moist air masses from the ocean moving inland bring summer rainfall to the Kalahari Desert. On the north and south of the desert regions are belts of Mediterranean climate, characterised by hot dry summers and moist winters.
In 2019, the population of Africa was 1.342 billion people, and in 2043 it will rise to 2.24 billion people, an increase of 898 million people. This amounts to a population increase of 66.9% over the next two decades. Whereas Africa represented 17% of the world population in 2019, in 2043 it will constitute 24%.
Africa is a youthful continent: the median age was 19.98 years in 2019, and it will increase to 23.89 by 2043. Fertility rates are expected to fall from 4.5 live births per woman in 2019 to 3.2 in 2043. Life expectancy is low at 65.1 years in 2016 due to a very high disease burden, particularly as a result of communicable diseases and increasingly also from non-communicable diseases, low access to improved sanitation and a high dependency on subsistence farming which results in low food security. As the disease burden subsides and access to improved sanitation increases, the life expectancy is expected to improve to 72.1 years in 2043. Whereas the gap in life expectancy between Africa and the rest of the world was 8.9 years in 2019, in 2043 it will have declined to 6 years.
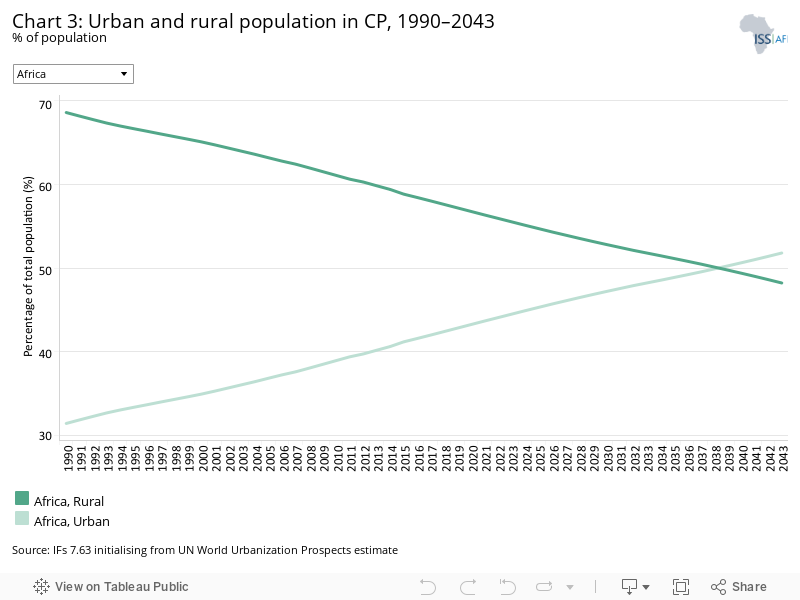
Although urbanisation has been steadily increasing in Africa, at 31.4% in 1990 and 42.8% in 2019, Africa’s population is predominantly rural, with rates ranging from 87% rural in Burundi to below 10% in Gabon in 2019. The continent has the lowest urbanisation rate (43.8%) when compared to South Asia (49.4%) and South America (84.2%) or even the global average (55.39%) in 2019.
By 2043, 51.8% of Africans will live in urban areas, ranging from 92% in Gabon to 18.7% in Niger. At that point, the global average will be 62.8%. North Africa was the most urban (at 55.9%) and East Africa/the Horn the least (at 26.8%) in 2019. Rates of urban population growth are particularly high in West Africa.
Notwithstanding, the continent recorded a fast urbanisation rate from 1990 to 2019 at 36.27%, above the average world urbanisation rate (30.69%) and below South Asia’s rate of urbanisation. Although the rapid growth in urbanisation is caused by the natural increase in towns and re-classification of settlements into urban areas, rural–urban migration [1Frankema et al (eds), The History of African Development. An Online Textbook for a New Generation of African Students and Teachers, African Economic History Network, 2022.] is a significant driver of urbanisation. In Africa, people primarily move from rural to urban areas due to ‘push factors’ such as lack of employment opportunities, extreme rural poverty, climate-related disasters in rural areas, and wars. Compared to the history of other regions, ‘pull factors’, such as a chance to find employment in urban industrial and service sectors and better access to medical and education services, are less prominent in Africa. Very often the rural–urban shift is from subsistence farming in rural areas to the informal sector in informal, urban areas.
As the interplay between the ‘pull’ and ‘push’ factors for rural–urban migration continues, the urbanisation rate in Africa will grow by 20.92 percentage points between 2019 and 2043, above the average growth in world urbanisation.
The relatively low urbanisation in Africa compared to other continents is partly because of the continent’s low levels of industrialisation. Africa also has the fewest connections to global value chains and international trade.
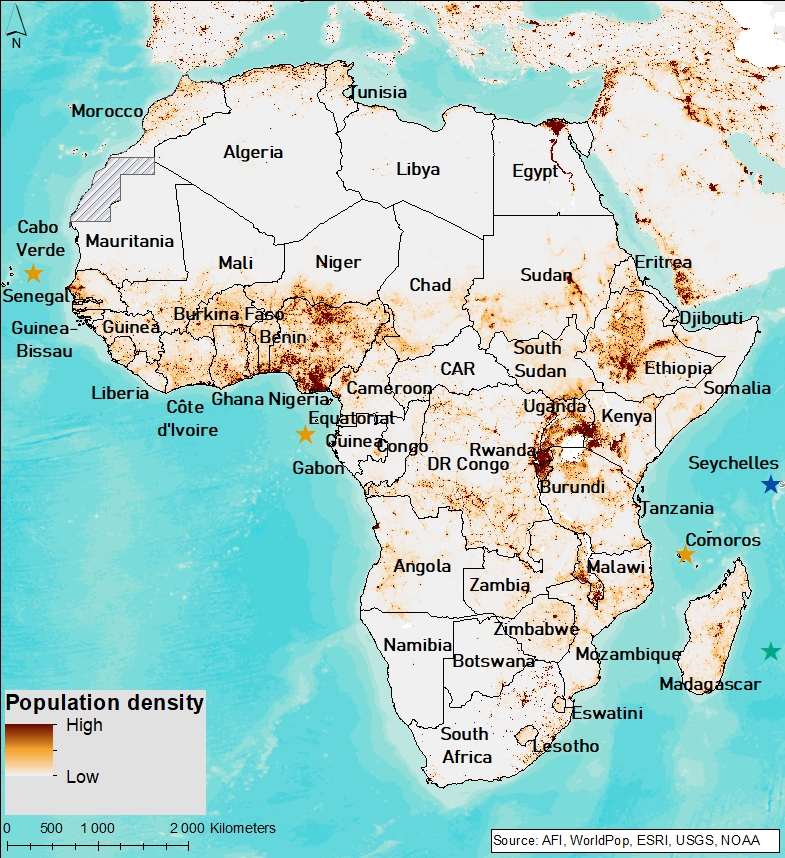
As the second most densely populated continent in the world next to Asia, Africa’s most densely populated countries are generally in West Africa (Nigeria, Benin, Burkina Faso, Ghana and Togo) and in East Africa (Uganda, Ethiopia, Kenya and Burundi). The least densely populated countries are in the Sahel region (Mali, Mauritania, Niger, Chad, Sudan, Libya, Algeria and Egypt), mainly due to unfavourable weather conditions, and in the Southern African countries of Namibia and Botswana. One-third of the continent’s population live in Nigeria, Ethiopia and Egypt alone.
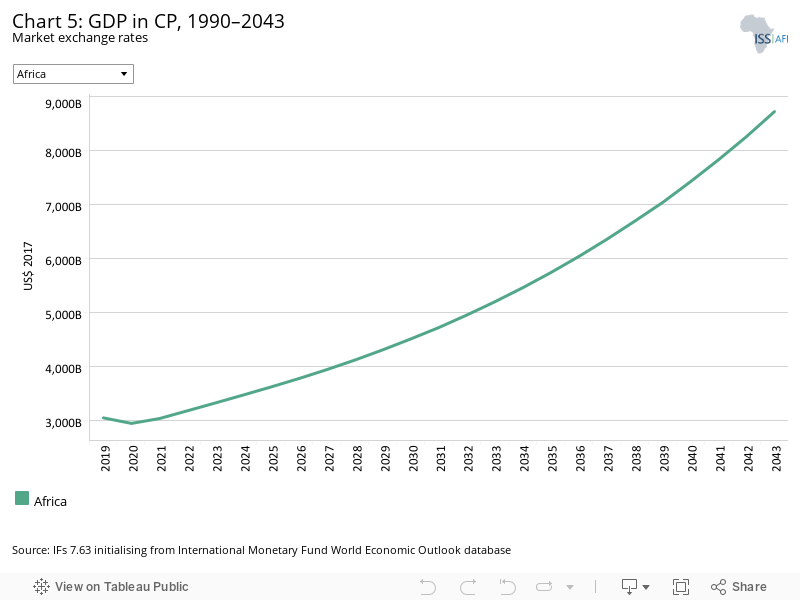
The GDP in Africa has grown substantially from US$1 132.5 billion in 1990 to US$3 055.3 billion in 2019. By 2043, Africa’s GDP will grow to US$8 724.4 billion with GDP growth rates of 5.5% and 5.6% in 2042 and 2043 respectively. Such impressive growth is, however, largely a function of population growth although towards the end of the forecast horizon Africa is closer to entering into a demographic dividend window of opportunity. The adoption of new technologies and greater integration into the world economy and value chains will also help to propel growth. This growth aside, the African economy remains very small as a portion of the global economy. It constituted 2.5% of the global economy in 1990, 3.1% in 2019 and will constitute 5.2% in 2043, despite having 24% of the world’s population by then.
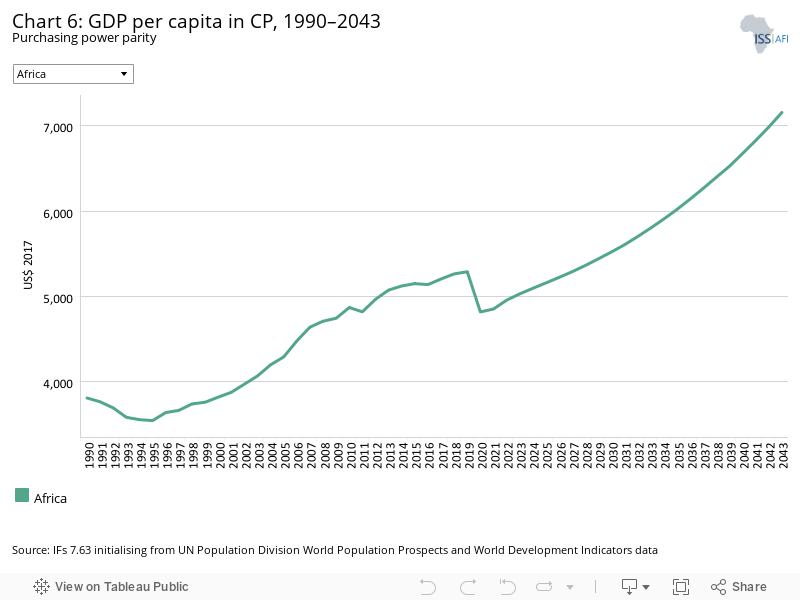
Although many of the charts in the sectoral scenarios also include GDP per capita, this overview is an essential point of departure for interpreting the general economic outlook of Africa.
The GDP per capita generally has a positive trend, rising from US$3 808 in 1990 to US$5 289 in 2019; it is forecast to reach over US$7 100 by 2043, representing a 35.3% growth from 2019. Notwithstanding, the GDP per capita dipped during the period 1990 to 1995, during the great recession of 2010/11, and during the start of the COVID-19 pandemic in 2019/20.
In 1990, Africa’s GDP per capita was 39% of the global average. In 2019, it was 30%, and in the Current Path forecast it will get to 32% in 2043, indicating a turn-around in the trend that has seen the GDP per capita in Africa generally fall further behind growth in global averages.
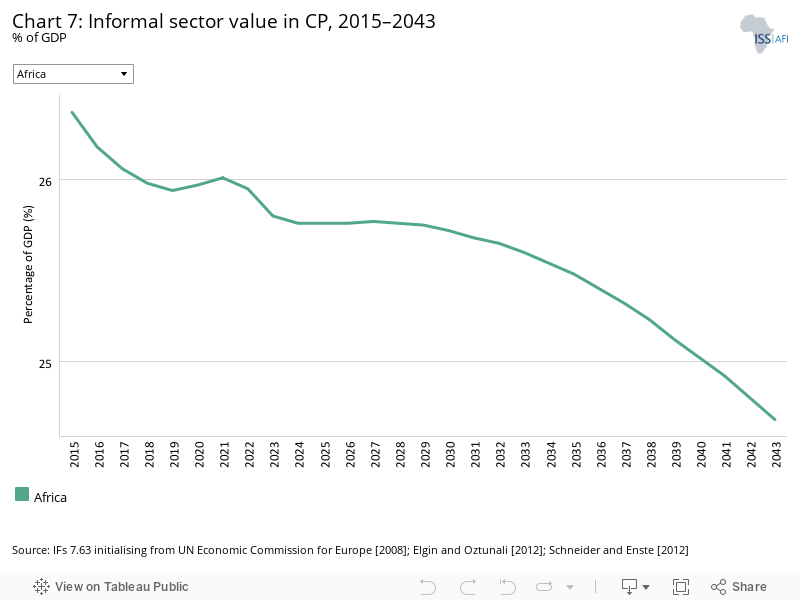
A quarter of the African economy was in the informal sector, representing 25.94% of GDP, 2019. On this metric, the African economy has a much larger informal sector than other regions, translating into low revenue contributions and lowering productivity. For example, the contribution to GDP from the informal sector in South America in 2019 was only 13.7%. In the Current Path forecast, the size of the informal sector in Africa will marginally drop to 24.68% of GDP in 2043. The large share of the labour force will continue to operate in subsistence agriculture in rural Africa with the large dependency ratio across the region over time.
A similar picture emerges when looking at the size of the total labour force active in the informal sector, which was 57.8% in 2019 — almost 20 percentage points above the average for the rest of the world. Only South Asia has a larger portion of its labour force employed in the informal sector.
There are almost 13 percentage points more females in the informal sector in Africa than males.
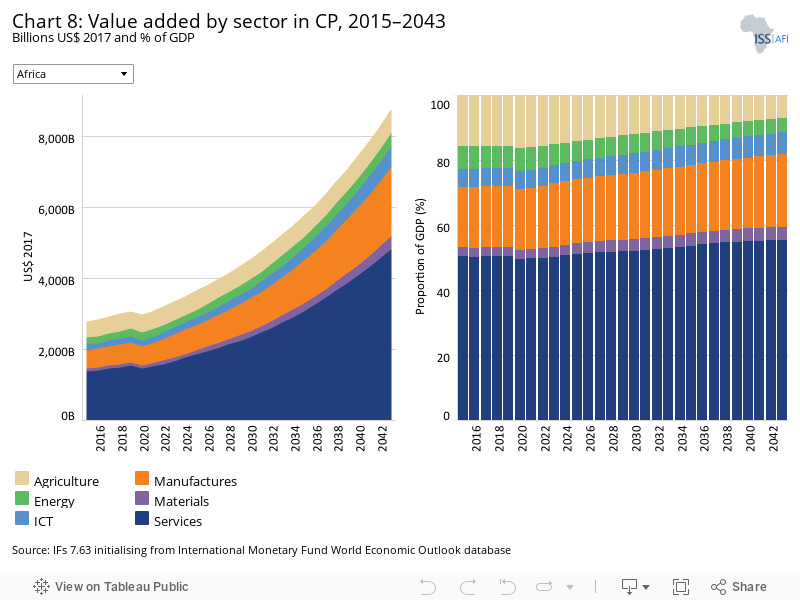
The IFs platform uses data from the Global Trade and Analysis Project (GTAP) to classify economic activity into six sectors: agriculture, energy, materials (including mining), manufactures, services and information and communications technology (ICT). Most other sources use a threefold distinction between only agriculture, industry and services with the result that data may differ.
The service sector is the most dominant in Africa, accounting for 50.3% (US$1394.11 billion) of Africa’s GDP in 2015. The contribution of the service sector is expected to grow to 55.4% (US$4 833.06 billion) in 2043. In 2019, the manufacturing sector contributed 18.5% (US$512.41 billion) to African GDP and will grow to 22.3% (US$1 946.74 billion) in 2043 in the Current Path forecast. While the service and manufacturing sectors are expected to grow, the relative importance of agriculture is expected to halve from 15.7% in 2015 to 7.1% in 2043, although, in absolute terms, the sector will have increased in size from US$476 billion in 2019 to US$621.8 billion in 2043. The dominance of the service sector and the low levels of the manufacturing sector reflect Africa’s current development trajectory. The impact of industrialisation and intra-Africa trade are examined in the Manufacturing/Transfers and Free Trade scenarios. What is striking though is the extent to which the contribution of Africa’s manufacturing sector is significantly lower than that of South Asia and global averages. Historically, the manufacturing sector and international trade have been the foundation of more rapid economic growth, and Africa lags on both accounts.
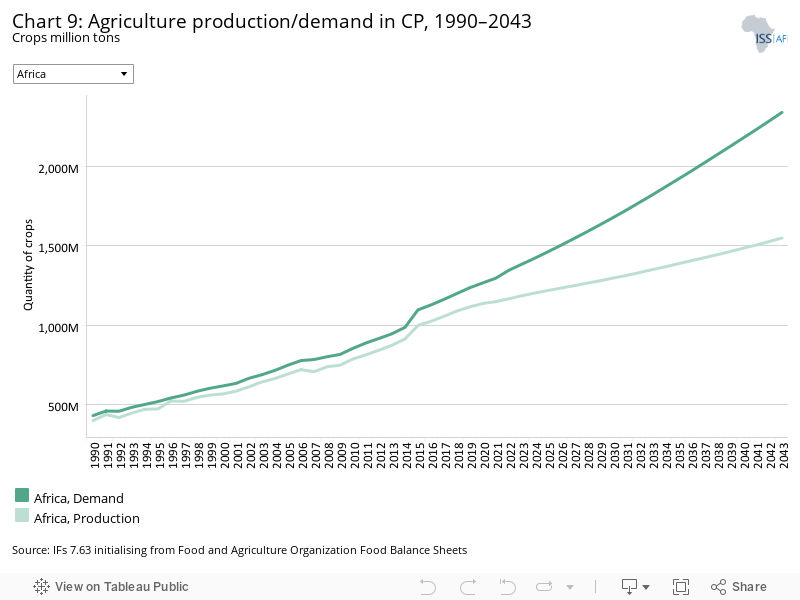
The data on agricultural production and demand in the IFs forecasting platform initialises from data provided on food balances by the Food and Agriculture Organization (FAO). IFs contains data on numerous types of agriculture but aggregates its forecast into crops, meat and fish, presented in million metric tons. Chart 9 shows agricultural production and demand as a total of all three categories.
Agriculture contributed 15.6% to GDP in Africa in 2019, however, it is set to decline to 7.1% in 2043. Africa’s yields per hectare are significantly lower than global averages. Hence, in spite of its large contribution to the African economy, the gap between agriculture production and demand is set to grow from 121.1 million metric tons in 2019 to 791 million metric tons in 2043. This means that food security will continue to grow as population growth accelerates and consumption patterns change. Unlike Africa, South America, with its much smaller agriculture sector as a per cent of GDP is food secure, while demand and production will largely keep pace in South Asia, the other two comparable developing regions.
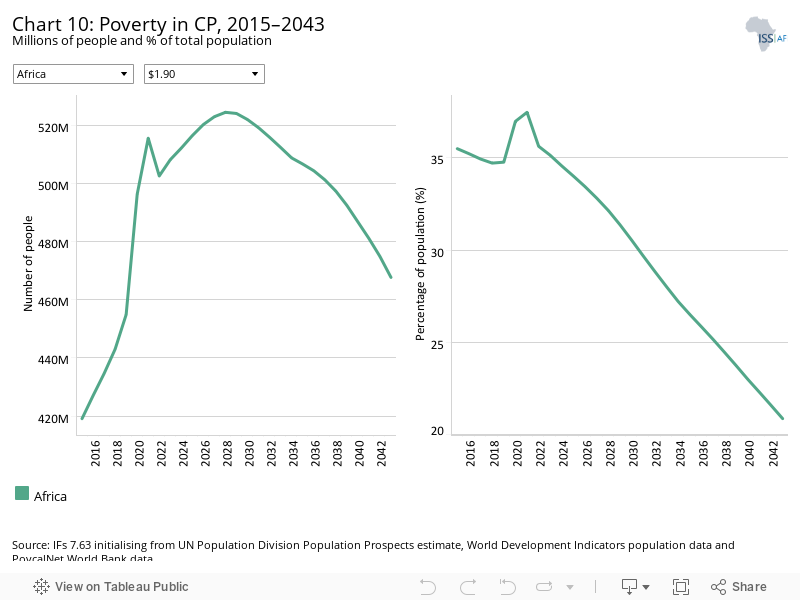
There are numerous methodologies for and approaches to defining poverty. We measure income poverty and use GDP per capita as a proxy. In 2015, the World Bank adopted the measure of US$1.90 per person per day (in 2011 international prices), also used to measure progress towards the achievement of Sustainable Development Goal 1 of eradicating extreme poverty. To account for extreme poverty in richer countries occurring at slightly higher levels of income than in poor countries, the World Bank introduced three additional poverty lines in 2017:
- US$3.20 for lower middle-income countries
- US$5.50 for upper middle-income countries
- US$22.70 for high-income countries.
Poverty in Africa is significantly higher than in other regions. Generally, poverty rates drop slightly between 2015 and 2019 from 35.5% to 34.8%. In 2019, 454.9 million Africans survived on less than US$1.90 per day. However, due to the COVID-19 pandemic, average poverty increased by 3 percentage points between 2019 and 2021, and thereafter again starts to slowly decline to 20.9% in 2043, equivalent to 467.8 million people. Whereas extreme poverty will largely have been eliminated in the rest of the world by 2030, Africa will then have close to 31% (or 522 million people) of its population still living in extreme poverty.
By comparison, in South America and South Asia, the 2019 extreme poverty rates were 6.1% and 9.7%, respectively.
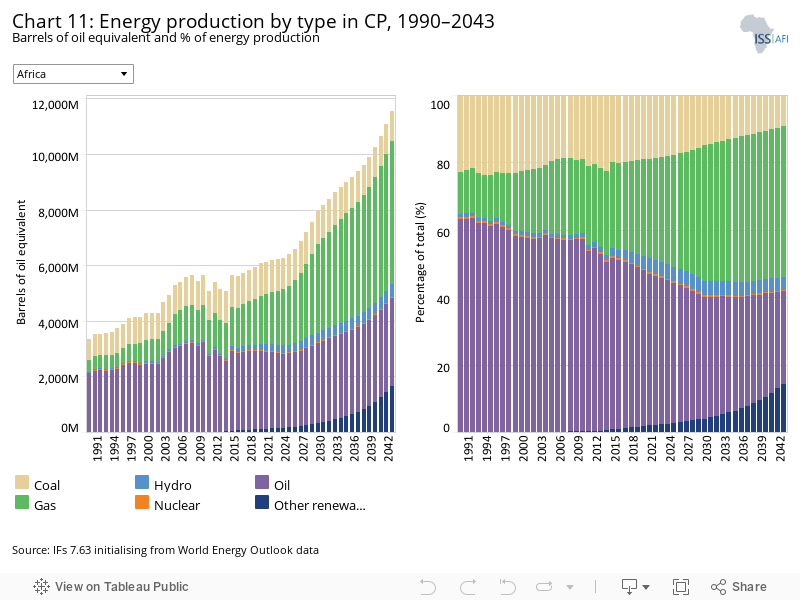
The IFs platform forecasts six types of energy, namely oil, gas, coal, hydro, nuclear and other renewables. To allow comparisons between different types of energy, the data is converted into billion barrels of oil equivalent (BBOE). The energy contained in a barrel of oil is approximately 5.8 million British thermal units (MBTUs) or 1 700 kilowatt-hours (kWh) of energy.
Oil accounted for almost half (2.80 BBOE) of Africa’s energy production in 2019, much of which draws from big oil producers such as Nigeria, Angola, Algeria, Egypt, Libya, South Sudan, the Republic of the Congo, Gabon, Sudan and Equatorial Guinea. The continent’s reliance on oil as the main source of energy is declining and, in 2029, gas production (in BBOE) will overtake oil production to the extent that in 2043 oil will account for only 27.5% of energy production whereas gas will account for 44.7%. Gas only accounted for 27.8% of energy production in 2019 (Algeria and Nigeria were the largest producers in 2019), implying almost a doubling of its contribution on the back of large discoveries of gas reserves in Mozambique, Tanzania and elsewhere. Most of the oil and gas is, however, exported and not refined or used domestically. In spite of the fact that Africa exports large amounts of energy, a large section of its population does not have access to electricity.
In the Current Path forecast, the contribution from nuclear power was 0.5% of production in 2019 and is forecast to decline. Its future will largely depend on the extent to which new technologies, such as small modular nuclear technologies, become commercially attractive. In 2019, energy production from hydro accounted for only 0.2 BBOE (or 11%). Countries like the Democratic Republic of the Congo (DR Congo) have huge hydropower potential and growth in this sector depends on the implementation of schemes like the Grand Inga scheme. In the Current Path forecast, 0.45 BOE (or 4.1%) of its energy will come from hydro in 2043.
However, other renewable energy sources, such as wind and solar, are increasingly becoming significant sources of energy representing 14.3% of Africa’s total energy production in 2043 (equivalent to 1.65 BBOE).
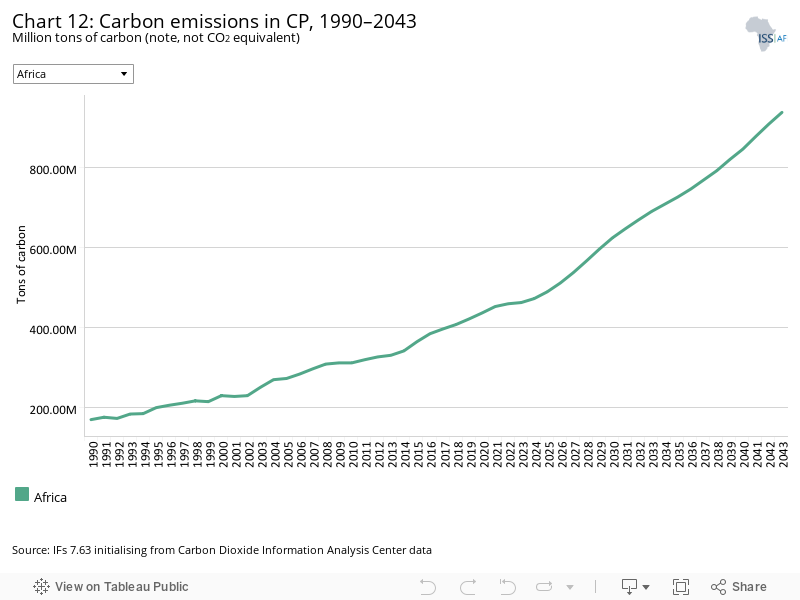
Carbon is released in many ways, but the three most important contributors to greenhouse gases are carbon dioxide (CO2), carbon monoxide (CO) and methane (CH4). Since each has a different molecular weight, IFs uses carbon. Many other sites and calculations use CO2 equivalent.
Africa’s total carbon emissions have steadily increased from 170 million tons in 1990 to 422 million tons in 2019. Africa’s carbon emissions are comparable to South East Asia (453 million tons) and South America (359 million tons). Whereas in 2019 Africa released 4.4% of global carbon emissions, by 2043 it will release 9.5%.
In 2043, it is forecasted that carbon emissions in Africa will amount to 939 million tons, greater than the Current Path forecast for South America, South East Asia and Europe in that year. The main reason for the increase is due to Africa’s rapid population growth that, by 2043, will have increased to almost 24% of the global total.
Sectoral Scenarios for Africa
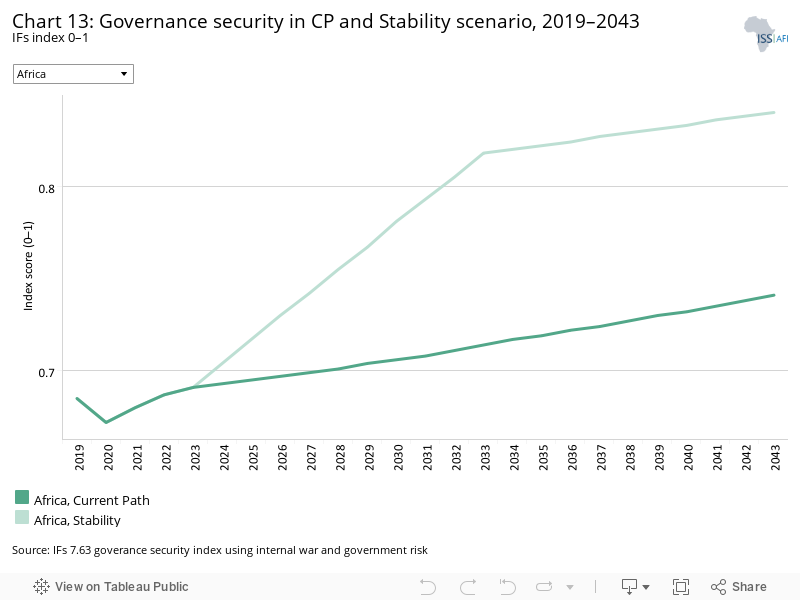
Download to pdfThe Stability scenario represents reasonable but ambitious reductions in risk of regime instability and lower levels of internal conflict. Stability is generally a prerequisite for other aspects of development and this would encourage inflows of foreign direct investment (FDI) and improve business confidence. Better governance through the accountability that follows substantive democracy is modelled separately.
The intervention is explained here in the thematic part of the website.
The Stability scenario entails significant interventions in increasing regime stability and lowering levels of internal conflict. These interventions allow for reductions in military expenditure and an increase inward investment flows from abroad. Africa has a low level of governance security compared to the global average and even compared to other developing regions. In 2019, Africa had an average governance security index of 0.69 lower than the average index value for South Asia (0.726) and South America (0.76). In line with global trends, governance security is improving and it is expected to reach 0.741 in 2043, though not closing the gap with other regions. The Stability scenario reflects aggressive improvements in security such that Africa improves its score on the governance security index by 25% to 0.932 by 2043, significantly above the average rate for comparable regions as well as most developed regions.
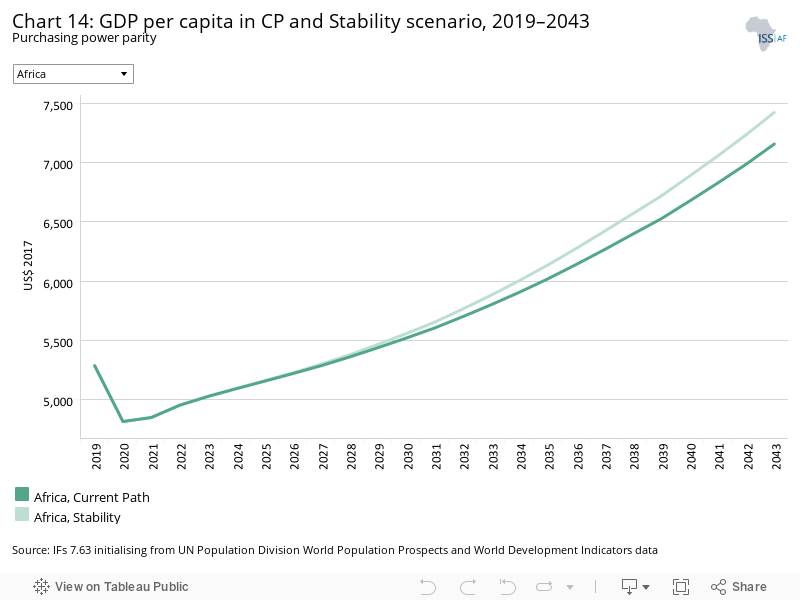
Africa’s GDP per capita fell between 2019 to 2020 due to the devastating effect of the COVID-19 pandemic on lives and livelihoods. The GDP per capita will increase from US$4 852 in 2019 to US$7 157 in 2043. In the Stability scenario, Africa will add US$266 (3.7%) to its Current Path forecast in 2043.
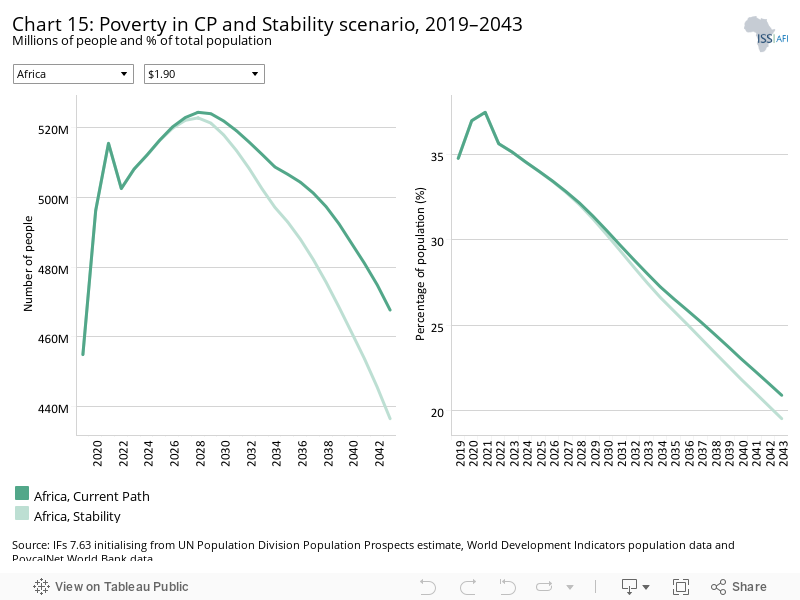
The number of extremely poor people in the Current Path forecast in Africa will fall to 467.7 million (20.88%) people in 2043 from 454.9 million or 34.8% in 2019. In the Stability scenario, the number of extremely poor people (percentage of poor people) in Africa is forecast to fall to 436.5 million (19.51%). This means that in the Stability scenario Africa will have 31.2 million fewer people living in extreme poverty, a difference of almost 7%.
This section presents the impact of a Demographic scenario that aims to hasten and increase the demographic dividend through reasonable but ambitious reductions in the communicable-disease burden for children under five, the maternal mortality ratio and increased access to modern contraception.
The intervention is explained here in the thematic part of the website.
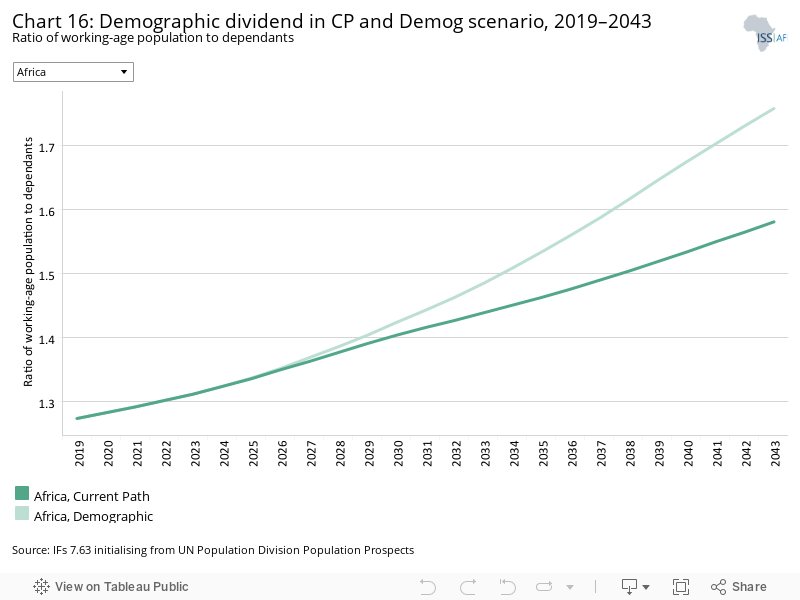
Demographers typically differentiate between a first, second and even a third demographic dividend. We focus here on the contribution of the size of the labour force (between 15 and 64 years of age) relative to dependants (children and the elderly) as part of the first dividend. A window of opportunity opens when the ratio of the working-age population to dependants is equal to or surpasses 1.7.
The ratio of working-age persons to dependants in the rest of the world exceeded 1.7:1 in 1995 and will achieve a peak in 2028 before starting to decline. In the Current Path forecast, Africa will only achieve a potential demographic dividend from 2051. In the Demographic scenario, Africa will enter its dividend a decade earlier, in 2041, 41 years later than South America and 30 years later than South Asia. This is because of the high fertility rates in Africa. In 2019, the fertility rate in Africa was 4.5 children per woman compared to 2 in South America and 2.4 in South Asia.
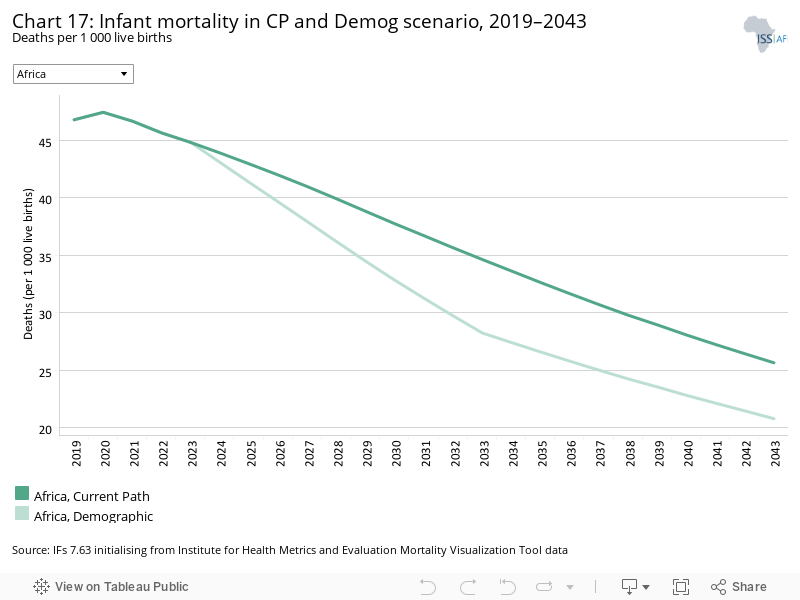
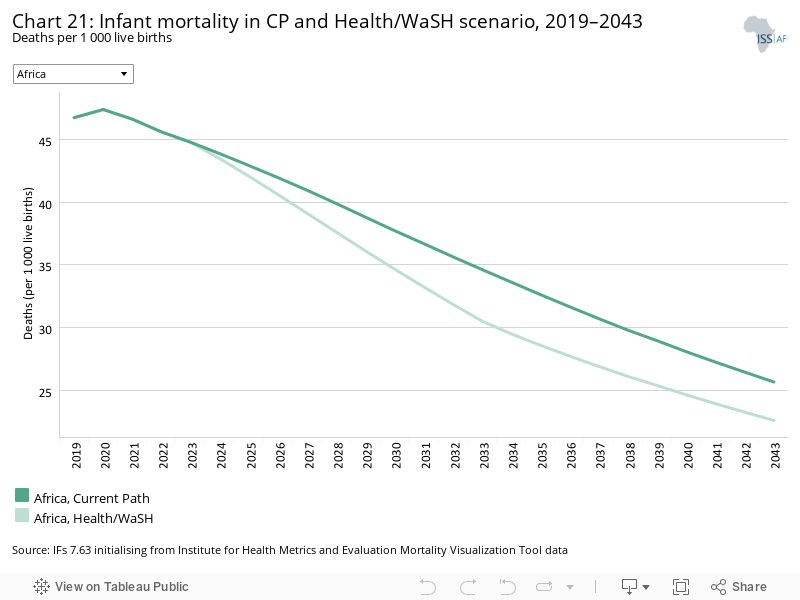
The infant mortality rate is the number of infant deaths per 1 000 live births and is an important marker of the overall quality of the health system in a country.
In 2019, Africa’s infant mortality rate was more than double the average for the rest of the world, although declining from 46.8 in 2019 to 25.6 in 2043. In the Demographic scenario, Africa will reduce its infant mortality rate by nearly 5 deaths per 1 000 live births compared to the Current Path forecast in 2043 but will still be almost 10 deaths per 1 000 live births above the average for the rest of the world in 2043. In addition to advances in medicine and disease control that reduce infant mortality rates, in the Demographic scenario, the intervention increases contraception use and reduces child and maternal mortality.
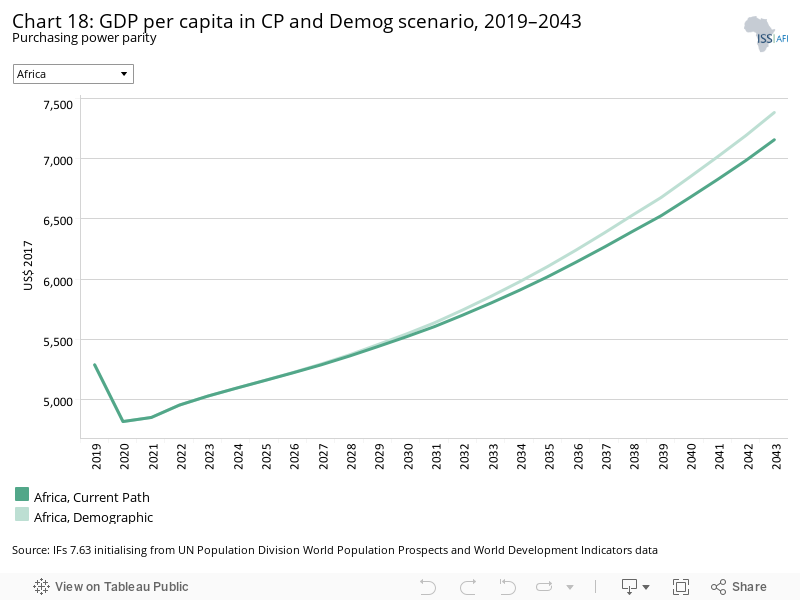
In the Current Path forecast, the GDP per capita increases rapidly from US$5 289 to US$7 157 in 2043 — a year earlier in the Demographic scenario. Africa’s GDP was four times lower than the world average in 2019 and is projected to be nearly three times lower in 2043 in the Demographic scenario. The relatively higher GDP per capita in the Demographic scenario is due to a larger working-age population relative to dependants, hence the ability to contribute more to tax and other revenues while governments have to spend less on education, healthcare, etc.
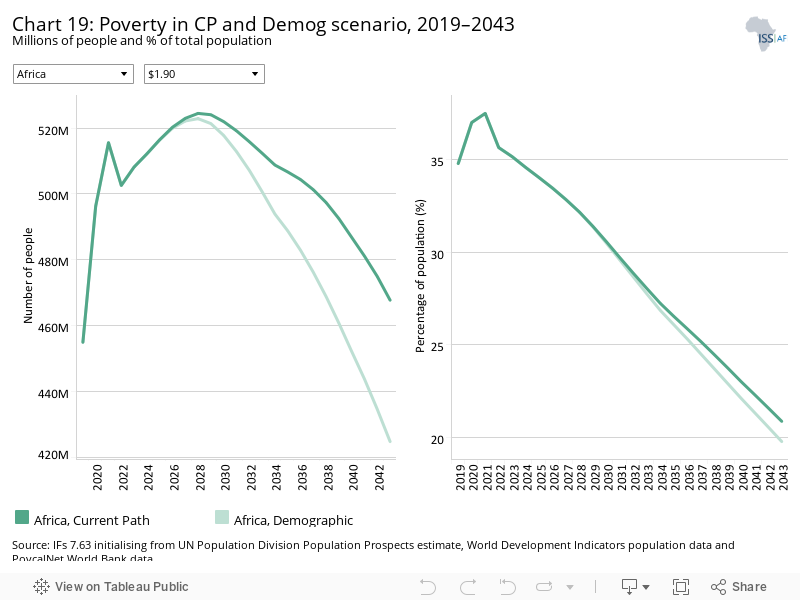
The number of extremely poor people is forecast to increase from 2019 to 2029 before it decreases nearer 2043. In the Demographic scenario, Africa will reduce the number of extremely poor people by 43 million in 2043 to 424.7 million people compared to the Current Path forecast. The per cent of poor people at the US$1.90 poverty line is projected to fall from 34.8% in 2019 to 20.9% in 2043 in the Current Path forecast, and to 19.8% in the Demographic scenario.
This section presents reasonable but ambitious improvements in the Health/WaSH scenario, which include reductions in the mortality rate associated with both communicable diseases (e.g. AIDS, diarrhoea, malaria and respiratory infections) and non-communicable diseases (NCDs) (e.g. diabetes), as well as improvements in access to safe water and better sanitation. The acronym WaSH stands for water, sanitation and hygiene.
The intervention is explained here in the thematic part of the website.
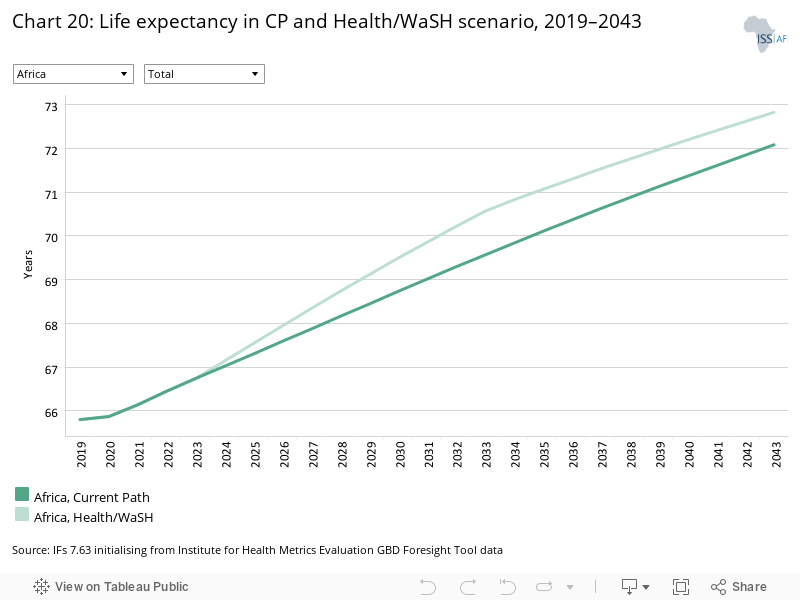
In the Current Path forecast, life expectancy in Africa will rise from 65.87 years in 2019 to 72.08 years in 2043. Life expectancy changes slowly and in the Health/WaSH scenario the continent will gain 0.8 years compared to the Current Path forecast in 2043. In 2019, Africa’s average life expectancy was around 9 years below the average life expectancy rate in the rest of the world, which was at 73.2 years. In the Health/WaSH scenario, Africa will start closing that gap and will only be 6 years below the average in the rest of the world by 2043.
Infant mortality in Africa will fall from 46.8 to 25.6 deaths per 1 000 live births in 2043 in the Current Path forecast. In the Health/WaSH scenario, the infant mortality rate is expected to fall by 3 deaths per 1 000 live births compared to the Current Path forecast. Despite the faster reduction in infant mortality rate in the Health/WaSH scenario, Africa has 6 infant mortality per 1 000 live births more than the average world infant mortality rate in 2043. On the regional heterogeneity in infant mortality, North Africa (18) and West Africa (58.6) have the lowest and highest infant mortality rates on the continent, while by country, Central African Republic (81) and South Sudan (78.2) are countries with the highest mortality rate and Libya (6.8) the lowest.
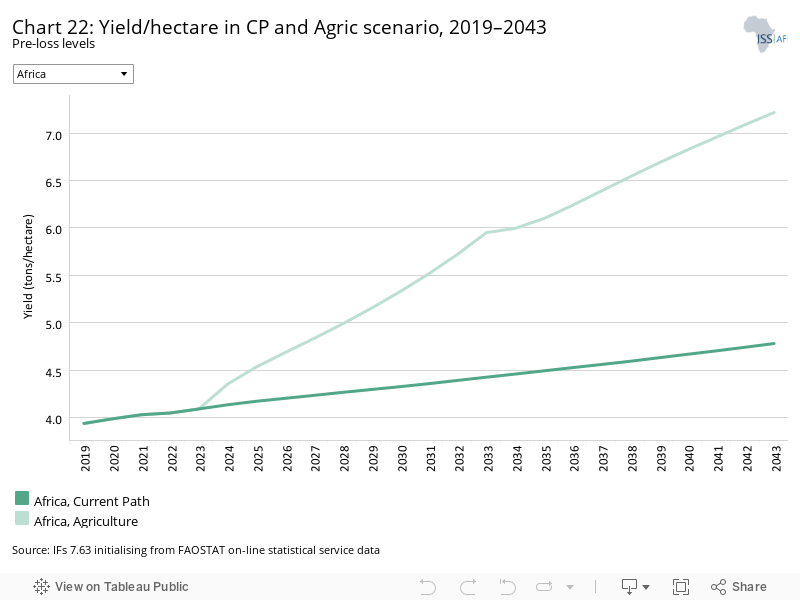
The Agriculture scenario represents reasonable but ambitious increases in yields per hectare (reflecting better management and seed and fertiliser technology), increased land under irrigation and reduced loss and waste. Where appropriate, it includes an increase in calorie consumption, reflecting the prioritisation of food self-sufficiency above food exports as a desirable policy objective.
The intervention is explained here in the thematic part of the website.
The data on yield per hectare (in metric tons) is for crops but does not distinguish between different categories of crops.
Average crop yield in Africa will increase from 3.9 tons per hectare in 2019 to 4.8 tons per hectare in 2043. In 2019, average crop yields in Arica were around half that of the rest of the world, and, although improving over time, will remain almost 4 tons per hectare below the average for the rest of the world. The Agriculture scenario will have a significant impact on crop yield in Africa by adding a yield of 2.432 tons per hectare compared to the Current Path forecast in 2043. As a result, crop production in Africa will be 689.1 million metric tons larger in the Agriculture scenario than in the Current Path forecast.
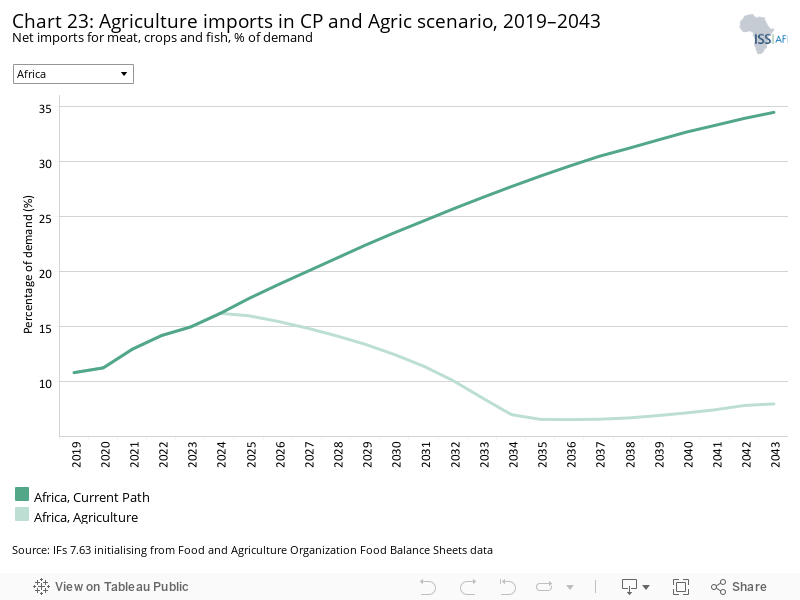
In the Current Path forecast, Africa’s import dependence will increase from 10.8% in 2019 to 34.4% in 2043. However, this trend changes in the Agriculture scenario as import dependence reduces to 8.01% in 2043, representing an improvement of 26.5 percentage points.
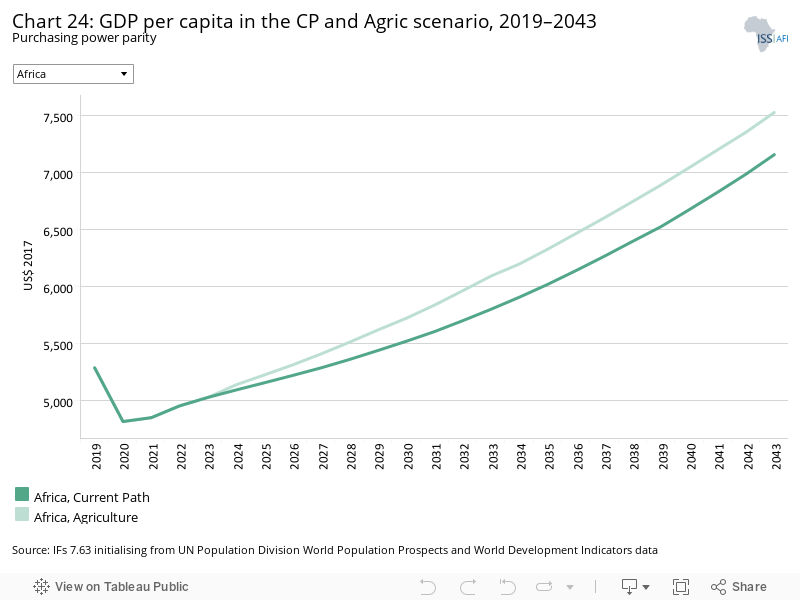
Agriculture is a key sector of African economies, contributing 15.6% to Africa’s GDP in 2019. In the Agriculture scenario, the GDP per capita will increase by 5% (or US$370) by 2043.
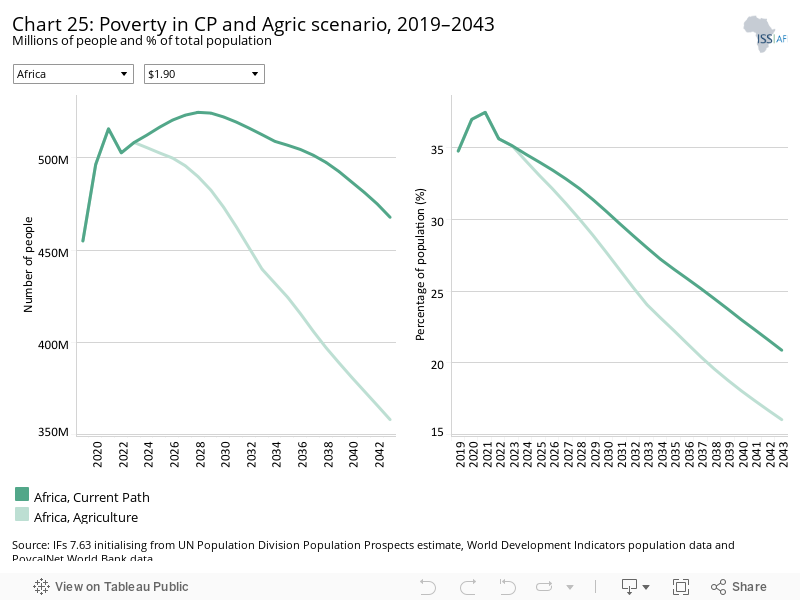
Given its large agriculture sector, the Agriculture scenario has a significant impact on reducing extreme poverty. The number of extremely poor people in the Current Path forecast in Africa will increase from 454.9 million people in 2019 (34.8% of population) to 467.7 million (20.9%) in 2043. In the Agriculture scenario, the number of extremely poor people is forecast to reduce to 358.2 million people in 2043, lifting 109 million additional people out of extreme poverty in 2043 (poverty rate of 16%). In the Agriculture scenario, Africa will reduce its poverty rate by 4.84 percentage points in 2043 compared to the Current Path forecast.
The Education scenario represents reasonable but ambitious improved intake, transition and graduation rates from primary to tertiary levels and better quality of education. It also models substantive progress towards gender parity at all levels, additional vocational training at secondary school level and increases in the share of science and engineering graduates.
The intervention is explained here in the thematic part of the website.
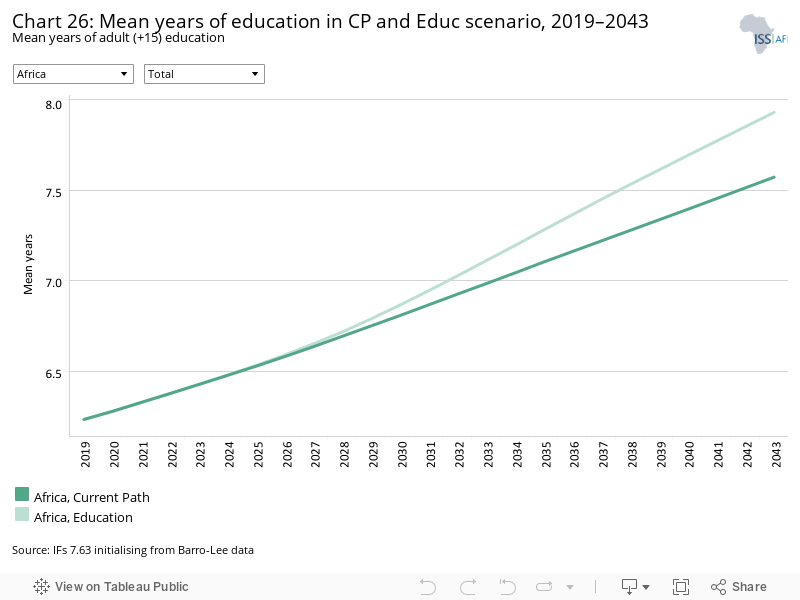
In 2019, the mean years of adult education in Africa was more than two years below the average for South America and around one year below the average for South Asia. In the Current Path forecast, Africa’s mean years of adult education will increase from 6.2 in 2019 to 7.6 years in 2043 and 7.9 years in the Education scenario, equivalent to an extra 4 months of adult education. This may not seem a lot as the results from improved education are slow to show. The improvement is equivalent to an additional 536 million years of education in Africa in 2043, however they differ vastly among countries and regions.
On average, African men have about 1.2 years more education than African women. The gap narrows to 0.8 years by 2043 in the Current Path forecast and slightly less in the education scenario.
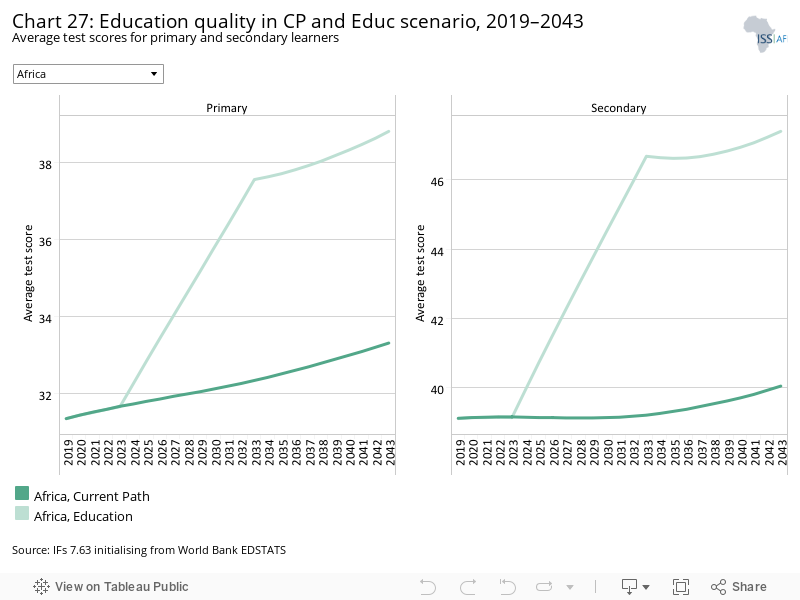
Quality of education is a key predictor of the level of human capital that a country enjoys. In the Education scenario, average test score of primary learners in Africa improves by 17% above the Current Path forecast in 2043 and 18% in the case of secondary learners. In the process, Africa closes much of the gap between primary and secondary test scores compared to the average test scores for the rest of the world.
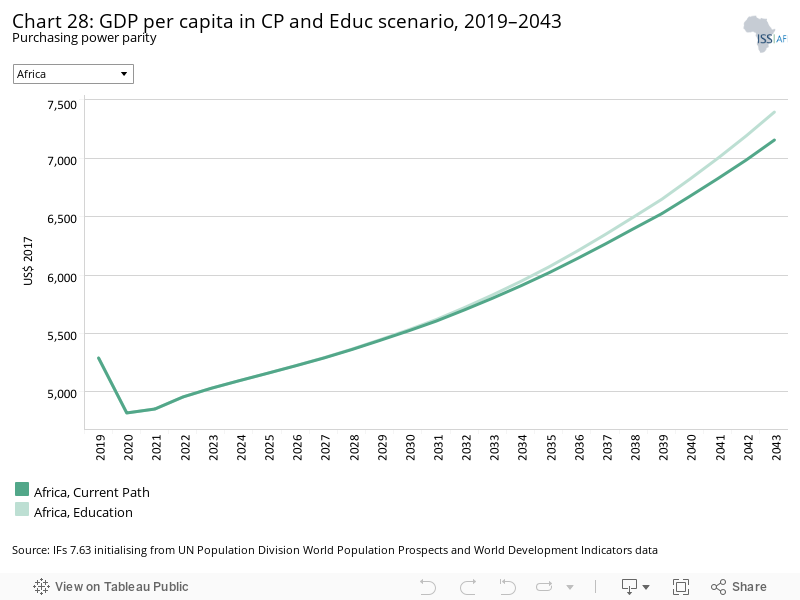
Because improvements in education take a long time to show visible results, the GDP per capita for Africa will only increase by 3% in 2043, but its impact cascades through all scenarios. The average GDP per capita for Africa was US$5 289 in 2019 and is set to increase to US$7 157 by 2043 in the Current Path forecast. In the Education scenario, the GDP per capita will improve by US$240 to US$7 397 in 2043.
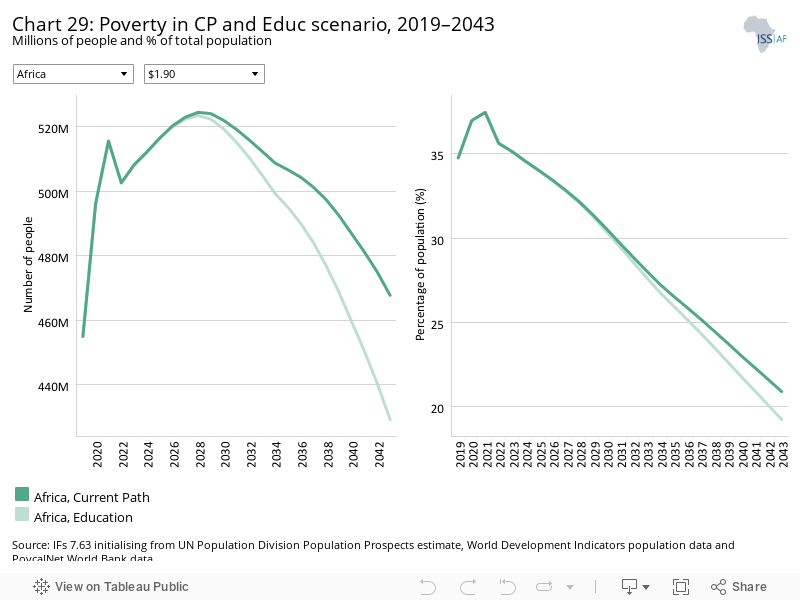
Materialisation of the Education scenario impacts poverty in Africa such that by 2043 in the Education scenario, 38.6 million people will move out of poverty compared to the Current Path forecast of a 1.66 percentage point reduction in extreme poverty. In the Education scenario, poverty will fall to 19.2%, three times higher than the world average poverty rate (6.03%) in 2043.
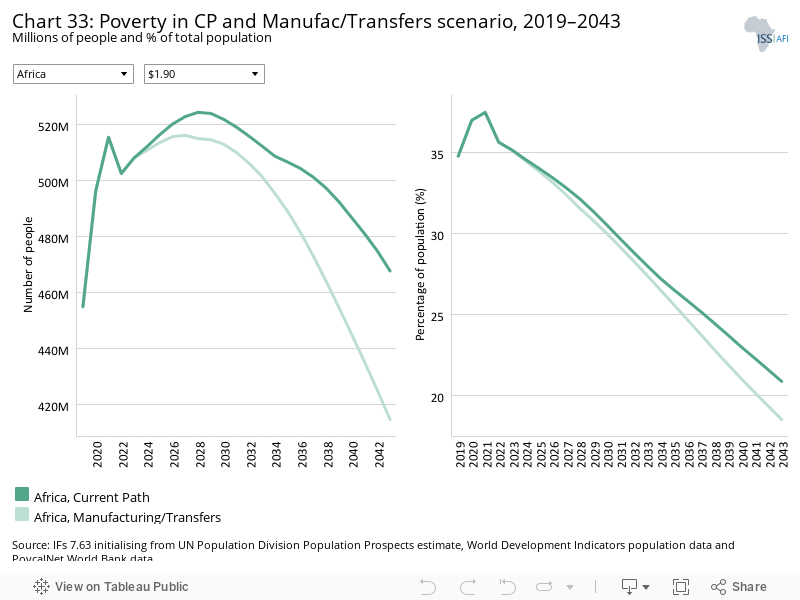
The Manufacturing/Transfers scenario represents reasonable but ambitious manufacturing growth through greater investment in the economy, investments in research and development, and promotion of the export of manufactured goods. It is accompanied by an increase in welfare transfers (social grants) to moderate the initial increases in inequality that are typically associated with a manufacturing transition. To this end, the scenario improves tax administration and increases government revenues.
The intervention is explained here in the thematic part of the website.
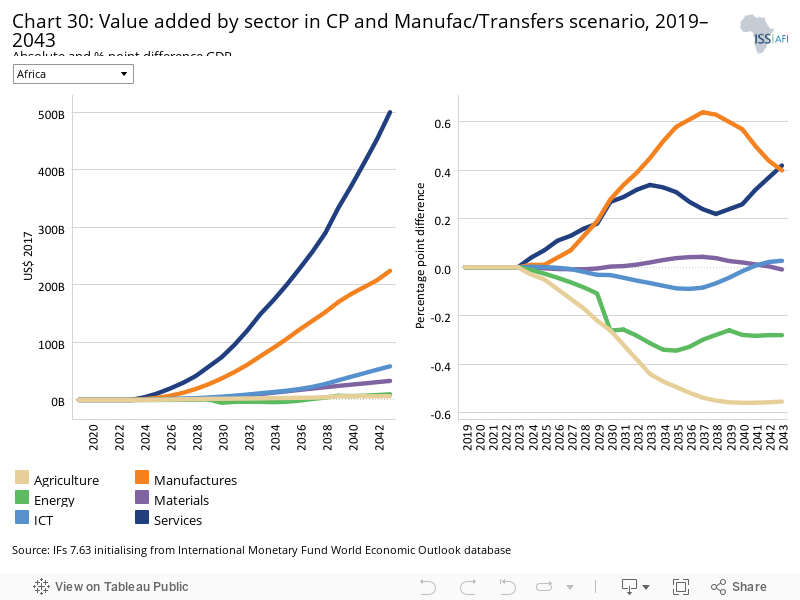
Chart 30 should be read with Chart 8 that presents a stacked area graph on the contribution to GDP and size, in billion US$, of the Current Path economy for each of the sectors.
In the Manufacturing/Transfers scenario, the manufacturing and service sectors will increase in their relative importance while the agriculture and energy sectors decline, although all sectors are larger given more rapid economic growth. The impact of the scenario is an increase in the size of Africa’s economy by 9.5% above the 2043 Current Path forecast. In value terms, the agriculture sector will be 1% larger in 2043 than in the Current Path forecast. Energy will be 2.6% larger, materials 9.3% larger, manufacturing 11.5% larger, service 10.4% larger, and ICT 20% larger.
Generally, low-end services dominate the African economy, accounting for half of the GDP (50.4%) in 2019 and are set to increase to 55.4% in 2043. In the Manufacturing/Transfers scenario, the service sector increases by US$500.31 billion compared to the Current Path to 55.81% — an increase of 0.32 percentage points by 2043. Coming from a low base compared to other regions, the manufacturing sector will increase by US$224.54 billion in size in 2043 compared to the Current Path forecast (an additional 0.4 percentage points of GDP), while the ICT sector will contribute an additional US$58.42 billion (0.03 percentage points) in 2043. Even with the growth in the relative size of its manufacturing sector, manufacturing in Africa will still be more than 7 percentage points below the average for South Asia, although it will make a slightly larger contribution to GDP than the manufacturing sector in South America.
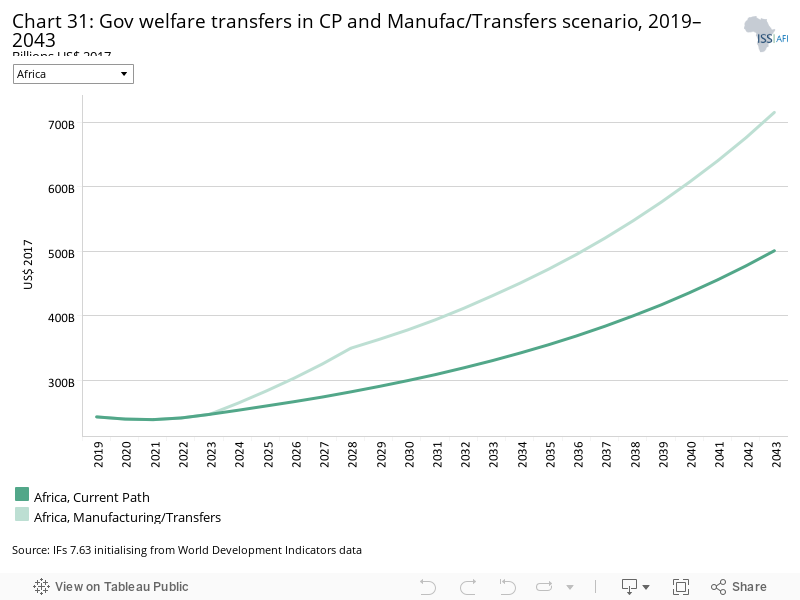
The average government transfers to households in Africa will rise from US$242.85 billion in 2019 to US$500.85 billion in 2043 in the Current Path forecast. However, the Manufacturing/Transfers scenario will add a significant US$215 billion to the Current Path forecast value representing US$715.15 billion in 2043.
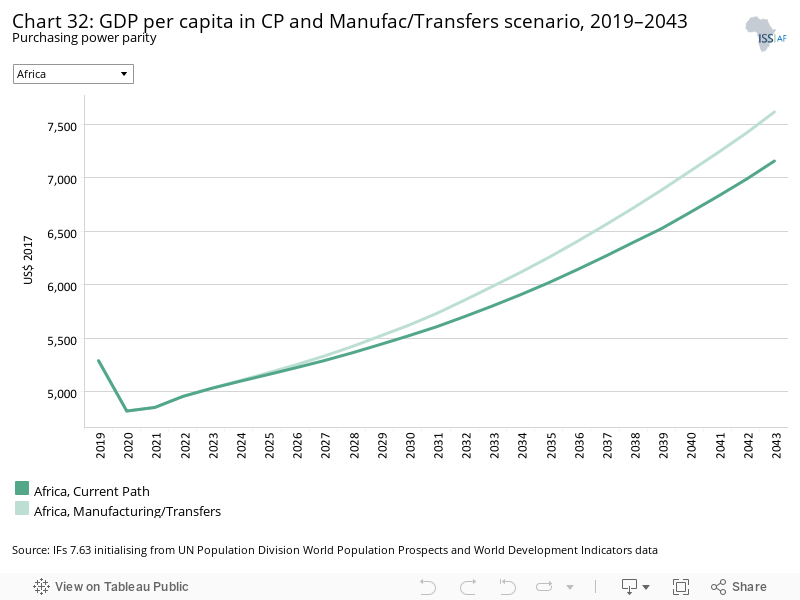
In 2019, the GDP per capita in Africa was US$5 289 — lower than the world average GDP per capita of US$7 048. In the Current Path forecast, Africa will increase its GDP per capita to US$7 157 in 2043. In the Manufacturing/Transfer scenarios, the GDP per capita increases to US$7 616 in 2043, an increase of US$459, or more than 6%.
The Manufacturing/Transfers scenario will reduce the number of poor people to 414.5 million (18.53%) by 2043, down from 467.7 million in 2019. This scenario will result in a 2.35 percentage point alleviation of extreme poverty by 2043 compared to the Current Path forecast, which means lifting 53.2 million people out of extreme poverty.
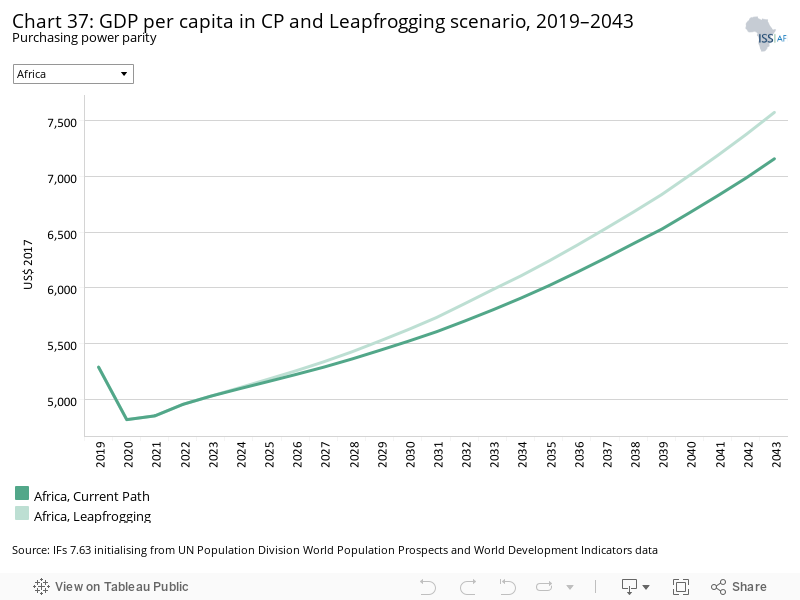
The Leapfrogging scenario represents a reasonable but ambitious adoption of and investment in renewable energy technologies, resulting in better access to electricity in urban and rural areas. The scenario includes accelerated access to mobile and fixed broadband and the adoption of modern technology that improves government efficiency and allows for the more rapid formalisation of the informal sector.
The intervention is explained here in the thematic part of the website.
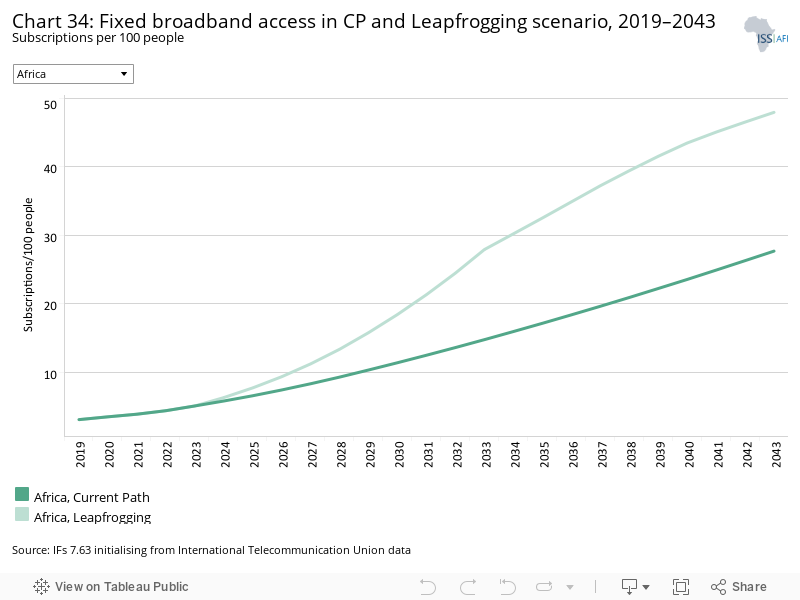
Fixed broadband includes cable modem Internet connections, DSL Internet connections of at least 256 KB/s, fibre and other fixed broadband technology connections (such as satellite broadband Internet, ethernet local area networks, fixed-wireless access, wireless local area networks, WiMAX, etc.).
Africa has a very low fixed broadband subscription rate, at 3.15 subscriptions per 100 people in 2019, as the continent moves rapidly to mobile broadband as the preferred means of connecting to the Internet. In the Leapfrogging scenario, fixed broadband subscriptions increase to 47.92 per 100 people by 2043. This is 20.27 subscriptions more than in the Current Path forecast and higher than the average for the rest of the world (at 44.3 subscriptions per 100 people).
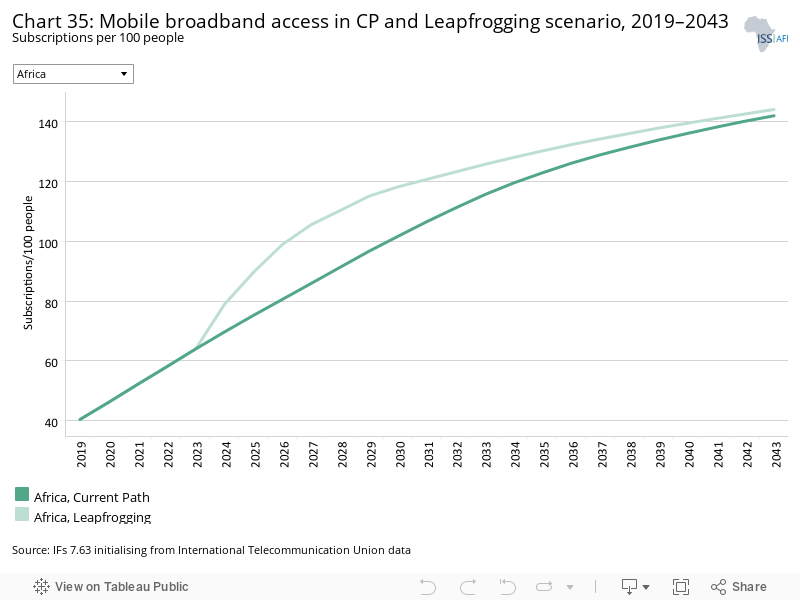
Mobile broadband refers to wireless Internet access delivered through cellular towers to computers and other digital devices.
Africa had a mobile broadband subscription rate of 40.47 per 100 people in 2019. This was 45.7 subscriptions fewer than the average in the rest of the world which is, by 2026, approaching saturation rates at 130 subscriptions per 100 people. Since Africa comes from a lower base, subscriptions in the Leapfrogging scenario increase rapidly reaching 130 subscription per 100 people in 2035 instead of 2038 as in the Current Path forecast. Mobile broadband in Africa is projected to increase to 143.93 subscriptions per 100 people by 2043. This is only 2.13 subscriptions more than the Current Path forecast given levels of saturation.
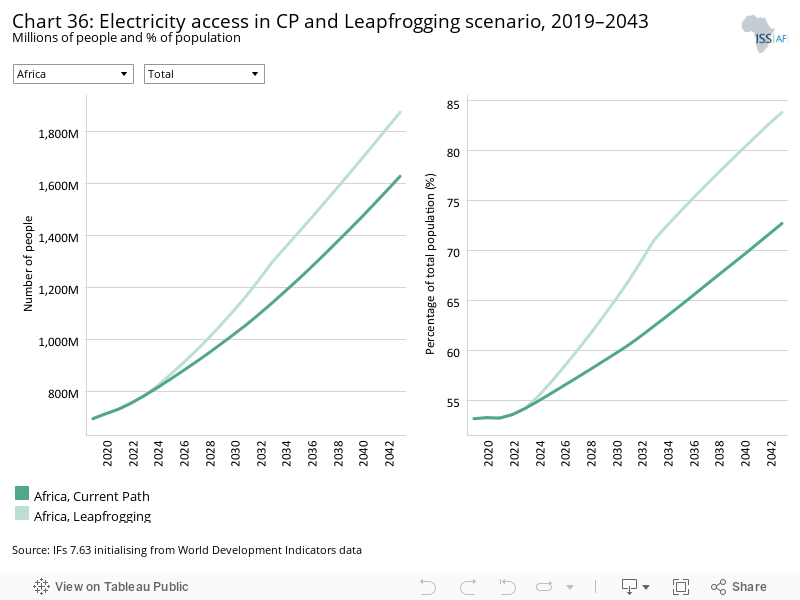
Just over half of Africans (53.18% or 696.13 million people) had access to electricity in 2019. These rates are significantly lower than in comparable regions such as South America (98.2%) and South Asia (88.6%). South Asia is on track to get to 96% access in 2036 at which point rates of access in Africa will only be at 65.4%. In the Current Path forecast, 72.69% (or 1 627.5 million people) of Africa will have access to electricity by 2043, still significantly below the rates in South America and South Asia. In the Leapfrogging scenario, electricity access is projected to reach 83.78% of the population by 2043, equivalent to 1 873.32 million people, through the widespread adoption of decentralised renewables such as wind and solar in mini- and off-grid solutions.
Niger, Burundi and Chad achieve the most progress in improved rates of electricity access in the Leapfrogging scenario.
Progress in rural areas will, however, lag. In the Current Path forecast, rural electricity access will increase from 39.3% in 2019 to 59.2% in 2043 and 75.8% in the Leapfrogging scenario. In urban Africa, access in the Leapfrogging scenario will be 91% in 2043 compared to 85.9% in the Current Path forecast.
Electricity access in the Leapfrogging scenario in 2043 for Africa (at 75.8%) will be lower than the average for the rest of the world which is above 96% as from 2026.
In 2019, the GDP per capita in Africa was US$5 289 — lower than the world average of US$7 048. In the Current Path forecast, Africa will increase its GDP per capita to US$7 157, US$13 493 lower than the 2043 world average. In the Leapfrogging scenario, the GDP per capita increases to US$7 573 in 2043, US$416 above the Current Path forecast value due to greater access to electricity and Internet, the adoption of modern technologies and rapid formalisation of the informal sector.
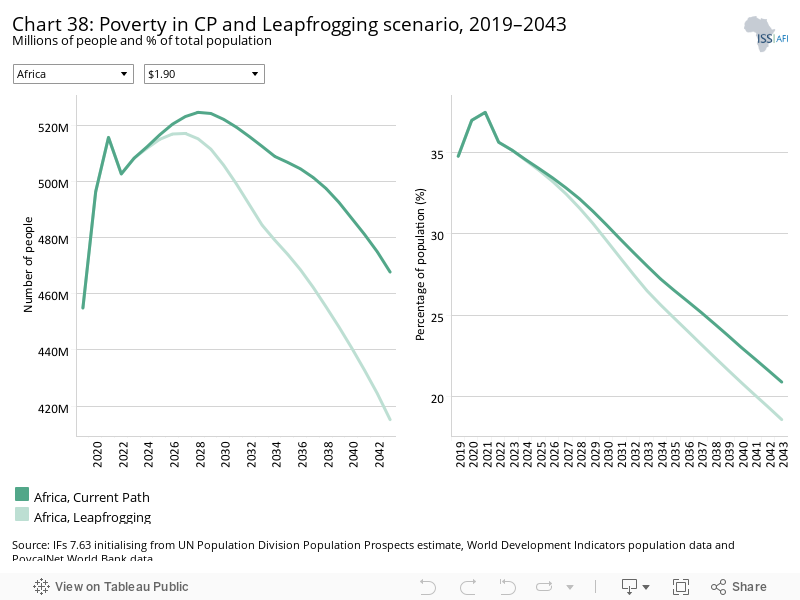
While the poverty rate in Africa reduces from 34.77% to 20.90%, the number of poor people is set to increase from 454.9 million in 2019 to 468.2 million in 2043. In the Leapfrogging scenario, the poverty rate declines by 2.4 percentage points more than the Current Path forecast amounting to 53 million fewer people in poverty in 2043. The poverty gains from the Leapfrogging scenario are due to increased access to electricity and Internet and the adoption of modern technologies in government.
The three countries that experience the largest decline in extreme poverty in the Leapfrogging scenario are Uganda, Zambia and Zimbabwe.
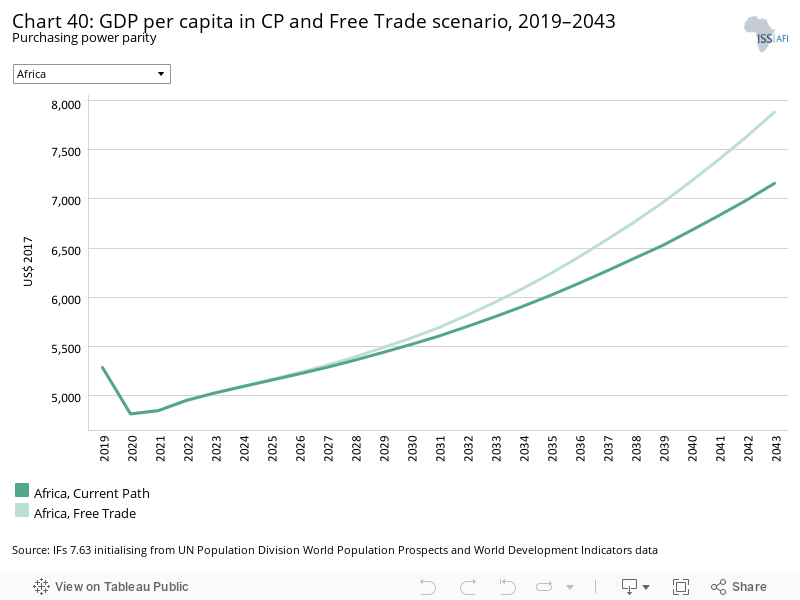
The Free Trade scenario represents the impact of the full implementation of the African Continental Free Trade Area (AfCFTA) by 2034 through increases in exports, improved productivity and increased trade and economic freedom.
The intervention is explained here in the thematic part of the website.
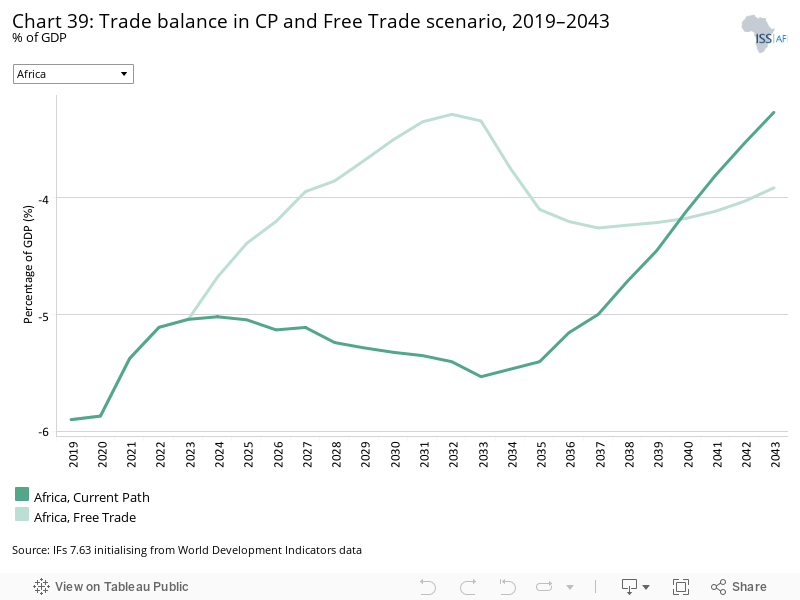
The trade balance is the difference between the value of a country's exports and its imports. A country that imports more goods and services than it exports in terms of value has a trade deficit, while a country that exports more goods and services than it imports has a trade surplus.
In 2019, Africa’s trade balance was already negative to the tune of -5.9% of GDP, and in the Current Path forecast it is expected to improve to -3.28% of GDP in 2043. Until 2040 Africa’s trade balance improves significantly in the Free Trade scenario compared to the Current Path forecast, although it deteriorates thereafter. In the Free Trade scenario, Africa’s trade balance improves to -3.26% in 2032 before it declines to -3.92% in 2043. Additionally, in this scenario, Africa will import US$270.1 billion more goods in 2043 and export US%265.3 billion more. Although the implementation of the AfCFTA is an important step in the structural transformation of African economies towards higher-value production, the results reflect the importance of additional efforts to incentivise Africa’s manufacturing sector, reflected in the Manufacturing/Transfers scenario Jump to Manufacturing/Transfers scenario, as well as the need to capitalise on its agriculture potential, reflected in the Agriculture scenario Jump to Agriculture scenario.
In 2019, the GDP per capita in Africa was US$5 089 (30% of the world average). In the Current Path forecast, Africa will increase its GDP per capita to US$7 157 in 2043 which is less than one-third of the global average at US$22 323. In the Free Trade scenario, the GDP per capita increases to US$7 880 in 2043, US$723 above the Current Path forecast, at a time when Africa’s population has increased by a substantial margin. Africa will therefore start narrowing the gap with global averages. Instead of the 2043 Current Path ratio of 32.1% of the global average, Africa’s GDP per capita will be 35.2% — an improvement of three percentage points.
While the Current Path poverty rate in Africa reduces from 34.8% in 2019 to 20.9% in 2043, the number of poor people is set to increase from 454.9 million in 2019 to 467.7 million in 2043. In the Free Trade scenario, the poverty rate declines to 17.3%, with 80.3 million fewer people living in extreme poverty in 2043. By 2043, almost all the world’s people living in extreme poverty will be in sub-Saharan Africa.
The Free Trade scenario makes a significant contribution to lower rates of extreme poverty in Africa but on its own is insufficient to effect a substantive decline.
The Financial Flows scenario represents a reasonable but ambitious increase in worker remittances and aid flows to poor countries, and an increase in the stock of foreign direct investment (FDI) and additional portfolio investment inflows to middle-income countries. We also reduced outward financial flows to emulate a reduction in illicit financial outflows.
The intervention is explained here in the thematic part of the website.
As African economies grow, it is inevitable that aid as a per cent of GDP declines since the forecast of aid to Africa lags behind growth in the size of the African economy. In 2019, foreign aid constituted 2.38% of Africa’s GDP; it will decline to 1.21% in the Current Path forecast by 2043 — although the absolute amount increases from US$72.7 billion in 2019 to US$105.2 billion in 2043.
In the Financial Flows scenario, foreign aid is set to mildly increase to 1.27%, 0.06 percentage points (or US$7.3 billion) compared to the Current Path forecast in 2043. The additional aid flows overwhelmingly to low and lower middle-income countries. Whereas the increase in aid in the Financial Flows scenario for Africa as a whole is 8% more than the Current Path forecast by 2043, the average increase to Africa’s 23 low-income countries is 14%. By comparison, Africa’s seven upper middle-income countries actually experience an 11% decline in their aid allocations.
Africa steadily attracts more FDI as a per cent of GDP, although the improvement is slow. In the Current Path forecast, FDI inflows increase by about a percentage point (0.9) in 2043 compared to 2019 and is, by 2043, then roughly on par with the inflows as a per cent of GDP in South America.
In the Financial Flows scenarios, FDI inflows in Africa will increase to 4.24% — 0.49 percentage points more than the Current Path forecast in 2043. The stock of FDI in Africa, at US$1 215 billion in 2019, will increase to US$4 114.8 billion, an improvement of US$534.2 billion above the 2043 Current Path forecast.
Whereas aid flows largely go to low and lower middle-income countries, the larger portion of additional FDI goes to upper- and lower middle-income countries.
The size of remittance inflows to Africa is set to increase to US$131.35 billion in 2043 from just US$51.37 billion in 2019 in the Current Path forecast. Africa consistently gets much more remittances in US$ terms and as a per cent of GDP than South America, but less than South Asia.
In the Financial Flows scenario, remittance inflow is set to increase by US$21.8 billion to US$153.15 billion in 2043 in the Current Path forecast. This improvement in remittance receipt is represented by a 0.2 percentage point increase compared to the 2043 Current Path forecast value of 1.51%. Not all African countries are net receivers of remittances, however. In 2019, Nigeria, Egypt and Morocco received the largest amounts of remittances, while South Africa, Mauritius, Libya and Angola experienced net remittance outflows. Over time, the number of countries that record net remittance outflows increase from three in 2019 to 23 in 2043 in the Current Path forecast. In the Financial Flows scenario, 24 African countries will experience net remittance outflows in 2043.
In 2019, the GDP per capita was US$5 289, which was lower than the world average. In the Current Path forecast, Africa will increase its GDP per capita to US$7 157, US$13 493 lower than the world average GDP per capita in 2043. In the Financial Flows scenario, however, the GDP per capita increases to US$7 296 in 2043, due mainly to remittances and aid flows to Africa.
Trade openness will reduce poverty in the long term after initially increasing it due to the redistributive effects of trade. Most African countries export primary commodities and low-tech manufacturing products, and therefore a continental free trade agreement (AfCFTA) that reduces tariffs and non-tariff barriers across Africa will increase competition among countries in primary commodities and low-tech manufacturing exports. Countries with inefficient, high-cost manufacturing sectors might be displaced as the AfCFTA is implemented, thereby pushing up poverty rates. In the long term, as the economy adjusts and produces and exports its comparatively advantaged (lower relative cost) goods and services, poverty rates will decline.
In the Current Path forecast, the poverty rate reduces from 34.8 to 20.9%, but the number of poor people is set to increase from 454.9 million people to 468.2 million between 2019 and 2043. In the Financial Flows scenario, the poverty rate declines marginally (0.91 percentage points or 20.2 million fewer extremely poor people). On its own, more aid, remittances and FDI, and fewer illicit financial outflows are insufficient to reduce extreme poverty and increase incomes. Much more is required to unlock more rapid growth, grow incomes and achieve the structural transformation of African economies.
The three countries that achieve the largest percentage point reduction in extreme poverty in 2043 in the Financial Flows scenario are Madagascar, Sierra Leone and Liberia. In Mauritania and Botswana, poverty increases marginally in the Financial Flows scenario when compared to the Current Path forecast. In both countries, high levels of inequality, and no additional aid, means that FDI inflows do not benefit the poor, leading to an increase in inequality. This points to the need for additional measures such as social grants to offset these trends while the countries pursue pro-growth policies.
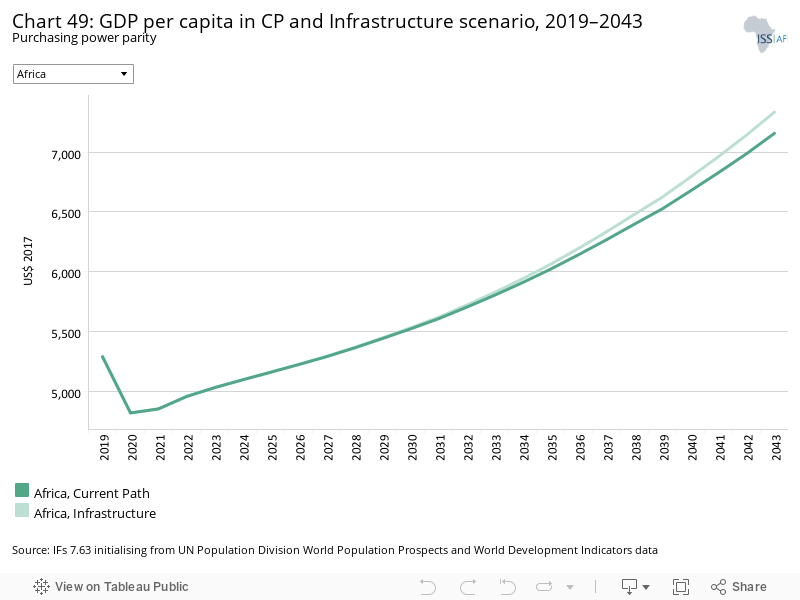
The Infrastructure scenario represents a reasonable but ambitious increase in infrastructure spending across Africa, focusing on basic infrastructure (roads, water, sanitation, electricity access and ICT) in low-income countries and increasing emphasis on advanced infrastructure (such as ports, airports, railway and electricity generation) in higher-income countries.
Note that health and sanitation infrastructure is included as part of the Health/WaSH scenario and that ICT infrastructure and more rapid uptake of renewables are part of the Leapfrogging scenario. The interventions there push directly on outcomes, whereas those modelled in this scenario increase infrastructure spending, indirectly boosting other forms of infrastructure, including that supporting health, sanitation and ICT.
The intervention is explained here in the thematic part of the website.
In Africa, nearly a billion more people will have access to electricity in 2043 in the Current Path forecast, compared to the situation in 2019, as access increases from 53.2% (2019) of Africa’s population to 72.7% (2043). In the Infrastructure scenario, access improves to 76.6% in 2043. The improvements will arise as more basic and advanced infrastructure is installed across the continent.
Indicator 9.1.1 in the Sustainable Development Goals refers to the proportion of the rural population who live within 2 km of an all-season road and is captured in the Rural Access Index.
The proportion of the population in Africa within 2 km access of an all-weather road is set to increase from 53% in 2019 to 59.1% 2043 in the Current Path forecast and to 60.9% in the Infrastructure scenario. This is equivalent to an additional 19.5 million rural Africans having access to an all-weather road, even as the continent adds almost half a million kilometres of additional roads to its current stock in 2043 compared to the Current Path forecast.
Notably, South Africa had a significantly larger road network than any other African country in 2019.
In 2019, the GDP per capita in Africa was US$5 289 — lower than the world average GDP per capita of US$7 048. In the Current Path forecast, Africa will increase its GDP per capita to US$7 157, US$13 493 lower than the world average GDP per capita in 2043. In the Infrastructure scenario, the GDP per capita increases to US$7 335 in 2043, adding less than US$200 more to the Current Path forecast value. The additional increase in the Infrastructure scenario will accrue to greater spending on basic infrastructure in low-income countries and advanced infrastructure in higher-income countries.
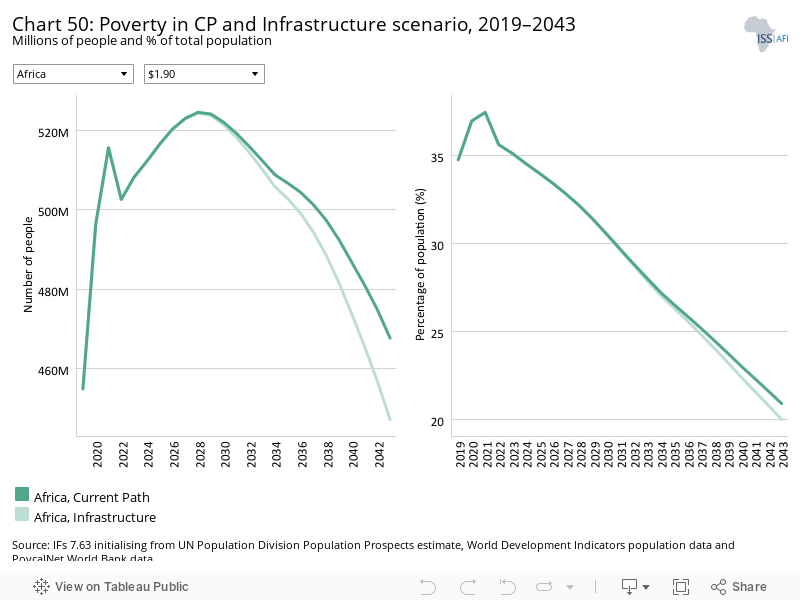
The poverty rate (at the US$1.90 poverty line) in Africa is set to reduce from 34.77% to 20.90%, and the number of poor people from 454.9 million people to 468.2 million between 2019 and 2043 respectively. In the Infrastructure scenario, the poverty rate will decline marginally (0.93%) more than in the Current Path forecast, amounting to 20.9 million fewer people in poverty compared to the Current Path forecast in 2043. Despite the significant gains in the Free Trade scenario due to more trade and higher productivity, poverty rates will remain higher in Africa compared to the Current Path forecast of poverty in the world in 2043.
The Governance scenario represents a reasonable but ambitious improvement in accountability and reduces corruption, and hence improves the quality of service delivery by government.
The intervention is explained here in the thematic part of the website.
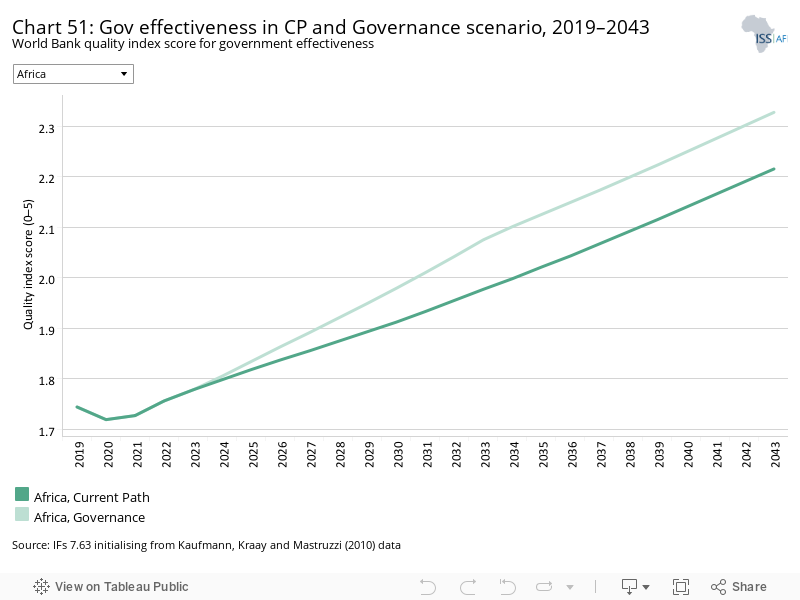
As defined by the World Bank, government effectiveness ‘captures perceptions of the quality of public services, the quality of the civil service and the degree of its independence from political pressures, the quality of policy formulation and implementation, and the credibility of the government’s commitment to such policies’.
Chart 51 presents the impact of the interventions in the Governance scenario on government effectiveness.
In 2019, the World Bank gave Africa an average score of 1.7 out of a possible 5 for government effectiveness compared to 2.3 for South America and 2.2 for South Asia. The average in the rest of the world was 2.8. Generally, government effectiveness in Africa is poor, although scores range from 3.6 for Mauritius to 0.19 for South Sudan. Government effectiveness in Africa is forecast to improve to 2.22 in 2043 as a result of more democratic accountability, representing a 5% improvement in the Current Path forecast. Coming from a very low base, in 2043 South Sudan will experience an 88% improvement in government effectiveness, followed by 17% in Sudan and Eritrea. The countries that will gain the least improvements in government effectiveness by 2043 are those that already do well, namely Seychelles, Cape Verde and Mauritius. Whereas in 2043 the average government effectiveness score in Africa was 63% of the average for the rest of the world, by 2043 it will increase to 74% in the Governance scenario.
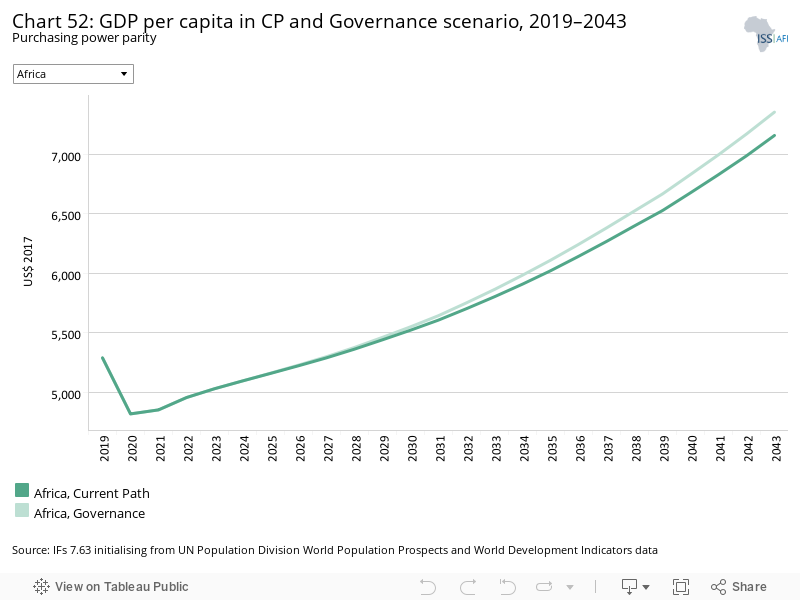
In 2019, the GDP per capita in Africa was US$5 289 — below the world average GDP per capita of US$7 048. More democratic accountability improves the GDP per capita by 2.7% above the Current Path forecast to US$7 353 in 2043.
While Africa’s poverty rate reduces from 34.8% in 2019 to 20.9% in 2043 in the Current Path forecast, the number of poor people is set to increase from 454.9 million people to 468.2 million between 2019 and 2043 respectively. On its own, the Governance scenario reduces extreme poverty marginally (0.91 percentage points) below the Current Path forecast to 20% in 2043. This amounts to 20.2 million fewer people in extreme poverty compared to the Current Path forecast in 2043.
This section presents projections for carbon emissions in the Current Path for Africa and the 11 scenarios. Note that IFs uses carbon equivalents rather than CO2 equivalents.
In 2043, the Free Trade scenario will release the most carbon (1 013 million tons), followed by the Manufacturing/Transfers scenario (985 million tons). Because of the slower increase in population size, the Demographic scenario releases the least carbon (924 million tons in 2043). The Current Path forecast is that Africa will release 939 million tons of carbon in 2043.
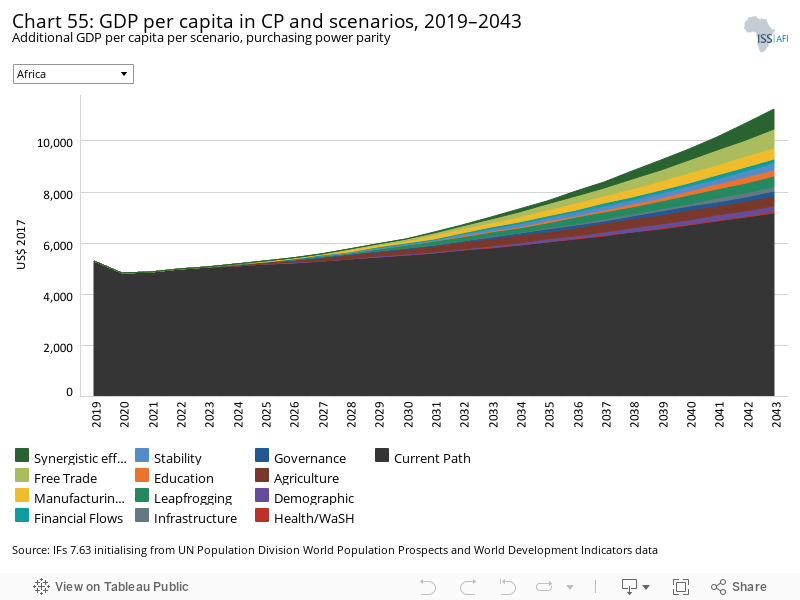
The Combined Agenda 2063 scenario consists of the combination of all 11 sectoral scenarios presented above, namely the Stability, Demographic, Health/WaSH, Agriculture, Education, Manufacturing/Transfers, Leapfrogging, Free Trade, Financial Flows, Infrastructure and Governance scenarios. The cumulative impact of better education, health, infrastructure, etc. means that countries get an additional benefit in the integrated IFs forecasting platform that we refer to as the synergistic effect. Chart 55 presents the contribution of each of these 12 components to GDP per capita in the Combined Agenda 2063 scenario as a stacked area graph.
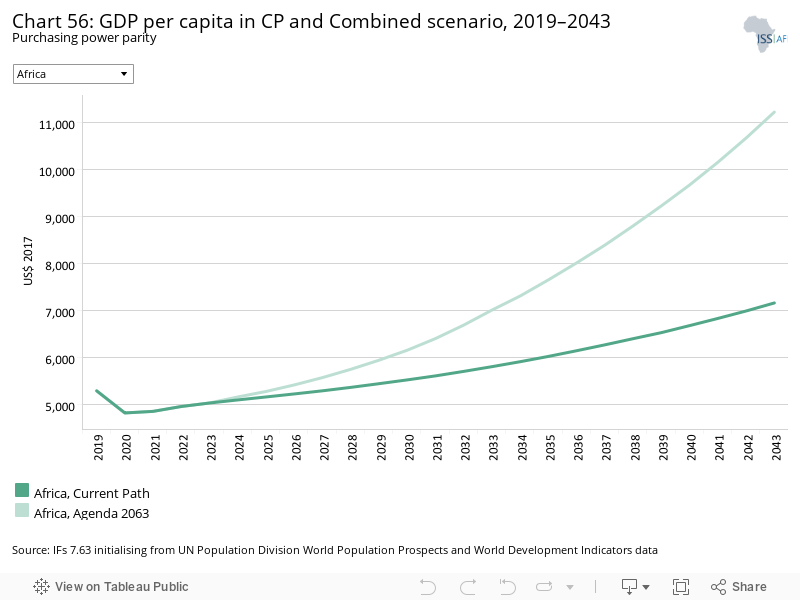
In 2019, the GDP per capita in Africa was US$5 289 and will increase to US$7 157 in the Current Path forecast by 2043. In the Combined Agenda 2063 scenario, the GDP per capita increases significantly to US$11 216 in 2043 — a difference of US$4 059, or 57%, above the 2043 Current Path forecast. The largest contribution comes from the synergistic effect — the extent to which the rising tide of better investments in labour capital and technology combine to raise all boats. Next to the synergistic effect, the Free Trade scenario has the largest positive impact, reflecting the huge potential that the full implementation of the AfCFTA has on Africa’s prospects, followed by the Manufacturing/Transfers scenario. The Financial Flows and Health/WaSH scenarios make the smallest contribution to the GDP per capita by 2043.
Whereas Chart 55 presents a stacked area graph on the contribution of each scenario to GDP per capita as well as the additional benefit or synergistic effect, Chart 56 presents only the GDP per capita in the Current Path forecast and the Combined Agenda 2063 scenario.
Regionally, West Africa grows most rapidly, experiencing an 85% increase in the GDP per capita above the Current Path forecast in 2043, followed by Central Africa (82% increase), East Africa (77% increase), Southern Africa (60% increase) and North Africa (42% increase). However, North Africa comes from a much higher base. Its GDP per capita in 2019 was almost double that of the second most prosperous region, Southern Africa. Central Africa and the Horn/East Africa come from a much lower base than other regions with a GDP per capita of US$5 206 and US$4 538, respectively.
In absolute terms, Namibia gains the most from the Combined Agenda 2063 scenario. In 2043, its GDP per capita is US$7 968 larger than the Current Path forecast for that year, followed by Eswatini (US$7 739 larger) and Seychelles (US$6 922 larger). The countries that gain the least are the Central African Republic (US$1 141 larger), Somalia (US$995 larger) and Burundi (US$878 larger).
Using the per cent increase above the 2043 Current Path forecast as a measure of improvement, Malawi does the best (135% above the Current Path forecast), followed by Madagascar (112%) and Uganda (99%). The countries that gain the least in per cent increase above the 2043 Current Path forecast are Seychelles (20.7% increase), Mauritius (17.5% increase) and Equatorial Guinea (17% increase) since they all come from a much higher base.
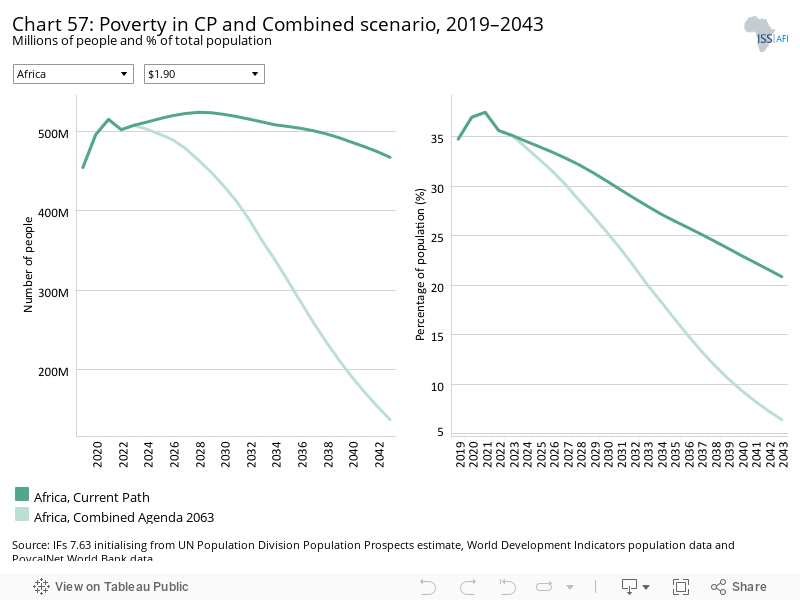
The poverty rate (at the US$1.90 poverty line) in Africa is set to reduce from 34.8 to 20.9% and the number of poor people from 454.9 million people to 467.7 million between 2019 and 2043, respectively. In the Combined Agenda 2063 scenario, the poverty rate will decline significantly to 6.4%. This will equal 331.3 million fewer people in poverty compared to the Current Path forecast in 2043. Regionally, extreme poverty (at the US$1.90 poverty line) was highest in Central Africa (54.8%) and Southern Africa (44.7%) and lowest in North Africa (1.3%) in 2019. Compared to the 2043 Current Path forecast, the Combined 2063 Agenda will reduce poverty rates most in Central Africa (by 26 percentage points) and Southern Africa (19 percentage points), and least in North Africa (0.5 percentage points) because of its low base.
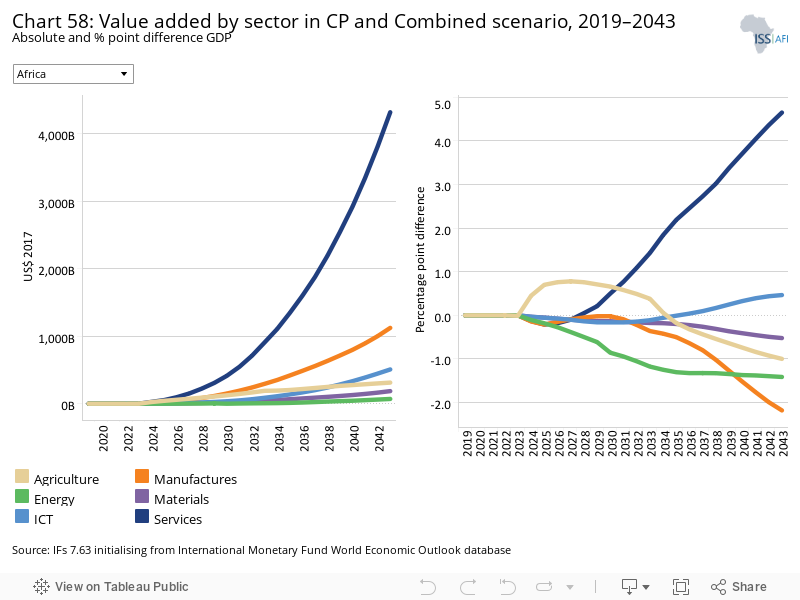
See Chart 8 to view the Current Path forecast of the sectoral composition of the economy.
The service and ICT sectors will add to the share of GDP by 4.7% and 0.47% respectively, while all other sectors will reduce in significance in share of GDP; the least being manufacturing at -2.18 percentage points. In terms of the value of contribution, the service sector will make the greatest contribution to GDP in the Combined Agenda 2063 scenarios of US$4 316 billion followed in a distant second by manufacturers of US$1.123 trillion, and the least contributor to GDP is the energy sector US$70.31 billion. Across all income groups, the agriculture share of GDP will decline in the Combined 2063 Agenda scenario compared to the 2043 Current Path forecast, while services share will increase. Nigeria alone will add US$1 292 billion worth of services to GDP in the Combined Agenda 2063 scenario.
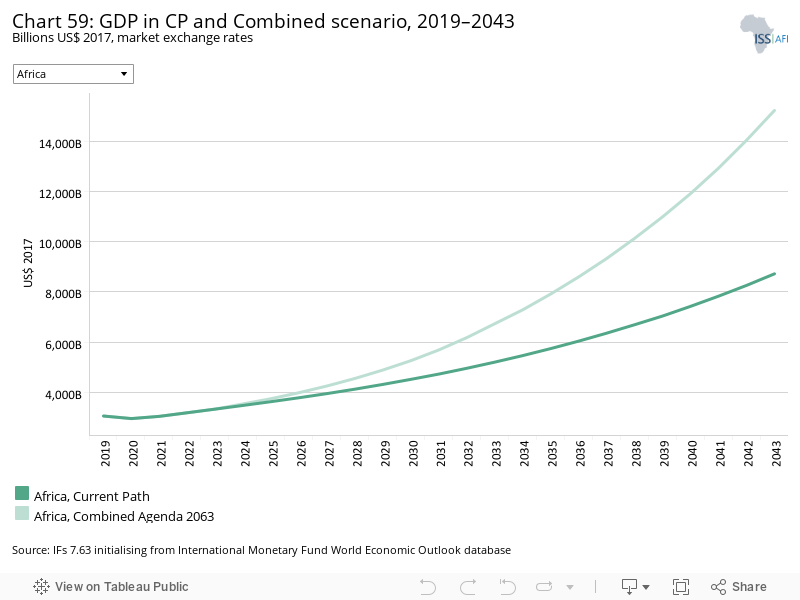
In the Current Path forecast, Africa’s economy will grow from US$3.055 trillion to US$8.724 trillion in 2043. In the Combined Agenda 2063 scenario, the African economy is set to increase to US$15.238 trillion, nearly double the Current Path forecast in 2043.
Despite the enormous gain, this will be less than 10% of the size of the rest of the world economy but greater than the 2043 Current Path forecast for South Asia (US$15 227 billion). Nigeria will make up 25% of the US$15 trillion economy.
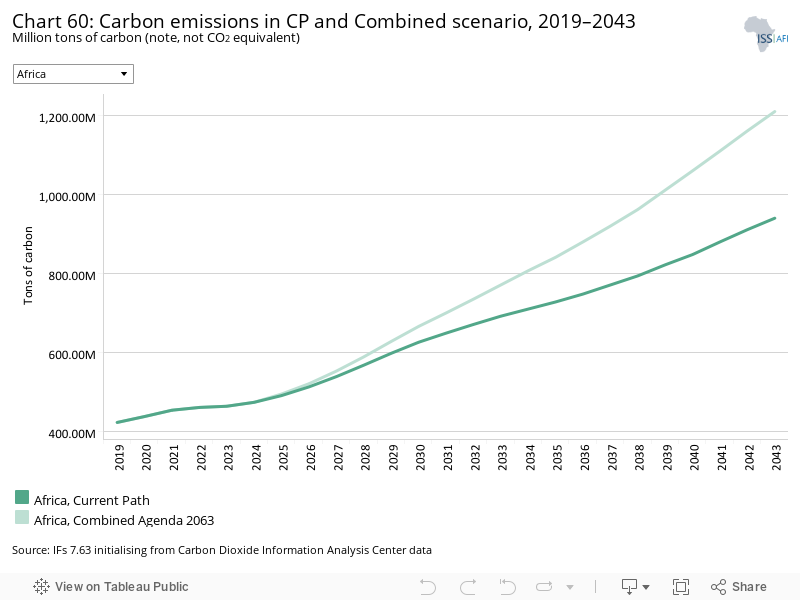
Carbon emission will increase from 422 million tons in 2019 to 939 million tons in 2043 in the Current Path forecast. In the Combined Agenda 2063 scenarios, carbon emissions are set to increase to 1.209 billion tons in 2043, 270 million tons more compared to the Current Path forecast. In the Combined Agenda 2063 scenario, Africa will cause more damage to the environment than North America (1 123 million tons) and Europe (887 000 tons) in 2043 in the Current Path forecast. Nigeria (289 million tons), Egypt (177 million tons) and South Africa (115 million tons) will be the largest carbon emitters in the 2043 Combined Agenda 2063 scenario. São Tomé and Príncipe by virtue of its size will be the least carbon emitter at 130 000 tons of carbon.
Endnotes
Frankema et al (eds), The History of African Development. An Online Textbook for a New Generation of African Students and Teachers, African Economic History Network, 2022.
Page information
Contact at AFI team is Mustapha Jobarteh
This entry was last updated on 25 June 2024 using IFs v7.63.
Donors and sponsors


Reuse our work
- All visualizations, data, and text produced by African Futures are completely open access under the Creative Commons BY license. You have the permission to use, distribute, and reproduce these in any medium, provided the source and authors are credited.
- The data produced by third parties and made available by African Futures is subject to the license terms from the original third-party authors. We will always indicate the original source of the data in our documentation, so you should always check the license of any such third-party data before use and redistribution.
- All of our charts can be embedded in any site.
Cite this research
Mustapha Jobarteh (2025) Africa. Published online at futures.issafrica.org. Retrieved from https://futures.issafrica.org/geographic/regions/africa/ [Online Resource] Updated 25 June 2024.