 ECCAS
ECCAS
Feedback welcome
Our aim is to use the best data to inform our analysis. See our About page for information on the IFs forecasting platform. We appreciate your help and references for improvements via our feedback form.
In this entry, we first describe the Current Path forecast for the Economic Community of Central African States (ECCAS) as it is expected to unfold to 2043, the end of the third ten-year implementation plan of the African Union’s Agenda 2063 long-term vision for Africa. The Current Path in the International Futures (IFs) forecasting model initialises from country-level data that is drawn from a range of data providers. We prioritise data from national sources.
The Current Path forecast is divided into summaries on demographics, economics, poverty, health/WaSH and climate change/energy.
A second section then presents a single positive scenario for potential improvements in stability, demographics, health/WaSH, agriculture, education, manufacturing/transfers, leapfrogging, free trade, financial flows, infrastructure, governance and the impact of various scenarios on carbon emissions.
With the individual impact of these sectors and dimensions having been considered, a final section presents the impact of the Combined Agenda 2063 scenario.
We generally review the impact of each scenario and the Combined Agenda 2063 scenario on gross domestic product per person and extreme poverty except for Health/WaSH that uses life expectancy and infant mortality.
The information is presented graphically and supported by brief interpretive text.
All US$ numbers are in 2017 values.
Summary
- Current Path forecast
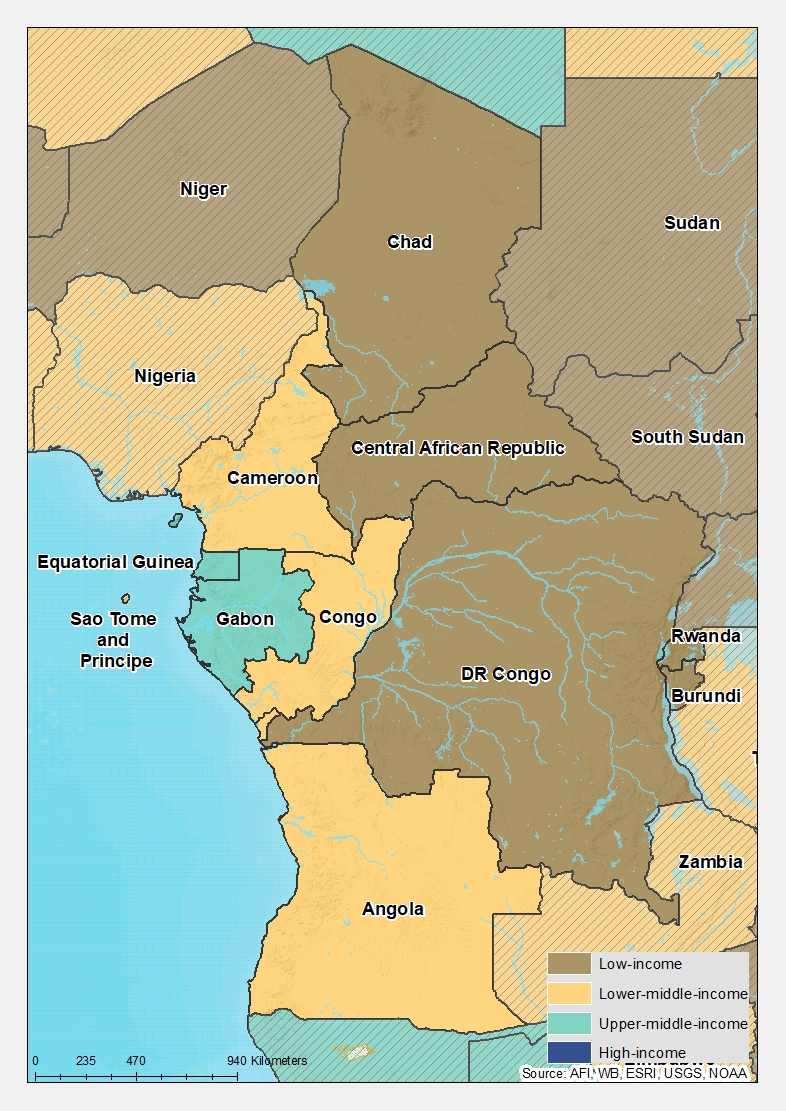
- ECCAS has 11 members: Gabon and Equatorial Guinea are classified as upper middle-income countries; Angola, Cameroon, the Republic of the Congo and São Tomé and Príncipe are all considered lower middle-income countries; and Burundi, the Central African Republic (CAR), Chad, the Democratic Republic of the Congo (DR Congo) and Rwanda are all low-income countries. Jump to forecast: Current Path
- The total population of ECCAS was 199 million in 2019 and is expected to increase to 384 million by 2043. Because of its youthful population, ECCAS will only benefit from a demographic dividend during the second half of the 21st Century. Jump to Demographics: Current Path
- The DR Congo has the largest population in ECCAS, but the Angolan economy (at 43% of ECCAS) is significantly larger than any other. The economies of Burundi, CAR and São Tomé and Príncipe each constitute less than 1% of the ECCAS economy. The services sector dominates the ECCAS economy. Jump to Economics: Current Path
- Because of its high rates of population growth and relatively slow economic growth, the number of extremely poor people (using US$1.90) in ECCAS will increase from 111.1 million in 2019 to 143.1 million in 2043 in the Current Path forecast, with the largest increase in the DR Congo. Jump to Poverty: Current Path
- ECCAS countries emitted 22 million tons of carbon in 2019—an amount that will increase five-fold to 105 million tons by 2043. Angola is the largest emitter. Jump to Carbon emissions/Energy: Current Path
- Sectoral scenarios
- The Stability scenario models an improvement to current average levels of stability in Africa and reduces the number of extremely poor people by 10.8 million in 2043. Jump to Stability scenario
- The Demographic scenario reduces fertility rates to the extent that ECCAS enters the demographic dividend in 2043 instead of 2057. Jump to Demographic scenario
- The impact of the Health/WaSH scenario is an increase of life expectancy in ECCAS by eight months by 2043. Jump to Health/WaSH scenario
- With significant agricultural potential, average crop yields in ECCAS increase by 60% in the Agriculture scenario and reduce the per cent of people living in extreme poverty by almost 10 percentage points to 28.4% by 2043. Jump to Agriculture scenario
- The impact of the Education scenario is the largest in Equatorial Guinea and Gabon. GDP per capita increases by US$763 and US$479 respectively by 2043, compared to the Current Path forecast for that year. Jump to Education scenario
- Coming from a very low base, Chad gains the largest percentage point increase in the size of its manufacturing sector in the Manufacturing/Transfers scenario, followed by Cameroon and the Republic of the Congo. Burundi gains the least. Jump to Manufacturing/Transfers scenario
- In 2019, fixed broadband access per 100 people in ECCAS was at 1.8 and in the Current Path forecast is set to increase to 25.7 people by 2043. In the Leapfrogging scenario, that rate almost doubles to 47.7, with large country to country variations. Jump to Leapfrogging scenario
- The DR Congo will realise a decline of 9.2 million fewer extremely poor people in 2043 as a result of the impact of the Leapfrogging scenario, compared to the Current Path forecast, followed by Angola with a much smaller decline of 2.5 million people. Jump to Leapfrogging scenario
- From 2024 to 2043, the cumulative reduced outward flow of remittances in the Financial Flows scenario is US$2.936 billion. The improvement is largest in the DR Congo. Jump to Financial Flows scenario
- The Republic of the Congo gains most from the Infrastructure scenario, improving rural access to an all-season road by 6.3 percentage points by 2043, followed by Rwanda. Jump to Infrastructure scenario
- The Governance scenario improves government effectiveness by 9% in 2043 above the Current Path forecast. Chad improves the most (14%) and São Tomé and Príncipe the least (5%). Jump to Governance scenario
- In 2019, Angola released half of the ECCAS carbon emission. Looking to 2043, the Free Trade scenario is the most carbon intensive scenario for ECCAS. Jump to Impact of scenarios on carbon emissions
- Combined Agenda 2063 scenario
- In 2019, average GDP per capita in ECCAS was US$2 680. In the Current Path forecast that would increase to US$4 386 in 2043. It could be US$7 267 in 2043 in the Combined Agenda 2063 scenario, which is 65.7% larger than the Current Path forecast for that year. Jump to Combined Agenda 2063 scenario
- Burundi will experience the largest decline in extreme poverty at 38.7 percentage points by 2043. Jump to Combined Agenda 2063 scenario
- In the Combined Agenda 2063 scenario, ECCAS will release 150 million tons of carbon in 2043, compared to 107 million tons in the Current Path forecast. Jump to Combined Agenda 2063 scenario
All charts for ECCAS
- Chart 1: Political map of ECCAS
- Chart 2: Population structure in CP, 1990–2043
- Chart 3: Urban and rural population in CP, 1990–2043
- Chart 4: Population density map for 2019
- Chart 5: GDP in CP, 1990–2043
- Chart 6: GDP per capita in CP, 1990–2043
- Chart 7: Informal sector value in CP, 2015–2043
- Chart 8: Value added by sector in CP, 2015–2043
- Chart 9: Agriculture production/demand in CP, 1990–2043
- Chart 10: Poverty in CP, 2015–2043
- Chart 11: Energy production by type in CP, 1990–2043
- Chart 12: Carbon emissions in CP, 1990–2043
- Chart 13: Governance security in CP and Stability scenario, 2019–2043
- Chart 14: GDP per capita in CP and Stability scenario, 2019–2043
- Chart 15: Poverty in CP and Stability scenario, 2019–2043
- Chart 16: Demographic dividend in CP and Demog scenario, 2019–2043
- Chart 17: Infant mortality in CP and Demog scenario, 2019–2043
- Chart 18: GDP per capita in CP and Demog scenario, 2019–2043
- Chart 19: Poverty in CP and Demog scenario, 2019–2043
- Chart 20: Life expectancy in CP and Health/WaSH scenario, 2019–2043
- Chart 21: Infant mortality in CP and Health/WaSH scenario, 2019–2043
- Chart 22: Yield/hectare in CP and Agric scenario, 2019–2043
- Chart 23: Agriculture imports in CP and Agric scenario, 2019–2043
- Chart 24: GDP per capita in the CP and Agric scenario, 2019–2043
- Chart 25: Poverty in CP and Agric scenario, 2019–2043
- Chart 26: Mean years of education in CP and Educ scenario, 2019–2043
- Chart 27: Education quality in CP and Educ scenario, 2019–2043
- Chart 28: GDP per capita in CP and Educ scenario, 2019–2043
- Chart 29: Poverty in CP and Educ scenario, 2019–2043
- Chart 30: Value added by sector in CP and Manufac/Transfers scenario, 2019–2043
- Chart 31: Gov welfare transfers in CP and Manufac/Transfers scenario, 2019–2043
- Chart 32: GDP per capita in CP and Manufac/Transfers scenario, 2019–2043
- Chart 33: Poverty in CP and Manufac/Transfers scenario, 2019–2043
- Chart 34: Fixed broadband access in CP and Leapfrogging scenario, 2019–2043
- Chart 35: Mobile broadband access in CP and Leapfrogging scenario, 2019–2043
- Chart 36: Electricity access in CP and Leapfrogging scenario, 2019–2043
- Chart 37: GDP per capita in CP and Leapfrogging scenario, 2019–2043
- Chart 38: Poverty in CP and Leapfrogging scenario, 2019–2043
- Chart 39: Trade balance in CP and Free Trade scenario, 2019–2043
- Chart 40: GDP per capita in CP and Free Trade scenario, 2019–2043
- Chart 41: Poverty in CP and Free Trade scenario, 2019–2043
- Chart 42: Foreign aid in CP and Financial Flows scenario, 2019–2043
- Chart 43: Inflow of FDI in CP and Financial Flows scenario, 2019–2043
- Chart 44: Remittances in CP and Financial Flows scenario, 2019–2043
- Chart 45: GDP per capita in CP and Financial Flows scenario, 2019–2043
- Chart 46: Poverty in CP and Financial Flows scenario, 2019–2043
- Chart 47: Electricity access in CP and Infrastructure scenario, 2019–2043
- Chart 48: Rural road access in CP and Infrastructure scenario, 2019–2043
- Chart 49: GDP per capita in CP and Infrastructure scenario, 2019–2043
- Chart 50: Poverty in CP and Infrastructure scenario, 2019–2043
- Chart 51: Gov effectiveness in CP and Governance scenario, 2019–2043
- Chart 52: GDP per capita in CP and Governance scenario, 2019–2043
- Chart 53: Poverty in CP and Governance scenario, 2019–2043
- Chart 54: Carbon emissions in CP and scenarios, 2019–2043
- Chart 55: GDP per capita in CP and scenarios, 2019–2043
- Chart 56: GDP per capita in CP and Combined scenario, 2019–2043
- Chart 57: Poverty in CP and Combined scenario, 2019–2043
- Chart 58: Value added by sector in CP and Combined scenario, 2019–2043
- Chart 59: GDP in CP and Combined scenario, 2019–2043
- Chart 60: Carbon emissions in CP and Combined scenario, 2019–2043


This page provides an overview of the key characteristics of ECCAS along its likely (or Current Path) development trajectory. The Current Path forecast from the International Futures forecasting (IFs) platform is a dynamic scenario that imitates the continuation of current policies and environmental conditions. The Current Path is therefore in congruence with historical patterns and produces a series of dynamic forecasts endogenised in relationships across crucial global systems. We use 2019 as a standard reference year and the forecasts generally extend to 2043 to coincide with the end of the third ten-year implementation plan of the African Union’s Agenda 2063 long-term development vision.
ECCAS has 11 member states (see Chart 1), namely Angola, Burundi, Cameroon, the Central African Republic (CAR), Chad, the Democratic Republic of the Congo (DR Congo), the Republic of the Congo, Equatorial Guinea, Gabon, Rwanda and São Tomé and Príncipe. The Community was established on 18 October 1983 by members of the Central African Customs and Economic Union (UDEAC) and the Economic Community of the Great Lakes States (CEPGL), as well as São Tomé and Príncipe. Angola remained an observer until 1999 when it became a full member. Rwanda withdrew in 2007 and rejoined in 2013.
ECCAS was inactive for several years because of the non-payment of membership fees and the conflict in the Great Lakes region, with Rwanda on the opposite side to Angola.
The Community is one of the eight regional economic communities (RECs) recognised by the African Union but generally suffers from low levels of regional integration and limited coordination. A number of ECCAS member states also belong to other RECs.
The World Bank classifies Gabon and Equatorial Guinea as nominally upper middle-income countries, but the extreme levels of poor governance and corruption mean that these categorisations do not reflect reality of the majority of their populations. Within IFs, the upper middle-income classification of these two countries means that our forecasts for them may be unreliable. Angola, Cameroon, the Republic of the Congo and São Tomé and Príncipe are all considered lower middle-income countries. The ECCAS countries classified as low-income are Burundi, CAR, Chad, the DR Congo and Rwanda.
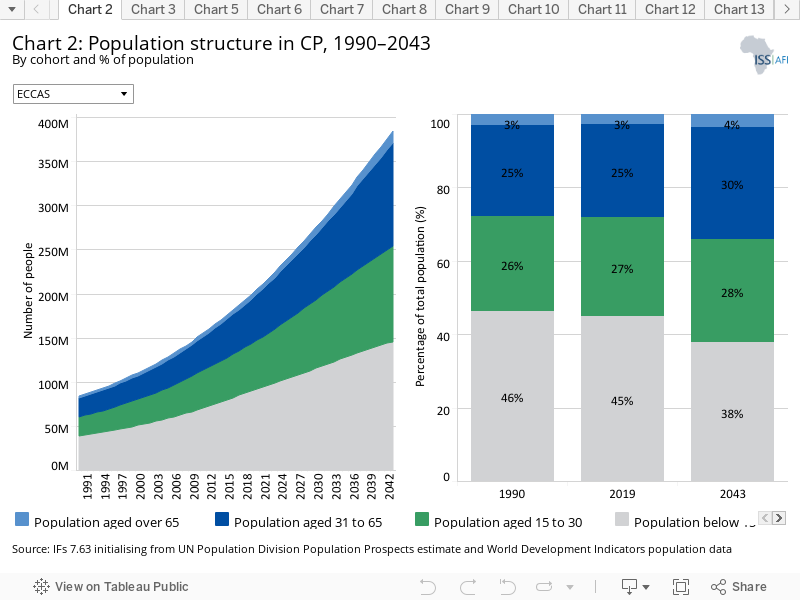
Chart 2A displays that the total population of ECCAS has increased from 83.6 million people in 1990 to 199 million in 2019 and is expected to increase to 384 million by 2043. Whereas the average population growth rate for the Community was high at 3.1% in 2019, it will modestly decline to 2.4% by 2043. The DR Congo is the most populous member state with 87 million people in 2019, followed by Angola (32 million people), Cameroon (26 million), Chad (16.3 million), Rwanda (12.6 million), Burundi (11.1 million), Republic of the Congo (5.3 million), CAR (4.8 million), Gabon (2.2 million), Equatorial Guinea (1.3 million) and São Tomé and Príncipe (218 000).
Average 2019 fertility rates in the DR Congo (at 5.9 children) and Rwanda (at 3.9 children) are coming down more rapidly than for other countries in the Community. The countries with the highest fertility rates across the forecast horizon are Chad and Angola. By 2043, these countries would still have total fertility rates of 4.4 and 4.3 children per fertile woman respectively.
In 2019, the median age for the Community ranged from 22.4 years in Gabon to 16.6 years in Angola. ECCAS, therefore, has an exceptionally young population with 49% of its adult population in the age group 15 to 29 years of age in 2019, typically considered as constituting its youth bulge (Chart 2B). Even by 2043, 45% of its adult population will still be in this bulge, implying considerable momentum towards social turbulence without very rapid expansion of services and opportunities. Because only 52.4% of its population was in the general working-age bracket (15 to 64 years of age) in 2019, ECCAS will likely only benefit from a demographic dividend during the second half of the century, as long as governments provide appropriate education, jobs and healthcare.
At 62.6 years, the 2019 average life expectancy for the ECCAS group is significantly lower than the African average at 65.8 years. Average ECCAS life expectancy will increase to 69.2 years in 2043 with the gap between males and females expected to increase from 2.7 to 3.5 years.
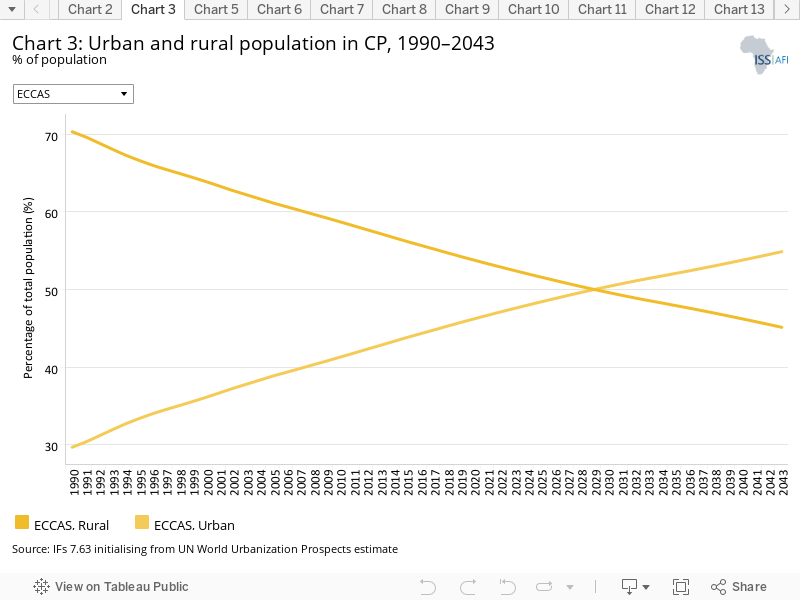
ECCAS is still predominantly rural (average of 54% in 2019) but rates differ enormously between member states. In 2019, around 92% of Gabon’s population was classified as urban, while only 13% in Burundi. Even by 2043, only 20% of the population of Burundi will be considered urban. On average, the Community will become predominantly urban in 2030 and will continue to experience urbanisation but at a slower rate compared to other RECs. By 2043, 211 million people (55%) will be living in urban areas compared to 173 million in rural areas.
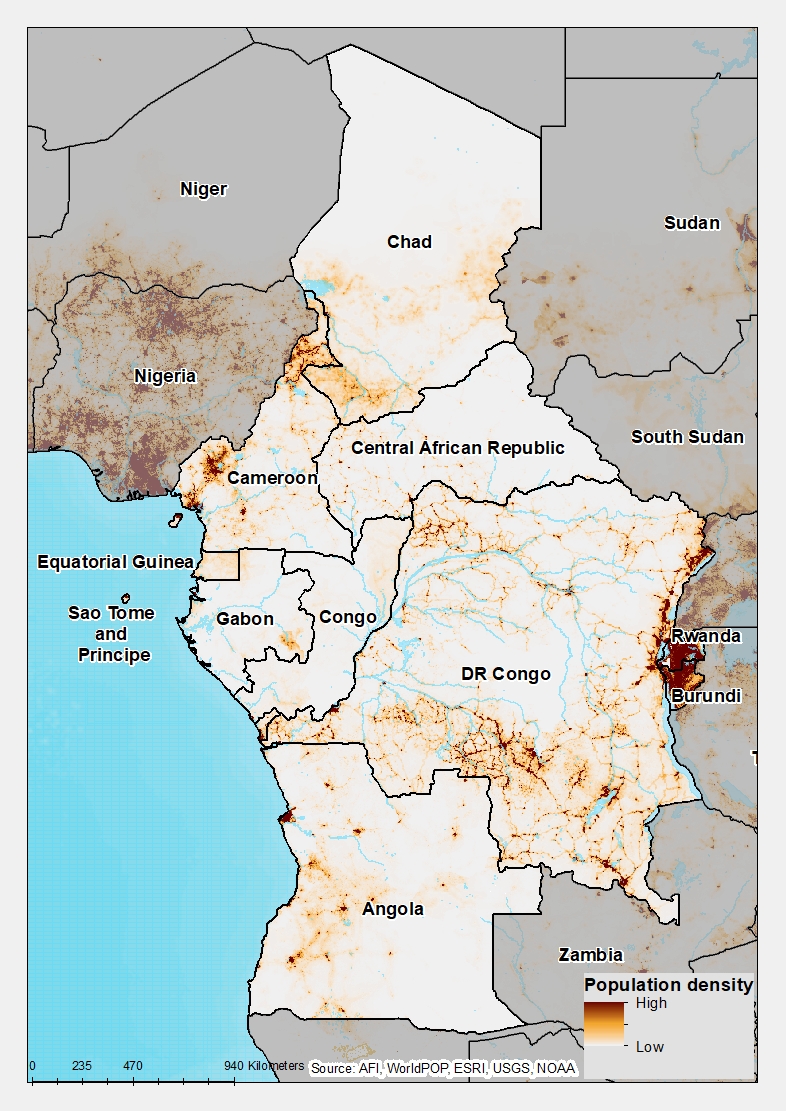
Compared to most other RECs, such as the East African Community (EAC) and the Economic Community of West African States (ECOWAS), ECCAS has relatively low average population density, but there are large differences between countries, as can be seen in Chart 4. Rwanda and Burundi are the most densely populated countries within ECCAS with more than five and four people per hectare respectively, followed by São Tomé and Príncipe which has just over two. Gabon and CAR have very low densities with less than one person per hectare. Around 2029, Rwanda will overtake Mauritius to have the most people per hectare in Africa, followed by Burundi. The two countries will, by 2043, have the highest population densities in Africa, while Gabon and CAR will remain amongst the least densely populated.
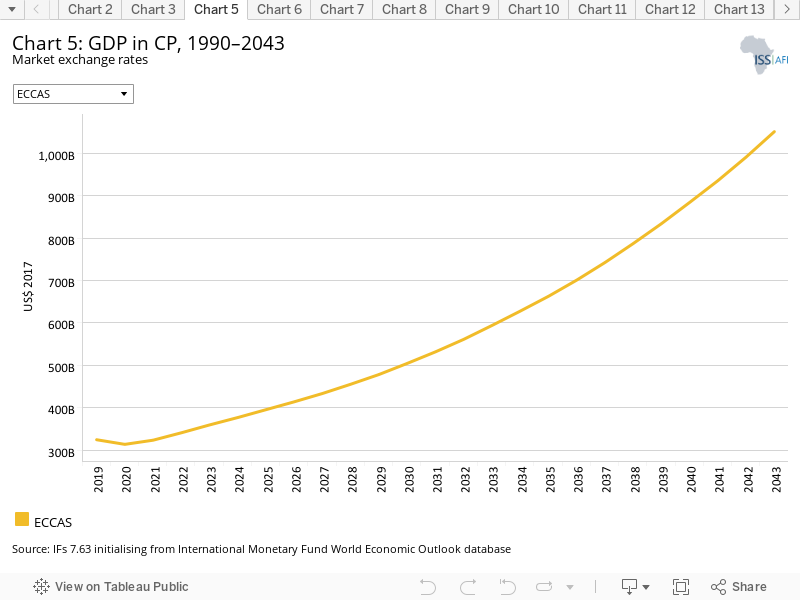
The combined GDP of ECCAS has nearly tripled from US$126.4 billion in 1990 to US$324.9 billion in 2019. It is expected to expand to US$1 050.8 billion by 2043. In 2019, ECCAS constituted 11% of Africa’s economy. By 2043 it will constitute 12%, much of that due to rapid growth in Angola and to a lesser extent in the DR Congo as population numbers in these youthful countries translate into larger economies.
The ECCAS group is dominated by Angola, constituting around 43% of the GDP of the Community, followed by the DR Congo and Cameroon at 14–15% each. The share of the DR Congo is likely to modestly increase from 14% in 2019 to 17% of ECCAS. The next group of countries, Gabon, Equatorial Guinea, Republic of the Congo and Chad, constitute around 4–6% each of the ECCAS economy. The economies of Burundi, CAR and São Tomé and Príncipe are small. Each constitutes less than 1% of the ECCAS economy.
Angola had the largest economy in ECCAS in 2019, at US$138.8 billion, followed by Cameroon (US$46.3 billion) and the DR Congo (US$44.9 billion). By 2043 the economy of Angola is set to increase to a total size of US$443.3 billion, followed by the DR Congo at US$182.8 billion and Cameroon at US$141.2 billion.
Although many of the charts in the sectoral scenarios also include GDP per capita, this overview is an essential point of departure for interpreting the general economic outlook of ECCAS.
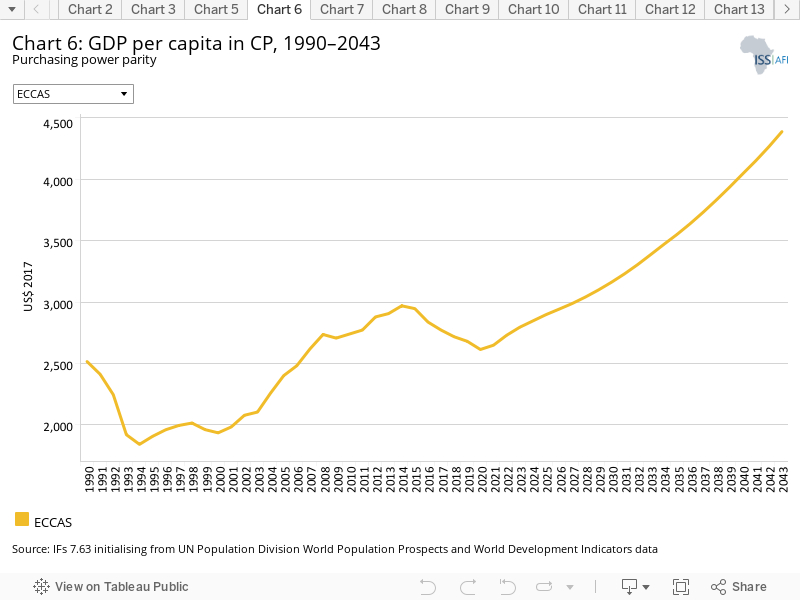
The average GDP per capita for ECCAS was only 54% that of Africa in 2019, reflecting the Community’s general poverty and low levels of development. Because of their large oil reserves and small populations, the GDP per capita for Equatorial Guinea and Gabon exceed that of other countries in the Community by a large margin, as seen in Chart 6. In 2019, the GDP per capita for Equatorial Guineas was US$20 056 and for Gabon US$17 440, compared to an average for the DR Congo, CAR and Burundi of each below US$1 000. Based on these revenues, the World Bank classifies Equatorial Guinea and Gabon as upper middle-income but the associated data for these two countries needs to be treated with care. Much of their population lives in extreme poverty with large disparities in income between a small elite and the general population.
In 2019, the GDP per capita for Angola was only a third of that of Gabon. And the average for the latter is around US$3 000 below that of Equatorial Guinea. Countries with oil and gas production all do better compared to those without. However, these countries are heavily affected by changes in the global oil price, while the associated overvaluation of their currencies makes it very difficult to diversify their economies. The GDP per capita of Equatorial Guinea has, for example, halved the past decade.
In 2019, ECCAS member state Burundi had the lowest GDP per capita in Africa followed by another member state, CAR, lower even than the estimates for Somalia. The DR Congo and Niger are the countries with the fourth and fifth lowest average GDP per capita in Africa.
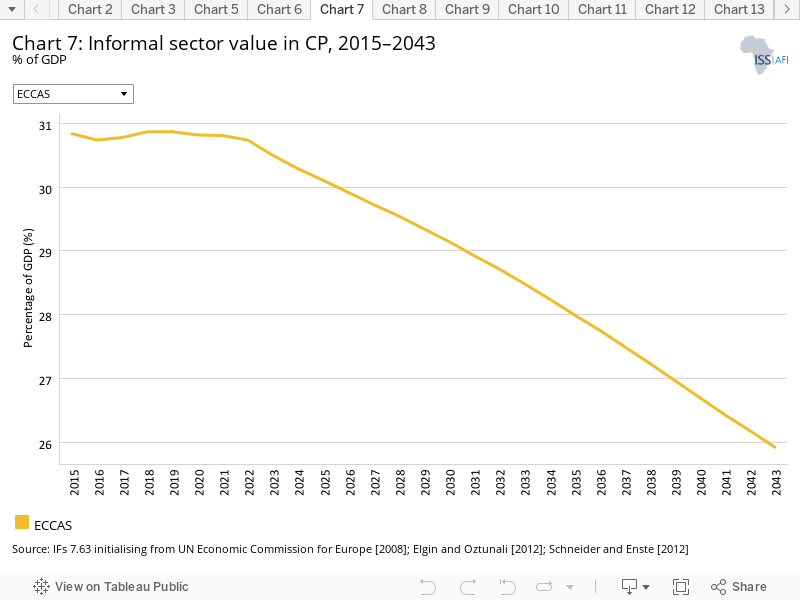
Estimates on the contribution of the informal sector to GDP in 2019 range from 42% in the DR Congo to 15% in Equatorial Guinea. By 2043 these numbers will have declined to 34% and 8% respectively (see Chart 7).
At 31% in 2019 (or US$100 billion), the ECCAS informal sector was about five percentage points of GDP larger than the average for Africa, reflecting the extent to which a very large portion of the population ekes out a survival in this sector. By 2043 the GDP share of the informal sector is forecast to modestly decline to 26%, equivalent to US$269.7 billion.
The portion of GDP generated within the informal sector is largest in the DR Congo and smallest in Equatorial Guinea, although data on the latter is likely inaccurate given the skewed income distribution. Since its economy is also the largest within ECCAS, Angola had the largest informal sector size amongst the ECCAS members with a value of US$41.7 billion in 2019. The share of informal sector contribution to GDP does not, however, equate to the relative share of the total labour force within the informal sector that IFs estimates is highest in the DR Congo followed by CAR and Burundi, reflecting the higher rates of extreme poverty in these countries.
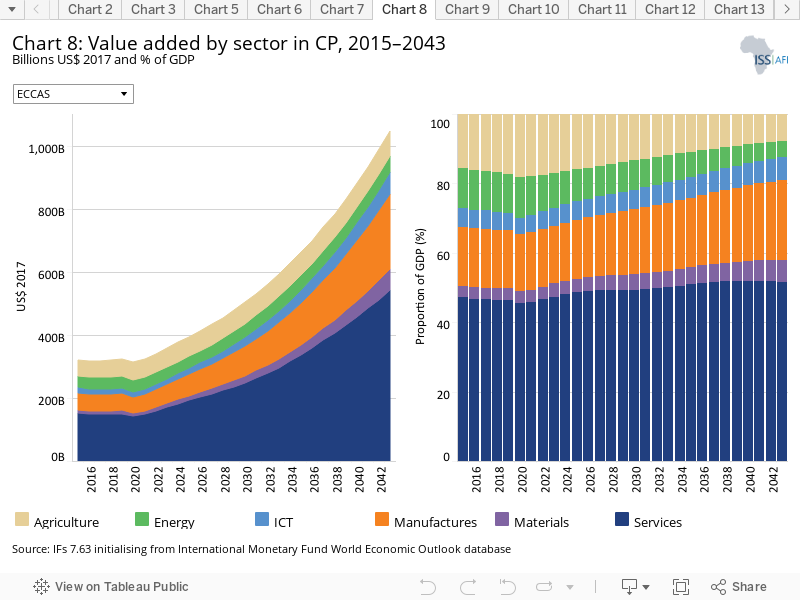
The IFs platform uses data from the Global Trade and Analysis Project (GTAP) to classify economic activity into six sectors: agriculture, energy, materials (including mining), manufactures, services and information and communications technology (ICT).
Generally, the services sector dominates within ECCAS, accounting on average for half of GDP, ranging from 71% in São Tomé and Príncipe to 31% in the DR Congo. The services sector contributes around 58% of GDP in Rwanda, and in other countries the value ranges between 40% and 51%. These are, however, generally low-end services, either as part of subsistence agriculture or low-end retail services located in informal urban areas. The general trend in Africa, and in ECCAS, is for a steady increase in the contribution that the services sector makes to the economy at the expense of other sectors, particularly agriculture, reflected in Chart 8. Despite its substantial agricultural potential, the contribution from agriculture is set to decline from 17% in 2019 to below 8% by 2043, while that from low-end manufacturing, also at 17% in 2019, will modestly increase to 23%. In 2019, agriculture contributed most to GDP in Chad (at 44% of GDP) and least in Gabon (at 6% of GDP). These numbers will decline to 28% and 4% respectively by 2043. The contribution of the energy sector, at 11% in 2019, is boosted by oil production in the Republic of the Congo (23% of GDP in 2019), Equatorial Guinea (17%), Angola (16%) and Gabon (13%) and is set to decline to an average for the Community of less than 5% of GDP by 2043. The contribution to GDP from ICT in Equatorial Guinea (at 11% in 2019) is double that of other countries in the Community.
On average, the sizes of the services and manufacturing sectors are set to increase significantly over the forecast horizon. The sizes of other sectors do not substantially increase to the same extent. For example, the agricultural sector is at US$55.7 billion in 2019 and will increase to US$80.8 billion by 2043. By 2043 the size of the services sector will, however, have increased from US$151.3 billion in 2019 to US$543 billion. The services sector will grow most rapidly in Angola, where it will increase from US$68.5 billion in 2019 to US$252.5 billion in 2043, significantly larger in size than in other ECCAS member states. Angola will also see a strong increase in the size of its manufacturing sector that will increase from US$20.2 in 2019 to US$89.9 billion in 2043. The size of the agricultural sector increases most rapidly in the DR Congo and Chad. By 2043 the agricultural sector in the DR Congo and Angola will be comparable in size and significantly larger than in other ECCAS member states. The energy sector in Angola is much larger than in other ECCAS member states, growing from US$22.1 billion in 2019 to US$29.5 billion in 2043. By comparison, the energy sector in 2019 was only US$4.1 billion in the Republic of the Congo and modestly increases to US$5.1 billion by 2043.
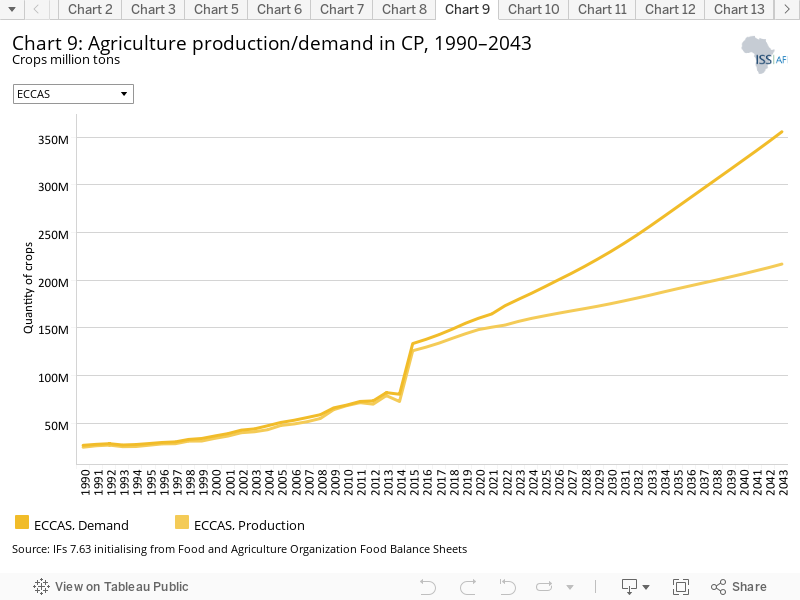
The data on agricultural production and demand in the IFs forecasting platform initialises from data provided on food balances by the Food and Agricultural Organization (FAO). IFs contains data on numerous types of agriculture but aggregates its forecast into crops, meat and fish, presented in million metric tons.
In 2019, total agricultural demand exceeded production by 11 million metric tons—a gap that is expected to increase to 139 million metric tons by 2043, as reflected in Chart 9. The ECCAS region is, therefore, becoming increasingly food insecure, not only because of poor domestic production but also because of changes in dietary preferences. The DR Congo produced the equivalent of 51.45 million metric tons of crop, meat and fish in 2019, the largest by volume amongst the ECCAS members. The DR Congo is followed by Cameroon (32.28 million tons) and Angola (27.06 million tons). São Tomé and Príncipe was the smallest agricultural producer at 134 000 tons in 2019 and is set to double its import dependence. By 2043 the DR Congo will produce 84.81 million tons and Cameroon will be the second largest agricultural producer having overtaken Angola. These three countries, the DR Congo, Cameroon and Angola produce significantly more agricultural produce than other ECCAS members. Cameroon, the only ECCAS member that exports a modest amount of agricultural goods (at US$1.516 billion in 2019), will see a decline in exports such that it will only export agriculture to the value of US$161 million in 2043.
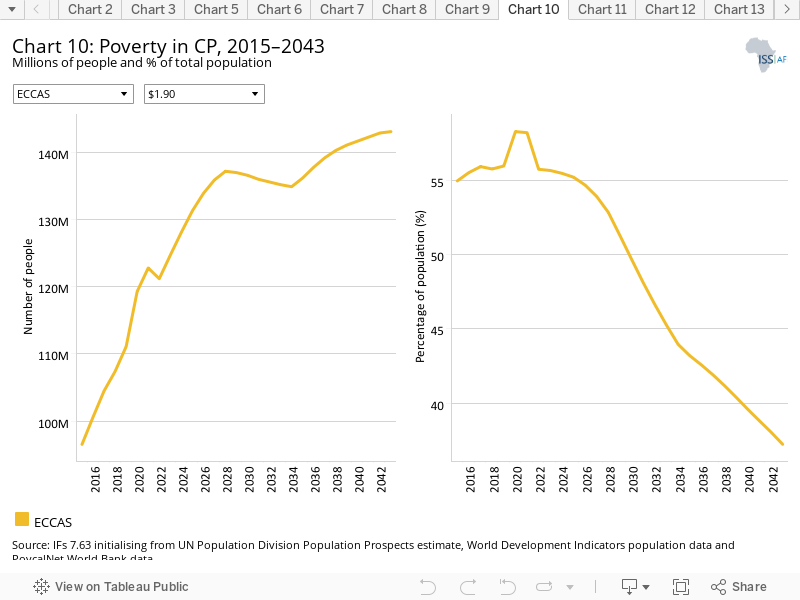
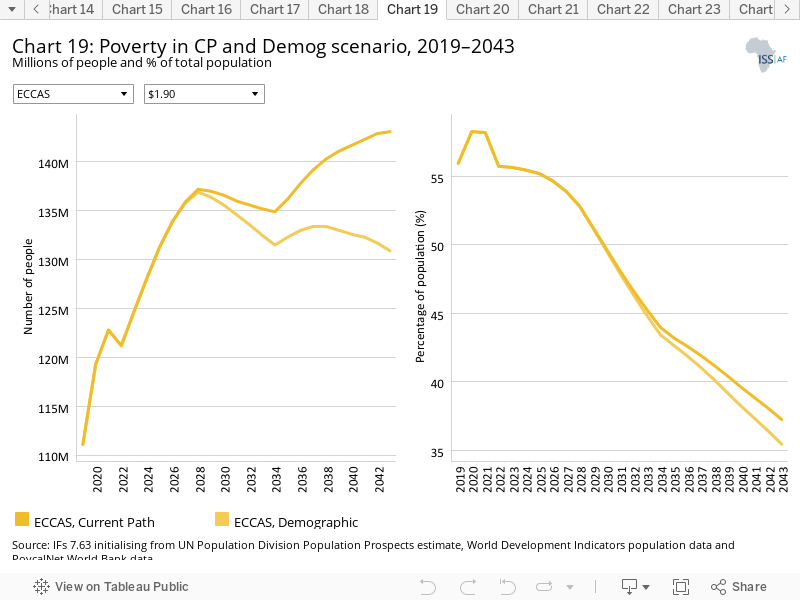
Because of its high rates of population growth and relatively slow economic growth, the number of extremely poor people (using US$1.90) in ECCAS will increase from 111.1 million in 2019 to 143.1 million in 2043, reflected in Chart 10A. Much of that is due to the increase in extremely poor people in the DR Congo, from 62.82 million in 2019 to 81.89 million in 2043. Extreme poverty in Angola will also increase from 14.64 million in 2019 to 21.27 million in 2043.
The poverty forecasts for Equatorial Guinea and Gabon are not reliable, however. Technically, the World Bank classifies these two countries as upper middle-income because of incomes generated from oil and gas, but their general development profiles are comparable to low-middle or low-income countries.
While the absolute number of extremely poor people (using US$1.90) is set to increase, the portion of extremely poor people in ECCAS will decline from 55.94% in 2019 to 37.24% in 2043. Burundi, CAR and the DR Congo have higher rates of poverty than other countries (at 76.69%, 73.91% and 72.30% in 2019). By 2043 rates of extreme poverty will be highest in CAR (68.28%), Burundi (58.4%) and the DR Congo (47.41%). Because inequality in Burundi and Gabon is lower than in other ECCAS countries, economic growth will translate into more rapid poverty reduction in these countries. Average inequality is highest in CAR, São Tomé and Príncipe and Equatorial Guinea.
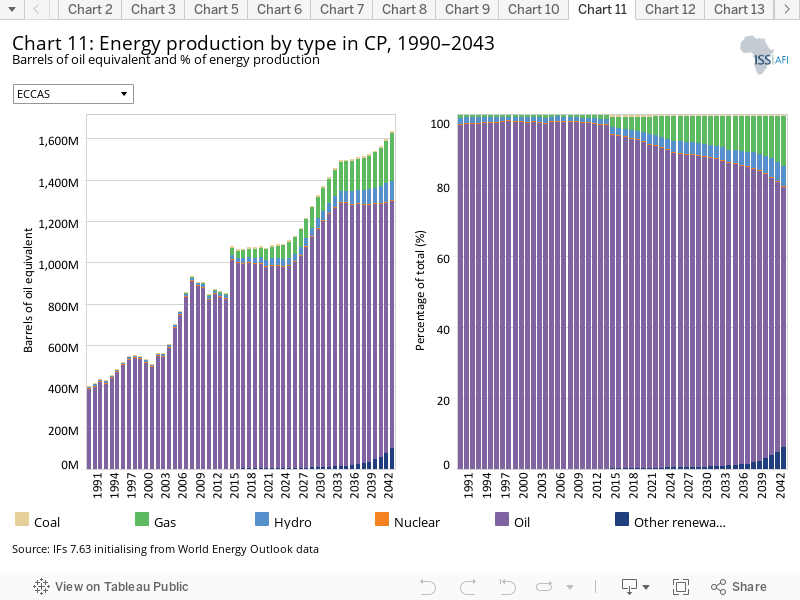
The IFs platform forecasts six types of energy, namely oil, gas, coal, hydro, nuclear and other renewables. To allow comparisons between different types of energy, the data is converted into billion barrels of oil equivalent. The energy contained in a barrel of oil is approximately 5.8 million British thermal units (MBTUs) or 1 700 kilowatt-hours (kWh) of energy.
Chart 11A shows that Angola produces significantly more energy amongst the ECCAS member states with a very high dependency on oil. The hydro production potential of the DR Congo is, however, significantly larger than in any other ECCAS member state, reflected in the ambitions of the Grand Inga scheme.
The energy forecast is for modest gas production in Cameroon to peak in 2034 and subsequently in Angola. Next to the DR Congo, Cameroon is also expected to benefit from hydropower. Angola is forecast to have most other renewables by 2043 but modestly so.
The Current Path forecast is that Angola, the Republic of the Congo, Cameroon, Gabon, Equatorial Guinea and Chad all produce modest amounts of natural gas by 2043. The DR Congo has significant potential from hydropower in the form of the Grand Inga scheme. Other countries that see an increase in hydropower over the forecast horizon are Angola and Cameroon.
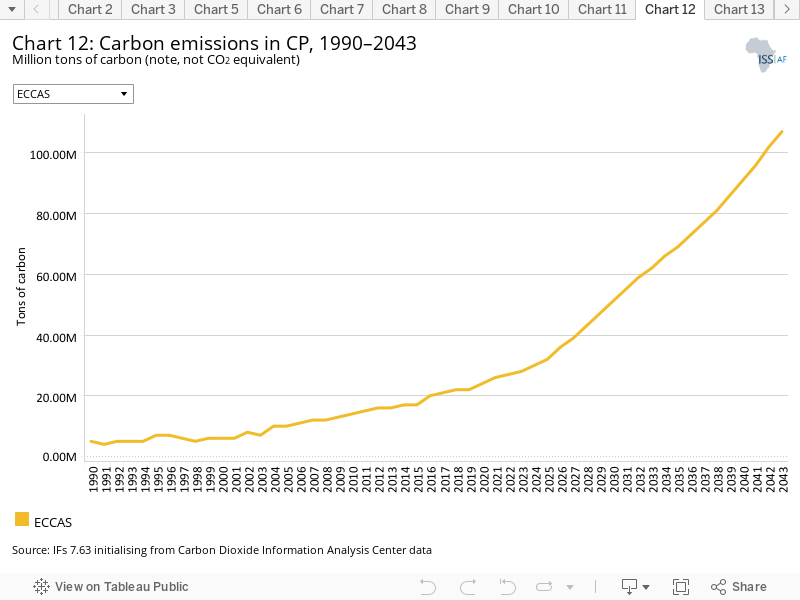
Carbon is released in many ways, but the three most important contributors to greenhouse gases are carbon dioxide (CO2), carbon monoxide (CO) and methane (CH4). Since each has a different molecular weight, IFs uses carbon. Many other sites and calculations use CO2 equivalent.
As a group, ECCAS countries emitted 22 million tons of carbon in 2019—an amount that will increase five-fold to 105 million tons by 2043 (see Chart 12). In the process, ECCAS will increase its portion of African carbon emissions from 5% of the African total to 11%. Because of the size of its economy and large oil production, Angola is the largest emitter, responsible for 53% of the Community’s carbon emissions. That portion modestly declines to 41% by 2043 as its oil reserves decline and other sectors and countries increase their carbon footprint, particularly the DR Congo and Cameroon that will increase their carbon emissions.
Sectoral Scenarios for ECCAS
Download to pdfThe Stability scenario represents reasonable but ambitious reductions in risk of regime instability and lower levels of internal conflict. Stability is generally a prerequisite for other aspects of development and this would encourage inflows of foreign direct investment (FDI) and improve business confidence. Better governance through the accountability that follows substantive democracy is modelled separately.
The intervention is explained in here in the thematic part of the website.
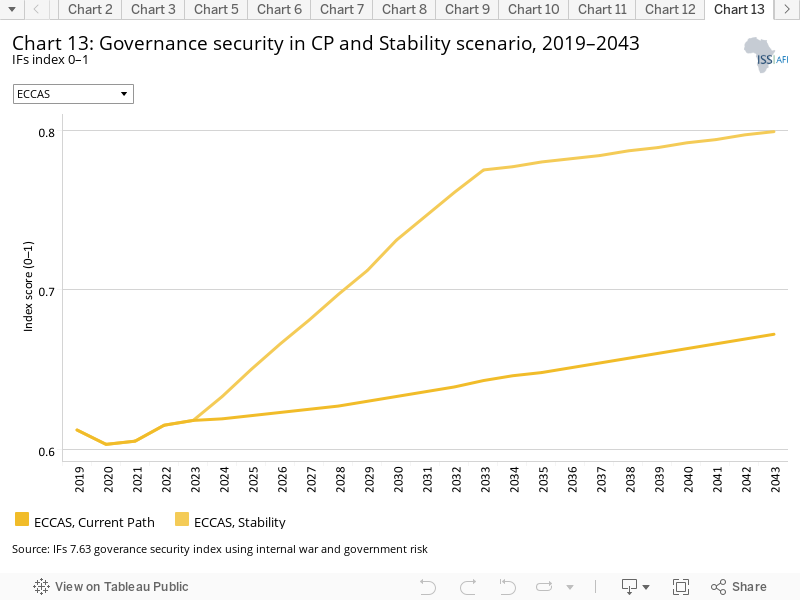
Using the governance security index within IFs, ECCAS is below the average for Africa, as can be seen in Chart 13. The ECCAS Current Path forecast is for modest improvements in stability for all member states, but the Community retains its relatively negative posture compared to the African average. The Stability scenario is for an improvement in stability by about one fifth, using the IFs governance security index. In the process, ECCAS largely closes the gap within Africa. Coming from its turbulent history, the modelled improvement is the largest in the DR Congo, followed by CAR, Burundi and Chad.
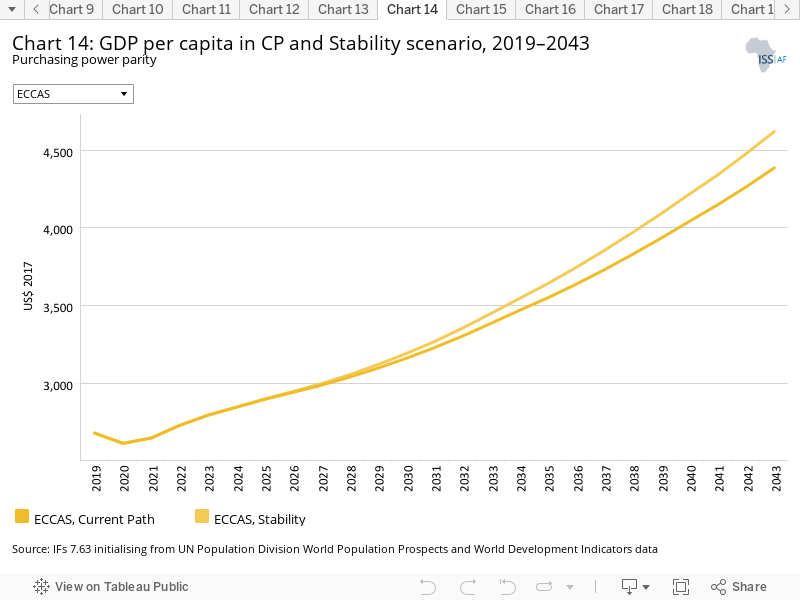
Stability is a general catalyst for other aspects of development. The Stability scenario increases GDP per capita by US$233 in 2043 compared to the Current Path forecast. The increase ranges from US$667 in Angola (the largest increase), US$483 in the Republic of the Congo and US$600 in Equatorial Guinea, to US$57 in Burundi (least improvement).
By 2030 the Stability scenario will reduce the number of extremely poor people in ECCAS by 1.3 million people and by 10.8 million in 2043, compared to the Current Path forecast (using US$1.90). The largest gains are made in the DR Congo which will see a reduction of 7.4 million extremely poor people (4.2 percentage points) in 2043, reflected in Chart 15.
Instead of an extreme poverty rate (using US$1.90) of 37.2% in 2043, the 2043 extreme poverty rate for ECCAS will be 34.5% under the Stability scenario.
This section presents the impact of a Demographic scenario that aims to hasten and increase the demographic dividend where relevant through reasonable but ambitious reductions in the communicable-disease burden for children under five, the maternal mortality ratio and increased access to modern contraception.
The intervention is explained in here in the thematic part of the website.
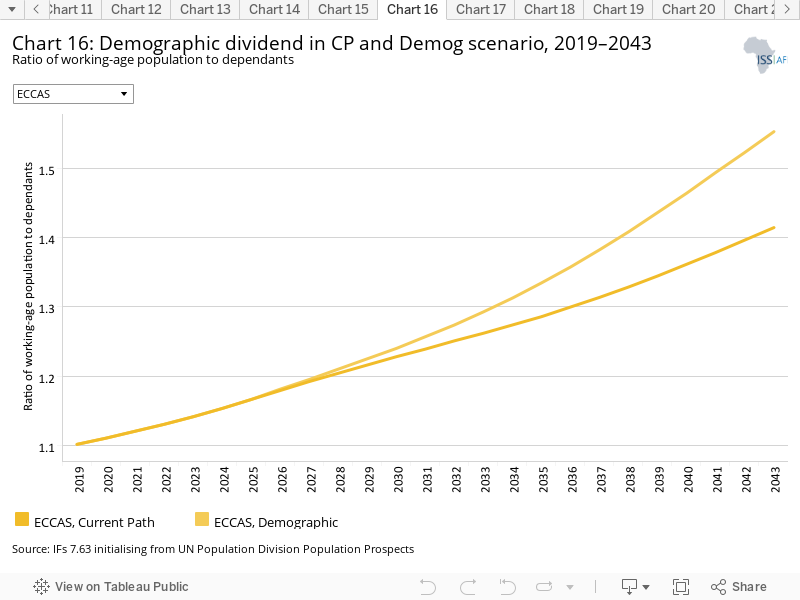
Demographers typically differentiate between a first, second and even a third demographic dividend. We focus here on the first dividend, namely the contribution of the size and quality of the labour force to incomes. It refers to a window of opportunity that opens when the ratio of the working-age population (between 15 and 64 years of age) to dependants (children and the elderly) reaches 1.7.
In 2019, the ratio of working-age persons to dependants for ECCAS was only 1.1, and in the Current Path forecast, ECCAS only enters the demographic dividend in around 2057, given the population momentum and its high fertility rates. This is several years later than the average for Africa. In the Demographic scenario, ECCAS gets to a ratio of 1.7 working-age persons to every dependant by 2043, as shown in Chart 16. Because it is already on a more positive trajectory compared to other ECCAS members, Rwanda makes significantly more progress in this scenario compared to other member states. In 2019, Rwanda had a fertility rate of 3.9 children per fertile woman, which gets to 1.9 by 2037, reaching a demographic dividend as early as 2033 under the Demographic scenario. Chad and Angola evidence the least progress.
The infant mortality rate is the number of infant deaths per 1 000 live births and is an important marker of the overall quality of the health system in a country.
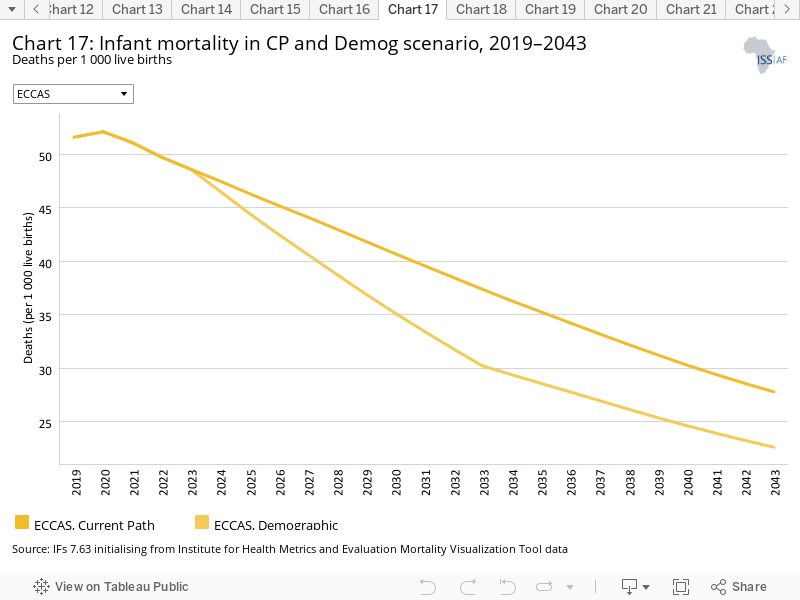
The average for the Community in 2019 is 51.6 deaths, with values varying from 81 in CAR to 23.9 in São Tomé and Príncipe. In the Current Path forecast, rates decline to 27.8 by 2043, which is below the average for Africa at 25.6. In the Demographic scenario, the ECCAS rate declines to 22.6 in 2043, with Chad experiencing the largest decrease, with 8.8 fewer deaths per 1 000 live births in 2043 compared to the Current Path forecast.
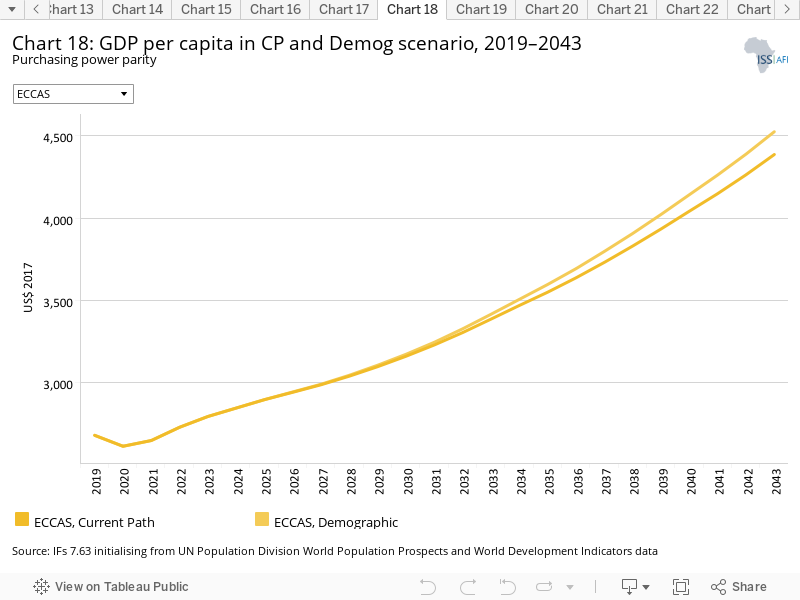
By 2043 the Demographic scenario will increase average GDP per capita by US$139 compared to the Current Path forecast. Equatorial Guinea and Gabon are forecast to benefit the most by 2043 (at US$676 and US$490 respectively, compared to the Current Path forecast) with Rwanda and the Republic of the Congo following with improvements of US$280 and US$223 respectively. Burundi and Chad benefit the least at US$44 and US$38 by 2043, compared to the Current Path forecast.
Compared to the Current Path forecast, the Demographic scenario would reduce extreme poverty in the DR Congo by 8.1 million people in 2043, compared to the Current Path forecast (using US$1.90).
Using the US$1.90 poverty line, the Demographic scenario will reduce extreme poverty in the ECCAS region by two percentage points in 2043, compared to the Current Path forecast for that year, resulting in a poverty reduction of 12.2 million people. The DR Congo will experience the largest reduction in rates of extreme poverty (almost three percentage points), followed by Rwanda and São Tomé and Príncipe.
This section presents reasonable but ambitious improvements in the Health/WaSH scenario, which include reductions in the mortality rate associated with both communicable diseases (e.g. AIDS, diarrhoea, malaria and respiratory infections) and non-communicable diseases (e.g. diabetes), as well as improvements in access to safe water and better sanitation. The acronym WaSH stands for water, sanitation and hygiene.
The intervention is explained in here in the thematic part of the website.
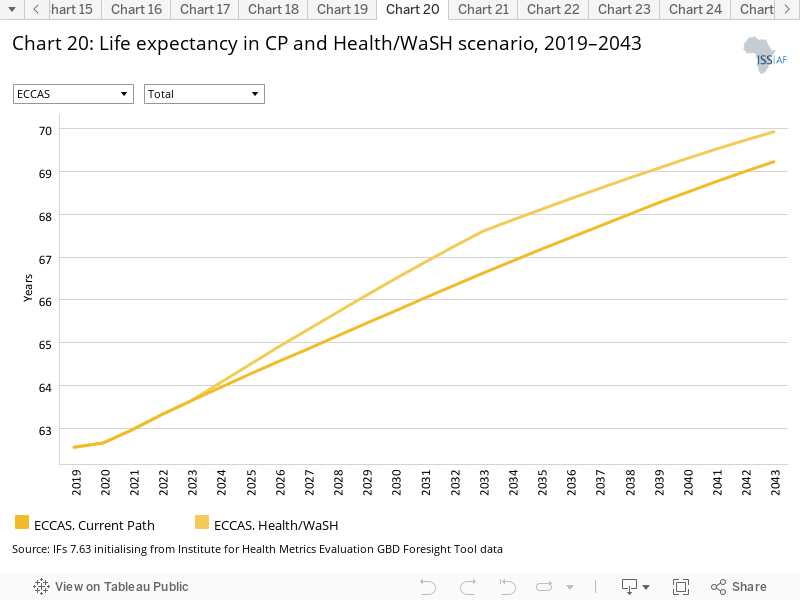
Chart 20 indicates that life expectancy amongst ECCAS member states ranged from 71.2 years in São Tomé and Príncipe in 2019 to 51.2 years in CAR. In 2019, average life expectancy in ECCAS was 62.6 years and in the Current Path forecast it will increase to 69.2 years in 2043. The Health/WaSH scenario results in a marginal life expectancy increase above the Current Path forecast. Chad, with life expectancy of 59.4 years in 2019, experiences the largest increase of one year and São Tomé and Príncipe the least (one month). Average life expectancy in ECCAS remains below the average for Africa, with 2.9 years fewer in 2043 under the Health/WaSH scenario.
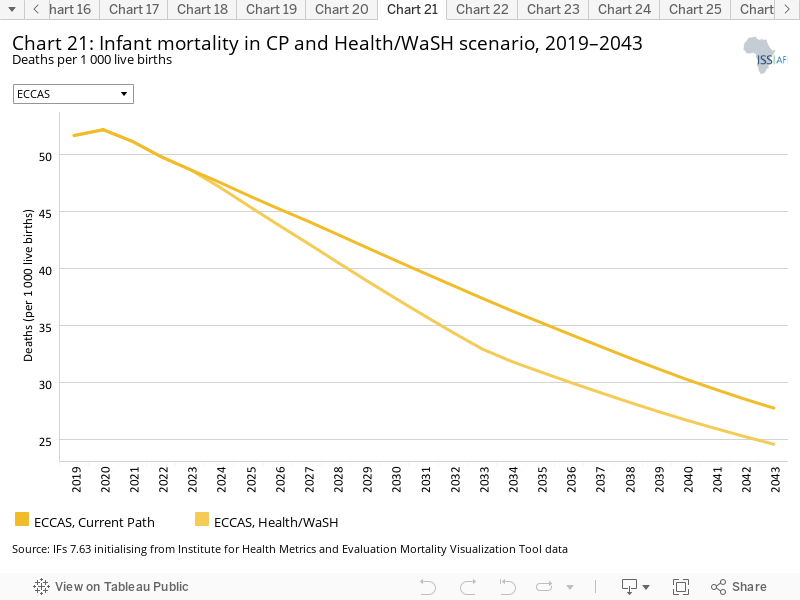
Rates of infant mortality in ECCAS in 2019 were at 51.5 deaths per 1 000 live births and would reduce to 27.8 in the Current Path forecast by 2043, shown in Chart 21. In the Health/WaSH scenario, the average by 2043 is 24.6, 3.2 deaths fewer compared to the Current Path forecast. These rates remain above the average for Africa to 2043. Chad experiences the largest decline in infant mortality in the Health/WaSH scenario: its 2043 rate is 5.3 deaths below the Current Path forecast, followed by Angola with a reduction of 4.3 deaths.
The Agriculture scenario represents reasonable but ambitious increases in yields per hectare (reflecting better management and seed and fertilizer technology); increased land under irrigation and reduced loss and waste. Where appropriate, it includes an increase in calorie consumption, reflecting the prioritisation of food self-sufficiency above food exports as a desirable policy objective.
The intervention is explained in here in the thematic part of the website.
The data on yields per hectare (in metric tons) is for crops but does not distinguish between different categories of crops.
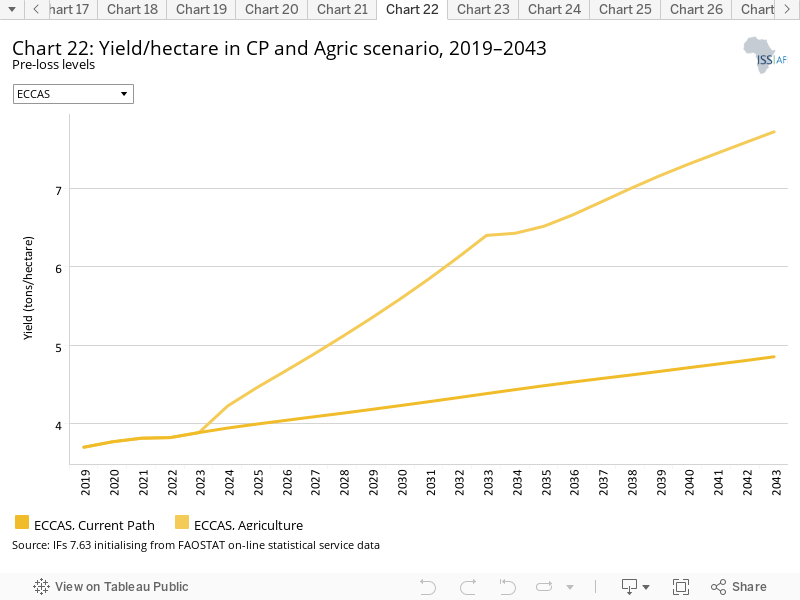
In 2019, the average crop yield in ECCAS was 3.7 metric tons, slightly below the average for Africa which is at 3.9 tons (see Chart 22). In the Current Path forecast, yields for ECCAS would improve to 4.9 tons by 2043 and to 7.7 tons in the Agriculture scenario—a difference of almost 60%. Although it is only the fourth largest agriculture producer by volume, Rwanda has the highest pre-loss crop yields per hectare amongst the ECCAS members by a large margin, reflecting its rich soils, higher rainfall, the intensity of farming and better utilisation of technology. Yields per hectare for Rwanda increase from 8.1 tons in 2019 to 10.6 tons in 2043 in the Current Path forecast and 14 tons in the Agriculture scenario. Chad and CAR have the lowest pre-loss crop yields per hectare, whereas crop yields for the latter remain below two metric tons per hectare across the forecast horizon. Burundi experiences the largest improvements (4.5 tons by 2043) in the Agriculture scenario, followed by São Tomé and Príncipe (4 tons), the DR Congo (3.9 tons) and Rwanda 3.4 tons. Equatorial Guinea gains the least with an increase below 1 ton per hectare. Because of its much larger agricultural sector, the DR Congo benefits most from the Agriculture scenario increasing its crop production by an additional 62.1 million metric tons above the Current Path forecast by 2043.
Cameroon and Angola would also increase their annual crop production, by 18.1 and 14.6 million metric tons respectively by 2043.
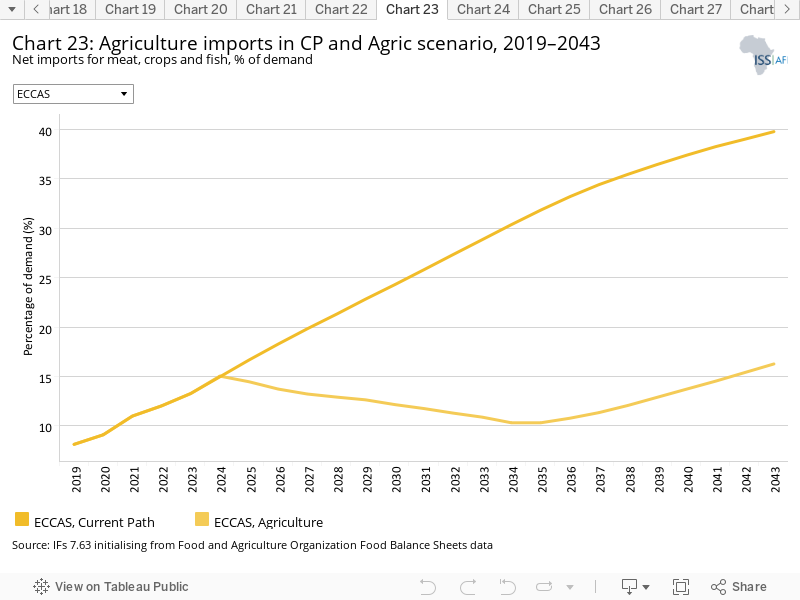
In the Current Path forecast, the contribution of agriculture to the GDP of ECCAS would decline from 17.2% in 2019 to less than half that in 2043. In the Agriculture scenario, agriculture would still contribute almost 11% to GDP by 2043, and the ECCAS region will produce 115 million metric tons more crops by 2043, compared to the Current Path forecast. The import dependence of ECCAS is set to be reduced to 15.7% of demand by 2043 instead of the Current Path forecast of 41.4%. The Community would therefore import US$62.7 billion less agricultural produce in 2043 than in the Current Path forecast (see Chart 23). Cameroon will increase the value of its agriculture exports by US$5.923 billion in 2043 compared to the Current Path forecast for that year, followed by Burundi (increase of US$298 million). Angola, CAR, Equatorial Guinea, Chad and Gabon will, however, not see any increase in agriculture exports as these countries have large deficits.
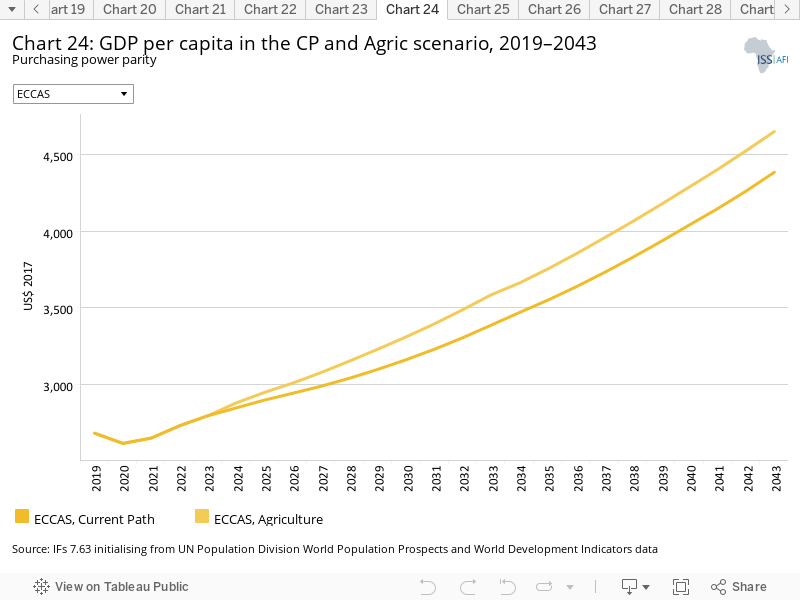
The average improvement in GDP per capita in the Agriculture scenario is US$266 in 2043, compared to the Current Path forecast for that year. Chad will benefit the most: its GDP per capita in 2043 will be US$511 larger than in the Current Path forecast for that year, followed by Angola and Rwanda. São Tomé and Príncipe and Equatorial Guinea (US$98) will benefit the least.
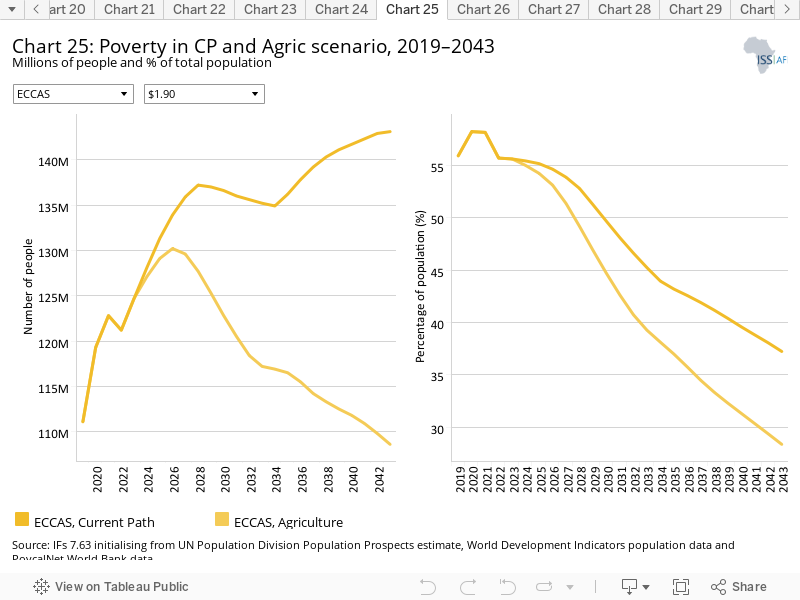
Agriculture traditionally has significant leverage on rates of extreme poverty. Whereas ECCAS would still have 143.1 million people living below US$1.90 in the Current Path in 2043, in the Agriculture scenario the number comes down to 108.6 million (Chart 25), most of which is attributable to the DR Congo. The number of extremely poor people in the DR Congo will decline by 10.3 million people in 2030, compared to the Current Path forecast, and 25.9 million in 2043.
Whereas, in 2019, the per cent of people living below US$1.90 per day in ECCAS was 55.9%, there would be a decline to 37.2% by 2043 in the Current Path forecast. The impact of the Agriculture scenario is such that it reduces that rate by almost 10 percentage points to 28.4%. Extreme poverty in the DR Congo will have declined by 14.8 percentage points by 2043, compared to the Current Path forecast for that year, and by 10.5 percentage points in Burundi.
The Education scenario represents reasonable but ambitious improved intake, transition and graduation rates from primary to tertiary levels and better quality of education. It also models substantive progress towards gender parity at all levels, additional vocational training at secondary school level and increases in the share of science and engineering graduates.
The intervention is explained in here in the thematic part of the website.
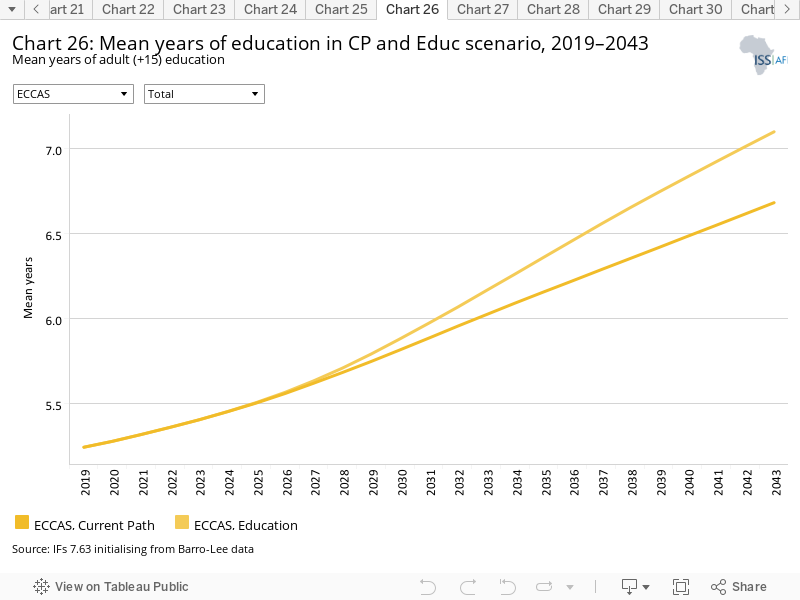
Education is foundational to development but improvements in education take a long time to impact. In 2019, the adult population of ECCAS had, on average, 5.2 years of education, set to increase to 6.7 years in 2043. Levels of education are low, even when compared to the averages for Africa. In the Education scenario, the mean years of education of ECCAS would increase to 7.1 years, as seen in Chart 26. Whereas the mean years of male education was 6.1 years in 2019, that for females was only at 4.2 years, a gap of 1.6 years. In the Education scenario, the gap in mean years of male and female education is forecast to modestly decline to 1.1 years by 2043, as gender inequality improves. Chad will experience the largest increase in education years (an improvement of half a year by 2043 compared to the Current Path forecast for that year) and São Tomé and Príncipe the least (at 0.2 years or less than three months).
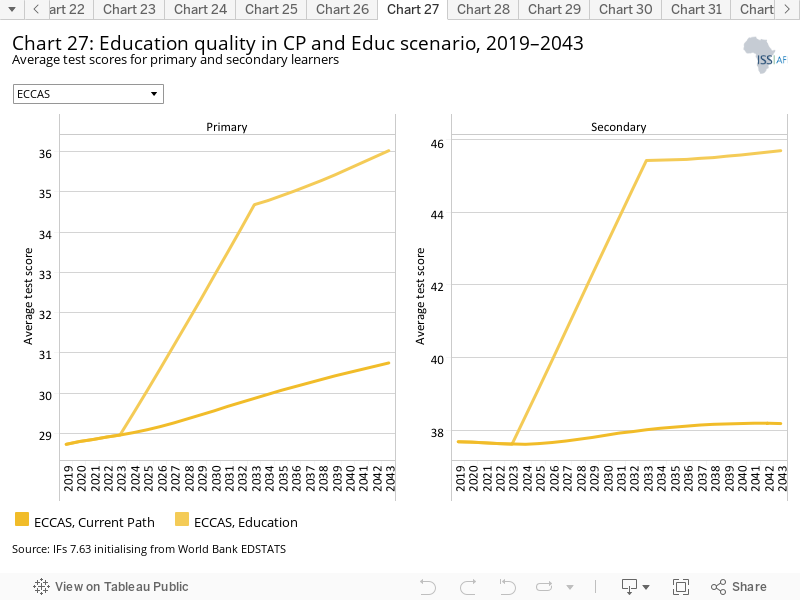
Education quality is, in many senses, more important than the quantity of education provided and it is therefore concerning that a number of ECCAS countries are forecast to experience declines in primary (Chart 27A) and secondary education quality (Chart 27B) in the Current Path forecast. These include Cameroon and Equatorial Guinea, which have the highest primary education quality amongst ECCAS countries. Other countries where scores are forecast to decline are Angola and Chad, which also has the lowest average test scores for primary learners in Africa.
The average test scores for secondary learners for ECCAS is below those for Africa and, in some instances such as Chad, the forecast is for quality to decline from already low levels given low levels of investment and rapid population growth.
The reason for poor progress and some regression is that spending on education in the Current Path is forecast to increase very modestly except in CAR and the Republic of the Congo that see more robust improvements.
The impact of the Education scenario is to improve the primary school education quality of ECCAS countries by 17% above the Current Path forecast for 2043. The quality of primary school education in all ECCAS countries improves in the Education scenario.
In the Current Path forecast, secondary school education also declines in Equatorial Guinea, Gabon, Cameroon and Angola. By 2043 secondary school quality levels of Chad will be the lowest in Africa in the Current Path forecast as well as in the Education scenario. The impact of the Education scenario is to improve the average quality of secondary school education of ECCAS countries by 20% above the Current Path forecast for 2043. The quality of secondary school education in all ECCAS countries improves in the Education scenario.
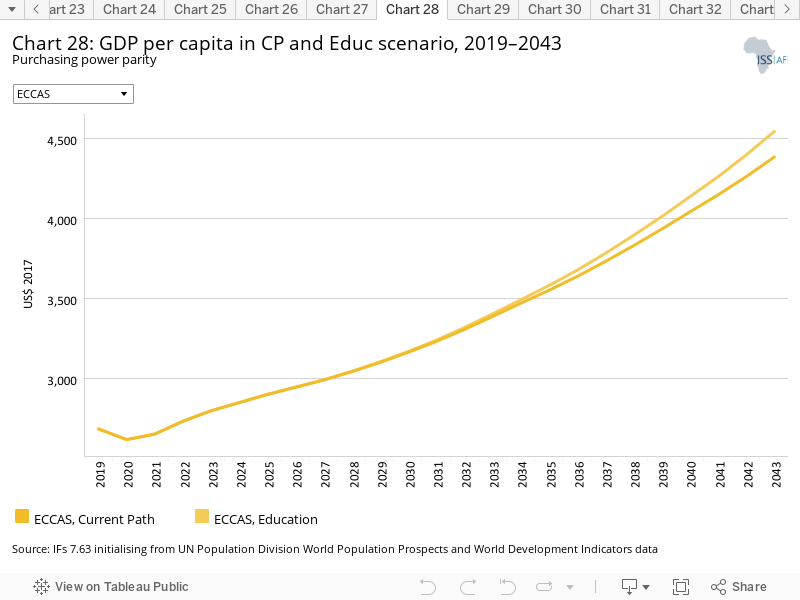
The impact of the Education scenario on GDP per capita is an average improvement for ECCAS of US$160 in the Current Path forecast to US$4 550 in 2043 (see Chart 28). The impact is the largest in Equatorial Guinea and Gabon (US$763 and US$479 respectively by 2043, compared to the Current Path forecast for that year), both nominally classified as upper middle-income countries by the World Bank. The impact is lowest in Burundi—only US$37 above the Current Path forecast for 2043.
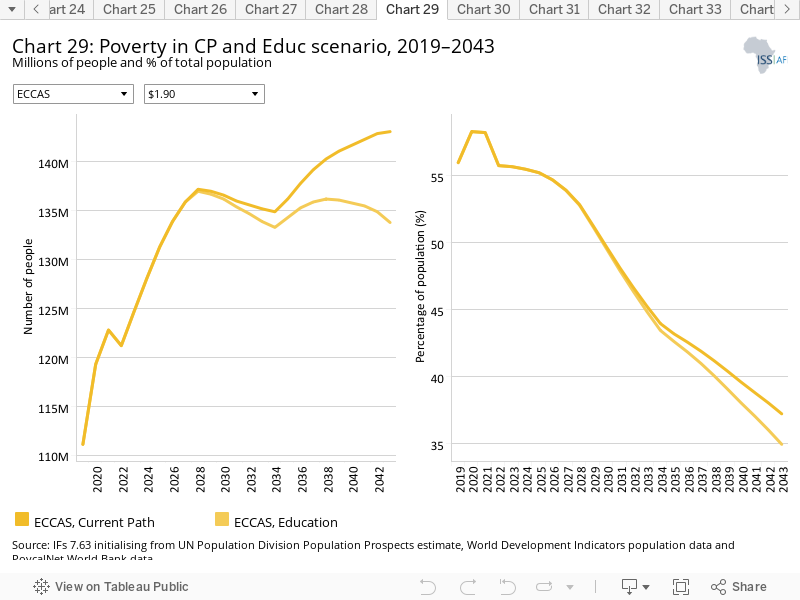
Instead of 143.1 million people living in extreme poverty (using US$1.90) by 2043, the Education scenario will reduce the number of extremely poor people to 133.8 million, i.e. from 55.9% of the population in 2019 to 49.5% by 2030 and 35% by 2043 (see Chart 29). The largest reduction occurs in the DR Congo that will have 5.6 million fewer people living in extreme poverty in 2043 compared to the Current Path forecast for that year.
In the Education scenario, extreme poverty would be 2.3 percentage points lower by 2043 compared to the Current Path forecast for that year. Viewed as a percentage point reduction in rates of extreme poverty from the Current Path forecast, Equatorial Guinea would experience the lowest decline and the DR Congo the largest decline (by more than three percentage points).
The Manufacturing/Transfers scenario represents reasonable but ambitious manufacturing growth through greater investment in the economy, investments in research and development, and promotion of the export of manufactured goods. It is accompanied by an increase in welfare transfers (social grants) to moderate the initial increases in inequality that are typically associated with a manufacturing transition. To this end, the scenario improves tax administration and increases government revenues.
The intervention is explained in here in the thematic part of the website.
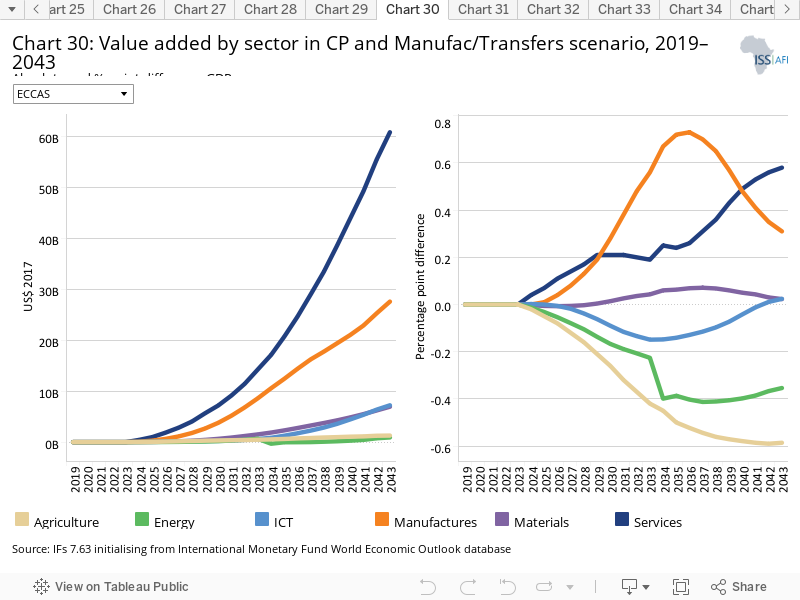
Chart 31 should be read with Chart 8 that presents a stacked area graph on the contribution to GDP and size, in billion US$, of the Current Path economy for each of the sectors.
Because of its forward and backward linkages to other sectors, the manufacturing sector is unique in its contribution to productivity improvements in most economies. In 2019, the services sector represented 46.3% of GDP in ECCAS, agriculture 17.2%, manufacturing 16.9%, energy 11.2%, ICT 5% and materials 3.5%. By 2043 the percentage contributions to GDP in the Current Path forecast are agriculture 7.7%, manufactures 22.9%, energy 4.8%, ICT 6.6% and materials 6.4%. Chart 30A shows the difference in the contribution to GDP when comparing the size in the Manufacturing/Transfers scenario and in the Current Path forecast. The increased contribution from manufacturing peaks by 0.7 percentage points above the Current Path forecast by 2036 before modestly declining. Services also increase in relative contribution to GDP while the contribution from ICT, energy and agriculture generally decline. The shifts differ between countries; for example, in Chad the contribution to GDP from energy remains largely unchanged while that in the Republic of the Congo declines significantly. The contribution of materials in the latter doubles from more than 10% in 2019. Coming from a very low base, Chad gains the largest percentage point increase in the size of its manufacturing sector, followed by Cameroon and the Republic of the Congo. Burundi gains the least. Services increase most in the DR Congo and Burundi while modestly declining in contribution to GDP in Rwanda and Cameroon.
All sectors increase in absolute size in the Manufacturing/Transfers scenario compared to the Current Path forecast, reflected in Chart 30B. The services sector is, by 2043, US$55.79 billion larger than the Current Path forecast for that year, followed by the Manufacturing sector which is US$25.31 billion large; ICT is US$6.633 larger. The increases in size for the agriculture and energy sectors are nominal. There are large country to country differences, and it is important to bear in mind that Angola is the largest economy and is set to grow more rapidly than other ECCAS countries. For example, the increase in the size of the agricultural sector in Angola by 2043 is significantly larger than in any other country when compared to the Current Path forecast for that year, equivalent to US$560 million, followed by the DR Congo at US$417 million. Angola also experiences the largest increase in the absolute size of its energy sector (US$568 million) as well as in the manufacturing sector (US$12.45 billion), followed by the DR Congo with an increase of US$5.731 billion and Cameroon with US$4.853 billion. The materials sector in the DR Congo is, in 2043, US$3.823 billion larger than in the Current Path forecast for that year, and that of Angola US$1.506 billion larger. Angola also sees the largest increase in the size of the services sector at US$30.85 billion, followed, at some distance, by the DR Congo at US$8.81 billion. The forecast is similar in the ICT sector, with a 2043 forecast increase of US$3.64 billion above the Current Path forecast for that year for Angola and US$1.31 billion in the DR Congo.
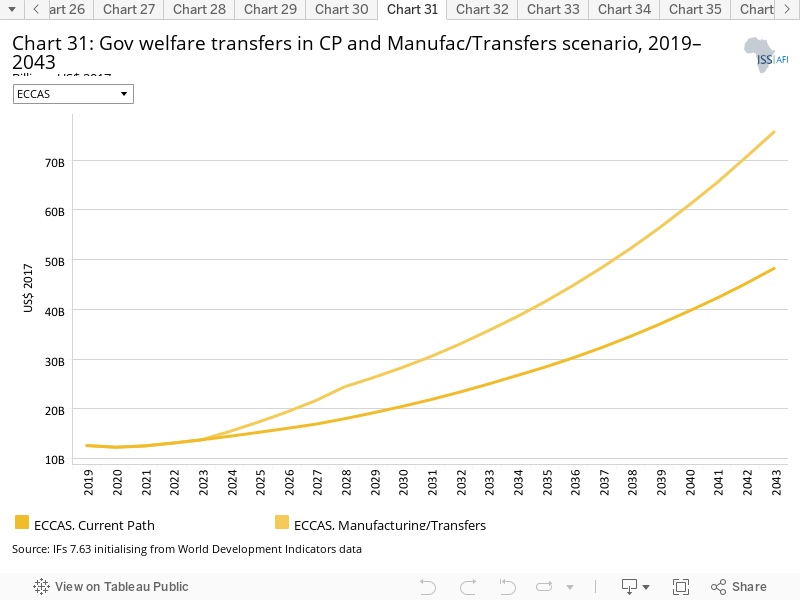
Chart 31 presents the efforts to use welfare transfers to unskilled workers to offset the increase in poverty/inequality that is often associated with investments in manufacturing. Whereas ECCAS member states transferred US$12.7 billion in welfare transfers in 2019, the 2043 amount in the Manufacturing/Transfers scenario, at US$75.7 billion, is US$27.4 billion more than in the Current Path forecast. Without these transfers, extreme poverty would be significantly higher.
Because its economy is so much larger, the majority of ECCAS’ transfers are in Angola, followed by the DR Congo. In 2043, Angola transfers an additional US$11.7 billion and the DR Congo an additional US$6.7 billion.
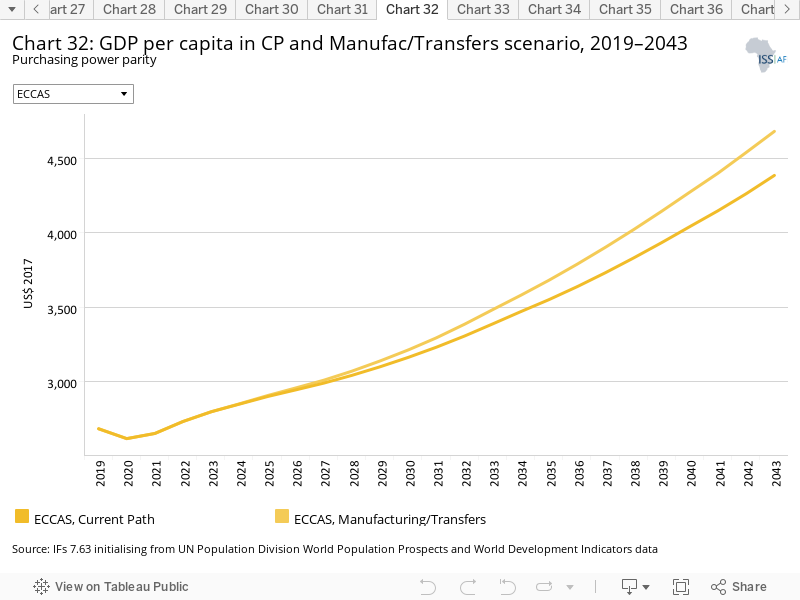
Instead of a 2043 GDP per capita of US$4 386 in 2043, ECCAS could have a GDP per capita of US$4 683 in the Manufacturing/Transfers scenario. In dollar values, the scenario has the most positive impact on Angola where GDP per capita in 2043 is US$740 higher than the Current Path forecast for that year, followed by Gabon (US$654) and the Republic of the Congo (US$647). Chad (US$141), CAR (US$91) and Burundi (US$71) benefit the least. The forecasts are displayed in Chart 32.
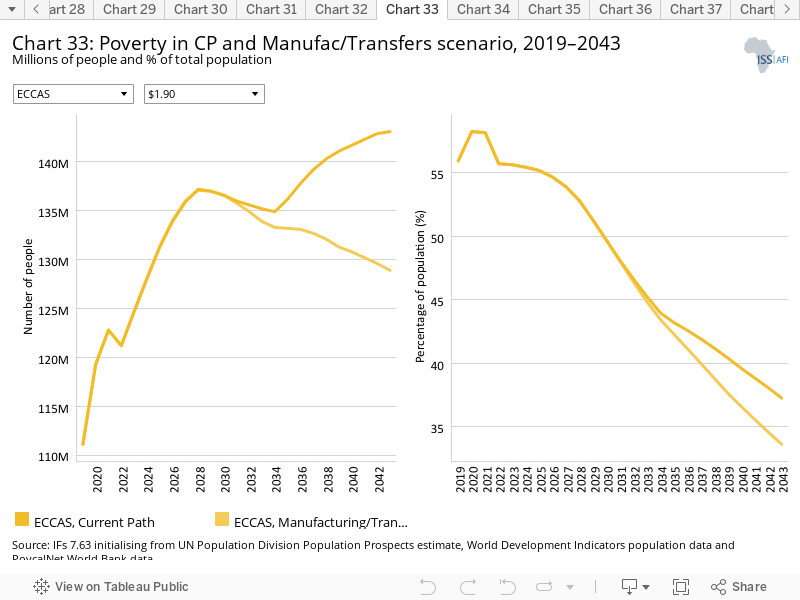
In the Manufacturing/Transfers scenario, ECCAS would have 128.9 million extremely poor people in 2043 (using US$1.90) instead of 143.1 million, a difference of 14.2 million people. Given its large population, most of that decline (9 million people in 2043) is in the DR Congo, followed by Angola (2.1 million less in 2043), seen in Chart 33.
In the Manufacturing/Transfers scenario, ECCAS would have 34% extremely poor people (using US$1.90) in 2043 instead of 37.2% in the Current Path forecast. Given its large population, most of that decline (5.2 percentage points) is in the DR Congo where poverty reduces to 42.3%, followed by Rwanda (4.7 percentage points decline) and São Tomé and Príncipe (3.5 percentage point decline).
The Leapfrogging scenario represents a reasonable but ambitious adoption of and investment in renewable energy technologies, resulting in better access to electricity in urban and rural areas. The scenario includes accelerated access to mobile and fixed broadband and the adoption of modern technology that improves government efficiency and allows for the more rapid formalisation of the informal sector.
The intervention is explained in here in the thematic part of the website.
Fixed broadband includes cable modem Internet connections, DSL Internet connections of at least 256 KB/s, fibre and other fixed broadband technology connections (such as satellite broadband Internet, ethernet local area networks, fixed-wireless access, wireless local area networks, WiMAX, etc.).
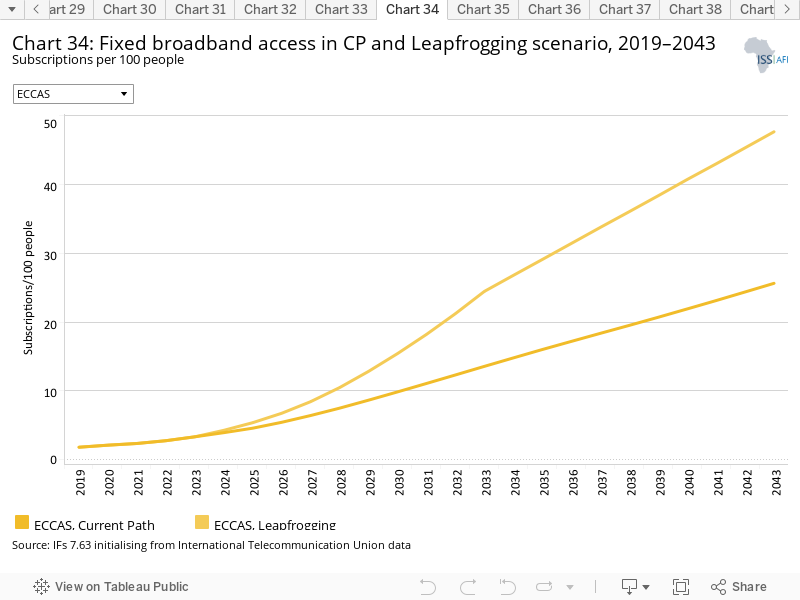
Internet access in Africa is expanding rapidly although the expansion in ECCAS trails behind the averages for Africa. In 2019, fixed broadband access per 100 people in ECCAS was at 1.8 and, in the Current Path forecast, is set to increase to 25.7 by 2043. In the Leapfrogging scenario, that rate almost doubles to 47.7 with large country to country variations, reflected in Chart 34. The most rapid growth occurs in the DR Congo (additional 39.7 million subscribers in 2043 compared to the Current Path forecast for that year) followed by Angola (additional 17.4 million subscriptions).
Mobile broadband refers to wireless internet access delivered through cellular towers to computers and other digital devices.
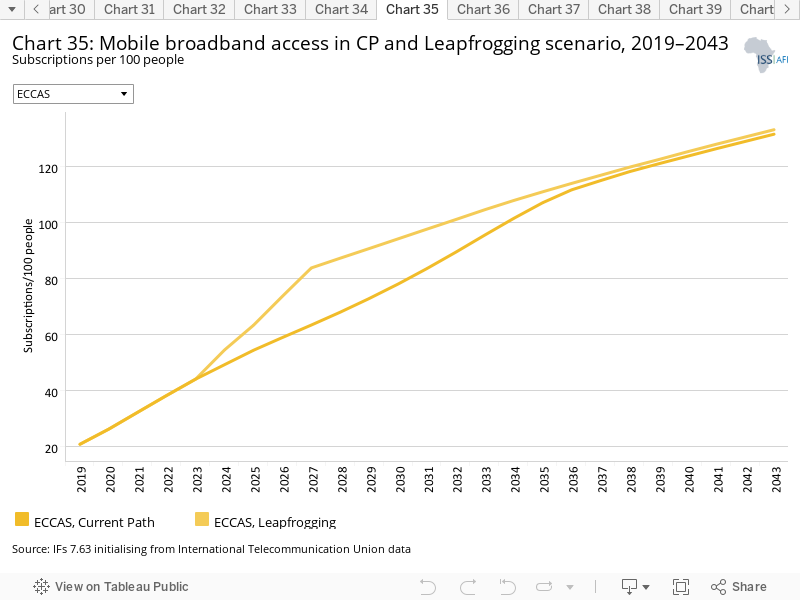
Even more rapid than increased subscriptions to fixed broadband is the improved access to mobile broadband, which may be reaching saturation levels. In 2019, 20.6 out of every hundred persons in ECCAS had mobile broadband. In the Current Path forecast, that ratio will increase to more than 100 by 2034 and in the Leapfrogging scenario (Chart 35) it will get to hundred before 2032. Within IFs, broadband saturation is set at 150 subscriptions per hundred people. The Leapfrogging scenario accelerates the already aggressive forecasts on mobile broadband access within IFs. Gabon, the ECCAS member state that has significantly more mobile broadband per 100 people than any other member, gets to 150 by 2025 in the Leapfrogging scenario instead of by 2042 in the Current Path forecast. São Tomé and Príncipe get there two years earlier, in 2042, similar to the Republic of the Congo, which is a year or so behind Rwanda. Other countries that get close to 150 subscriptions per 100 people in the Leapfrogging scenario by 2043 are Burundi and Cameroon.
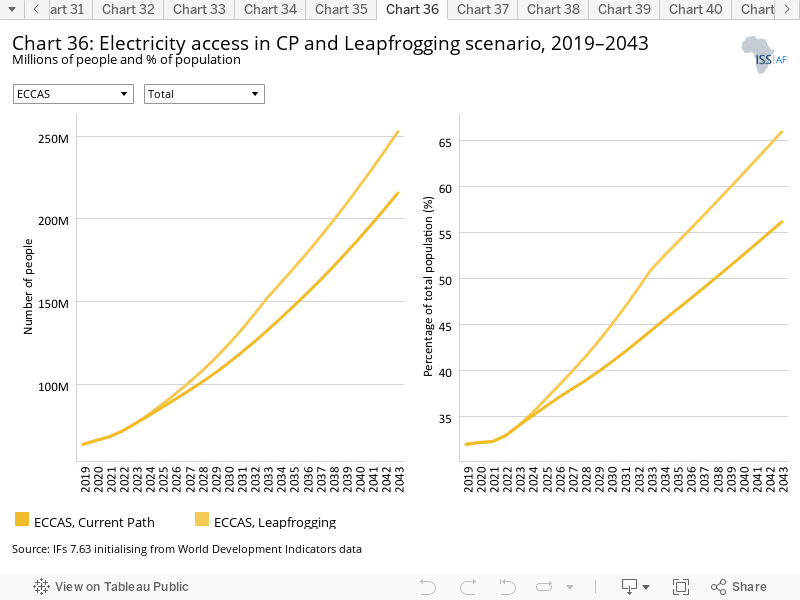
In 2019, 63.5 million of the ECCAS population had access to electricity. In the Current Path forecast that number will increase to 112.3 million people by 2030 and 215.7 million by 2043. In the Leapfrogging scenario, 11 million more people will have access in 2030 and 37.1 million more in 2043. These numbers and trends are shown in Chart 36.
The SDG target for 2030 (Indicator 7.1.1) is 98% electricity access. No ECCAS country is on target to meet this goal in the Current Path forecast. Gabon however reaches 92% access in the Current Path forecast and 95.9% in the Leapfrogging scenario by 2030. Gabon reaches the SDG target in 2041 in the Leapfrogging scenario. In 2019, the ECCAS average was 32%, forecast to increase to 40.8% in 2030 and 56.1% by 2043 in the Current Path forecast. In the Leapfrogging scenario, the average for the Community improves to 44.8% in 2030 and 65.9% by 2043. Rwanda has the largest improvement at 20.3 percentage points above the Current Path forecast by 2043—double the improvements in the next best country, the DR Congo. The Leapfrogging scenario yields the least impact in 2043 for CAR with improvement at 4.6 percentage points above the Current Path forecast.
The average urban electrification rate in ECCAS was 58% in 2019 and is forecast to improve to 64.7% in 2030 and 77.2% in the Current Path forecast. In the Leapfrogging scenario, urban electricity access improves to 84.4% in 2043. The DR Congo is forecast to improve most at 9.6 percentage points in 2043 and the neighbouring Republic of the Congo the least with improvement at only 3.2 percentage points. In 2019, average rates of electricity access in ECCAS were more than 20 percentage points below the African average—a gap that has been unchanged for several decades. In the Leapfrogging scenario, rural electricity access improves from 8.6% in 2019 to 20.1% in 2030 (compared to 15.7% in the Current Path forecast) and to 44.5% in 2043 (compared to 31.1% in the Current Path forecast). Rural electricity rates in Rwanda are forecast to improve the most at 24 percentage point improvement by 2043, followed by São Tomé and Príncipe at 21.7 percentage points. Burundi has the second poorest improvement at 9.2 percentage points, more than double CAR, which improves by a mere 4.7 percentage points.
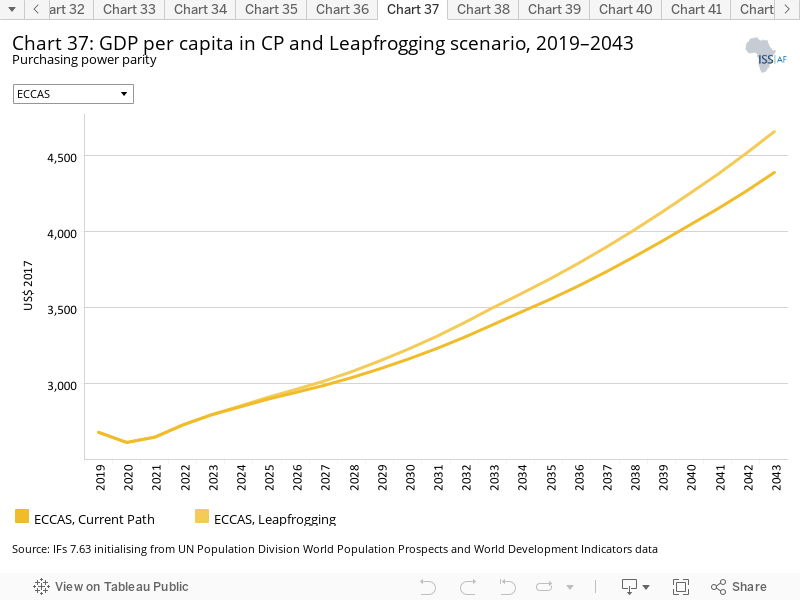
In 2019, GDP per capita was at US$2 680 and is forecast to increase to US$4 386 by 2043 in the Current Path. In the Leapfrogging scenario, (Chart 37) GDP per capita will increase by US$268 to US$4 654 in 2043, compared to the Current Path forecast. Compared to the Current Path forecast, the largest increase is forecast for the Republic of the Congo at US$519, followed by Gabon (US$491), Angola (US$481) and Equatorial Guinea (US$480). The countries with the least improvement are Chad, CAR and Burundi (at US$119).
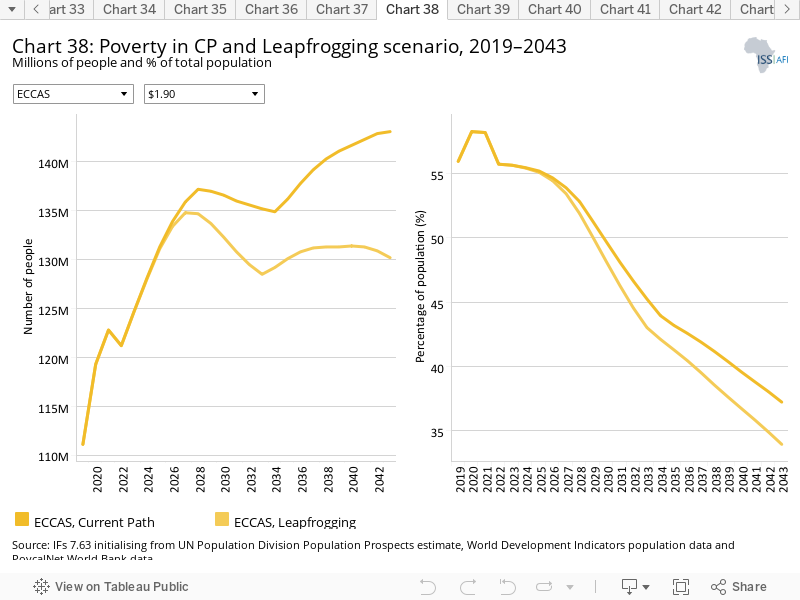
In the Leapfrogging scenario (Chart 38), the DR Congo will experience the largest decline in the number of extremely poor people (using US$1.90) amongst the ECCAS member states by 2043, compared to the Current Path forecast. Instead of 81.9 million extremely poor people in 2043, the DR Congo will have 72.7 million, a difference of 9.2 million people; in 2030, the difference will be 3.3 million people. Angola, the country that will experience the second highest impact, will only reduce poverty by 1.2 million people in 2043, compared to the Current Path forecast for that year. Whereas ECCAS was forecast to have 143.1 million extremely poor people in 2043, that number would only be 130.2 million in the Leapfrogging scenario.
In 2019, 55.9% of the population of ECCAS were living below US$1.90 per person per day, a number that will decline to 49.7% in 2030 and 37.2% in 2043. In the Leapfrogging scenario, the rate would be 48.1% in 2030 and 34% in 2043. The DR Congo will experience the largest decline at 5.2 percentage points in 2043, compared to the Current Path forecast for that year, followed by CAR at three percentage points and Rwanda at 2.8.
The Free Trade scenario represents the impact of the full implementation of the African Continental Free Trade Area (AfCFTA) by 2034 through increases in exports, improved productivity and increased trade and economic freedom.
The intervention is explained in here in the thematic part of the website.
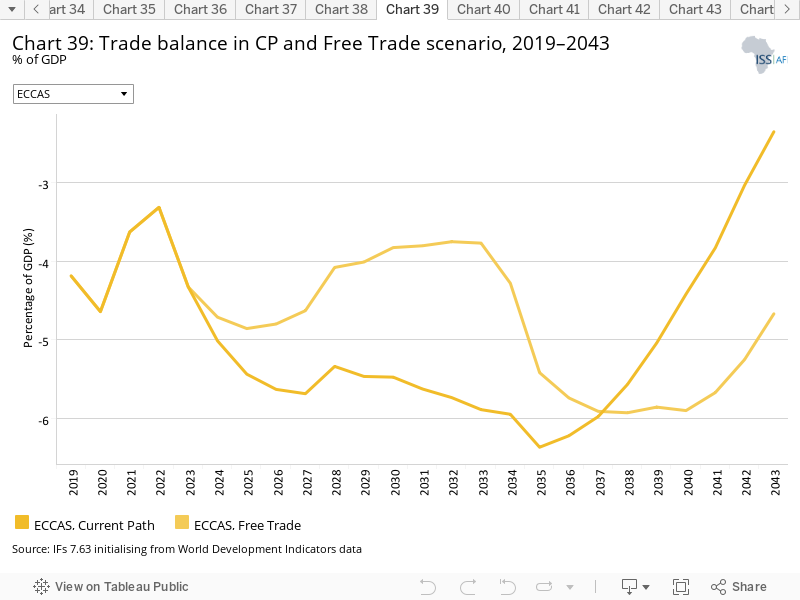
In 2019, ECCAS had a negative trade balance of -4.2% of GDP, expected to deteriorate to -6.4% by 2035 before improving. The impact of the Free Trade scenario is to reduce this negative trade balance until around 2037. By 2043 the ECCAS group would be exporting to the value of US$562.9 billion instead of US$385 billion in the Current Path forecast and importing US$622.8 billion instead of US$411.1 billion. The impact is shown in Chart 39. Compared to the Current Path forecast, all ECCAS countries increase their imports measured as a per cent of GDP (the DR Congo has the largest increase), except for Burundi, which sees a US$218-million decline in agricultural imports. In the Free Trade scenario, Burundi remains dependent upon 40% of demand from imports but gains more in GDP per capita terms than all other ECCAS members in this scenario compared to its gains from other scenarios. All ECCAS countries also increase the value of their exports. Burundi experiences the largest increase in exports as a per cent of GDP (an increase of 26.5 percentage points of GDP) and its imports decline by -7.9 percentage points of GDP.
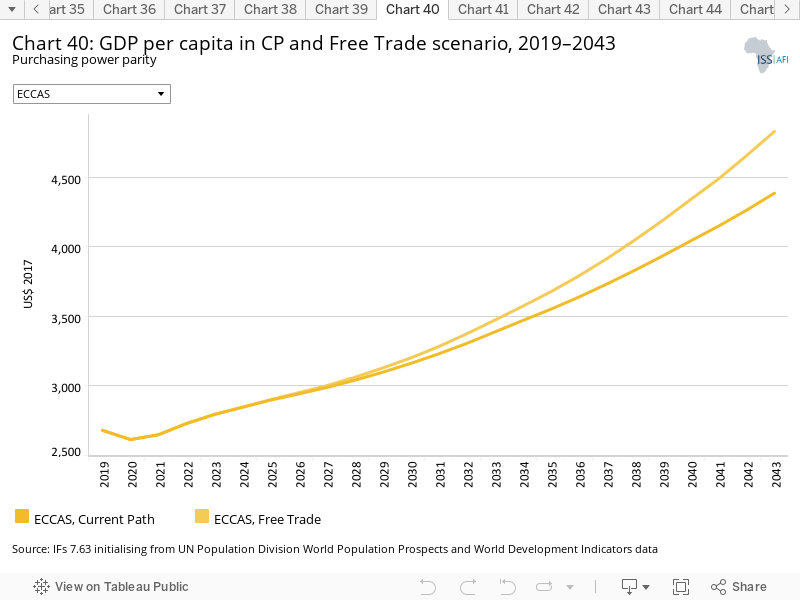
GDP per capita for ECCAS is US$2 680 in 2019 and set to increase to US$4 386 in the Current Path forecast. In the Free Trade scenario, this will increase with more than US$400 to a value of US$4 830 in 2043.
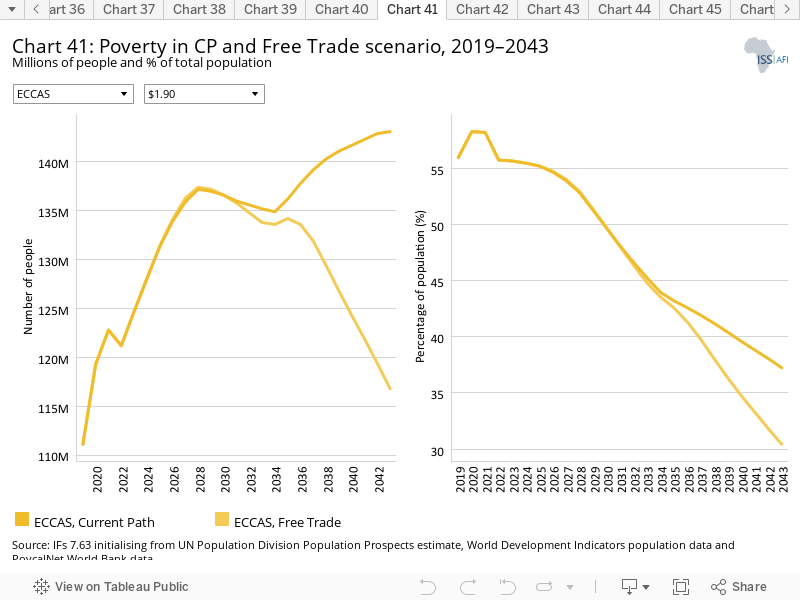
In the Current Path forecast, rates of extreme poverty (using US$1.90) in ECCAS are set to decline from 55.9% in 2019 to 49.7% in 2030 and 37.2% in 2043. In the Free Trade scenario (Chart 41), rates of extreme poverty start to decline from 2029 to 30.4% in 2043, a difference of almost seven percentage points. Whereas the DR Congo experiences the largest decline of 12.7 percentage points in extreme poverty, Burundi experiences an increase in 9.3 percentage points by 2043.
In 2019, 111.1 million people were considered to live on less than US$1.90 per person per day in ECCAS. In the Current Path forecast, that will increase to 136.6 million in 2030 and 143.1 million in 2043. In the Free Trade scenario (Chart 41), extreme poverty numbers in 2030 will be unchanged, compared to the Current Path forecast, but will decline to 116.8 in 2043. The DR Congo will achieve the largest decline of 22 million people below the Current Path forecast in 2043, followed by Angola with a much smaller decline of 2.9 million people.
The Financial Flows scenario represents a reasonable but ambitious increase in worker remittances and aid flows to poor countries, and an increase in the stock of foreign direct investment (FDI) and additional portfolio investment inflows to middle-income countries. We also reduced outward financial flows to emulate a reduction in illicit financial outflows.
The intervention is explained in here in the thematic part of the website.
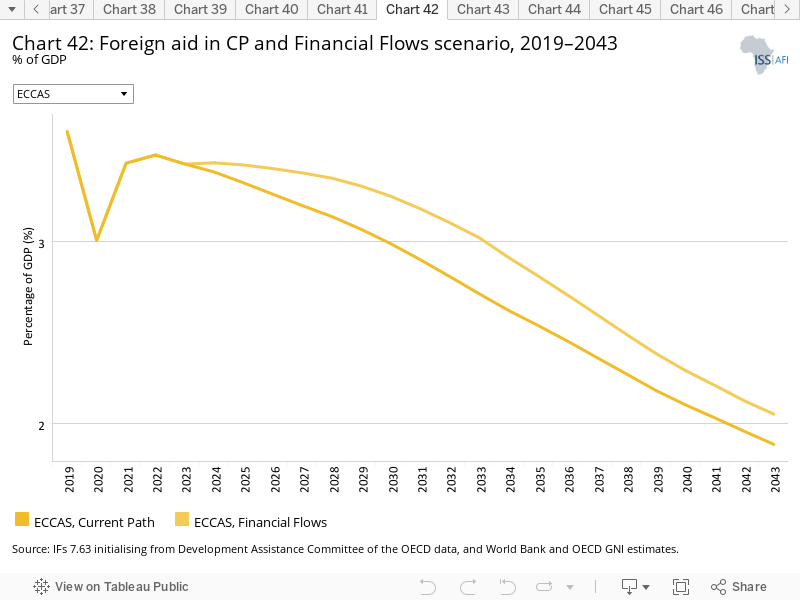
Most aid goes to low-income countries. In 2019, the ECCAS group received US$10.74 billion net aid that would increase to US$13.03 billion in 2030 and US$18.15 billion in 2043 in the Current Path forecast. However, as a per cent of GDP, aid reduces from 3.6% of GDP to 3% in 2030 and 1.9% in 2043 since the increases in aid do not keep pace with the expansion of the economies of the Community. As a result, in the Financial Flows scenario (Chart 42), the reduction in aid as a per cent of GDP is slower than in the Current Path. By 2030 aid constitutes 3.3% of GDP and is at 2.1% of GDP in 2043. In 2030 ECCAS will receive US$1.441 billion more aid under the Financial Flows scenario than in the Current Path forecast and US$2.3 billion more in 2043. By 2043 the region would, cumulatively, have received US$33.1 billion more aid in the Financial Flows scenario compared to the Current Path forecast. The increase is, however, not evenly distributed amongst countries. Upper middle-income countries, Gabon and Equatorial Guinea get very little aid. Measuring in per cent of GDP, aid is important for low-income countries, Burundi and CAR in particular. In the Current Path forecast, aid to CAR declines from 30.7% of GDP in 2019 to 18.1% in 2043 but is 19.1% of GDP in the Financial Flows scenario. However, it is the DR Congo that gets the lion's share of more aid in absolute value (an increase of US$1.159 billion in 2043 compared to the Current Path forecast for that year). In 2043 aid to the DR Congo is equivalent to 4.7% of GDP in the Financial Flows scenario compared to 4.2% in the Current Path forecast. In the Financial Flows scenario, levels of aid to Gabon and Angola decline modestly below the Current Path forecast given their relatively high levels of GDP per capita.
FDI typically goes to middle- and high-income countries rather than low-income countries. In 2019, ECCAS received FDI inflows equivalent to 2.9% of GDP that increase to 5% by 2030 and 5.4% in 2043, shown in Chart 43. In the Financial Flows scenario, FDI inflows increase to 5.9% of GDP in 2030 and 6% in 2043. As a per cent of GDP, the inflows of FDI are most significant in São Tomé and Príncipe, the Republic of the Congo and Gabon, and lowest in Burundi.
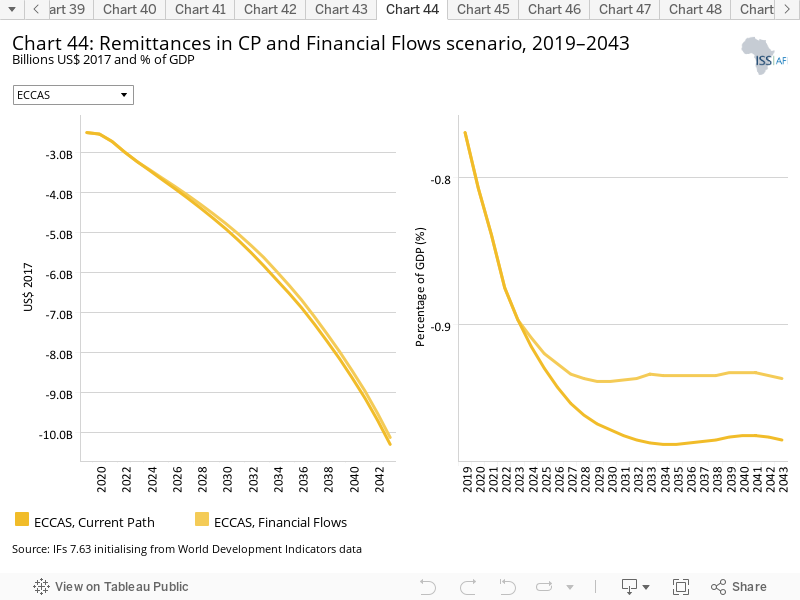
Because of large remittance outflows from Angola and the DR Congo, and smaller outflows from Gabon, the Republic of the Congo, CAR, Rwanda, Chad and Equatorial Guinea ECCAS is characterised by a net outflow of remittances, which is quite different from the general belief that remittances flow inward towards poor countries. In 2019, that outflow was US$2.5 billion, reflected in Chart 44. Only Cameroon, Burundi and São Tomé and Príncipe received net inward remittance flows in 2019. In the Current Path forecast, net outward remittance flows will increase to US$10.287 billion in 2043. In the Financial Flows scenario, the 2043 outflow is reduced to US$10.114 billion. From 2024 to 2043, the cumulative reduced outward flow of remittances in the Financial Flows scenario is US$2.936 billion. The improvement is largest in the DR Congo.
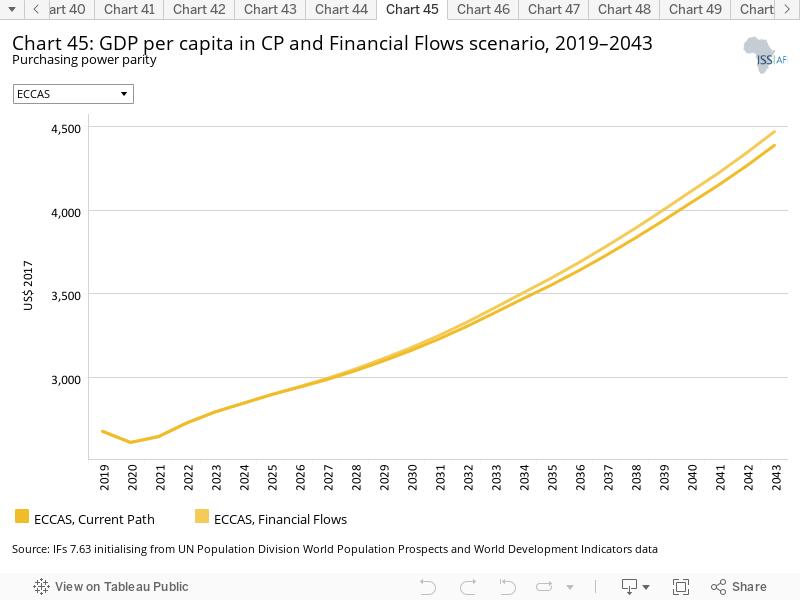
In 2019, the GDP per capita in ECCAS was US$2 680. In the Current Path forecast, GDP per capita would come to US$4 386 in 2043. Instead, in the Financial Flows scenario, it comes to US$4 468, a difference of US$82. Compared to the Current Path forecast, Gabon receives the largest increase at US$360 in 2043, followed by Equatorial Guinea and Angola. CAR and Burundi achieve the smallest improvement at below US$25 per person.
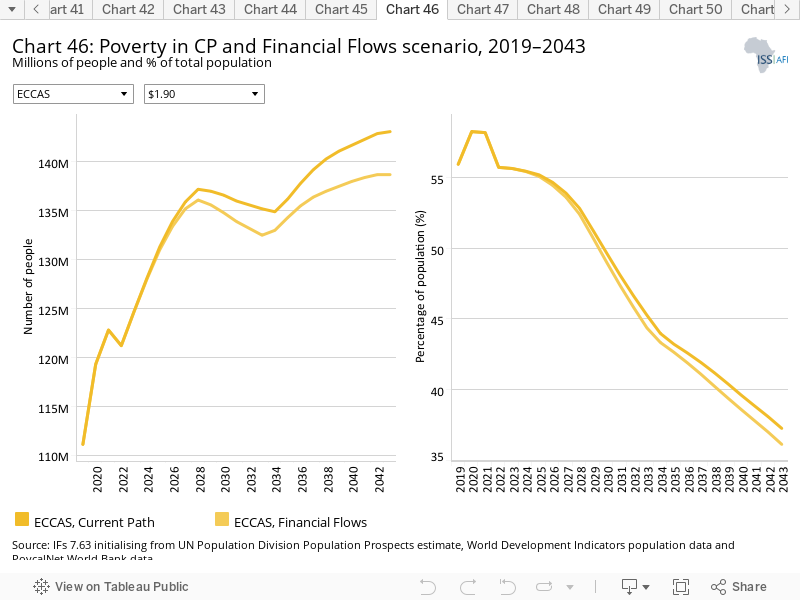
The difference between the Current Path forecast and the Financial Flows scenario (Chart 46) is equivalent to 1.8 million fewer extremely poor people in 2030 and 4.4 million fewer in 2043. The largest decline is in the DR Congo (2.8 million people).
The extreme poverty rate in 2019 (at US$1.90) was 55.9%, which is likely to decline to 49.7% in 2030 and 37.2% in 2043. In the Financial Flows scenario, the rate of extreme poverty declines to 49% in 2030 and 36.1% in 2043.
The Infrastructure scenario represents a reasonable but ambitious increase in infrastructure spending across Africa, focusing on basic infrastructure (roads, water, sanitation, electricity access and ICT) in low-income countries and increasing emphasis on advanced infrastructure (such as ports, airports, railway and electricity generation) in higher-income countries.
Note that health and sanitation infrastructure is included as part of the Health/WaSH scenario and that ICT infrastructure and more rapid uptake of renewable is part of Leapfrogging. The interventions there push directly on outcomes, whereas those modelled in this scenario increase infrastructure spending, indirectly boosting other forms of infrastructure, including that supporting health, sanitation and ICT.
The intervention is explained in here in the thematic part of the website.
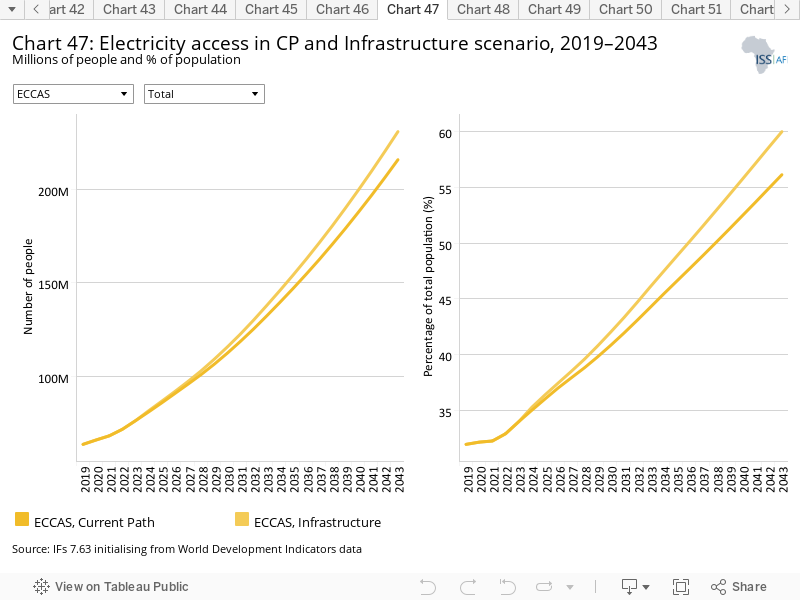
Similar to most other infrastructure, electricity access in ECCAS is almost 20 percentage points below the average for Africa, reflected in Chart 47. In 2019, average electricity access in ECCAS was 32%, forecast to increase to 56.1% in 2043 in the Current Path forecast. In 2019, 135.2 million people in ECCAS had no access to electricity of which 83.5 million were in urban areas and 181.7 million in rural areas. In the Current Path forecast, the total number of people without access increases to 168.4 million in 2043 and to 153.8 million in the Infrastructure scenario even as the rate of access in the Infrastructure scenario improves to 60%. Whereas rural electricity access was at 8.6% in 2019, it will improve to 36.7% in 2043 under the Infrastructure scenario, 5.6 percentage points above the Current Path forecast.
Electricity access in Burundi and Chad are the lowest, followed by the DR Congo, while in Gabon it is already above 90% in 2019. Electricity access in Equatorial Guinea improves to 82.6% in 2030 in the Current Path forecast.
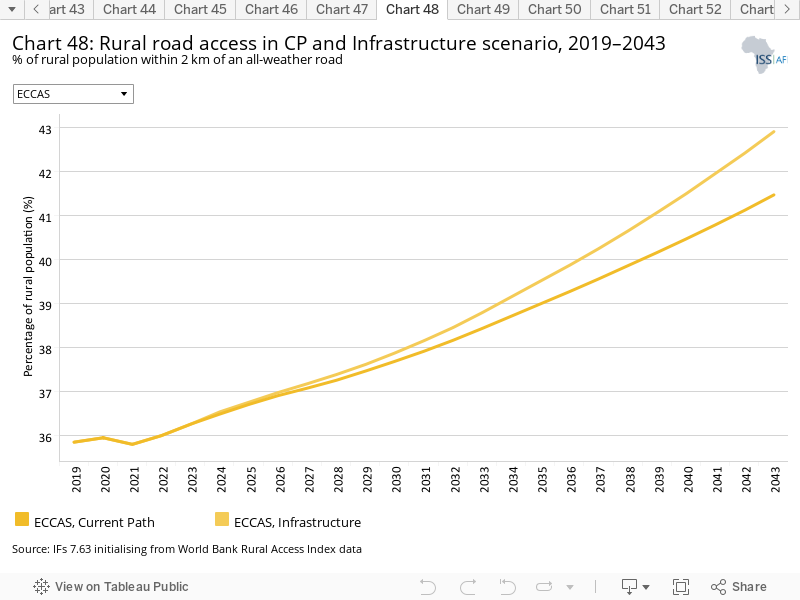
Indicator 9.1.1. in the Sustainable Development Goals refers to the proportion of the rural population who live within 2 km of an all-season road and is captured in the Rural Access Index.
In 2019, 32% of the population in rural areas in ECCAS were within 2 km from an all-weather road. The Current Path forecast is that this will improve to 41.9% by 2030 and 56.1% by 2043. The ECCAS countries with the best access are Equatorial Guinea (95% in 2019) and Gabon (90% in 2019). The three worst performing countries are the DR Congo (32.9% access), Cameroon (25.2%) and Chad (16%). The Republic of the Congo gains most from the Infrastructure scenario, improving access by 6.3 percentage points above the Current Path forecast by 2043, followed by Rwanda. Because it is almost at full access, the scenario has no impact upon rural access improvement in Equatorial Guinea.
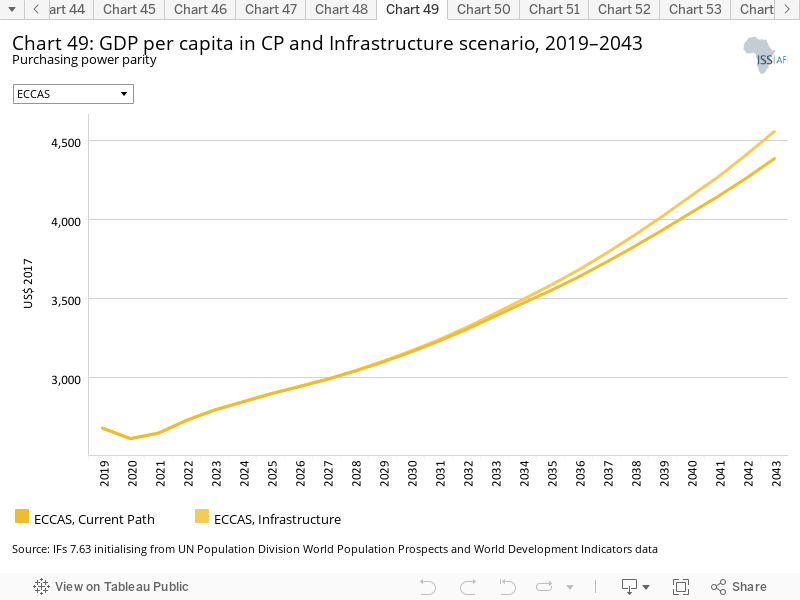
GDP per capita for ECCAS was US$2 680 in 2019 and set to increase to US$4 386 in the Current Path forecast, compared to US$4 558 in the Infrastructure scenario. Angola gains the most in GDP per capita that increases US$528 above the Current Path forecast by 2043, followed by Equatorial Guinea (US$305). Chart 49 shows that Burundi will experience the least improvement in the Infrastructure scenario with only US$12 by 2043.
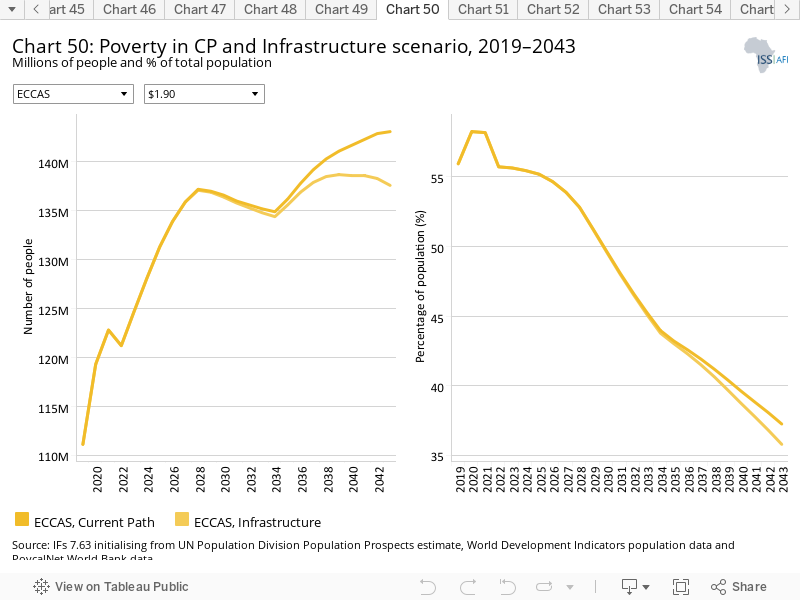
The Current Path forecast is that extreme poverty in ECCAS (using US$1.90) will increase from 111.1 million people (58.6% of the population) in 2019 to 136.6 million in 2030 and 143.1 million in 2043, representing 49.7% and 37.2% of the population respectively. Chart 50 shows that the number of extremely poor people in the Infrastructure scenario in 2030 is 136.4 million in 2030 and 137.6 million in 2043. These numbers represent 49.6% and 35.8% of the total population. The decline in poverty is most significant in the DR Congo with 3.4 million fewer people living in extreme poverty in 2043 compared to the Current Path forecast.
The Governance scenario represents a reasonable but ambitious shift that improves accountability and reduces corruption, and hence improves the quality and service delivery by government.
The intervention is explained in here in the thematic part of the website.
As defined by the World Bank, government effectiveness ‘captures perceptions of the quality of public services, the quality of the civil service and the degree of its independence from political pressures, the quality of policy formulation and implementation, and the credibility of the government’s commitment to such policies’.
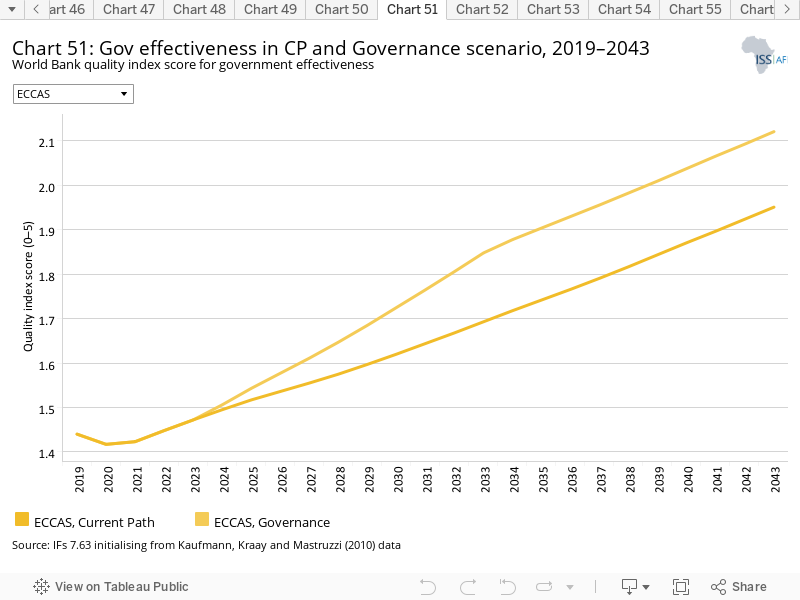
The Governance scenario improves government effectiveness by 9% in 2043 above the Current Path forecast. Chad improves the most (14%) and São Tomé and Príncipe the least (5%). Chart 51 shows the government effectiveness in the Current Path forecast and the Governance scenario for the ECCAS member states.
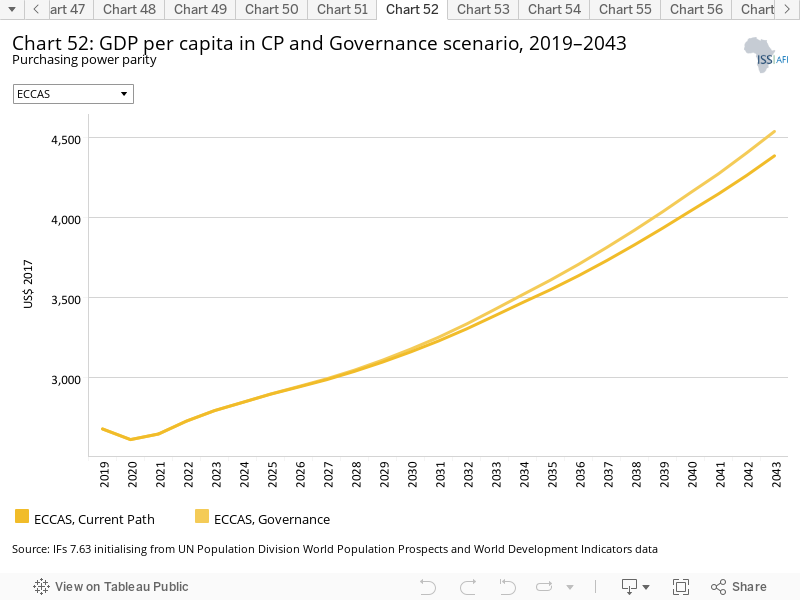
Chart 52 shows that, in 2019, GDP per capita in ECCAS was US$2 680 and is set to improve to US$4 386 in 2043. In the Governance scenario, GDP per capita increases to US$4 539. Angola gains the most in the Governance scenario compared to the Current Path forecast. In 2019, GDP per capita in Angola was US$5 988 and is set to improve to US$9 205 in 2043. In the Governance scenario, Angola improves its GDP per capita by US$361 above the Current Path forecast for 2043. Burundi gains the least from the Governance scenario, with a meagre US$44 improvement above the Current Path forecast for 2043.
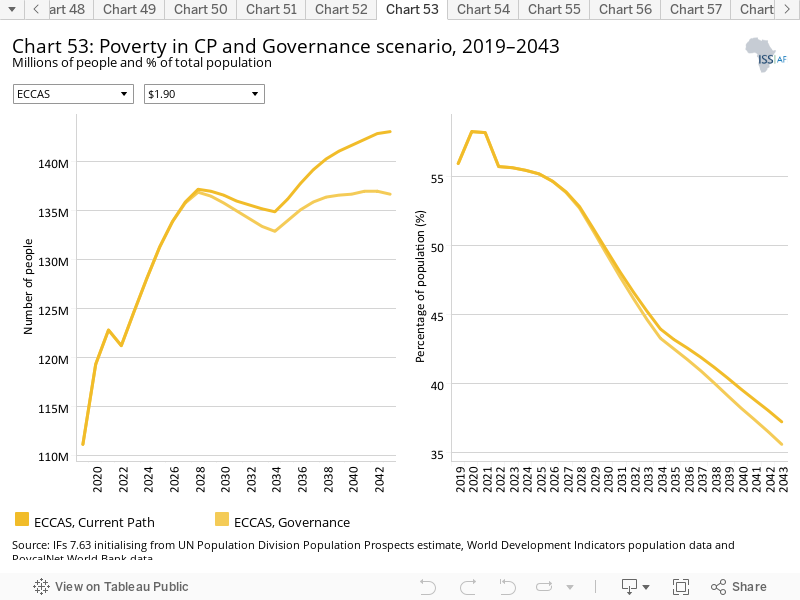
The rate of extreme poverty (using US$1.90) was 55.9% in ECCAS in 2019, equivalent to 111.1 million people, shown in Chart 53. In the Governance scenario, extreme poverty will decline to 35.6% (136.7 million people) by 2043, compared to 37.2% (143.1 million people) in the Current Path forecast. Extreme poverty in the DR Congo will decline by an additional 3.9 million people in 2043 compared to the Current Path forecast. Extreme poverty in Angola will decline by 880 000 people. Calculated as a per cent decline, extreme poverty declines most sharply in Rwanda (by 8%) followed by Cameroon (7%). Poverty declines by only 2% in CAR.
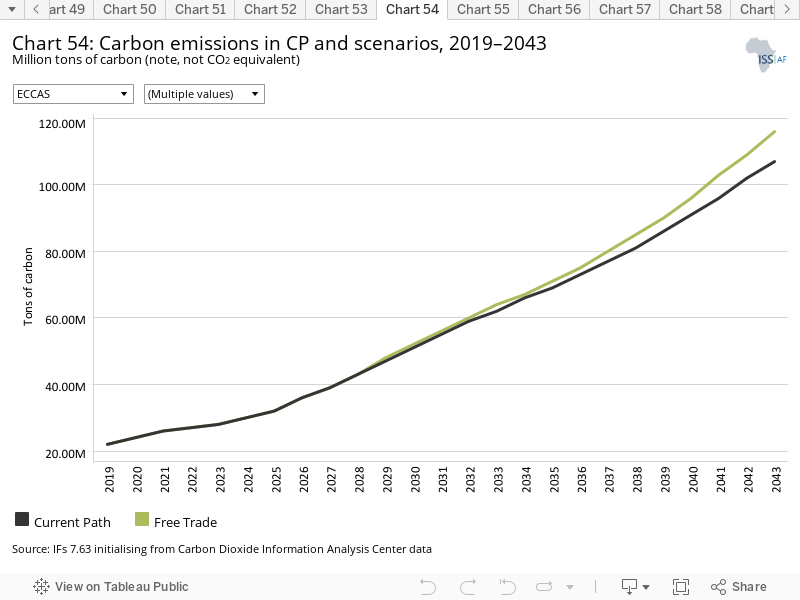
This section presents projections for carbon emissions in the Current Path for ECCAS and the 11 scenarios. Note that IFs uses carbon equivalents rather than CO2 equivalents.
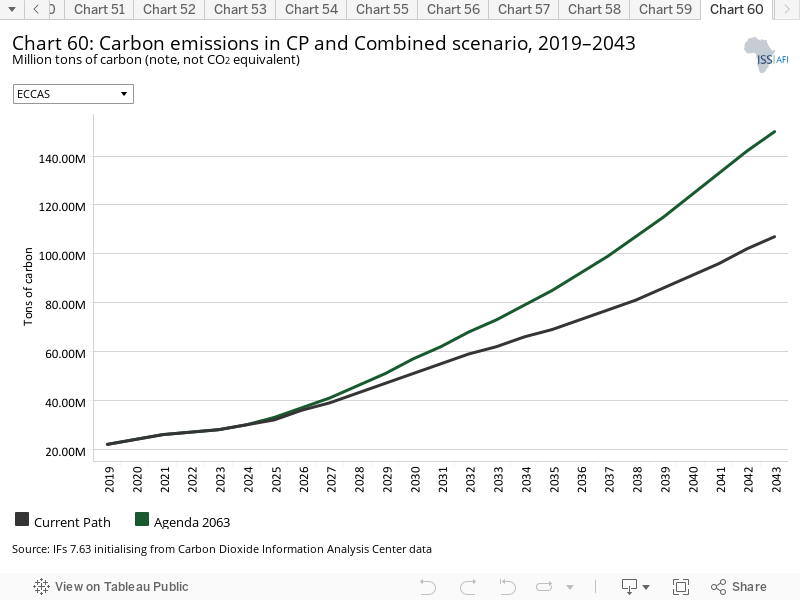
In 2019, the ECCAS region released only 22 million tons of carbon of which Angola released more than half. In the Current Path forecast, ECCAS will release 107 million tons of carbon in 2043, the result of sustained economic and population growth in all member states.
Chart 54 indicates that the Free Trade scenario is the most carbon intensive scenario for ECCAS, while, in the Demographic scenario, carbon emissions in 2043 will be below the Current Path forecast (at 105 million tons in 2043).
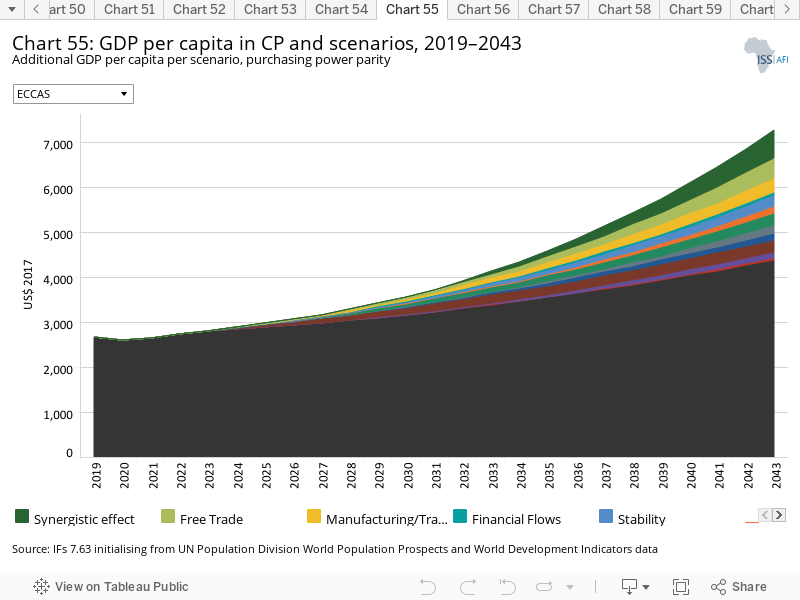
The Combined Agenda 2063 scenario consists of the combination of all 11 sectoral scenarios presented above, namely the Stability, Demographics, Health/WaSH, Agriculture, Education, Manufacturing/Transfers, Leapfrogging, Free Trade, Financial Flows, Infrastructure and Governance scenarios. The cumulative impact of better education, health, infrastructure, etc. means that countries get an additional benefit in the integrated IFs forecasting platform that we refer to as the synergistic effect. Chart 55 presents the contribution of each of these 12 components to GDP per capita in the Combined Agenda 2063 scenario.
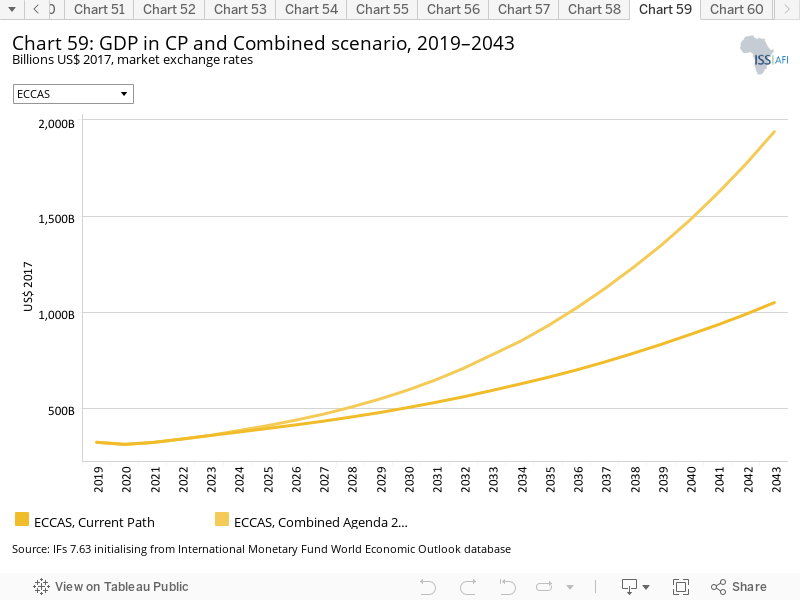
In 2019, average GDP per capita in ECCAS was US$2 680. In the Current Path forecast, this will increase to US$4 386 in 2043. In the Combined Agenda 2063 scenario GDP per capita increases to US$7 267 in 2043, which is 65.7% larger than the Current Path forecast for that year.
By 2033, the end of the second ten-year implementation plan of the Combined Agenda 2063, the Agriculture scenario provides the largest increase in GDP per capita, followed by Leapfrogging, Manufacturing/Transfers and Free Trade. .
By 2043 the Free Trade scenario provides the largest increase in GDP per capita, followed by Management/Transfers,Leapfrogging and Agriculture.
These impacts obviously differ between countries. For example, in the case of Angola, the Manufacturing/Transfers scenario is most impactful by 2033, followed by the Agriculture scenario. In 2043, Free Trade is the most impactful scenario, followed by Manufacturing/Transfers. In the case of the DR Congo, however, the Agriculture and Leapfrogging scenarios are most impactful in 2033 and, in 2043, Agriculture and Free Trade will have the greatest impact.
Angola gains more in GDP per capita improvements in the Combined Agenda 2063 than other ECCAS member states (an increase of US$6 818 by 2043 compared to the Current Path forecast), followed by Equatorial Guinea (US$5 984). Burundi gains the least from this scenario with US$878 in 2043.
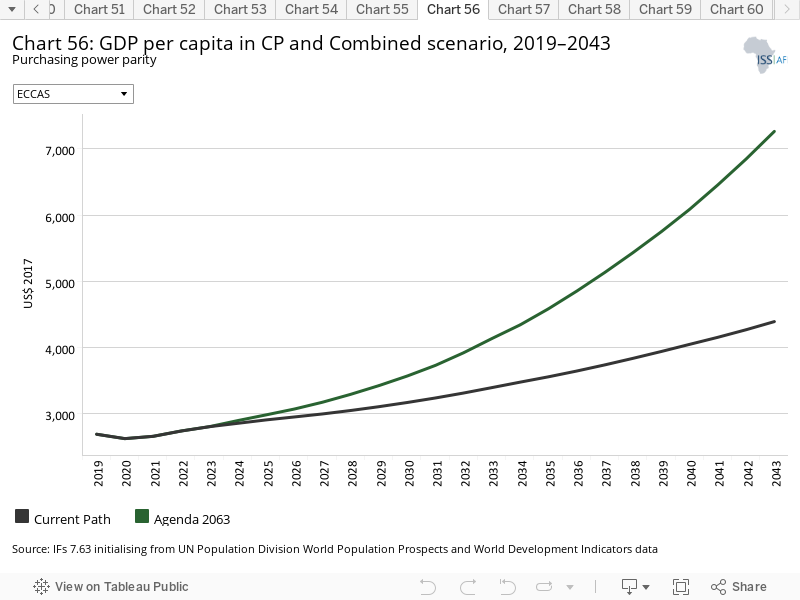
Chart 56 presents a stacked area graph on the contribution of each scenario to GDP per capita as well as the additional benefit or synergistic effect, whereas Chart 56 presents only the GDP per capita in the Current Path forecast and the Combined Agenda 2063 scenario.
The Combined Agenda 2063 scenario has a substantial impact on incomes in the ECCAS region. GDP per capita for ECCAS was US$2 680 in 2019 and is set to increase to US$4 386 in 2043 in the Current Path forecast. In the Combined Agenda 2063 scenario, the average GDP per capita for ECCAS will be US$7 502, an increase of 83% in the Current Path forecast for that year. In absolute US$ values, the increase is the largest in Angola, at US$7 341 in 2043, compared to the Current Path forecast for that year (i.e. 80% larger), followed by Equatorial Guinea at US$5 984 (17% larger) and Gabon at US$4 960 (24% larger). Burundi gains the least in absolute value at US$953 (73% larger). Yet it is the DR Congo that experiences the largest percentage improvement in GDP per capita above the Current Path forecast for 2043. GDP per capita in the DR Congo will increase by 86%, followed by Rwanda with an increase of 82%.
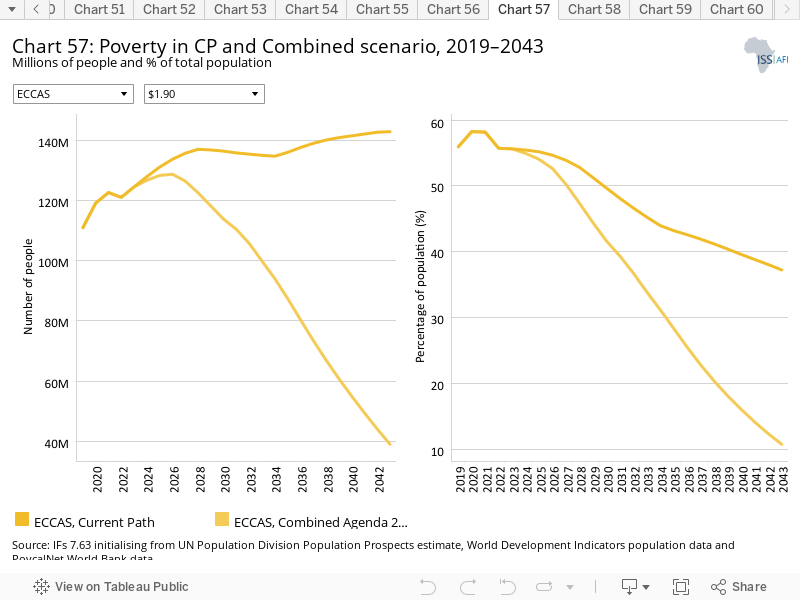
In 2019, extreme poverty at US$1.90 affected 55.9% of the ECCAS population, or 111.1 million people. In the Combined Agenda 2063 forecast, the per cent of extremely poor people could decline to 41.4% in 2030 (113.2 million people) and 9.9% (35.7 million) by 2043, instead of 49.7% (136.6 million people) and 37.2% (143.1 million people) in the Current Path forecast. Burundi would experience the largest decline in extreme poverty, namely 40.6 percentage points (equivalent to 8.3 million people) followed by the DR Congo (68.6 million people) and CAR (2.5 million people). Equatorial Guinea and Gabon would register less than one percentage point improvement.
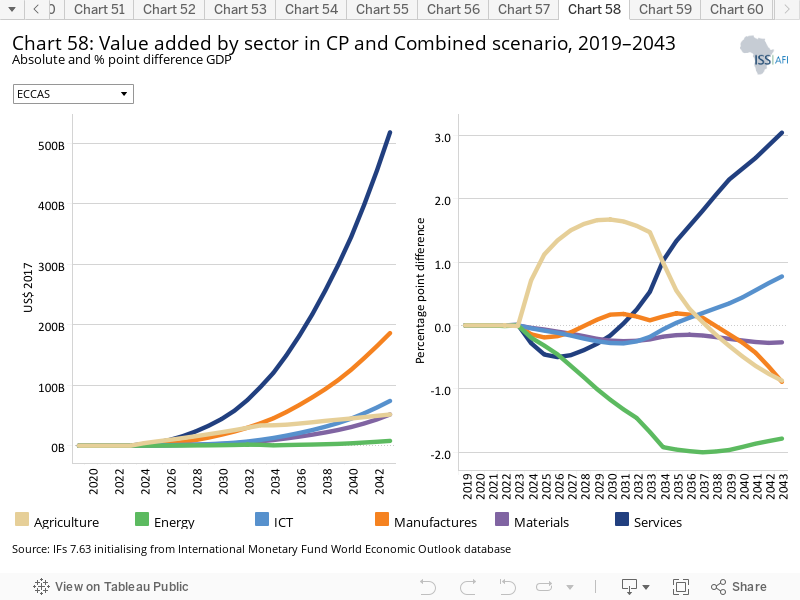
See Chart 8 to view the Current Path forecast of the sectoral composition of the economy.
All sectors increase in value when comparing the 2043 Current Path forecast with the Combined Agenda 2063 scenario although the relative contribution shifts.
In 2019, services represented 46.3% of the ECCAS economy. Instead of 51.7% in 2043 (the Current Path forecast), in the Combined Agenda 2063 scenario, services would represent 54.8%. The services sector will expand particularly rapidly in Chad. The changes in the sectoral composition of the ECCAS economy would, by 2043, consist of a decline of the contribution of the energy, manufacturing, agriculture and materials sectors and increases in services and ICT. As a portion of GDP, agriculture will decline most rapidly in Chad and CAR.
The agriculture sector in the DR Congo will be US$19.5 billion larger and in Angola it will be US$13.3 billion larger. The energy sector in Angola and Chad will increase by US$5.2 billion and US$862 million respectively in 2043, compared to the Current Path forecast. In the DR Congo, the materials sector will be US$34.75 billion larger in 2043 than in the Current Path forecast. In Angola, the manufacturing sector will be US$91.5 billion larger and Angola’s services sector an astonishing US$271 billion bigger.
However, when comparing the proportion of the change per sector, Burundi will experience the largest increase in its agricultural sector (2.1% above the Current Path forecast in 2043). While CAR will experience the largest increase in its energy sector (1.7% above the Current Path forecast in 2043).
In 2019, Angola had the largest economy in ECCAS at US$138.8 billion, followed by Cameroon (US$46.3 billion) and the DR Congo (US$44.9 billion). In the Combined Agenda 2063 scenario, the DR Congo will have the second largest economy within ECCAS in 2043 (at US$413.1 billion, but still significantly smaller than Angola’s at US$877 billion). Cameroon would rank third with a value of US$250.9 billion in 2043. In 2043 the economies of Burundi and CAR would be below US$20 billion and São Tomé and Príncipe would be below US$2 billion in the Combined Agenda 2063 scenario.
In the Combined Agenda 2063 scenario, ECCAS will release 154 million tons of carbon in 2043 compared to 107 million tons in the Current Path forecast. In 2019, ECCAS released only 22 million tons of carbon. Angola will, in 2043, still be the largest carbon emitter amongst the ECCAS member states but then only release one quarter of the ECCAS total. In 2019, Angola was responsible for half of the ECCAS total carbon emissions.
Page information
Contact at AFI team is Jakkie Cilliers
This entry was last updated on 15 November 2023 using IFs v7.63.
Donors and sponsors


Reuse our work
- All visualizations, data, and text produced by African Futures are completely open access under the Creative Commons BY license. You have the permission to use, distribute, and reproduce these in any medium, provided the source and authors are credited.
- The data produced by third parties and made available by African Futures is subject to the license terms from the original third-party authors. We will always indicate the original source of the data in our documentation, so you should always check the license of any such third-party data before use and redistribution.
- All of our charts can be embedded in any site.
Cite this research
Jakkie Cilliers (2024) ECCAS. Published online at futures.issafrica.org. Retrieved from https://futures.issafrica.org/geographic/recs/eccas/ [Online Resource] Updated 15 November 2023.