 Tunisia
Feedback welcome
Our aim is to use the best data to inform our analysis. See our About page for information on the IFs forecasting platform. We appreciate your help and references for improvements via our feedback form.
In this entry, we first describe the Current Path forecast for Tunisia as it is expected to unfold to 2043, the end of the third ten-year implementation plan of the African Union’s Agenda 2063 long-term vision for Africa. The Current Path in the International Futures (IFs) forecasting model initialises from country-level data that is drawn from a range of data providers. We prioritise data from national sources.
The Current Path forecast is divided into summaries on demographics, economics, poverty, health/WaSH and climate change/energy. A second section then presents a single positive scenario for potential improvements in stability, demographics, health/WaSH, agriculture, education, manufacturing/transfers, leapfrogging, free trade, financial flows, infrastructure, governance and the impact of various scenarios on carbon emissions. With the individual impact of these sectors and dimensions having been considered, a final section presents the impact of the Combined Agenda 2063 scenario.
We generally review the impact of each scenario and the Combined Agenda 2063 scenario on gross domestic product per person and extreme poverty except for Health/WaSH that uses life expectancy and infant mortality.
The information is presented graphically and supported by brief interpretive text.
All US$ numbers are in 2017 values.
Summary
- Current Path forecast
- Tunisia is a country in North Africa and is classified as a lower middle-income country. Jump to forecast: Current path
- Tunisia has a population of over 11 million people that is rapidly ageing, and the country will fall below the replacement level of 2.1 live births by 2022. By 2043, health costs will likely increase due to the burden of treating more non-communicable diseases. Jump to Demographics: Current path
- Tunisia’s economic growth is stagnant because of poor governance, low levels of investment, a small formal sector and a large, low-productivity informal sector. The economic situation in Tunisia has worsened since the revolution and large government expenditure and subsidy policies have complicated the problem. Jump to Economics: Current path
- Tunisia has already achieved the headline sustainable development goal (SDG) of eliminating extreme poverty as measured at US$1.90 per person per day. At the World Bank’s US$3.20 extreme poverty threshold for lower middle-countries, 10.1% of Tunisians are currently in poverty. Jump to Poverty: Current path
- By 2043, the country will be emitting 12 million tons of carbon compared to 9 million tons in 2019. This is a direct result of increased economic activity and illustrates the trade-offs that policymakers need to grapple with while thinking about economic development and environmental sustainability. Jump to Carbon emissions/Energy: Current path
- Sectoral Scenarios
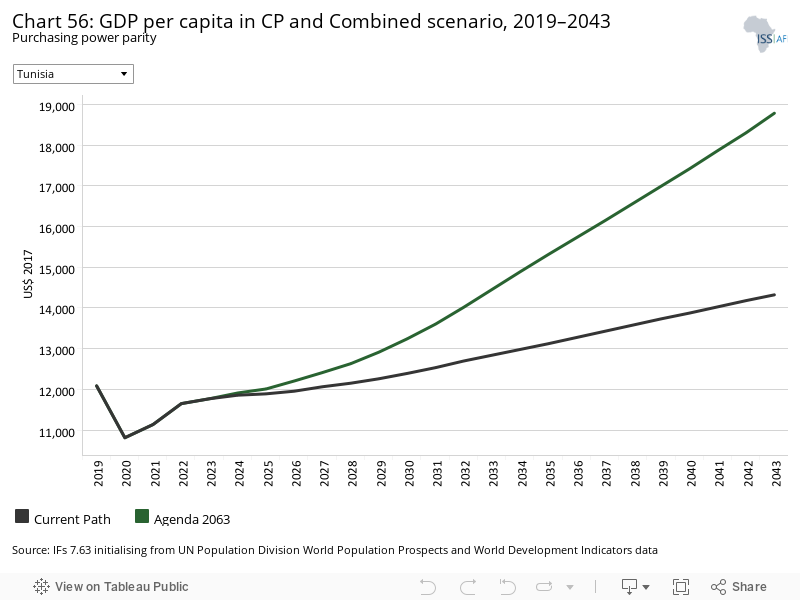
- The Stability scenario envisions a future where political and social consensus/contract is renewed and security and stability are achieved in Tunisia and regionally. By 2043, per capita income is estimated at US$14 835 compared to US$14 323 in the Current Path forecast. Jump to Stability scenario
- The Demographic scenario significantly improves the demographic dividend of Tunisia, and by 2037 the country will experience a second peak at 1.97 working-age persons per dependant (a slightly lower peak than 2.25 in 2011). Jump to Demographic scenario
- The Health/WaSH scenario increases life expectancy to 80.8 years by 2043, nearly four years above the global average. Jump to Health/WaSH scenario
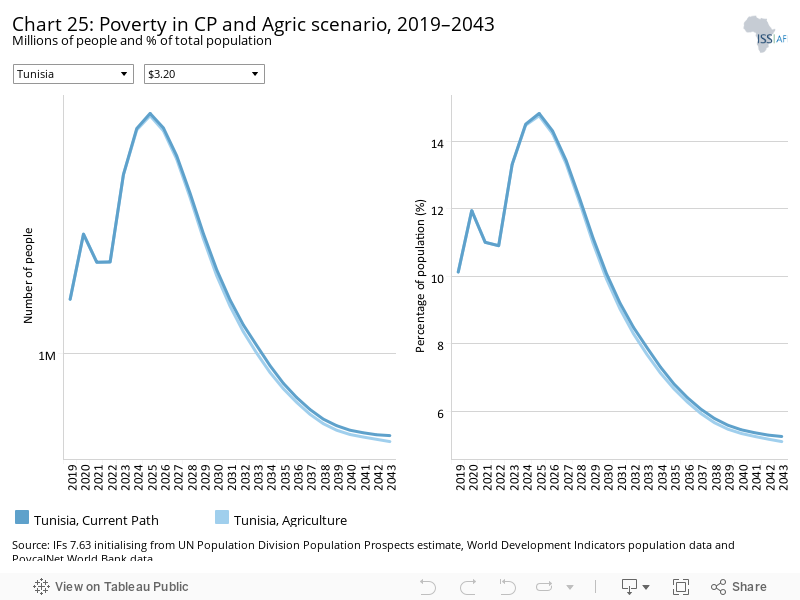
- The Agriculture scenario increases crop yields, and by 2043 yields will reach about 3.02 tons per hectare compared to 2.92 tons per hectare in the Current Path forecast. Jump to Agriculture scenario
- The Education scenario increases primary test scores, reaching 47.1 compared to 40.4 in the Current Path forecast, while secondary test scores reach 58, relative to 48.4 in the Current Path forecast. Jump to Education scenario
- In the Manufacturing/Transfers scenario, the contribution of manufacturing to GDP in Tunisia will increase from 29.1% of GDP in 2019 to 31.9% in 2043 and marks the greatest improvement compared to the other sectors. However, in absolute values, the services sector makes the greatest contribution to the economy by then. Jump to Manufacturing/Transfers scenario
- In the Leapfrogging scenario, by 2043 fixed broadband is expected to reach about 50 subscriptions per 100 people, relative to 34.4 in the Current Path forecast. This is slightly higher than the average for lower middle-income countries at 47.5. Jump to Leapfrogging scenario
- The Free Trade scenario opens up new markets for Tunisia and increases the volume of exports in the country so that by 2024, the country starts to record a positive trade balance. Jump to Free Trade scenario
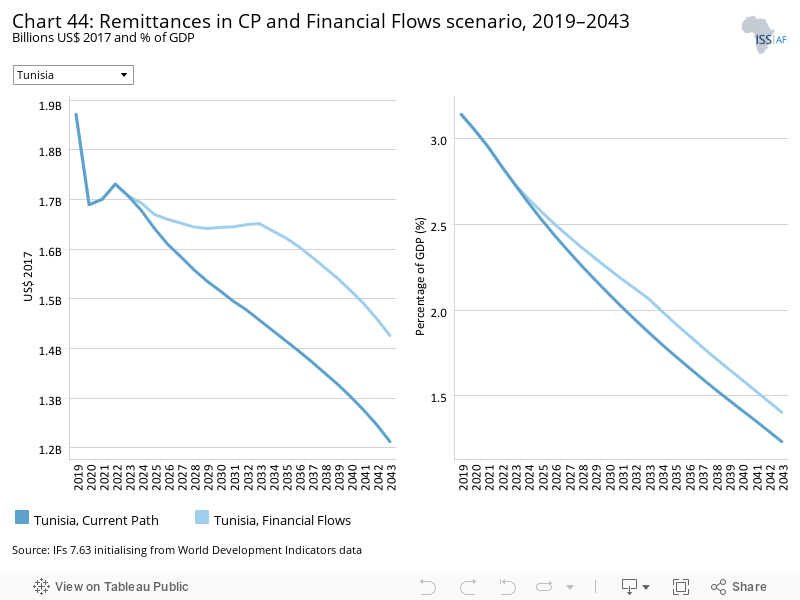
- The Financial Flows scenario increases remittances to about 1.4% of GDP (US$1.43 billion) compared to 1.2% (US$1.21 billion) in the Current Path forecast in 2043. Jump to Financial Flows scenario
- In the Infrastructure scenario, by 2043 the rural population with access to an all-weather road will increase to 59.2% compared to 57.1% in the Current Path forecast. Jump link to Infrastructure scenario
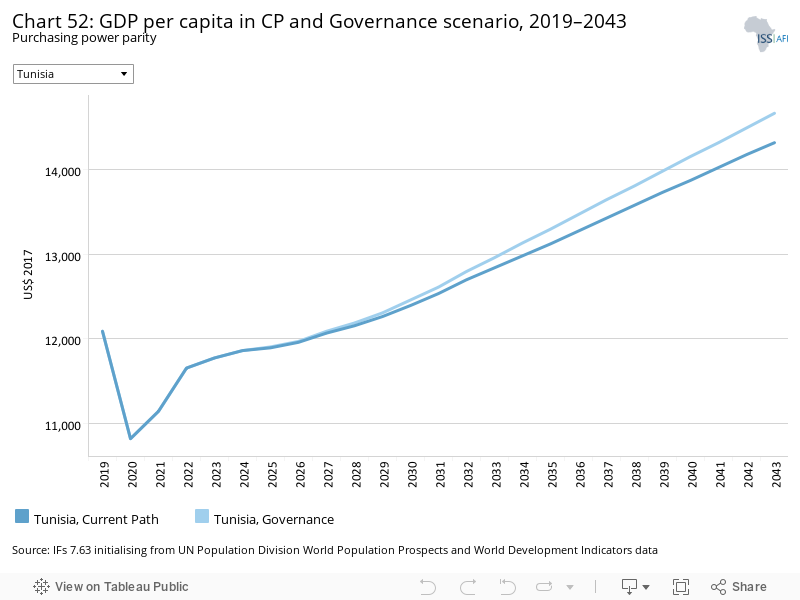
- The Governance scenario improves government effectiveness and per capita income is US$349 more than in the Current Path forecast in 2043. Jump to Governance scenario
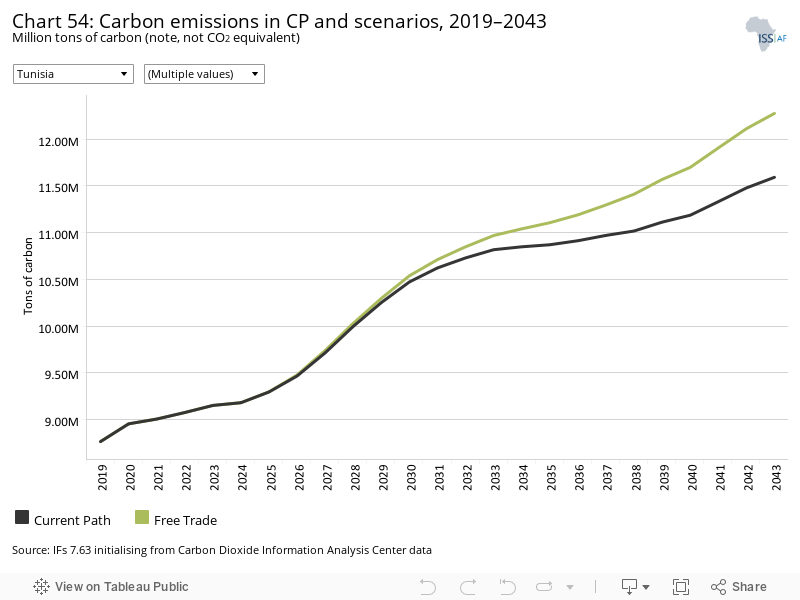
- The Manufacturing/Transfers scenario will be the biggest emitter of carbon until about 2041 when the Free Trade scenario outpaces it. Jump to Impact of scenarios on carbon emissions
- Combined Agenda 2063 scenario
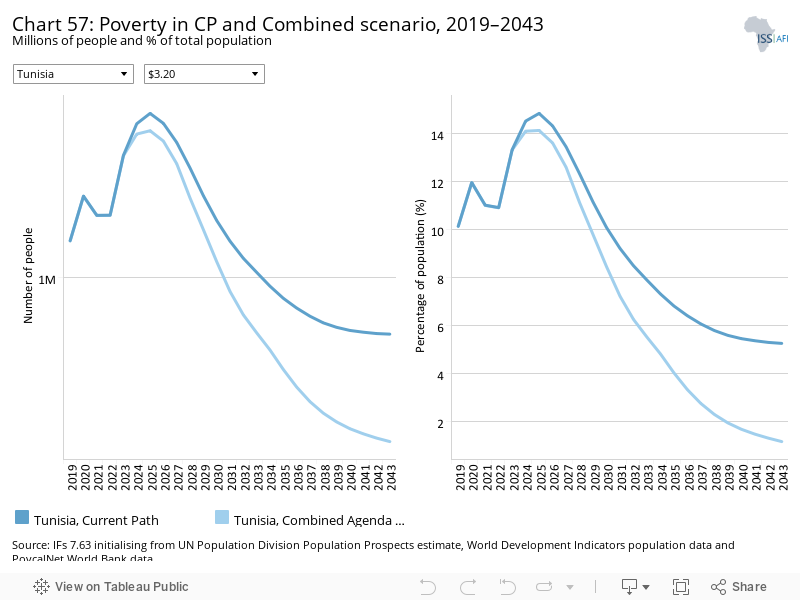
- Under the Combined Agenda 2063 scenario, by 2043 only about 1.1% of Tunisians will be living in extreme poverty (at the US$3.20 threshold) compared to 5.3% in the Current Path forecast. This represents about 561 000 fewer people living in extreme poverty relative to 710 000 in the Current Path forecast. Jump to Combined Agenda 2063 scenario
A comprehensive study on Tunisia’s development prospects titled “The rebirth: Tunisia’s potential development pathways to 2040” can be found here.
All charts for Tunisia
-
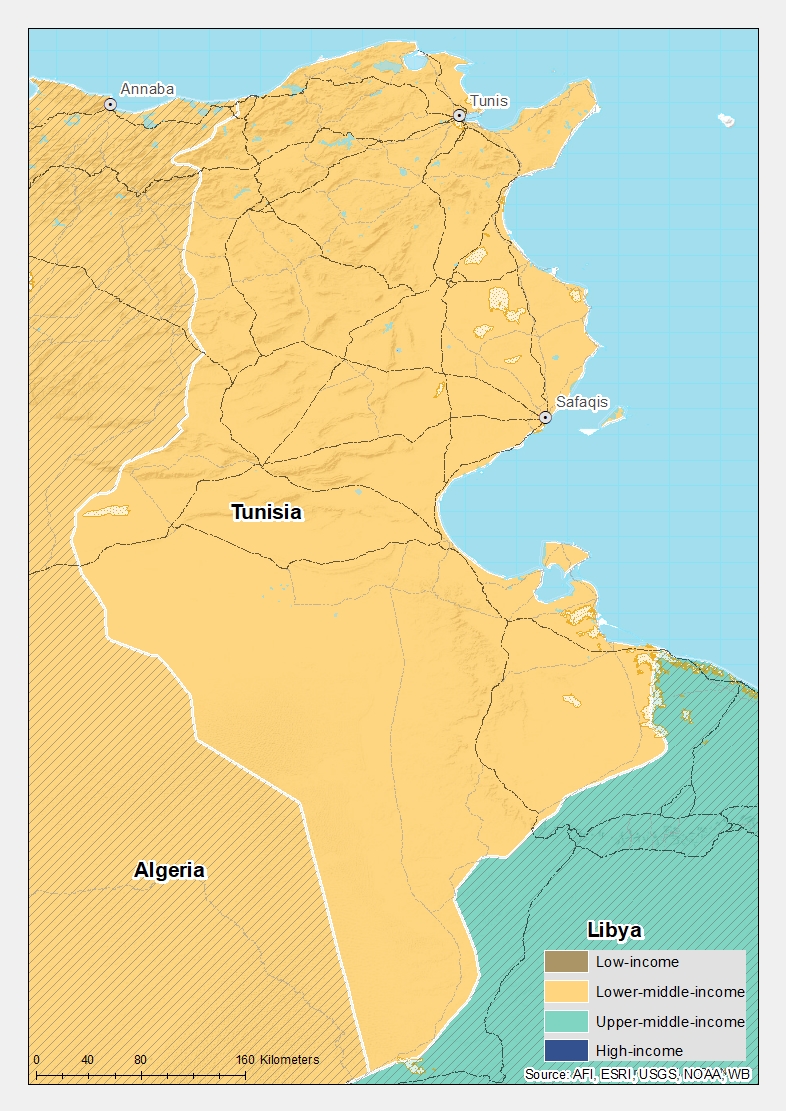
Chart 1: Political map of Tunisia
Chart 1: Political map of Tunisia
- Chart 2: Population structure in CP, 1990–2043
- Chart 3: Urban and rural population in CP, 1990–2043
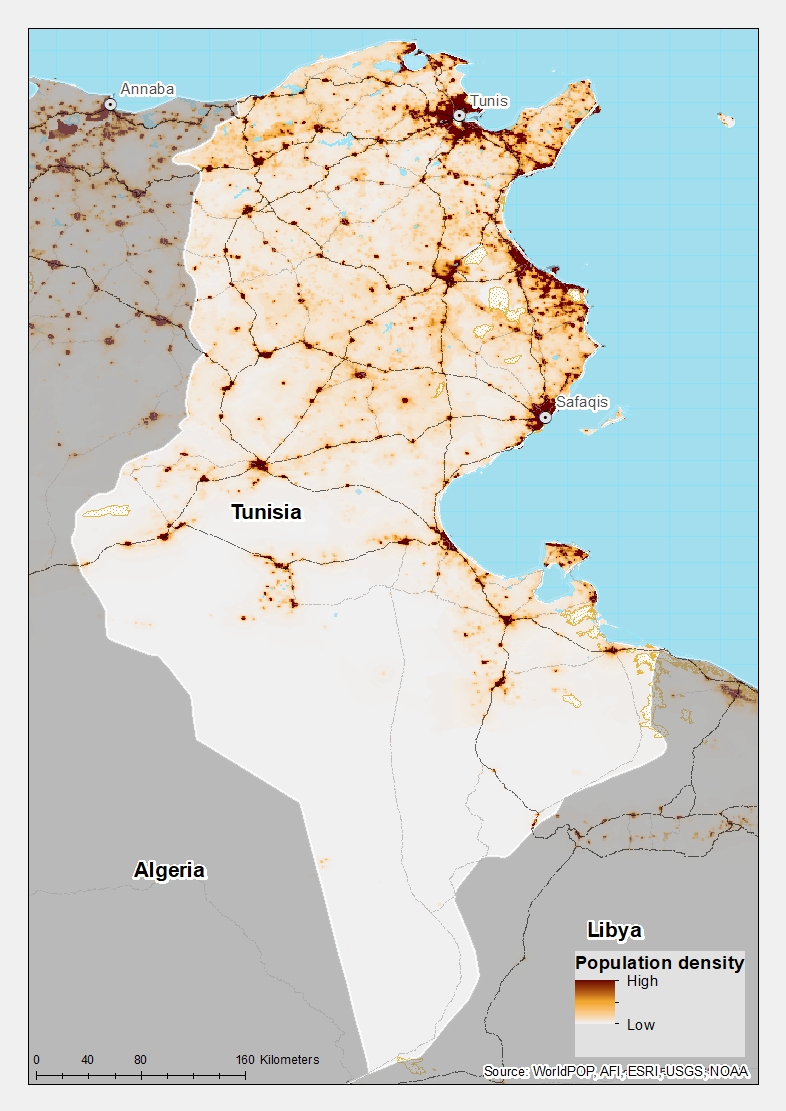
- Chart 4: Population density map for 2019
- Chart 5: GDP in CP, 1990–2043
- Chart 6: GDP per capita in CP, 1990–2043
- Chart 7: Informal sector value in CP, 2015–2043
- Chart 8: Value added by sector in CP, 2015–2043
- Chart 9: Agriculture production/demand in CP, 1990–2043
- Chart 10: Poverty in CP, 2015–2043
- Chart 11: Energy production by type in CP, 1990–2043
- Chart 12: Carbon emissions in CP, 1990–2043
- Chart 13: Governance security in CP and Stability scenario, 2019–2043
- Chart 14: GDP per capita in CP and Stability scenario, 2019–2043
- Chart 15: Poverty in CP and Stability scenario, 2019–2043
- Chart 16: Demographic dividend in CP and Demog scenario, 2019–2043
- Chart 17: Infant mortality in CP and Demog scenario, 2019–2043
- Chart 18: GDP per capita in CP and Demog scenario, 2019–2043
- Chart 19: Poverty in CP and Demog scenario, 2019–2043
- Chart 20: Life expectancy in CP and Health/WaSH scenario, 2019–2043
- Chart 21: Infant mortality in CP and Health/WaSH scenario, 2019–2043
- Chart 22: Yield/hectare in CP and Agric scenario, 2019–2043
- Chart 23: Agriculture imports in CP and Agric scenario, 2019–2043
- Chart 24: GDP per capita in the CP and Agric scenario, 2019–2043
- Chart 25: Poverty in CP and Agric scenario, 2019–2043
- Chart 26: Mean years of education in CP and Educ scenario, 2019–2043
- Chart 27: Education quality in CP and Educ scenario, 2019–2043
- Chart 28: GDP per capita in CP and Educ scenario, 2019–2043
- Chart 29: Poverty in CP and Educ scenario, 2019–2043
- Chart 30: Value added by sector in CP and Manufac/Transfers scenario, 2019–2043
- Chart 31: Gov welfare transfers in CP and Manufac/Transfers scenario, 2019–2043
- Chart 32: GDP per capita in CP and Manufac/Transfers scenario, 2019–2043
- Chart 33: Poverty in CP and Manufac/Transfers scenario, 2019–2043
- Chart 34: Fixed broadband access in CP and Leapfrogging scenario, 2019–2043
- Chart 35: Mobile broadband access in CP and Leapfrogging scenario, 2019–2043
- Chart 36: Electricity access in CP and Leapfrogging scenario, 2019–2043
- Chart 37: GDP per capita in CP and Leapfrogging scenario, 2019–2043
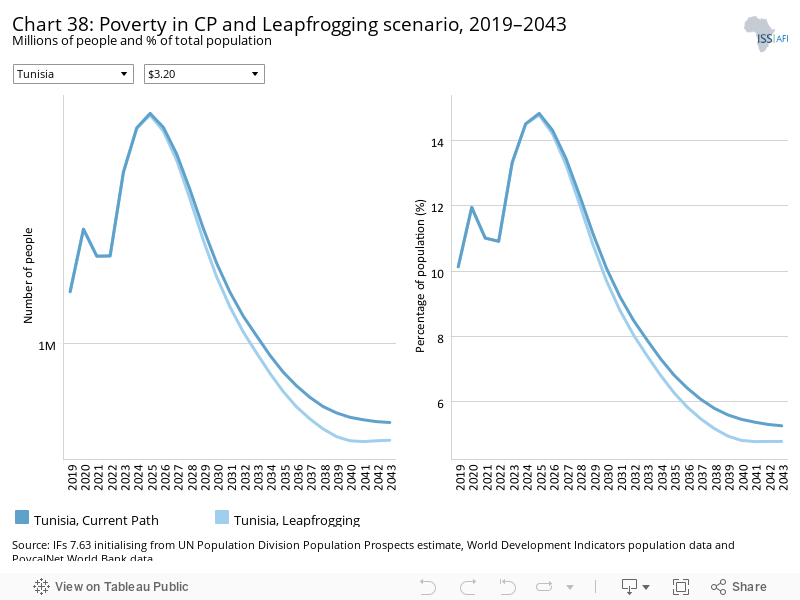
- Chart 38: Poverty in CP and Leapfrogging scenario, 2019–2043
- Chart 39: Trade balance in CP and Free Trade scenario, 2019–2043
- Chart 40: GDP per capita in CP and Free Trade scenario, 2019–2043
- Chart 41: Poverty in CP and Free Trade scenario, 2019–2043
- Chart 42: Foreign aid in CP and Financial Flows scenario, 2019–2043
- Chart 43: Inflow of FDI in CP and Financial Flows scenario, 2019–2043
- Chart 44: Remittances in CP and Financial Flows scenario, 2019–2043
- Chart 45: GDP per capita in CP and Financial Flows scenario, 2019–2043
- Chart 46: Poverty in CP and Financial Flows scenario, 2019–2043
- Chart 47: Electricity access in CP and Infrastructure scenario, 2019–2043
- Chart 48: Rural road access in CP and Infrastructure scenario, 2019–2043
- Chart 49: GDP per capita in CP and Infrastructure scenario, 2019–2043
- Chart 50: Poverty in CP and Infrastructure scenario, 2019–2043
- Chart 51: Gov effectiveness in CP and Governance scenario, 2019–2043
- Chart 52: GDP per capita in CP and Governance scenario, 2019–2043
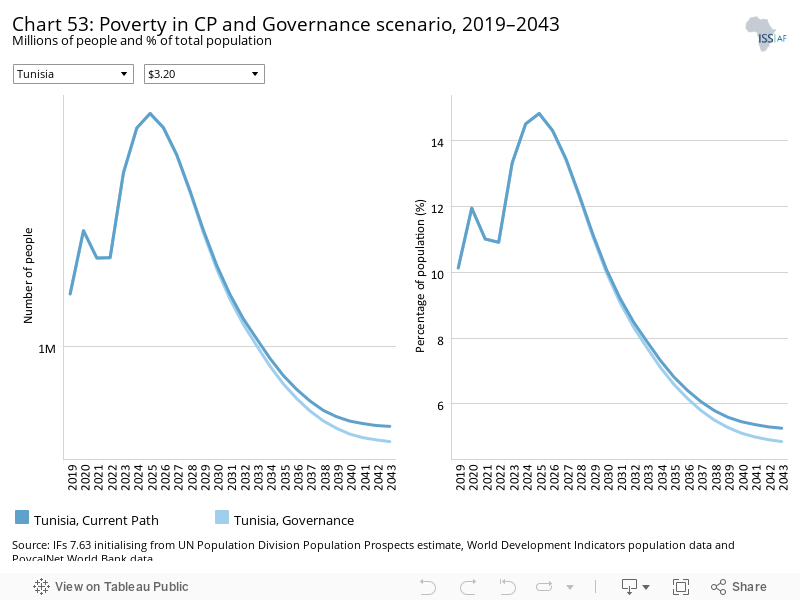
- Chart 53: Poverty in CP and Governance scenario, 2019–2043
- Chart 54: Carbon emissions in CP and scenarios, 2019–2043
- Chart 55: GDP per capita in CP and scenarios, 2019–2043
- Chart 56: GDP per capita in CP and Combined scenario, 2019–2043
- Chart 57: Poverty in CP and Combined scenario, 2019–2043
- Chart 58: Value added by sector in CP and Combined scenario, 2019–2043
- Chart 59: GDP in CP and Combined scenario, 2019–2043
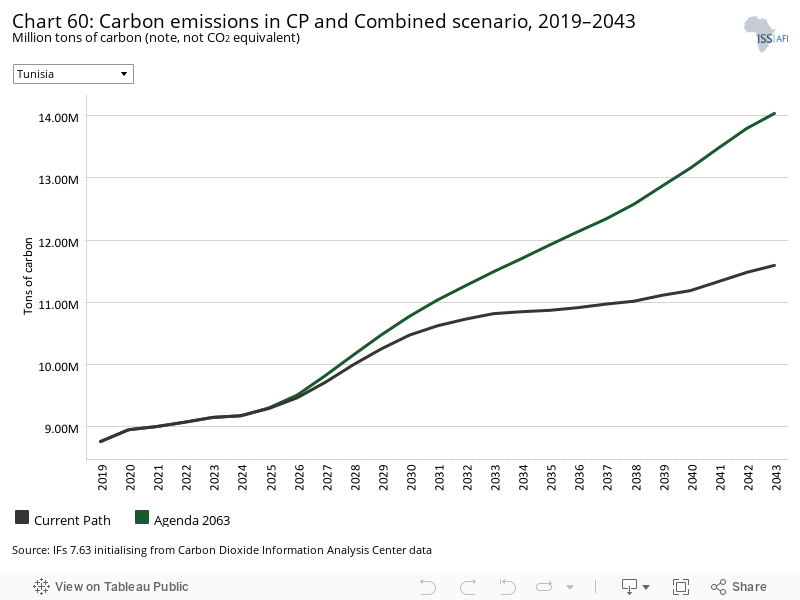
- Chart 60: Carbon emissions in CP and Combined scenario, 2019–2043


This page provides an overview of the key characteristics of Tunisia along its likely (or Current Path) development trajectory. The Current Path forecast from the International Futures forecasting (IFs) platform is a dynamic scenario that imitates the continuation of current policies and environmental conditions. The Current Path is therefore in congruence with historical patterns and produces a series of dynamic forecasts endogenized in relationships across crucial global systems. We use 2019 as a standard reference year and the forecasts generally extend to 2043 to coincide with the end of the third ten-year implementation plan of the African Union’s Agenda 2063 long-term development vision.
Tunisia is a country in North Africa, bordered by Algeria to the west and south-west, Libya to the south-east and the Mediterranean Sea to the north and east. The country covers an area of 163 610 km². The capital and largest city is Tunis, located on the north-eastern coast of the country. The main languages spoken are Tunisian Arabic, Berber and French.
After gaining independence from France in 1956, Tunisia was ruled by Prime Minister and later President Habib Bourguiba, who embarked on an expansive social and state-led development model including the development of a more gender-equitable society, compared to its peers in North Africa and the Middle East. However, the progress made since independence on various indices such as years of education, women’s rights and the generally positive macroeconomic indicators concealed a widespread sense of frustration that had risen over time.
Despite performing better than most lower-income countries in many human development indicators, and in fact mirroring the characteristics of an upper middle-income country, Tunisia has not achieved the expected economic growth and income that comes with its relatively good human capital.
The dearth of and unequal access to economic opportunities manifested in high and rising youth unemployment and pervasive corruption. The closed economic and political system is, therefore, one of the most important factors in understanding the events that led to the Freedom and Dignity Revolution in Tunisia at the end of December 2010 and the associated events of the Arab Spring. Today, Tunisia is the only country in the region that has transitioned to a democracy as a result of these events, but it finds itself assailed by a range of domestic and regional challenges. Instead of a robust economy and improved livelihoods, the general sense is one of economic frustration and disaffection with the inability of its leadership and democracy to improve governance and livelihoods.
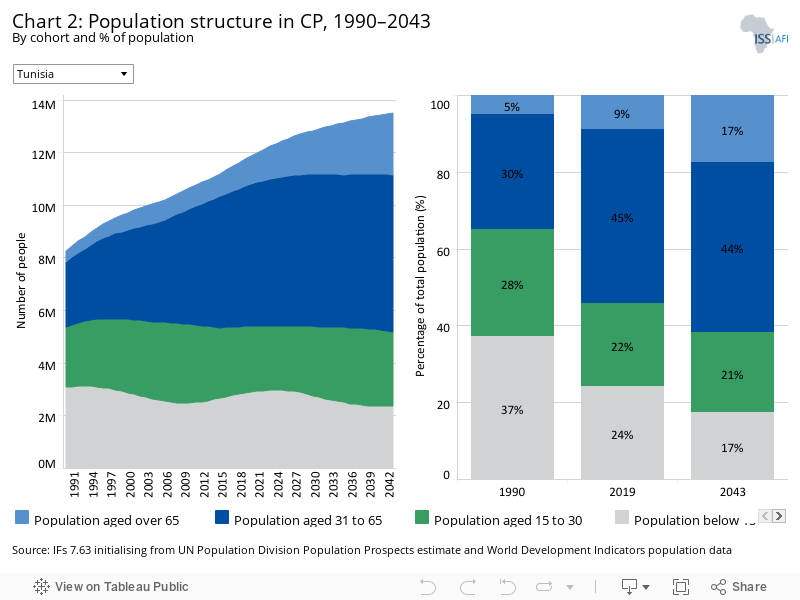
Tunisia’s population was estimated at 11.7 million in 2019 and is expected to increase to 13.5 million by 2043. Evident in Chart 2 is the rapid increase in the size of Tunisia’s working-age population (15–64 years) in the years preceding the Freedom and Dignity Revolution in 2010. The large portion of the working-age population from 1980 to 2006 contributed to the events that culminated in the ousting of President Zine El Abidine Ben Ali in January 2011.
Tunisia’s total fertility rate (TFR) is projected to fall below the replacement level of 2.1 children in the early 2020s, which will, in time, cause a slight decline in the size of the working-age population by 2043, although the country will still have a large proportion of its population aged between 15- and 64 years. Whereas in 2019 the working-age cohort constituted 67% of the population, in 2043 it will constitute about 65%. This demographic transition will also be accompanied by an increase in the elderly population. By 2043, the elderly population will account for about 17.5% of the total population. This will have implications on Tunisia’s economic productivity and health system owing to increased prevalence of non-communicable diseases that are inherently more expensive to diagnose and treat.
Tunisia reached its peak demographic dividend in 2011 when it had about 2.3 working-age persons for every dependant, i.e. 23 working people for every 10 dependants. By 2019, this ratio had declined to a rate of two people of working-age for every dependant and is projected to increase slightly between 2039 and 2040 before gradually declining. Tunisia is one of only eight African countries that should be benefiting from a demographic dividend (generally, a ratio of 1.7 working-age persons to dependants), but this favourable ratio, with regard to the contribution that labour makes to economic growth, is not, however, translating into income growth, as would be expected.
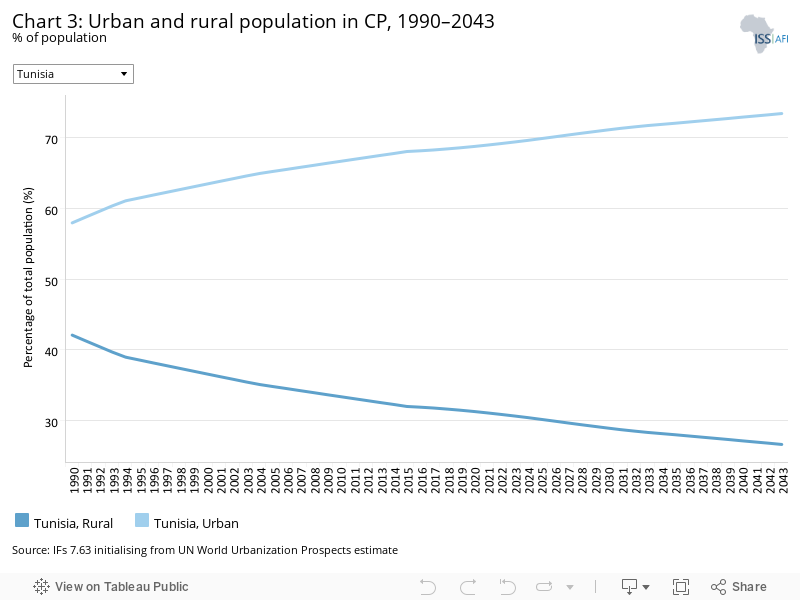
Tunisia has consistently had a larger urban population than the averages in the region and is about 20 percentage points more urban than the average for lower middle-income countries globally and in Africa. Contrary to the experience there, these high levels of urbanisation have not contributed to more equitable income growth as would be expected; however, they have assisted in the provision of more education and delivery of better basic infrastructure services.
It is forecast that the majority of the population will still live in urban areas, and by 2043 the rate will reach 73.4% with fewer people (26.7%) residing in rural areas by then, as shown in Chart 3.
Tunisia is one of the most urbanised countries in Africa and in the North African region at 68.6% in 2019. The three main metropolises are in the regions of Greater Tunis, Sfax and Sousse, which account for 85% of GDP. Most investments are also concentrated in coastal cities where about 75% of the population lives. The smaller inland cities lag in infrastructure and other basic services, thus causing disparities between regions in Tunisia.
Tunisia’s poor economic performance is rooted in its highly protective regulatory environment, the dominance of state-owned enterprises, outdated regulations, corrupt customs, lack of competition, problematic labour laws and its constrained socio-political space that all promote exclusion and inequalities. Collectively, these impede greater productivity and growth.
Compared to the averages for lower middle-income countries, labour and capital contribute the least to Tunisia’s growth and technology (or multifactor productivity) makes the greatest contribution. The reason for labour’s low contribution is that Tunisia’s labour participation rate is significantly below the averages for its peer groupings, with the rate of female participation in the economy significantly below that of males. Capital investment in the economy is also significantly below its peer groupings.
In the decade since the revolution, Tunisia’s development strategy has emphasised private sector development for economic growth and job creation, a vibrant civil society and strong international partnerships.[1World Bank, 2016, Tunisia Country Strategy 2016–2020] However, little progress has been made and the country struggles with the burden of high unemployment, rising expenditure and public debt, inflation, dwindling foreign reserves and unsustainable subsidies, particularly in the energy sector.
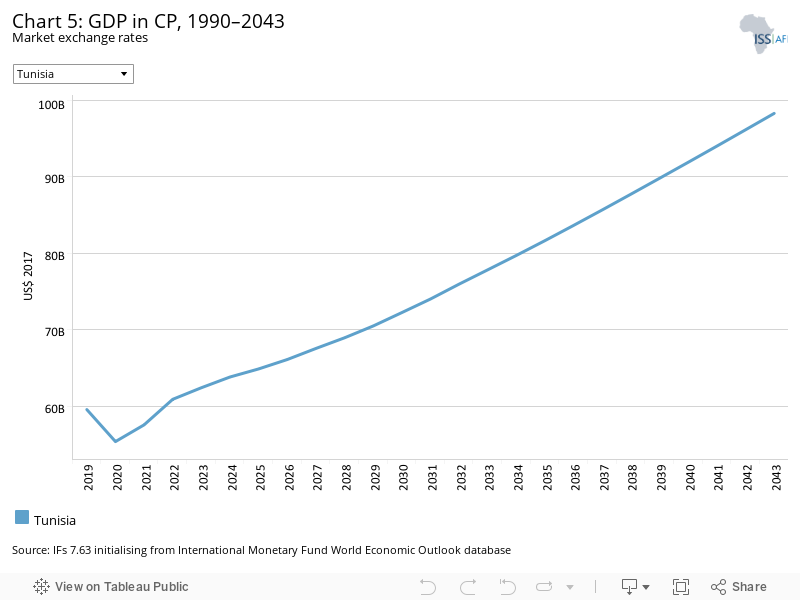
In the Current Path forecast, Tunisia will experience an average annual economic growth rate of just over 2.1% between 2020 and 2043. In 2019, GDP was US$59.5 billion, whereas by 2043 the economy will be US$98.3 billion.
Although many of the charts in the sectoral scenarios also include GDP per capita, this overview is an essential point of departure for interpreting the general economic outlook of Tunisia.
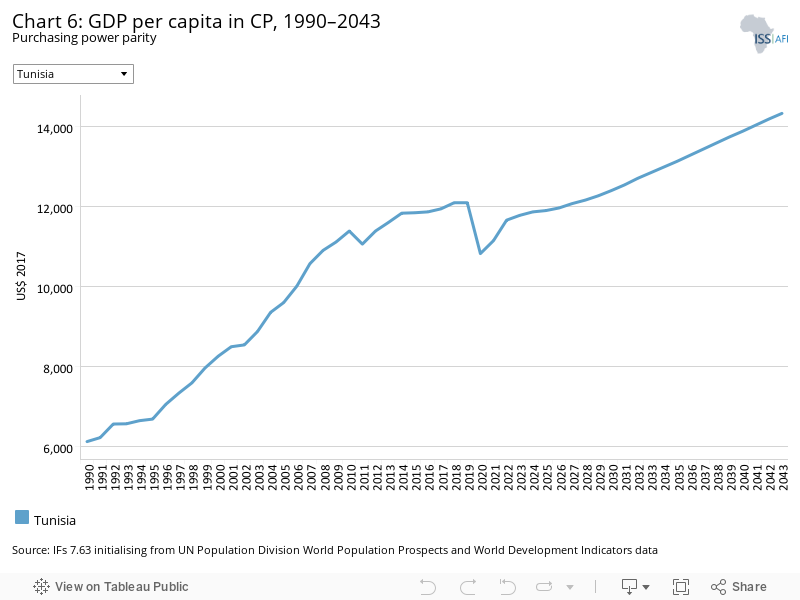
Tunisia’s per capita income is ranked tenth highest in Africa and it is significantly above the average for lower-income countries in Africa and globally. It has increased significantly over the years, particularly prior to 2010, but has shown a slight decline and even stagnation in the last decade. Per capita income is, however, forecast to modestly decline in the next few years owing to the effects of the COVID-19 pandemic, only to return to its 2019 levels by around 2026. Thereafter, per capita income is forecast to increase but quite modestly and will in fact trend towards convergence with the average of lower middle-income countries. This dynamic is concerning, given Tunisia’s significant human capital endowment which should enable significantly more rapid growth in income.
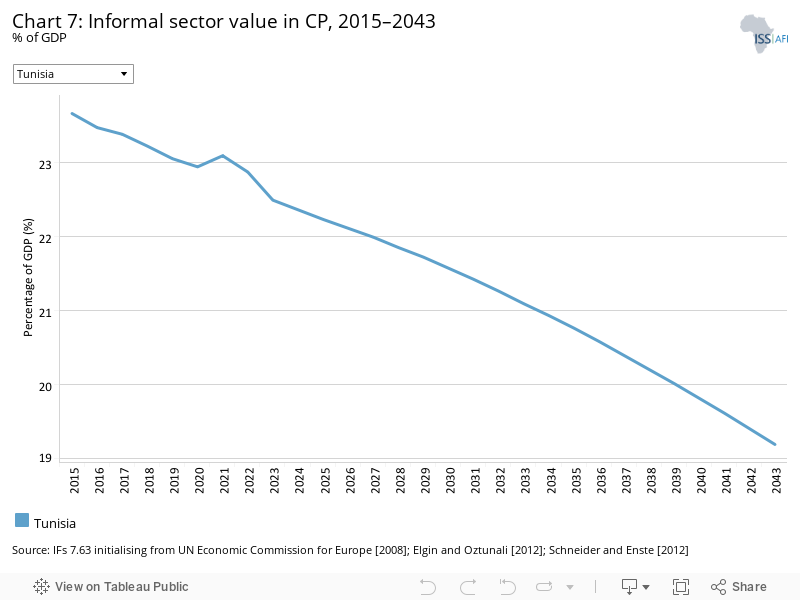
Tunisia has a significant informal and parallel economic sector that is substantially larger than the average for lower middle-income economies in Africa but below the global average for this grouping when measured as a portion of the total economy. This is in part due to a mismatch in skills and economic opportunities available in the country and the nature of the economy which is primarily state-led, with high levels of monopoly dominance and limited entrepreneurial opportunity. As a result, many Tunisians are forced to engage in the informal sector in spite of their high levels of education—women in particular. A World Bank study notes that 60% of Tunisia’s graduates end up in the informal sector or unemployed. This high level of informality constrains growth, as the informal sector is generally less productive than the formal sector and makes a smaller contribution to taxes. The informal sector’s contribution is expected to decline slowly to reach 19.2% in 2043 from 23.1% in 2019, reflecting a drop of about 3.9 percentage points over a 24-year time period horizon.
The high level of informality constrains growth as the informal sector is generally less productive than the formal sector and makes a smaller contribution to taxes and overall government revenue.
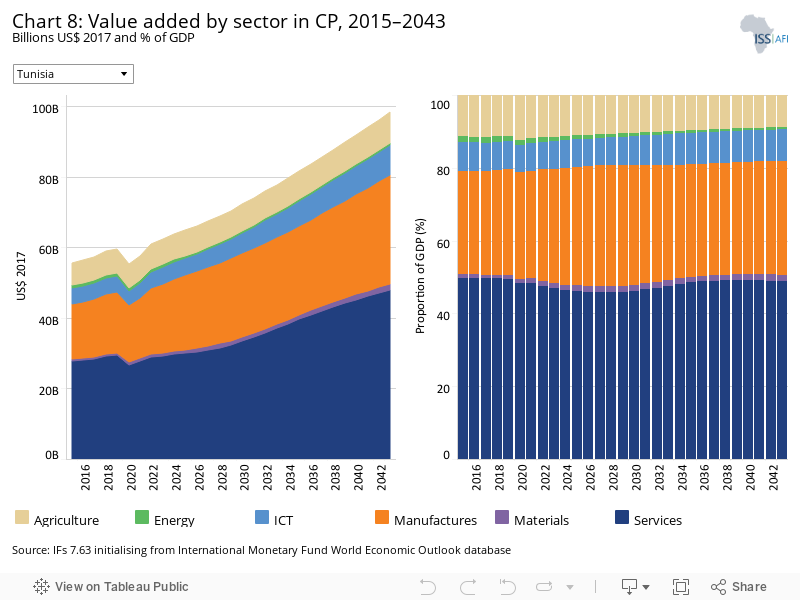
The IFs platform uses data from the Global Trade and Analysis Project (GTAP) to classify economic activity into six sectors: agriculture, energy, materials (including mining), manufactures, services and information and communications technology (ICT).
Going by the various sectoral components that make up the economy, the services sector was the largest contributor to GDP in 2019 at 49% (although other research estimates it is between 50% and 60%), followed by manufacturing at 29%. Agriculture (at 11.3%) is followed by ICT and energy, although the contribution of energy will likely be overtaken by materials (i.e. construction and mining).
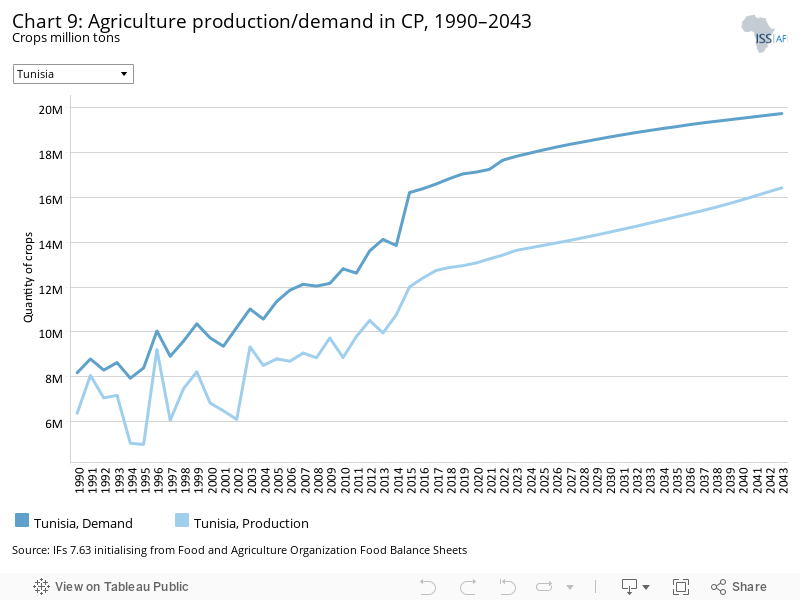
The data on agricultural production and demand in the IFs forecasting platform initialises from data provided on food balances by the Food and Agriculture Organization (FAO). IFs contains data on numerous types of agriculture but aggregates its forecast into crops, meat and fish, presented in million metric tons. Chart 9 shows agricultural production and demand as a total of all three categories.
Agriculture still plays an important role in the economy, especially for the rural poor. However, agricultural demand long outstripped production in around 1970. Owing to the deficit in production and unmet food demand, the country relies heavily on imports.
From a food security perspective, Tunisia is vulnerable to shocks such as fluctuating international prices and disruptions in supply chains. Declining foreign exchange reserves make the food security situation more precarious because Tunisia’s capacity to import food will be affected.
There are numerous methodologies and approaches to defining poverty. We measure income poverty and use GDP per capita as a proxy. In 2015, the World Bank adopted the measure of US$1.90 per person a day (in 2011 international prices), also used to measure progress towards the achievement of Sustainable Development Goal 1 of eradicating extreme poverty. To account for extreme poverty in richer countries occurring at slightly higher levels of income than in poor countries, the World Bank introduced three additional poverty lines in 2017:
- US$3.20 for lower middle-income countries
- US$5.50 for upper middle-income countries
- US$22.70 for high-income countries.
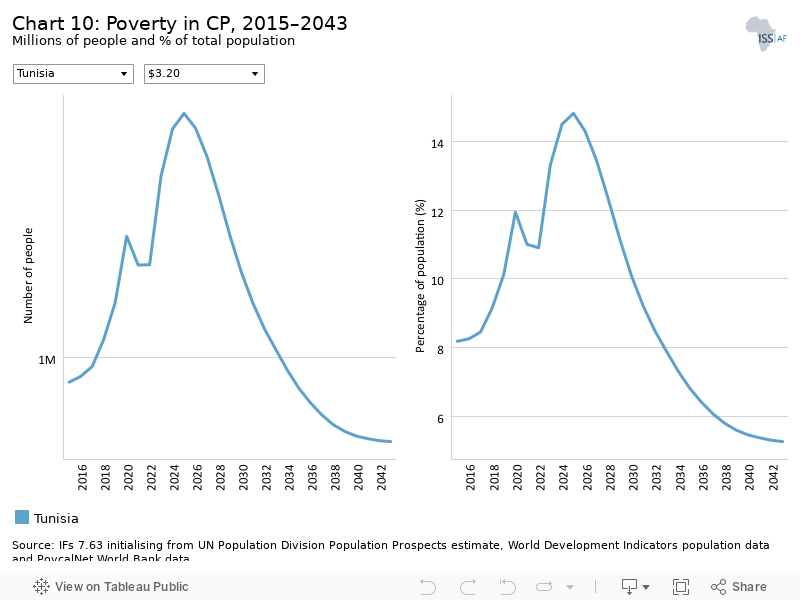
Tunisia has already achieved the headline sustainable development goal (SDG) of eliminating extreme poverty as measured at US$1.90 per person per day. In fact, less than 1% of its population falls below this level of income; however, other forms of poverty and social inequalities between regions and various segments of the population persist in the country.
Poverty levels at other thresholds, i.e. the World Bank’s US$3.20 lower middle-countries, will persist into the future. Although subsidies have played a role in poverty reduction in Tunisia, reform of the subsidy system, with more targeted social safety net programmes, is needed for more effective reduction of poverty and inequality in the country.
In fact, poverty is set to increase to 2025 before resuming a downward trend. Thereafter, extreme poverty (at US$3.20) is expected to decline, although by 2043, about 5.3% of the population (or 710 000 people) will still be living in poverty, which is an improvement from 1.42 million people in 2019.
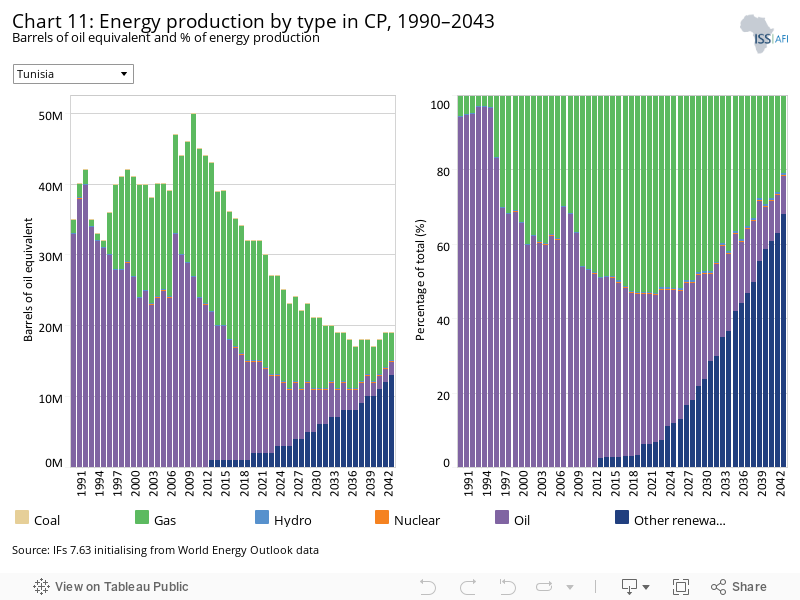
The IFs platform forecasts six types of energy, namely oil, gas, coal, hydro, nuclear and other renewables. To allow comparisons between different types of energy, the data is converted into billion barrels of oil equivalent. The energy contained in a barrel of oil is approximately 5.8 million British thermal units (MBTUs) or 1700 kilowatt-hours (kWh) of energy.
Gas and oil are the leading sources of energy in Tunisia although their production is forecast to gradually decline while that of other renewable energy sources is forecast to increase. Currently, about 97% of Tunisia’s electricity generation comes from fossil fuels, mostly from domestic and imported natural gas, almost half of which comes from Algeria. By 2035, other renewable energy sources are projected to be the main source of energy.
The energy sector is heavily subsidised and comes at a high cost for the Tunisian government. Reforming the sector and offering greater incentives for the development and uptake of renewables would alleviate the fiscal pressure on the government and more rapidly move Tunisia towards a greener economy in light of climate change and the impact of fossil fuels on the environment.
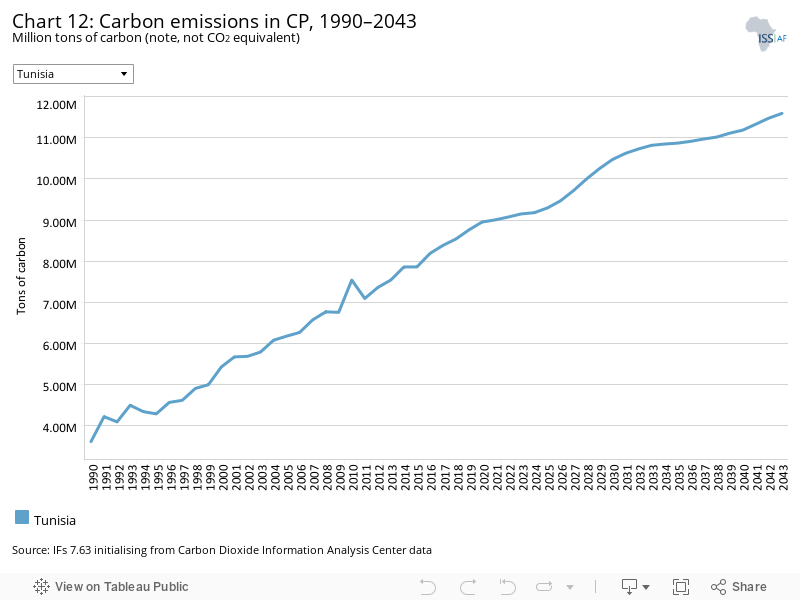
Carbon is released in many ways, but the three most important contributors to greenhouse gases are carbon dioxide (CO2), carbon monoxide (CO) and methane (CH4). Since each has a different molecular weight, IFs uses carbon. Many other sites and calculations use CO2 equivalent.
Tunisia, like the rest of the world, is vulnerable to climate change, and owing to the growing population over the years as well as increased economic activity and energy consumption, CO2 emissions have increased in the atmosphere.
Tunisia is highly exposed to the impacts of climate change which will impact all aspects of life in the country. With 84% of its population located along its 1150 km coastline, sea level rise, floods, coastal erosion, increase in the temperature of fishing waters and droughts are amongst the more urgent threats that the country faces. Aside from economic disruption, displacement of people, especially the vulnerable, will likely occur unless improved disaster risk management systems are put in place. Climate change will also directly impact health and agriculture in Tunisia. Climate-related risks in the future will include higher mortality rates from extreme heat, increased malnutrition from crop failure, potential increased spread of diseases and lack of access to clean water. From an agricultural perspective, climate risks to the sector include the decrease in crop yields, a shift in growing seasons, the degradation of soil quality, increased salinisation of aquifers, the decreased availability of water for irrigation and higher food prices.
To avoid future water shortages, for example, Tunisia needs to reduce inefficiency in water use by modernising infrastructure, implementing modern farming practices and launching public awareness campaigns on sustainable water use.
By 2043, the country will be emitting 12 million tons of carbon compared to 9 million tons emitted in 2019. This is a direct result of economic activity and illustrates the trade-offs that policymakers need to grapple with while thinking about economic development and environmental sustainability.
However, because the effects of climate change are already evident, Tunisia will need to create policies and regulatory frameworks that adequately balance and support economic, social and environmental sustainability.
Sectoral Scenarios for Tunisia
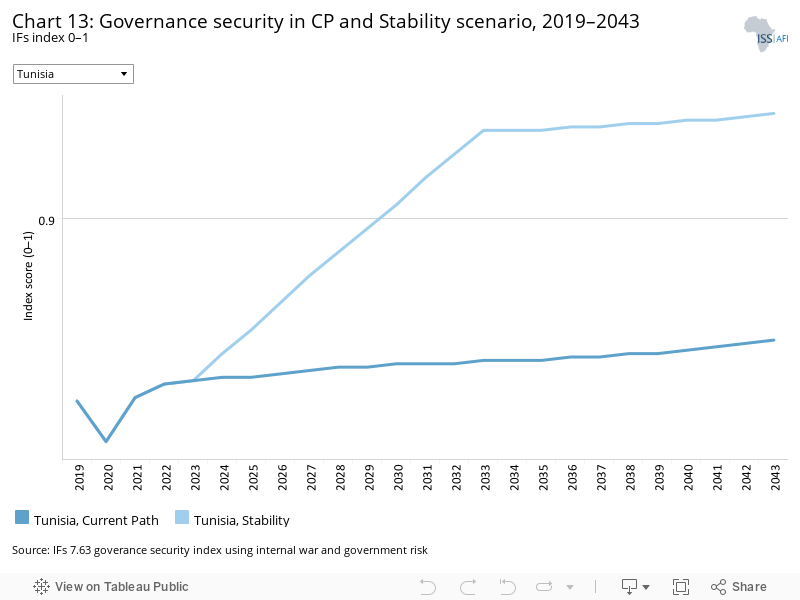
Download to pdfThe Stability scenario represents reasonable but ambitious reductions in risk of regime instability and lower levels of internal conflict. Stability is generally a prerequisite for other aspects of development and this would encourage inflows of foreign direct investment (FDI) and improve business confidence. Better governance through the accountability that follows substantive democracy is modelled separately.
The intervention is explained in here in the thematic part of the website.
Socio-political and economic stability are requisite factors for sustainable development in Tunisia. Issues around domestic security, challenges in consolidating democratic institutions and the fragmented political establishment are testament to the political and economic development uncertainties ahead. Without political consensus, trust and comprehensive structural reforms, the goals and promises of the Jasmine Revolution will remain elusive for Tunisia.
Given the turbulence in the country since December 2010 and the civil war in neighbouring Libya, regional instability feeds off Tunisia’s large shadow economy and rampant smuggling in southern border towns such as Ben Guerdane.
In a scenario where political and social consensus/contract is achieved, stability, as demonstrated in the governance security index (which ranges from 0 to 1, where 0 is unstable and 1 is stable), improves to 0.93 compared to 0.86 in the Current Path forecast in 2033. Such an improvement would require much greater internal stability and, from a regional perspective, an end to the civil war in Libya.
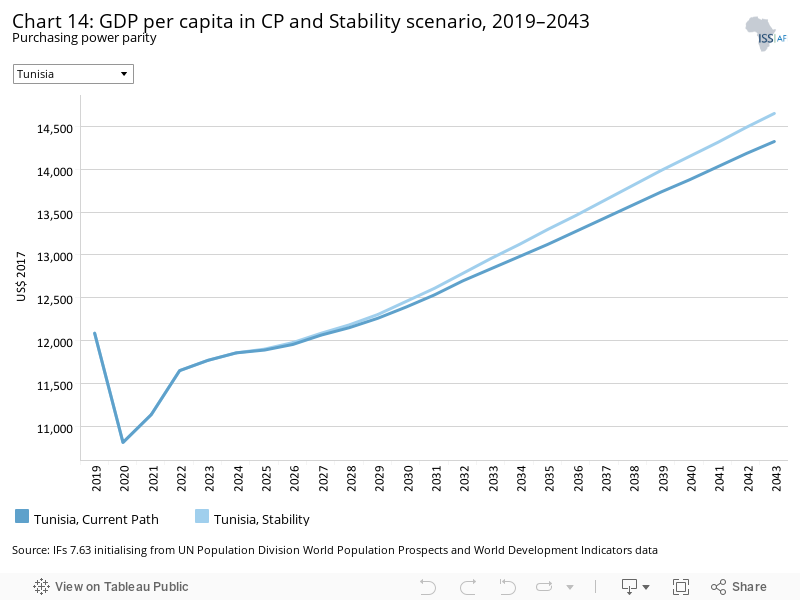
In this scenario, GDP per capita increases by about 1.5%, representing US$185 more in the pocket of the average Tunisian relative to the Current Path forecast at US$12 840 in 2033. By 2043, per capita income in the Stability scenario is estimated at US$14 835 compared to US$14 323 in the Current Path forecast.
Additionally, a more stable political and policy environment would increase investor confidence and encourage capital flow in the form of FDI into the country. Such investments would likely also create jobs thus increasing income levels in the country.
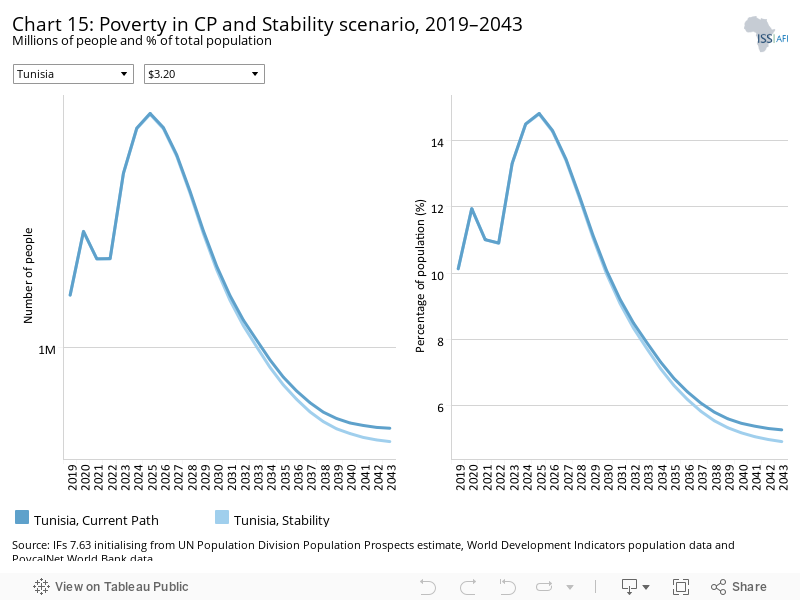
At the US$3.20 poverty threshold, Tunisia will have 40 000 fewer people in poverty, compared to the Current Path forecast at 1.03 million in 2033 (i.e. 7.9% poverty rate in the Current Path forecast compared to 7.6% in the Stability scenario). By 2043, only about 4.7% of the population will be living under the US$3.20 poverty line, compared to 5.3% in the Current Path forecast (710 000 people in the Current Path forecast and 637 000 in the Stability scenario).
Political consensus creates a more stable environment for people to look for and engage in meaningful economic activity that alleviates poverty.
This section presents the impact of a Demographic scenario that aims to hasten and increase the demographic dividend through reasonable but ambitious reductions in the communicable-disease burden for children under five, the maternal mortality ratio and increased access to modern contraception.
The intervention is explained in here in the thematic part of the website.
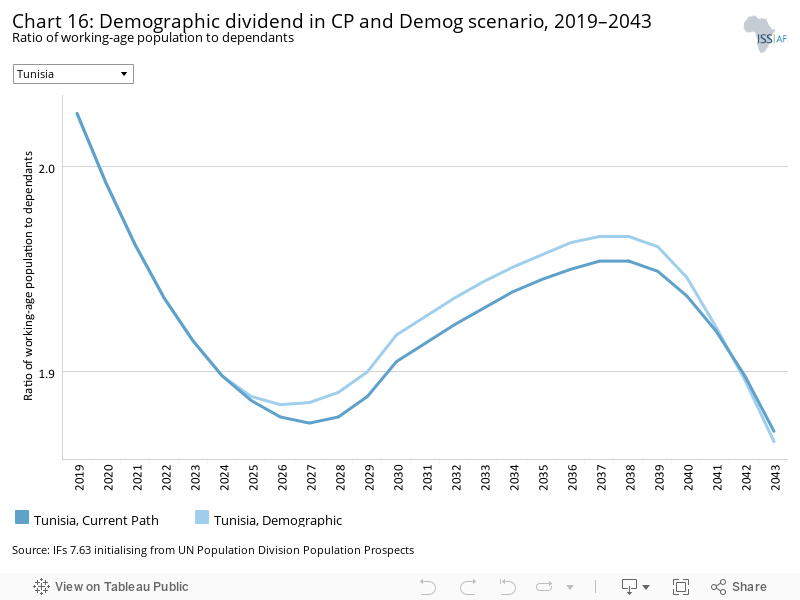
Demographers typically differentiate between a first, second and even a third demographic dividend. We focus here on the first dividend, namely the contribution of the size and quality of the labour force to incomes. It refers to a window of opportunity that opens when the ratio of the working-age population (between 15 and 64 years of age) to dependants (children and the elderly) reaches 1.7.
Interventions in this scenario significantly improve the demographic dividend of Tunisia and by 2037 the country will experience a second peak at 1.97 working-age persons per dependant (a slightly lower peak than 2.25 in 2011). This means that for every 197 working-age persons there will be 100 dependants, compared to the Current Path’s 1.95 for every dependant by then.
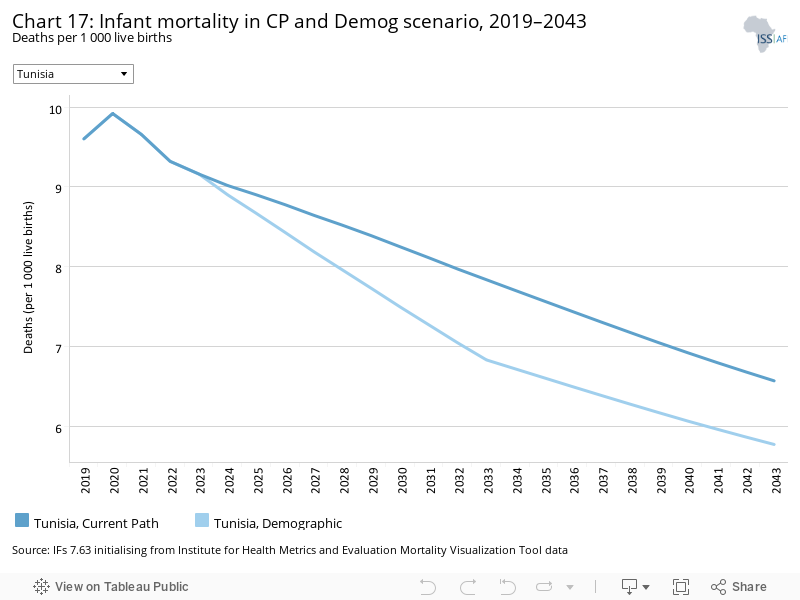
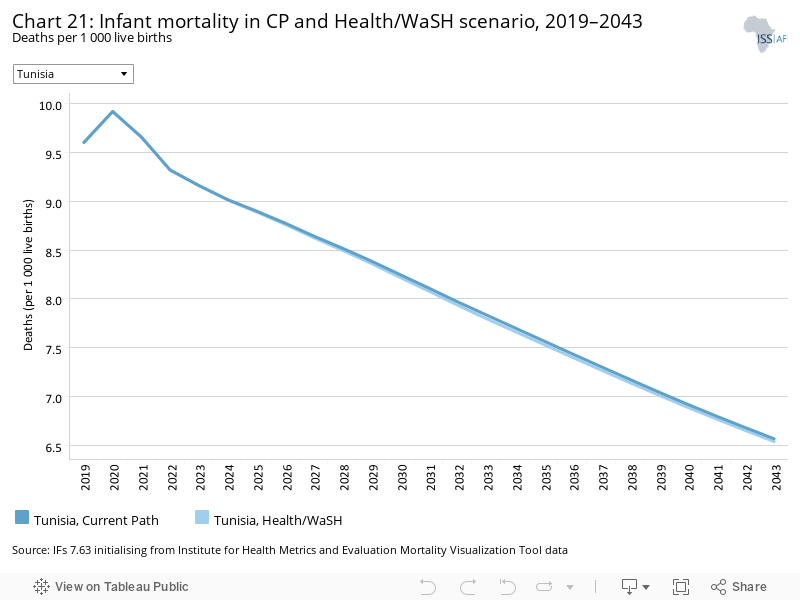
The infant mortality rate is the number of infant deaths per 1 000 live births and is an important marker of the overall quality of the health system in a country.
Tunisia has already met the 2030 SDG target to reduce infant mortality to 25 deaths per 1 000 live births. The Demographic scenario reduces infant mortality to 6.8 deaths per 1 000 live births compared to 7.8 in the Current Path forecast by 2033. By 2043, the infant mortality rate is 5.8 relative to 6.6 in the Current Path forecast.
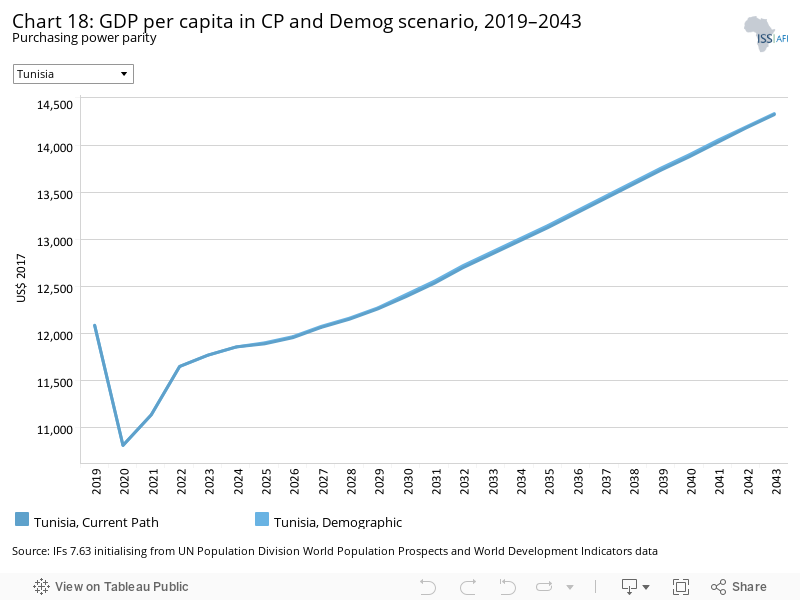
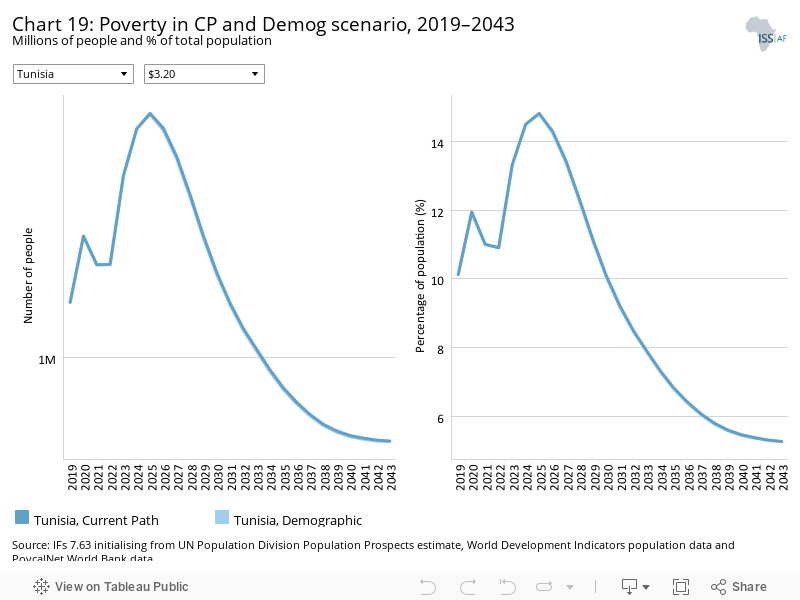
The impact of the Demographic scenario on per capita income is negligible, indicative of the fact that Tunisia has above average reproductive health indicators and a relatively stable population growth. The challenge to development is largely around the dearth of economic opportunities for its relatively good stock of human capital.
This section presents reasonable but ambitious improvements in the Health/WaSH scenario, which include reductions in the mortality rate associated with both communicable diseases (e.g. AIDS, diarrhoea, malaria and respiratory infections) and non-communicable diseases (NCDs) (e.g. diabetes), as well as improvements in access to safe water and better sanitation. The acronym WaSH stands for water, sanitation and hygiene.
The intervention is explained in here in the thematic part of the website.
Tunisia introduced free healthcare on independence and has since made significant investments in the sector. As a result, it is estimated to have gone through its epidemiological transition during the late 1960s and early 1970s. Since then, non-communicable diseases (NCDs) have been the primary cause of death, replacing communicable diseases.
The country’s health system is mostly burdened by NCDs which are the result of urbanisation and lifestyle change and are mostly prevalent amongst older cohorts of the population. NCDs are inherently more expensive to diagnose and treat and will present challenges to the country’s health system owing to its ageing population.
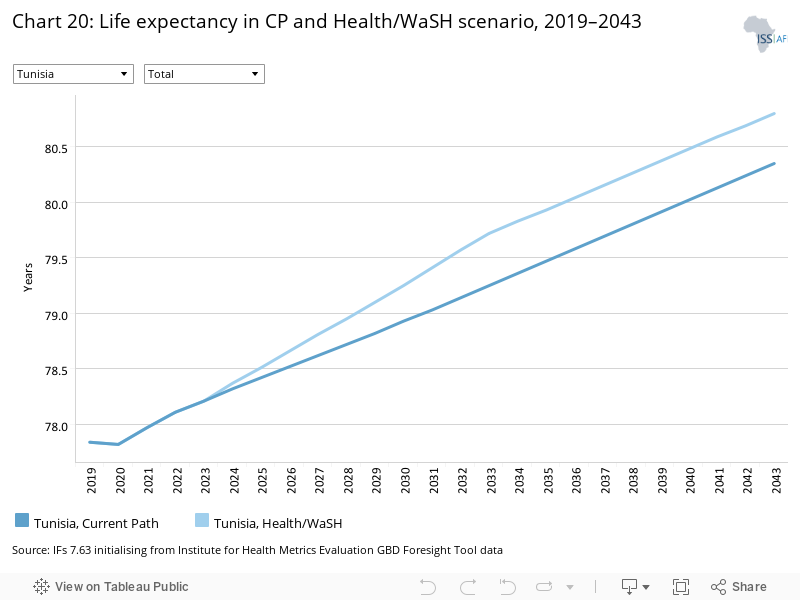
Generally, Tunisia’s health indicators perform well. Life expectancy is high and was about 76 years in 2019 and is projected to improve to about 80.3 years by 2043 in the Current Path forecast. In this scenario, life expectancy reaches 80.8 years by 2043, nearly four years above the global average. Unsurprisingly, female life expectancy is consistently higher than that of males in both the Current Path forecast and the Health/WaSH scenario.
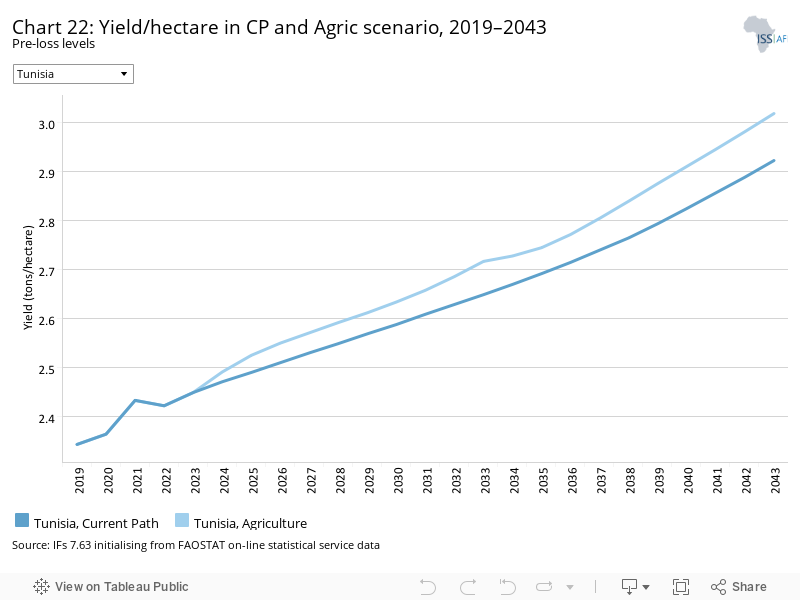
The Agriculture scenario represents reasonable but ambitious increases in yields per hectare (reflecting better management and seed and fertilizer technology), increased land under irrigation and reduced loss and waste. Where appropriate, it includes an increase in calorie consumption, reflecting the prioritisation of food self-sufficiency above food exports as a desirable policy objective.
The intervention is explained in here in the thematic part of the website.
The data on yields per hectare (in metric tons) is for crops but does not distinguish between different categories of crops.
Agriculture is an important element of the Tunisian economy. It is one of the world’s largest producers and exporters of olive oil and one of the few African countries that is fully self-sufficient in dairy products, vegetables and fruit but heavily dependent upon imports of wheat. The sector contributes about 12% of GDP and employs roughly 16% of Tunisia’s labour force. Food dependence exceeded 55% of consumption in 2019.
Interventions in the Agriculture scenario increase crop yields by about 2.6% from 2.72 tons per hectare in the Current Path forecast in 2033. By 2043, yields will reach about 3.02 tons per hectare compared to 2.92 in the Current Path forecast. This scenario shows the agricultural potential that could be harnessed with a more efficient agricultural system.
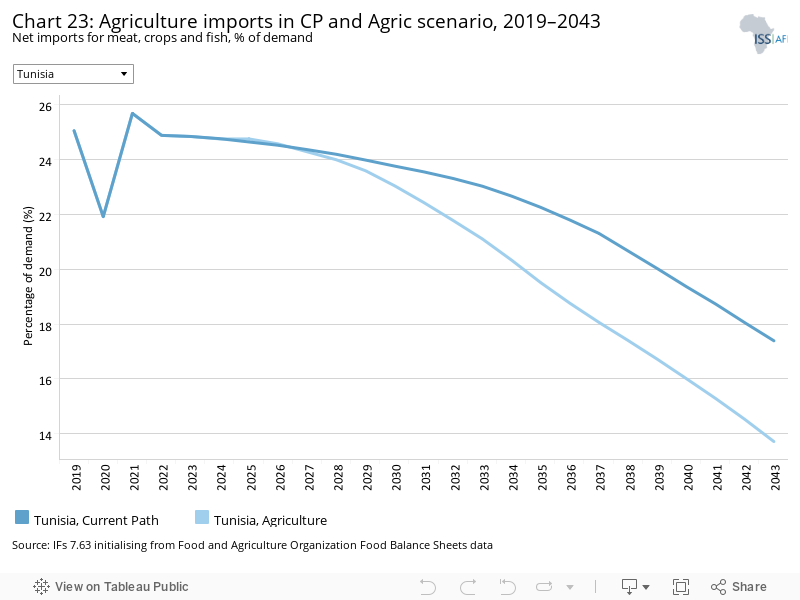
Improved agricultural yields also impact the level of import dependence in the country. In this scenario, Tunisia becomes a net exporter of agricultural products by 2035. From a food security perspective, this is much more favourable for the country as it would no longer be vulnerable to international price shocks and would adequately meet the food demands of its population.
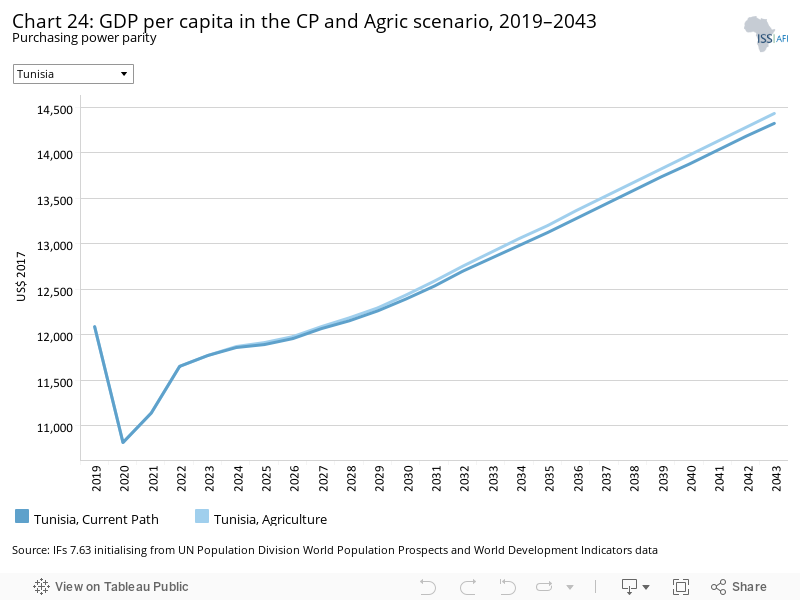
The contribution of agriculture to GDP is already forecast to decline although the sector is still vital for those living in rural areas where agriculture is still the main economic activity. As such, GDP per capita improves slightly in this scenario. GDP per capita will be US$65 and US$109 higher compared to the Current Path forecast for 2033 and 2043, respectively.
Agriculture is one of the most effective ways to lift people out of extreme poverty, especially in a rural context, and in Tunisia, this scenario reduces the number of people in extreme poverty (US$3.20) from nearly 1.03 million people (7.9% of the population) to 1 million (7.7%) in 2033. By 2043, 21 000 fewer people than in the Current Path forecast (689 000 people) would be in extreme poverty.
The Education scenario represents reasonable but ambitious improved intake, transition and graduation rates from primary to tertiary levels and better quality of education. It also models substantive progress towards gender parity at all levels, additional vocational training at secondary school level and increases in the share of science and engineering graduates.
The intervention is explained in here in the thematic part of the website.
Tunisia has achieved remarkable progress in education outcomes since independence by investing in pre-primary education and making education free and compulsory for students aged six to 16. At present, Tunisia has the second most educated population in North Africa after Libya and ranks ninth on the continent, as measured by the average years of education attained by Tunisian adults (15 years and older).
The considerable number of well-educated young Tunisians without economic opportunities contributed to the Freedom and Dignity Revolution. Bottlenecks are, however, starting to emerge at the upper secondary and tertiary level.
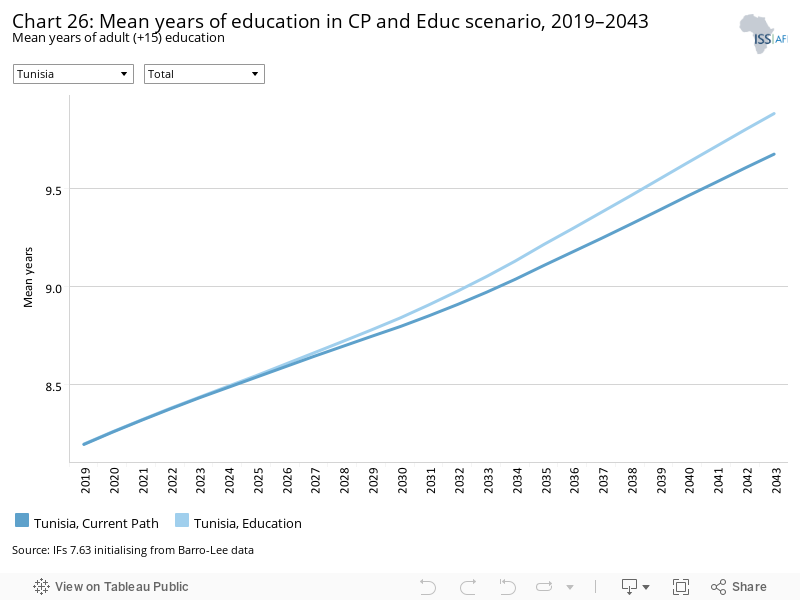
The mean number of years of education helps to gauge the stock of human capital in a population. Owing to how long the benefits of education take to manifest, improvements in educational indicators are slow. In this scenario, the mean years of education as shown in Chart 26 will be 9.9 years compared to 9.7 in the Current Path forecast in 2043. The mean number of years of female education will stand at 9.8 years against 10 years for males. This demonstrates the gender disparity that still exists in the education system in Tunisia, although beyond the secondary level, female students persist and perform better than their male counterparts (inverse gender disparity).
Beyond improvements in the total number of students with access to education, the quality of primary education improves by 6.1 percentage points from 38.7 in the Current Path forecast by 2033, and secondary school test scores surpass the 50th mark by 2028. By 2043, primary test scores reach 47.1 compared to 40.4 in the Current Path forecast, while secondary test scores reach 58, relative to 48.4 in the Current Path forecast. These improvements would be attributed to improved curriculums, better learning facilities and supplies, improved teacher-student ratio and well-trained instructors.
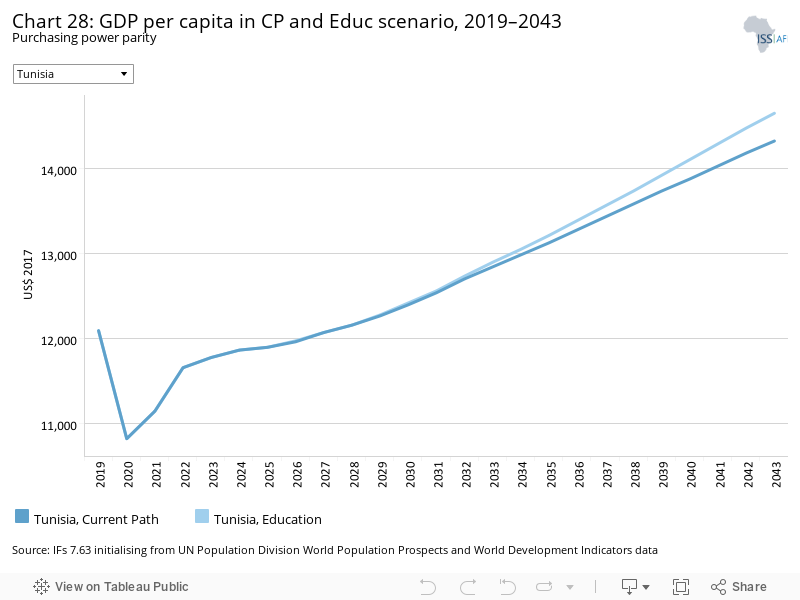
Because of the protracted nature of formal education and the time it takes for it to impact the income level of an individual and increase productivity in the economy, per capita income improves slowly, and a significant increase is only recorded much later in the forecast horizon. By 2043, this scenario yields US$327 more for the average Tunisian than in the Current Path forecast at US$14 323.
In the scenario in Chart 29, reduction in income poverty also only manifests itself much more significantly towards 2043. By 2043, 71 000 fewer people will be living below the US$3.20 extreme poverty line, and this represents 4.73% of the population compared to 5.26% (639 000 people) in the Current Path forecast.
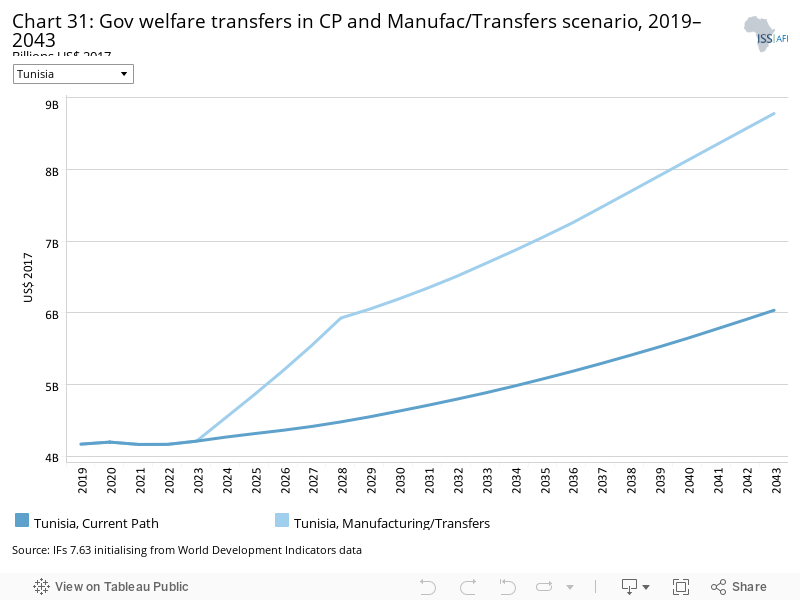
The Manufacturing/Transfers scenario represents reasonable but ambitious manufacturing growth through greater investment in the economy, investments in research and development, and promotion of the export of manufactured goods. It is accompanied by an increase in welfare transfers (social grants) to moderate the initial increases in inequality that are typically associated with a manufacturing transition. To this end, the scenario improves tax administration and increases government revenues.
The intervention is explained in here in the thematic part of the website.
Chart 31 should be read with Chart 8 that presents a stacked area graph on the contribution to GDP and size, in billion US$, of the Current Path economy for each of the sectors.
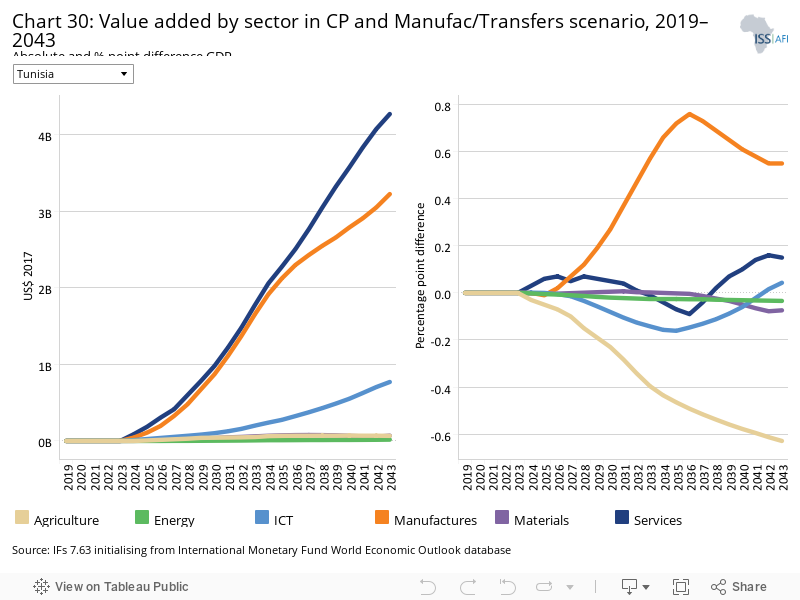
The manufacturing sector is important in creating employment, increasing productivity, changing the structure of an economy and ultimately reducing poverty. In this scenario, the contribution of manufacturing to GDP in Tunisia will increase from 29.1% of GDP in 2019 to 33.8% in 2038 and 31.9% in 2043. Although the difference in the 2043 forecast is only 0.5% of GDP in that year, it equates to a manufacturing sector that is US$3.2 billion larger than on the Current Path forecast in that year alone.
This scenario also increases welfare transfers to unskilled workers by US$2.8 billion over the Current Path forecast, reaching US$8.8 billion in 2043.
Targeted approaches are necessary for the effectiveness of such programmes to ensure they reach the poorest and most vulnerable in society.
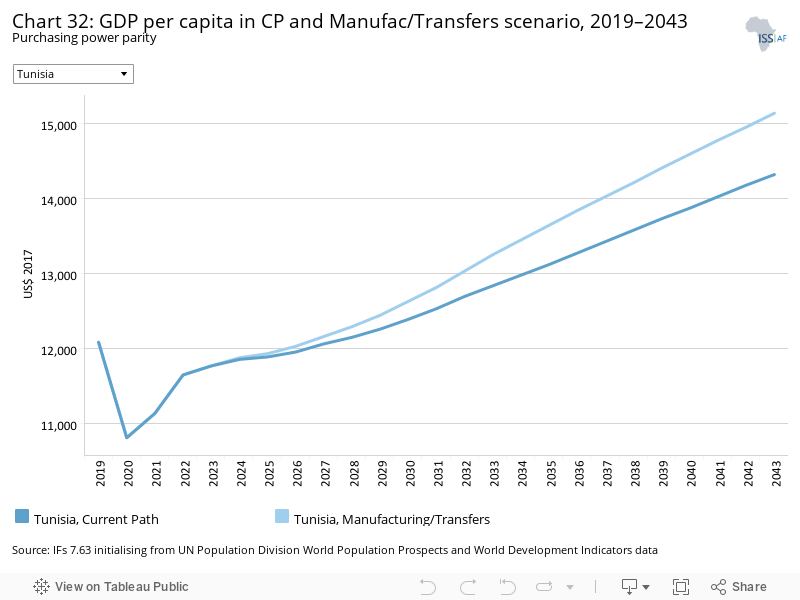
Owing to the intensive capital required to make investments in manufacturing, per capita income will increase slowly in the first few years. However, by 2033, GDP per capita will increase by US$414 relative to the Current Path’s US$12 840. By 2043, GDP per capita will be US$818 higher than on the Current Path forecast.
The combined impact of the Manufacturing/Transfers scenario only significantly affects poverty from 2024. By 2033, only 6.5% of the population (847 0000 people) will be living in extreme poverty at US$3.20 compared to 7.9% (1.03 million) in the Current Path forecast. By 2043, only about 3.1% of the population (416 000) would be in extreme poverty compared to 5.3% (710 000) in the Current Path forecast.
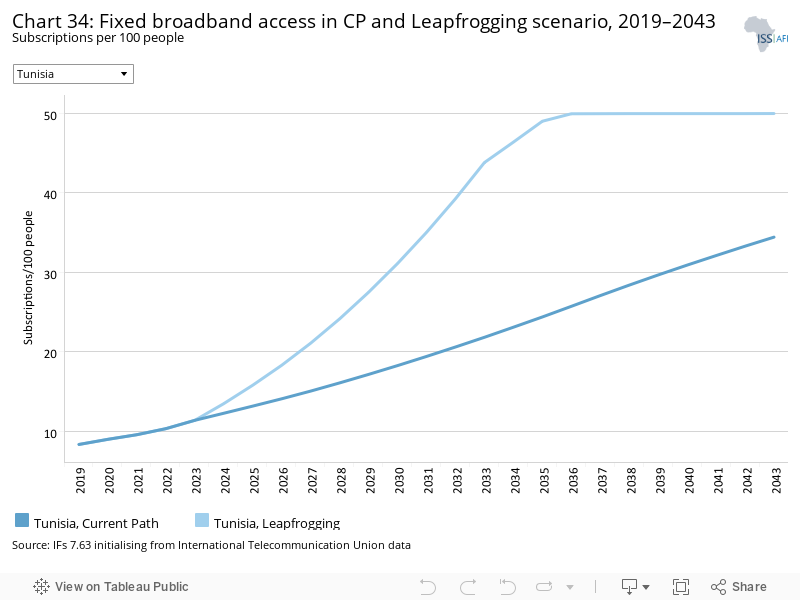
The Leapfrogging scenario represents a reasonable but ambitious adoption of and investment in renewable energy technologies, resulting in better access to electricity in urban and rural areas. The scenario includes accelerated access to mobile and fixed broadband and the adoption of modern technology that improves government efficiency and allows for the more rapid formalisation of the informal sector.
The intervention is explained in here in the thematic part of the website.
Fixed broadband includes cable modem Internet connections, DSL Internet connections of at least 256 KB/s, fibre and other fixed broadband technology connections (such as satellite broadband Internet, ethernet local area networks, fixed-wireless access, wireless local area networks, WiMAX, etc.).
Tunisia has great potential to improve its ICT sector for greater access to digital technology and innovation which can facilitate the country’s development process and preclude some of the traditional development catch-up processes.
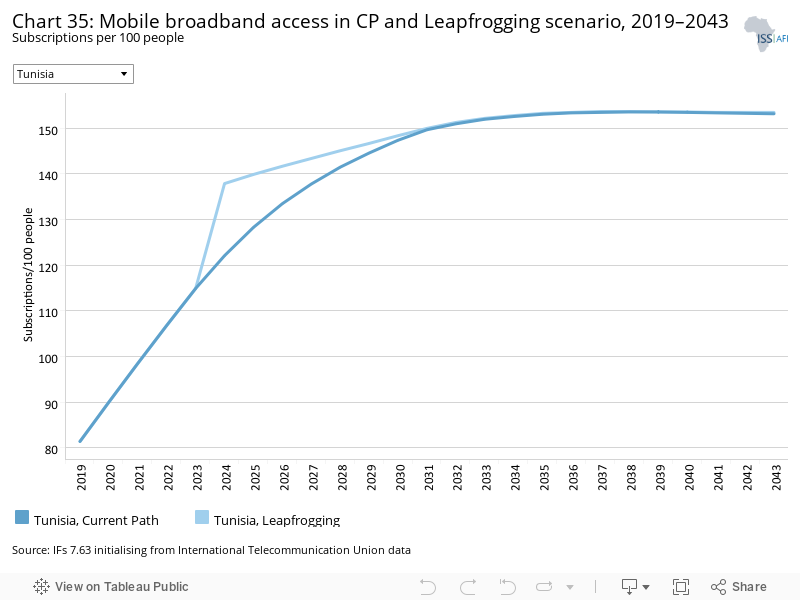
Tunisia already has one of the most developed telecommunications infrastructures in North Africa, with some of the continent’s highest market penetration rates. The mobile sector in particular has experienced exceptional growth since competition was introduced in 2002. By 2017, Tunisia had recorded 14.2 million mobile subscribers with over 124 subscriptions per 100 people. Forecasts in 2019 estimated that Tunisia had 15.1 million subscribers and 128.7 subscriptions per 100 people.
A nationwide fibre-optic backbone and international access via submarine cables have supported the rapid development of the Internet sector. In 2017, an estimated 7.4 million people were connected to mobile broadband and 2019 forecasts projected roughly 9.5 million people.
However, the sector is characterised by low levels of competition owing to high entry barriers. Because of limited competition and restrictions on inter-operator services, Tunisian consumers pay very high prices, which affect firms’ competitiveness and efficiency. As a result, ICT is largely confined to basic communications and not fully integrated into the economy. Tunisia is thus not reaping the full benefits of ICT, in spite of the fact that its value-added contribution to the economy is comparable to that in upper middle-income countries.
The Leapfrogging scenario increases subscriptions per 100 people on fixed broadband to 43.8 by 2033 compared to 21.8 in the Current Path forecast. By 2043, it is expected to reach about 50 subscriptions per 100 people, relative to 34.4 in the Current Path forecast. This is slightly higher than the average for lower-middle-income countries at 47.5 in the Leapfrogging scenario by 2043.
Mobile broadband refers to wireless Internet access delivered through cellular towers to computers and other digital devices.
Mobile broadband subscriptions are already saturated beyond the 100 mark and thus increases in this scenario are not as remarkable. Tunisia only performs marginally better than the average of lower middle-income countries which have also surpassed the 100 subscriptions mark.
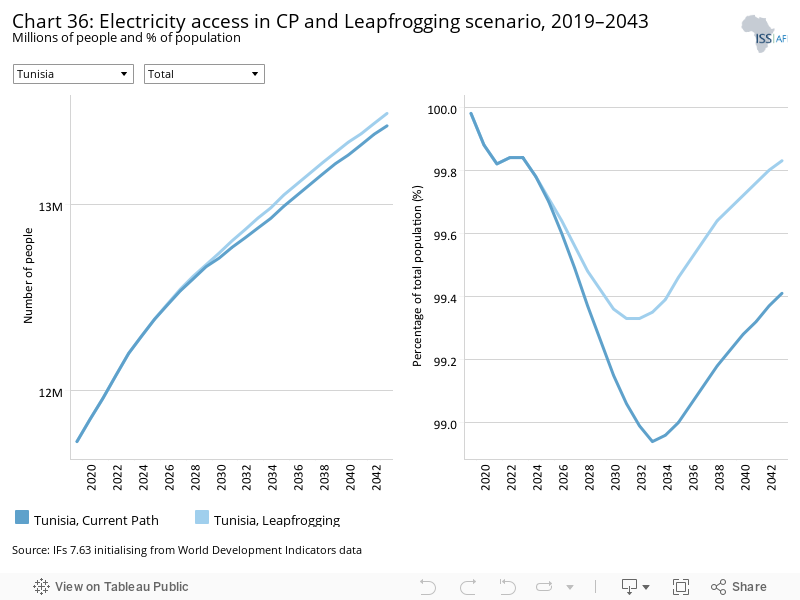
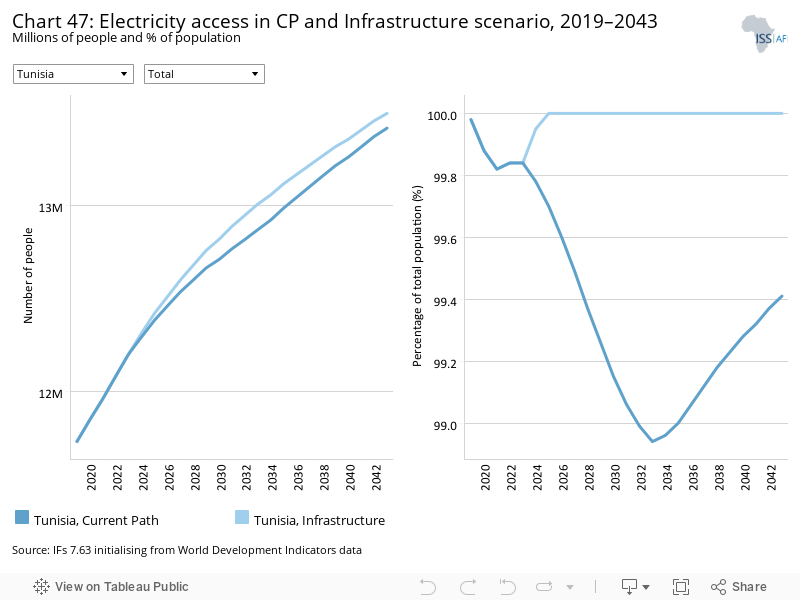
Tunisia has already achieved universal electricity access and thus the improvements are quite small in this scenario. By 2043, 100 000 more people will have access to electricity compared to 13.4 million people in the Current Path forecast. The largest increase will be observed in rural areas where there is still inadequate basic infrastructure.
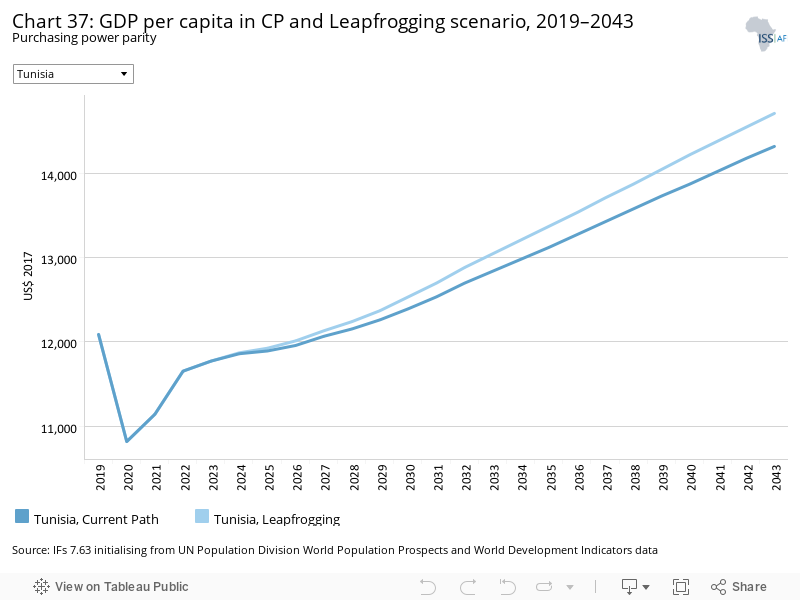
As shown in Chart 37, this scenario increases GDP per capita by US$207 over the Current Path forecast in 2033 and by US$392 by 2043.
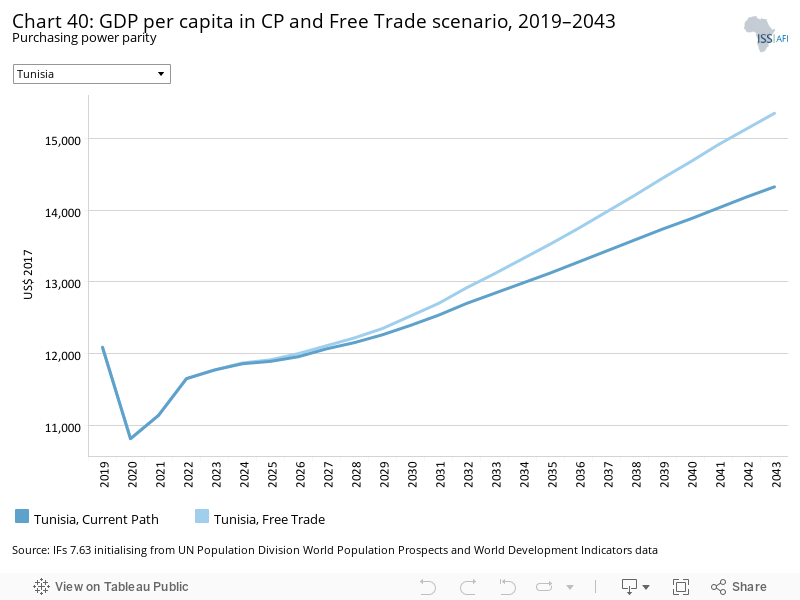
The Free Trade scenario represents the impact of the full implementation of the African Continental Free Trade Area (AfCFTA) by 2034 through increases in exports, improved productivity and increased trade and economic freedom.
The intervention is explained in here in the thematic part of the website.
Given the low levels of intra-regional trade in the North African region, it is no surprise that almost 80% of Tunisia’s exports go to the European Union (EU) rather than to its neighbours. The lack of regional integration in North Africa is a major constraint on development in the region.
Negotiations for a Deep and Comprehensive Free Trade Area (DCFTA) between the EU and Tunisia launched on 13 October 2015 to include agriculture and services are expected to create new trade and investment opportunities and ensure Tunisia is better integrated into the EU single market; however, the domestic impact is contested.
Additionally, almost one-third of goods traded in the domestic market are imported illegally. This is because of Tunisia’s high import taxes, outdated regulations and corrupt customs officials that deter business people from complying with official trade and currency exchange laws. A comprehensive review of business regulations and customs practices can draw Tunisians back into the formal economic sector.
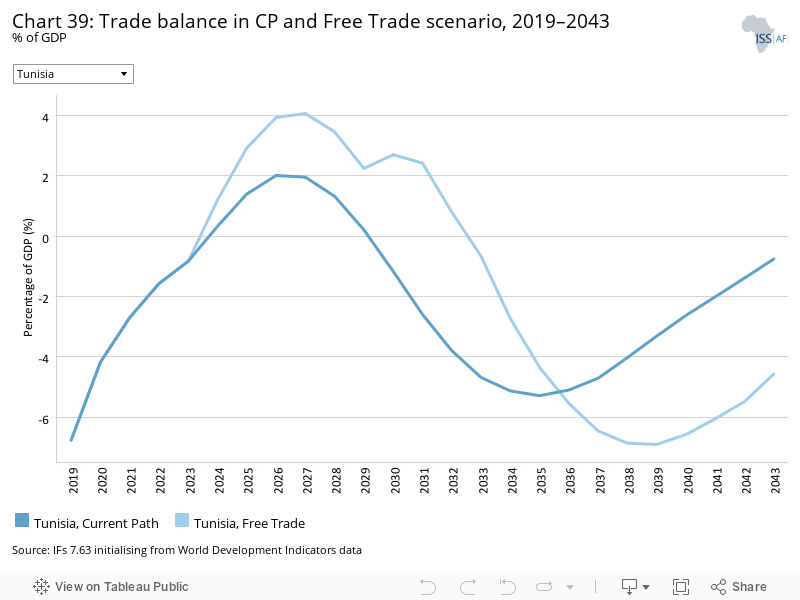
The Free Trade scenario could potentially open up new markets for Tunisia and increase the volume of exports in the country so that by 2024, the country starts to record a positive trade balance.
Tunisia has the potential to benefit from its membership in the AfCFTA and become a gateway to Africa with its huge investment potential, particularly in the pharmaceutical, textile and automobile components sectors.
Because trade is largely a national phenomenon that often excludes those in rural areas, trade openness would increase income in Tunisia on the assumption that there is equitable distribution. This scenario increases per capita income so that by 2033 and 2043, the average Tunisian earns US$273 and US$1025 more, respectively, over the Current Path forecast.
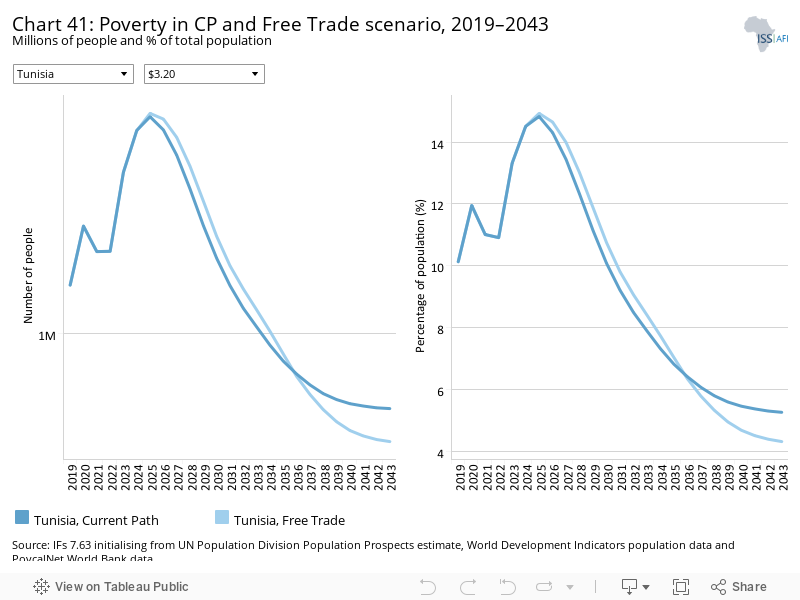
A predictable policy environment and reduced constraints on trade positively impact extreme poverty by increasing the number and quality of jobs, thus stimulating growth and productivity. However, poverty in Tunisia is largely a rural phenomenon and this presents real challenges for the extremely poor to benefit from trade opportunities. In the Free Trade scenario, the per cent of the population in extreme poverty only drops towards the end of the forecast horizon when it reaches 4.3% (582 000 people) against 5.3% (710 000 people) in the Current Path forecast, as shown in Chart 41.
The Financial Flows scenario represents a reasonable but ambitious increase in worker remittances and aid flows to poor countries, and an increase in the stock of foreign direct investment (FDI) and additional portfolio investment inflows to middle-income countries. We also reduced outward financial flows to emulate a reduction in illicit financial outflows.
The intervention is explained in here in the thematic part of the website.
During his time as president, ousted Ben Ali and his clique stole large amounts of money but the practices did not stop in 2011. Tunisia loses a significant amount of money - around 3% of GDP - annually to illicit financial flows, much of that through smuggling with Libya and Algeria.
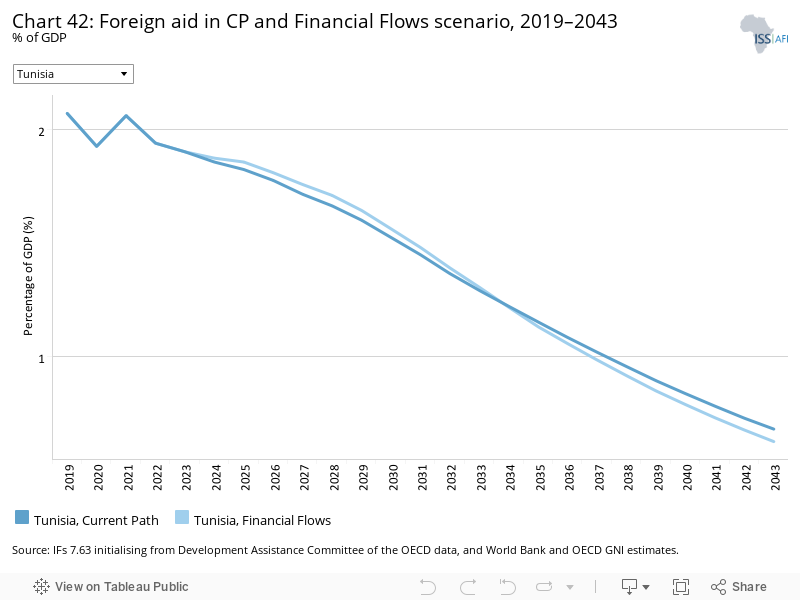
Compared to most countries in sub-Saharan Africa, the share of foreign aid revenue is relatively small. However, Tunisia still needs foreign aid to reconstruct its political system and spur economic growth and financial development goals. It is estimated that, on average, a minimum increase of 6% of GDP per year in foreign aid would be needed to finance key development goals.
This scenario modestly increases foreign aid until around 2034 before it starts declining to reach 0.63%, compared to 0.68% in the Current Path forecast.
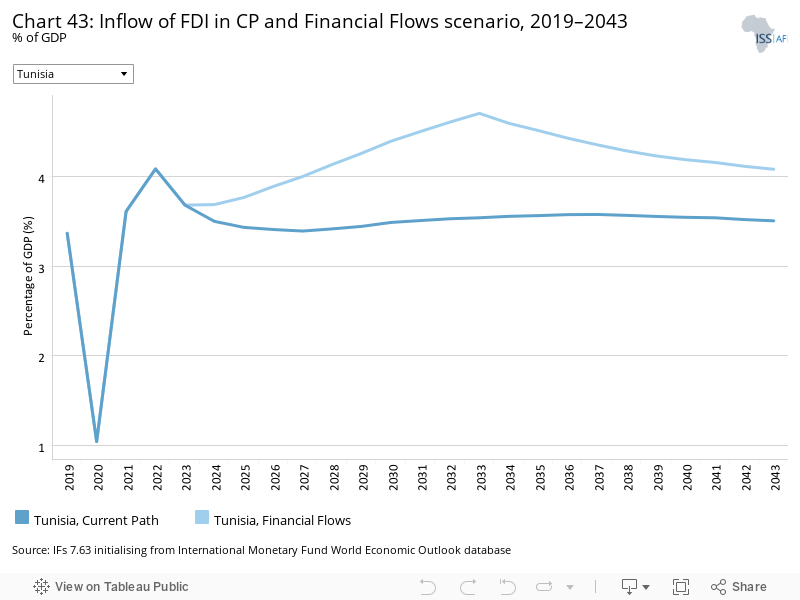
Foreign direct investment (FDI) to Tunisia has gradually decreased over the last decade. The political and economic instability since 2011 has impacted the inflow of FDI in the country. The global financial crash of 2008 also played an equally large role in the drop in FDI.
This scenario increases FDI flows to about 4.7% of GDP compared to 3.5% in the Current Path by 2033 and to 4.1% over the Current Path’s 3.5% in 2043. The rate of FDI inflow in Tunisia performs better than the average of lower middle-income countries at 4.08% of GDP in 2033, however, by 2043, the lower middle-income average outpaces Tunisia at 3.99% of GDP under the Financial Flows scenario.
Remittances are a lifeline for many poor families in low and lower middle-income countries like Tunisia. This scenario increases remittances to about 1.4% of GDP (US$1.43 billion) compared to 1.2% (US$1.21 billion) in the Current Path forecast in 2043.
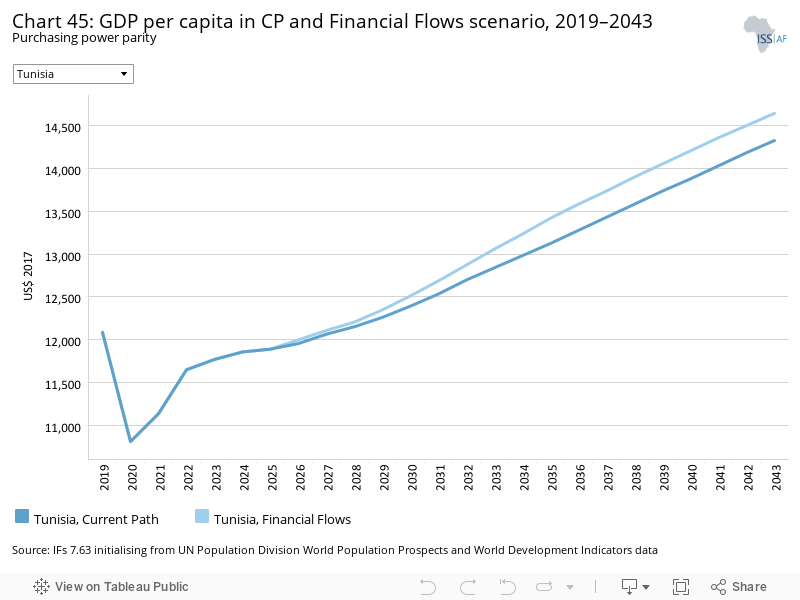
This scenario increases GDP per capita to about US$14 639 compared to US$13 323 in the Current Path forecast in 2043.
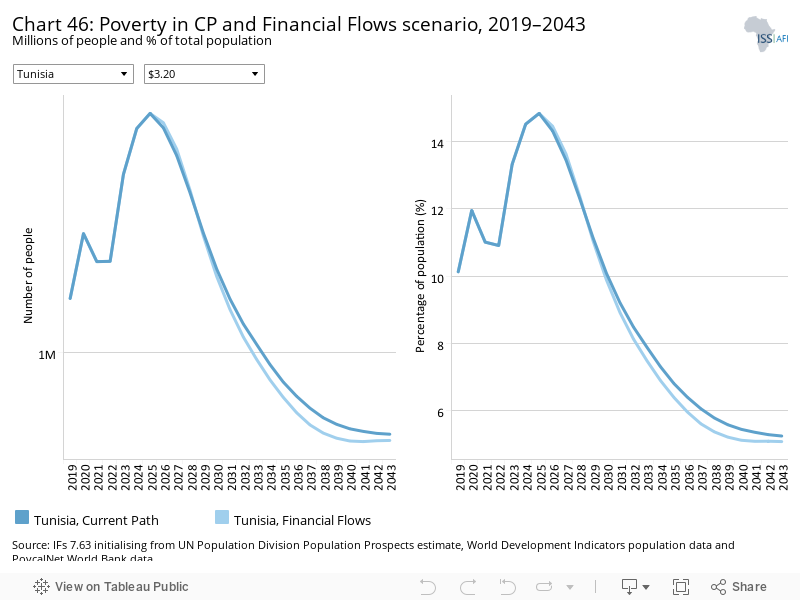
The decline in the number of extremely poor people in this scenario is quite modest because FDI does not necessarily benefit the average person and would depend on the destination sector(s) to make a significant impact.
By 2043, extreme poverty only declines by 0.17 percentage points, relative to the Current Path forecast at 5.3% of the population. This represents 688 000 people, 22 000 fewer people in extreme poverty than in the Current Path forecast in 2043.
The Infrastructure scenario represents a reasonable but ambitious increase in infrastructure spending across Africa, focusing on basic infrastructure (roads, water, sanitation, electricity access and ICT) in low-income countries and increasing emphasis on advanced infrastructure (such as ports, airports, railway and electricity generation) in higher-income countries.
Note that health and sanitation infrastructure is included as part of the Health/WaSH scenario and that ICT infrastructure and more rapid uptake of renewables are part of the Leapfrogging scenario. The interventions there push directly on outcomes, whereas those modelled in this scenario increase infrastructure spending, indirectly boosting other forms of infrastructure, including that supporting health, sanitation and ICT.
The intervention is explained in here in the thematic part of the website.
Tunisia has a relatively well-developed basic infrastructure system. Basic utilities and services like water, sanitation, electricity, telecommunications and transport were rolled out in the 1980s as part of the broader push on economic and human development.
Although Tunisia has achieved significant success in expanding access to improved water sources and sanitation facilities, water scarcity has long been a challenge in North Africa, complicated by rapid urbanisation and climate change.
The energy sector in Tunisia is heavily subsidised through a complex system. It was estimated that energy subsidies accounted for 12% of GDP (TND 5 600 million). Tunisia has achieved universal access to electricity with about 97% of Tunisia’s electricity generation coming from fossil fuels, mostly from domestic and imported natural gas, almost half of which comes from Algeria. The energy law of 2015 also encourages independent power producers (IPPs) to invest in renewable energy.
Because Tunisia has already achieved universal electricity access, the impact of this scenario is minimal.
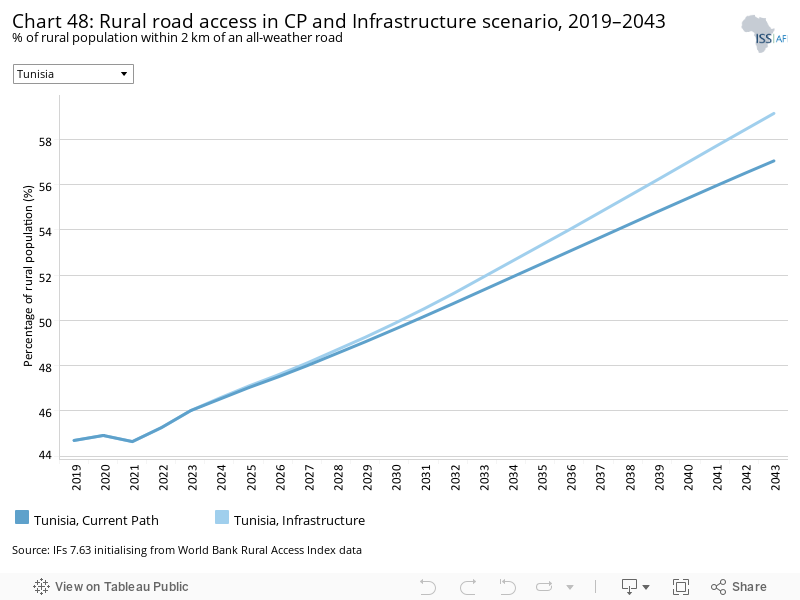
Indicator 9.1.1 in the Sustainable Development Goals refers to the proportion of the rural population who live within 2 km of an all-season road and is captured in the Rural Access Index.
The development of rural roads is a backbone for the improvement of livelihoods in rural areas. In fact, poor roads in rural areas are a barrier to socio-economic development and contribute to poverty.
In this scenario, by 2043 the rural population with access to an all-weather road increases to 59.2% compared to 57.1% in the Current Path forecast.
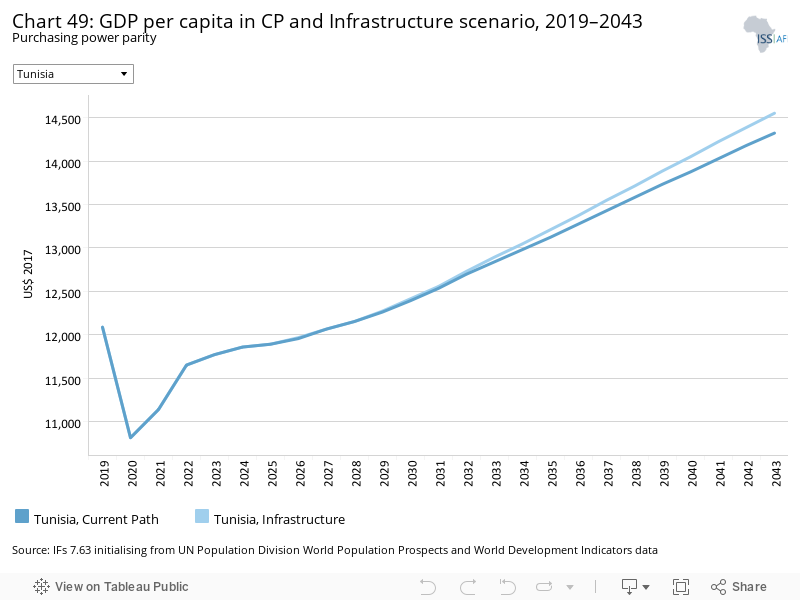
This scenario increases GDP per capita to about US$14 552 compared to US$14 323 in the Current Path forecast in 2043, a US$229 increase.
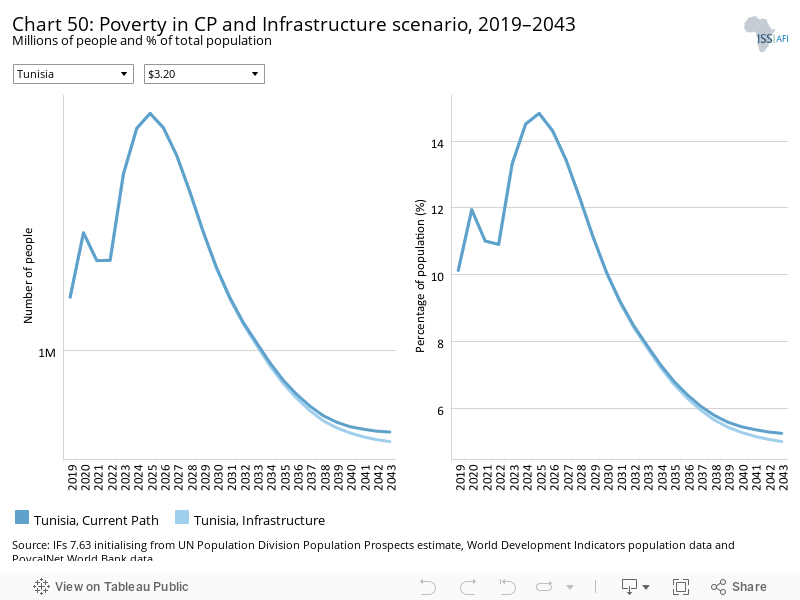
Tunisia’s basic infrastructure is generally good. The reduction in the number of extremely poor people (using US$3.20) in this scenario is small. By 2043, extreme poverty will only drop by 0.25 percentage points, relative to the Current Path forecast at 5.3% of the population. This represents 676 000 people in poverty compared to 710 000 in the Current Path forecast in the same year.
The Governance scenario represents a reasonable but ambitious improvement in accountability and reduces corruption, and hence improves the quality of service delivery by government.
The intervention is explained in here in the thematic part of the website.
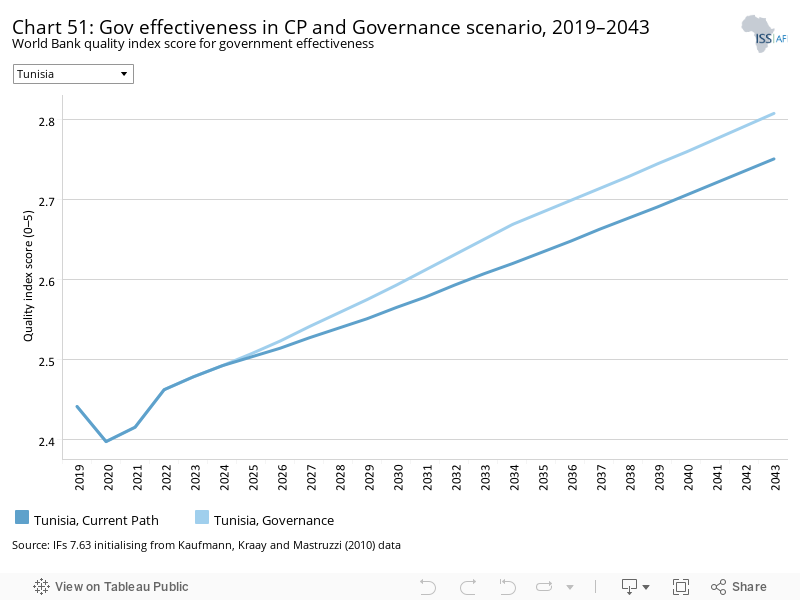
As defined by the World Bank, government effectiveness ‘captures perceptions of the quality of public services, the quality of the civil service and the degree of its independence from political pressures, the quality of policy formulation and implementation, and the credibility of the government’s commitment to such policies’.
Governance is a central pillar to sustained development. Improving the quality of governance in Tunisia increases the level of government effectiveness, i.e. the ability of the government to raise revenue and provide basic services to its people. To date, the country’s enormous potential has stagnated as a result of an opaque political and insider/outsider economic system that constrains opportunity and forces many into the informal and parallel economy. Tunisia lacks a clear development vision and orientation that can drive the allocation of scarce resources for the future. Meanwhile, challenges such as high unemployment rates, especially amongst university graduates, and regional inequalities persist. Also, Tunisia’s significant subsidies on energy, fuel, food and transport and a large public service wage bill are exacerbating inequality and straining the government's coffers.
In this scenario, government effectiveness is higher than the Current Path forecast in 2043 by about 2.2%.
This scenario increases GDP per capita to about US$14 671 compared to US$14 323 in the Current Path forecast in 2043.
The decrease in the number of extremely poor people in this scenario is relatively small. By 2043, extreme poverty will only drop by 0.41 percentage points, relative to the Current Path forecast at 5.3% of the population. This represents about 655 000 people living in extreme poverty compared to 710 000 in the Current Path forecast.
This section presents projections for carbon emissions in the Current Path for [Tunisia] and the 11 scenarios. Note that IFs uses carbon equivalents rather than CO2 equivalents.
Undertaking the various interventions outlined towards Tunisia’s development have ecological costs. The rate of carbon emissions is accelerated and this has environmental impacts which the government must assess accordingly, especially in light of climate change in their development policy framework.
The Manufacturing/Transfers scenario will be the biggest emitter of carbon until about 2041 when the Free Trade scenario outpaces it, as shown in Chart 54.
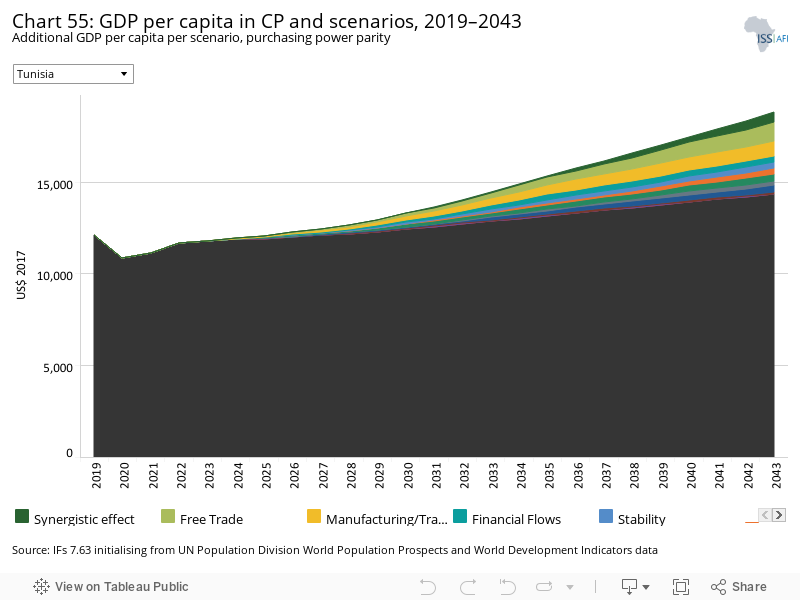
The Combined Agenda 2063 scenario consists of the combination of all 11 sectoral scenarios presented above, namely the Stability, Demographics, Health/WaSH, Agriculture, Education, Manufacturing/Transfers, Leapfrogging, Free Trade, Financial Flows, Infrastructure and Governance scenarios. The cumulative impact of better education, health, infrastructure, etc. means that countries get an additional benefit in the integrated IFs forecasting platform that we refer to as the synergistic effect. Chart 55 presents the contribution of each of these 12 components to GDP per capita in the Combined Agenda 2063 scenario.
Tunisia is moving rapidly through its demographic transition without having achieved the associated benefits that typically accompany high levels of urbanisation, improved health outcomes and high levels of education. Income and overall economic growth have deteriorated and job opportunities in the formal sector are scarce. The impediment, it would seem, is the country’s opaque economic system, which is dominated by strong vested interests that allow little competition and few new opportunities. Despite the impressive human capital outcomes, the Tunisian economy has under-delivered in terms of employment and economic inclusion. As a result, the country finds itself at a crossroad that requires radical but necessary economic and socio-political reforms if it is to achieve inclusive development.
The government faces numerous challenges, not least crafting a coherent development vision amongst the fragmented parties represented in parliament. Tackling the macroeconomic challenges faced in the country will require great understanding, sacrifices and tough decisions by all Tunisians.
When the sectoral scenarios are combined and their impact on GDP per capita is compared, trade, manufacturing, agriculture and leapfrogging make the greatest contribution to additional income for Tunisians.
Chart 55 presents a stacked area graph on the contribution of each scenario to GDP per capita as well as the additional benefit or synergistic effect, whereas Chart 56 presents only GDP per capita in the Current Path forecast and the Combined Agenda 2063 scenario.
The combined impact of all scenarios on GDP per capita yields about US$14 552 over the Current Path’s US$12 840 in 2033. By 2043, per capita income is projected at US$19 086, roughly US$4 763 more than in the Current Path forecast in the same year.
In the Combined Agenda 2063 scenario, by 2043, only about 1.1% of Tunisians will be living in extreme poverty (at the US$3.20 threshold) compared to 5.3% in the Current Path forecast. This represents about 561 000 fewer people living in extreme poverty relative to 710 000 in the Current Path forecast.
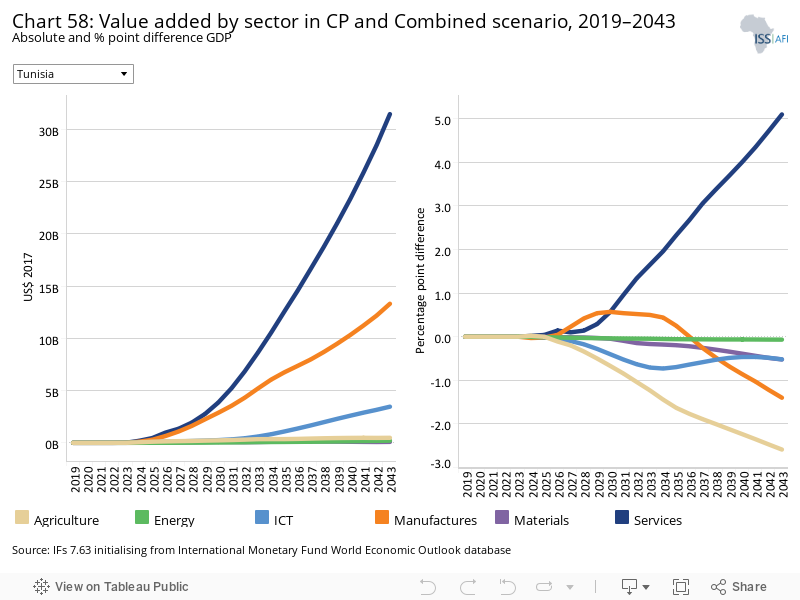
See Chart 8 to view the Current Path forecast of the sectoral composition of the economy.
The service industry, already the largest contributor to GDP at 50.4% of GDP in 2019, will further increase its contribution to Tunisia’s economy to 55.4% in 2043. The other sectors are expected to slightly decline in their contribution to GDP, agriculture in particular. However, in absolute dollar terms, all sectors will be larger in the Combined Agenda 2063 scenario in 2043 compared to the Current Path forecast for that year. Services and manufacturing will contribute the largest share to the economy in 2043, which will be followed by ICT, agriculture, energy and materials, respectively.
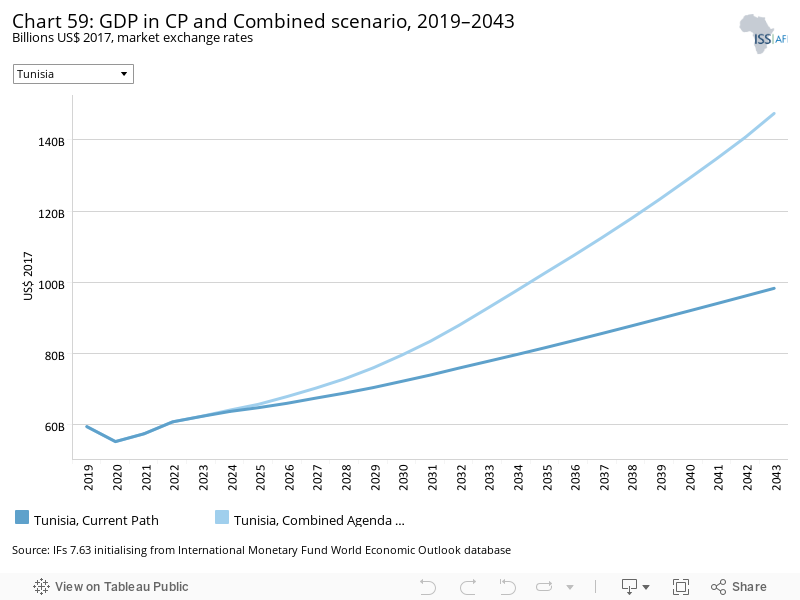
In this sustained push to implement all the policies, the size of the economy grows by an additional US$15.9 billion, relative to US$77.8 billion in the Current Path forecast by 2033. By 2043, the economy will be a whopping US$151 billion, relative to US$98 billion in the Current Path forecast, representing a 56.4% increase.
Endnotes
World Bank, 2016, Tunisia Country Strategy 2016–2020
Page information
Contact at AFI team is Jakkie Cilliers
This entry was last updated on 5 July 2024 using IFs v7.63.
Donors and sponsors


Reuse our work
- All visualizations, data, and text produced by African Futures are completely open access under the Creative Commons BY license. You have the permission to use, distribute, and reproduce these in any medium, provided the source and authors are credited.
- The data produced by third parties and made available by African Futures is subject to the license terms from the original third-party authors. We will always indicate the original source of the data in our documentation, so you should always check the license of any such third-party data before use and redistribution.
- All of our charts can be embedded in any site.
Cite this research
Jakkie Cilliers (2025) Tunisia. Published online at futures.issafrica.org. Retrieved from https://futures.issafrica.org/geographic/countries/tunisia/ [Online Resource] Updated 5 July 2024.