 Mauritius
Feedback welcome
Our aim is to use the best data to inform our analysis. See our Technical page for information on the IFs forecasting platform. We appreciate your help and references for improvements via our feedback form.
Please note: This country report was developed using African Futures’ previous analytical framework, which organised the assessment across 11 sectoral scenarios. We have since updated and streamlined the analytical architecture to 8 sectoral scenarios. While the two frameworks remain broadly aligned, the current structure improves consistency, comparability and integration across themes and geographic studies. This page will therefore be updated to the current framework in due course. Read more about our analytical framework on the Technical Page.
In this entry, we first describe the Current Path forecast for Mauritius as it is expected to unfold to 2043, the end of the third ten-year implementation plan of the African Union’s Agenda 2063 long-term vision for Africa. The Current Path in the International Futures (IFs) forecasting model initialises from country-level data that is drawn from a range of data providers. We prioritise data from national sources.
The Current Path forecast is divided into summaries on demographics, economics, poverty, health/WaSH and climate change/energy. A second section then presents a single positive scenario for potential improvements in stability, demographics, health/WaSH, agriculture, education, manufacturing/transfers, leapfrogging, free trade, financial flows, infrastructure, governance and the impact of various scenarios on carbon emissions. With the individual impact of these sectors and dimensions having been considered, a final section presents the impact of the Combined scenario.
We generally review the impact of each scenario and the Combined scenario on gross domestic product (GDP) per person and extreme poverty except for Health/WaSH that uses life expectancy and infant mortality.
The information is presented graphically and supported by brief interpretive text.
All US$ numbers are in 2017 values.
Executive Summary
- The Current Path forecast indicates that Mauritius will:
- see a stagnation in population growth driven by a low total fertility rate and resulting in the proportion of the population aged 65 and above increasing by 10 percentage points by 2043. Jump to Demographics: Current path
- experience a steady increase in GDP per capita resulting in an increase of US$6 725 by 2043. Jump to Economics: Current path
- eliminate extreme poverty at the US$5.50 poverty line by 2036. Jump to Poverty: Current path
- Mauritius, which reached produced 1.3 million tons of carbon in 2019, will steadily produce more emissions as the economy grows, with 1.8 million tons of carbon emitted by 2043. Jump to Carbon emissions/Energy: Current Path
- Sectoral Scenarios
- In the Stability scenario, Mauritius is projected to attain a near perfect score of 0.98 out of 1 for governance security by 2043. Jump to Stability scenario
- The Demographic scenario projects no change compared to the Current Path forecast due to Mauritius’ already low total fertility and infant mortality rates. Jump to Demographic scenario
- In the Health/WaSH scenario, life expectancy increases to 78.9 years by 2043, 0.8 year higher than the Current Path forecast. Jump to Health/Wash scenario
- The Agriculture scenario increases yield per hectare by 0.3 by 2043 compared to the Current Path forecast. Jump to Agriculture scenario
- In the Education scenario, average test scores for secondary school learners are 11.6 points higher than in the Current Path forecast by 2043. Jump to Education scenario
- The Manufacturing/Transfers scenario projects that the manufacturing sector will add US$270 million more to the economy by 2043 compared to the Current Path forecast. Jump to Manufacturing/Transfers scenario
- In the Leapfrogging scenario, fixed broadband subscriptions reach 50 per 100 people by 2027, eight years earlier than the Current Path forecast. Jump to Leapfrogging scenario
- The Free Trade scenario increases GDP per capita by US$1 010 by 2043, 3.5% above the Current Path forecast. Jump to Free Trade scenario
- In the Financial Flows scenario, FDI inflows rise to 4.4% of GDP by 2043, an increase of 1 percentage point above the Current Path forecast. Jump to Financial Flows scenario
- The Infrastructure scenario projects a 1.5 percentage-point increase in Mauritius’ Rural Access Index score compared to the Current Path forecast by 2043. Jump to Infrastructure scenario
- In the Governance scenario, the country’s government effectiveness score rises to 3.77 by 2043. Jump to Governance scenario
- The Free Trade scenario increases carbon emissions the most out all the sectoral scenarios, followed by the Manufacturing/Transfers and Financial Flows scenarios. Jump to Impact of scenarios on carbon emissions
- The Combined scenario will result in: Jump to Combined scenario
- an 18.5% increase in GDP per capita by 2043 when contrasted with the Current Path forecast.
- services adding US$6.7 billion more to the economy by 2043 than in the Current Path forecast.
- emissions of 0.3 million tons more carbon by 2043 compared to the Current Path forecast.
All charts for Mauritius Development Futures
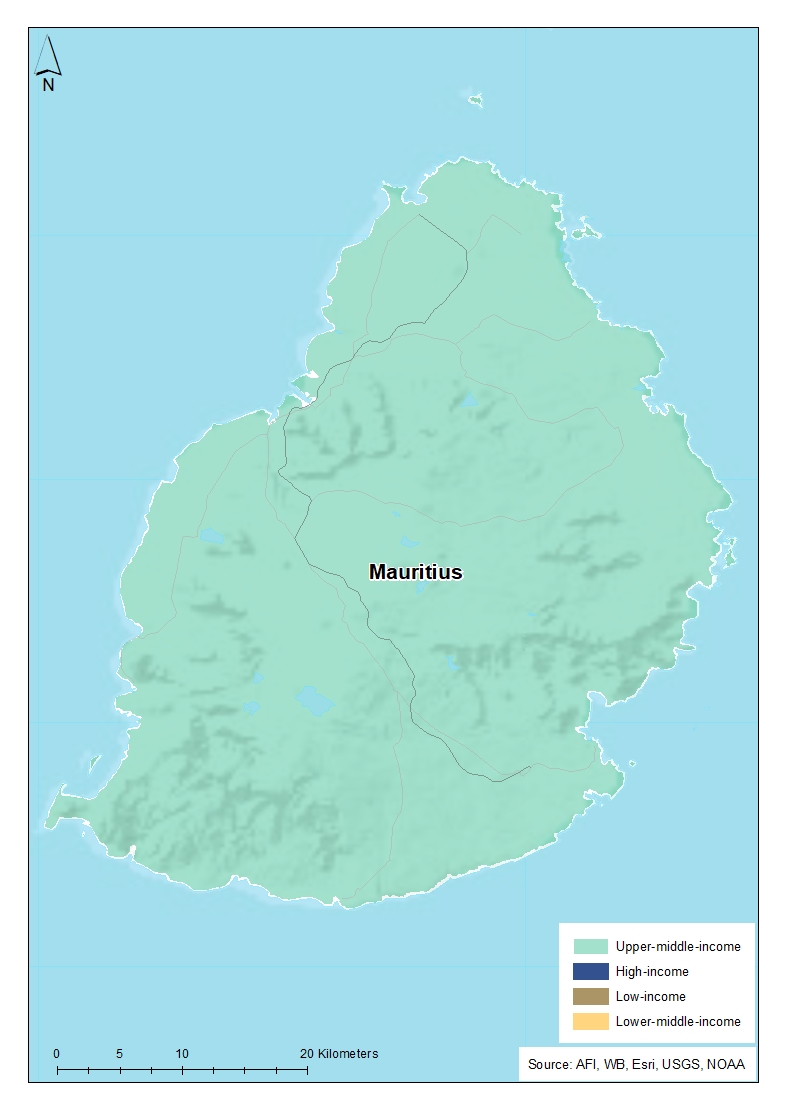
- Chart 1: Political map of Mauritius
- Chart 2: Population structure in CP, 1990–2043
- Chart 3: Urban and rural population in CP, 1990–2043
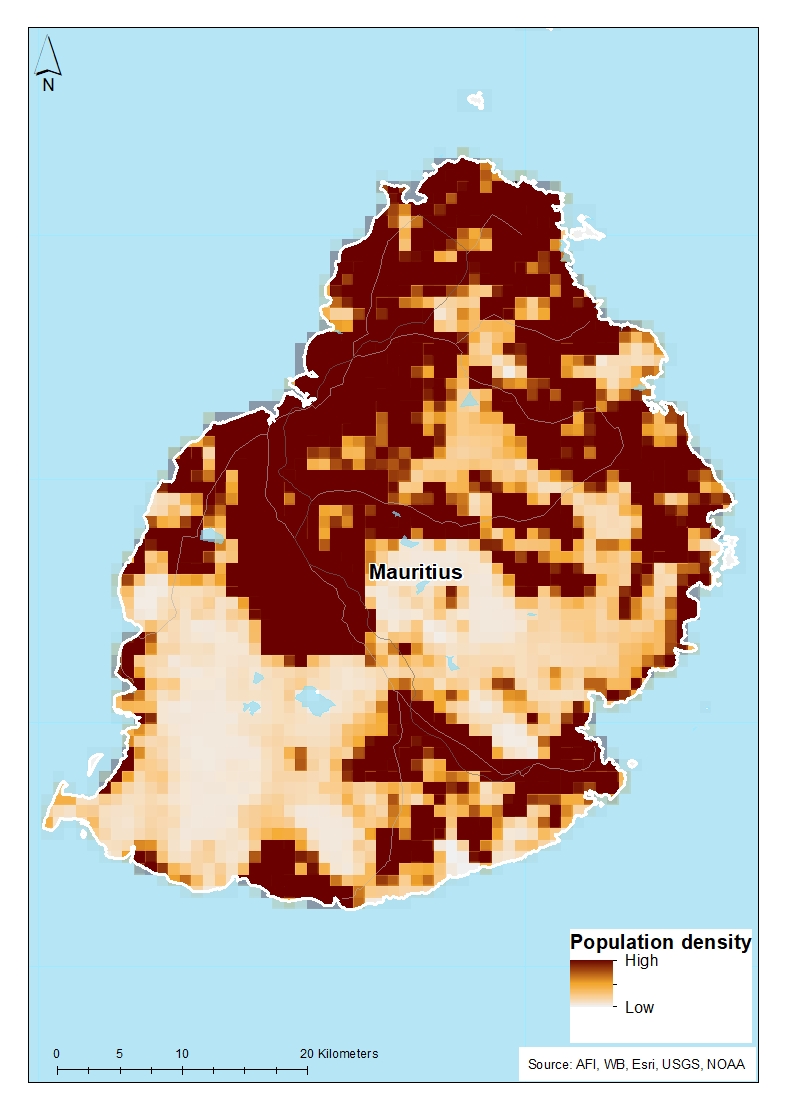
- Chart 4: Population density map for 2019
- Chart 5: GDP in CP, 1990–2043
- Chart 6: GDP per capita in CP, 1990–2043
- Chart 7: Informal sector value in CP, 2015–2043
- Chart 8: Value added by sector in CP, 2015–2043
- Chart 9: Agriculture production/demand in CP, 1990–2043
- Chart 10: Poverty in CP, 2015–2043
- Chart 11: Energy production by type in CP, 1990–2043
- Chart 12: Carbon emissions in CP, 1990–2043
- Chart 13: Governance security in CP and Stability scenario, 2019–2043
- Chart 14: GDP per capita in CP and Stability scenario, 2019–2043
- Chart 15: Poverty in CP and Stability scenario, 2019–2043
- Chart 16: Demographic dividend in CP and Demog scenario, 2019–2043
- Chart 17: Infant mortality in CP and Demog scenario, 2019–2043
- Chart 18: GDP per capita in CP and Demog scenario, 2019–2043
- Chart 19: Poverty in CP and Demog scenario, 2019–2043
- Chart 20: Life expectancy in CP and Health/WaSH scenario, 2019–2043
- Chart 21: Infant mortality in CP and Health/WaSH scenario, 2019–2043
- Chart 22: Yield/hectare in CP and Agric scenario, 2019–2043
- Chart 23: Agriculture imports in CP and Agric scenario, 2019–2043
- Chart 24: GDP per capita in the CP and Agric scenario, 2019–2043
- Chart 25: Poverty in CP and Agric scenario, 2019–2043
- Chart 26: Mean years of education in CP and Educ scenario, 2019–2043
- Chart 27: Education quality in CP and Educ scenario, 2019–2043
- Chart 28: GDP per capita in CP and Educ scenario, 2019–2043
- Chart 29: Poverty in CP and Educ scenario, 2019–2043
- Chart 30: Value added by sector in CP and Manufac/Transfers scenario, 2019–2043
- Chart 31: Gov welfare transfers in CP and Manufac/Transfers scenario, 2019–2043
- Chart 32: GDP per capita in CP and Manufac/Transfers scenario, 2019–2043
- Chart 33: Poverty in CP and Manufac/Transfers scenario, 2019–2043
- Chart 34: Fixed broadband access in CP and Leapfrogging scenario, 2019–2043
- Chart 35: Mobile broadband access in CP and Leapfrogging scenario, 2019–2043
- Chart 36: Electricity access in CP and Leapfrogging scenario, 2019–2043
- Chart 37: GDP per capita in CP and Leapfrogging scenario, 2019–2043
- Chart 38: Poverty in CP and Leapfrogging scenario, 2019–2043
- Chart 39: Trade balance in CP and Free Trade scenario, 2019–2043
- Chart 40: GDP per capita in CP and Free Trade scenario, 2019–2043
- Chart 41: Poverty in CP and Free Trade scenario, 2019–2043
- Chart 42: Foreign aid in CP and Financial Flows scenario, 2019–2043
- Chart 43: Inflow of FDI in CP and Financial Flows scenario, 2019–2043
- Chart 44: Remittances in CP and Financial Flows scenario, 2019–2043
- Chart 45: GDP per capita in CP and Financial Flows scenario, 2019–2043
- Chart 46: Poverty in CP and Financial Flows scenario, 2019–2043
- Chart 47: Electricity access in CP and Infrastructure scenario, 2019–2043
- Chart 48: Rural road access in CP and Infrastructure scenario, 2019–2043
- Chart 49: GDP per capita in CP and Infrastructure scenario, 2019–2043
- Chart 50: Poverty in CP and Infrastructure scenario, 2019–2043
- Chart 51: Gov effectiveness in CP and Governance scenario, 2019–2043
- Chart 52: GDP per capita in CP and Governance scenario, 2019–2043
- Chart 53: Poverty in CP and Governance scenario, 2019–2043
- Chart 54: Carbon emissions in CP and scenarios, 2019–2043
- Chart 55: GDP per capita in CP and scenarios, 2019–2043
- Chart 56: GDP per capita in CP and Combined scenario, 2019–2043
- Chart 57: Poverty in CP and Combined scenario, 2019–2043
- Chart 58: Value added by sector in CP and Combined scenario, 2019–2043
- Chart 59: GDP in CP and Combined scenario, 2019–2043
- Chart 60: Carbon emissions in CP and Combined scenario, 2019–2043


Mauritius Development Futures: Current Path
Download to pdfThis page provides an overview of the key characteristics of Mauritius along its likely (or Current Path) development trajectory. The Current Path forecast from the International Futures forecasting (IFs) platform is a dynamic scenario that imitates the continuation of current policies and environmental conditions. The Current Path is therefore in congruence with historical patterns and produces a series of dynamic forecasts endogenised in relationships across crucial global systems. We use 2019 as a standard reference year and the forecasts generally extend to 2043 to coincide with the end of the third ten-year implementation plan of the African Union’s Agenda 2063 long-term development vision.
Mauritius is a small island nation located in the Indian ocean, 800 km east of Madagascar. The country is classified as upper middle-income by the World Bank and forms part of the Common Market for Eastern and Southern Africa (COMESA) and Southern African Development Community (SADC) Regional Economic Communities. Chart 1 shows the capital of Port Louis situated in the north-west region, where the majority of the population is located.
The climate is tropical, with a dry winter and a wet summer during which a cyclone season poses a threat. Over the past four decades, the country has faced 13 noticeable cyclones which have caused damages in excess of US$400 million.
Forecasts suggest that storms are increasingly reaching cyclone strength as the number of rainy days decrease, adding pressure on the water supply and agricultural activity.
Chart 2 shows the composition of Mauritius’ population by age cohort and how it is expected to change in the Current Path forecast. In 2019, 70.8% of the population was in the working-age cohort resulting in a ratio of 2.4 workers for every dependant. The population is expected to become more elderly: those aged above 65 constituting an extra 10 percentage points of the total population by 2043. The ageing population could result in problems in the future as additional elderly dependants place added pressure on the working-age population. Mauritius’ social protection system focuses heavily on pensions, and recent increases in pension payouts combined with increased life expectancy will cause rising expenditure, possibly to the detriment of other welfare distribution spending.
Stagnating population growth results in the size of the population being smaller by 2043 than in 2019, decreasing by 22 000 people. The decline is due to a very low total fertility rate, with 1.4 births per woman in 2019, 0.7 below the replacement rate.
Chart 3 shows how Mauritius’ population is projected to remain predominantly rural as only 41.2% of people will be living in urban areas by 2043—a very small increase from 40.8% in 2019. Mauritius has the lowest rate of urbanisation among its upper middle-income peers in Africa. In 2019, 19% of all available land was protected forest while 39.4% was used for agricultural cultivation. The lack of available land area on the main island restricts urban expansion into the hinterland, and it is forecast that the country will remain the least urbanised among its income peers.
The highest levels of population density, as shown in Chart 4, are seen in Port Louis and the urban areas south west of the capital. Other areas of higher density are dotted around the island where smaller urban centres are situated. Due to large areas of land being used for agriculture, density is low in most areas of the country, as seen in the southern areas of the island. Average population density is the highest in Africa at 6.3 people per hectare in 2019, with an urban density of 36.4 people per hectare.
Average growth has been steady for the last decade, averaging between 3% and 4% per year. The economy is largely driven by tourism, financial services and sugar exports, with more than 90% of cropland being used for sugar cane production. The COVID-19 pandemic has impacted the country’s economy significantly, especially due to its reliance on the tourism sector, resulting in a severe retraction in 2020. Chart 5 shows how Mauritius’ GDP is expected to continue to increase steadily until 2043, with the size of the economy growing to US$27.3 billion from US$16.7 billion in 2019.
Although many of the charts in the sectoral scenarios also include GDP per capita, this overview is an essential point of departure for interpreting the general economic outlook of Mauritius.
GDP per capita grew at a steady pace between 1990 and 2019, making Mauritius the country with the second highest income per capita in Africa. This growth trend is projected to continue, after recovering from the impact of the COVID-19 pandemic, reaching US$29 114 by 2043, a rise of US$6 725 compared to 2019. The 30% increase is attributable to population growth stagnating and GDP growth remaining robust due to the continuation of sound economic policies. Mauritius already outperforms SADC, COMESA and upper middle-income economies in Africa, and by 2043 the gap would have widened even further.
The size of the informal sector in Mauritius is small, and its value as a per cent of GDP falls 5.4 percentage points below the average for its upper middle-income peers in Africa. In 2019, the value of the sector was 8.6% of GDP and is projected to fall to 3.9% by 2043. In 2019, 12.4% of non-agricultural labourers were classified as informal—a number projected to drop 3.9% by 2043. Lower levels of informality are advantageous for a country as workers are more productive and better protected in the formal sector. Government revenues are also boosted through additional tax income gathered in the formal sector—a benefit the country already enjoys.
The IFs platform uses data from the Global Trade and Analysis Project (GTAP) to classify economic activity into six sectors: agriculture, energy, materials (including mining), manufactures, services and information and communications technology (ICT).
The sectoral composition of the Mauritian economy displayed in Chart 8 clearly shows services adding the most value in the economy at 69.7% of GDP in 2019. Manufacturing accounts for 16.6% of GDP, while ICT (9.2%) and agriculture (3.6%) follow behind in third and fourth place.
The shift away from agriculture and manufacturing towards services has created a skilled labour supply shortage. The effect has been increasing wage income inequality, felt most keenly among women, as their labour force participation rate remains low compared to men. Youth unemployment is also increasing as fewer young people are willing to work in low-skilled agricultural- and manufacturing-type employment. The government’s efforts to redistribute growth through a social protection system has proven effective, but an emphasis on increasing female labour force participation is needed.
The economy’s composition is projected to remain largely unchanged by 2043: agriculture will see a decrease of 1.5 percentage points, while services will grow by 1.2 percentage points. In absolute terms, the services sector will add US$7.7 billion more in value by 2043, whereas agriculture will add US$0.03 billion less. Manufacturing and ICT are both projected to grow to be US$1.6 billion and US$1.2 billion larger by 2043 respectively.
The data on agricultural production and demand in the IFs forecasting platform initialises from data provided on food balances by the Food and Agriculture Organization (FAO). IFs contains data on numerous types of agriculture but aggregates its forecast into crops, meat and fish, presented in million metric tons. Chart 9 shows agricultural production and demand as a total of all three categories.
Mauritius has a small shortfall of agricultural production compared to demand, amounting to 140 000 metric tons in 2019. Chart 9 shows that in the Current Path forecast the gap will gradually widen to 250 000 metric tons by 2043. Agricultural production is dominated by sugar cane, most of which is exported due to limited local demand. The demand for agricultural produce is mostly met through imports, with 20.8% of all imports in 2019 being agricultural. The slow nature of population growth over the forecast period means agricultural demand will remain in check, with demand growing from 5 million metric tons in 2019 to 5.2 million metric tons by 2043.
There are numerous methodologies and approaches to defining poverty. We measure income poverty and use GDP per capita as a proxy. In 2015, the World Bank adopted the measure of US$1.90 per person a day (in 2011 international prices), also used to measure progress towards the achievement of Sustainable Development Goal 1 of eradicating extreme poverty. To account for extreme poverty in richer countries occurring at slightly higher levels of income than in poor countries, the World Bank introduced three additional poverty lines in 2017:
- US$3.20 for lower middle-income countries
- US$5.50 for upper middle-income countries
- US$22.70 for high-income countries.
Mauritius had been an upper middle-income country since 1993, and it was upgraded to high-income status in 2020, lifting its poverty line to US$22.70 per person per day for the first time. The subsequent jump in extreme poverty was dramatic, but the country was downgraded back to upper middle-income status in 2021 following the negative effects of the COVID-19 pandemic on tourism and export of goods. At the poverty level of US$5.50, Mauritius had a poverty rate of 7.7% in 2019 and is projected to eliminate extreme poverty at this level by 2036; it is projected to decline to 1.2% by 2043. The low poverty rate is largely due to social transfers aimed at redistributing wealth, which significantly reduce poverty and the country’s Gini coefficient.
Compared to COMESA and SADC, whose poverty rates are measured at US$1.90, Mauritius performs significantly better: COMESA’s poverty rate was 35.4% in 2019, while SADC’s was higher at 51%. The two RECs make progress, COMESA reaching 18.8% and SADC 34% by 2043, but both are well above Mauritius’ level.
When compared to its upper middle-income peers, Mauritius also does substantially better: in 2019, upper middle-income Africa had a poverty rate of 45.9% and is projected to make limited progress to reach 39.7% by 2043.
The IFs platform forecasts six types of energy, namely oil, gas, coal, hydro, nuclear and other renewables. To allow comparisons between different types of energy, the data is converted into billion barrels of oil equivalent (BBOE). The energy contained in a barrel of oil is approximately 5.8 million British thermal units (MBTUs) or 1 700 kilowatt-hours (kWh) of energy.
Mauritius’ energy production of 0.0003 BBOE made it Africa’s third smallest energy producer in 2019. The two sources of energy are hydro and other renewables, which both account for 50% of production, a balance which will shift to 20% hydro and 80% other renewables by 2043. Most of the renewable energy produced locally comes from bagasse, the organic material left over from crushing sugar cane. The demand for energy is almost exclusively met by energy imports, which accounted for 97% of demand in 2019. The near total dependence on imports will remain the norm as energy production increases by 0.0002 BBOE to reach 0.0005 BBOE by 2043.
Carbon is released in many ways, but the three most important contributors to greenhouse gases are carbon dioxide (CO2), carbon monoxide (CO) and methane (CH4). Since each has a different molecular weight, IFs uses carbon. Many other sites and calculations use CO2 equivalent.
Chart 12 shows Mauritius’ carbon emissions, which reached 1.3 million tons in 2019, a figure that has tripled since 1990. The country will steadily produce more emissions as the economy grows, particularly the manufacturing sector, with 1.8 million tons of carbon emitted by 2043. The 28.6% increase would be small in comparison to the rest of Africa as Mauritius moves from being the 26th biggest emitter on the continent in 2019 to the 41st by 2043.
Although a low emitter, Mauritius will still need to react to the effects of climate change with its rising surface and sea temperatures. The ND-GAIN Country Index, which ranks a country’s vulnerability to climate change and its readiness to improve resilience against the negative consequences, ranks Mauritius high for readiness and low for vulnerability, meaning it is well placed to respond to climate change-related events.
Sectoral Scenarios for Mauritius Development Futures
Download to pdfThe Stability scenario represents reasonable but ambitious reductions in risk of regime instability and lower levels of internal conflict. Stability is generally a prerequisite for other aspects of development and this would encourage inflows of foreign direct investment (FDI) and improve business confidence. Better governance through the accountability that follows substantive democracy is modelled separately.
The intervention is explained in here in the thematic part of the website.
Mauritius has experienced a period of peace and untroubled political transitions since gaining its independence in 1968. Apart from one period of rioting in 1999, partly influenced by ethnic tensions, the country has benefitted from stability and no internal conflict. Wise investments, export-oriented economic policies, strong institutions and an emphasis on income redistribution are key factors in explaining the continued lack of conflict.
Chart 13 shows the level of governance security in Mauritius, with a higher score reflecting lower levels of instability and internal conflict. In 2019, Mauritius achieved a score of 0.89 out of 1, the highest in Africa. The Stability scenario increases the score to 0.98 by 2043, 0.05 higher than the Current Path forecast. The country considerably outperforms both COMESA and SADC: in 2019, the country’s score was 0.22 points higher than COMESA’s and 0.23 higher than SADC’s. Upper middle-income Africa had a score of 0.72 in 2019. The Stability scenario widens the gap between Mauritius and the two RECs and upper middle-income Africa considerably to above 0.2 points.
The stable nature of Mauritius’ political climate and lack of internal conflict means the Stability scenario’s interventions affect small changes in the GDP per capita. By 2043, the scenario increases the GDP per capita by US$425 above the Current Path forecast, a rise of 1.5%.
Mirroring the impact on the GDP per capita, the Stability scenario is projected to produce a minimal reduction in poverty. By 2043, the scenario would only reduce the number of poor people by 1 000 compared to the Current Path forecast. The poverty rate is also projected to be 0.07 percentage points lower, reaching a level of 1.17%.
This section presents the impact of a Demographic scenario that aims to hasten and increase the demographic dividend through reasonable but ambitious reductions in the communicable-disease burden for children under five, the maternal mortality ratio and increased access to modern contraception.
The intervention is explained in here in the thematic part of the website.
Demographers typically differentiate between a first, second and even a third demographic dividend. We focus here on the first dividend, namely the contribution of the size and quality of the labour force to incomes. It refers to a window of opportunity that opens when the ratio of the working-age population (between 15 and 64 years of age) to dependants (children and the elderly) reaches 1.7.
Mauritius has been experiencing a demographic dividend since 1984 and will continue to do so beyond 2043 in the Current Path forecast. The main reasons for this prolonged dividend are rapid declines in the total fertility rate and improved health outcomes in the years following independence. The period between 1965 and 1985 saw the total fertility rate decrease from 6.2 births per woman to 2.3, a decrease of 3.9 births per woman. This low fertility rate was achieved due to a concerted effort by government and religious groups to promote family planning methods and increase educational attainment.
The total fertility rate has continued to decrease, reaching 1.4 in 2019, and has contributed to a stagnation in population growth. Low levels of fertility over a prolonged period have meant the proportion of the working-age population to dependants is projected to decline from 2.4 in 2019 to 1.8 by 2043 along the Current Path forecast as the proportion of the population aged 65 years and older increases by 10.1 percentage points in that time. In the Demographic scenario, Mauritius’ ratio of working-age persons to dependants is the same by 2043 as in the Current Path forecast.
The infant mortality rate is the number of infant deaths per 1 000 live births and is an important marker of the overall quality of the health system in a country.
Health outcomes in Mauritius were positively impacted by increased access to improved water and sanitation infrastructure following independence, leading to a rapid decline in infant mortality. In 1968, the infant mortality rate was 69.2 deaths per 1 000 live births, a figure which decreased to 14.9 by 2000. Since then, a levelling off has occurred and the infant mortality was 12 deaths per 1 000 live births in 2019. This figure is well below the average for upper middle-income countries at 30.4 deaths per 1 000 live births in 2019.
The Demographic scenario thus has no effect on Mauritius’ infant mortality rate as the rate is already low. By 2043, Mauritius’ infant mortality rate is projected to be 8.7 deaths per 1 000 live births in both the Demographic scenario and Current Path forecast. The two RECs, coming from a high base, will see significant progress in the Current Path forecast and significantly close the gap between them and Mauritius by 2043. Upper middle-income Africa would see less progress and by 2043 would have an infant mortality rate higher than SADC.
Chart 18 shows the lack of impact that the Demographic scenario has on the GDP per capita for Mauritius. By 2043, the GDP per capita is projected to be US$10 higher than in the Current Path forecast. The small rise is due to Mauritius’ already low infant mortality rate, low fertility rates and the current ratio of working-age people to dependants.
Reductions in poverty follow the same trend as those for the GDP per capita. Mauritius sees a reduction of 1 000 people who are extremely poor by 2043 in the Demographic scenario compared to the Current Path forecast and no change in the share of the population who are extremely poor due to a decline in population size. Mauritius would still eliminate extreme poverty at the US$5.50 poverty line by 2036.
This section presents reasonable but ambitious improvements in the Health/WaSH scenario, which include reductions in the mortality rate associated with both communicable diseases (e.g. AIDS, diarrhoea, malaria and respiratory infections) and non-communicable diseases (NCDs) (e.g. diabetes), as well as improvements in access to safe water and better sanitation. The acronym WaSH stands for water, sanitation and hygiene.
The intervention is explained in here in the thematic part of the website.
A key factor in improving the health of a country’s population is access to WaSH infrastructure. Improved cleanliness helps reduce the spread of communicable diseases such as diarrhoea and respiratory infections. Access to improved water and sanitation infrastructure has been widespread in Mauritius since 2000: at that time, 99.3% of the population had improved water access while 90.1% had improved sanitation access. Consequently, deaths due to communicable disease have been low, accounting for 6.8% of deaths in 2000, 5% in 2019 and are projected to account for only 3% of deaths by 2043 in the Current Path forecast.
An increase in non-communicable diseases normally occurs as countries grow richer and older, with the causes of death ever more linked to lifestyle choices and less to the spread of infectious diseases. The priority for the healthcare sector in Mauritius is thus the treatment of non-communicable diseases such as cardiovascular diseases, diabetes and mental health. Non-communicable diseases accounted for 89.7% of deaths in 2019 and this is expected to grow to 93.1% by 2043.
Life expectancy in Mauritius has increased as WaSH infrastructure has become more widespread and healthcare expenditure has increased. In 2000, average life expectancy was 71 years, while by 2019 the figure had risen to 75.2 years. This figure is much higher than the income peers’ average of 64.6 years in 2019. The percentage of GDP spent on healthcare also increased over that time, rising 2.9 percentage points from 2.9% of GDP in 2000 to 5.8% of GDP in 2018.
The Health/WaSH scenario improves life expectancy in Mauritius, combatting the increasing burden of non-communicable diseases. By 2043, life expectancy in Mauritius will be 78.9 years in the WaSH scenario compared to 78.1 in the Current Path forecast.
Mauritius has made good progress in combatting infant mortality, as discussed in the Demographic scenario section (Chart 17). In 2019, 12 infants died per 1 000 live births, a rate well below the average for African upper middle-income countries. Access to improved water and sanitation is widespread, a critical factor in improving health outcomes generally and infant mortality specifically. Other important factors are access to nutrients, skilled professionals for antenatal care, birth and postnatal care and access to immunisations. Mauritius does well in these areas: 99.8% of births were attended by skilled healthcare staff in 2017 and coverage of necessary vaccines for infant health was above 95% in 2019.
The Health/WaSH scenario does improve upon this already positive position. By 2043, infant mortality per 1 000 deaths is projected to be 8.3 in the Health/WaSH scenario, 0.4 deaths lower than in the Current Path forecast.
One area of concern related to infant mortality is maternal mortality, an area where progress has stalled over the last two decades. There were 59 maternal deaths per 100 000 live births in 2000 compared to 61 in 2017. The Mauritian government recognised the problem and has endeavoured to enhance antenatal care and improve ICU facilities for complex pregnancies in their latest health sector strategic plan.
The Agriculture scenario represents reasonable but ambitious increases in yields per hectare (reflecting better management and seed and fertilizer technology), increased land under irrigation and reduced loss and waste. Where appropriate, it includes an increase in calorie consumption, reflecting the prioritisation of food self-sufficiency above food exports as a desirable policy objective.
The intervention is explained in here in the thematic part of the website.
The data on yields per hectare (in metric tons) is for crops but does not distinguish between different categories of crops.
The Agriculture sector in Mauritius is constrained by various factors unique to small island states: a small domestic market, unfavourable climate, limited area and lack of space to grow crops at economically viable levels. The sector is dominated by sugar cane production, which covers most of the cultivated land due to its comparative advantage and suitability to the local climate. Mauritius thus relies on food imports to satisfy agricultural demand, while sugar cane is the only agricultural export of notable size and serves as an important earner of foreign currency.
The sugar cane sector is however facing a number of challenges which threaten its productivity and competitiveness. Rising labour costs coupled with decreasing productivity, due to reduced milling capacity and a short milling season, have strained production. Additionally, the number of small and medium planters has dropped as land available for sugar cane production continues to decrease.
Despite these challenges, Mauritius’ yield per hectare is still the highest in Africa, and far above the average for upper middle-income Africa. Yields are expected to decline however, from 62.3 in 2019 to 58.1 in the Agriculture scenario and 57.8 in the Current Path forecast.
The lack of land available to grow food at suitable levels means Mauritius is a net food importer, with food imports accounting for 20.8% of total imports in 2019. Chart 23 shows net agricultural imports as a per cent of agricultural demand, highlighting Mauritius’ import dependence for food. The percentage in 2019 of 3.7% is however somewhat misleading, as large amounts of food imports are offset by sugar cane exports, thus reducing net food imports. Mauritius is self-reliant in three food product sectors—fresh vegetables, poultry meat and eggs—with the rest of demand being met through imports.
In the Agriculture scenario, net agricultural imports are projected to amount to 4.5% of demand by 2043, 0.5 percentage points lower than the Current Path forecast. The improvement marginally widens the gap between Mauritius and the average for upper middle-income Africa, whose rate is projected to be 20.7% in 2043. SADC and COMESA are expected to see a sustained increase over the forecast horizon and surpass the 30% mark before 2043.
A minimal increase in yield per hectare and a small decrease in import dependence result in a limited increase in the GDP per capita for Mauritius in the Agriculture scenario compared to the Current Path forecast. By 2043, the GDP per capita is projected to be US$60 more than in the Current Path forecast.
The Education scenario represents reasonable but ambitious improved intake, transition and graduation rates from primary to tertiary levels and better quality of education. It also models substantive progress towards gender parity at all levels, additional vocational training at secondary school level and increases in the share of science and engineering graduates.
The intervention is explained in here in the thematic part of the website.
The Mauritian government has placed a strong emphasis on educating its population since independence, progressively making education free at all levels. Secondary education has been provided for free since 1976, with tertiary education following suit in 2019 at all public tertiary education institutions. Schooling has been made compulsory up to the age of 16, equating to 11 years of education. The result of these policies has been very high gross enrolment rates and positive gender parity indexes at both primary and secondary levels. Tertiary gross enrolment rates are also high, reaching 40.6% in 2017.
Chart 26 shows the mean years of education for adults aged 15 years and above and reflects the high rates of completion Mauritius has for primary and lower secondary schooling. In 2019, average education for both sexes was 9.5 years, with the female average 0.4 years below the male average. The average for both sexes is expected to increase to 11.3 in the Education scenario, 0.2 years higher than the Current Path forecast. Gender parity would also have been reached, with the female average being 0.1 years higher than the male average by 2043 in the Education scenario.
High averages for years of education do not however show the effectiveness of the schooling received. As noted earlier, the structural shift of the economy away from low-skilled agriculture and manufacturing work towards high-skilled manufacturing and services work has created a labour supply shortage. Youth increasingly do not have the skills employers are looking for, with the percentage of unemployed youth who had post-secondary or tertiary education equalling 39.5% in 2015.
In addition to years of educational attainment, education quality is an important factor to consider. Mauritius performs well in average test scores for both primary and secondary learners when compared to the rest of Africa, ranking in the top 5 in both metrics. In 2019, primary school learners achieved an average test score of 40.5 and secondary school learners achieved a score of 46.7. Both these scores are higher than the averages for upper middle-income Africa, SADC and COMESA. The Education scenario’s interventions improve these scores considerably: the primary level score increases to 56.4 by 2043, 8.2 higher than in the Current Path forecast, while the secondary level score increases to 70.2 by 2043, 11.6 higher than the Current Path forecast. Although these numbers are impressive for Mauritius, the gap between the skills provided through education and those demanded by employers remains problematic.
Chart 28 shows the impact that the Education scenario’s interventions could have on the GDP per capita compared to the Current Path forecast. By 2043, the GDP per capita would be US$590 higher than in the Current Path forecast, equating to a 2% increase.
The Manufacturing/Transfers scenario represents reasonable but ambitious manufacturing growth through greater investment in the economy, investments in research and development, and promotion of the export of manufactured goods. It is accompanied by an increase in welfare transfers (social grants) to moderate the initial increases in inequality that are typically associated with a manufacturing transition. To this end, the scenario improves tax administration and increases government revenues.
The intervention is explained in here in the thematic part of the website.
Chart 30 should be read with Chart 8 that presents a stacked area graph on the contribution to GDP and size, in billion US$, of the Current Path economy for each of the sectors.
Mauritius’ manufacturing sector has been steadily decreasing in size since 2001, from 20% value added to 16.6% of GDP in 2019 and is expected still to be 16% by 2043 in the Current Path forecast. When disaggregating the sector, non-export-oriented firms (excluding sugar milling) added 65% of the value and export-oriented firms added 35% in 2019. In the export-oriented sector, wearing apparel, accounted for 51.7% of value added at basic prices in 2017, while the non-export-oriented sector is dominated by the production of food and beverages and tobacco products. The manufacturing sector is also important for foreign exchange earnings as it represented 60.4% of merchandise exports in 2019.
In 2019, the manufacturing sector accounted for 23.8% of total employment, compared to 63.8% for the services sector. The wearing apparel segment of the manufacturing sector accounted for 45.6% of total employment, followed by 18% for food products and 7.7% in textiles. By 2043, employment in the manufacturing sector is projected to be 22.8% in the Current Path forecast, while services will account for 66.9% of total employment.
Chart 30 shows the difference in percentage value added of all six sectors in the Manufacturing/Transfers scenario compared to the Current Path forecast. Although services continue to lead the way, manufacturing will add an extra 0.2 percentage points of GDP by 2043 compared to the Current Path forecast. In absolute terms, the sector is projected to be US$270 million larger by 2043 compared to the Current Path forecast, again only topped by services.
Chart 31 shows the increase in welfare transfers to unskilled workers affected by the Manufacturing/Transfers scenario to compensate for the negative effects of increased investment in the manufacturing sector. The transfers aim to address the rising inequality caused by a manufacturing transition, as those without the requisite skills suffer from unemployment. This trend, as discussed earlier, is already under way in Mauritius, with a supply shortage of adequately skilled labour affecting wage equality. In 2019, welfare transfers equated to US$0.08 billion and would increase to US$0.35 billion by 2043 in the Manufacturing/Transfers scenario, US$30 million more than in the Current Path forecast.
The Manufacturing/Transfers scenario is projected to elicit an increase of 3.2% in GDP per capita by 2043 compared to the Current Path forecast, equating to an extra US$930 dollars per citizen. The scenario has the second largest potential to increase GDP per capita for the country, only topped by the Free Trade scenario.
By 2043, the poverty rate is projected to be 0.2 percentage points lower in the Manufacturing/Transfers scenario than in the Current Path forecast, lifting an additional 3 000 people out of poverty. Mauritius would marginally widen the gap of the average poverty rate for Africa’s upper middle-income countries, which would be 39.7% in 2043.
The Leapfrogging scenario represents a reasonable but ambitious adoption of and investment in renewable energy technologies, resulting in better access to electricity in urban and rural areas. The scenario includes accelerated access to mobile and fixed broadband and the adoption of modern technology that improves government efficiency and allows for the more rapid formalisation of the informal sector.
The intervention is explained in here in the thematic part of the website.
Fixed broadband includes cable modem Internet connections, DSL Internet connections of at least 256 KB/s, fibre and other fixed broadband technology connections (such as satellite broadband Internet, ethernet local area networks, fixed-wireless access, wireless local area networks, WiMAX, etc.).
Mauritius has the most fixed broadband subscriptions per 100 people and second highest percentage of the population connected to the Internet in Africa, behind only the Seychelles. High and equal levels of electricity access in both rural and urban areas help to explain these positive statistics. The government has also invested heavily in providing fibre to the whole island, reaching 100% Fibre-to-the-Home coverage in 2019. The liberalisation of the telecommunication sector in 2003 has ensured it benefits from healthy levels of competition. The 2019 Telecoms Maturity Index, published by BuddeComm, ranked the country as having the most mature telecoms market in Africa. [1The index considers the broadband, fixed and mobile markets of a country and benchmarks them against its region.]
Chart 34 shows how the already positive position can be improved upon by implementing the Leapfrogging scenario’s interventions. In 2019, Mauritius had 23 fixed broadband subscriptions per 100 people and is projected to reach the saturation point of 50 by 2035 in the Current Path forecast. The Leapfrogging scenario accelerates this progress, with the country reaching saturation in 2027, eight years earlier.
Mobile broadband refers to wireless Internet access delivered through cellular towers to computers and other digital devices.
Mobile network coverage is widespread with 4G being universally available to all inhabitants of the main island. In 2019, mobile broadband subscriptions per 100 people was 76.6, the 11th highest in Africa. The Current Path forecast projects rapid increases which the Leapfrogging scenario accelerates further, reaching 150 subscriptions per 100 people in 2025, compared to 2030 in the Current Path forecast.
The country has high and equal levels of electricity access in urban and rural areas. Mauritius is planning to increase the share of renewables in the energy mix, aiming for 35% by 2025. The country currently imports nearly all the energy sources it needs to generate electricity, while 55% of generation is undertaken by independent power producers.
The World Bank’s data pegged total electricity access at 100% in 2019, while IFs data showed 88.8%. There was no difference in access between rural and urban areas in 2019, and by 2043, IFs data projects access for both areas to be 96%. The Leapfrogging scenario increases total access by 2043 to 98.9%, 2.7 percentage points higher than the Current Path forecast, while rural access would reach 98.2% and urban access would equate to 100%.
Chart 37 highlights the positive impact that the Leapfrogging scenario would have on GDP per capita, raising it by US$320 by 2043 compared to the Current Path forecast. Increased access to fixed and mobile broadband would enable more Mauritians to enter the digital work domain and benefit from online services.
The Free Trade scenario represents the impact of the full implementation of the African Continental Free Trade Area (AfCFTA) by 2034 through increases in exports, improved productivity and increased trade and economic freedom.
The intervention is explained in here in the thematic part of the website.
The trade balance is the difference between the value of a country's exports and its imports. A country that imports more goods and services than it exports in terms of value has a trade deficit, while a country that exports more goods and services than it imports has a trade surplus.
Mauritius has a mixed tracked record in regional integration, according to the African Regional Integration Index, which measures progress along five forms of integration. The country performs well in macroeconomic integration, meaning its macroeconomic policy aligns well with regional partners and in infrastructural integration, reflecting Mauritius’ well developed ICT and electricity infrastructure. Below average scores are achieved in productive and trade integration, the latter showing Mauritius’ dependence on trade partners outside of Africa.
Exports to Europe constituted 45.4% of total exports in 2020, followed by 28.5% to Africa and 15% to Asia. Imports mainly originate from Asia and Europe, which constituted 54.4% and 26.6% of total imports in 2020. Wearing apparel and preserved fish constitute the largest proportion of exports, while energy imports make up a major share of imports.
Trade data for Mauritius varies considerably between IFs and other sources such as the World Bank and the Mauritius Chamber of Commerce and Industry. The former is used in this analysis. In 2019, Mauritius had a positive trade balance of 8.5% of GDP driven by exports of services 23.6% of GDP and manufactures 15.1% of GDP. The Free Trade scenario increases trade in both these sectors, exports of services increasing by 15.2 percentage points and imports of manufactures by 9 percentage points. The latter increase would result in the trade balance being 3.6 percentage points below the Current Path forecast by 2043 compared to the Free Trade scenario.
The Free Trade scenario increases the GDP per capita the most of all the sectoral scenarios. By 2043, the GDP per capita would increase by US$1 010 compared to the Current Path forecast, a rise of 3.5%.
The Free Trade scenario does increase the GDP per capita but the poverty rate remains largely unchanged, with a slight increase of 0.1 percentage points by 2043 compared to the Current Path forecast. Although contradictory, extreme poverty would still be eliminated at US$5.50 by 2036. A possible explanation is the domestic Gini index rising by 0.01, meaning that the increase in GDP per capita is not shared equally among the population with a slight increase in income inequality.
The Financial Flows scenario represents a reasonable but ambitious increase in worker remittances and aid flows to poor countries, and an increase in the stock of foreign direct investment (FDI) and additional portfolio investment inflows to middle-income countries. We also reduced outward financial flows to emulate a reduction in illicit financial outflows.
The intervention is explained in here in the thematic part of the website.
Mauritius does not rely on foreign aid for its development or social spending, due to its high levels of GDP per capita, low poverty rates and low levels of inequality. The country has also been politically stable for a long time and is not suffering from internal conflict or instability. In 2019, foreign aid equated to 0.4% of GDP and 1.9% of government revenue, low levels which are projected to decline along the Current Path forecast. The Financial Flows scenario decreases foreign aid as percentage of GDP by 2043 by 0.03 compared to the Current Path forecast, reaching a level of 0.21%.
Mauritius has low levels of foreign direct investment when compared to the rest of Africa. In 2019, FDI as a per cent of GDP stood at 3%, ranking the country 33rd on the continent. This is surprising as Mauritius is consistently ranked as the most competitive economy on the continent by the World Economic Forum and achieves a high score in the ease of doing business index, ranking 13th in the world in 2019.
Problematic factors include a rigid labour market, as described above, difficulty in attaining credit information and costs associated with importing and exporting goods. The Financial Flows scenario increases the inflow of FDI to 4.4% of GDP by 2043, 1 percentage point above the Current Path forecast. Mauritius has historically had low levels of FDI inflows and 4.4% would be in line with the trend of the last decade.
Even though the Mauritian diaspora is large, equating to 10% of the population, Mauritius does not receive large amounts of remittances and is a net sender of remittance money. The migrant population living in Mauritius in 2020 was small however, totalling 28 000 thousand people. The Mauritian Economic Development Board launched a diaspora scheme encouraging the diaspora to return to the country rather than increase remittance flows. The aim is to increase the number of skilled labourers in the economy and address the skilled labour supply shortage developing in the country.
Net remittances were US$-0.85 billion in 2019 and are projected to decrease further, reaching US$-3.8 billion by 2043 in the Financial Flows scenario, a fall of US$160 million compared to the Current Path forecast. The decrease equates to a 0.1 percentage point fall in remittances as a per cent of GDP by 2043.
The Financial Flows scenario is projected to increase the GDP per capita by US$630 by 2043 compared to the Current Path forecast. The increase of 2.2% will see the GDP per capita rise to US$29 740 by 2043, up from a base of US$22 390 in 2019.
The Infrastructure scenario represents a reasonable but ambitious increase in infrastructure spending across Africa, focusing on basic infrastructure (roads, water, sanitation, electricity access and ICT) in low-income countries and increasing emphasis on advanced infrastructure (such as ports, airports, railway and electricity generation) in higher-income countries.
Note that health and sanitation infrastructure is included as part of the Health/WaSH scenario and that ICT infrastructure and more rapid uptake of renewables are part of the Leapfrogging scenario. The interventions there push directly on outcomes, whereas those modelled in this scenario increase infrastructure spending, indirectly boosting other forms of infrastructure, including that supporting health, sanitation and ICT.
The intervention is explained in here in the thematic part of the website.
Mauritius’ basic WaSH and ICT infrastructures are well developed and explain the country’s good health record and widespread access to wireless Internet. Road infrastructure is also well developed, with 98.9% of roads paved in 2019. The country does score low in the World Economic Forum’s road connectivity index however, a measure designed to gauge the ease and speed with which one can travel between a country’s major cities. Mauritius achieves a score of 36.3% and the low road connectivity index score is one of the reasons it has a low transport infrastructure score in the Global Competitiveness Report. Furthermore, the cost of documentary compliance when importing and exporting negatively affects port efficiency. These problems point to Mauritius needing to focus more on upgrading their advanced infrastructure as opposed to basic infrastructure, which is well developed.
Electricity access is another basic infrastructure component Mauritius has excelled in. As discussed in the Leapfrogging scenario, the World Bank’s data shows electricity access as being 100% in 2019, while IFs data shows 88.9%. Following the IFs estimation, in the Infrastructure scenario, electricity access is projected to be 97.7% of the total population by 2043, 1.5 percentage points higher than in the Current Path forecast.
Indicator 9.1.1 in the Sustainable Development Goals refers to the proportion of the rural population who live within 2 km of an all-season road and is captured in the Rural Access Index.
Indicator 9.1.1 falls under Goal 9 and Target 9.1 of the Sustainable Development Goals. Goal 9 aims for the building of resilient infrastructure that crosses borders and aids economic development and improves human well-being. Mauritius had a score in the Rural Access Index of 78.5% in 2019, a score aided by the country’s small surface area and high levels of GDP per capita. Increased access to roads improves access to services for those living in rural areas and reduces transport costs. Ensuring the rural population is adequately connected to urban areas will remain a priority for Mauritius as urbanisation is projected to stagnate over the forecast horizon. The Infrastructure scenario increases the country’s Rural Access Index score to 95.6% by 2043, 1.6 percentage points higher than in the Current Path forecast.
The Infrastructure scenario increases the GDP per capita to US$29 390 by 2043, US$280 more than in the Current Path forecast. Mauritius’ already high level of electricity access and good rural connectivity means the scenario has a smaller impact compared to other sectoral interventions.
The Governance scenario represents a reasonable but ambitious improvement in accountability and reduces corruption, and hence improves the quality of service delivery by government.
The intervention is explained in here in the thematic part of the website.
As defined by the World Bank, government effectiveness ‘captures perceptions of the quality of public services, the quality of the civil service and the degree of its independence from political pressures, the quality of policy formulation and implementation, and the credibility of the government’s commitment to such policies’.
Government effectiveness is one of six indicators that the World Bank uses to measure governance. The bank investigates three dimensions of governance, i.e. political, economic and institutional respect, with two indicators detailed under each dimension. Together these indicators are used to gauge the quality of governance in a country.
Mauritius performs the best on the continent in the government effectiveness indicator, scoring 3.6 out 5 in 2019. The country is also ranked on top when taking an average of all six indicators and has done so for the last 14 years. The country has experienced peaceful political transitions for much of its independent existence, increasing stability and promoting efficient service delivery. In the Governance scenario government effectiveness remains largely unchanged due to an already high score, increasing by 0.01 percentage points by 2043 compared to the Current Path forecast score of 3.76.
Mauritius does however have issues regarding corruption, particularly in its financial services sector. The country scores much lower in the World Bank’s corruption indicator than in any other and its score in Transparency International’s corruption index has decreased by four points since 2012. The country was identified as a high-risk country for international financial systems due to deficiencies in its anti-money laundering and counter financing of terrorism regime. The opaqueness associated with its offshore financial industry was already identified as problematic by Transparency International in 2014.
The Governance scenario increases the GDP per capita by US$200 by 2043 compared to the Current Path forecast, resulting in a projected income of US$29 310. The rise in GDP per capita is attributable to a very small increase in government effectiveness.
This section presents projections for carbon emissions in the Current Path for Mauritius and the 11 scenarios. Note that IFs uses carbon equivalents rather than CO2 equivalents.
Africa is a low emitter globally, and Mauritius emitted the 26th most carbon on the continent in 2019. On a per capita basis however, Mauritius ranks fifth in Africa at one ton per capita, 2.8 tons fewer than South Africa in 2019. The scenario that increases Mauritius’ emission the most by 2043 is the Free Trade scenario, raising emissions by 0.06 million tons of carbon. The Manufacturing/Transfers scenario leads until 2041, after which the Free Trade scenario sees the full implementation of the AfCFTA taking effect. The Agriculture scenario as well as the Demographic scenario impact carbon emissions least. This is in contrast with other African states, where the Agriculture scenario has a much larger impact due to their agricultural sectors being less developed than Mauritius’.
The Combined scenario consists of the combination of all 11 sectoral scenarios presented above, namely the Stability, Demographics, Health/WaSH, Agriculture, Education, Manufacturing/Transfers, Leapfrogging, Free Trade, Financial Flows, Infrastructure and Governance scenarios. The cumulative impact of better education, health, infrastructure, etc. means that countries get an additional benefit in the integrated IFs forecasting platform that we refer to as the synergistic effect. Chart 55 presents the contribution of each of these 12 components to GDP per capita in the Combined scenario.
Mauritius has succeeded in transitioning away from a mono-crop economy to a high level of diversification. The country’s manufacturing base is solid and high value-added services are contributing more and more to the economy. Health and education outcomes are positive due to a concerted effort by the government to provide universal WaSH infrastructure and free education at all educational levels. The widespread use of mobile broadband services, near universal electricity access and a high percentage of paved roads means Mauritians are well connected to services, physically and online.
As a highly developed country, the risks and challenges Mauritius faces are complex. The transition away from low-skilled agriculture and manufacturing has created a skilled labour supply shortage, a problem the education system must address swiftly. Allegations of corruption linked to the offshore financial services sector also need to be addressed, while levels of FDI inflows remain low. The cross cutting issue of gender inequality also requires attention, especially the low female labour force participation rate.
Chart 55 shows the Free Trade scenario having the biggest impact on GDP per capita of all the discussed scenarios, increasing average incomes by US$1 003 by 2043 compared to the Current Path forecast. The Manufacturing/Transfers scenario is second, showing the value of a more developed manufacturing sector, followed by the Financial Flows scenario. The synergistic effect of full implementation of all 11 scenarios increases GDP per capita the most, raising GDP per capita by US$1 046 by 2043.
Chart 55 presents a stacked area graph on the contribution of each scenario to GDP per capita as well as the additional benefit or synergistic effect, whereas Chart 56 presents only the GDP per capita in the Current Path forecast and the Combined scenario.
Mauritius stands to benefit greatly from the interventions outlined in the mentioned scenarios. The Combined scenario increases the GDP per capita by US$5 380 by 2043 compared to the Current Path forecast, equating to an 18.5% increase.
Mauritius is projected to eliminate extreme poverty at US$5.50 per day by 2036 along the Current Path forecast. There is thus little room for improvement, but the Combined scenario is projected to bring the elimination of extreme poverty in Mauritius forward by a year and decrease the poverty rate by 0.5 percentage points by 2043. This steady elimination of poverty coincides with a decline in the domestic inequality, as the country’s domestic Gini index score decreases from 0.36 in 2019 to 0.31 by 2043.
See Chart 8 to view the Current Path forecast of the sectoral composition of the economy.
The Combined scenario would dramatically increase the size of the services sector, but the manufacturing and ICT sectors are projected to experience more muted growth. By 2043, the services sector is projected to add 4.8 percentage points more to GDP than in the Current Path forecast, whereas manufacturing and ICT see a decrease of 2.4 and 1.7 percentage points respectively. Mauritius’ service would also be US$6.7 billion larger by 2043 than in the Current Path forecast, dwarfing manufacturing’s increase of US$320 million.
Chart 59 shows the robust GDP growth Mauritius is projected to experience under the Combined scenario compared to the Current Path forecast. By 2043, the economy would be 26% larger, equating to an increase of US$7.1 billion.
The economic benefits associated with the Combined scenario will be accompanied by slight increases in carbon emissions. Mauritius is projected to emit 0.3 million tons more carbon by 2043 in the Combined scenario, compared to the Current Path forecast. The country’s emissions do however increase much slower than the rest of Africa, as it sinks to 42nd position in the continent by 2043.
Endnotes
The index considers the broadband, fixed and mobile markets of a country and benchmarks them against its region.
Page information
Contact at AFI team is Du Toit McLachlan
This entry was last updated on 31 May 2026 using IFs v7.63.
Donors and sponsors


Reuse our work
- All visualizations, data, and text produced by African Futures are completely open access under the Creative Commons BY license. You have the permission to use, distribute, and reproduce these in any medium, provided the source and authors are credited.
- The data produced by third parties and made available by African Futures is subject to the license terms from the original third-party authors. We will always indicate the original source of the data in our documentation, so you should always check the license of any such third-party data before use and redistribution.
- All of our charts can be embedded in any site.
Cite this research
Du Toit McLachlan (2026) Mauritius Development Futures. Published online at futures.issafrica.org. Retrieved from https://futures.issafrica.org/geographic/countries/mauritius/ [Online Resource] Updated 31 May 2026.