 Zimbabwe
Feedback welcome
Our aim is to use the best data to inform our analysis. See our Technical page for information on the IFs forecasting platform. We appreciate your help and references for improvements via our feedback form.
This page explores Zimbabwe's current and projected future development, examining various sectoral scenarios and their potential impacts on the country's growth and development. It explores eight individual sectoral scenarios: demographics and health, agriculture, education, manufacturing, infrastructure and leapfrogging, the African Continental Free Trade Area (AfCFTA), financial flows and governance. Additionally, it evaluates the combined impact of these scenarios on Zimbabwe’s economic growth and development up to 2043, marking the conclusion of the third ten-year implementation plan for the African Union Agenda 2063. The analysis provides insights into policy measures that could strengthen the country's development path.
The report is divided into five sections. The first section introduces the country by providing its geographical location, social structure and political history. The second section outlines the Current Path for Zimbabwe, which unfolds through 2043. This Current Path is based on country-level data sourced from various reputable data sources, focusing on prioritising data from national sources. It covers key growth and development factors, including demographics, real Gross Domestic Product (GDP) in market exchange rates (MER), informal economy, real GDP per capita, poverty levels, and the National Development Plan (NDP). The third section presents individual sectorial scenarios outlining potential improvements in the eight key sectors mentioned above. The fourth section is divided into two parts. The first part analyses the impact of individual and combined scenarios on economic growth, specifically real GDP in purchasing power parity (PPP) and poverty alleviation. The second part examines the impact of the combined scenario on various factors, including real GDP per capita at MER, value-add by sector, the informal economy, life expectancy, income inequality, carbon emissions, and energy distribution. The report concludes in the final section.
For more information about the International Futures modelling platform we use to develop the various scenarios, please see About this Site.
Executive Summary
We begin this page with an introductory assessment of the country’s context by looking at current population distribution, social structure, climate and topography.
- Zimbabwe is a landlocked country in Southern Africa, classified as a lower-middle-income country, with a total land area of 390 757 square kilometres (km²). It shares borders with Zambia to the northwest, Mozambique to the east and northeast, South Africa to the south, and Botswana to the southwest. The country possesses abundant natural resources and fertile land suitable for agriculture. As of 2024, the agricultural sector employed 70% of the population, making it the largest employer, particularly in rural areas. This sector plays a crucial role in poverty alleviation and rural development. Besides agriculture, Zimbabwe's economy also relies on mining and the informal sector. However, to fully capitalise on these economic sectors and drive structural transformation, the country must enhance beneficiation and governance reforms.
This section is followed by an analysis of the Current Path for Zimbabwe, which informs the country’s likely current development trajectory to 2043. It is based on current geopolitical trends and assumes that no major shocks would occur in a ‘business-as-usual’ future.
- Zimbabwe’s population structure is characterised by a youthful and growing population, with a high proportion of children (under 15 years) and a gradually increasing working-age population (15-64 years). By 2023, the total population was estimated at 16 million, with 41% under the age of 15 and 56% in the working-age category. Around 33% of the population resided in urban areas, while the remaining 67% lived in rural areas. In the Current Path (business-as-usual) scenario, the population will grow at an average annual rate of 2%, reaching approximately 24 million by 2043. This trajectory will be mainly driven by declining fertility rates and increasing life expectancy.
- Zimbabwe's economy has undergone significant fluctuations, shifting between periods of prosperity, crisis and recovery. Following its recovery from the COVID-19 pandemic, the country's GDP reached US$19 billion in 2023. The Current Path presents a cautiously optimistic outlook, projecting an average annual GDP growth rate of 5% between 2023 and 2030, which will raise GDP to US$27 billion by 2030. If the growth rate accelerates to 7% annually between 2031 and 2043, GDP will potentially reach US$68 billion by 2043. However, this projection indicates that Zimbabwe is unlikely to achieve its Vision 2030 target of an annual GDP growth rate between 7% and 10% unless the interventions outlined in this report are effectively implemented.
- On the Current Path, Zimbabwe’s GDP in purchasing power parity (PPP) will increase from US$2 190 in 2023 to approximately US$2 580 by 2030 and further rise to around US$4 400 by 2043. These forecasts are based on an annual average growth rate of about 2.3% between 2023 and 2030, followed by a growth rate of 4.2% per year from 2031 to 2043.
- In 2023, the informal sector accounted for 40% of employment and 54% of GDP. Though its share of both employment and GDP will decline to 35% by 2043 on the Current Path, it will remain a critical component of the economy and a key source of livelihood.
- On the Current Path, extreme poverty affected 35% of the population (5.6 million people) in 2023. While absolute numbers may rise slightly to 5.7 million by 2030, representing 30% of the population, improvements are projected by 2043, with extreme poverty affecting 18% (4.3 million people). These statistics are concerning, especially when considering that in 1998, only 0.96 million people lived in extreme poverty, accounting for just 8% of the population.
- The National Development Strategy 1 (NDS1) aims to build on the achievements of the Transitional Stabilization Programme (TSP) and guide Zimbabwe toward achieving Vision 2030, transforming the country into an upper-middle-income economy. Beyond 2030, the focus will shift to economic modernisation and long-term prosperity by 2043.
The next section compares progress on the Current Path with eight sectoral scenarios. These are Demographics and Health; Agriculture; Education; Manufacturing; the African Continental Free Trade Area (AfCFTA); Large Infrastructure and Leapfrogging; Financial Flows; and Governance. Each scenario is benchmarked to present an ambitious but reasonable aspiration in that sector.
- Sustained policy focus and increased investment in Demographics and Health scenario will reduce the infant mortality rate from 37 deaths per 1 000 live births in 2023 to 27 and 15 deaths per 1 000 live births by 2030 and 2043, respectively. This trend suggests that the country will achieve the Sustainable Development Goal 3.2 target of reducing infant mortality to below 25 deaths per 1 000 live births by 2032. However, if Zimbabwe remains on the Current Path, this milestone would be delayed until 2040.
- Enhancing domestic crop production capacity through targeted interventions in the Agriculture scenario can boost crop yields, strengthening the resilience of Zimbabwe’s agricultural sector. As a result, in this scenario, agriculture import dependence will decrease to 31% by 2043, a significant drop from the 53% on the Current Path.
- The country's education sector faces several significant challenges, including inadequate infrastructure (both hard and soft), a shortage of teachers and insufficient funding, all of which stem from political and economic instability. The interventions proposed in the Education scenario aim to address these issues. Consequently, under this scenario, the average educational attainment for the lower youth age group (15-24 years) will reach 8.7 years, slightly higher than the 8.6 years on the Current Path. The average educational attainment for adults aged 15 and older will increase to 11.4 years by 2043 in the Education scenario, compared to 11.3 years on the Current Path.
- Zimbabwe's business regulatory environment and industrial development outlook indicate substantial potential for growth in the manufacturing sector. This growth is dependent on factors such as political stability, institutional reforms, investment in research and development (R&D), and initiatives in beneficiation. By implementing these measures, Zimbabwe's manufacturing sector will experience a revitalisation, with its contribution to GDP increasing from 15.6% on the Current Path to 18.5% by 2043 in the Manufacturing scenario. The Manufacturing scenario, thus, places Zimbabwe's manufacturing sector share above the average of 17.2% for lower-middle-income African countries by 2043.
- Interventions in the AfCFTA scenario aim to ensure that export growth matches the increase in imports, helping to maintain a favourable trade balance. If these interventions are effectively implemented, Zimbabwe's trade deficit could decrease to 3.6% of GDP by 2043 in the AfCFTA scenario, compared to 5.5% on the Current Path. In terms of sectoral impact, these interventions will significantly boost export growth in materials, followed by services, agriculture, ICT and energy. However, manufacturing exports will be adversely impacted, indicating a crowding-out effect.
- Zimbabwe’s advancements in energy, transportation, clean cooking technologies and digital connectivity highlight its steady progress toward sustainable development and modernisation. With government incentives and global sustainability efforts promoting clean cooking, Zimbabwe will achieve near-universal access to clean and efficient cookstoves by 2043, with approximately 72% of households (4.2 million people) using modern fuel-powered cookstoves in the Large Infrastructure and Leapfrogging scenario, compared to 63% (3.7 million people) on the Current Path. Additionally, interventions in the Large Infrastructure and Leapfrogging scenario will boost mobile and fixed broadband subscriptions to 147 and 6 per 100 people, respectively, in 2043. This compares to 145.3 mobile and 28.7 fixed broadband subscriptions per 100 people on the Current Path by 2043.
- Zimbabwe's economic outlook remains cautiously optimistic, with significant progress expected in debt reduction, government revenue collection, Foreign Direct Investment (FDI) and decreased reliance on financial aid. In the Financial Flows scenario, FDI will increase from 3.1% of GDP in 2023 to approximately 5% by 2043, compared to just 3.8% on the Current Path. These measures will also play a crucial role in reducing Zimbabwe's dependence on financial aid, with aid receipts as a share of GDP dropping from 3% in 2023 to 0.5% by 2043 in the Financial Flows scenario, slightly lower than the 0.6% on the Current Path.
- Zimbabwe’s governance system has undergone significant evolution over time, shaped by various internal and external factors that have influenced its legal and political frameworks. By 2023, the country’s composite governance index stood at 0.49. Interventions in the Governance scenario have the potential to significantly improve governance, positioning Zimbabwe above the average for lower-middle-income African countries. As a result, the composite governance index will increase to 0.62 by 2043 in this scenario, compared to 0.55 on the Current Path.
In the third section, we compare the impact of each of these eight sectoral scenarios with one another and subsequently with a Combined scenario (the integrated effect of all eight scenarios). In our forecasts, we measure progress on various dimensions such as economic size (in market exchange rates), gross domestic product per capita (in purchasing power parity), extreme poverty, carbon emissions, the changes in the structure of the economy, and selected sectoral dimensions such as progress with mean years of education, life expectancy, the Gini coefficient or reductions in mortality rates.
- The Combined scenario can push Zimbabwe’s GDP per capita in PPP to US$9 470 by 2043, exceeding the Current Path by US$5 070 (115%). Among individual scenarios, Manufacturing will have the most substantial impact on GDP per capita both in the short and long run, raising it to US$7 040 by 2043, followed by Large Infrastructure and Leapfrogging (US$4 830), AfCFTA (US$4 660), Governance (US$4 570), Financial Flows (US$4 510), Agriculture (US$4 470), Demographics and Health (US$4 460) and Education (US$4 440).
- With effective implementation of interventions in the Combined scenario, Zimbabwe’s extreme poverty rate can significantly fall to 3% (610 000 people) by 2043, compared to 18% (4.2 million) on the Current Path. Among individual scenarios, the Manufacturing scenario shows the greatest potential for reducing extreme poverty, bringing the rate down to 9% (2 million people) by 2043. This is followed by the Large Infrastructure and Leapfrogging scenario at 11% (2.7 million) and Financial Flows at 16% (3.9 million). Other sectoral scenarios would result in an extreme poverty level of about 17% (approximately 4 million people).
- If Zimbabwe adopts the interventions proposed in the Combined scenario, the country will achieve significant economic growth, with an average annual growth rate of 8% from 2026 to 2030, compared to 5% on the Current Path. These measures are essential for supporting Zimbabwe's Vision 2030, which aims for GDP growth rates between 7% and 10% by 2030. Looking ahead, from 2026 to 2043, the average annual growth rate will reach 12% in the Combined scenario, surpassing the 9% growth rate on the Current Path by 3 percentage points. Consequently, Zimbabwe's GDP (MER) will be approximately US$2.6 billion larger than the Current Path by 2030 and US$93 billion larger by 2043.
- The Combined scenario will shift 31% of the informal sector’s GDP and employment contribution to the formal economy by 2043, enhancing overall economic resilience and national development.
- A successful shift to cleaner energy, driven by technological leapfrogging and sustainability-focused policies, can significantly reduce carbon emissions from 2.5 million tons in 2023 to approximately 760 000 tons by 2043 under the Combine scenario. In contrast, emissions are forecasted to reach 7.3 million tons on the Current Path.
- If Zimbabwe successfully implements interventions in the Combined Scenario, total energy production will reach 259.1 million barrels of oil equivalent, surpassing the Current Path by 407 percentage points. This would result in an energy surplus of approximately 112.6 million barrels of oil equivalent, enabling Zimbabwe to meet growing energy needs while reducing reliance on hydro and fossil fuels, fostering sustainable energy production, and building a more resilient energy system for the future.
We end this page with a summarising conclusion offering key recommendations for decision-making.
Zimbabwe faces major growth and development challenges, including food insecurity, limited economic diversification and beneficiation, low agricultural productivity, an unfavourable business climate, inadequate infrastructure and insufficient skills development. These issues stem from over three decades of political and economic instability. While addressing these challenges is essential for achieving inclusive and sustainable growth, prioritising the manufacturing sector is critical. By 2043, manufacturing will play a key role in driving sustainable economic growth and improving living standards. Focusing on this sector will help Zimbabwe diversify its economy, create jobs, reduce poverty and enhance resilience against external economic shocks. To fully unlock its potential, the country must invest strategically in skills development, infrastructure, innovation and governance reforms that foster a supportive environment for value-add and beneficiation investments. These initiatives are essential for Zimbabwe’s Vision 2030, which aims for a GDP expansion of 7-10% by 2030.
All charts for Zimbabwe Development Futures
- Chart 1: Political map of Zimbabwe
- Chart 2: Population structure in the Current Path, 1990–2043
- Chart 3: Population distribution map, 2023
- Chart 4: Urban and rural population in the Current Path, 1990-2043
- Chart 5: GDP (MER) and growth rate in the Current Path, 1990–2043
- Chart 6: Size of the informal economy in the Current Path, 2020-2043
- Chart 7: GDP per capita in Current Path, 1990–2043
- Chart 8: Extreme poverty in the Current Path, 2020–2043
-
Chart 9: National Development Plan of Zimbabwe
Chart 9: National Development Plan of Zimbabwe

- Chart 10: Relationship between Current Path and scenario
- Chart 11: Mortality distribution in the Current Path, 2023 and 2043
- Chart 12: Infant mortality rate in Current Path and Demographics and Health scenario, 2020–2043
- Chart 13: Demographic dividend in the Current Path and the Demographics and Health scenario, 2020–2043
- Chart 14: Crop production and demand in the Current Path, 1990-2043
- Chart 15: Import dependence in the Current Path and Agriculture scenario, 2020–2043
- Chart 16: Progress through the education funnel in the Current Path, 2023 and 2043 Per cent of-age children
- Chart 17: Mean years of education in the Current Path and Education scenario, 2020–2043 15 to 24 age group
- Chart 18: Value-add by sector as % of GDP in the Current Path, 2020 and 2043
- Chart 19: Value-add by the manufacturing sector in the Current Path and Manufacturing scenario, 2020–2043
- Chart 20: Exports and imports as % of GDP in the Current Path and the AfCFTA scenario, 2000-2043
- Chart 21: Trade balance in the Current Path and AfCFTA scenario, 2020–2043 % of GDP
- Chart 22: Electricity access: urban, rural and total in the Current Path, 2000-2043
- Chart 23: Cookstove usage in the Current Path and Large Infra/Leapfrogging scenario, 2020–2043 Number of people
- Chart 24: Access to mobile and fixed broadband in the Current Path and the Large Infra/Leapfrogging scenario, 2020–2043 % of population, toggle between mobile and fixed broadband
- Chart 25: FDI, foreign aid and remittances as % of GDP in the Current Path and in the Financial Flows scenario, 1990-2043
- Chart 26: Government revenue in the Current Path and Financial Flows scenario, 2020–2043 US$ 2017 and % of GDP
- Chart 27: Government effectiveness score in the Current Path, 2002-2043
- Chart 28: Composite governance index in the Current Path and Governance scenario, 2023 and 2043
- Chart 29: GDP per capita in the Current Path and scenarios, 2020–2043
- Chart 30: Poverty in the Current Path and scenarios, 2020–2043
- Chart 31: GDP (MER) in the Current Path and Combined scenario, 2020–2043
- Chart 32: GDP per capita in the Current Path and Combined scenario, 2023-2043
- Chart 33: Value-add by sector in the Current Path and Combined scenario, 2023 and 2043
- Chart 34: Informal sector in the Current Path and Combined scenario, 2020–2043
- Chart 35: Life expectancy in the Current Path and Combined scenario, 2020–2043
- Chart 36: Domestic Gini in the Current Path and Combined scenario, 2023 and 2043
- Chart 37: Carbon emissions in the Current Path and Combined scenario, 2020–2043
- Chart 38: Energy demand and production by type in the Current Path and Combined scenario, 2020-2043
- Chart 39: Policy recommendations
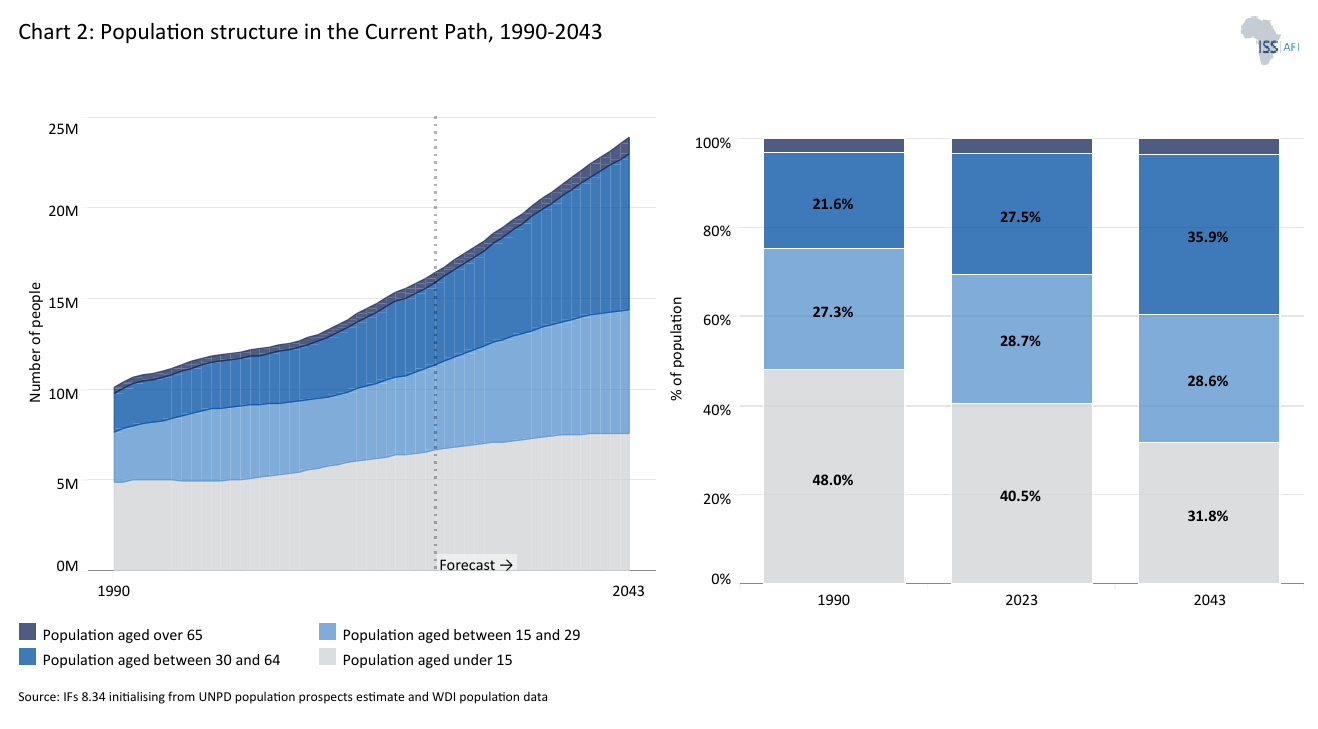
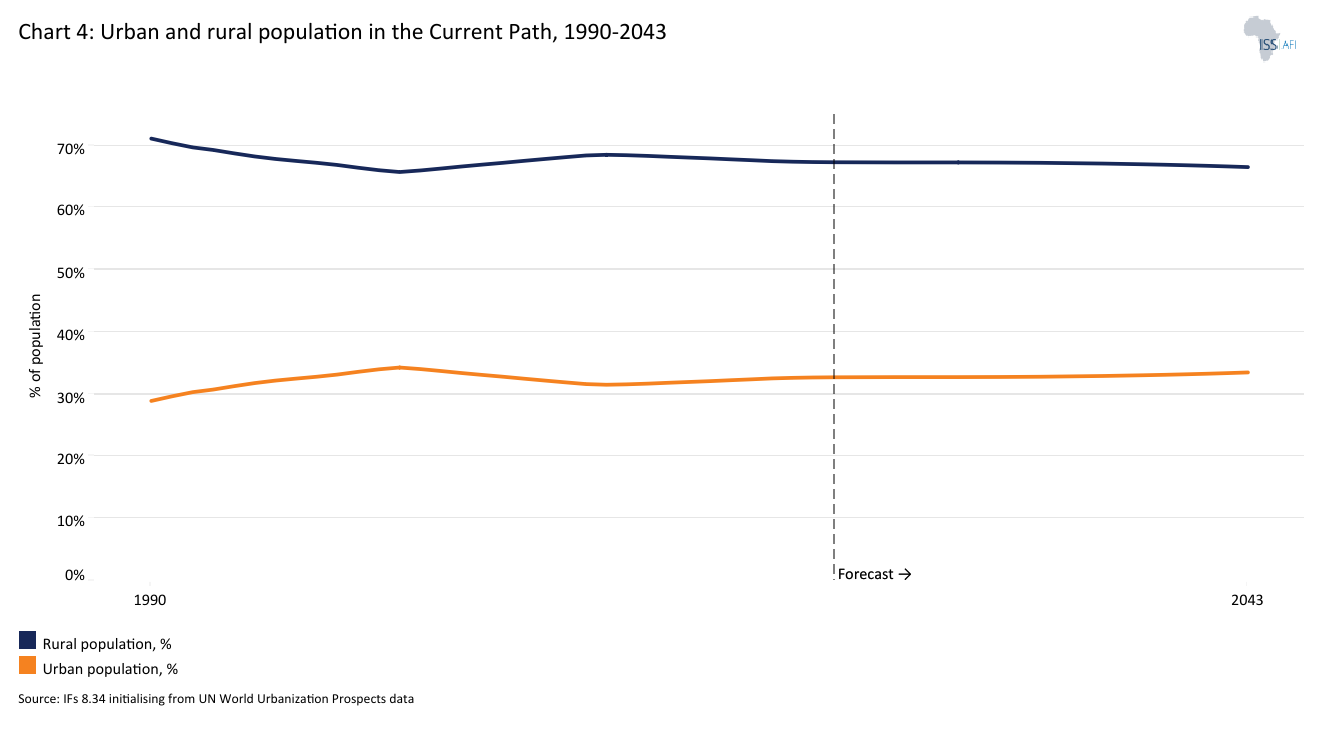
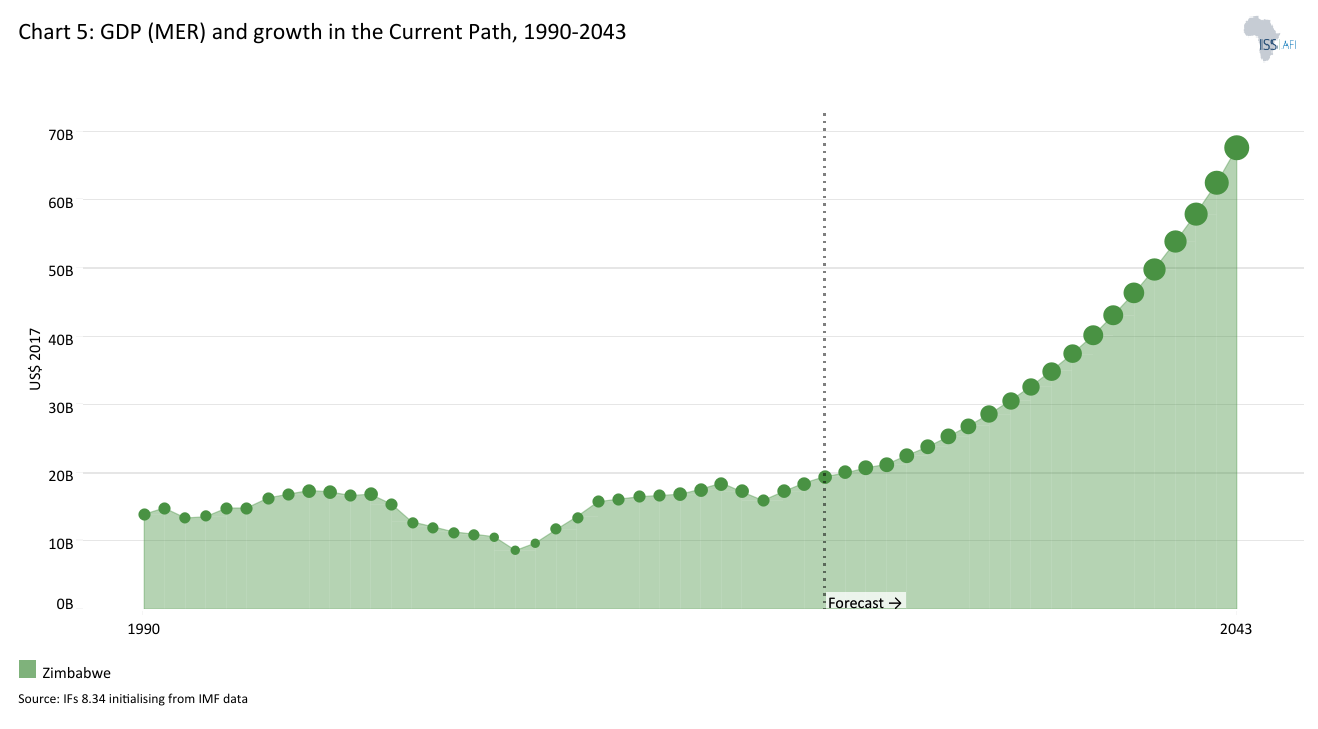
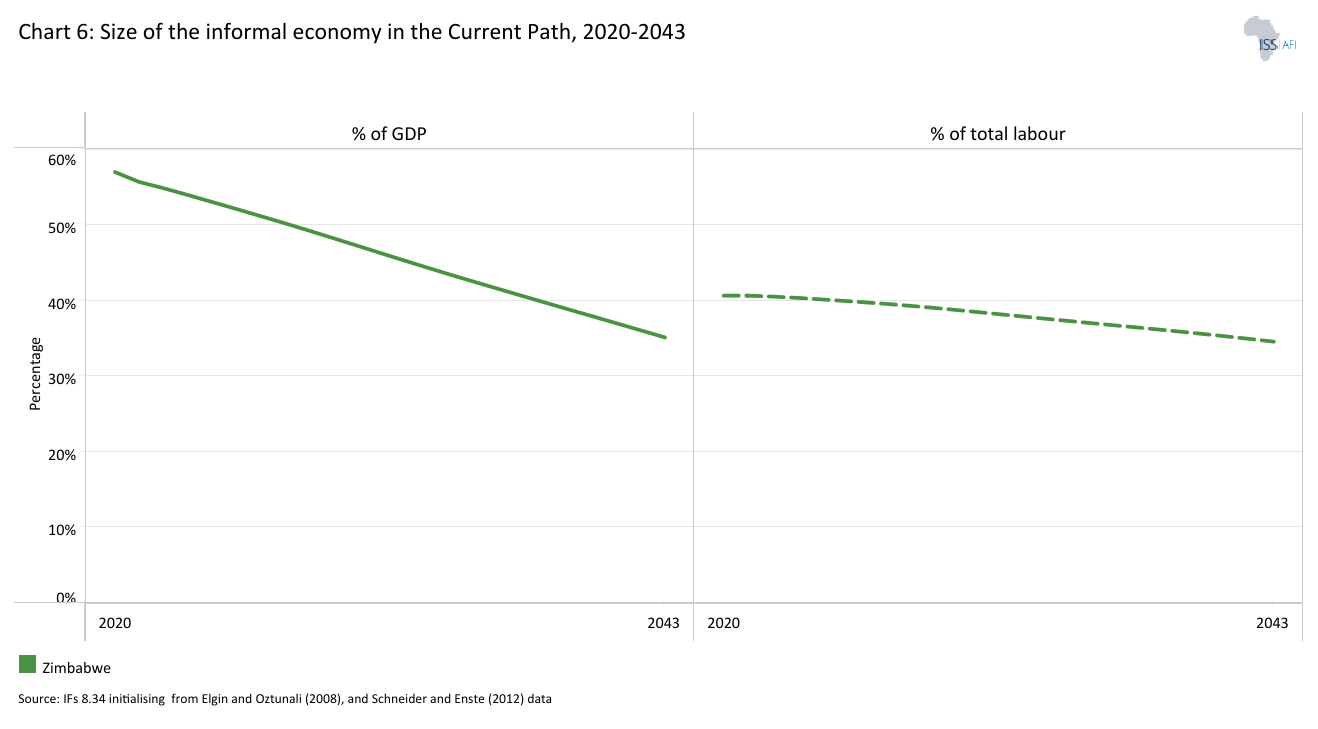
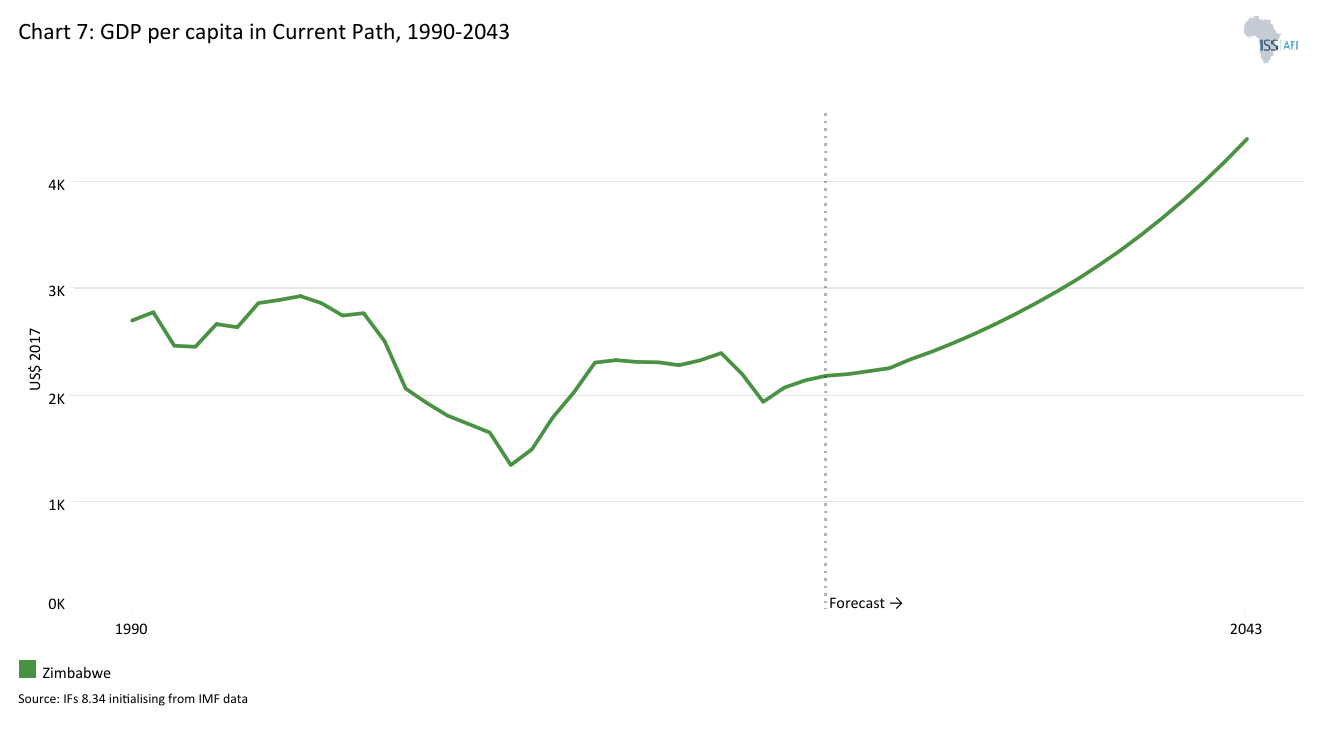
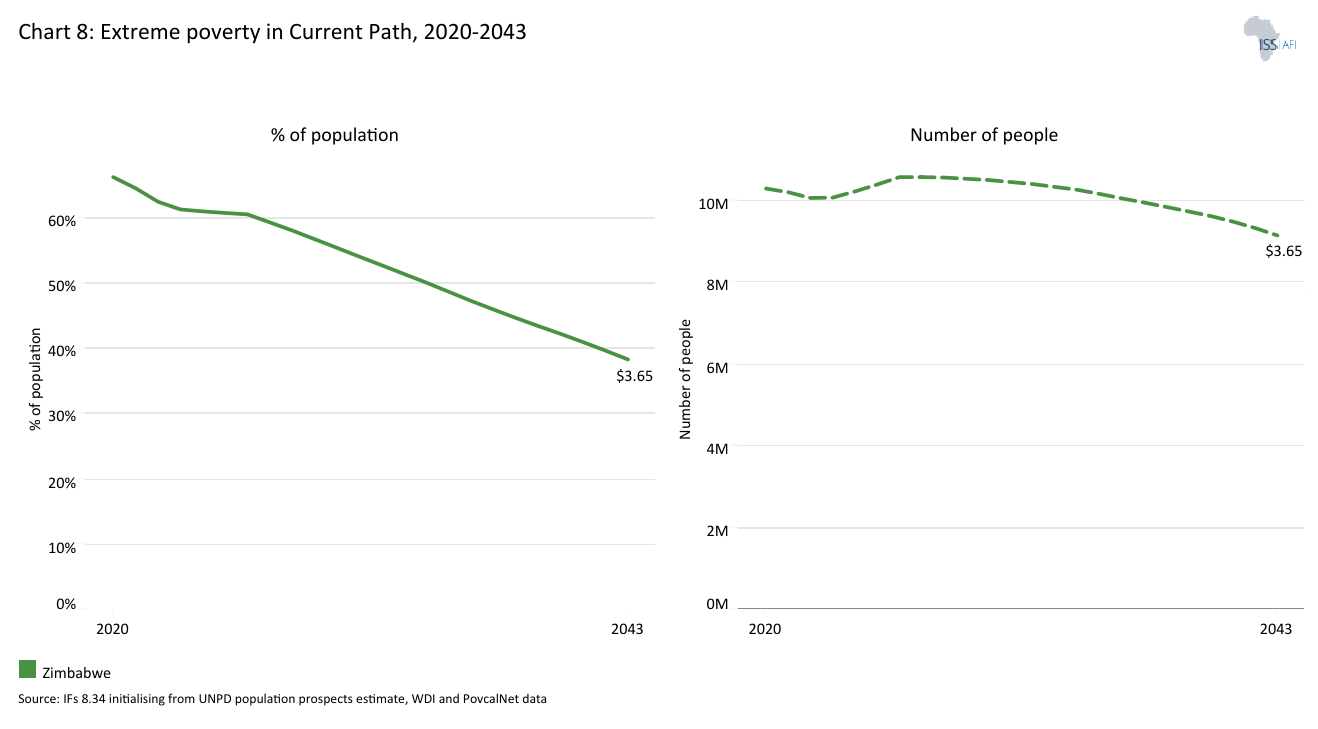
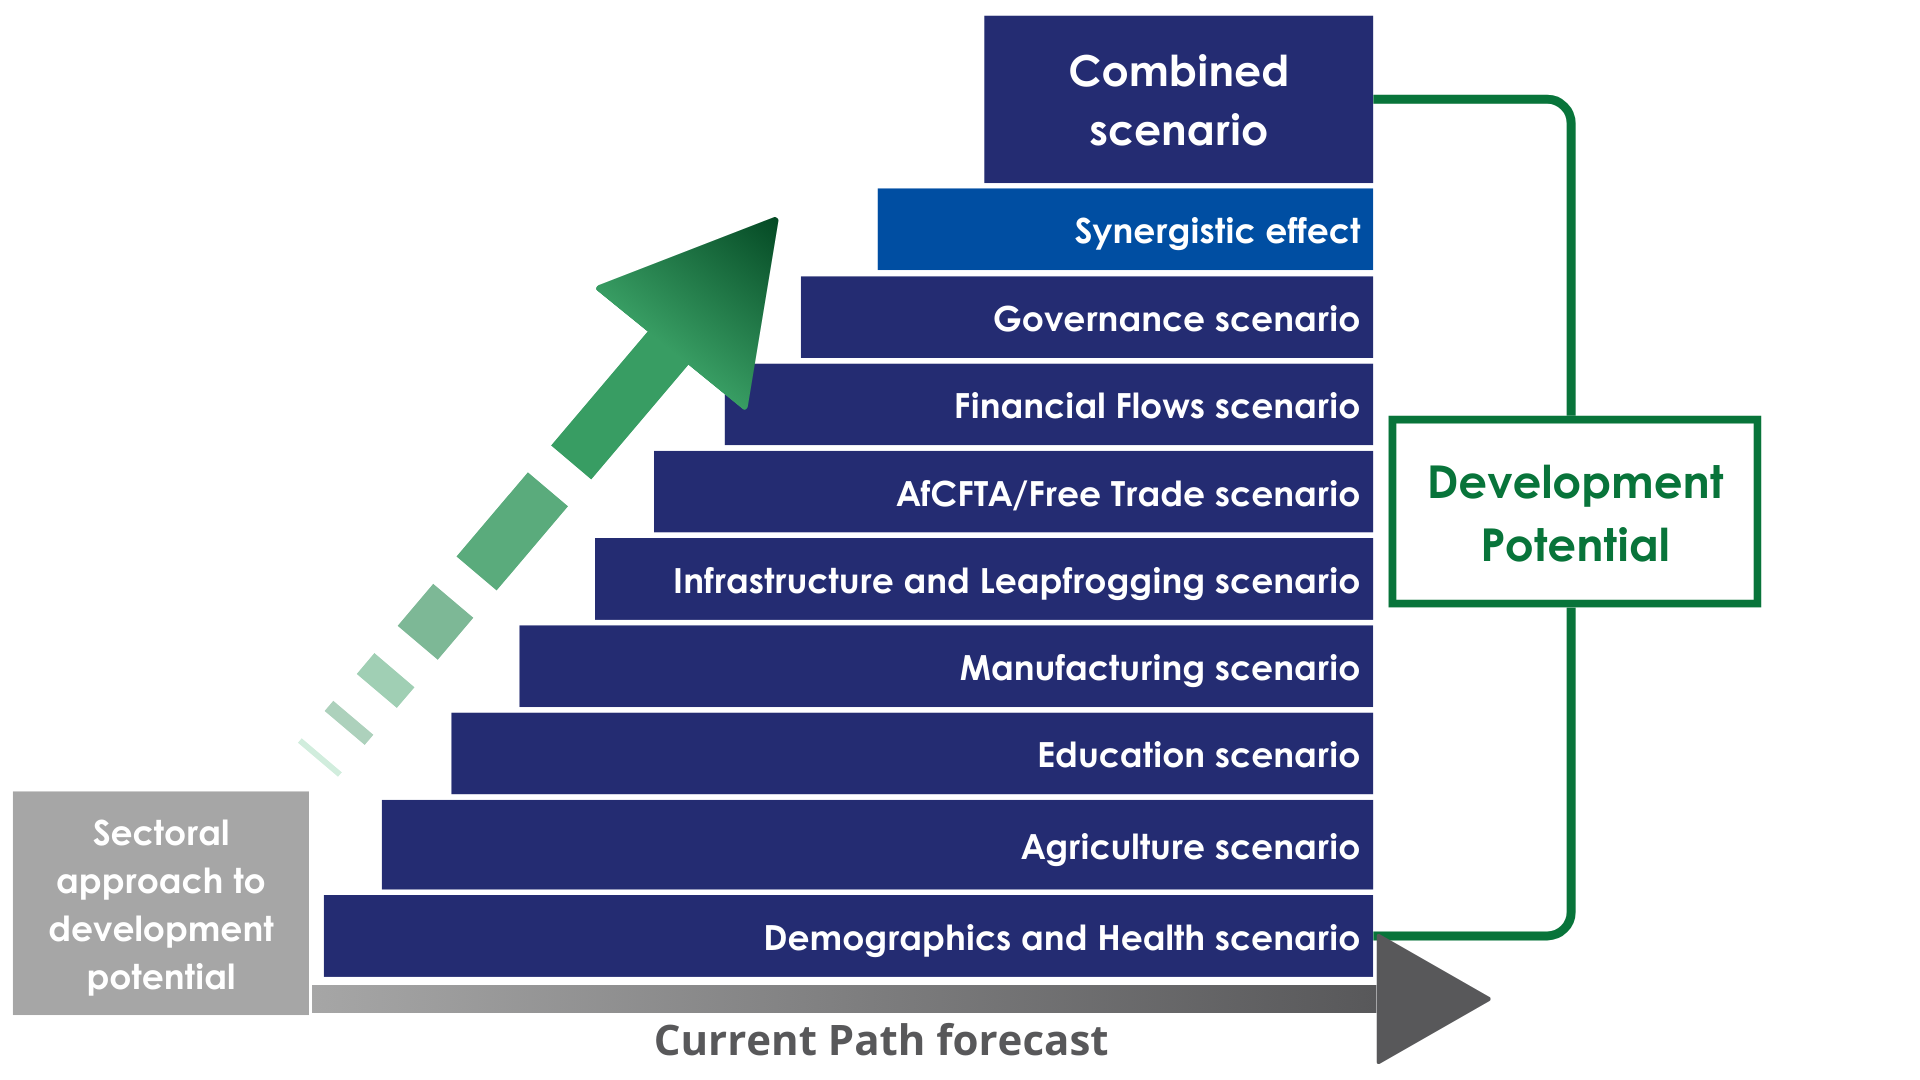
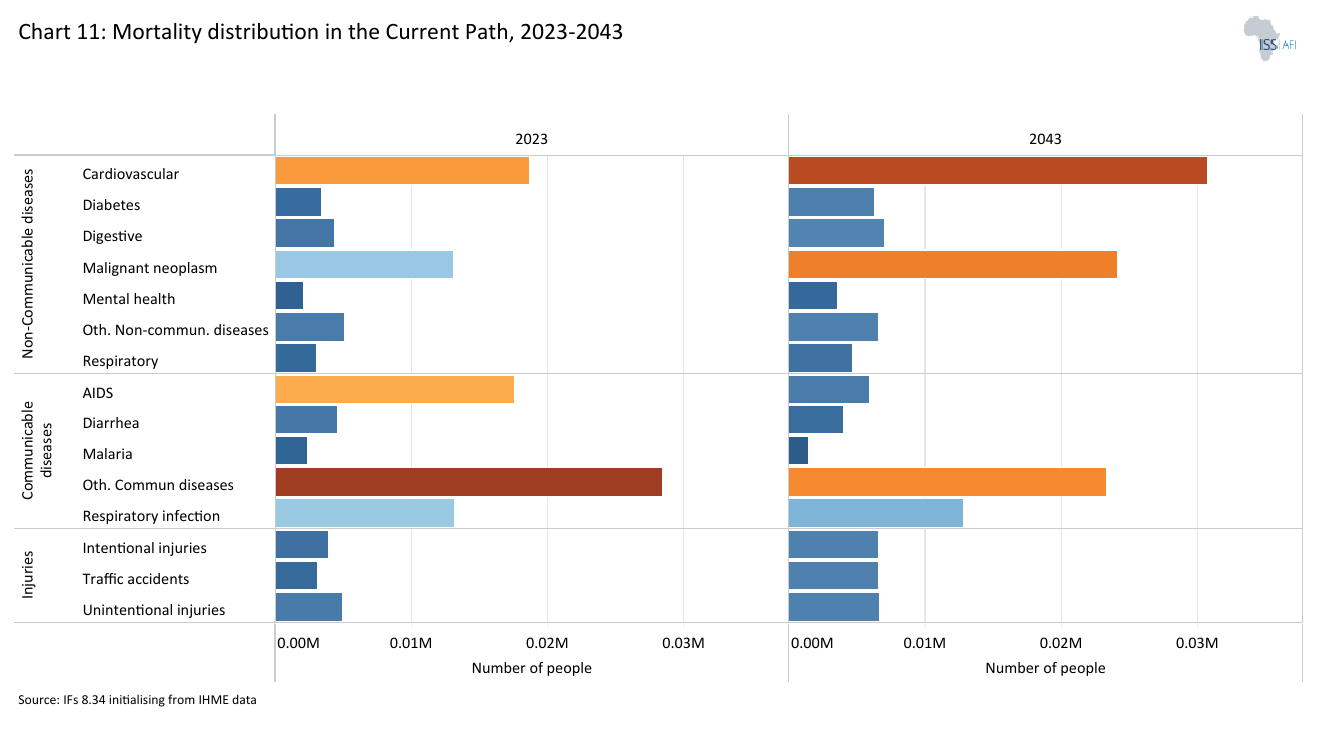
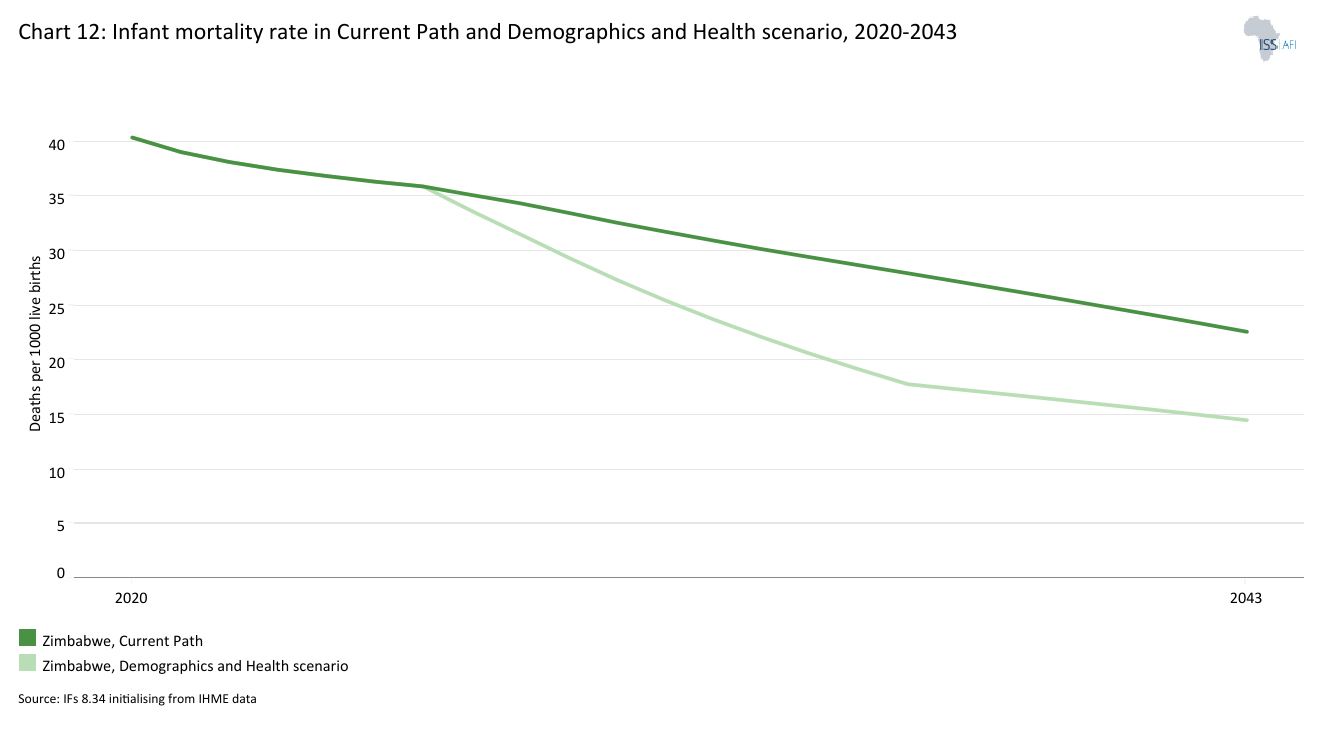
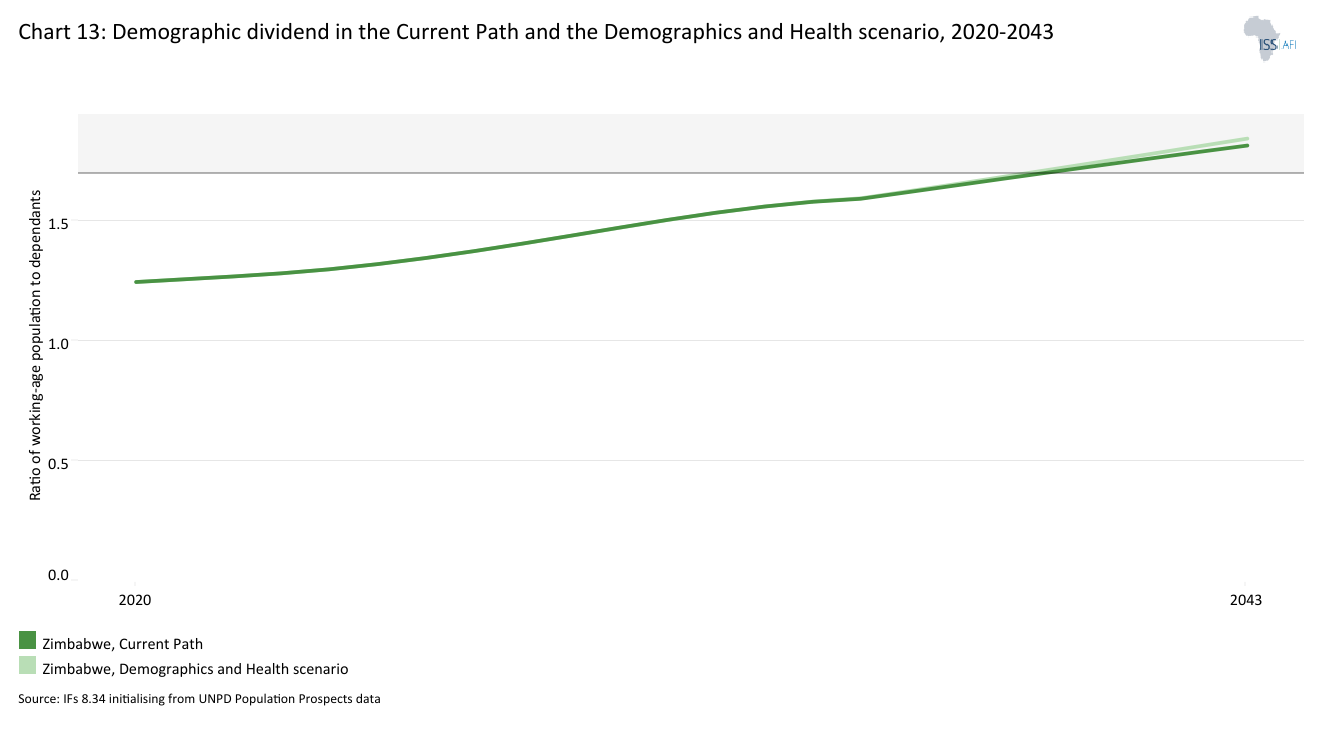
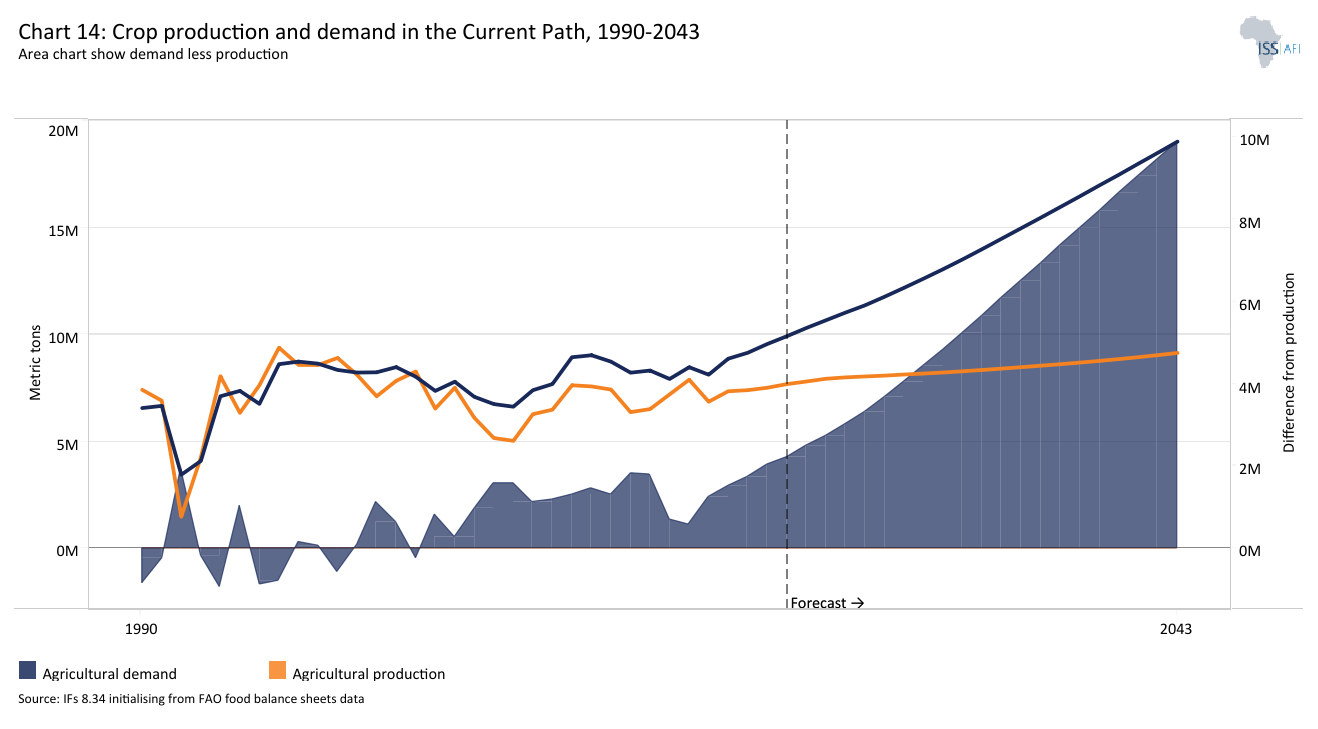
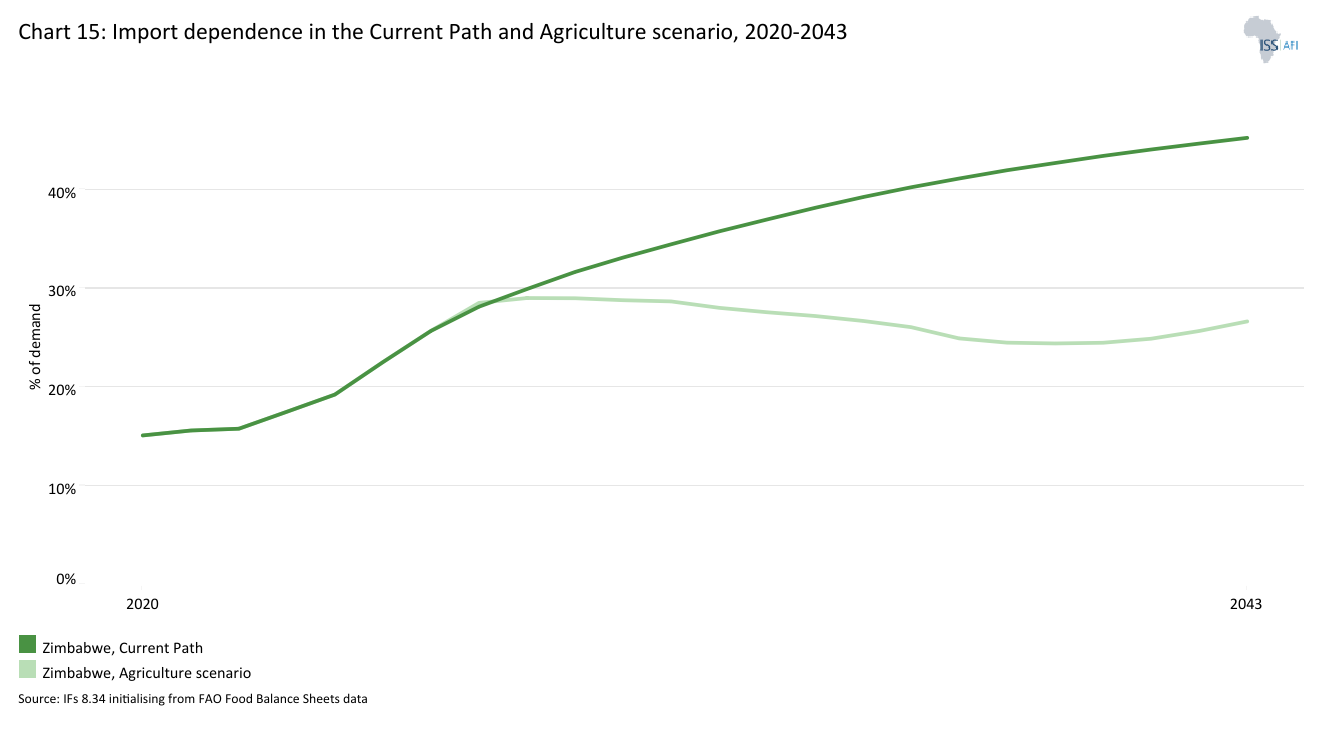
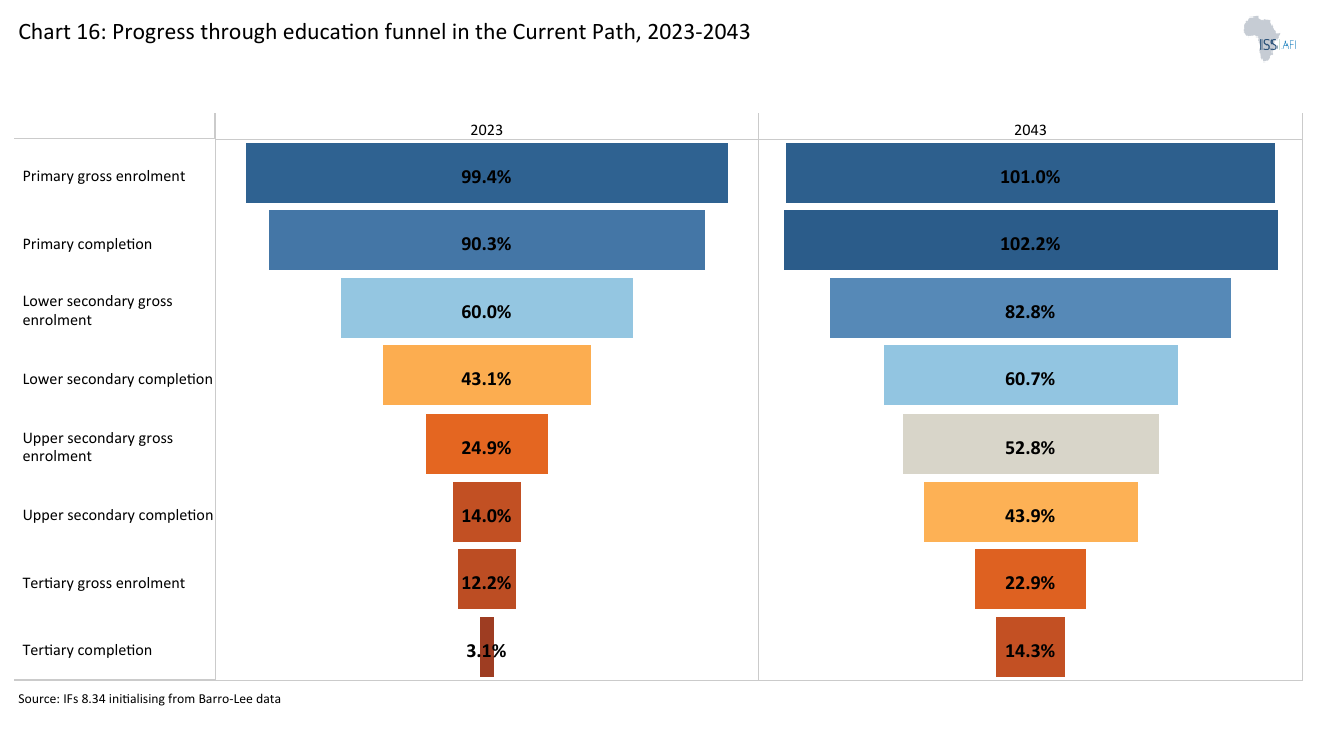
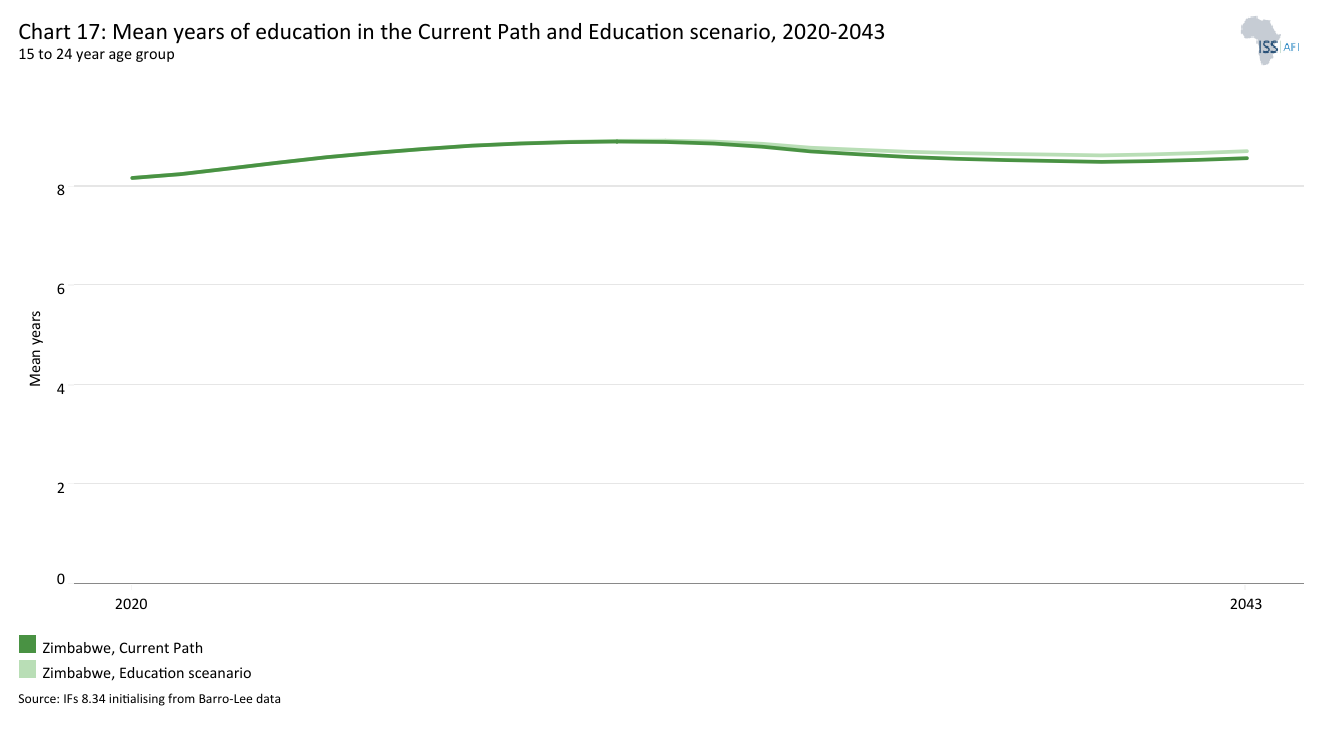
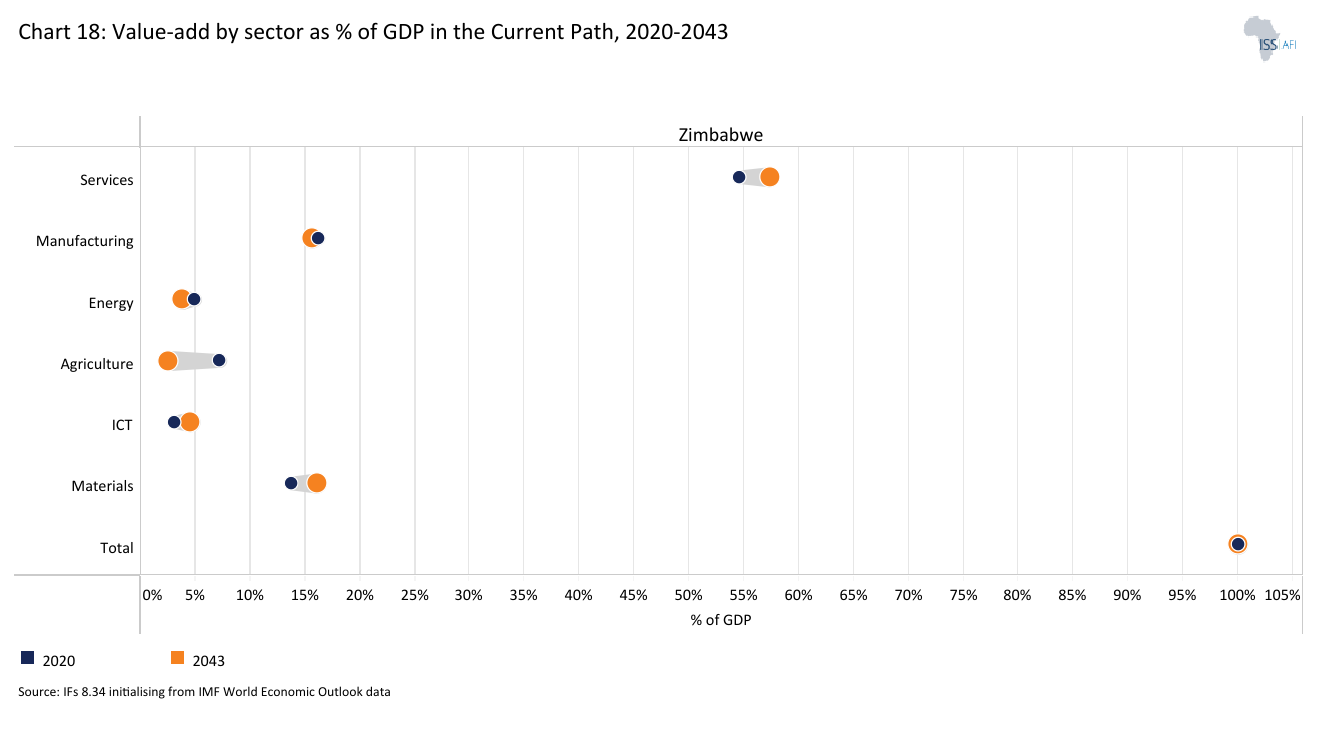
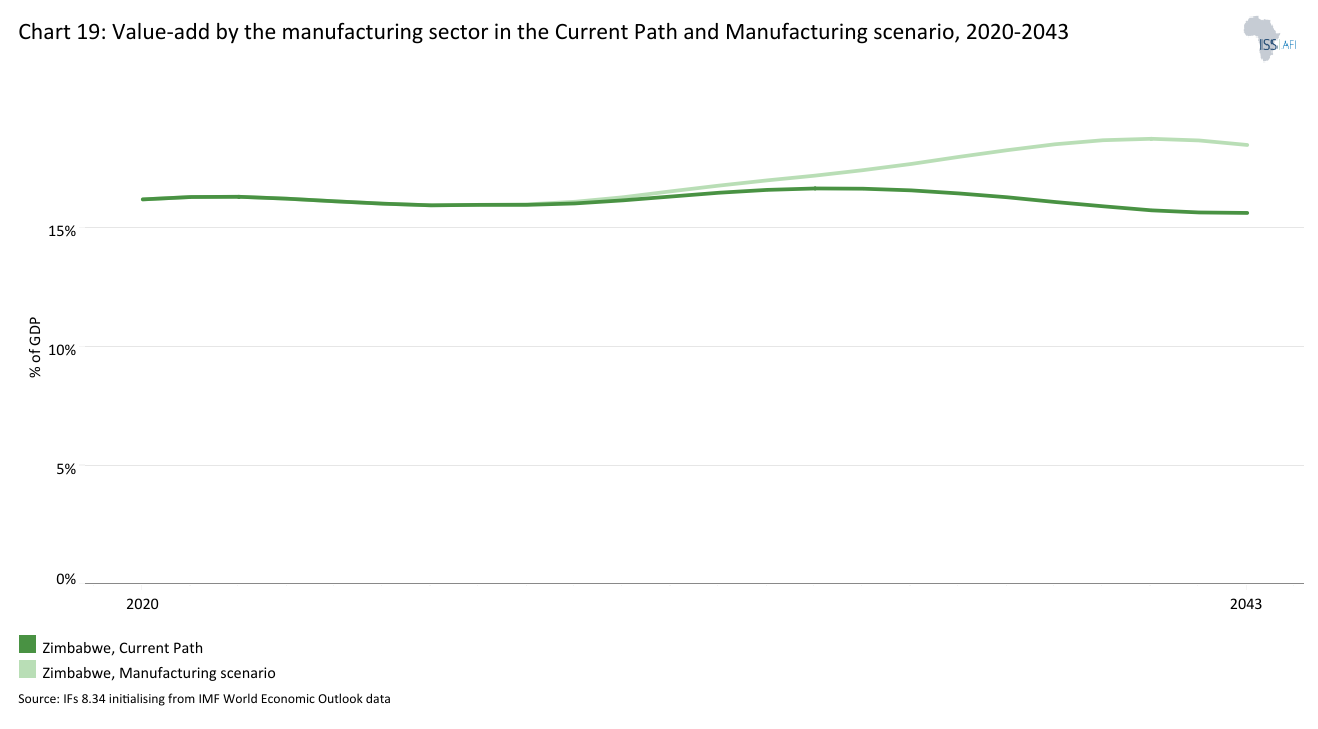
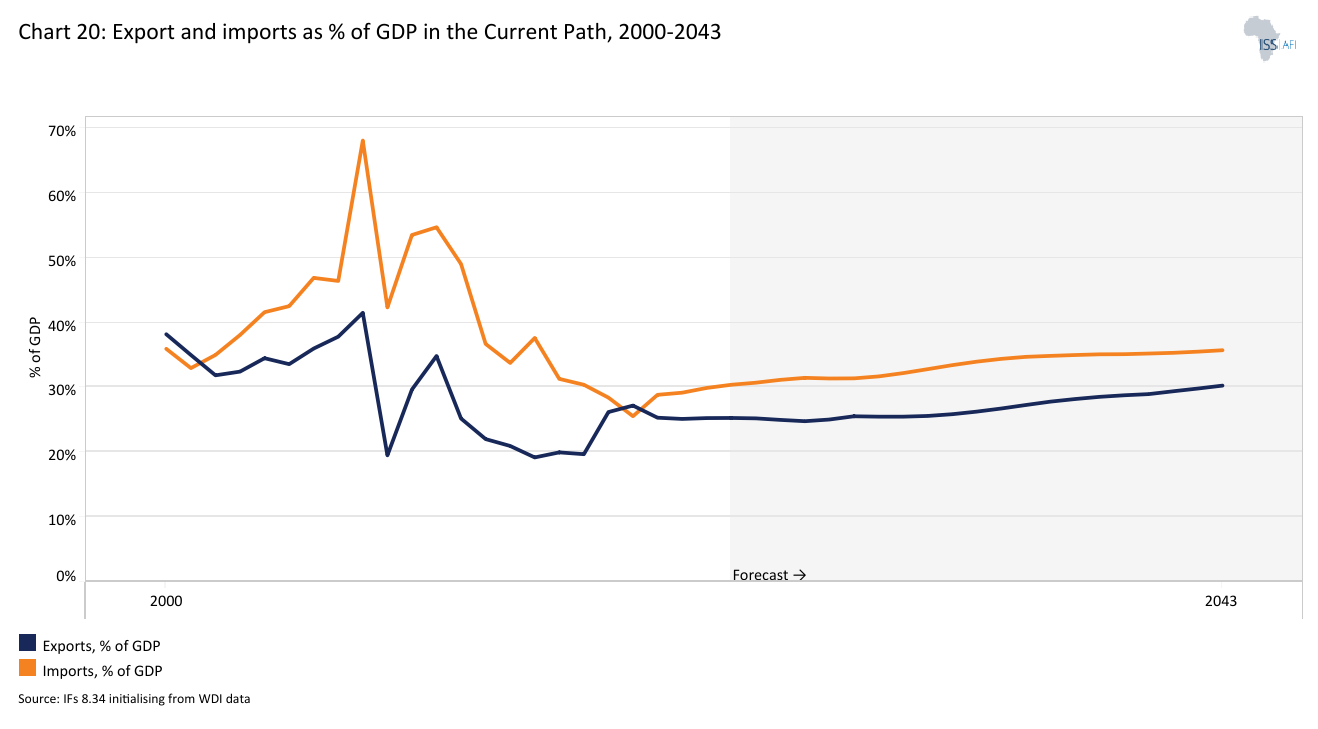
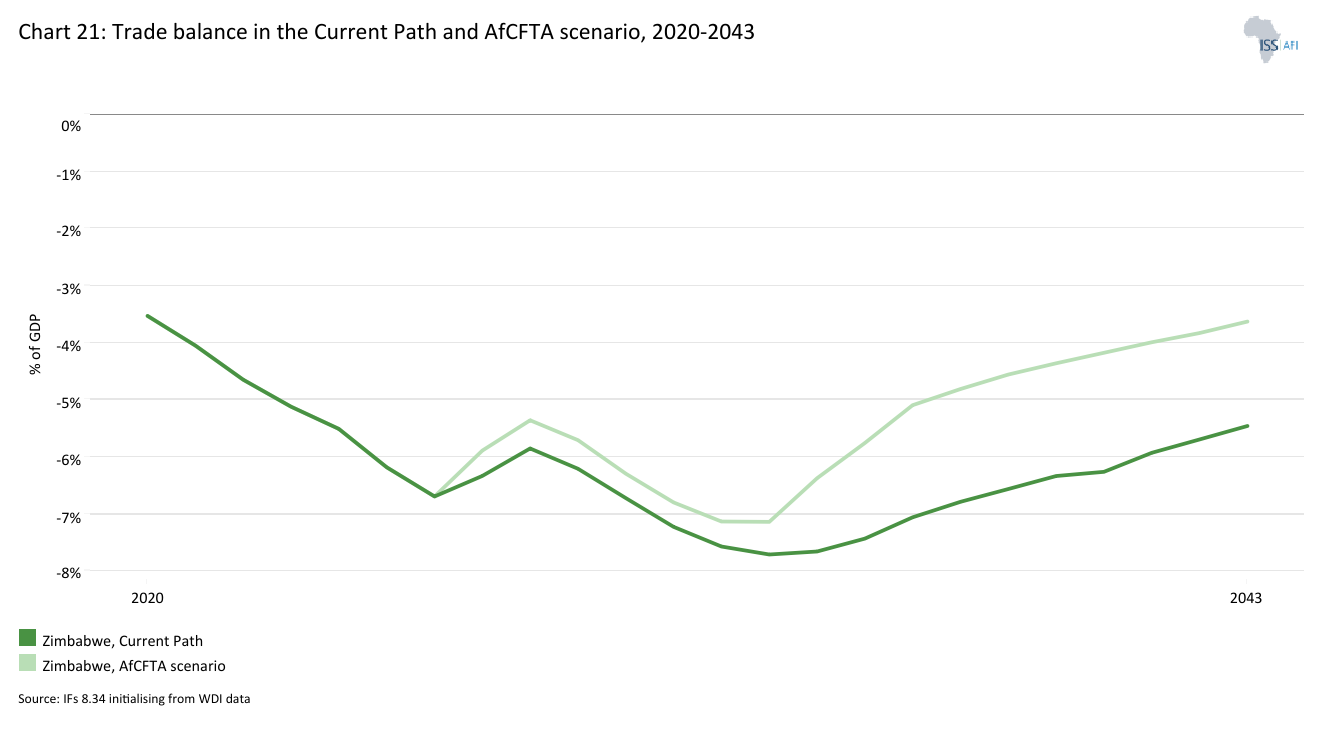
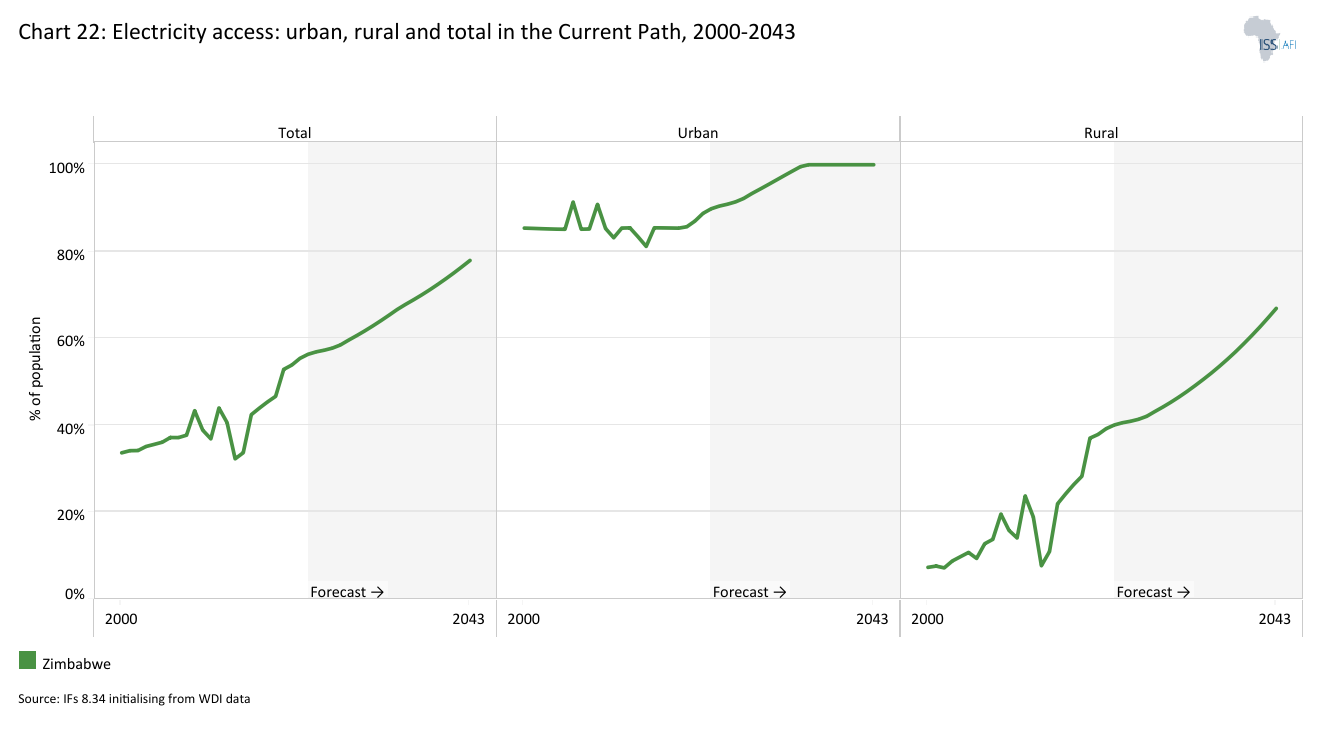
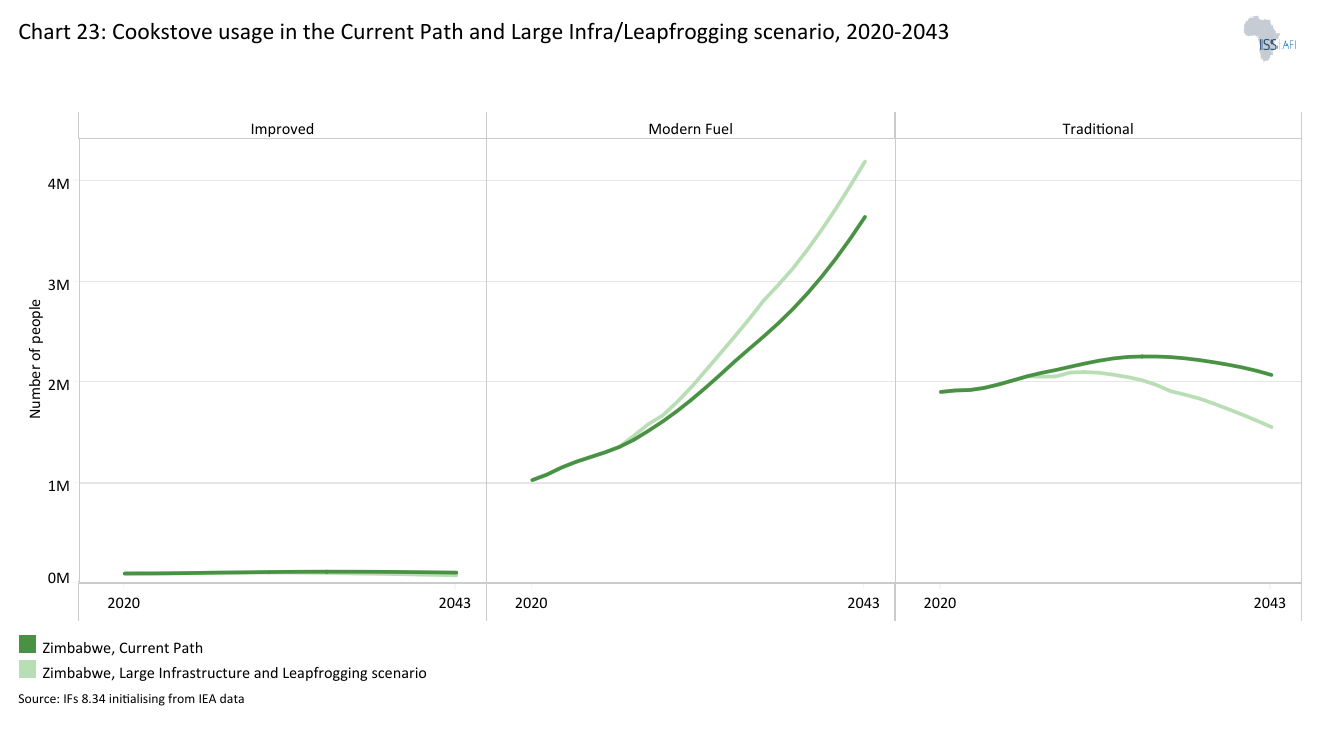
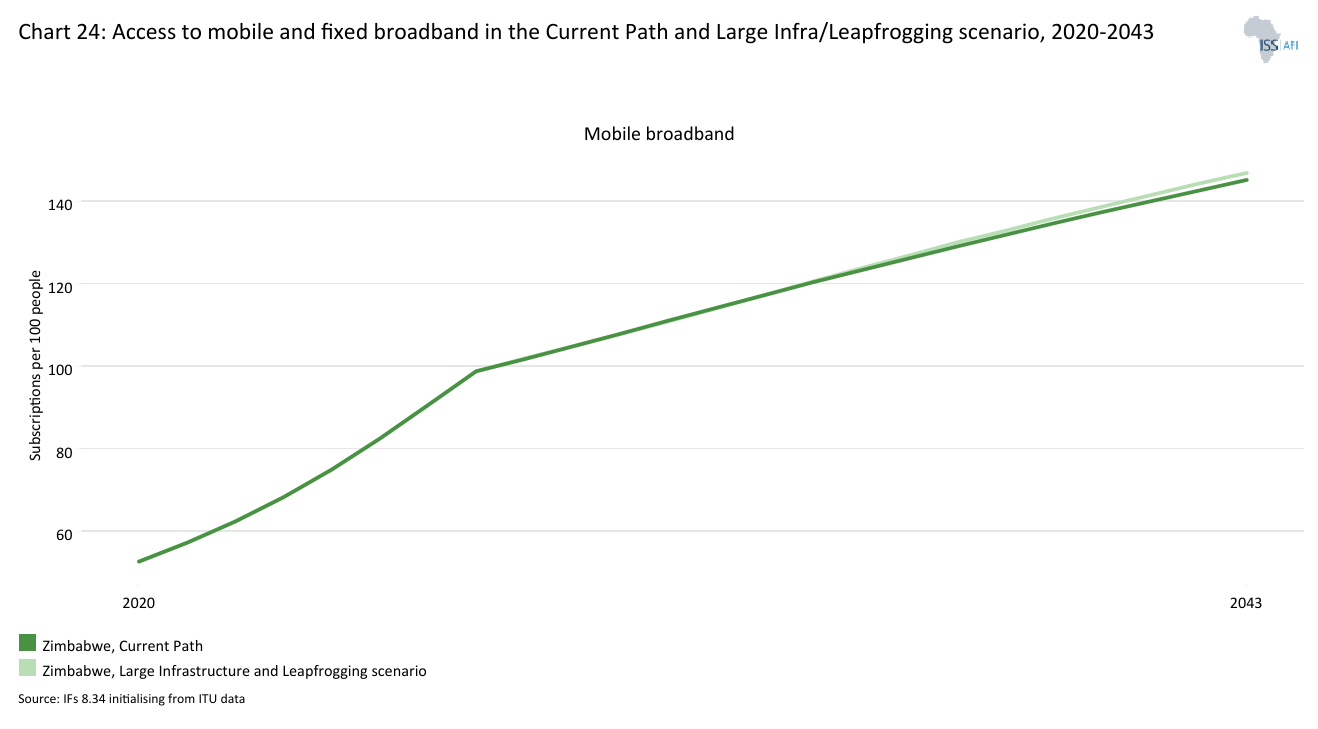
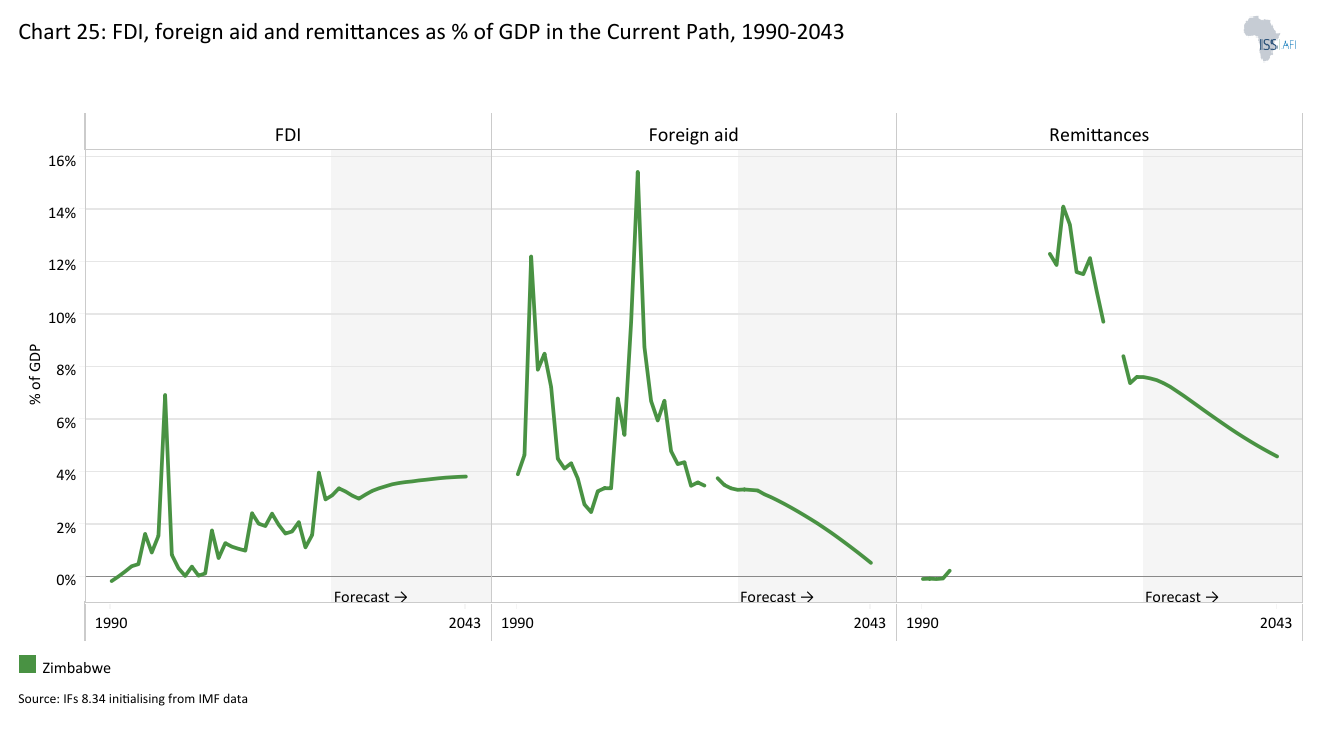
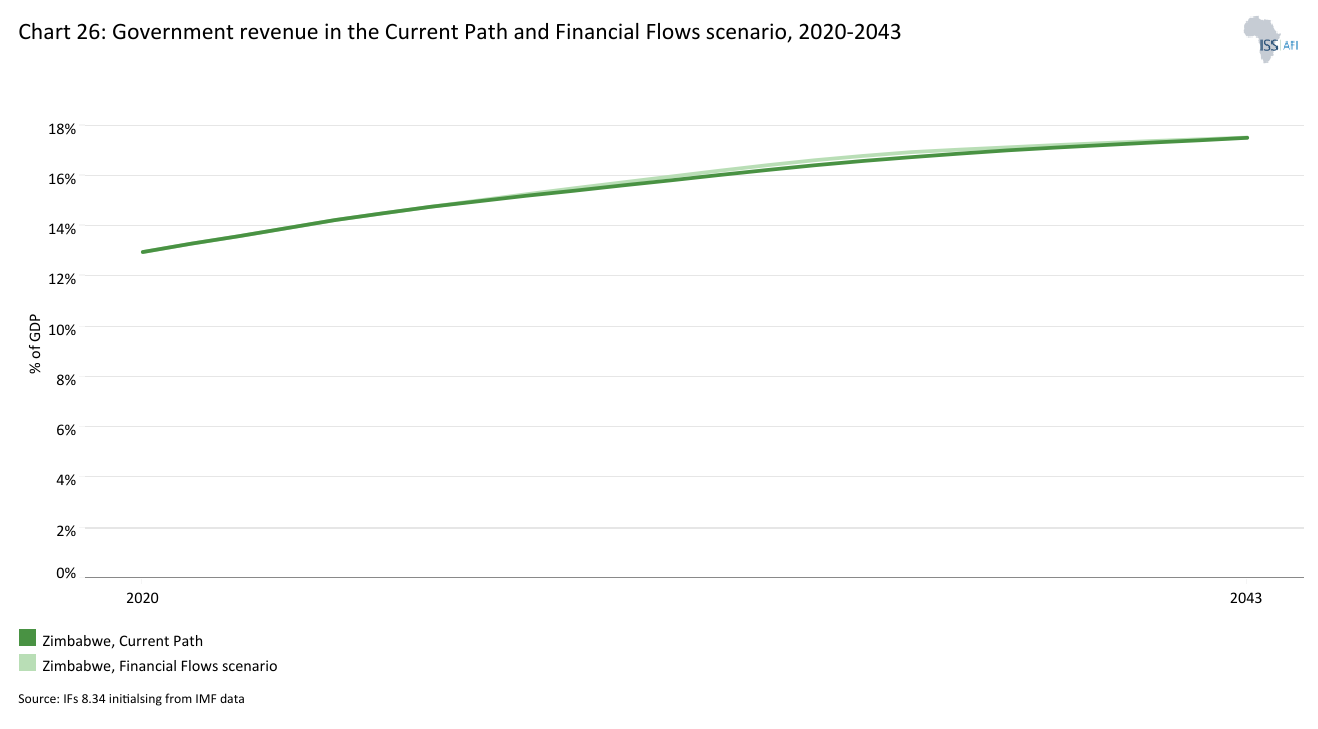
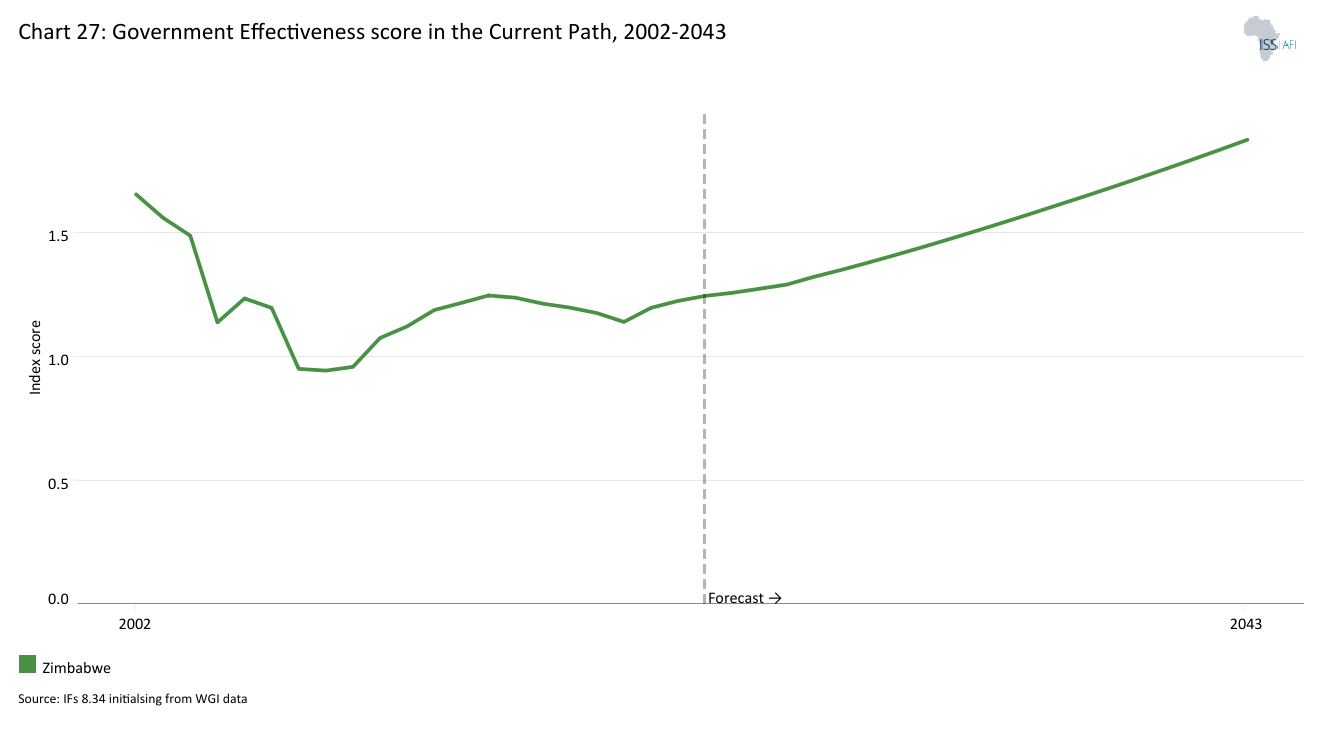

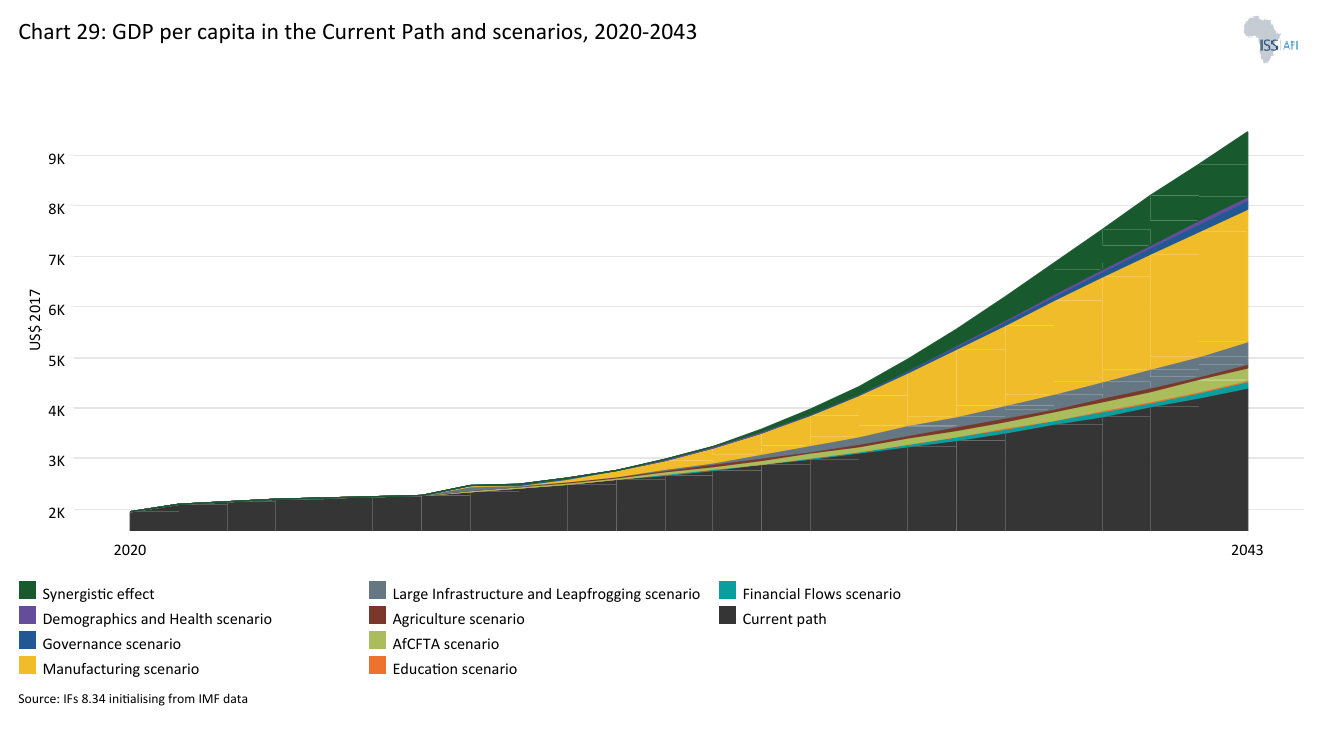
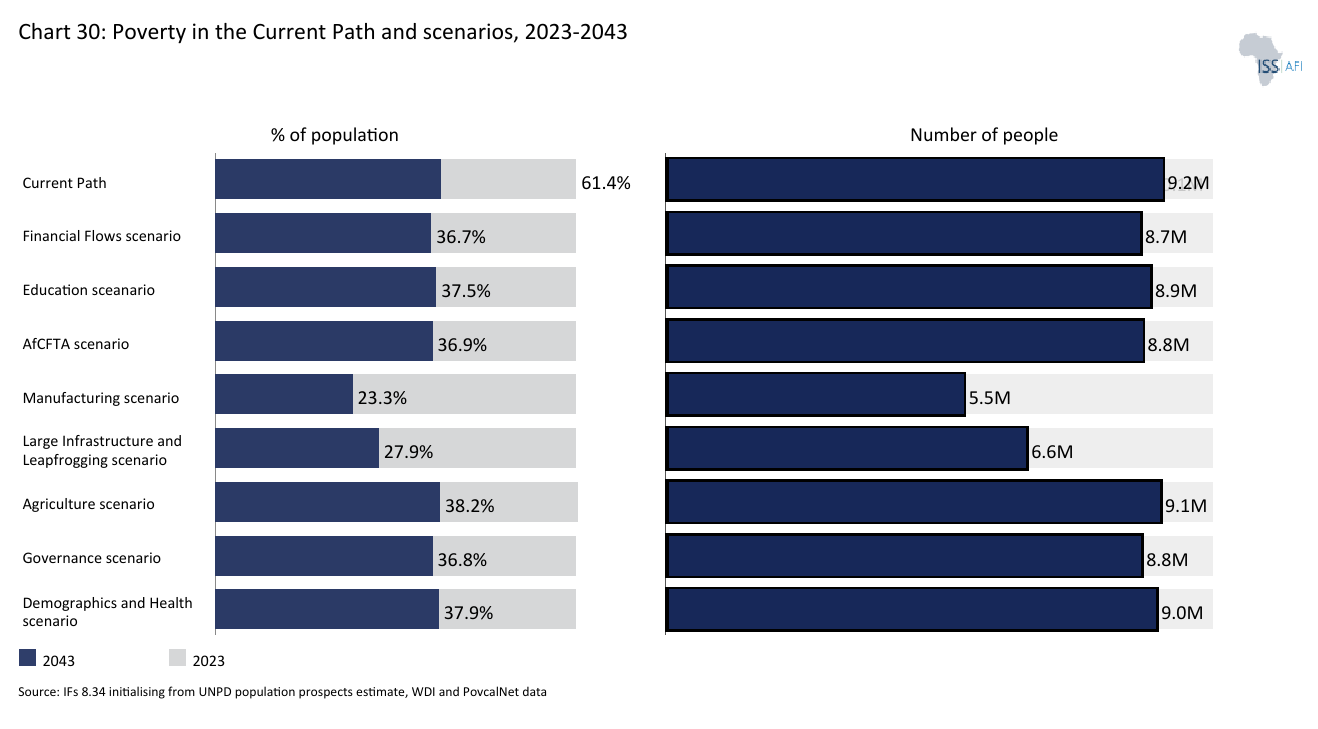
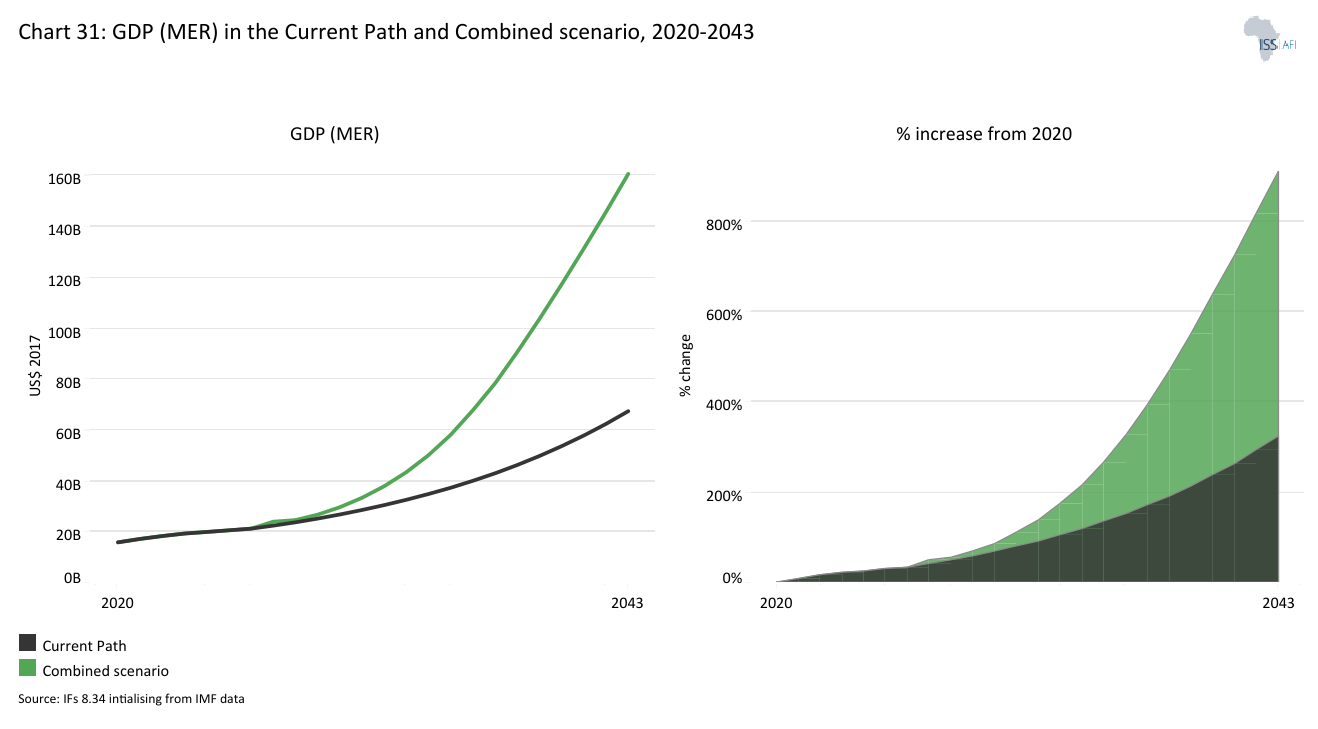
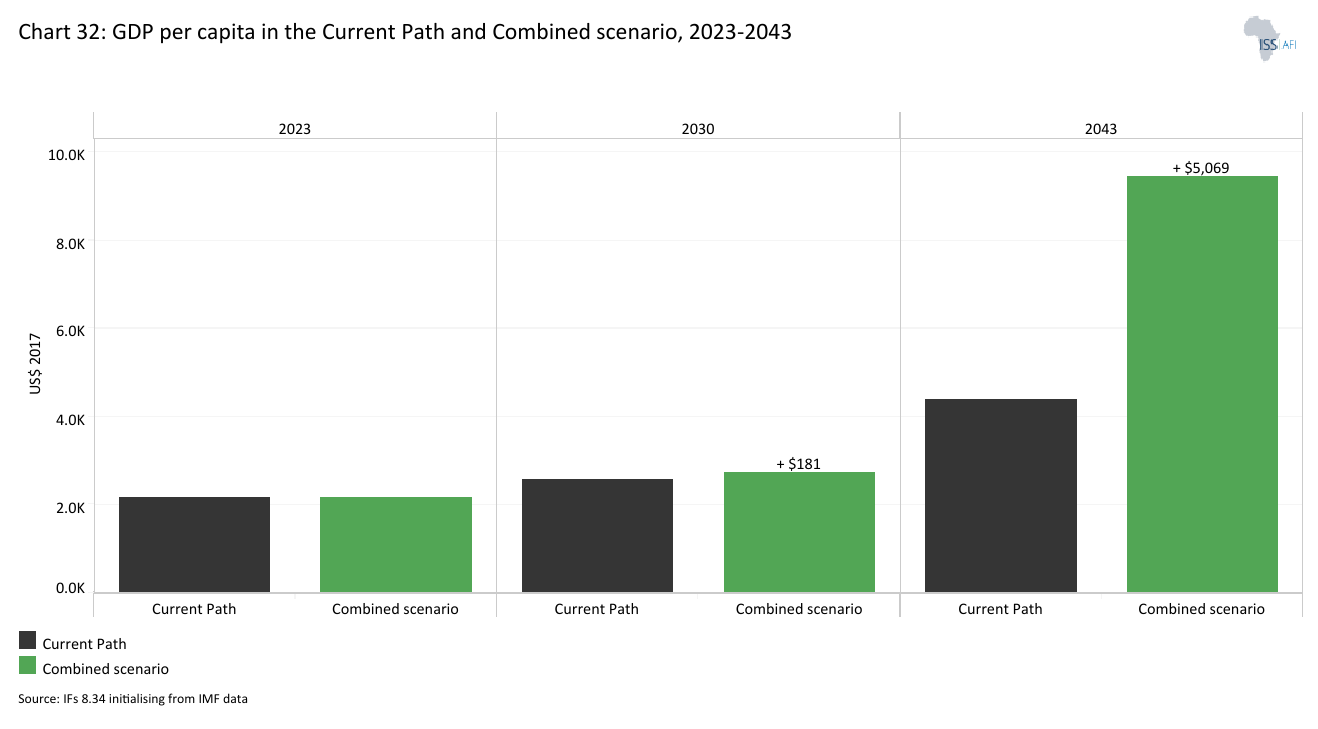
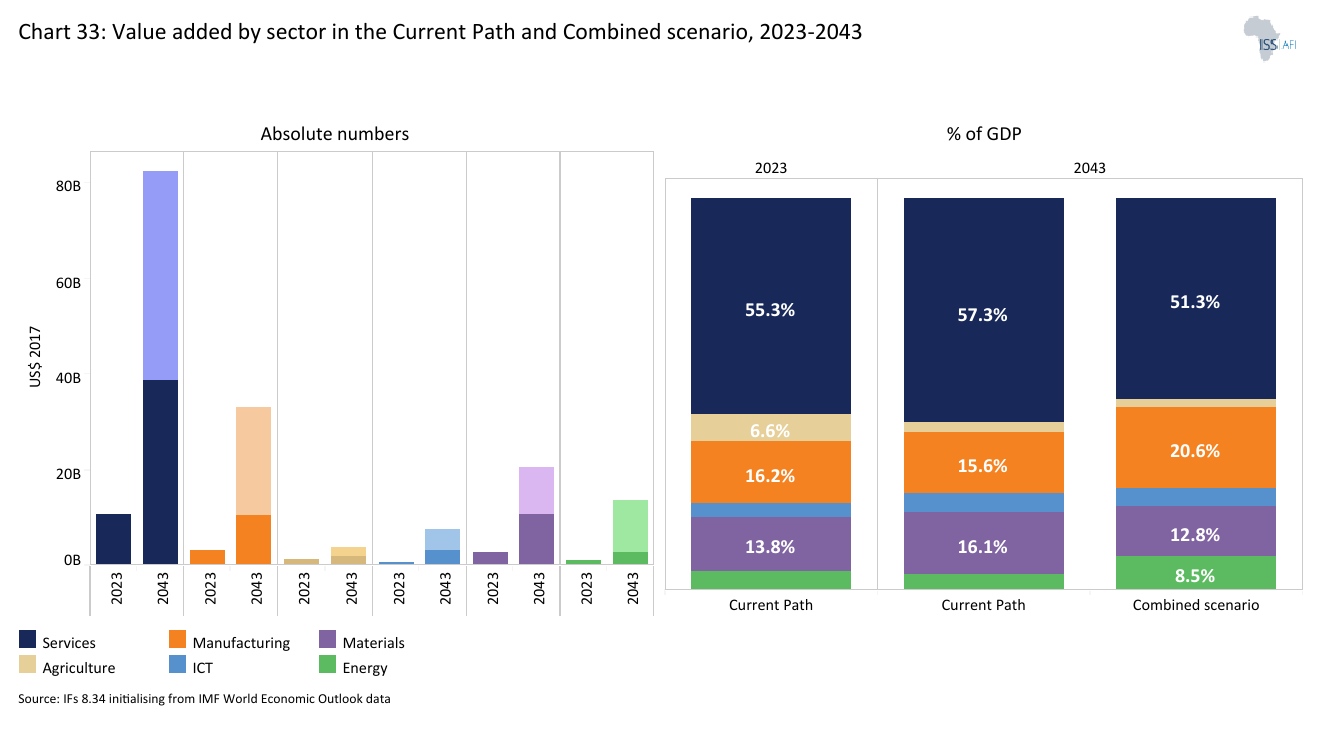
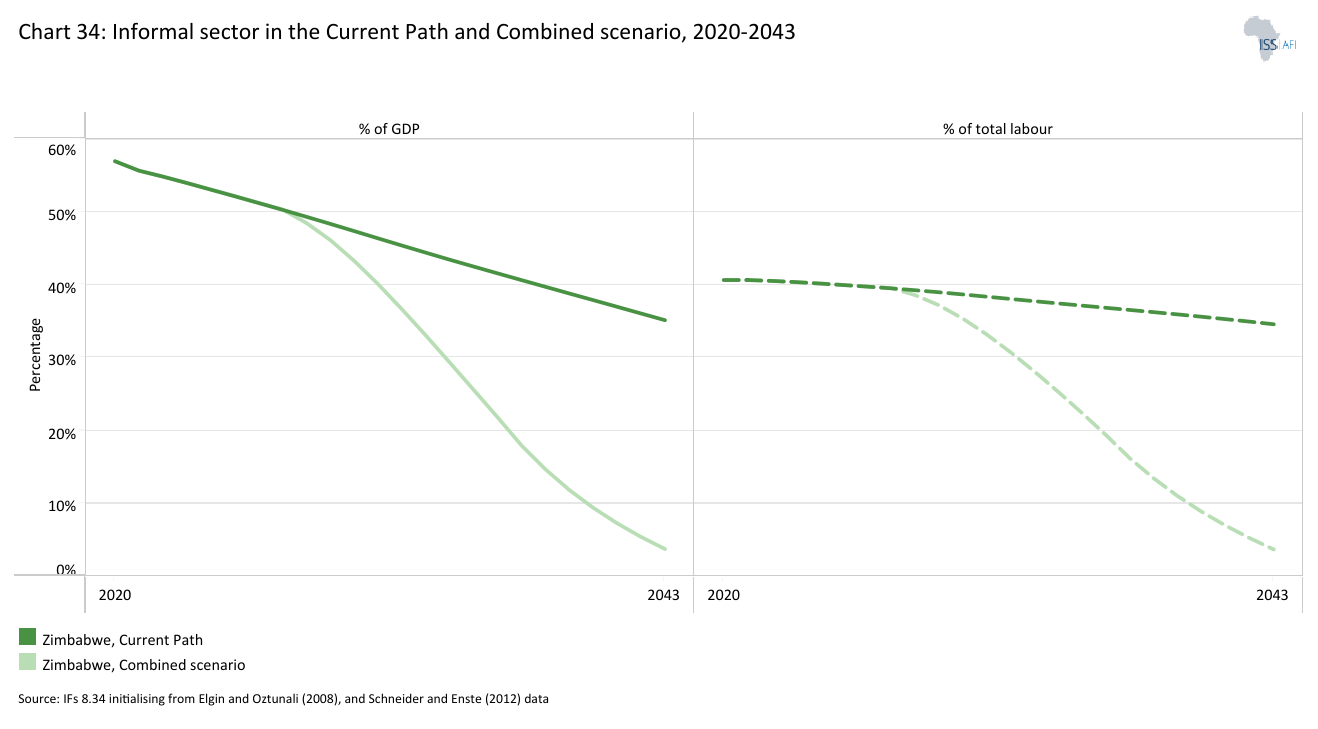
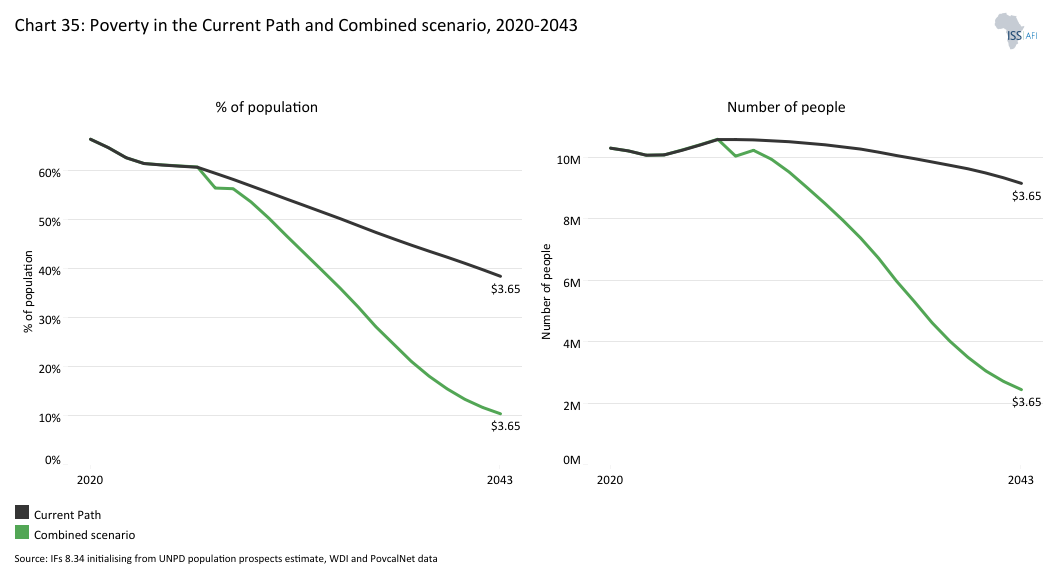
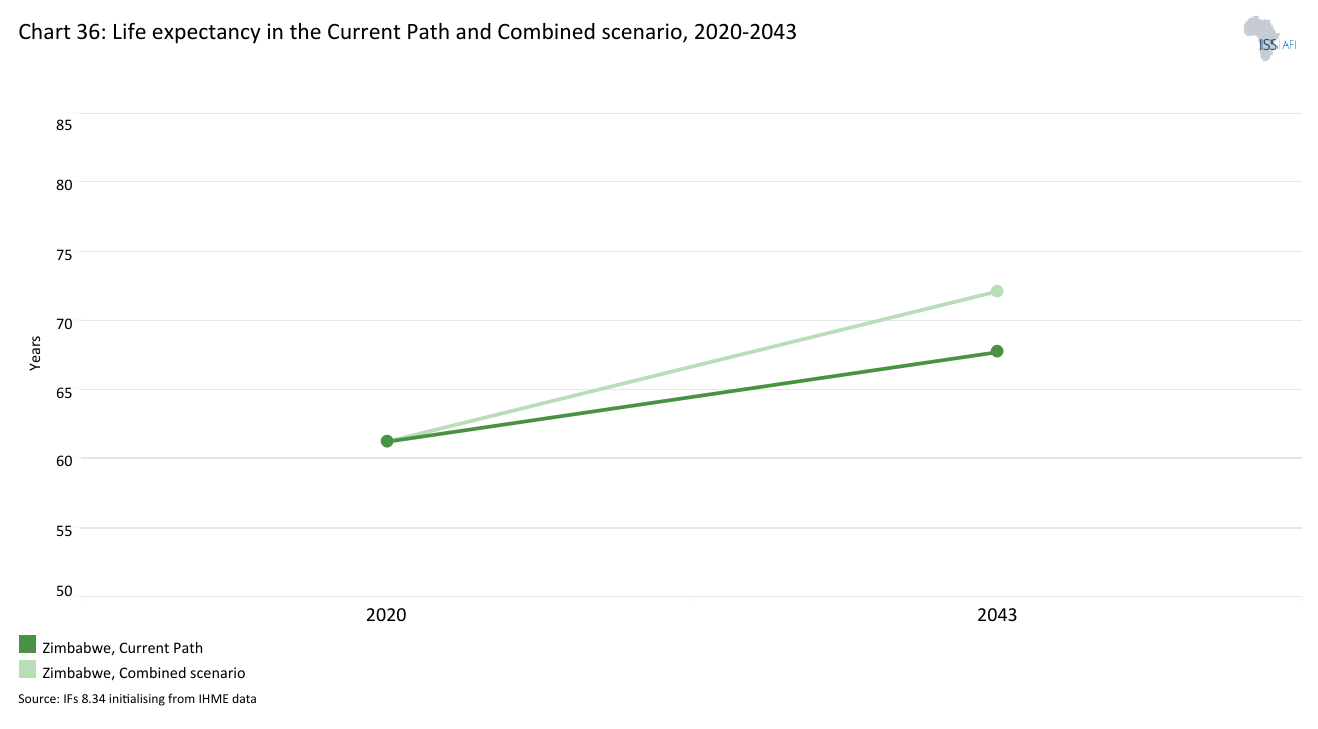
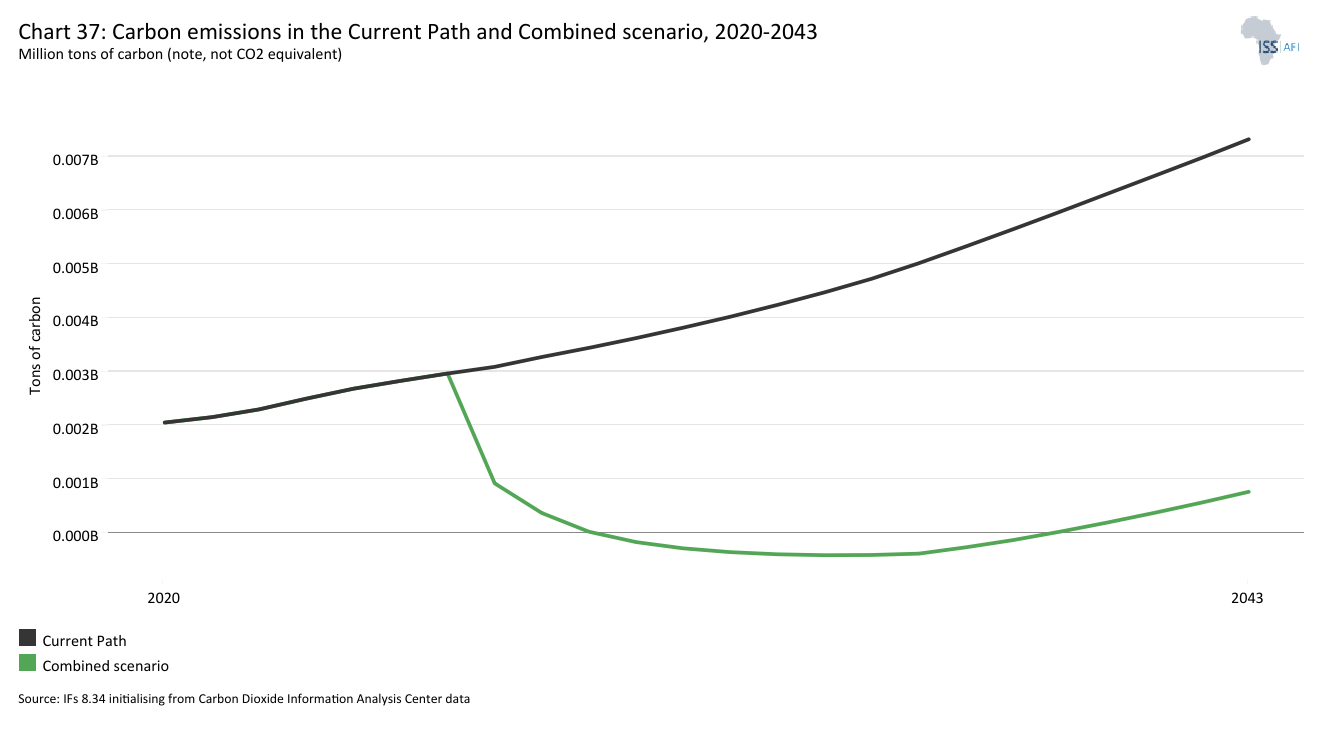
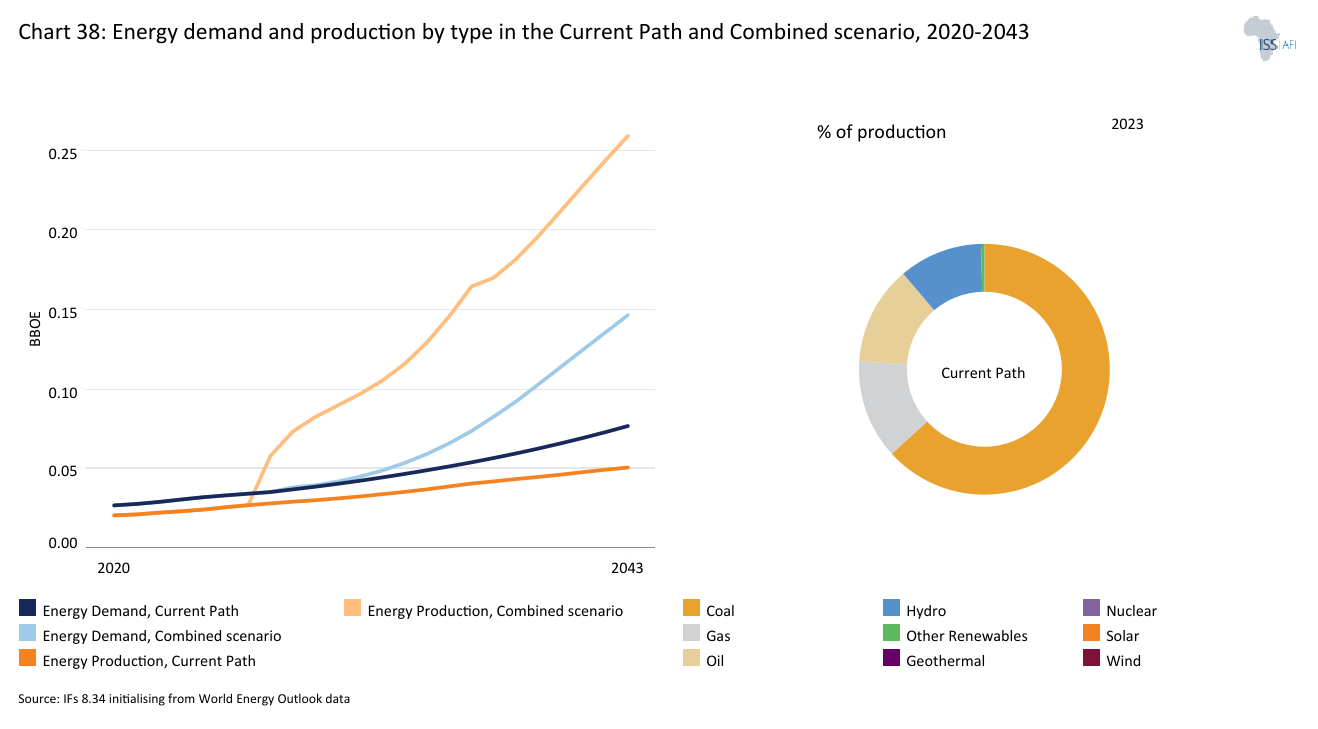
Chart 1 is a political map of Zimbabwe.
Zimbabwe is a landlocked, lower-middle-income country in Southern Africa, with a total land area of 390 757 square kilometres (km²). It shares borders with Zambia to the northwest, Mozambique to the east and northeast, South Africa to the south, and Botswana to the southwest. The country has a centralised government based in its capital, Harare, and is divided into eight provinces and two cities holding provincial administrative status. Each province has its provincial capital, from which government administration is typically conducted.
Zimbabwe is a member of several regional economic and political organisations, including the Southern African Development Community (SADC), the Common Market for Eastern and Southern Africa (COMESA) and the African Union (AU).
Zimbabwe gained independence from Britain on 18 April 1980, following a prolonged liberation war. The late President Robert Mugabe served as Prime Minister from 1980 to 1987 and then as President from 1987 until his controversial retirement in November 2017. He was succeeded by Mr Emmerson Mnangagwa.
The ethnic composition of Zimbabwe is primarily made up of the Shona people, who represent approximately 81% of the population. The Ndebele follow, accounting for about 12% of the population. There are also smaller ethnic groups, including the Ndau (3%), Tonga (2%), Shangani (0.8%), Venda (0.5%), Kalanga (0.4%), official English (0.3%), and others, including Xhosa, Tswana, Sotho, Nambya, Chewa, Chibarwe and Khoisan (1.2%). Additionally, Zimbabwe has a small but noteworthy population of people of European, Indian, Coloured descent, and East Asians, particularly Chinese. Over the years, these populations have declined, especially the European population and British, largely due to emigration following independence in 1980 and during the land reform program in the early 2000s.
Zimbabwe features a diverse topography that supports unique ecosystems, including grasslands, woodlands and mountainous forests. In the east, Zimbabwe features rugged mountain ranges, such as the Eastern Highlands, which include peaks like Mount Nyangani. To the west and southwest, the terrain transitions into lower, drier areas like the Kalahari Basin. Key rivers such as the Zambezi (north) and the Limpopo (south) form natural boundaries, contributing to diverse landscapes from lush valleys to arid savannas.
Despite its abundant natural resources (e.g., gold, diamonds, platinum, chrome and lithium), fertile agricultural land and strategic location in southern Africa, Zimbabwe has faced challenges related to governance, economic and political instability, and human development since gaining independence.
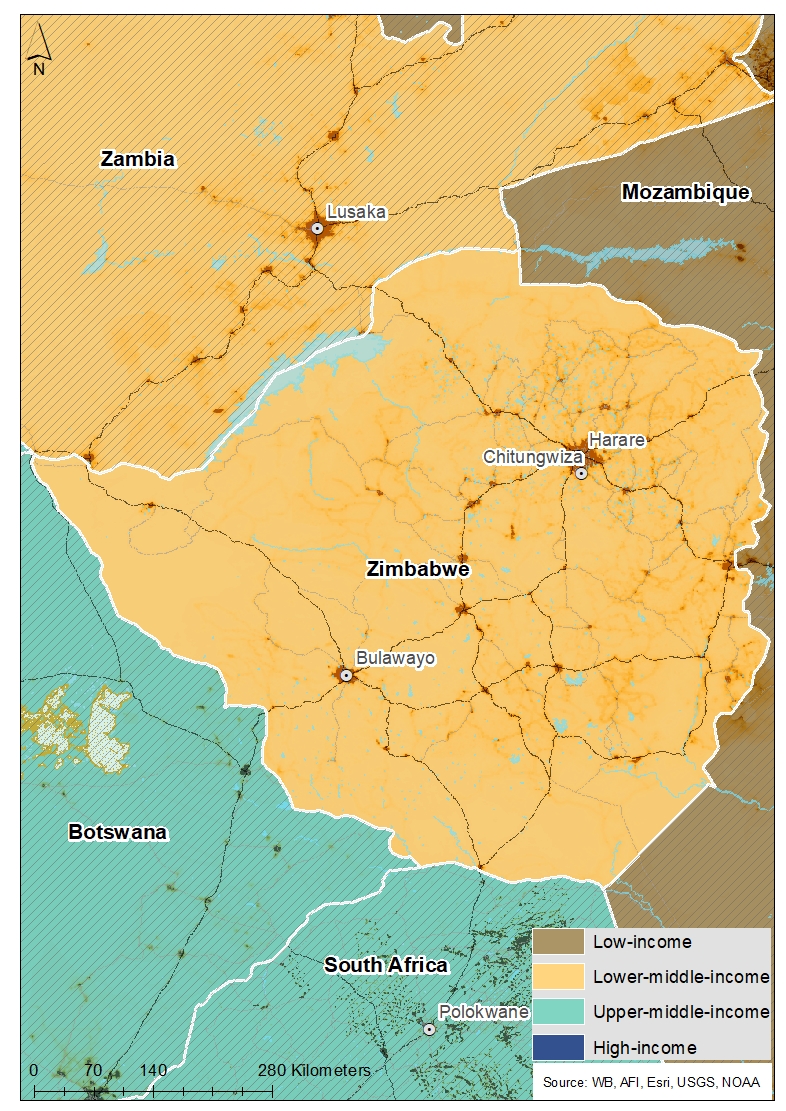
Chart 2 presents the Current Path of the population structure, from 1990 to 2043.
The population structure of Zimbabwe from 1990 to 2023 was characterised by a youthful and growing population, with a high proportion of children (under 15 years) and a gradually increasing working-age population (15-64 years). This structure is forecast to remain the same by 2043. When compared to other lower-middle-income African countries such as Angola, Ghana, Nigeria and Kenya, Zimbabwe shares similar demographic patterns but faces unique challenges, particularly in the areas of economic growth and healthcare. Common trends across these countries include declining fertility rates, longer life expectancy and an increasing proportion of the working population.
Since 1990, Zimbabwe’s population structure has undergone notable changes driven by demographic trends, migration, and the country’s political and economic landscape. These factors have reshaped age distribution, urbanisation patterns and population growth rates. The population was estimated at 10 million in 1990, growing to 12 million by 2000. However, factors like HIV/AIDS, declining fertility and emigration slowed this growth during this period.
The HIV/AIDS epidemic significantly impacted Zimbabwe’s population structure, especially in the 1990s and early 2000s. The number of HIV/AIDS-related deaths rose sharply, increasing from 12 000 in 1990 to a peak of about 109 360 in 2003, reflecting an annual growth rate of approximately 25%. However, these numbers have since dropped to 17 620 in 2023. This epidemic also influenced the gender ratio, as higher mortality rates among men widened the gender gap in favour of women.
Zimbabwe’s total fertility rate dropped from 4.88 births per woman in 1990 to 3.64 in 2006, with a modest rebound to 3.72 by 2023. This decline was largely due to improvements in access to family planning, healthcare and education, especially for women.
Economic and political instability since the 1990s has fueled significant emigration, with net migration shifting from a surplus of 4 900 people in 1990 to a deficit of 108 700 in 2010 and 57 230 in 2023. Many Zimbabweans, particularly young people, sought opportunities abroad, migrating to neighbouring countries like South Africa, Botswana and Namibia, as well as to the Global North. This migration contributed to a shrinking youth demographic, often referred to as a youth bulge, particularly in the 2000s when economic difficulties intensified. Youth bulge dropped from a peak of 58% in 2002 to 48% in 2023 and will decrease further to 42% by 2043 on the Current Path. Be that as it may, inward migration from neighbouring countries like Mozambique, Malawi and Zambia, and more recently from China, has also played a role in shaping population dynamics.
Despite these challenges, Zimbabwe’s population has continued to grow, reaching 13 million in 2010 and 16 million by 2023. The Current Path suggests that it will climb to 19 million in 2030 and 24 million by 2043. Declining fertility rates, which are forecast to fall from 3.65 births per woman in 2023 to 2.45 by 2043, will play a key role in this trend. This decrease will be driven by improved education for women, greater access to family planning and ongoing urbanisation.
On the Current Path, an additional 3 million people projected by 2030 and 8 million by 2043, compared to 2023 levels, exert substantial pressure on the country's public infrastructure and services, necessitating urgent and strategic investments in several key areas such as investments in healthcare, food production, services for an aging population, job creation and sustainable urban development. These areas of focus will be essential for mitigating the challenges associated with demographic growth and ensuring that Zimbabwe can develop sustainably and inclusively.
The HIV/AIDS pandemic, along with ongoing political and economic challenges, has led to a significant decline in life expectancy and increased adult mortality in Zimbabwe. Life expectancy sharply decreased from 62 years in 1990 to 46 years in 2004. However, it has since improved, returning to 62 years in 2023, with women averaging 65 years and men 59 years. This progress is largely due to improved access to antiretroviral treatment (ART). Despite these developments, economic and political instability continue to drive outward migration.
Looking ahead, the Current Path shows that the proportion of children under 15 will decline from 41% in 2023 to 38% in 2030 and 31% by 2043. Conversely, the working-age population (15–64) will rise steadily from 56% in 2023 to 60% in 2030 and 64% by 2043. The elderly population (65+) will grow modestly, increasing from 3% in 2023 to 4% by 2043. These trends align with those observed in average lower-middle-income African countries.
While the growing working-age population presents economic challenges, as generating sufficient employment to accommodate this expansion will require substantial policy measures, it also offers the potential for a demographic dividend if the working population is absorbed into the economy. The Current Path indicates that Zimbabwe could enter a demographic window of opportunity around 2039 when the working-age population-to-dependant ratio will reach the 1.7:1 threshold necessary to realise a demographic dividend. To maximise the potential benefits of this demographic dividend, Zimbabwe will need to invest in education, healthcare and job creation to ensure that the growing working-age population is equipped with the necessary skills and can be absorbed into the labour market.
Chart 3 presents a population distribution map for 2023.
As of 2023, Zimbabwe's average population density was approximately 0.42 people per hectare, based on a total land area of 390 757 km² (39 075 700 hectares). This density is unevenly distributed, with higher concentrations in major urban areas like Harare and Bulawayo, which are pivotal as the country's economic and political centres.
Due to its urban opportunities and capital status, Harare attracts many migrants from rural areas and other cities. Despite economic challenges, Bulawayo remains a key industrial and trade hub, though its growth has been slower than Harare's, which has been influenced by factors like deindustrialisation, emigration and political-related issues. Bulawayo is seen as an opposition stronghold, often reflecting broader societal frustrations with government policies and economic conditions.
In terms of rural and urban distribution, as of 2023, approximately 33% of the population lived in urban areas, while the remaining 67% was rural. Rural areas are predominantly engaged in agriculture, but they face challenges such as limited access to basic services and infrastructure.
The population is also characterised by a youthful demographic, with a significant proportion of children under the age of 15 years (41% in 2023) and working-age population (56% in 2023), which presents both opportunities and challenges for job creation and social services. Overall, the distribution underscores the need for balanced development between urban and rural areas to address disparities and ensure sustainable growth.
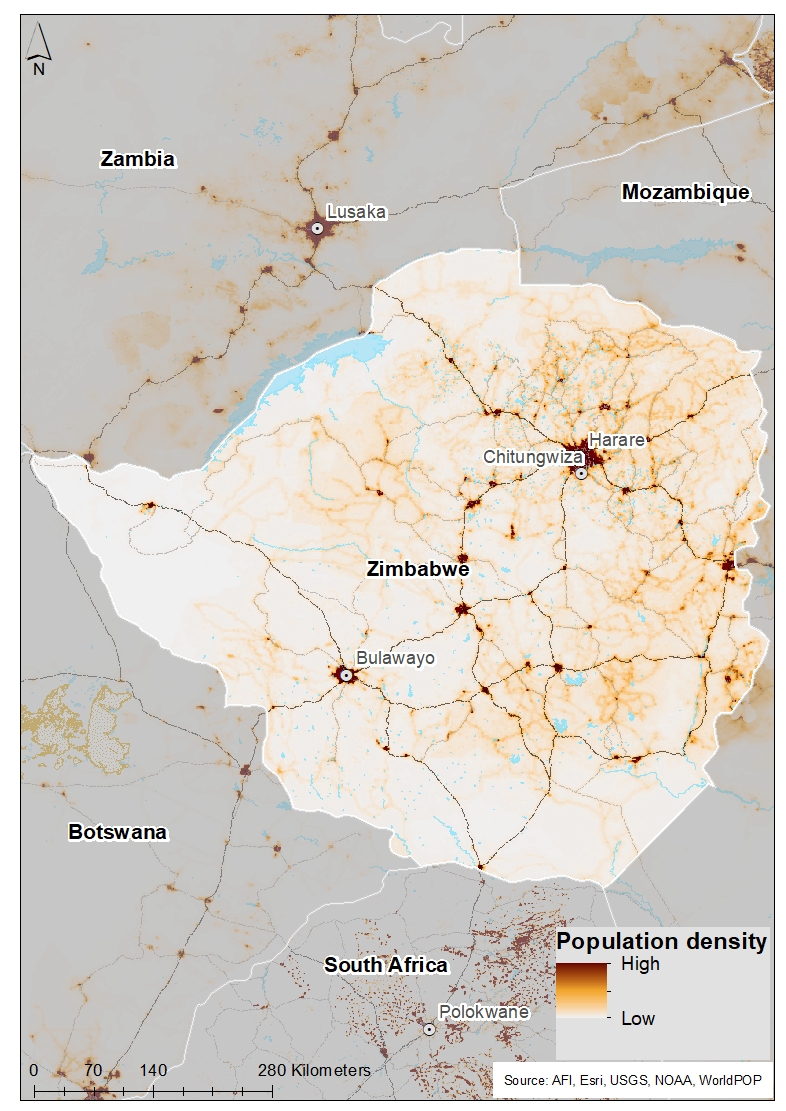
Chart 4 presents the urban and rural population in the Current Path, from 1990 to 2043.
The urbanisation rate in Zimbabwe has been increasing steadily, though it remains lower than in many other lower-middle-income African countries. In 1990, Zimbabwe was predominantly a rural society, with approximately 71% of the population living in rural areas and the remaining 29% in urban centres. However, by 2002, the rural population had decreased to around 66%. This decline reflects a trend of urbanisation that has been ongoing since the 1950s, driven by rural-to-urban migration and a growing youth population seeking employment and tertiary education opportunities. Major urban and industrial centres such as Harare, Bulawayo, Mutare, Gweru, Masvingo, Kadoma and Kwekwe experienced population growth, often at the expense of rural areas.
After 2002, the rural population began to increase again, rising to 68% by 2014. This shift suggests a reverse trend of urban-to-rural migration, which is likely attributed to the difficult economic conditions that affected the country during this period, causing significant hardship for the urban population. Many elderly individuals have been forced to migrate to their rural retirement homes due to the high cost of living in urban areas and a significant decline in basic urban amenities. For instance, access to essential water services for the urban population decreased from 31% in 2000 to 27% in 2023, with the Current Path indicating a further decline to 20% by 2043. Furthermore, dwindling economic opportunities compelled some of the working-age population to leave the cities and return to their rural homes.
Despite ongoing economic challenges, there has been a small increase in urbanisation beginning in 2014, which has reduced the rural population to 67% in 2023. This slight increase in the urban population can be attributed to the youth who are seeking employment opportunities in urban areas.
The Current Path suggests that the rural population will stay around 67%, with a consistent population gap between rural and urban areas until 2043. This consistent gap can be attributed to the limited urban and industrial development that is typically associated with rural-to-urban migration.
Rural areas in Zimbabwe have often been neglected regarding socio-economic development despite making up a significant portion of the population. Based on the Current Path, it is essential for the government and stakeholders to implement policies that promote sustainable development in both urban and rural areas. This will ensure that the basic needs of populations in both settings are adequately addressed.
Chart 5 presents GDP in market exchange rates (MER) and growth rate in the Current Path, from 1990 to 2043.
Since 1990, Zimbabwe's economy has experienced significant fluctuations, moving from prosperity to crisis and attempts at recovery. Initially, during the decade after independence, Zimbabwe thrived with a diverse agricultural sector and strong mining and manufacturing, leading to GDP growth from US$9 billion to US$14 billion.
In the 1990s, the introduction of Structural Adjustment Programs (SAP) aimed at liberalising the economy brought some growth, with GDP reaching around US$17 billion in 1999, but also led to fiscal imbalances and unrest due to contentious land reforms that resulted in economic chaos and food shortages.
By 2008, Zimbabwe's economy collapsed, with GDP falling to US$9 billion amid rampant hyperinflation. The adoption of a multi-currency system in 2009 temporarily stabilised the economy, and by 2018, GDP had risen to approximately US$18 billion, although challenges like corruption and poor infrastructure persisted. From 2019 onward, the abolition of the multi-currency system reintroduced hyperinflation, and by 2020, GDP had dropped to US$16 billion, further worsened by the COVID-19 pandemic.
However, by 2023, a recovery was noticeable, with GDP rising to about US$19 billion, supported by rebounds in agriculture and mining. The Current Path is cautiously optimistic, with an average GDP growth rate of 5% annually between 2023 and 2030, potentially elevating GDP to US$27 billion by 2030 and an even more ambitious reach of US$68 billion by 2043, if the average growth rate accelerates to 7% annually between 2031 and 2043. The Current Path GDP growth rate of approximately 6% by 2030 suggests that Zimbabwe will not meet its Vision 2030 goal of achieving an annual GDP growth rate between 7% and 10%.
For sustainable growth, Zimbabwe must focus on comprehensive reforms in several key areas: enhancing agricultural productivity, developing its mining sector through beneficiation, improving infrastructure, revitalising tourism and embracing digital innovation. Achieving these goals will require stabilising the currency, enhancing governance, reducing external debt and fostering better international relationships to restore investor confidence.
Chart 6 presents the size of the informal economy as per cent of GDP and per cent of total labour (non-agriculture), from 2020 to 2043. The data in our modelling are largely estimates and therefore may differ from other sources.
In the early 1990s, Zimbabwe implemented economic reforms as part of SAPs, which included privatisation, austerity measures and cuts in government spending. These changes resulted in rising unemployment and a reduction in formal sector jobs. Consequently, many Zimbabweans were pushed into the informal sector, engaging in activities such as street vending, small-scale farming and other informal enterprises to make ends meet. The growth of informal businesses continued to expand from the early 2000s due to the economic challenges (mentioned above) as people sought alternative sources of income.
Beginning in 2000, many industries faced collapse or downsizing, resulting in significant job losses. During this time, street vending became increasingly common, while cross-border trading, informal foreign exchange dealing, informal retail and artisanal mining activities also gained prominence as people sought alternatives to the dwindling formal job market. After the introduction of the multi-currency regime in 2009, many informal businesses began transitioning into more structured, semi-formal operations. However, the complete formalisation of these businesses has been slow, hindered by ongoing regulatory challenges and the continued reliance on informal practices.
In the 2010s, Zimbabwe faced ongoing policy inconsistencies characterised by frequent changes in regulations and tax laws that affected informal sector operators. As a result, many small businesses found themselves operating in a grey area, with limited access to formal banking services, government support and infrastructure. Despite these challenges, the informal sector demonstrated remarkable resilience. Smallholder farmers, informal foreign exchange dealers, cross-border traders, artisans and others continued to make significant contributions to the economy, particularly in terms of employment and local consumption.
The global COVID-19 pandemic put additional pressure on the Zimbabwean economy, particularly impacting the informal sector. Movement restrictions and lockdowns severely affected street vending, small-scale trade and informal mining activities. Despite these challenges, the informal sector demonstrated remarkable adaptability by embracing innovation. The pandemic led to a rise in digital platforms and online businesses, as many individuals turned to e-commerce and delivery services in response to the disruption of physical markets.
As of 2023, the informal sector in Zimbabwe played a vital role in the economy, employing around 40% of the total labour force and contributing approximately 54% to the country's GDP. Although the Current Path suggests that this sector's share of employment and GDP may decline to 35% by 2043, it is expected to remain essential for the Zimbabwean economy and the livelihoods of many citizens over the next two decades.
To effectively transition the informal sector towards formalisation and improve productivity, a comprehensive strategy is needed. Key approaches include access to finance, infrastructure development, reform of business regulatory framework, capacity building and support, public-private partnerships, political stability, anti-corruption measures, and monitoring and evaluation. By pursuing these strategies, policymakers can foster an inclusive economic environment that empowers informal businesses and contributes to economic growth. This could lead to the informal sector becoming a more organised part of the economy by 2043, promoting innovation, job creation and national development.
Chart 7 presents GDP per capita in the Current Path, from 1990 to 2043, compared with the average for the Africa income group.
Zimbabwe's GDP per capita displayed relative stability in the early 1990s, averaging around US$2 730, with a peak of US$2 930 in 1998—a level last seen in 1974. This stability was supported by a strong agricultural sector and mineral exports. However, challenges emerged toward the end of the decade, including political instability and rising external debt, which contributed to slower growth.
The early 2000s marked a significant decline in GDP per capita, which fell from approximately US$2 750 in 2000 to a record low of US$1 350 in 2008. This drop was largely a result of the land reform program that destabilised agriculture, compounded by political turmoil and rampant corruption, culminating in a hyperinflation crisis.
After the adoption of a multi-currency system in 2009, GDP per capita saw a moderate recovery, rising to about US$2 400 by 2018. Nonetheless, issues like low productivity, high unemployment and external debt persisted. In 2020, GDP per capita decreased to around US$1 940 due to currency instability following the end of the multi-currency system in early 2019. Moreover, negative impacts from the COVID-19 pandemic, coupled with domestic instability and natural disasters, further hindered growth, leading to a contraction in GDP per capita.
By 2023, signs of recovery emerged, particularly in the mining and agriculture sectors, with GDP per capita rising to about US$2 190. Despite this progress, Zimbabwe's GDP per capita remained significantly lower than the average GDP per capita of lower-middle-income African countries, which stood at US$5 780 in 2023.
On the Current Path, GDP per capita will grow to approximately US$2 580 by 2030 and then reach around US$4 400 by 2043, assuming annual average growth rates of approximately 2.3% and 4.2%, respectively. At this growth rate, Zimbabwe's economic development, as measured by GDP per capita, will continue to lag behind the average growth of lower-middle-income African countries, which will reach US$7 710 by 2043 from US$6 240 in 2030 on the Current Path.
Relatively higher growth rates are achievable if key factors such as political stability, institutional reforms, efficient natural resource management, infrastructure investment, debt management and currency stability are addressed. Successfully overcoming these challenges could enable Zimbabwe to experience significant economic growth and improve its attractiveness as an investment destination by 2043.
Chart 8 presents the rate and numbers of extremely poor people in the Current Path from 2020 to 2043.
In 2022, the World Bank updated the poverty lines to 2017 constant dollar values as follows:
- The previous US$1.90 extreme poverty line is now set at US$2.15, also for use with low-income countries.
- US$3.20 for lower-middle-income countries, now US$3.65 in 2017 values.
- US$5.50 for upper-middle-income countries, now US$6.85 in 2017 values.
- US$22.70 for high-income countries. The Bank has not yet announced the new poverty line in 2017 US$ prices for high-income countries.
Zimbabwe has experienced significant fluctuations in poverty levels over recent decades despite various efforts to stabilise the economy. In the 1980s, following independence, about 13% of the population lived on less than $2.15 per day, with rural poverty affecting over 60% of the population. The 1990s saw a decline in poverty, dropping from 11% in 1990 to a record low of 8% in 1998. However, the situation worsened in the 2000s due to severe economic challenges, with extreme poverty rising dramatically to 41% by 2008, a significant increase driven by factors such as land reform disruptions and political instability.
The adoption of a multi-currency system in 2009 led to a notable recovery, reducing the proportion of people living in extreme poverty by nearly half by 2012. However, ongoing economic fragility meant poverty remained a significant issue, especially in rural areas suffering from high unemployment and underemployment. From 2012 to 2018, weak GDP growth and a high formal unemployment rate contributed to persistent extreme poverty. The COVID-19 pandemic in 2020 exacerbated the poverty crisis, leading to economic disruptions and job losses, particularly in rural regions.
On the Current Path, extreme poverty (at less than US$2.15 per day) affected 35% of the population (5.8 million people) in 2023. While absolute numbers may drop slightly to 5.6 million by 2030, representing 30% of the population, significant improvements are projected by 2043, with extreme poverty affecting only 18% (4.2 million people). These forecasts are concerning, especially when considering that in 1998, only 0.96 million people lived in extreme poverty, accounting for just 8% of the population. Furthermore, these forecasts suggest that the country is unlikely to meet Sustainable Development Goal 1 (SDG 1), which aims to end extreme poverty and ensure that less than 3% of the global population lives below the extreme poverty line (at less than US$2.15 per day) by 2030.
To have a better chance of achieving SDG 1, Zimbabwe would need focused interventions aimed at fostering economic growth, creating jobs, ensuring effective governance, and enhancing access to education and health services. This includes leveraging its natural resources responsibly, investing in human capital, and establishing a predictable and stable political environment conducive to investment. Without significant policy changes and investments in these areas, the likelihood of achieving the target of reducing extreme poverty below 3% by 2030 remains slim.
Chart 9 depicts the National Development Plan of Zimbabwe.
Zimbabwe's national development plan has evolved over several decades to address shifting economic, political and social challenges. In the early 1990s, the country initiated SAP, guided by the Growth with Equity Strategy of 1991. This plan was influenced by a global shift toward neoliberal economic policies, aiming for: (i) economic liberalisation to reduce government intervention in the market, (ii) market-based reforms that focused on the privatisation of state-owned enterprises, trade liberalisation and cuts to subsidies, and (iii) economic growth with equity, which sought to diminish poverty and inequalities while promoting economic development. However, this era was also characterised by significant challenges, including rising inflation, high unemployment and a declining industrial sector, which prompted a reevaluation of these policies in the late 1990s.
During the hyperinflation crisis, the government did not present a formal long-term development plan. However, following the political and economic upheaval, a power-sharing government was established in 2009 between the ruling party Zimbabwe African National Union-Patriotic Front (ZANU-PF) and the main opposition party Movement for Democratic Change (MDC). This coalition government implemented the Short-Term Economic Recovery Programme (STERP) which aimed to stabilise the economy through a series of strategic measures, including currency stabilisation (the country transitioned from its currency to a multi-currency system, primarily using the US$ and South African rand), restoring growth (with a major focus on rebuilding essential sectors such as agriculture, mining and manufacturing) and infrastructure rehabilitation of key infrastructure projects that deteriorated during the crisis years.
While these efforts led to some economic stabilisation, challenges such as high unemployment, poverty and political instability remained. In 2013, Zimbabwe launched the Zimbabwe Agenda for Sustainable Socio-Economic Transformation (ZIM-ASSET), which spanned from 2013 to 2018. This plan aimed at achieving economic transformation through several key objectives:
- Natural Resource Management: Leveraging the country's mineral wealth for industrialis
- Agriculture and Food Security: Enhancing agricultural production to ensure food self-sufficiency.
- Infrastructure Development: Focusing on road improvements, energy and water systems to enhance the business environment.
- Employment Creation: Promoting industrialisation and the development of small-scale enterprises to reduce unemployment.
While ZIM-ASSET outlined ambitious goals, its implementation was often hindered by the country's economic challenges, including a lack of financing and pressures from external debt. The Transitional Stabilization Programme (TSP) was introduced in 2018 following the ousting of former President Robert Mugabe. It aimed to guide Zimbabwe through a period of economic transition and stabilisation. The key objectives of the TSP included:
- Economic Stabilization: Stabilizing the currency and managing inflation.
- Fiscal Consolidation: Reducing the budget deficit and controlling government expenditure.
- Reform and Modernization: Reforming the state-owned enterprises sector, implementing anti-corruption measures and enhancing governance.
- Infrastructure Development: Continuing infrastructure projects, particularly in energy and transport.
The TSP was expected to pave the way for the long-term goals outlined in the National Development Strategy 1 (NDS1). The NDS1, covering the period from 2021 to 2025, serves as Zimbabwe’s mid-term development plan. It aims to build on the achievements of the TSP and lay the groundwork for the country to become an upper-middle-income economy by 2030. Key priorities of the NDS1 include:
- Economic Diversification: Moving away from reliance on agriculture and mining to incorporate manufacturing and services.
- Infrastructure Development: Expanding roads, power generation and social services like health and education.
- Human Capital Development: Improving education and healthcare systems to create a skilled and healthy workforce.
- Digital Transformation: Promoting the use of technology in both the public and private sectors.
- Environmental Sustainability: Encouraging green initiatives and sustainable land use.
Zimbabwe's Vision 2030 represents the long-term national development goal of transforming the country into an upper-middle-income economy by 2030. This vision emphasises:
- Economic Growth: Achieving an annual GDP growth rate of around 7% to 10%.
- Industrialization and Value Addition: Shifting away from exporting raw materials to focusing on manufacturing and value-added exports.
- Poverty Reduction: Significantly lowering poverty levels by improving living standards.
- Sustainable Development: Ensuring that economic progress is environmentally sustainable and inclusive.
Zimbabwe’s development goals aim to achieve economic modernisation and create a more prosperous country. This plan builds on the groundwork laid in the Vision 2030 framework. Key long-term objectives may include:
- Technological Innovation: Promoting research and development while integrating emerging technologies across all sectors.
- Global Competitiveness: Positioning Zimbabwe as a competitive economy in regional and global markets.
- Social Inclusion: Ensuring that the benefits of economic growth reach all segments of society, particularly marginalised groups.
- Institutional Development: Strengthening transparent institutions that promote governance, peace and development.
The national development plans from 1990 reflect the evolution of Zimbabwe's economic and development strategies, moving from addressing immediate crises to setting ambitious long-term growth goals. While progress has been uneven, Zimbabwe remains focused on structural transformation, poverty reduction and sustainable development as it works toward these objectives.
The eight sectoral scenarios as well as their relationship to the Current Path and the Combined scenario are explained in the About Page. Chart 10 summarises the approach.
Chart 11 presents the mortality distribution in the Current Path for 2023 and 2043.
The Demographics and Health scenario envisions ambitious improvements in child and maternal mortality rates, enhanced access to modern contraception, and decreased mortality from communicable diseases (e.g., AIDS, diarrhoea, malaria, respiratory infections) and non-communicable diseases (e.g., diabetes) alongside advancements in safe water access and sanitation. This scenario assumes a swift demographic transition supported by heightened investments in health and water, sanitation, and hygiene (WaSH) infrastructure.
Visit the themes on Demographics and Health/WaSH for more detail on the scenario structure and interventions.
Zimbabwe's mortality distribution is characterised by a combination of factors, including communicable diseases (CDs) and non-communicable diseases (NCDs). CDs include HIV/AIDS, respiratory infections and others. NCDs include cardiovascular and malignant neoplasm. Lack of safe water access and sanitation is a significant contributor to the country's health challenges as it increases the risk of waterborne and sanitation-related diseases.
The HIV/AIDS epidemic in Zimbabwe has been a significant health challenge since the 1980s, but the country has made remarkable progress in reducing infection and death rates. The AIDS-related deaths dropped from a peak of 109 390 in 2003 to 17 620 in 2023 due to the widespread rollout of antiretroviral therapy (ART) starting in the 2000s, supported by initiatives like the President’s Emergency Plan for AIDS Relief (PEPFAR) and the Global Fund. Moreover, Zimbabwe adopted a universal test-and-treat policy in 2010 and now has over 1 million individuals on ART, achieving substantial progress toward global "90-90-90" targets.
Expanding access to testing and ART, addressing stigma, improving healthcare infrastructure and providing targeted support for vulnerable populations can further reduce AIDS-related deaths to 5 960 by 2043 on the Current Path. Furthermore, by integrating HIV care into broader health systems and leveraging education, technology and sustainable funding, Zimbabwe can eliminate mother-to-child transmission, maintain high viral suppression rates and achieve long-term health outcomes.
Although HIV/AIDS remains a major concern, respiratory infections and other CDs continue to affect the population. On the Current Path, deaths from respiratory infections and other CDs will decline from 13 190 and 28 410 in 2023 to 12 860 and 23 340 by 2043, respectively. These figures highlight the persistent burden of CDs, which has been exacerbated by the COVID-19 pandemic, further straining healthcare resources and increasing mortality rates. However, progress can be made through preventive measures, enhancements in healthcare infrastructure, increased education and awareness and tackling social determinants of health.
On the other hand, the Current Path indicates an increase in deaths from NCDs, with fatalities due to malignant neoplasms (MagligNeoPi) and cardiovascular diseases (Cardio Vasc) rising from 13 120 and 18 680 in 2023 to 24 110 and 30 760 by 2043, respectively. This surge is driven by demographic shifts, lifestyle changes and healthcare challenges. As a result, effectively addressing NCDs in Zimbabwe will require a stronger emphasis on prevention, early diagnosis and strategic resource allocation to meet the growing healthcare demands.
With a decline in deaths related to CDs and an increase in deaths from NCDs, the Current Path indicates that Zimbabwe will experience its epidemiological transition by 2031. This transition marks the point when NCD-related death rates surpass those of CDs.
Chart 12 presents the infant mortality rate in the Current Path and in the Demographics and Health scenario, from 2020 to 2043.
The infant mortality rate is the probability of a child born in a specific year dying before reaching the age of one. It measures the child-born survival rate and reflects the social, economic and environmental conditions in which children live, including their health care. It is measured as the number of infant deaths per 1 000 live births and is an important marker of the overall quality of the health system in a country.
Zimbabwe’s infant mortality rates have fluctuated over the years due to a combination of social, political and economic factors. In 1990, the rate stood at around 47 deaths per 1 000 live births, increasing to 54 by 1999 as a result of economic hardships and the HIV/AIDS crisis. The early 2000s saw further deterioration, peaking at 58 deaths per 1 000 live births in 2009. However, starting in 2010, enhanced healthcare efforts, supported by foreign aid and public health initiatives, began to reverse this trend. By 2020, the rate had dropped to approximately 40 deaths per 1 000 live births, further decreasing to 37 by 2023. With continued improvements in healthcare access, sanitation and economic stability, this figure will further decrease to 33 in 2030 and 23 deaths per 1000 live births by 2043 on the Current Path.
Sustained policy focus and increased investment in public health interventions in the Demographics and Health scenario will drive even greater progress, potentially reducing the infant mortality rate to 27 and 15 deaths per 1 000 live births by 2030 and 2043, respectively. However, this trajectory indicates that Zimbabwe will not meet the SDG 3.2 target of reducing the infant mortality rate to less than 25 deaths per 1 000 live births by 2030. The target could potentially be reached by 2032 in the Demographics and Health scenario while remaining on the Current Path would delay the achievement until 2040.
Severe acute malnutrition (SAM) remains a significant challenge for children in Zimbabwe, fueled by food insecurity, poverty and gaps in healthcare services. SAM prevalence among children under five rose sharply from 0.4% in 1988 to 4.2% in 1999 during a period of economic and health crises. Although international aid in the 2010s contributed to treatment advancements, SAM rates have remained a concern, with an estimated 0.7% prevalence by 2023. This rate will remain unchanged until 2043 on the Current Path. However, it can decline slightly to 0.6% with interventions in the Demographics and Health scenario. These interventions focus on sustained improvements in food security and access to healthcare.
Similarly, Zimbabwe’s maternal mortality ratio (MMR) has experienced dramatic shifts. It peaked at 685 deaths per 100 000 live births in 2008 due to economic instability and the impact of HIV/AIDS. Efforts to enhance maternal healthcare in the early 2010s led to a steady decline, with the MMR dropping to 357 by 2020 and further to 323 in 2023. With sustained investment in healthcare systems and addressing underlying social issues like poverty and education as part of the interventions in the Demographics and Health scenario, the MMR will drop to 76 by 2043 compared to 101 deaths per 100 000 live births on the Current Path. Despite this progress, Zimbabwe will not reach the 2030 international health target of reducing the MMR to below 70 deaths per 100 000 live births until 2043.
Overall, while strides have been made in improving health outcomes in Zimbabwe, challenges remain due to economic instability, food insecurity and healthcare access. Continued focus on maternal and child health, nutrition and healthcare infrastructure will be critical for achieving sustainable reductions in infant mortality, SAM and maternal mortality rates by 2043.
Chart 13 presents the demographic dividend in the Current Path and in the Demographics and Health scenario, from 2020 to 2043.
The dividend is the window of economic growth opportunity that opens when the ratio of working-age persons to dependants increases to 1.7 to 1 and higher.
Zimbabwe’s fertility rates have shown a consistent decline since 1990, decreasing from approximately 5 births per woman to approximately 4 by 2023. This trend will continue, with the Current Path suggesting a decrease to 2.4 births per woman by 2043. The reduction in fertility rates will result in a smaller dependent population (children) and a larger working-age population, which has significant implications for economic development.
As fertility rates decline, the demographic composition of Zimbabwe's population is expected to shift. On the Current Path, the proportion of the population aged 65 and above will gradually increase but is projected to remain relatively low, around 4% by 2043. Conversely, the working-age population (ages 15-64) will grow significantly, potentially making up 64% of the total population by 2043, compared to 56% in 2023. This demographic transition creates a potential for what is known as a "demographic dividend."
By 2023, Zimbabwe's ratio of working-age population to dependants was 1.3:1, which is below the 1.7:1 threshold required to achieve a demographic dividend. Both the Current Path and the proposed Demographics and Health scenario suggest that Zimbabwe will enter a demographic window of opportunity by 2039, with dependency ratios of 1.71 and 1.72, respectively. Until that time, the country will not benefit from a demographic dividend, which could have sped up economic growth.
To maximise the potential benefits of this demographic dividend, Zimbabwe will need to invest in education, healthcare and job creation to ensure that the growing working-age population is healthy, equipped with the necessary skills and can be absorbed into the labour market.
Chart 14 presents crop production and demand in the Current Path from 1990 to 2043.
The Agriculture scenario envisions an agricultural revolution that ensures food security through ambitious yet feasible increases in yields per hectare, thanks to improved management, seed, fertiliser technology, and expanded irrigation and equipped land. Efforts to reduce food loss and waste are emphasised, with increased calorie consumption as an indicator of self-sufficiency and prioritising it over food exports. Additionally, enhanced forest protection signifies a commitment to sustainable land use practices.
Visit the theme on Agriculture for our conceptualisation and details on the scenario structure and interventions.
Zimbabwe's agriculture sector is predominantly crop-based and is vital to the economy and livelihoods, serving as a key pillar of food security, particularly for rural communities. Over the years, food security has fluctuated due to economic policies, land reforms, climate conditions and international trade dynamics. Total agricultural production and demand have both increased, reaching 9.3 and 11.6 million metric tons in 2023 from 8.11 and 7.76 million metric tons in 1990, respectively. However, since 2001, demand has consistently exceeded production, widening the food deficit to 2.3 million metric tons by 2023.
In the 1990s, the country was recognised for having some of the highest crop production levels in sub-Saharan Africa. Crop production increased from 7.4 million metric tons in 1990 to 8.7 million metric tons in 1999, primarily driven by staple crops such as maize and tobacco. During the same period, overall agricultural crop production rose from 6.6 million to 8.4 million metric tons.
However, severe droughts, particularly during the 1992/1993 season, led to a sharp decline in yields. In 1992, crop yields plummeted to a record low of 1.5 million metric tons, significantly below the national demand of 3.5 million metric tons. Total agricultural production also fell to a record low of 2.15 million metric tons, compared to the national demand of 4.09 million metric tons in that same year. Recovery efforts allowed crop production to rebound to 9.4 million metric tons by 1999, while domestic demand increased to 8.6 million metric tons.
The land reform program of the early 2000s, which aimed to redistribute commercial farmland to local farmers, significantly reduced agricultural productivity. The displacement of skilled commercial farmers led to a drastic decline in crop yields, which dropped from 8.9 million metric tons in 2000 to 5.1 million metric tons by 2009. This situation marked the beginning of food shortages as crop demand consistently remained above production, even as it decreased from 8.3 million metric tons to 6.7 million metric tons during the same period.
From 2010 onwards, recovery efforts increased crop production again to 7.9 million metric tons in 2018. However, yields still fell short of pre-reform levels, while demand rose to 8.5 million metric tons in the same period. The land reform led to ongoing food insecurity, widening the food deficit from 2001 onward, and caused economic instability due to decreased financial inflows from agricultural exports.
Ongoing economic challenges, erratic rainfall due to climate change events such as the 2023/2043 El Niño and insufficient investment in agricultural technology have further strained the agricultural sector. As a result, crop yields declined again to 7.7 million metric tons in 2023, while demand increased to 9.9 million metric tons. This situation resulted in a crop production deficit of 2.2 million metric tons in 2023.
On the Current Path, the crop production deficit will increase nearly fivefold to 9.9 million metric tons by 2043, with demand reaching 19.1 million metric tons against production of 9.2 million metric tons. This suggests that the country is straying from the SDG 2 goal of eradicating hunger, ensuring food security and enhancing nutrition by 2030.
Land reform also negatively affected agricultural losses (both post-harvest losses and food waste), irrigation development and rural road access, particularly in farming regions. Equipped irrigated land is crucial, especially as Zimbabwe has experienced inconsistent rainfall for over two decades. Additionally, rural road access is essential for improving agricultural efficiency, production and market access. Reducing agricultural losses is necessary to mitigate food shortages and prevent food price hikes, as production and distribution losses often result in higher costs for consumers.
Although crop production losses due to storage and distribution challenges will decrease slightly from 10.3% in 2023 to 9.7% in 2043 on the Current Path, they remain higher than the averages of lower-middle-income African countries. Before the land reform, equipped-irrigated land expanded from 109 000 hectares in 1990 to 174 000 hectares by 1999. However, growth stalled during the land reform crisis, only beginning to recover in 2017 through investments in large-scale and smallholder irrigation systems. By 2023, equipped-irrigated land had reached approximately 190 000 hectares. The Current Path shows a decline to 167 000 hectares by 2043.
Rural road access, once relatively strong before land reform, has deteriorated since the early 2000s. The proportion of the rural population with access to all-season roads declined from 65% in 2002 to 56% in 2020. Recent infrastructure investments have begun reversing this trend, increasing access to 57% by 2023. Consistent investments in road development could raise this figure to about 62% by 2023 on the Current Path.
In summary, Zimbabwe’s agricultural sector faces a complex array of challenges, including unstable crop yields, high production losses, dependence on rain-fed farming and deteriorating infrastructure. A comprehensive strategy involving major investments in irrigation, modern agricultural practices, rural road networks, and effective land reform policies could revitalise the sector. Without addressing these pressing issues, Zimbabwe’s agricultural performance will likely continue to lag behind regional peers, impacting long-term food security and economic stability.
Chart 15 presents the import dependence in the Current Path and the Agriculture scenario, from 2020 to 2043.
In the 1990s, Zimbabwe's agricultural sector was highly productive and diversified, enabling the country to achieve self-sufficiency in key commodities. Zimbabwe was a net exporter of agricultural products such as tobacco, maize, cotton and sugar, with tobacco being the largest contributor to foreign currency earnings. The highest dependence on imports occurred during the 1992 drought. However, by 1994, the country had significantly enhanced its self-sufficiency. While the country was largely self-reliant in food and cash crop production, it still imported a small portion of agricultural inputs, including fertilisers, machinery and seeds. Moreover, climatic risks, particularly for rain-fed farming, posed challenges as droughts occasionally necessitated imports of staple foods.
The early 2000s marked a dramatic shift in Zimbabwe’s agricultural landscape. The Land Reform Program, coupled with political instability and economic collapse, caused a sharp decline in agricultural output. The redistribution of commercial farms significantly reduced production as new farm owners often lacked resources and expertise, leading to widespread food insecurity. Zimbabwe became heavily reliant on imported food staples such as maize, wheat and rice to meet domestic demand. Shortages of essential inputs like fertilisers and seeds, compounded by a foreign exchange crisis, further exacerbated the situation. Tobacco and cotton production, once major exports, also declined, reducing the country’s capacity to earn foreign exchange. Since the 2001/2002 season, the country has shifted from self-sufficiency to import dependency.
During the 2010s, Zimbabwe began efforts to rebuild its agricultural sector, but challenges in achieving self-sufficiency persisted. While tobacco production recovered, overall agricultural output remained low, and import dependency on staples like maize, wheat and rice continued. Limited access to irrigation systems, unpredictable weather and rural infrastructure issues hindered productivity. Imported fertilisers, pesticides and equipment were critical to maintaining production, but high costs and limited foreign currency made these inputs inaccessible to many farmers. Periodic droughts and floods disrupted agriculture, increasing reliance on food imports to ensure food security.
By the 2020s, Zimbabwe's economic stability had improved, yet the agricultural sector continued to struggle with reducing import dependency which stood at 20% in 2023, up from 7% in 2002. Crop exports were approximately US$50 million, while imports were US$468 million. As a result, the crop trade deficit stood at roughly US$418 million in 2023.
The country remained reliant on imported agricultural inputs such as fertilisers, seeds and machinery to sustain productivity. Additionally, disease outbreaks highlighted ongoing challenges. While tobacco remained a major export crop and efforts were made to revive cotton and horticulture exports, overall export capacity was constrained by high input costs and low production levels. Furthermore, Zimbabwe's dependence on rain-fed agriculture and limited irrigation infrastructure left it vulnerable to climate variability, leading to inconsistent domestic production.
Looking ahead, the Current Path suggests that Zimbabwe's dependence on agriculture imports will worsen, reaching 53% by 2043. At the same time, agricultural imports will increase to US$2.03 billion while exports will drop significantly to US$1.2 million.
Zimbabwe's agricultural future relies on climate adaptation, technological investment, infrastructure development, economic stability and effective policy implementation. If these issues are not addressed, increasing agricultural output will remain a challenge. Hence, interventions in the Agriculture scenario focus on substantial investments in small-scale and large-scale irrigation systems, agricultural technology, climate-adaptive agricultural practices, infrastructure, agro-processing and nutrition. Strengthening domestic production capacity through these measures can lead to improved exports of tobacco and horticultural products, ultimately fostering a more resilient agricultural sector.
In the Agriculture scenario, dependence on agricultural imports will increase to 31% by 2043, compared to 53% on the Current Path. At the same time, agriculture exports will rise to US$180 million by 2043, far above the US$1.2 million on the Current Path, while import growth will be limited to US$1.5 billion, which is lower than the US$2.03 billion on the Current Path.
Chart 16 depicts the progress through the educational system in the Current Path, for 2023 and 2043.
The Education scenario represents reasonable but ambitious improvements in intake, transition, and graduation rates from primary to tertiary levels, as well as better quality of education at primary and secondary levels. It also models substantive progress towards gender parity at all levels, additional vocational training at the secondary school level, and increases in the share of science and engineering graduates.
Visit the theme on Education for our conceptualisation and details on the scenario structure and interventions.
The educational landscape in Zimbabwe, particularly since the 1990s, has been shaped by various socio-economic and political factors that have impacted access, quality and gender parity across different education levels. Despite these challenges, the literacy rate among individuals aged 15 and older has steadily risen, from around 80% in 1990 to 90% in 2023. In 2024, Zimbabwe ranked among the top 10 African countries with the highest education levels, securing the 4th position. This ranking is based on literacy rates and years of schooling. The Current Path indicates that Zimbabwe’s literacy rate will reach 91% by 2030 and 96% by 2043. As a result, Zimbabwe aligns with SDG 4.6, which aims to ensure that all youth and a significant proportion of adults, regardless of gender, attain literacy and numeracy by 2030.
In the 1990s, Zimbabwe was a notable leader in educational attainment within sub-Saharan Africa, achieving near-universal primary education and substantial gender parity at both primary and secondary levels. The government's proactive investment in educational infrastructure and policies effectively reduced the gender gap, providing equal opportunities for boys and girls. Despite the robust enrollment figures, challenges loomed for secondary education where access was limited and many families could not afford associated costs.
The early 2000s brought a significant downturn as Zimbabwe experienced a severe economic crisis characterised by hyperinflation and declining governmental support for education. This crisis severely impacted secondary and tertiary education enrollment rates, particularly affecting girls due to economic pressures leading to higher dropout rates from schools and increased risks of early marriages and pregnancies.
International aid initiatives were instrumental in advancing gender parity and increasing girls' enrollment in both primary and secondary education during this challenging period. However, challenges persisted for women in tertiary education.
Following the dollarisation of the economy in 2009, Zimbabwe's education system began to show signs of recovery. Primary education net enrollment remained high and secondary school net enrollment gradually improved, although it was accompanied by issues such as overcrowded classrooms and inadequate infrastructure. Enhancements in gender parity continued, with an increasing presence of female students in tertiary institutions by the 2010s, reflecting a growing commitment to higher educational attainment regardless of gender.
The COVID-19 pandemic in 2020 accelerated the implementation of online learning but the country's previously established digital infrastructure issues highlighted the uneven access to technology between urban and rural areas. Nevertheless, initiatives aimed at promoting gender equality and removing barriers for female students continued.
Looking ahead, the Current Path indicates that Zimbabwe will achieve the SDG 4 2030 target of at least 97% net primary enrollment and gender parity in primary education by 2043. Girls’ net enrollment rates will rise from 93% in 2023 to 100% by 2043, while boys' enrollment will increase from 80% to 94% during the same period.
In secondary education, the gender gap in net enrollment will close entirely by 2034 on the Current Path, with a net enrollment rate of 52%, up from 35% for females and 39% for males in 2023. This rate will rise to 56% by 2043. There is potential for improvement through initiatives like scholarships, mentorship programs and community-based efforts aimed at overcoming socio-cultural barriers such as early marriage and teenage pregnancies. These measures are crucial since the country's net secondary school enrollment rates are still lower than the average for lower-middle-income African countries. By 2043, this average will reach 63% after achieving gender parity at 60% in 2038 on the Current Path.
In tertiary education, the gender gap in gross enrollment closed at approximately 12% in 2023. However, the Current Path shows that it reopened in 2024, this time favouring females. Despite this shift, the gap will remain small as enrollment rates rise to about 26% for females and 23% for males by 2043. This trend is consistent with the average observed in lower-middle-income African countries, with marginal variations.
Zimbabwe has made significant progress toward gender parity in education, implementing policies to increase girls' enrollment in secondary education and tackle barriers like teenage pregnancy. By 2023, gender parity across all education levels was nearly 1:1, with almost equal gross enrollment rates for both genders. The Current Path indicates that parity levels will be maintained across all education levels through 2043.
The country's primary focus must be on enhancing the quality of tertiary education and equipping both male and female graduates with the skills needed to compete in a global economy. Future policies and reforms must also continue prioritising access to education and funding, especially in rural areas, while addressing gender disparities. As digital education gains prominence worldwide, Zimbabwe may further integrate online learning platforms; however, access to technology will remain a challenge unless significant infrastructure improvements are made.
Economic recovery and growth will be crucial in shaping the quality of education in the coming decades. A strong economy will enable better funding and accessibility for education. By 2043, gender parity in education is expected to be more firmly established, with more girls staying in school longer and entering traditionally male-dominated fields such as Science, Technology, Engineering, and Mathematics (STEM). Additionally, the education system may see notable improvements in the transition from secondary to tertiary education, particularly in response to the growing global demand for skilled labour.
Chart 17 presents the mean years of education in the Current Path and in the Education scenario, from 2020 to 2043, for the 15 to 24 age group.
The average years of education in the adult population aged 15 to 24 is a good first indicator of how the stock of knowledge in society is changing.
Zimbabwe’s education system continues to face challenges, including inadequate infrastructure, teacher shortages and economic instability. Despite these obstacles, the country’s educational attainment remains competitive within the region.
In general, on the Current Path, the average years of educational attainment for adults aged 15 and older will increase, reaching 11.3 years for both males and females by 2040, remaining stable through 2043. This convergence marks a shift from the 2023 figures, which were 11.4 years for males and 11 years for females (11.2 years total).
Zimbabwe's Current Path trend on average years of adult educational attainment from 2023 to 2043 surpasses that of economically stable African countries such as Botswana, South Africa and Mauritius. However, these countries have achieved significantly higher average years of educational attainment among the lower youth age group (15–24 years) due to their stable economies and consequently well-funded education systems. The lower youth age group serves as a key indicator of a country's human capital stock.
On the Current Path, the average years of educational attainment for the lower youth age group (15–24 years) in Zimbabwe will see a slight increase from 8.5 years in 2023 (8.9 for females and 8.1 for males) to 8.6 years in 2043 (9 for females and 8.2 for males), peaking at 8.9 years in 2030 (9.4 for females and 8.5 for males). While these figures are slightly above the average for lower-middle-income African countries, there is still room for improvement to reach the levels of economically stable African countries.
The country’s education sector faces several key challenges, including inadequate infrastructure (both soft and hard), a shortage of teachers and insufficient funding all of which are rooted in political and economic instability. A stable political and economic environment would allow for greater investment in education, enhanced infrastructure and improved teacher availability.
Consequently, interventions in the Education scenario aim to address these challenges and enhance education outcomes beyond the Current Path. The long-term trajectory of educational attainment will also be shaped by reforms such as Education 5.0, introduced in the 2010s to emphasise higher education and skills development.
If interventions in the Education scenario are successfully implemented, the average years of schooling for adults aged 15 and older will increase to 11.4 years by 2043, compared to 11.3 years on the Current Path. Similarly, for the lower youth age group (15–24 years), the average educational attainment will reach 8.7 years in the Education scenario, slightly higher than the 8.6 years on the Current Path.
Additionally, policies supporting universal secondary education, vocational training, STEM qualifications and gender equality in education will contribute to progress. As of 2023, science and engineering students comprised 21% of tertiary graduates, a rate expected to remain the same by 2043 on the Current Path. However, in the Education scenario, interventions such as international programs and partnerships focused on STEM education in Africa could increase this rate to 26% by 2043. Global education trends, particularly advancements in digital learning, may also enhance STEM educational outcomes.
Chart 18 presents the value-add by sector as share of GDP in the Current Path, for 2023 and 2043.
In the Manufacturing scenario, reasonable but ambitious growth in manufacturing is envisaged through increased investment in the sector, research and development (R&D), and improved government regulation of businesses. This aims to enhance total labour participation rates, particularly among females where appropriate and is accompanied by increased welfare transfers to unskilled workers to mitigate the initial rises in inequality typically associated with a low-end manufacturing transition.
Visit the theme on Manufacturing for our conceptualisation and details on the scenario structure and interventions.
Since 1990, Zimbabwe's manufacturing sector has experienced significant challenges and transformations. In the early 1990s, the sector was relatively robust, contributing a substantial portion to the country's GDP and employing a large workforce. However, economic instability, particularly due to political turmoil, weak governance and hyperinflation in the late 1990s and early 2000s, severely impacted industrial production.
The adoption of the Economic Structural Adjustment Program (ESAP) in the early 1990s aimed to liberalise the economy but led to increased unemployment and diminished domestic manufacturing capacity. The land reform program initiated in 2000 further exacerbated the situation, leading to the collapse of many agro-based industries, particularly in food and cotton processing.
By the mid-2000s, manufacturing output had declined significantly, with many factories closing due to a lack of investment, power shortages and a deteriorating infrastructure. However, after the introduction of the multi-currency system in 2009, some recovery was seen as businesses adapted to a more stable economic environment.
In the 2010s, the government made various efforts to revitalise the manufacturing sector, including policies aimed at attracting foreign investment, but challenges such as economic policy inconsistencies, limited access to financing and competition from manufactured imports, particularly from China, continued to hinder growth. By 2023, there have been sporadic signs of recovery and growth in specific industries. However, the manufacturing sector in Zimbabwe remains constrained by a combination of longstanding economic and political structural issues, largely stemming from poor regulation.
Although some reforms in the 2010s offered some hope for recovery, unfavourable business regulations contributed to economic decline and deindustrialisation, leading to a rise in informal enterprises. To this day, Zimbabwe’s business regulatory environment remains burdened by bureaucracy, a lack of transparency and extortion, all of which discourage the formalisation of informal businesses. Hence, by 2023, the Current Path indicates a significantly large size of the country’s informal sector, contributing 54% to GDP, compared to an average of 31% for lower-middle-income African countries. This situation highlights the need for regulatory reforms that promote a smooth transition to formalisation, allowing informal enterprises to eventually integrate into the formal economy.
Another key issue in the manufacturing sector relates to skills development, particularly among women, to achieve gender parity in the sector's workforce. Some policies have promoted female participation in the labour market, health and educational attainment but the manufacturing sector has largely remained disconnected from broader gender-focused economic reforms, limiting its overall productivity potential. Overall, the female labour participation rate stood at 80% compared to 89% for males in 2023. The Current Path suggests that this rate will rise to 83% by 2043. Be that as it may, it will still be lower than the male labour participation rate, which will remain steady at 89% throughout the same period. Skills development initiatives prioritising women in the manufacturing sector are therefore essential to help close this gender gap in the labour force.
Moreover, the manufacturing sector is experiencing a stark imbalance in labour demand, with a significant increase in unskilled labour demand forecast to rise from 549 930 to 844 470 by 2043, while skilled labour demand increases only slightly from 34 770 to 62 430 on the Current Path. This trend signals potential issues such as technological resistance, inadequate investment in workforce development and low productivity levels. A reliance on unskilled labour may also hinder innovation and competitiveness. The sector must implement strategies to attract skilled labour, invest in technology and cultivate a culture of innovation, which are essential for aligning with global trends and ensuring a sustainable economic future.
According to both endogenous and exogenous growth theories, relying solely on physical capital investment in the manufacturing sector without technological progress does not lead to sustainable growth. Therefore, policies aimed at increasing investment in the sector must be developed and revised alongside initiatives that promote industrial research and development (R&D) and skills development, among other technological factors. Beyond the issue of skills development, Zimbabwe’s manufacturing sector continues to lag in modern technology due to insufficient R&D. The Current Path indicates that R&D expenditure as a share of GDP will gradually increase from 0.18% in 2023 to 0.29% in 2043. However, it will still remain well below the average for lower-middle-income African countries, which is expected to rise from 0.34% to 2023 to 0.42% in the same period. To enhance manufacturing production and productivity, it is crucial to introduce tax incentives for research activities, provide grants for innovation hubs and strengthen collaboration between the government, universities and manufacturing firms. By aligning university research with industrial needs, the government can foster applied research that directly benefits the manufacturing sector.
Zimbabwe’s participation in regional trade agreements, such as the African Continental Free Trade Area (AfCFTA), could further drive manufacturing growth. Many African governments are improving regulatory frameworks to attract investment in value-added industries, particularly in technology, automotive and renewable energy. Attracting investments that promote beneficiation is essential, considering the country's abundance of mineral resources that are currently exported in their raw forms. For example, the country has a strong potential to attract manufacturing investments for electric vehicle batteries, as it possesses the largest lithium reserves in Africa and ranks 5th globally for lithium deposits.
As of 2023, Zimbabwe’s investment in manufacturing to GDP ratio was 2.8. The Current Path indicates that this ratio could peak at 3.2 before stabilising at 2.8 in 2043. In general, the Current Path trend from 2020 to 2043 depicts that policies aimed at attracting manufacturing investment should be reviewed regularly, ideally every five years, to maintain an upward investment trend in the sector.
In a nutshell, to enhance the manufacturing sector's contribution, it is essential to implement regulations that foster a conducive business environment, prioritise skills development initiatives with priority for women, adopt beneficiation policies, attract manufacturing investment, and promote industrial research and development (R&D). Without addressing these key factors, the sector risks stagnation or decline. On the Current Path, Zimbabwe’s manufacturing value-add remains stagnant at around 16% of GDP from 2020 to 2043 and will fall behind the average for lower-middle-income African countries by 2037/38.
Chart 19 presents the contribution of the manufacturing sector to GDP in the Current Path and in the Manufacturing scenario, from 2020 to 2023. The data is in US$ and % of GDP.
Zimbabwe's manufacturing sector has faced significant challenges in maintaining its contribution to GDP since 1990. Several factors, including volatile business environment, insufficient R&D investment, lack of beneficiation investments and skills development, and ongoing political issues, have hampered growth of the sector.
The Manufacturing scenario includes interventions focused on regulatory reforms to support the transition from informal to formal enterprises. These efforts aim to create a stable, transparent and business-friendly environment by streamlining tax systems, reducing bureaucratic barriers and strengthening property rights. Additionally, the scenario emphasises skills development, particularly for women to achieve gender parity in the sector, increased investment in R&D to drive technological progress, and policies to promote beneficiation and manufacturing investments.
Implementing the Manufacturing scenario will revitalise Zimbabwe’s manufacturing sector, increasing its value-added share of GDP from a stagnant 16% between 2020 and 2043 to 19% by 2043 on the Current Path. This growth trajectory positions Zimbabwe’s manufacturing sector above the average for lower-middle-income African countries, where the share will rise from 13% in 2023 to 17% in 2043.
Chart 20 depicts exports and imports as a percentage of GDP, from 2000 to 2043, in the Current Path and in the AfCFTA scenario.
The AfCFTA scenario represents the impact of fully implementing the African Continental Free Trade Agreement by 2034. The scenario increases exports in manufacturing, agriculture, services, ICT, materials and energy exports. It also includes improved multifactor productivity growth from trade and reduced tariffs for all sectors.
Visit the theme on AfCFTA for our conceptualisation and details on the scenario structure and interventions.
The African Continental Free Trade Area (AfCFTA) was officially launched on 21 March 2018, with 44 African Union member states, including Zimbabwe, signing the agreement. Zimbabwe ratified it in 2019 and has since been aligning its policies to maximise the benefits of economic integration. Following ratification, the country engaged stakeholders to ensure preparedness and committed to gradually reducing tariffs on various goods. Reducing tariffs and non-tariff barriers lowers export costs, boosting Zimbabwe’s competitiveness in the African market, which had over 1.5 billion people in 2023 and will grow to 2.3 billion by 2043 on the Current Path. Additionally, Zimbabwe has been working to improve trade infrastructure, increase industrial output and align national policies with AfCFTA regulations.
As of 2023, Zimbabwe actively participated in regional discussions to leverage AfCFTA for growth and has developed a National Strategy for AfCFTA Implementation aimed at enhancing trade, promoting SMEs and improving the business environment. Collaborative efforts among government, private sectors and trade associations are ongoing to prepare Zimbabwean businesses for the continental market.
Zimbabwe's implementation of AfCFTA is progressing gradually despite challenges like the COVID-19 pandemic. Steady advancements are positioning the country for significant benefits by 2043 as it works to diversify its export basket beyond minerals such as gold, platinum and diamonds, as well as agricultural products like tobacco and sugar. Additionally, Zimbabwe aims to reduce its dependence on extra-African sources for essential goods, including fuel, machinery, vehicles and food products.
The Current Path indicates that Zimbabwe’s trade-to-GDP ratio will rise from 56% in 2023 to 66% by 2043. This increase is mainly driven by imports, which will grow from 30% to 36% of GDP, while exports will rise from 25% to 30% in the same period. The rise in exports, although still lower than import levels, aligns with the opportunities created by AfCFTA and other economic initiatives designed to improve the country’s trade performance.
The AfCFTA is also expected to enhance Zimbabwe's knowledge capital through various channels, including increased collaboration opportunities, knowledge exchange and technology transfer across Africa. However, on the Current Path, the knowledge human capital index will decline slightly from 0.72 in 2023 to 0.71 in 2043, with a peak of 0.73 in 2030. While these figures are higher than the forecasted averages for AfCFTA non-least Developed Countries (LDCs) and lower-middle-income African countries—forecast to be 0.56 and 0.51 in 2023 and 0.66 and 0.62 in 2043, respectively—Zimbabwe has the potential to transition into a more knowledge-driven economy as the AfCFTA implementation progresses. This transition could significantly contribute to its economic and technological development within the African continent.
Chart 21 presents the trade balance in the Current Path and in the AfCFTA scenario, from 2020 to 2043 as a percentage of GDP.
Trade initiatives like the AfCFTA generally promote trade openness, allowing participating countries to diversify their exports and markets. However, when countries do not have competitive domestic products, such initiatives can lead to the crowding out of local goods. This issue is often seen in extra-African trade initiatives, such as the Forum on China-Africa Cooperation (FOCAC), but it can also occur in intra-African trade if a country's manufacturing costs are higher than those of its peers.
A pertinent example is Zimbabwe, which has faced a crowding-out effect due to both extra-African and intra-African trade since the economic crisis hit the country in the early 2000s. Domestic consumers and industries began to prefer cheaper imports from South Africa, Botswana and China over more expensive, locally manufactured products. Compounding this issue was the inability of the local production sector to scale up and meet domestic demand, leading to significant shortages. As a result, Zimbabwe's trade balance shifted dramatically from a surplus of 3.9% of GDP in 1999 to a record deficit of 26.6% in 2008.
The adoption of the dollarisation, which stimulated domestic production, helped ease these challenges, allowing the trade balance to recover to a surplus of 1.6% in 2019. However, a return to using the local currency seems to be reverting the country to its pre-dollarisation circumstances, with the trade deficit widening to 5.1% in 2023. On the Current Path this figure will worsen to 7.7% in 2034, before bouncing back to 5.5% in 2043.
If interventions in the AfCFTA scenario are effectively implemented, Zimbabwe’s trade deficit could shrink to 3.6% of GDP by 2043, compared to 5.5% on the Current Path.
To fully benefit from AfCFTA, Zimbabwe should prioritise strengthening its exporters, especially small and medium-sized enterprises (SMEs), by providing training programs to help them meet regional market standards. Additionally, the country must track its integration progress, implement policies that enhance export growth through diversification and value addition, and promote industrialisation and infrastructure development. These initiatives are vital to ensuring that export growth keeps pace with rising imports to maintain a favourable trade balance.
Regarding sectoral impact, the interventions under the AfCFTA scenario will significantly drive export growth in materials, followed by services, agriculture, ICT and energy. However, manufacturing exports will be negatively affected, indicating a crowding-out effect. This suggests that for Zimbabwe to fully leverage AfCFTA opportunities, it must focus on strengthening its manufacturing sector and improving its competitiveness relative to other African countries, as highlighted in the Manufacturing scenario. Currently, the sector faces several challenges, including outdated infrastructure, a lack of industrial research and innovation, insufficient skills and severe energy shortages. Overall, the trajectory of the AfCFTA scenario indicates that AfCFTA presents substantial opportunities to boost Zimbabwe's exports.
Chart 22 presents the Current Path of access to electricity for urban, rural and the total population from 2000 to 2043.
The Large Infrastructure and Leapfrogging scenario involves ambitious investments in road and renewable energy infrastructure, improved electricity access and accelerated broadband connectivity. It summarises adopting modern technologies to enhance government efficiency and incorporates significant investments in major infrastructure projects like rail, ports, and airports while highlighting the positive impacts of renewables and ICT.
Visit the themes on Large Infrastructure and Leapfrogging for our conceptualisation and details on the scenario structure and interventions.
Zimbabwe, like many lower-middle-income African countries, struggles with a significant infrastructure deficit, including inadequate energy supply, transportation networks, Information and Communication Technology (ICT) facilities, and water and sanitation facilities. These challenges impede domestic and regional trade, discourage investment and reduce the country's global competitiveness, ultimately slowing economic growth and affecting social well-being. Addressing these issues is crucial to unlocking Zimbabwe’s economic potential.
In 2024, the country ranked 20th out of 54 African countries on the composite African Infrastructure Development Index (AIDI). It secured 14th place in the transport category, 17th in energy, 24th in ICT, and 29th in water and sanitation. Additionally, in 2018, it held the 13th position for infrastructural regional integration in Africa, indicating that the country performs at an average level on the continent.
Zimbabwe had a relatively stable electricity system in the 1990s, primarily relying on hydropower from the Kariba Dam and thermal energy from coal-fired plants like the Hwange and Munyati Power Station. However, rural areas remained largely unconnected. The economy was fairly stable, and government efforts to expand electricity access saw some success, with overall access increasing from 28% in 1992 to 38% in 1999. Rural electrification played a major role in this progress, with rural access rising from 3% to 14%, while urban access saw a minor increase from 85% to 87% during the same period.
Financial difficulties in the early 2000s constrained infrastructure development, leading to more frequent power outages. Economic and political instability, including hyperinflation, severely impacted the power sector, causing a decline in industrial production and making it difficult for the government to maintain the national grid. Despite these challenges, electricity access rose from 34% in 2000 to 43% in 2009, driven primarily by rural electrification, which increased rural access from 7% to 20%, while urban access improved from 85% to 91%. However, frequent power cuts and load shedding disrupted urban areas, as power plants suffered from underinvestment and failed to meet growing demand. Zimbabwe increasingly relied on electricity imports from neighbouring countries like South Africa.
In the 2010s, the country sought to stabilise its economy but continued facing challenges, including poor infrastructure, high debt and limited investment in the energy sector. By the late 2010s, electricity access had improved slightly but remained below 50%. Rural electrification initiatives had limited success, while urban centres still faced shortages. The government and private sector explored alternative energy solutions, particularly solar power, to address supply gaps. Some rural areas turned to off-grid solar solutions, and efforts were made to expand existing power plants, such as the Hwange Power Station and Kariba hydropower facilities. However, progress was slow due to financial limitations.
By the 2020s, Zimbabwe shifted towards renewable energy sources, particularly solar, to tackle electricity shortages. National access to electricity increased from 47% in 2019 to 56% in 2023, with rural access nearly doubling from 28% to 40%, while urban access rose from 85% to 90%. With continued investments in renewables and grid improvements, national electricity access could reach 62% by 2030 and 78% by 2043 on the Current Path. The Current Path indicates that urban areas will achieve full electricity access by 2035, while rural access will grow to 45% in 2030 and 67% by 2043.
Zimbabwe’s road infrastructure was relatively well-developed in the early 1990s, especially in urban areas, connecting major cities such as Harare, Bulawayo, Mutare, Gweru and Masvingo. By 1994, approximately 55% of roads were paved and well-maintained, supporting trade and travel. However, political instability and economic decline in the late 1990s led to a deterioration of infrastructure. By 1998, the proportion of paved roads had declined to 47%, and rural roads remained underdeveloped, limiting access to essential services. Road accidents increased due to poor maintenance of roads and vehicles.
Many roads deteriorated around the 2000s when infrastructure maintenance programs collapsed due to a harsh economic environment. Major highways sustained severe damage because the government lacked resources for repairs. By 2019, only 19% of roads were paved. Rural areas suffered the most, and transportation became increasingly unreliable, which was exacerbated by fuel shortages. The informal transport sector grew, with minibus taxis and private cars becoming a common mode of travel.
In the 2010s, efforts were made to rehabilitate major highways, such as the Harare-Bulawayo and Harare-Mutare roads, but progress was slow. International loans, including funding from the African Development Bank, were sought to support road rehabilitation. The Beitbridge-Harare-Chirundu highway, a crucial trade route, is expected to be completed by 2030, improving regional connectivity. The Current Path suggests that paved roads will increase from 20% in 2023 to 23% in 2030 and 32% by 2043. These figures remain below the average of lower-middle-income African countries, indicating ongoing infrastructure deficits.
Zimbabwe’s railway network, once a vital transport system inherited from the colonial era, has suffered from neglect. In the late 1990s, lack of investment, political instability and mismanagement led to its decline. As road transport grew and the economy weakened, rail services became unreliable. By the 2000s, the National Railways of Zimbabwe (NRZ) faced severe infrastructure deterioration, outdated trains and funding shortages. Freight and passenger services dwindled, making rail transport less competitive. Attempts to rehabilitate the railway sector in the 2010s included seeking foreign investment, but progress was slow. Freight corridors saw some upgrades, and passenger services on certain routes, like Harare to Bulawayo, were reintroduced, though they remained unreliable. By the 2020s, the railway sector had nearly collapsed. The recovery of Zimbabwe’s rail transport hinges on substantial foreign investment and modernisation efforts.
Zimbabwe’s aviation sector was once strong, with Harare International Airport (now Robert Gabriel Mugabe International Airport) serving as a major hub. However, economic mismanagement and sanctions led to its decline. Air Zimbabwe struggled with financial losses, an ageing fleet and reduced international passenger demand. The 2000-2010 economic crisis nearly collapsed the airline, while airport infrastructure deteriorated. Since the 2010s, revival efforts have focused on upgrading major airports and attracting private airlines, such as Fastjet. Some progress has been made, particularly with the expansion and modernisation of Robert Gabriel Mugabe International Airport, which began in 2018 and was completed in 2023. However, the aviation industry continues to struggle with financial viability, limiting effective air travel options.
From 1990 to 2043, Zimbabwe’s transportation infrastructure faced severe challenges, particularly during economic and political crises. However, with strategic investments in roads, rail and aviation, the country has the potential to modernise its transport sector, improve connectivity and integrate more effectively into regional trade networks. By 2043, Zimbabwe could see a significantly improved transport infrastructure with a more reliable road network, a revitalised railway system and a strengthened aviation sector. This is supported by the country’s transport infrastructure index, which, through these initiatives, can improve from -0.25 in 2023 to -0.09 in 2043 on the Current Path.
Access to clean water and sanitation services is one of the most pressing issues in Zimbabwe, with only 32% of the population enjoying access to safely managed water services as of 2023. Rural areas are disproportionately affected, with only 15% having access to clean water. The situation is similarly precarious in sanitation, where only 28% (33% in rural areas and 19% in urban areas) of the population benefited from safely managed services in 2023. While there are ongoing efforts by the government to improve water supply and sanitation, a lack of adequate funding hinders progress. The Current Path indicates an increase in the proportion of people with access to safely managed water services and sanitation to 47% (31% in rural areas and 79% in urban areas) and 43% (47% in rural areas and 37% in urban areas) by 2043, respectively. Efforts to improve access to safely managed water services and sanitation are undermined by outdated infrastructure, persistent droughts and inadequate financial resources. However, targeted initiatives, such as promoting rainwater harvesting and enhancing solar-powered systems, can play significant roles in advancing water and sanitation accessibility, particularly in rural areas.
Overall, Zimbabwe's way forward involves strategic and innovative investments across its infrastructure sectors. For economic revitalisation and social development, it is essential to prioritise the rehabilitation of critical energy systems, the expansion of reliable transportation networks, the modernisation of water and sanitation facilities, and the enhancement of ICT capabilities. By leveraging partnerships with international organisations and employing innovative solutions, Zimbabwe can begin to address its longstanding infrastructure deficits, fostering an environment conducive to sustainable economic growth and improved quality of life for its citizens. The potential for improvement is significant, but realising this potential will require sustained commitment and effective governance.
Chart 23 presents the number of people using cookstoves in the Current Path and in the Large Infrastructure and Leapfrogging scenario, from 2020 to 2043.
In the 1990s, the vast majority of Zimbabweans used traditional cookstoves fueled by firewood or charcoal. These traditional cookstoves were often open fires or basic mud stoves, especially in rural areas. While many urban households began using more modern cooking methods, including gas stoves, the majority of the population still relied on wood and charcoal due to limited access to electricity and gas in rural areas. Traditional stoves are inefficient and produce a lot of smoke, contributing to indoor air pollution. This posed significant health risks, particularly respiratory illnesses, as well as deforestation due to over-reliance on firewood. Some initiatives by the government and non-governmental organisations (NGOs) were underway to promote the use of improved cookstoves that were more energy-efficient and produced less smoke. These stoves were designed to address the environmental and health challenges of traditional stoves but had limited reach, especially in rural areas.
The economic crisis in Zimbabwe during the 2000s led to fuel shortages, making it even more difficult for households to access cooking gas, electricity or kerosene. As a result, the use of firewood and charcoal became even more widespread, especially in rural and peri-urban areas. While improved cookstoves were promoted, the economic instability meant that many households could not afford them. People continued using open fires or simple, locally made stoves. Rural areas remained heavily dependent on traditional stoves, while urban areas saw more usage of charcoal stoves due to better access to this fuel and slightly higher access to alternative cooking methods (e.g., gas). NGOs continued to promote the use of energy-efficient, improved cookstoves in rural areas, but the success of these programs was mixed due to economic constraints and lack of widespread adoption. Some households began using alternative fuels, like biogas, but these solutions were still limited to a few areas and were not widespread.
In the 2010s, there was a growing awareness of the negative environmental and health impacts of traditional cookstoves. As a result, the adoption of improved cookstoves began to increase, especially in rural areas. The rise of solar energy solutions in Zimbabwe also provided opportunities for solar-powered cookstoves or cookers, though these were still relatively limited in rural areas. However, the trend toward renewable energy and solar cookstoves was starting to gain attention, particularly in off-grid areas. In urban areas, gas stoves became more common, though their usage remained uneven, with some households relying on charcoal and firewood due to the cost of gas. With increased awareness of indoor air pollution and its health impacts, there was a push for more sustainable cooking practices. The government and NGOs launched campaigns to promote cleaner cooking technologies. The government and NGOs began to invest more in educating the public about the benefits of clean cookstoves and provide subsidies or loans to make improved stoves more affordable. Solar-powered cookstoves started to be introduced in some rural areas, particularly in off-grid communities where access to traditional energy sources like electricity was limited. However, adoption was slow due to the high upfront costs of these technologies.
By 2023, a total of 102 490 people had adopted improved cookstoves. The Current Path indicates that this number will rise to 109 310 people by 2043, peaking at 118 960 people in 2034. Although the total number of users will increase with population growth, the percentage of households using these stoves will decrease from 3.1% in 2023 to 1.2% in 2043 on the Current Path.
However, a shift towards cleaner cooking technologies, such as solar cookers, biogas stoves and liquefied petroleum gas (LPG) stoves, is expected, particularly in urban areas. As government incentives and global sustainability initiatives promote clean cooking, the adoption of modern fuel-powered cookstoves will rise significantly. Consequently, the number of people using improved cookstoves will decline to 82 030 (1.4% of households) by 2043 in the Large Infrastructure and Leapfrogging scenario, compared to 109 310 (1.2% of households) on the Current Path. The use of modern fuel cookstoves is set to increase from 1.2 million people (37% of households) in 2023 to 3.7 million people (63% of households) by 2043 on the Current Path.
Increased access to electricity, particularly through decentralised solar systems, will support the growth of electric cooking technologies (such as induction cookers) in both urban and rural areas. LPG could also become a more widely used cooking fuel due to improvements in distribution networks. As awareness of environmental issues like deforestation and air pollution grows, more households will make the transition from traditional cookstoves to cleaner, more sustainable alternatives. The government, supported by international donors and NGOs, is likely to increase efforts to make clean cookstoves more affordable. There could be subsidies, micro-financing options and policy incentives aimed at accelerating the transition. Solar cookers and solar-powered cooking technologies could see increased adoption, particularly in rural areas, supported by the falling costs of solar panels and increased awareness of their environmental benefits. These initiatives will improve the adoption of modern fuel-powered cookstoves to 4.2 million people (72% of the households) by 2043 in the Large Infrastructure and Leapfrogging scenario, compared to 3.7 million people (63% of households) on the Current Path.
In the Large Infrastructure and Leapfrogging scenario, Zimbabwe could achieve near-universal access to clean and efficient cookstoves by 2043, with approximately 72% of households using modern fuel-powered cookstoves. Traditional cooking methods, like open fires and rudimentary biomass stoves, will become rare as most households transition to clean cooking technologies. Solar-powered and electric stoves will become common, particularly in areas with reliable access to renewable energy. These technologies will help reduce reliance on firewood and charcoal, contributing to environmental sustainability and reducing deforestation. In urban areas, where electricity access is expected to improve to 100% by 2033, electric cooking methods such as induction stoves could become more widespread. These stoves are energy-efficient and have the potential to work well with smart grid systems for load management. The government could implement regulations requiring clean cooking technologies to meet specific environmental and health standards, ensuring that all new stoves meet a high level of efficiency and safety. Zimbabwe may collaborate with international bodies and other African countries to create a regional clean cooking network, improving access to technologies and reducing costs.
Chart 24 presents the percentage of the population and number of people with access to mobile and fixed broadband in the Current Path and in the Large Infrastructure and Leapfrogging scenario, from 2020 to 2043. The user can toggle between mobile and fixed broadband.
Access to mobile and fixed broadband in Zimbabwe has evolved significantly from 1990 to 2023, driven by technological advancements, economic challenges, government policies, and shifts in global trends. In the 1990s, access to fixed-line broadband in Zimbabwe was extremely limited. The country’s telecommunications infrastructure was still heavily reliant on landlines, with internet access largely restricted to a few urban areas and businesses. Dial-up internet connections were common, but speeds were slow, and the overall accessibility was limited. Mobile telephony was still in its infancy during the early 1990s. The first mobile phone networks began to emerge in the mid-1990s, with the introduction of Econet Wireless in 1998, which marked the beginning of mobile communication for many Zimbabweans. The internet was largely available through dial-up connections, often expensive and unreliable, particularly in rural areas. Access to online services and digital communication remained a luxury for a limited portion of the population, mainly in cities. High technology costs, limited infrastructure, and the lack of widespread electricity access in rural areas prevented the expansion of Internet and mobile access. The government maintained tight control over communication services, including the regulation of internet access.
In the early 2000s, mobile telecommunications saw rapid growth with the expansion of Econet Wireless and the introduction of new operators like NetOne and Telecel. Mobile phones became increasingly affordable and widespread, making mobile communication accessible to a larger portion of the population. Fixed broadband remained limited and was primarily available in urban centres. Dial-up connections were still in use, but technologies like Asymmetric Digital Subscriber Line (ADSL) and fibre-optic broadband began to emerge in some urban areas by the end of the decade. However, widespread adoption of fixed broadband was hindered by the country's economic instability. Mobile internet began to gain traction as General Packet Radio Service (GPRS) and EDGE technologies were introduced, allowing for basic mobile data services, albeit at slow speeds. Short Message Service (SMS) and Wireless Application Protocol (WAP) were the primary ways of accessing mobile internet. Zimbabwe's economic difficulties, including hyperinflation, impacted investment in the communications sector, and the country experienced severe foreign currency shortages that affected the importation of infrastructure and equipment. While mobile phone penetration grew, internet connectivity remained slow and unreliable. Rural areas continued to face challenges in terms of both mobile and fixed broadband access. The liberalisation of Zimbabwe's telecommunications market in the early 2000s allowed for increased competition among service providers, though regulatory challenges and economic instability slowed the pace of development. The majority of mobile and broadband users were located in urban areas, with rural areas still lagging in terms of connectivity.
The 2010s saw the introduction of 3G networks by mobile operators like Econet, NetOne and Telecel, enabling faster mobile internet access. The expansion of mobile data services significantly boosted mobile broadband usage, particularly in urban areas, where smartphones became more affordable. The proliferation of smartphones helped drive internet access, as many Zimbabweans began using mobile phones not only for voice communication but also for browsing, social media and digital payments. Mobile broadband subscriptions surged from 0.4 per 100 people in 2010 to approximately 49 per 100 people in 2019. The use of fixed broadband saw gradual improvements, with more fibre-optic and ADSL connections being established in urban centres. It increased from 0.3 subscriptions per 100 people in 2010 to 1.3 subscriptions per 100 people in 2019. However, fixed broadband remained relatively expensive and limited to higher-income households and businesses. By the end of the decade, Zimbabwe had started the rollout of 4G LTE networks, providing faster internet speeds and opening up opportunities for more digital services.
The cost of mobile data and smartphones remained a significant barrier for many Zimbabweans despite mobile internet becoming more widespread. This was particularly true in rural areas, where affordability was a major issue. Frequent power outages and unreliable infrastructure, particularly in rural areas, hampered the growth of both fixed and mobile broadband networks. While fibre optic infrastructure expanded, it was mostly limited to major cities and urban centres, with rural areas still struggling to access high-speed broadband services. The Zimbabwean government began to focus more on ICT development and the digital economy. Initiatives such as the National Broadband Plan 2020-2030 sought to promote broadband expansion, but the government's limited capacity for implementation often slowed progress. The introduction of mobile money platforms like EcoCash was a significant leap in mobile technology, particularly for those without access to formal banking systems, and spurred further use of mobile phones for various services.
By the 2020s, mobile broadband access continued to grow, with the rollout of 4G services becoming more widespread, providing faster and more reliable connections in both urban and rural areas. The expansion of 5G networks is also expected, though it may start in urban areas and eventually extend to rural regions in the later part of the decade. With increasing affordability and mobile network expansion, smartphones are becoming more ubiquitous, providing greater access to mobile internet, e-commerce, mobile banking and online education. The mobile broadband subscriptions further surged from 49 in 2019 to 68 subscribers per 100 people in 2023. Fixed broadband, particularly fibre-optic internet, became more accessible in major cities and expanded into peri-urban and rural areas. Government initiatives and private sector investments assisted in reducing the cost of installation and increased accessibility. The fixed broadband subscriptions increased from 1.3 in 2019 to 3.7 subscribers per 100 people in 2023.
Despite improvements, a significant digital divide may persist between urban and rural areas, with urban areas enjoying faster and more reliable broadband services. Data costs may remain high compared to global standards, affecting affordability for many Zimbabweans, especially in lower-income households. Zimbabwe's government will likely prioritise the development of a digital economy, leveraging broadband to promote services such as e-commerce, telemedicine, education and remote work. Policies may be implemented to drive down the cost of broadband services, including regulatory measures for price reduction, subsidies for rural broadband infrastructure and public-private partnerships. All these initiatives play a vital role in achieving the universal broadband access goal, ensuring that both mobile and fixed broadband are widely accessible and affordable for all Zimbabweans. The Current Path suggests that mobile and fixed broadband subscriptions will increase to 145 and 29 subscribers per 100 people in 2043, respectively. Rural areas will have comparable access to urban areas, reducing the digital divide.
The 5G networks will likely be widespread by the early 2030s, providing ultra-fast internet speeds, improved connectivity for IoT (Internet of Things) devices and enhanced digital services for Zimbabweans. The rollout of smart city initiatives in urban areas will be powered by fast and reliable broadband, facilitating better services such as smart traffic management, waste management and energy distribution. While broadband access will improve, economic challenges could limit full affordability for all citizens, particularly in lower-income households. Ongoing efforts will be required to maintain and upgrade infrastructure, especially in rural and underserved areas. Hence, both public and private sector investments will be essential in developing and maintaining broadband infrastructure. International collaborations and partnerships may help drive investments in expanding both mobile and fixed broadband coverage. Furthermore, national programs to improve digital literacy will become a key part of Zimbabwe's strategy to ensure that all citizens can take full advantage of broadband access.
These interventions have the potential to increase mobile and fixed broadband subscriptions to 147 and 30 subscribers per 100 people, respectively, in the Large Infrastructure and Leapfrogging scenario, compared to 145 and 29 subscribers per 100 people in 2043 on the Current Path.
In summary, from 1990 to 2023, access to mobile and fixed broadband in Zimbabwe has evolved significantly. In the early years, the country had limited access, especially in rural areas, with mobile phones being the main mode of communication. By the 2010s, mobile broadband began to expand with the rollout of 3G and 4G networks and fixed broadband remained concentrated in urban areas. Moving into the 2020s and beyond, the country is projected to achieve near-universal broadband access, driven by the expansion of mobile networks, the introduction of 5G and increased fibre-optic deployment. Government initiatives, the growing importance of digital services and a focus on affordable connectivity will be key to ensuring widespread access to fast and reliable broadband in Zimbabwe by 2043.
Chart 25 presents the trends in FDI, aid and remittances in the Current Path and in the Financial Flows scenario as a percentage of GDP, from 1990 to 2043.
The Financial Flows scenario represents a reasonable but ambitious increase in inward flows of worker remittances, aid to poor countries and an increase in the stock of foreign direct investment (FDI) and additional portfolio investment inflows. We reduce outward financial flows to emulate a reduction in illicit financial outflows.
Visit the theme on Financial Flows for our conceptualisation and details on the scenario structure and interventions.
To analyse external financial inflows to Zimbabwe from 1990 to 2043, it is essential to examine key periods in the country's financial history and assess various sources of external funding, including foreign aid, remittances, foreign direct investment (FDI), loans and other forms of international financial assistance.
Zimbabwe experienced relative economic stability in the early 1990s but faced challenges later in the decade. The economy was affected by the launch of economic reforms (ESAP) in the early 1990s, leading to austerity measures that reduced state spending. During this period, Zimbabwe received significant foreign aid and concessional loans from international bodies like the IMF, World Bank and bilateral donors. Many Zimbabweans moved abroad, particularly to the United Kingdom and South Africa, sending remittances home. The share of foreign aid, remittances and FDI inflows in GDP spiked from around 4% in 1990 to 12% in 1992, -0.1% in 1990 to 12% in 2009, and -0.1% in 1990 to 7% in 1998, respectively. Zimbabwe's external debt began to rise, which affected future foreign inflows due to the increased repayment burden.
From 2000 onwards, the government's controversial land reform program worsened relations with Western donors and international creditors. This led to the imposition of sanctions by Western countries, which significantly reduced the inflow of financial support and FDI. Aid and FDI shares in GDP dropped to around 3% and 0.2% in 2004, respectively. The economy faced hyperinflation, which reached unprecedented levels by the mid-2000s, making the country effectively a pariah in the global economic system. International financial institutions withdrew support. Despite the economic collapse, remittances from Zimbabweans living abroad continued to grow, particularly from Zimbabweans in South Africa, Botswana, the UK and other countries, becoming a crucial source of foreign currency. Likewise, financial aid surged again to a record high of approximately 15% in 2008.
In 2009, Zimbabwe abandoned its currency in favour of using foreign currencies, primarily the US dollar. This period marked a semblance of stabilisation, which allowed for an influx of goods and services into the economy. During this period, Zimbabwe began to receive more support from international bodies like the IMF and World Bank, as well as from China and other emerging economies. However, the country's external debt remained a significant challenge. Remittances continued to grow to a record high of approximately 14% in 2011 and were vital in supporting households. FDI began to increase again, although slowly, especially from China, India and South Africa.
From 2014 to 2019, Zimbabwe continued to experience economic stagnation under President Robert Mugabe’s leadership. There were some attempts at economic reform but no significant breakthroughs in attracting large-scale FDI. Zimbabwe’s external debt continued to increase, which further strained its ability to receive financial inflows. The IMF and World Bank restricted funding due to Zimbabwe’s failure to meet debt obligations. China became a major player in providing loans and investments, particularly in mining and infrastructure sectors, with a focus on securing access to natural resources in exchange for financing.
The transition following the fall of former President Robert Mugabe in 2017 under President Emmerson Mnangagwa initially raised hopes for economic recovery in Zimbabwe. However, the country's political instability, corruption and significant foreign debt—59% of GDP by 2020—hampered substantial foreign investment. The global pandemic further exacerbated Zimbabwe's economic challenges, leading to a decrease in foreign investment and remittances.
By 2023, diaspora remittances had dropped to 8% of GDP, although they still provided vital support for many families. FDI improved, rising from 0.6% of GDP in 2021 to approximately 3.1% in 2023. Additionally, the debt situation showed signs of improvement, decreasing to 26% of GDP in 2023. While international financial institutions offered limited support under specific conditions, Zimbabwe continued to struggle with challenges related to external debt and ongoing political instability. Financial aid has consistently declined from 15% in 2008 to around 3% in 2023.
If Zimbabwe implements effective economic reforms, it could potentially attract more FDI, particularly from neighbouring countries and other emerging economies, growing to 3.8% by 2043 on the Current Path. As Zimbabwe strengthens its regional ties within the SADC and the African Union through AfCFTA, it may experience increased foreign inflows from regional trade and investment. This could help reduce the country’s external debt burden to a net credit position of approximately 0.2% of GDP by 2030 on the Current Path. Beyond 2030, Zimbabwe might be able to negotiate debt restructuring with international creditors, potentially leading to the resumption of concessional loans by 2040. This, in turn, will increase external debt financing to around 2% of GDP by 2043 on the Current Path. Although the diaspora remittances are expected to continue playing a significant role in supporting livelihoods and the economy, their contributions may decrease to 5% by 2043 on the Current Path.
The Financial Flows scenario will boost FDI to around 5% by 2043, compared to 3.8% on the Current Path. The country can also benefit from international climate finance as it works to adapt to the impacts of climate change. Initiatives to expand financial inclusion through fintech, mobile payments, and banking can slightly ease the decline of remittance from 8% in 2023 to 6% by 2043 in the Financial Flows scenario, compared to 5% on the Current Path.
Overall, interventions in the Financial Flows scenario are crucial to reducing the country’s dependence on financial aid. Thus, the share of aid receipts in GDP will constantly drop to 0.5% in 2043 in the Financial Flows scenario, slightly lower than the 0.6% on the Current Path. Given that USAID is the primary donor in Zimbabwe, the decline in financial aid to the country also reflects Trump's foreign policy, which aims to reduce aid to developing countries and prioritise US development goals. Interventions in the Financial Flows scenario are also essential for rebuilding the country's credibility with international creditors, the World Bank and IMF by ensuring transparency and institutional reforms. As a result, external debt financing will reach approximately 4% of GDP by 2043 under the Financial Flows scenario, compared to 2% on the Current Path.
In summary, external financial inflows to Zimbabwe have fluctuated significantly due to economic, political and social factors. Over the next two decades, the country has the potential to attract more foreign investment and development aid if it addresses issues like political instability, external debt and economic diversification. However, external inflows will continue to depend heavily on Zimbabwe’s ability to implement reforms and improve its international standing.
Chart 26 presents government revenue in the Current Path and in the Financial Flows scenario, from 2020 to 2043. The data is in US$ 2017 or % of GDP.
Wagner’s law, or the law of increasing state activity, is the observation that public expenditure increases as national income rises. It is reasonable to expect that government revenues will increase as a percentage of GDP in the Financial Flows scenario compared to the Current Path.
During the early 1990s, Zimbabwe's government revenue was relatively stable but began to decrease toward the end of the decade due in part to the economic decline, structural adjustment programs, and the impacts of external sanctions and political instability. The early 2000s saw a significant drop in government revenue due to hyperinflation, which reached unprecedented levels in 2008. The country's economy contracted severely, leading to a collapse of formal fiscal systems and the dollarisation of the economy in 2009. After the adoption of the US dollar in 2009, Zimbabwe's fiscal system became more stable, though revenue generation remained low due to a shrinking tax base, high unemployment and the informal economy. However, government revenue began to rise slowly in the mid-2010s as the economy grew marginally.
The reintroduction of the Zimbabwean dollar in 2019, along with the “austerity for prosperity” measures, led to a slight recovery in government revenue, rising from 13% of GDP (US$ 2.07 billion) in 2020 to 14% (US$2.7 billion) in 2023. While these measures aim to curb unproductive government spending, they have had more negative effects than positive ones, particularly on the working class and business sector, which have faced continuous tax hikes in every annual fiscal policy. Additionally, the general population has struggled with inflationary pressures driven by rising production and distribution costs. These policies have also created growth challenges for the informal sector.
Predicting government revenue in Zimbabwe up to 2043 is speculative and depends on numerous factors, including political stability, economic reforms, external factors (e.g., commodity prices, foreign aid) and natural disasters. Assuming Zimbabwe implements effective economic reforms, such as improved infrastructure, education and private sector development, economic growth could lead to higher tax revenues. High inflation, as seen in recent years, could undermine the real value of government revenue. If inflation remains under control, it will stabilise government receipts. External financing (loans or aid from organisations like the IMF or World Bank) might play a significant role in bolstering government revenue, especially if the country successfully negotiates debt relief and grants. Expanding the formal tax base by encouraging the formalisation of the informal enterprises would help increase government revenue. The government could adopt more progressive taxation policies or improve tax collection efficiency.
As a result, if Zimbabwe maintains moderate economic growth with stable inflation, the share of government revenue in GDP can increase slightly from 14% in 2023 to 16% (US$4.25 billion) by 2030 on the Current Path. If economic recovery continues and political stability is sustained beyond 2030, government revenue as a share of GDP will see a more substantial rise to 17.52% (US$11.8 billion) by 2043 on the Current Path. This figure will rise slightly to 17.53%, amounting to US$12.3 billion in the Financial Flows scenario.
Overall, government revenue growth will largely depend on the country's overall economic performance, potentially increasing at a rate similar to GDP growth. This holds true for Zimbabwe, where both the average GDP and government revenue growth rates are forecast to be around 6% from 2023 to 2043 on the Current Path.
The above forecasts could be improved if Zimbabwe diversifies its economy to manufacturing and services, moving away from dependence on agriculture and mining. Zimbabwe may also attract more investments if improvements in infrastructure, governance and political stability continue.
Chart 27 presents the Current Path of government effectiveness, comparing the country to the average for the Africa income group, from 2002 to 2043.
The World Bank’s index on government effectiveness captures perceptions of the quality of public services, the quality of the civil service and the degree of its independence from political pressures, the quality of policy formulation and implementation, and the credibility of the government’s commitment to such policies.
The effectiveness of government is a critical factor in shaping the economic landscape of any country, serving as a foundation for stability and growth through fostering an environment conducive to both domestic and foreign investment. The case of Zimbabwe illustrates a complex interplay between government effectiveness and a history marked by political instability, economic mismanagement and social unrest.
Historically, Zimbabwe's path has been influenced heavily by the leadership of President Robert Mugabe, particularly from the 1990s onward. In the early years following independence, the country exhibited promising developments. However, as the years progressed, a series of factors emerged that undermined these gains. Mismanagement of resources, corruption and the challenges brought about by SAPs mandated by international financial institutions played pivotal roles in precipitating economic decline. The repercussions of these policies, particularly their failure to deliver promised improvements, ignited social unrest as unemployment soared and poverty deepened.
The statistics clearly illustrate the deterioration of government effectiveness during this tumultuous period. The government effectiveness index, which dropped from 2.18 in 1996 to 1.74 in 2000, fell below the average for lower-middle-income African countries, highlighting declining governance standards. The controversial land reform program initiated in the early 2000s further exacerbated economic decline by disrupting the agricultural sector, which was a cornerstone of Zimbabwe’s economy. This mismanagement culminated in record-setting hyperinflation by the mid-2000s, pushing the economy into freefall and leading to significant unemployment and poverty.
Following a period marked by political violence and disputed elections, the establishment of a government of national unity (GNU) between ZANU-PF and the MDC from 2009 to 2013 brought a temporary pause in the political instability that had characterised prior years. The slight improvement in the government effectiveness index during this time—from 0.96 in 2010 to 1.25 in 2015—along with stabilisation bolstered by dollarisation and international aid, showcased that even limited political collaboration could produce positive outcomes. However, underlying governance challenges remained largely unaddressed, and President Mugabe’s authoritarian rule persisted, stifling meaningful reform.
The military coup in 2017 that ousted Mugabe culminated in the rise of President Emmerson Mnangagwa, initially signalling hope for reform. Yet, despite promises of transformation, the new administration faced significant hurdles in addressing the deep-rooted causes of the ongoing crises, including hyperinflation, rampant unemployment and currency instability. Furthermore, reports of human rights abuses, crackdowns on dissent and a lack of genuine democratic reforms have marred Mnangagwa's tenure.
By 2023, the government effectiveness index stagnated at 1.25, unchanged from 2015, and the Curreth Path suggests a bleak trajectory to 1.88 in 2043, ultimately falling short of the average government effectiveness of lower-middle-income African countries, which will rise from 1.85 in 2023 to 2.28 in 2043. This stagnation underscores the urgent necessity for Zimbabwe to undertake substantive reforms—both democratic and economic—to regain stability and efficacy.
Overall, Zimbabwe's path forward hinges on its ability to tackle long-standing economic issues, foster genuine improvements in governance, enhance international relations and cultivate an inclusive political environment. Only through addressing these pivotal aspects can Zimbabwe hope to carve out a sustainable future characterised by economic growth and greater government effectiveness.
Chart 28 presents security, capacity and governance index for the Current Path versus the Governance scenario, for 2023 and 2043.
In our modelling framework, governance is conceptualised across three dimensions—security, capacity, and inclusion—representing the traditional stages of state formation. Each governance dimension is scored on a scale from zero (poor) to one (excellent). The security dimension evaluates the likelihood of internal conflict and overall risk levels. The capacity dimension encompasses factors such as government revenue, corruption, regulatory quality, economic freedom, and government effectiveness. Finally, the inclusion dimension assesses the extent of democracy and gender empowerment.
In addition, the Governance scenario includes an expanded program of social transfers, reflecting the government's determined effort to reduce inequality and poverty.
Visit the theme on Governance for a full conceptualisation and details on the scenario structure and interventions.
The governance system in Zimbabwe has evolved significantly over time, encompassing several key phases, shaped by internal and external events influencing the country's legal and political systems. The changes are largely tied to political leadership, constitutional amendments and socio-economic challenges. In 2023, the country ranked 31st out of 54 African countries in overall governance, scoring 47.1 out of 100. Most category scores were below average, including security and rule of law (44.5), participation, rights and inclusion (43.5), and foundations for economic opportunity (48.7), except for one category, which stood at 51.7. These figures highlight that participation, rights and inclusion remain a significant challenge in Zimbabwe.
In the 1990s, Zimbabwe was still governed by the 1979 Lancaster House Constitution, which was put in place at the time of independence in 1980. The governance, particularly the rule of law during this time, was generally respected. Still, the political landscape began to shift due to the increasing dominance of the ruling ZANU-PF party and President Robert Mugabe’s growing authoritarianism. In the early 1990s, President Mugabe’s government initially pursued some legal reforms, especially in areas like land reform, but these were often seen as benefiting the elite and did not adequately address broader inequalities. Towards the end of the 1990s, there was increasing resistance to President Mugabe’s rule. The period saw a series of constitutional amendments that eroded certain checks and balances, most notably:
- The 1996 Constitutional Amendment allowed the president to appoint judges without parliamentary approval, giving the executive more control over the judiciary.
- The 1997 Amendment allowed for the seizure of land from white farmers, which was done without adequate legal process, setting the stage for further erosion of property rights.
The controversial land reform program of the early 2000s is one of the most significant events in Zimbabwe's legal history during this period. The government began forcibly evicting white farmers from their land, violating property rights and disregarding legal norms. This undermined both the rule of law and economic stability. The political environment deteriorated with increased state repression, particularly against opposition groups like the MDC. The government used legal mechanisms to harass political opponents and civil society groups, often with the acquiescence of the judiciary, which became more politicised. The 2000 constitutional amendment further entrenched President Mugabe’s power by altering the constitution to allow for land expropriation without compensation. It also sought to limit judicial independence. The Zimbabwean economy entered a period of severe decline, leading to hyperinflation and widespread poverty. The legal system struggled to function effectively amidst the economic collapse and rampant corruption.
After the violent 2008 elections, Mugabe’s ZANU-PF entered into a power-sharing agreement with the opposition MDC, the Global Political Agreement (GPA) of 2008. This agreement, under which the country had a transitional government, resulted in some legal reforms and greater respect for human rights but the underlying structures of authoritarianism remained intact. The new constitution, adopted in 2013, introduced several reforms aimed at strengthening the rule of law, including limiting presidential power, introducing protections for civil liberties and human rights, and establishing a more independent judiciary. Despite these legal reforms, the governance system continued to face challenges as President Mugabe's government remained deeply entrenched in corruption and repression. The judiciary was still viewed as politicised, and the legal system struggled to address widespread human rights abuses and land disputes.
The transition from President Mugabe to President Mnangagwa’s leadership in November 2017 raised hopes for governance reforms and the restoration of the rule of law. However, many of the same political elites retained power, and President Mnangagwa's administration has been criticised for continued repression and human rights abuses. While there was some legal reform, such as attempts to address economic challenges and land reform, the rule of law remained weak due to political interference, corruption and limitations on judicial independence. The government continued to use legal measures to suppress dissent, including arresting political opponents, restricting media freedoms and curbing public protests. Human rights organisations continued to report violations, and the rule of law remained fragile.
By 2023, Zimbabwe’s composite governance index stood at 0.49, with the Current Path indicating a gradual increase to 0.55 in 2043. This trend closely aligns with the average for lower-middle-income African countries, showing only minor differences.
The future of the governance system in Zimbabwe depends on several factors, including legal and constitutional reforms, political reforms, economic recovery and rule of law, and international influence. The 2013 constitution remains a framework for reform but its full implementation depends on political will. In the coming years, Zimbabwe may focus on strengthening the independence of the judiciary, addressing corruption and promoting legal reforms that respect human rights and property rights. A peaceful political transition could lead to establishing a more democratic legal framework. However, political instability or further authoritarianism could undermine any progress made. Restoring economic stability would likely require a greater respect for the rule of law, including protecting property rights and combating corruption. However, if Zimbabwe continues to face economic challenges, the legal system may remain vulnerable to exploitation. The role of international institutions, such as the African Union, the United Nations and bilateral donors, could also influence legal reforms in Zimbabwe. External pressure may encourage adherence to international legal standards, especially concerning human rights and governance.
In the Governance scenario, the composite governance index will rise to 0.62, compared to 0.55 on the Current Path, above the average for lower-middle-income African countries.
In a nutshell, the governance system in Zimbabwe from 1990 reflects the tension between political power and legal frameworks. While the country has seen significant legal changes, authoritarian governance, corruption and human rights violations have often undermined these. The future of the governance system will depend on genuine legal reforms, political stability and international support for democratic processes and human rights. The challenges faced in the past will likely continue to shape Zimbabwe’s legal landscape, but there is potential for change if the political system embraces the rule of law in its truest form.
Chart 29 presents GDP per capita in purchasing power parity (PPP) in the Current Path and each of the eight sectoral scenarios, plus the synergistic effect and the Combined scenario. The data is from 2020 with a forecast to 2043.
Zimbabwe’s GDP per capita in purchasing power parity (PPP) will rise from US$2 190 in 2023 to US$4 400 by 2043 on the Current Path. However, interventions in the Combined scenario can push this figure to US$9 470, exceeding the Current Path by US$5 070 (115%). Achieving this growth will depend on the successful implementation of key interventions across Demographics and Health, Education, Manufacturing, Large Infrastructure and Leapfrogging, Agriculture, AfCFTA, Financial Flows, and Governance scenarios.
Among individual scenarios, Manufacturing will have the most substantial impact on GDP per capita both in the short and long run, raising it to US$7 040 by 2043, followed by Large Infrastructure and Leapfrogging (US$4 830), AfCFTA (US$4 660), Governance (US$4 570), Financial Flows (US$4 510), Agriculture (US$4 470), Demographics and Health (US$4 460) and Education (US$4 440).
The combined impact of all the above scenarios will influence Zimbabwe’s ability to enhance its GDP per capita in the following ways:
- In the short term (2025-2030), Zimbabwe is likely to face economic challenges, but governance reforms, infrastructure development and advancements in agriculture and education could drive modest GDP per capita growth. External factors like regional integration through AfCFTA will also play a supportive role.
- In the medium term (2030-2040), economic growth could accelerate if Zimbabwe successfully implements structural reforms in governance, education, health, infrastructure and manufacturing. Increased FDI inflows and the adoption of leapfrogging technologies would further boost economic expansion, with growth in agriculture, manufacturing and services diversifying the economy and significantly improving GDP per capita.
- Zimbabwe could experience substantial growth in GDP per capita in the long run (2040-2045) if it achieves political stability, attracts significant financial inflows, improves education and health standards and strengthens its industrial sector. This progress could bring the country closer to upper-middle-income status, fueled by increased productivity, technological advancements and enhanced export competitiveness.
Chart 30 presents poverty in the Current Path and for each scenario, from 2020 to 2043. The user can select the number of extremely poor people or the percentage of the population.
The combined impact of the sectoral scenarios on extreme poverty in Zimbabwe is significant and interconnected. The interventions contribute to reducing extreme poverty through improvements in economic opportunities, living standards, social inclusion and access to basic services.
Zimbabwe’s extreme poverty rate, defined as living on less than US$2.15 per day, will decline from 35% of the population (5.8 million people) in 2023 to 18% (4.2 million people) by 2043 on the Current Path. However, with interventions in the Combined scenario, this rate could drop significantly to 3% (610 000 people) by 2043. This highlights the crucial role of the demographics and health, agriculture, AfCFTA, manufacturing, infrastructure and leapfrogging, financial flows, governance, and education scenarios in helping Zimbabwe achieve the 2030 SDG 1 target of reducing extreme poverty to below 3%.
Among individual scenarios, the Manufacturing scenario will have the greatest effect, constantly lowering extreme poverty to 9% (2 million people) by 2043, followed by Large Infrastructure and Leapfrogging (11% - 2.7 million) and Financial Flows (16% - 3.9 million), while the remaining scenarios will bring extreme poverty levels down to around 17% (approximately 4 million people).
In the short term (2025-2030), Zimbabwe will continue to face significant challenges, including high poverty rates, health burdens and slow economic growth. However, improvements in governance, targeted social protection programs and agricultural productivity could lead to a modest reduction in extreme poverty. Investments in education and infrastructure would also expand economic opportunities, particularly for vulnerable populations.
As the country strengthens its manufacturing sector, improves infrastructure and takes advantage of AfCFTA, it could experience more substantial declines in extreme poverty in the medium term (2030-2040). Growth in agriculture, manufacturing and services will generate millions of jobs, particularly benefiting low-income households. The adoption of technological leapfrogging (e.g., mobile banking) would create new economic opportunities, while enhanced STEM education and vocational training would equip the workforce with skills for higher-paying employment.
By 2043 and beyond, if Zimbabwe effectively addresses the main poverty drivers, extreme poverty could be reduced to below the SDG 1 threshold level of 3%. Enhancements in healthcare, education, governance, infrastructure and financial inclusion would ensure sustained improvements in living standards. If industrialisation, export growth and human capital development continue to advance, Zimbabwe could move closer to achieving upper-middle-income status, with extreme poverty becoming a rarity.
Chart 31 presents GDP in the Current Path and in the Combined scenario, from 2020 to 2043. The data is in US$ 2017 and at market exchange rates (MER).
The Combined scenario combines all eight sectoral scenarios: Governance, Demographics and Health, Education, Large Infrastructure and Leapfrogging, Agriculture, Manufacturing, AfCFTA and Financial Flows.
If Zimbabwe effectively implements the interventions outlined in the Combined scenario, the country will see a significant boost in economic growth. In this scenario, the average annual growth rate from 2026 to 2030 would reach 8%, compared to 5% on the Current Path. As a result, these interventions are crucial in supporting Zimbabwe’s Vision 2030, which targets GDP growth rates between 7% and 10% by 2030.
In the Combined scenario, between 2026 and 2043, the average annual growth rate will rise to 12%, exceeding the 9% growth rate on the Current Path by 3 percentage points. In terms of GDP (MER), Zimbabwe’s economy will be approximately US$2.6 billion and US$93 billion, larger than the Current Path by 2030 and 2043, respectively.
Chart 32 presents GDP per capita in purchasing power parity (PPP) in the Current Path and the Combined scenario. The data is from 2023 with a forecast to 2043.
On the current Path, Zimbabwe’s GDP per capita in PPP will increase from US$2 190 in 2023 to approximately US$2 580 by 2030, and further increase to around US$4 400 by 2043. However, the Combined Scenario presents a significant opportunity to accelerate this growth, potentially increasing GDP per capita (PPP) to US$9 470 by 2043—a 115% (US$5 070) increase compared to the Current Path. This accelerated growth would be driven by an average annual growth rate of 8.4% between 2026 and 2043, compared to 3.9% under the Current Path.
Chart 33 presents the value-add by sector in the Current Path and in the Combined scenario, for 2023 and 2043. The data is in US$ 2017 and as a percentage of GDP.
Our modelling provides forecasts in six economic sectors namely agriculture, energy, materials (including mining), manufactures, services and ICTech.
On the Current Path, the agricultural sector's contribution to GDP in Zimbabwe will decline from 7% in 2023 to 3% by 2043. This reduction is attributed to a transition from agriculture to the services, materials and ICT sectors, which will increase their value-added contributions from 55%, 14% and 3% in 2023 to 57%, 16% and 6% in 2043, respectively, on the Current Path. At the same time, the energy sector's share will decline from 5% to 4%, while the manufacturing sector will remain constant at around 16% over the same period on the Current Path.
Short-term improvements in agricultural productivity driven by investments in agro-technology, agro-processing, and enhanced market access through AfCFTA can slow this decline. As a result, in the Combined scenario, agriculture’s contribution to GDP will experience a smaller reduction, dropping to 6% by 2030 compared to 5% under the Current Path. However, after 2030, this contribution will follow a downward trajectory, aligning with the Current Path around 2036/2037 and ultimately falling to 2% by 2043. This trend reflects a shift from agricultural reliance toward diversification in sectors like manufacturing, energy and ICT.
The manufacturing sector is expected to benefit from AfCFTA, technological advancements, infrastructure improvements and increased financial inflows. Its value-added contribution will rise significantly in the long term (2040-2043) as Zimbabwe expands its industrial base, particularly in food processing, consumer goods and other manufacturing industries. By 2043, manufacturing will contribute 21% to GDP in the Combined scenario, compared to 16% on the Current Path.
Investments in energy infrastructure development will have a notable short-term impact (2026-2030), boosting the sector’s value-added contribution to a peak of 13% by 2030 in the Combined scenario, compared to 5% under the Current Path. Beyond 2030, this share will stabilise at 8% by 2043—still double the Current Path.
Investments in ICT infrastructure, along with other contributing factors, will significantly enhance the sector's value-added, especially in the medium term from 2030 to 2039. In the Combined scenario, the share of ICT in GDP will peak at 5% by 2039, compared to 4% on the Current Path. However, after 2039, this growth trajectory is expected to level off, reaching a level similar to the Current Path by 2043.
Advancements in automation, including digital services and financial technologies, will play a key role in replacing service-based roles with robotics. Consequently, the services sector’s GDP contribution will decline to 51% by 2043 in the Combined scenario, compared to 57% on the Current Path, with significant impacts both in the short term (2026-2030) and long term (beyond 2037). Overall, infrastructure development, including energy, transport and ICT, will drive construction-related activities and enhance economic efficiency, contributing to value-added growth across multiple sectors, except for services.
Chart 34 presents the size of the informal sector as a percentage of the total economy in the Current Path and in the Combined scenario, from 2020 to 2043.
The combined impact of all sectoral scenarios on Zimbabwe's informal sector is a complex issue influenced by a wide range of factors.
A growing youth population will increase demand for informal sector employment, though health crises could hinder labor force participation and productivity. Agriculture will remain a significant source of informal employment, especially if formal agricultural policies remain inconsistent. Additionally, climate change and infrastructure challenges could destabilise the formal economy, pushing more individuals into low-income informal jobs. While AfCFTA has the potential to enhance informal cross-border trade and entrepreneurship, it may also expose informal businesses to heightened competition from formal enterprises and imports.
If the manufacturing sector experiences growth, it could lead to increased formal job opportunities while simultaneously creating informal sector prospects in small-scale industries such as food processing, textiles and crafts. Improved infrastructure and technological advancements could enhance the efficiency and reach of informal businesses, particularly in trade and services by lowering transaction costs and opening new opportunities. Greater access to financial services will enable informal businesses to expand and become more productive, while remittances will continue to support informal activities, particularly in rural areas.
Effective governance can provide a stable and predictable business environment, benefiting the informal sector. However, political instability or weak governance could drive more businesses underground, limiting their growth potential. Higher education levels could lead to a more skilled informal workforce, fostering productivity and innovation. However, if formal job opportunities remain limited, many educated workers may still seek employment in the informal sector.
Despite these dynamics, the informal sector’s contribution to GDP and employment will decline from 54% and 40% in 2023 to 35% by 2043, respectively, on the Current Path. However, the sector will remain vital for economic livelihoods and development. It is therefore important to implement support initiatives for this sector, especially in terms of formalisation and labour market integration.
To strengthen Zimbabwe’s informal sector, a combination of financial, governance, infrastructure, education and social policy interventions will be necessary. Creating an enabling environment for informal businesses, improving access to markets, finance and technology, and addressing informal workers' needs will be essential for fostering growth and development. Long-term support will not only bolster economic resilience but also facilitate the transition of informal enterprises into the formal economy.
In the Combined scenario, formalisation efforts will shift 31% of the informal sector’s GDP and employment contribution to the formal economy by 2043, reducing the informal sector's share of GDP and employment to 4%, down from 35% on the Current Path. These efforts are, thus, crucial for strengthening economic resilience and promoting national development.
Chart 35 compares life expectancy in the Current Path with the Combined scenario from 2020 to 2043.
The combined effects of all scenarios are expected to have a significant impact on life expectancy in Zimbabwe. These factors influence public health, the healthcare system, economic stability and social conditions, all of which play a crucial role in determining life expectancy. On the Current Path, life expectancy will rise from 62 years in 2023 (65 years for females and 59 years for males) to 68 years (71 years for females and 65 years for males) in 2043.
The country’s age structure affects vulnerability to diseases like HIV/AIDS, a long-standing health challenge. If healthcare systems improve and chronic diseases are better managed, life expectancy could increase. However, setbacks such as infectious disease outbreaks and inadequate healthcare resources could slow progress. Enhanced agricultural practices and improved access to nutritious food could also contribute to longer life expectancy by reducing malnutrition and diet-related illnesses. Conversely, agricultural challenges such as drought and climate change may lead to food insecurity, negatively impacting health and longevity.
Economic growth spurred by regional trade under AfCFTA can indirectly boost life expectancy by improving access to healthcare, nutrition and overall living standards. A robust manufacturing sector could further support this by expanding economic opportunities, increasing healthcare access and reducing poverty. However, industrial expansion could also introduce environmental pollution, posing health risks that may offset these benefits.
Infrastructure improvements and technological advancements will likely contribute to increased life expectancy by enhancing access to healthcare, improving living conditions and reducing disease transmission through better sanitation and health systems. Greater financial flows can provide critical funding for healthcare, but inefficient resource allocation may limit its positive impact. Strong governance can lead to better healthcare services and outcomes, whereas instability or poor governance may hinder progress and lower life expectancy.
Higher levels of education, particularly for women, can have long-term benefits for life expectancy by promoting health awareness, reducing child mortality and encouraging healthier lifestyles. Overall, improvements in governance, education, infrastructure and financial flows will drive greater investment in healthcare, leading to better public health outcomes. Additionally, technological advancements in the healthcare sector could enhance medical service delivery and accessibility, further contributing to longer life spans.
If AfCFTA, along with economic growth in agriculture, manufacturing and trade, successfully raises living standards, life expectancy could increase as poverty declines and healthcare access expands. By capitalising on strengths such as a youthful population, regional integration as well as agricultural and manufacturing potential while addressing weaknesses like healthcare limitations and infrastructure deficits, Zimbabwe can see life expectancy rise to 72 years by 2043 (75 years for females and 70 years for males) in the Combined scenario.
Chart 36 compares the Gini coefficient in the Current Path with the Combined scenario in 2023 and 2043.
The Gini index is a measure of income inequality within a country, evaluating how income or wealth is distributed among its population. This index ranges from 0 (0%) to 1 (100%), where 0 represents perfect equality and 1 signifies complete inequality. A coefficient exceeding 0.4 is a critical threshold, indicating a significant income disparity that often correlates with social and political instability. When the index falls between 0.5 and 1, it reflects severe income inequality.
In Zimbabwe, the Gini coefficient will remain around 0.5 from 2023 to 2043 on the Current Path, highlighting a high level of inequality, with a substantial share of wealth concentrated among a small elite. The combined impact of the sectoral scenarios on income inequality in Zimbabwe will largely depend on how well they are managed and incorporated into national development strategies. Enhancements in governance, infrastructure and education could promote more inclusive growth, benefiting both the agricultural and manufacturing sectors and ultimately helping to reduce inequality. Additionally, AfCFTA could contribute by expanding markets and generating employment opportunities for a wider segment of the population.
Collectively, these factors could lower the 2043 Current Path Gini index by six percentage points, bringing it down to 0.49 in the Combined scenario. However, if the benefits of AfCFTA, technological advancements or financial flows are not distributed equitably, they could exacerbate income inequality rather than reduce it.
Chart 37 compares carbon emissions in the Current Path with the Combined scenario from 2020 to 2043. Note that the data is in million tons of carbon, not CO2 equivalent.
For more insights, also refer to the climate theme.
On the Current Path, Zimbabwe’s carbon emissions from fossil fuels will rise from 2.5 million tons in 2023 to 7.3 million tons by 2043. The trajectory of these emissions will be influenced by factors such as demographics, agriculture, AfCFTA, infrastructure development, and more. While population growth and economic expansion may contribute to higher emissions, investments in clean energy technologies, improved governance and education could help reduce the country’s dependence on fossil fuels and curb emissions growth. A successful transition to cleaner energy through technological leapfrogging and sustainability-focused policies can significantly cut carbon emissions to approximately 760 000 tons by 2043 in the Combined scenario, fostering a more resilient and environmentally sustainable economy.
Chart 38 compares energy demand and production in the Current Path with the Combined scenario from 2020 to 2043. Production is done in six types, namely oil, gas, coal, hydro, nuclear and other renewables. The data is converted into billion barrels of oil equivalent (BOE) to allow for comparisons. Note that energy production could be for domestic use or for export.
On the Current Path, Zimbabwe's energy demand will increase from 30.8 million barrels of oil equivalent (BOE) in 2023 to 77 million BOE by 2043. Over the same period, energy production will rise from 26.6 million BOE to 51.1 million BOE. Consequently, the energy deficit will expand from 7.3 million BOE in 2023 to 25.9 million BOE by 2043.
Zimbabwe primarily depends on coal and hydroelectric power. Coal production will grow from 14.9 million BOE in 2023 to 39.7 million by 2043 on the Current Path, while hydroelectric output will increase from 2.5 million BOE to 7.8 million BOE. Meanwhile, total renewable energy production will rise from 2.6 million to 7.9 million BOE during this period.
Although hydroelectric power remains the dominant source of renewable energy, it faces challenges such as climate change risks and ageing infrastructure. To enhance energy security, Zimbabwe should prioritise the expansion of solar and wind power. Additionally, the country could reduce pressure on energy demand and reliance on fossil fuels by bypassing outdated hydroelectric systems and carbon-intensive energy sources.
The growing demand for energy in the coming decades will be driven by population growth and industrialisation. Economic expansion, particularly through increased trade under AfCFTA and the growth of key sectors like manufacturing and agriculture, will push energy demand to 146.6 million BOE by 2043 in the Combined Scenario, representing a 90-percentage-point increase above the Current Path. This rising demand will further strain Zimbabwe’s existing energy infrastructure, which heavily depends on coal and hydropower.
Energy production in Zimbabwe will evolve based on investments in renewable energy, infrastructure improvements and technological advancements. If the country prioritises clean energy technologies such as solar and wind power, energy production could become more sustainable and resilient. Under these measures, renewable energy production would rise to 234 million BOE in the Combined scenario, reflecting a 3-percentage-point increase over the Current Path. However, if Zimbabwe continues to rely on coal without significant diversification, carbon emissions will increase, further escalating energy demand from conventional sources.
Zimbabwe has an opportunity to bypass inefficient energy systems by adopting renewable energy solutions and investing in energy-efficient infrastructure. By doing so, fossil fuel dependence could decline to 24.6 million BOE by 2043—41 percentage points lower than the Current Path. This transition would reduce the need for fossil fuel imports and decrease reliance on coal-generated electricity.
Additionally, through AfCFTA and regional collaborations, Zimbabwe could leverage shared energy resources and infrastructure. Participation in cross-border energy initiatives—such as shared solar farms or regional power grids—would provide access to diverse energy sources, lower costs and ensure stable production to meet demand.
If Zimbabwe successfully implements these strategies under the Combined scenario, total energy production will reach 259.1 million BOE, surpassing the Current Path by 407 percentage points. This would result in an energy surplus of approximately 112.6 million BOE, enabling Zimbabwe to meet growing energy needs while reducing reliance on hydro and fossil fuels, fostering sustainable energy production and building a more resilient energy system for the future.
Chart 39 summarises the policy recommendations for Zimbabwe.
This report has analysed Zimbabwe’s developmental trajectory up to 2043, assessing its Current Path and exploring transformative scenarios across eight critical sectors: agriculture, education, governance, infrastructure and leapfrogging, demographics and health, financial flows, manufacturing, and AfCFTA integration.
The findings highlight persistent structural challenges—including political and economic instability, weak governance, low technological adoption, limited economic diversification, inadequate and outdated infrastructure, a slow demographic transition, a low-skilled workforce and climate vulnerabilities. While Zimbabwe is making progress, the pace of economic and human development remains insufficient to meet the Sustainable Development Goals (SDGs) by 2030.
Achieving sustainable growth requires a synergised approach, leveraging sectoral advancements to drive long-term economic resilience. The following policy recommendations are critical for unlocking Zimbabwe’s full potential:
- Demographic Growth: Develop policies that enhance labour market integration, urban planning and youth employment programs to capitalise on the demographic dividend.
- Health/WaSH: Increase investment in healthcare infrastructure, disease prevention, as well as clean water and sanitation access to improve workforce productivity and reduce economic losses from health-related issues.
- Agriculture: Modernise the sector by expanding irrigation, promoting precision farming, improving transport and storage infrastructure, and supporting agro-processing to boost productivity, food security and job creation.
- AfCFTA Integration: Strengthen regional trade participation by eliminating trade barriers, improving logistics and diversifying exports to maximise opportunities in manufacturing and services.
- Manufacturing Sector: Prioritise industrialisation through technological adoption, skills development and strategic investments in key industries such as agro-processing and mineral beneficiation (lithium, platinum, diamond, iron ore, chromium and gold).
- Infrastructure Development: Develop energy, transport and ICT networks to lower business costs, improve efficiency, attract investment and enhance connectivity, particularly for agriculture and rural areas.
- Leapfrogging Technology: Promote the rapid adoption of digital technologies, automation and AI-driven solutions to enhance productivity and competitiveness in key sectors.
- Financial Flows: Implement policies that attract foreign direct investment (FDI), strengthen local capital markets and improve tax systems to boost sustainable economic growth and fiscal stability.
- Governance: Foster political stability, transparency and efficient resource allocation, implementing robust anti-corruption measures to improve the investment climate.
- Educational Attainment: Expand access to STEM education, vocational training and digital skills development to create a skilled and innovation-driven workforce for future economic transformation.
A future-ready Zimbabwe will be youthful, skilled, healthier, export-oriented, technologically advanced and well-governed. By prioritising industrialisation, strengthening regional trade ties through AfCFTA and creating a business-friendly investment environment, Zimbabwe can drive manufacturing growth, economic diversification and higher living standards.
The manufacturing sector will be the cornerstone of sustainable economic growth, unlocking job creation, poverty reduction and resilience against external economic shocks. To maximise its potential, Zimbabwe must focus on strategic investments in infrastructure, skills development, innovation and governance reforms that enable value-add production and beneficiation.
These policy interventions will accelerate GDP growth, reaching 9% by 2030, peaking at 14% in 2037, and stabilising at 9% by 2043 under the Manufacturing scenario. This trajectory aligns with Zimbabwe’s Vision 2030, targeting a GDP growth rate of 7–10% by 2030 and positioning the country as a competitive player in regional and global markets.
With decisive action, Zimbabwe can transition from a resource-based economy to an industrialised, high-value production hub, ensuring long-term prosperity for its people.
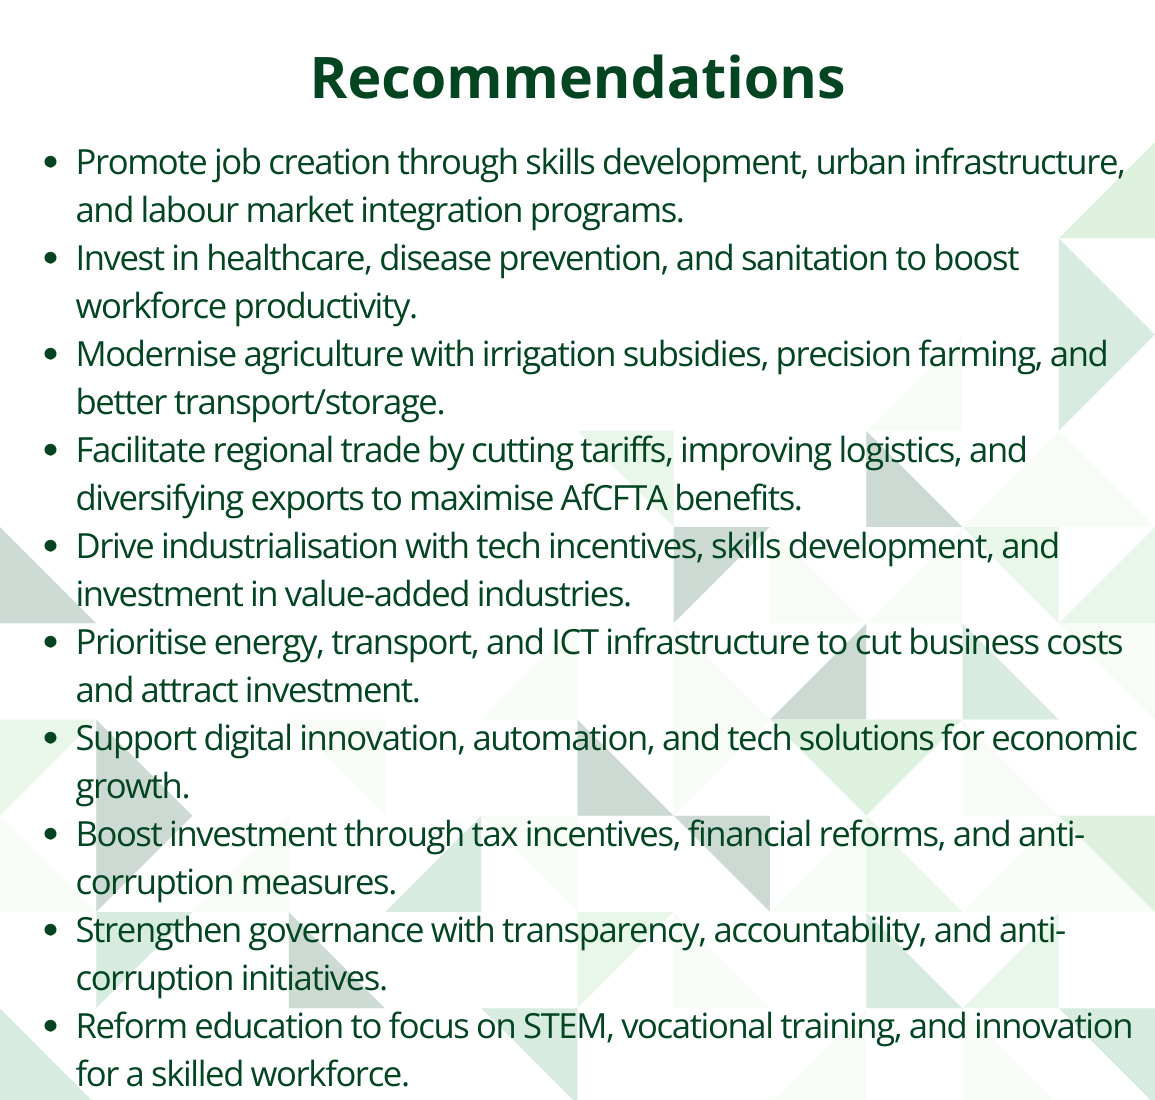
Page information
Contact at AFI team is Marvellous Ngundu and Jakkie Cilliers
This entry was last updated on 15 June 2026 using IFs v7.63.
Donors and sponsors


Reuse our work
- All visualizations, data, and text produced by African Futures are completely open access under the Creative Commons BY license. You have the permission to use, distribute, and reproduce these in any medium, provided the source and authors are credited.
- The data produced by third parties and made available by African Futures is subject to the license terms from the original third-party authors. We will always indicate the original source of the data in our documentation, so you should always check the license of any such third-party data before use and redistribution.
- All of our charts can be embedded in any site.
Cite this research
Marvellous Ngundu and Jakkie Cilliers (2026) Zimbabwe Development Futures. Published online at futures.issafrica.org. Retrieved from https://futures.issafrica.org/geographic/countries/zimbabwe/ [Online Resource] Updated 15 June 2026.