 Africa
Feedback welcome
Our aim is to use the best data to inform our analysis. See our Technical page for information on the IFs forecasting platform. We appreciate your help and references for improvements via our feedback form.
This report analyses Africa’s current development path and prospects, examining how various sectoral interventions could shape the continent’s economic and social landscape through to 2043, the end of the third ten-year implementation plan of the African Union's Agenda 2063. The analysis is grounded in scenario modelling using the International Futures (IFs) modelling platform. It explores eight key sectors: Demographics and Health, Agriculture, Education, Manufacturing, Large Infrastructure and Leapfrogging, the African Continental Free Trade Area (AfCFTA), Financial Flows and Governance. In addition to evaluating the effects of each sectoral scenario individually, the report assesses the combined impact of these interventions on Africa’s long-term growth and development trajectory. The report summarises the key findings and offers policy insights to support Africa in pursuing a more inclusive, resilient and sustainable development path. It underscores the importance of coordinated, multi-sectoral reforms to unlock the continent’s long-term economic and social potential.
Visit the Technical section for additional information on the International Futures (IFs) modelling platform, which serves as the analytical foundation for this report's scenario simulations.
Executive Summary
This report begins with an introductory assessment of the continent’s context, examining current population distribution, social structure, climate and topography.
- Africa, the world’s second-largest continent, spans 30.4 million km² and was home to 1.5 billion people in 2024. Demographically, it is the world’s youngest continent, with a median age of 19.7 years. Geographically diverse and politically varied, Africa is shaped by its semi-arid and tropical landscapes, colonial legacies and post-independence state-building, with 54 sovereign states organised into broad administrative divisions and rich cultural, linguistic and ethnic diversity that underpin both its development challenges and opportunities.
The introduction is followed by an analysis of Africa’s Current Path, which informs the continent’s likely development trajectory to 2043. It is based on current geopolitical trends and assumes that no major shocks would occur in a ‘business-as-usual’ or baseline scenario.
- Africa’s population will grow to 2.3 billion by 2043, with the working-age share rising steadily and laying the foundations for a potential demographic dividend. Realising this dividend, however, will depend on sustained investments in health, education and job creation to absorb Africa’s fast-growing youth population.
- Africa’s urban population share rose from 31% in 1990 to 44% in 2023, and will reach 52% by 2043 under the Current Path, with low-income countries urbanising the fastest. This rapid shift underscores the urgent need for inclusive urban planning, investment in affordable housing and infrastructure and strategies to address the growing rural-urban divide.
- In the Current Path, Africa’s GDP at market exchange rates (MER) will rise from US$2.66 trillion in 2023 to US$6.36 trillion by 2043, reflecting a moderate average growth of 4.6% annually, slower than South Asia but faster than South America. While services and domestic consumption remain the main drivers, structural transformation into industry and trade-led growth is essential if Africa is to align with Agenda 2063 targets and avoid vulnerability to commodity cycles.
- Africa’s GDP per capita in purchasing power parity (PPP) will rise from US$4 850 in 2023 to US$6 210 by 2043 under the Current Path, reflecting gradual improvements in living standards but still lagging behind peer regions, underscoring the urgency of structural reforms to avoid the middle-income trap and meet Agenda 2063 aspirations.
- Africa’s informal sector will remain pervasive, with its share of GDP above 27% and informal employment above 53% by 2043, reflecting structural rigidities in labour markets and limited progress toward formalisation, industrialisation and inclusive job creation. Low-income countries will continue to experience the highest levels of informality.
- Extreme poverty in Africa will decline from 31% in 2023 to 19.1% by 2043 under the Current Path, marking progress but leaving nearly half a billion people below the US$2.15/day line. This trajectory reflects modest improvements in income distribution and access to services. Yet, it lags far behind poverty reduction in South Asia and South America, underscoring that without accelerated structural transformation and inclusive policies, Africa will miss continental poverty reduction goals.
- Africa’s development ambitions are currently guided by the Second Ten-Year Implementation Plan (TYIP, 2024–2033) of Agenda 2063, which prioritises industrialisation, digital transformation and intra-African trade to consolidate early gains while tackling persistent poverty and inequality. Looking ahead, the Third TYIP (2034–2043) will focus on deepening structural transformation, embedding resilience against climate and geopolitical shocks, and driving Africa closer to its long-term vision of inclusive and sustainable prosperity.
The next section compares progress on the Current Path with eight sectoral scenarios. These are Demographics and Health; Agriculture; Education; Manufacturing; the African Continental Free Trade Area (AfCFTA); Large Infrastructure and Leapfrogging; Financial Flows; and Governance. Each scenario is benchmarked to present an ambitious but reasonable aspiration in that sector, comparing Africa with other regions at similar levels of development and characteristics.
- The Demographics and Health scenario accelerates Africa’s demographic transition, with the dividend ratio improving to 1.72 by 2043 compared to 1.57 under the Current Path, marking the continent’s delayed but eventual entry into its demographic window. It also places Africa on track to meet the Agenda 2063 health target of a 75-year life expectancy, reaching 74.3 years by 2043, reflecting sustained investment in non-communicable diseases (NCDs) prevention, maternal and child health and universal healthcare access that underpins productivity and inclusive growth.
- The Agriculture scenario moderates Africa’s crop import dependence to 16.2% of total demand by 2043, compared to almost 31% baseline forecast, highlighting important gains in domestic production, trade balance and food system resilience. However, the transformative impact on poverty and livelihoods will hinge on integrating smallholder farmers into value chains, scaling agro-processing industries and strengthening climate adaptation strategies, particularly in low-income countries where vulnerability to food insecurity remains highest.
- Under the Education scenario, Africa’s youth aged 14-24 achieve an average of 9.1 years of schooling by 2043, nearly a year higher than the Current Path forecast, with narrowing gender gaps and improved learning outcomes. These developments strengthen human capital formation and labour productivity, while contributing to moderate poverty reduction, underscoring the pivotal role of education reform, vocational training and digital inclusion in sustaining long-term growth and preparing Africa’s workforce for the demands of the 21st-century economy.
- The Manufacturing scenario revitalises Africa’s industrial base, raising manufacturing value-added to over 18% of GDP by 2043, and catalysing job creation, income growth and productivity gains, especially in the medium term. It underscores the centrality of industrial policy, infrastructure development and small to medium enterprise (SME) support in driving structural transformation, reducing dependence on primary commodities and positioning Africa to compete more effectively in global value chains.
- Under the AfCFTA scenario, Africa’s trade deficit narrows from 4.8% of GDP in 2023 to 2.9% by 2043, compared to 3.7% under the Current Path. This reflects gains from greater intra-African trade, export diversification and market integration. By driving the highest gains in per capita income and accelerating export diversification, AfCFTA confirms regional integration as a decisive lever for Africa’s long-term transformation and global positioning.
- The Large Infrastructure and Leapfrogging scenario accelerates Africa’s clean energy and digital transitions, with modern fuel cookstove adoption reaching 64% of households by 2043 compared to 57% under the Current Path, significantly expanding renewable energy production, especially solar. It also stimulates growth in digital services. However, persistent rural access gaps underline the need for targeted investment in infrastructure, affordability measures and inclusive energy planning to ensure no communities are left behind.
- The Financial Flows scenario boosts Africa’s external financing by raising FDI inflows to over 5% of GDP by 2043 and stabilising remittances, while moderating aid dependence to under 2% of GDP. However, without stronger domestic enterprise development and inclusive employment strategies, these flows risk reinforcing structural inequalities rather than driving broad-based growth.
- The Governance scenario demonstrates that strengthening institutional effectiveness across all income groups enhances investor confidence, improves fiscal efficiency and expands welfare transfers, positioning governance reform as a decisive lever for inclusive growth, poverty reduction and sustainable development.
The fourth section compares the impact of each of these eight sectoral scenarios with one another and subsequently with a Combined scenario (the integrated effect of all eight scenarios). The forecasts measure progress on various dimensions such as economic size (in market exchange rates), gross domestic product (GDP) per capita (in purchasing power parity), extreme poverty, carbon emissions, the changes in the structure of the economy, and selected sectoral dimensions such as progress with mean years of education, life expectancy, the Gini coefficient or reductions in mortality rates.
- Under the Combined scenario, Africa’s GDP (MER) will reach US$8.87 trillion by 2043, compared to US$6.36 trillion under the Current Path, reflecting accelerated growth from coordinated reforms across governance, intra-Africa trade, education and infrastructure. The average annual growth rate rises to 6.2% for the period 2024-2043 compared to 4.6% on the baseline, highlighting the compounding impact of coordinated, cross-sectoral reforms.
- GDP per capita increases to US$8 040 by 2043, approximately US$1 830 higher than the baseline forecast, reflecting more inclusive and sustained improvements in living standards. These gains are driven by stronger labour market performance, enhanced export competitiveness and expanded human capital development, underscoring the transformative potential of coordinated reforms.
- In the Combined scenario, Africa’s extreme poverty rate (measured at less than US$2.15/day per person) falls to about 11% by 2043, which is about 8.2 percentage points lower than the Current Path, lifting nearly 200 million more people out of poverty. These gains reflect faster income growth and more equitable distribution of development outcomes, highlighting the power of integrated, cross-sectoral reforms in breaking persistent poverty traps.
- The Combined scenario accelerates Africa’s structural transformation, with ICT, manufacturing and materials gaining the largest value-added shares of GDP by 2043, while agriculture and services contract slightly in relative terms. However, all sectors expand in absolute size, underscoring how industrialisation and digitalisation drive economy-wide spillovers, boosting productivity, technological diffusion and fiscal space across income groups.
- Informality declines considerably, with the informal sector’s GDP share falling to about 21% and informal employment dropping to 40% by 2043, compared to over 25% and 53% in the Current Path. These changes reflect progress in labour market formalisation, skills upgrading and SME integration into formal value chains.
- Under the Combined scenario, Africa’s energy production rises to over 10 billion barrels of oil equivalent (BOE) by 2043, compared to 7.7 billion under the Current Path, with solar emerging as the main driver of growth. While the scenario narrows the continent’s energy deficit through renewables expansion, demand will still outpace supply, highlighting the urgency of scaling investments in solar, wind and regional power integration to sustain industrialisation and universal access goals.
The analysis concludes with a summarising section offering recommendations. The Current Path allows steady but insufficient progress, while the Combined scenario demonstrates that coordinated sectoral reforms can unlock transformative growth. Achieving this potential demands bold, integrated policies that drive structural transformation, inclusive development and sustainable energy systems, lifting hundreds of millions out of poverty and positioning Africa as a competitive global growth pole. Among the individual scenarios, AfCFTA and Governance emerge as pivotal levers, underpinning stronger economic growth, poverty reduction and more equitable income distribution.
All charts for Africa Development Futures
- Chart 1: Political map of Africa
- Chart 2: Population structure in Current Path, 2020–2043
- Chart 3: Population distribution map, 2023
- Chart 4: Urban and rural population in the Current Path, 1990-2043
- Chart 5: GDP (MER) and growth rate in the Current Path, 1990–2043
- Chart 6: Size of the informal economy in the Current Path, 2020-2043
- Chart 7: GDP per capita in Current Path, 1990–2043
- Chart 8: Extreme poverty in Current Path 2020–2043
- Chart 9: Regional Development Plan of AFRICA
- Chart 10: Relationship between Current Path and Scenarios
- Chart 11: Mortality distribution in the Current Path, 2023
- Chart 12: Infant mortality rate in Current Path and Demographics and Health scenario, 2020–2043
- Chart 13: Demographic dividend in the Current Path and the Demographics and Health scenario, 2020–2043
- Chart 14: Crop production and demand in the Current Path, 1990-2043
- Chart 15: Import dependence in the Current Path and Agriculture scenario, 2020–2043
- Chart 16: Progress through the education funnel in the Current Path, 2023 and 2043
- Chart 17: Mean years of education in Current Path and Education scenario, 2020–2043
- Chart 18: Value-add by sector as % of GDP in the Current Path, 2020 and 2043
- Chart 19: Value-add by the manufacturing sector in the Current Path and Manufacturing scenario, 2020–2043
- Chart 20: Exports and imports as % of GDP in the Current Path, 2000-2043
- Chart 21: Trade balance in Current Path and AfCFTA scenario, 2020–2043
- Chart 22: Current Path access to electricity: urban, rural and total, 1990 to 2043
- Chart 23: Cookstove usage in Current Path and Large Infra/Leapfrogging scenario, 2020–2043
- Chart 24: Access to mobile and fixed broadband in Current Path and Large Infra/Leapfrogging scenario, 2020–2043
- Chart 25: Trends in FDI, aid and remittances as a % of GDP, 1990 to 2043
- Chart 26: Government revenue in Current Path and Financial Flows scenario, 2020–2043
- Chart 27: Current Path of Government Effectiveness, 1990 to 2043
- Chart 28: Composite governance index in Current Path vs Governance scenario, 2020–2043
- Chart 29: GDP per capita in Current Path and sectoral scenarios, 2020–2043
- Chart 30: Poverty in Current Path and sectoral scenarios, 2020–2043
- Chart 31: GDP (MER) in Current Path and Combined scenario, 2020–2043
- Chart 32: GDP per capita in the Current Path and the Combined scenario, 2020-2043
- Chart 33: Value added by sector in the Current Path and Combined scenario, 2023 and 2043
- Chart 34: Informal sector in the Current Path and Combined scenario, 2020–2043
- Chart 35: Poverty in the Current Path and Combined scenario, 2023 and 2043
- Chart 36: Life expectancy in the Current Path and Combined scenario, 2020–2043
- Chart 37: Carbon emissions in Current Path and in Combined Agenda 2063 scenario, 2020–2043
- Chart 38: Energy production by type in Current Path and Combined Agenda 2063 scenario, 2020-2043
- Chart 39: Policy recommendations
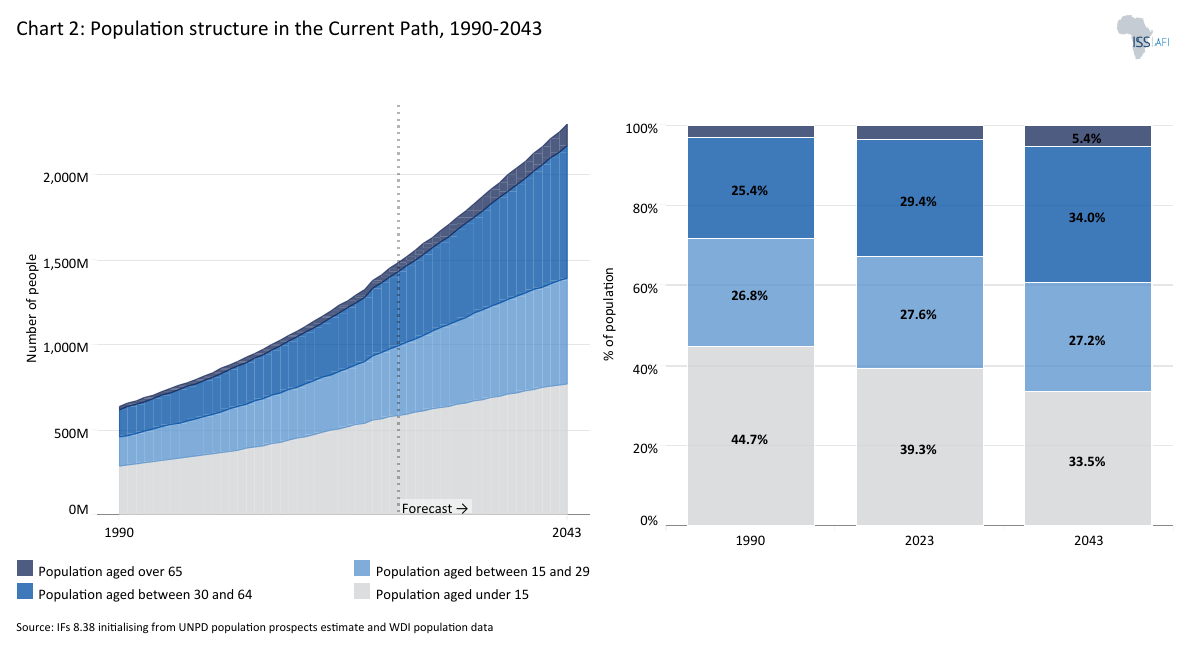
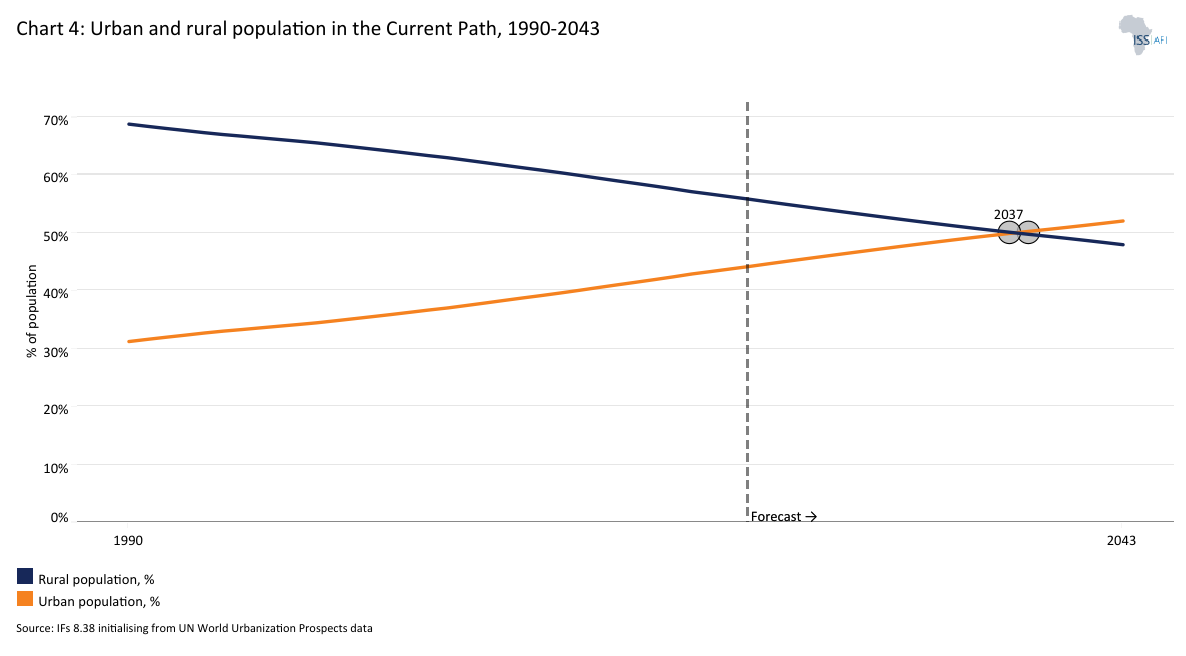
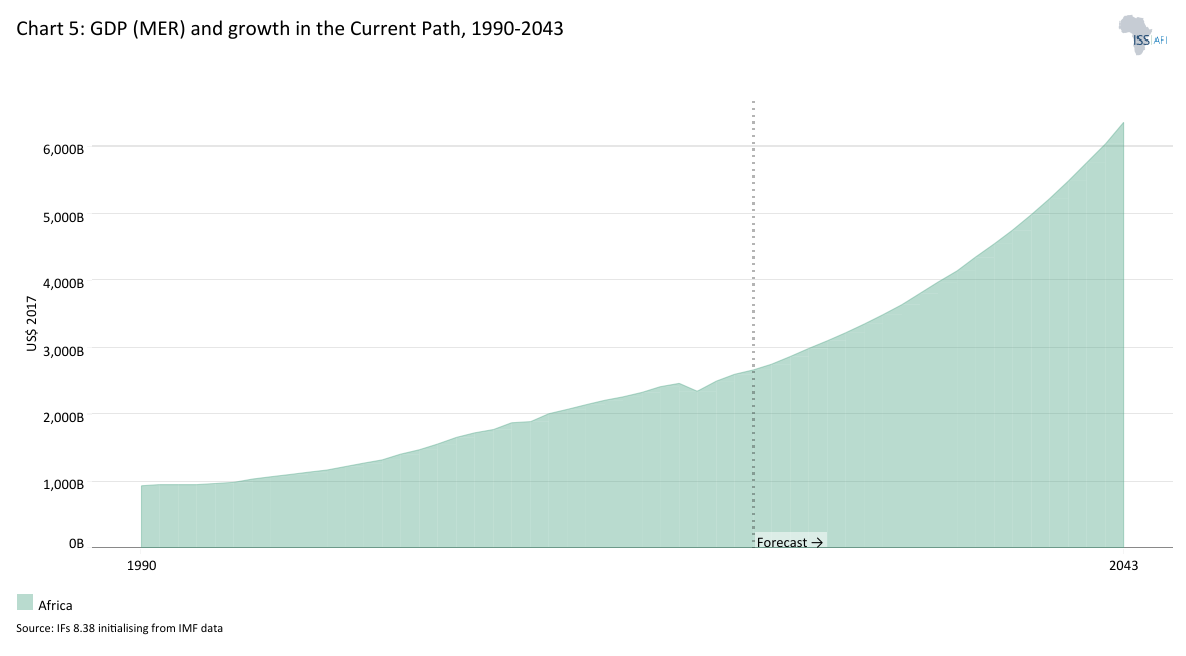
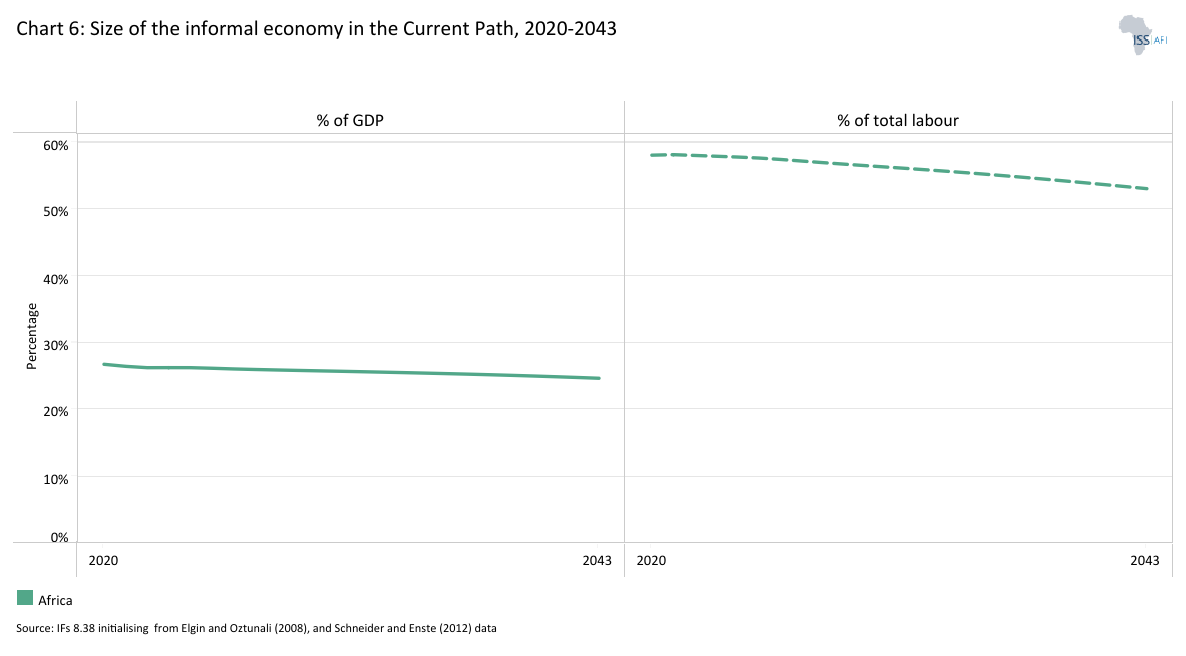
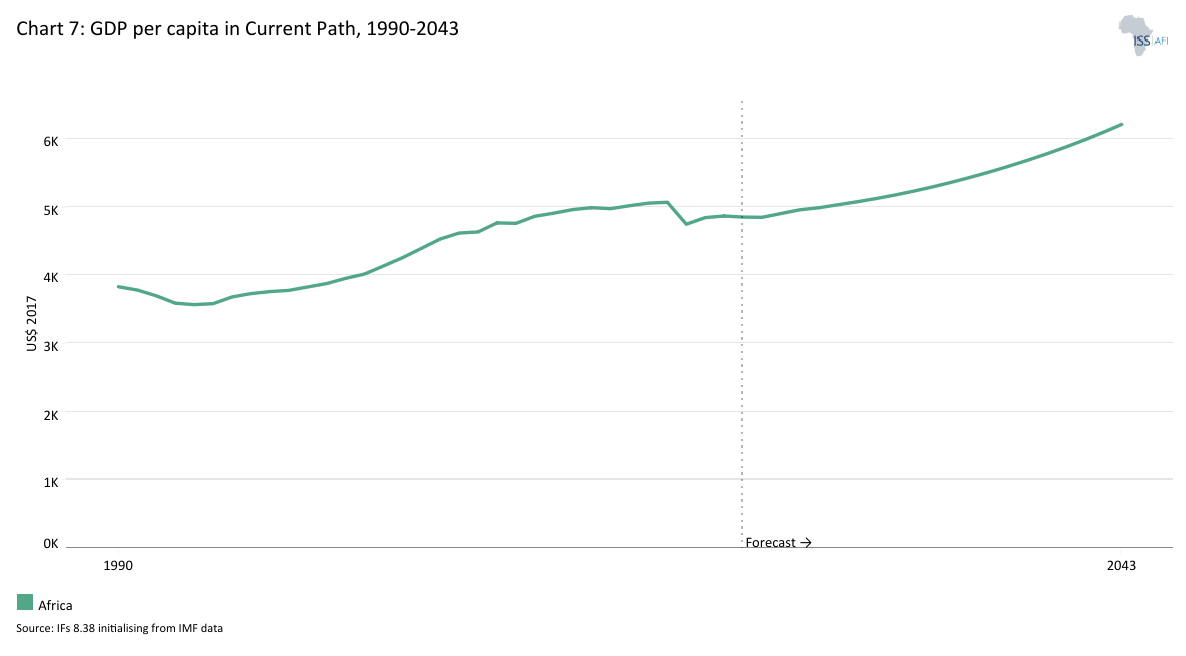
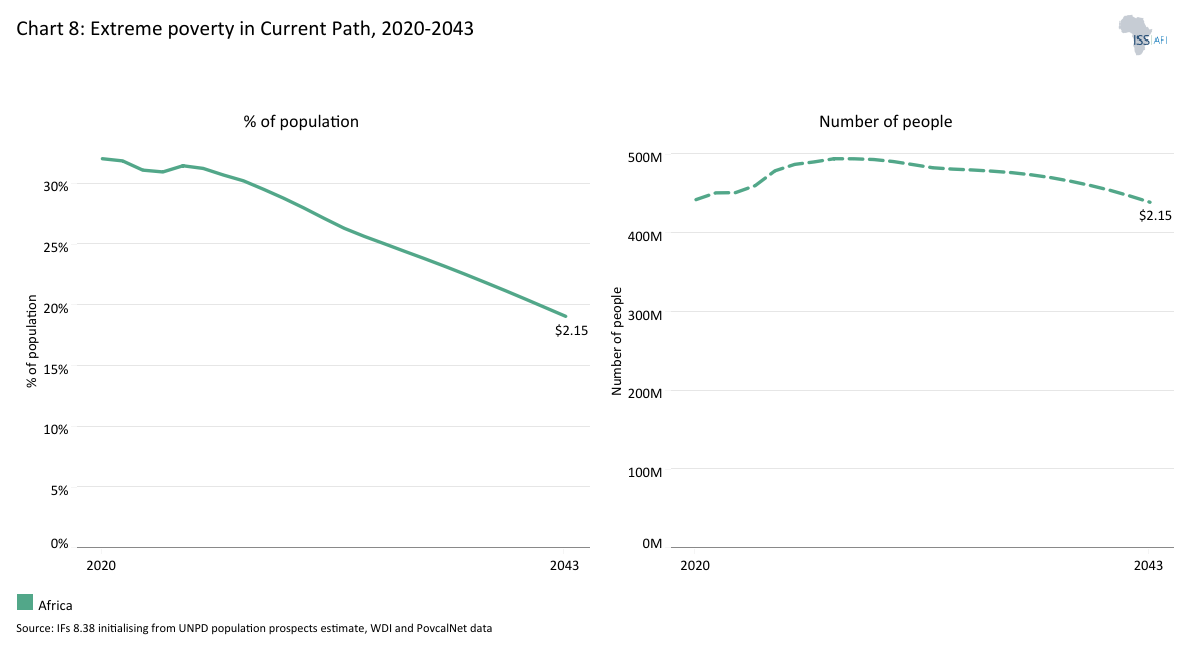
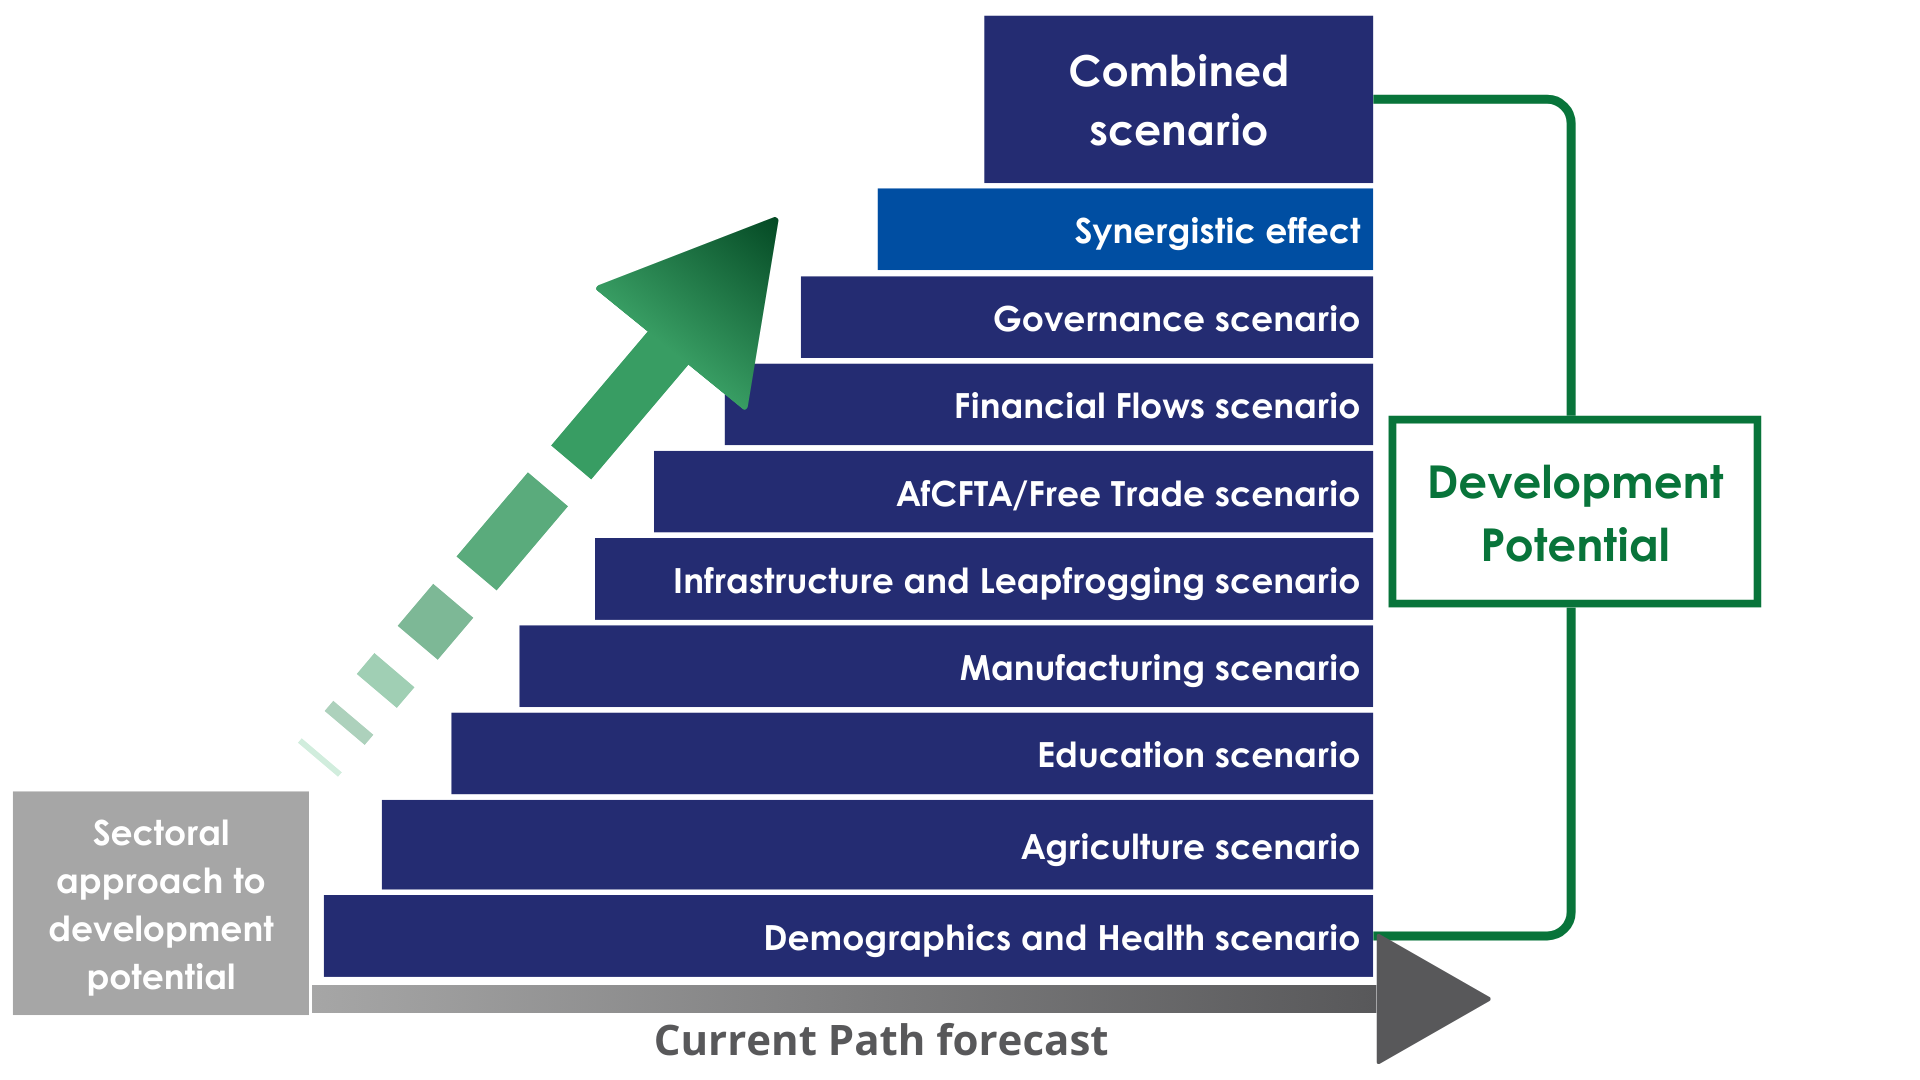
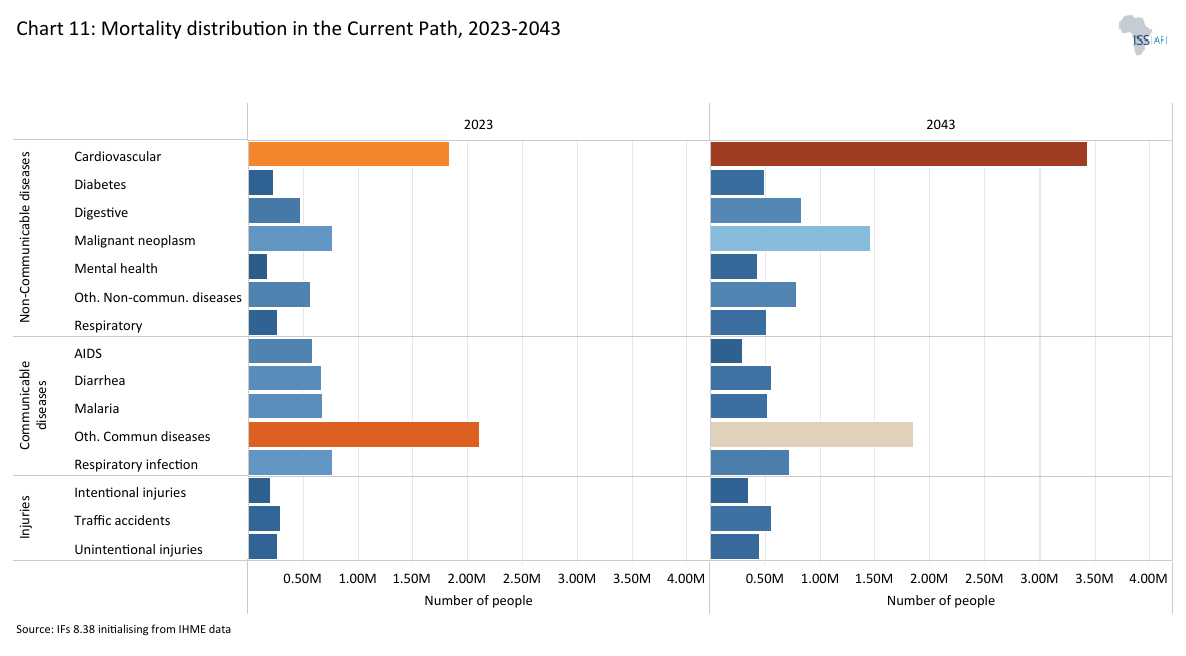
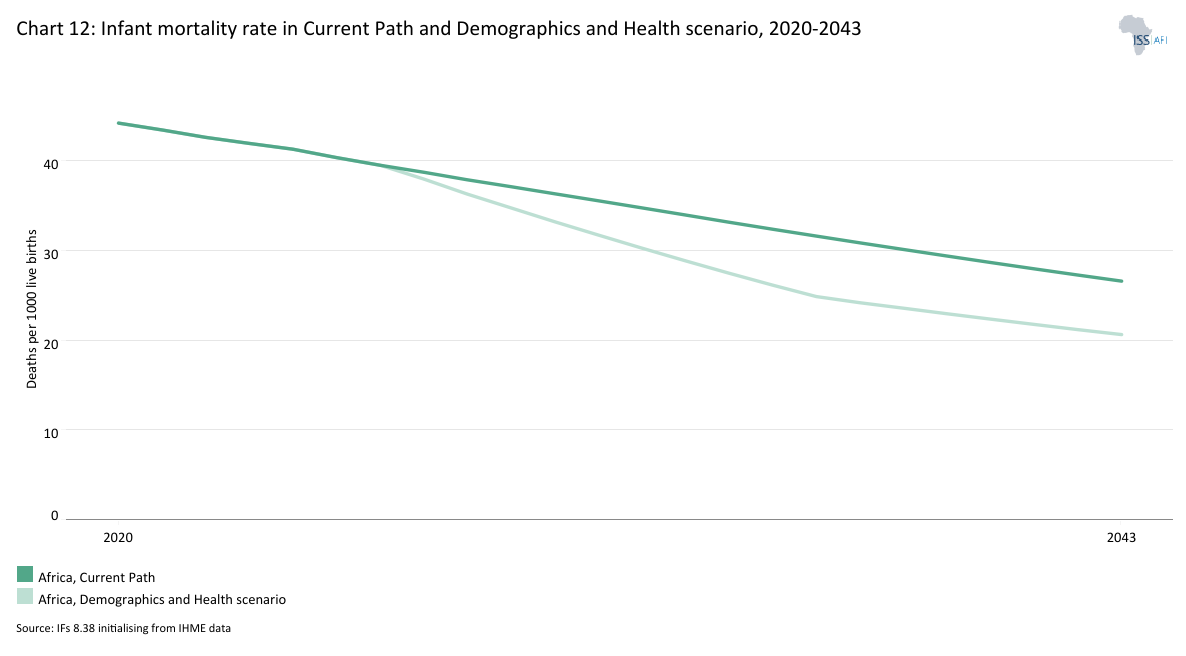
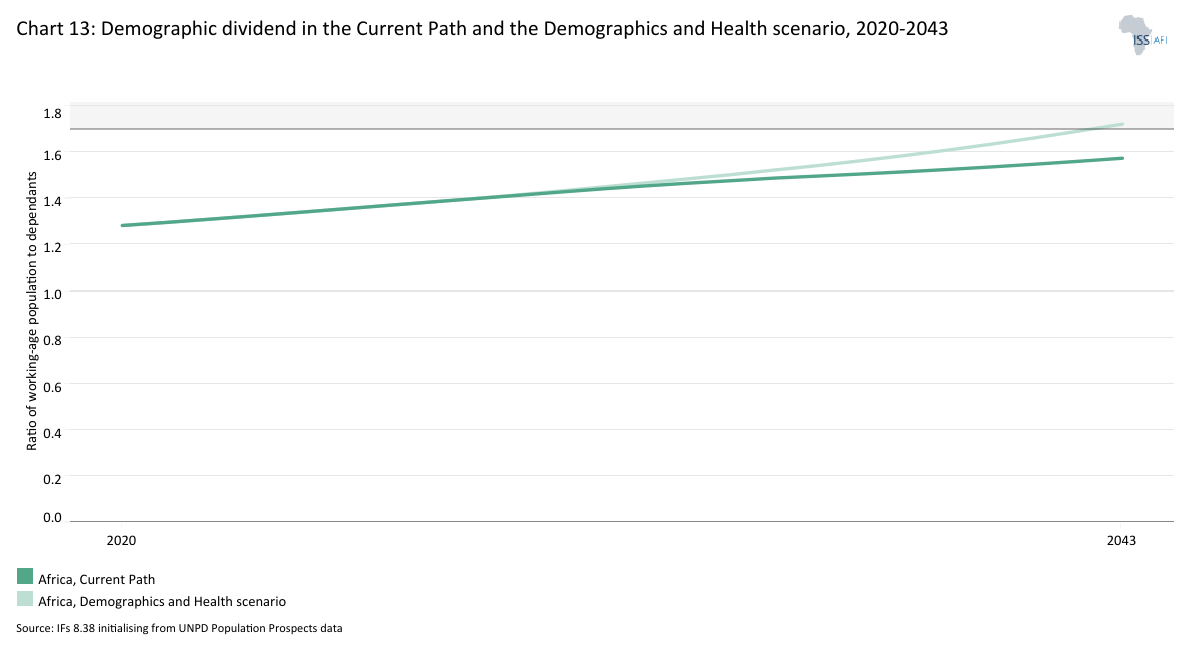
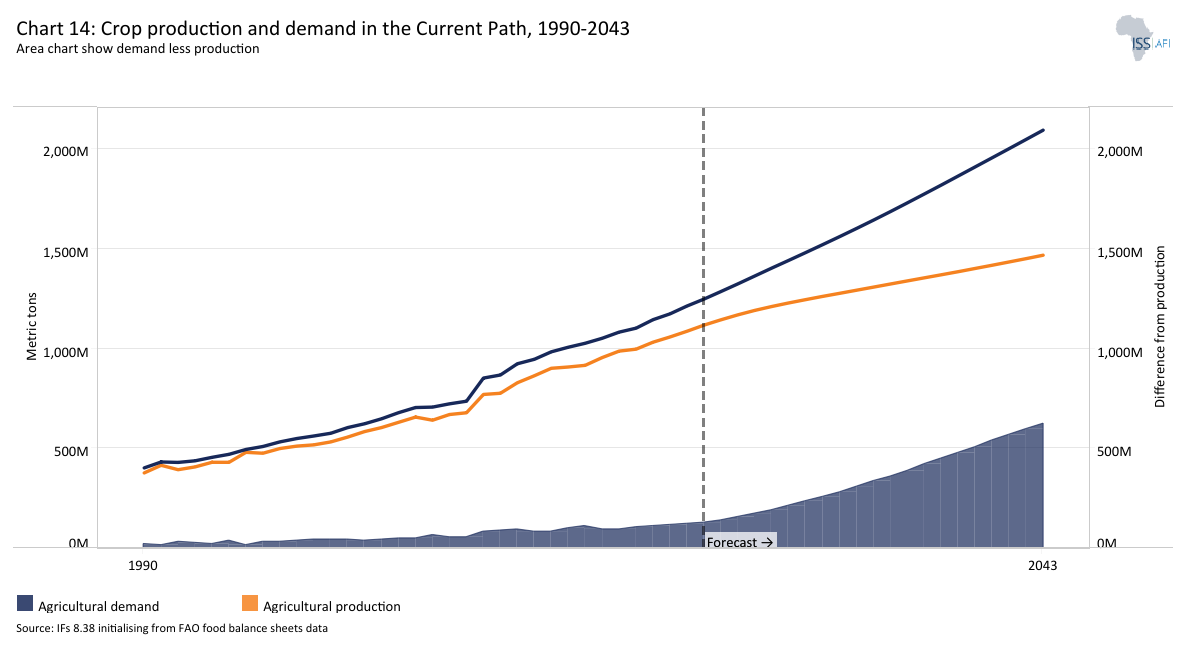
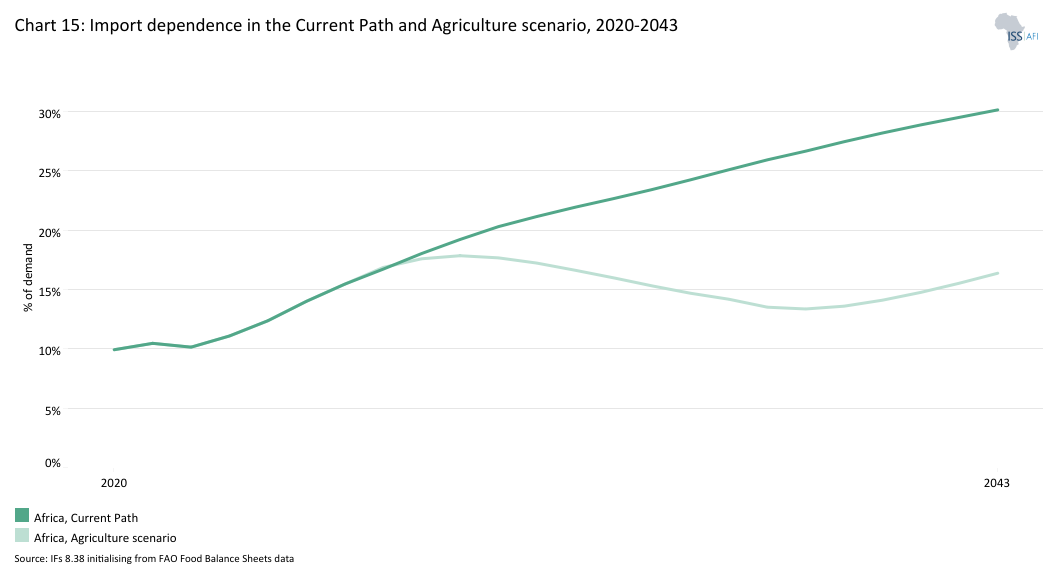
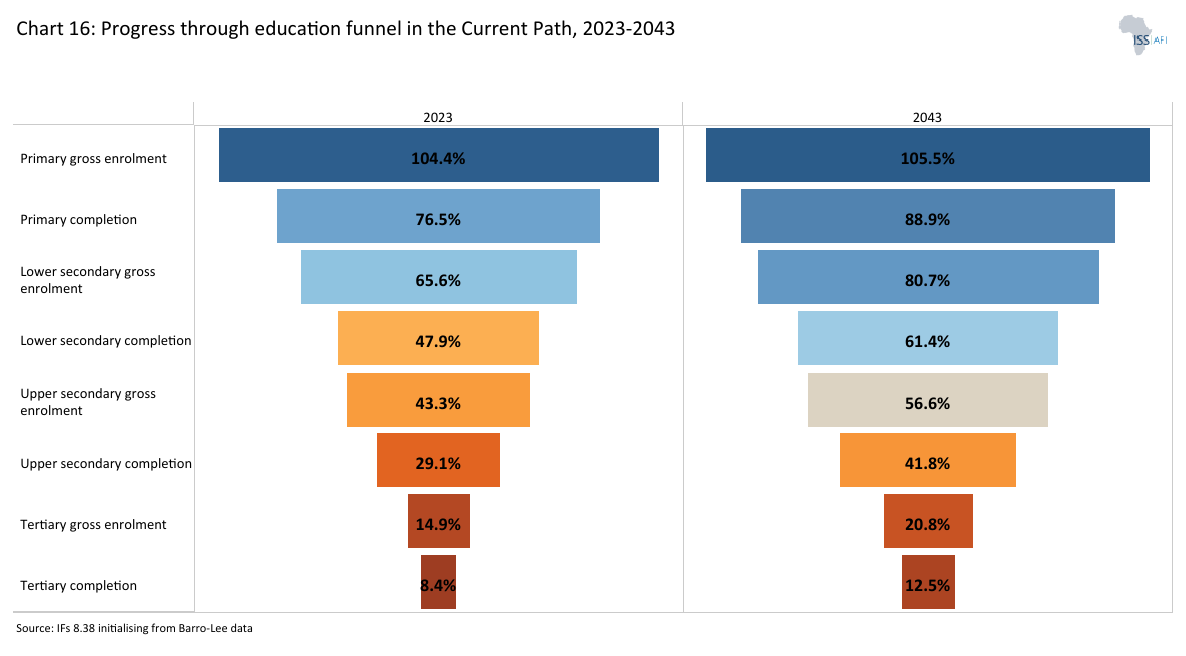
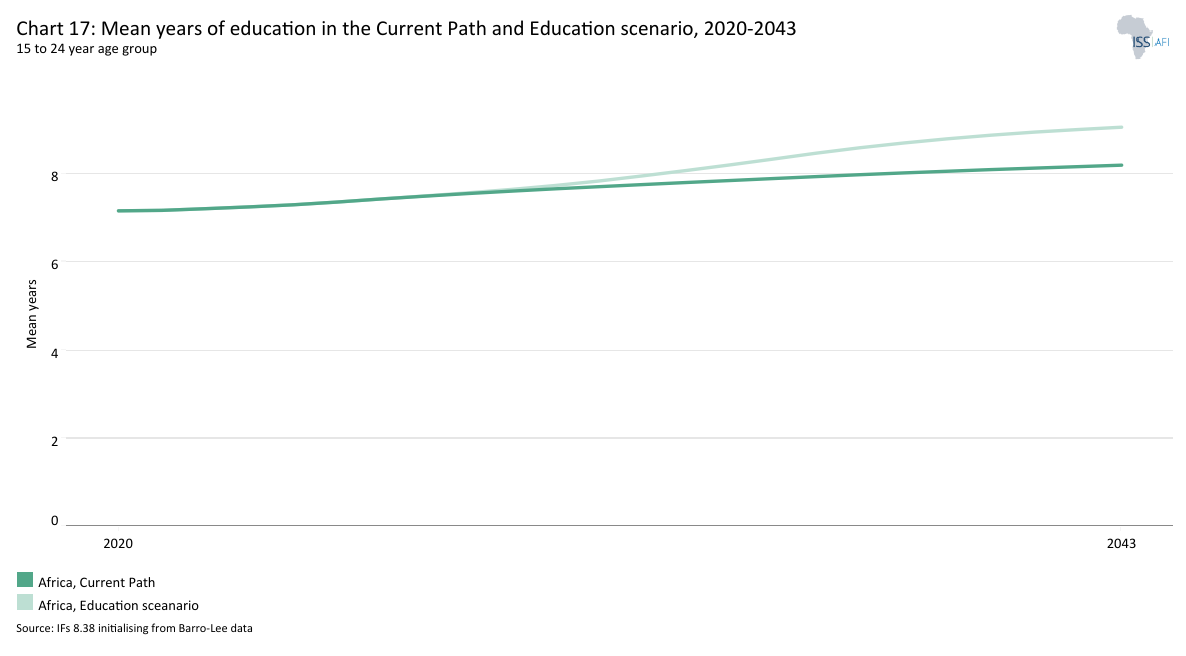
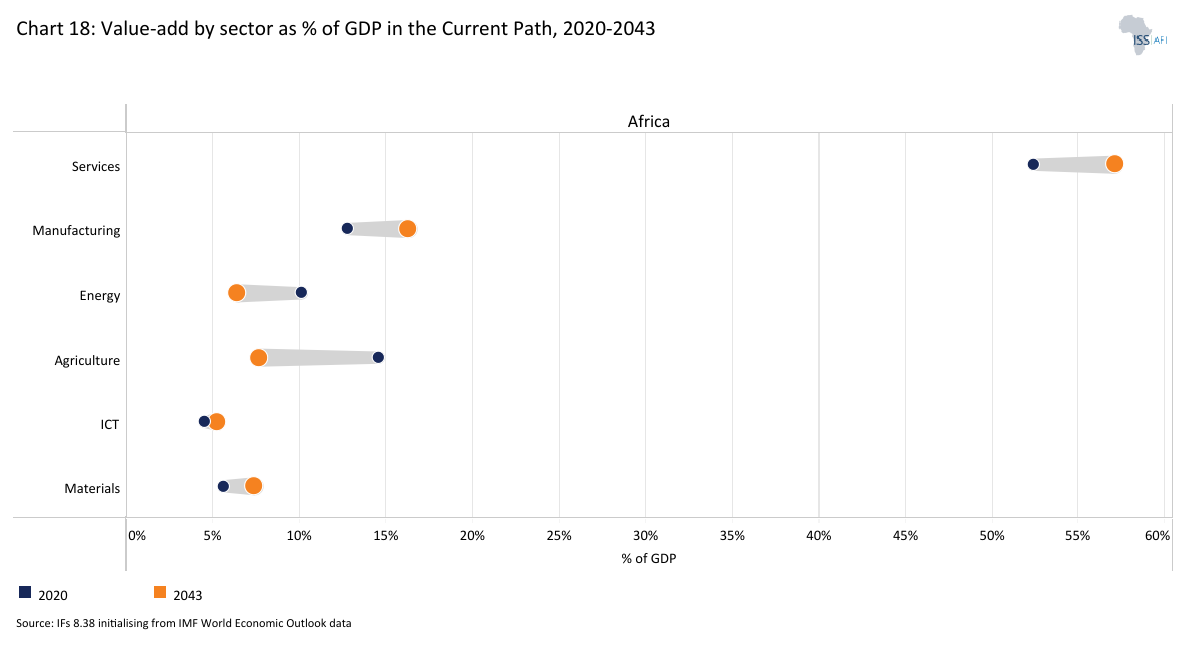
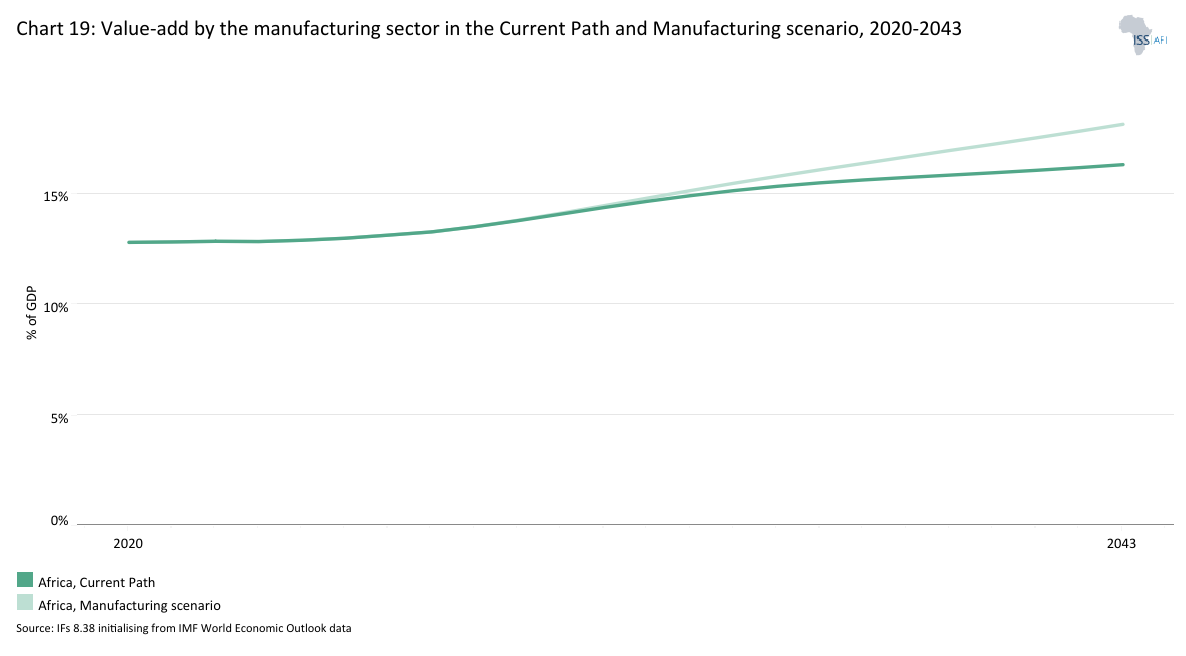
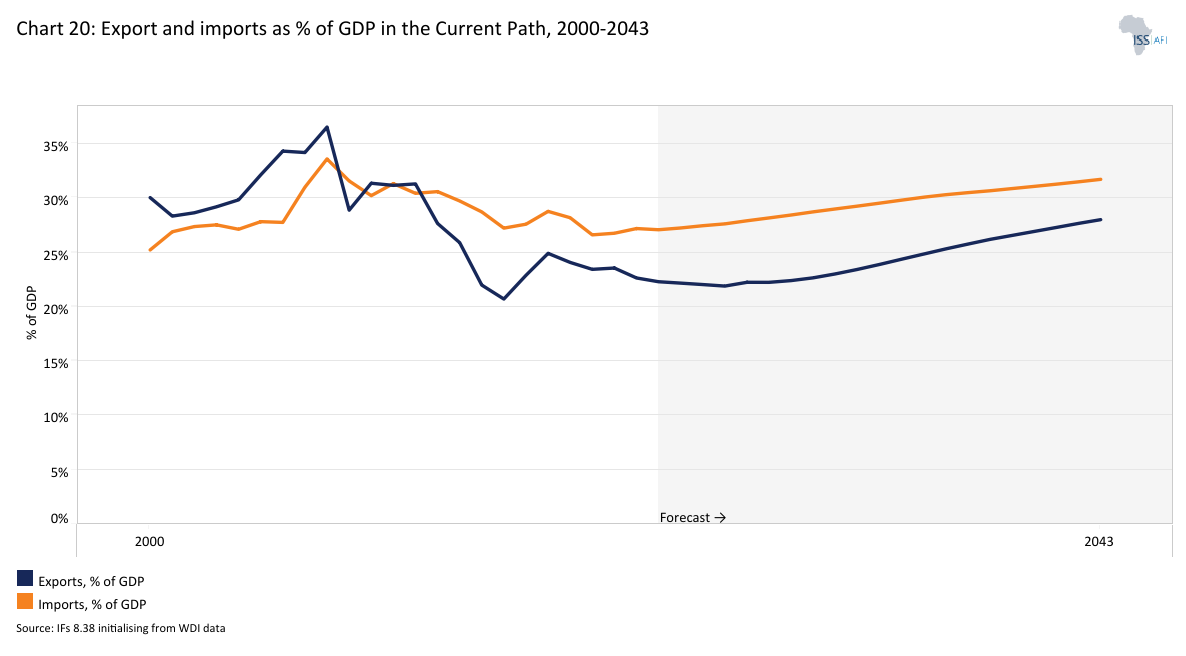
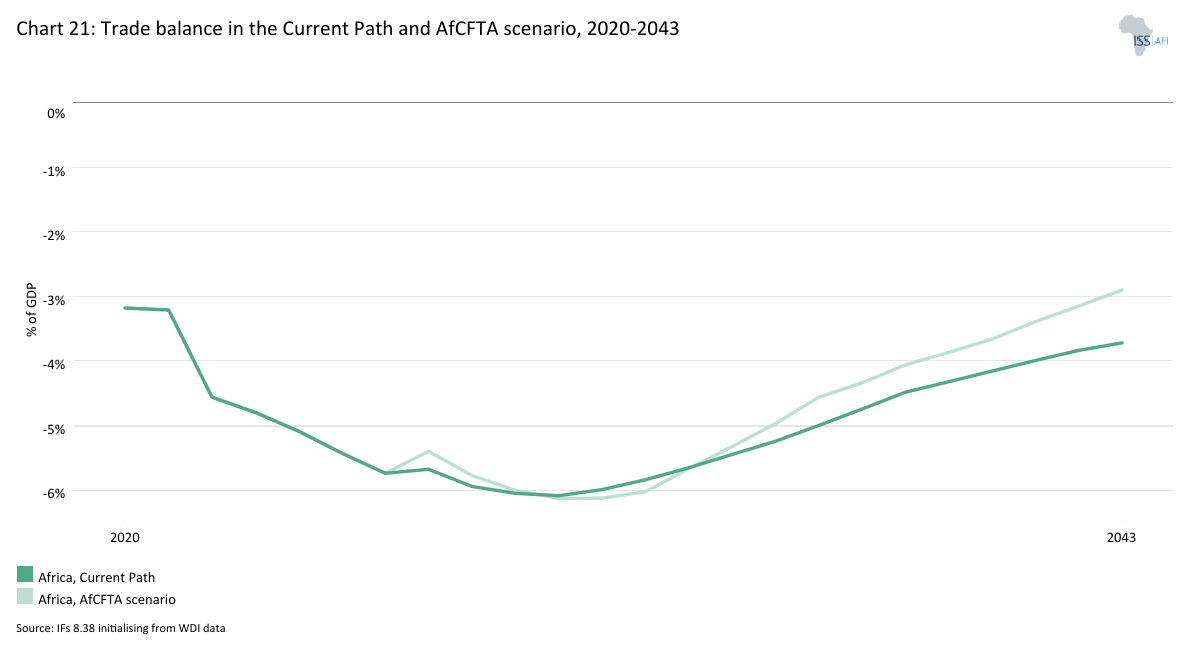
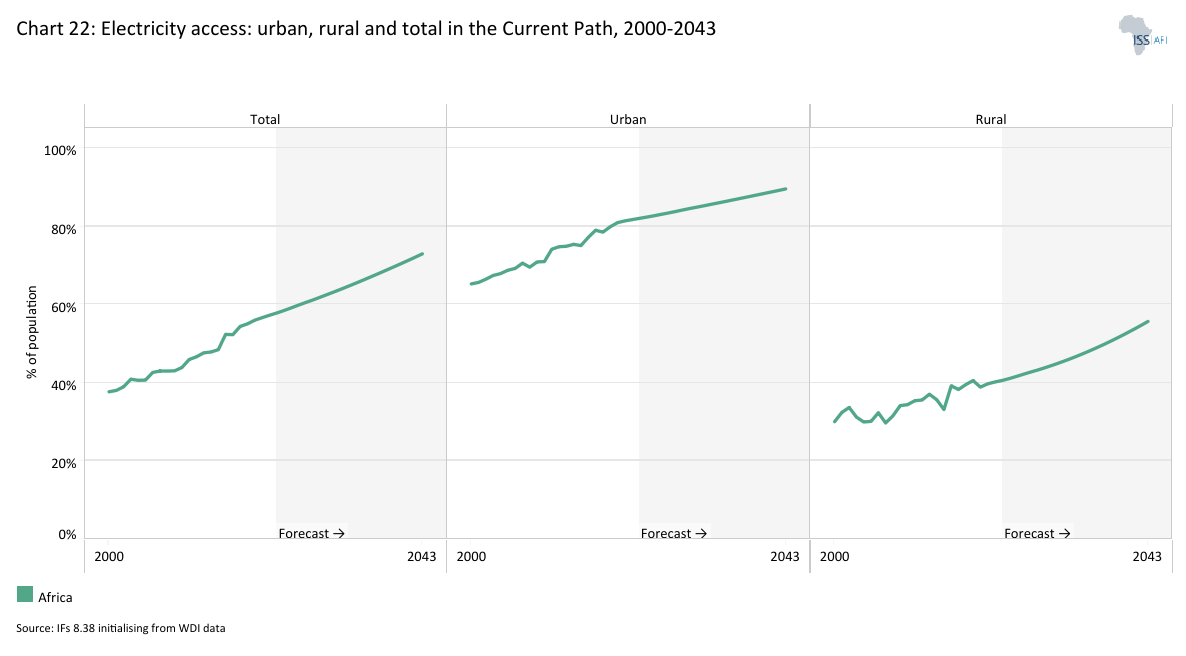
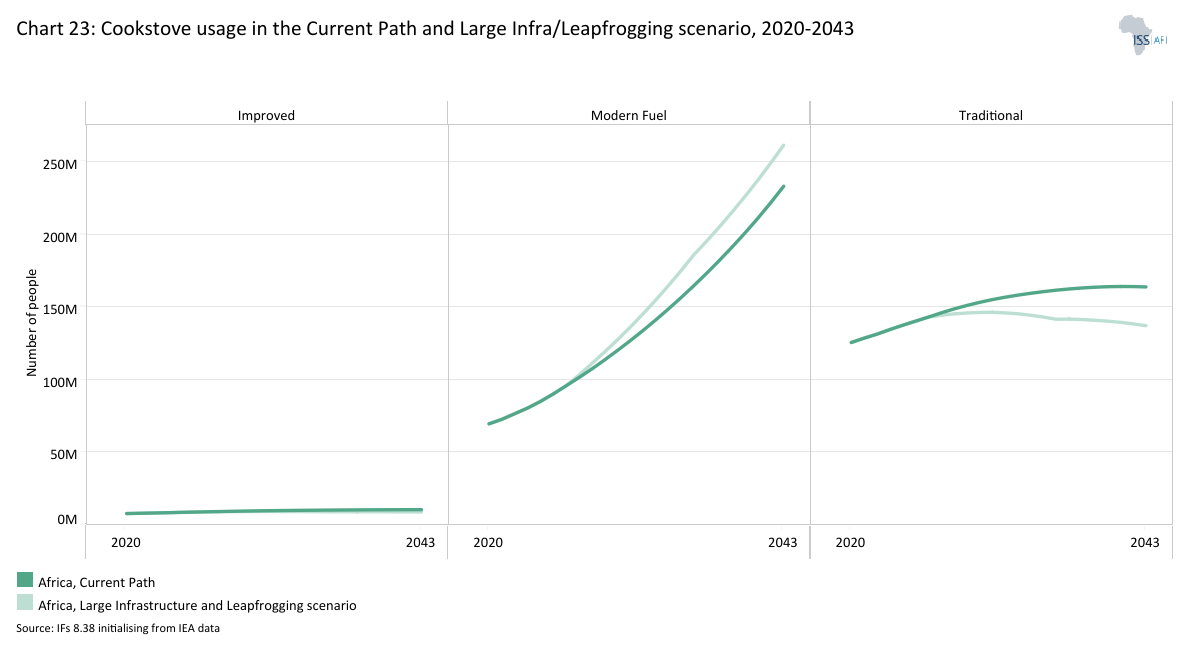
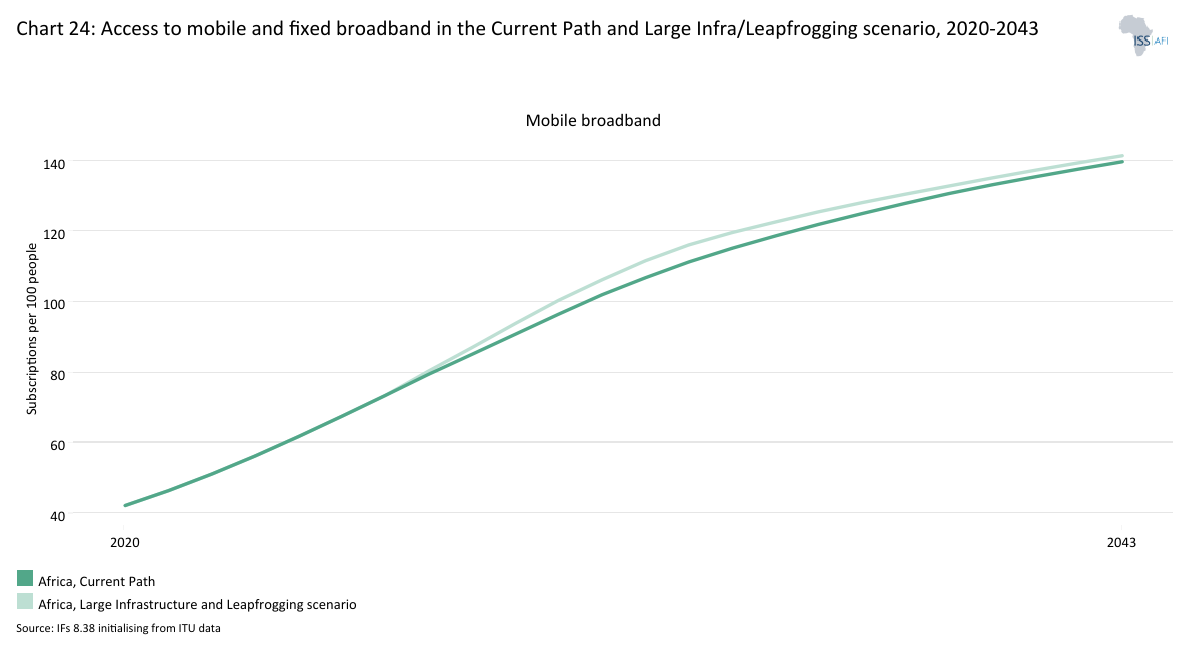
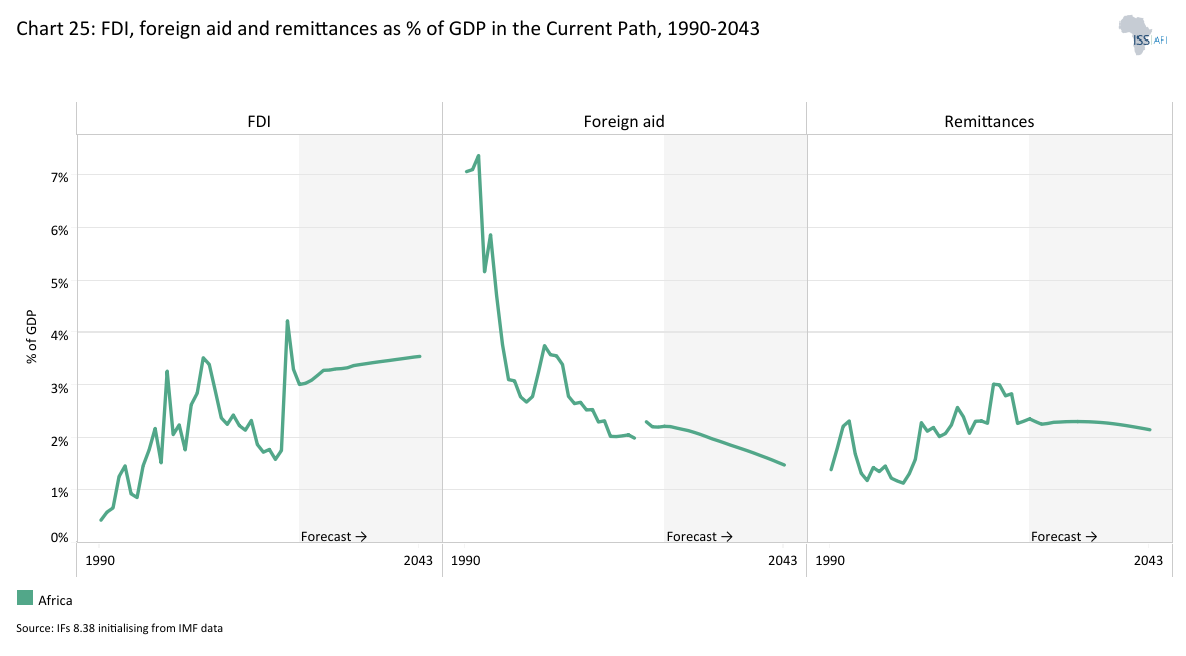
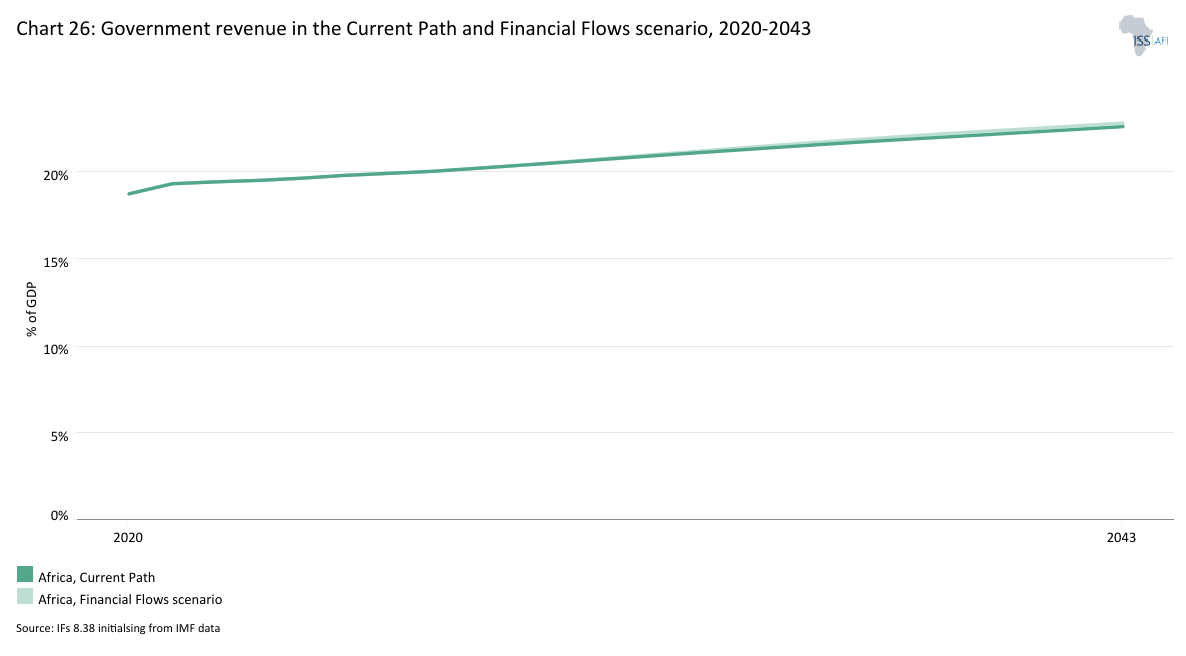
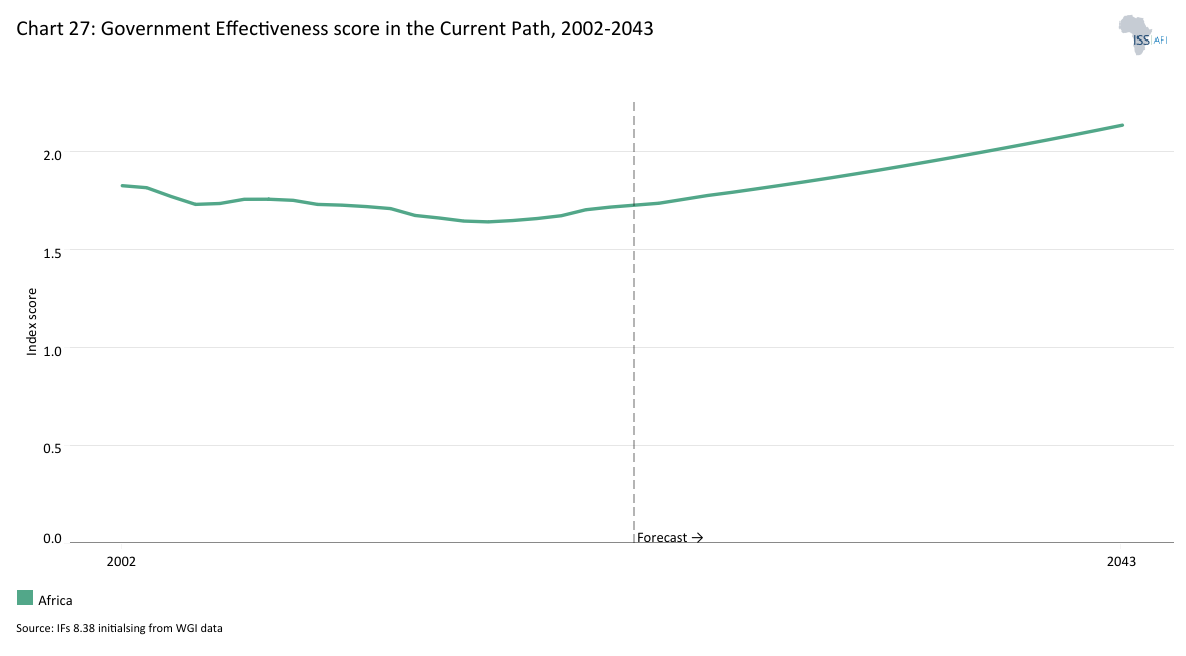
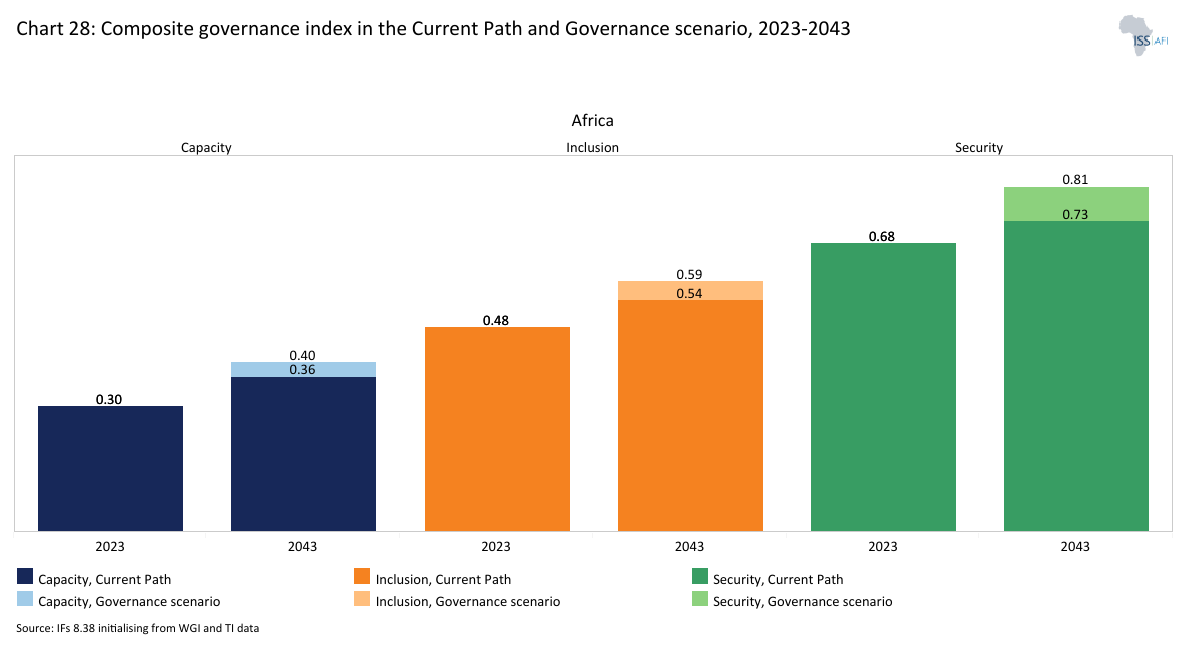
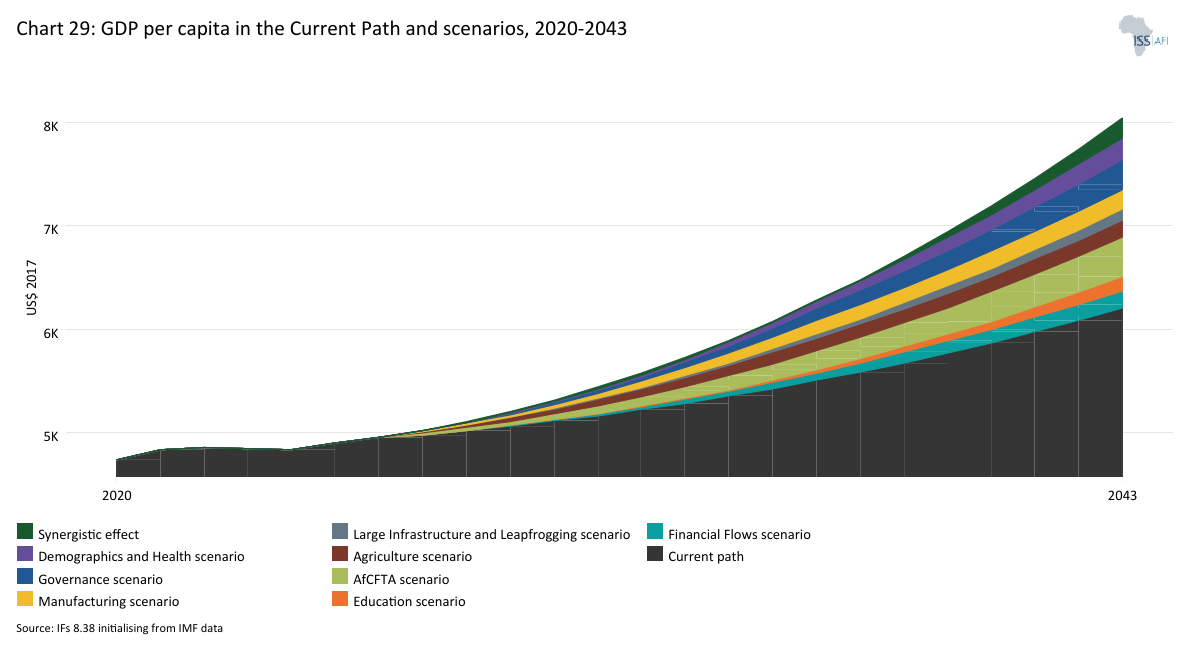
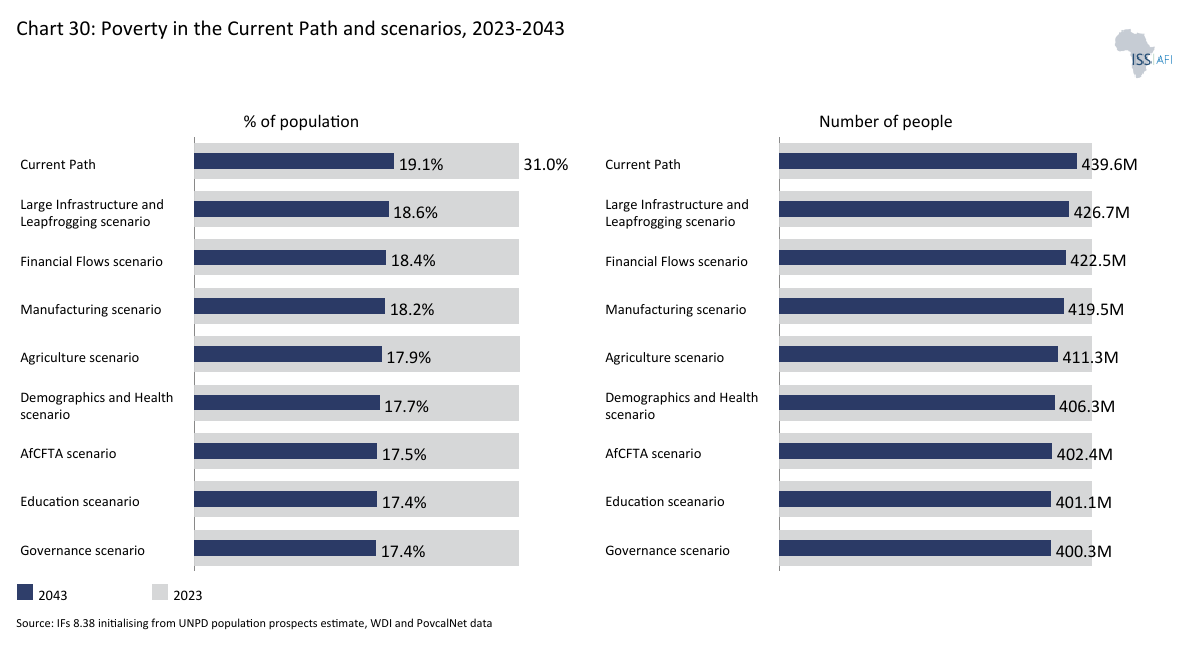
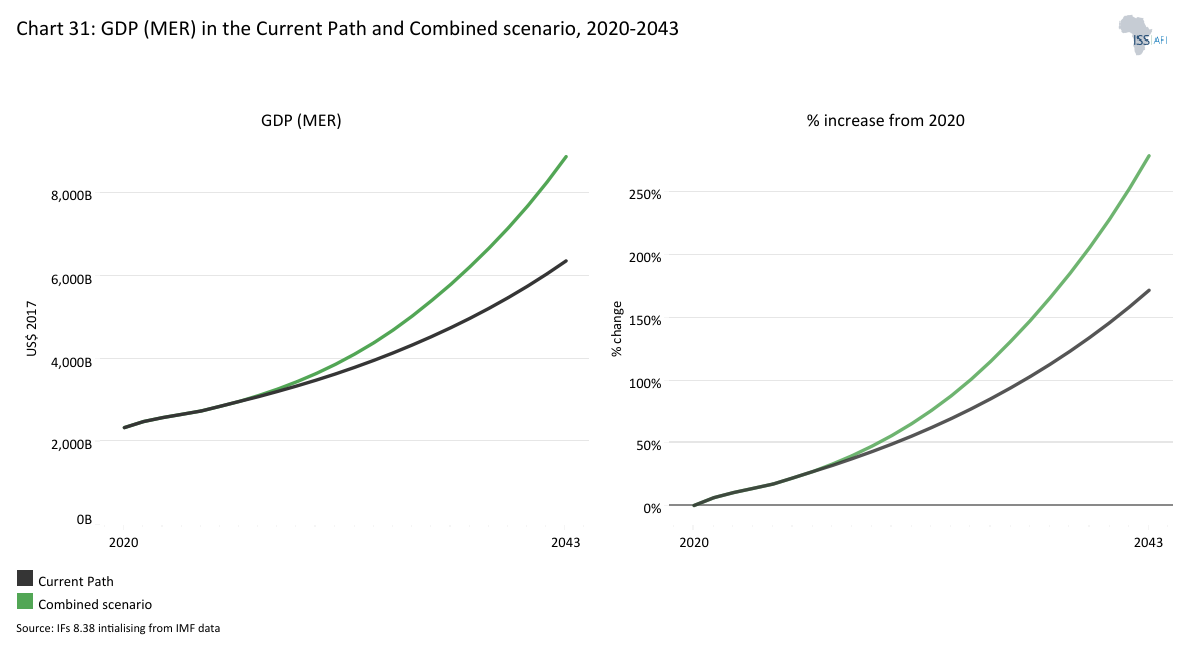
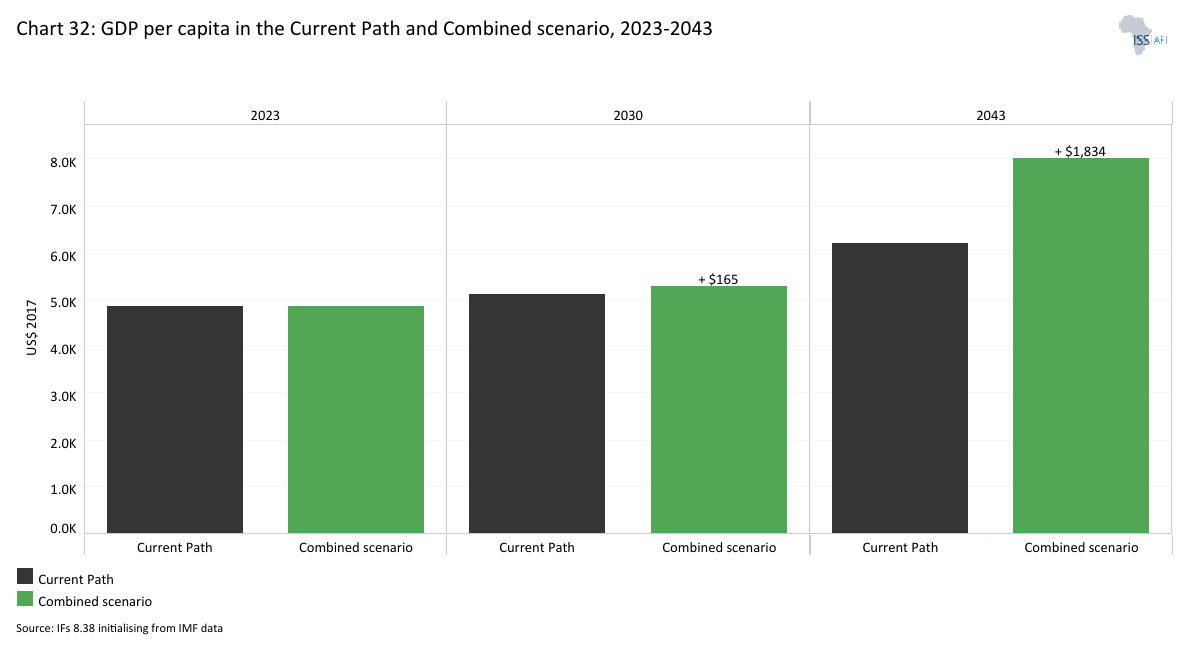
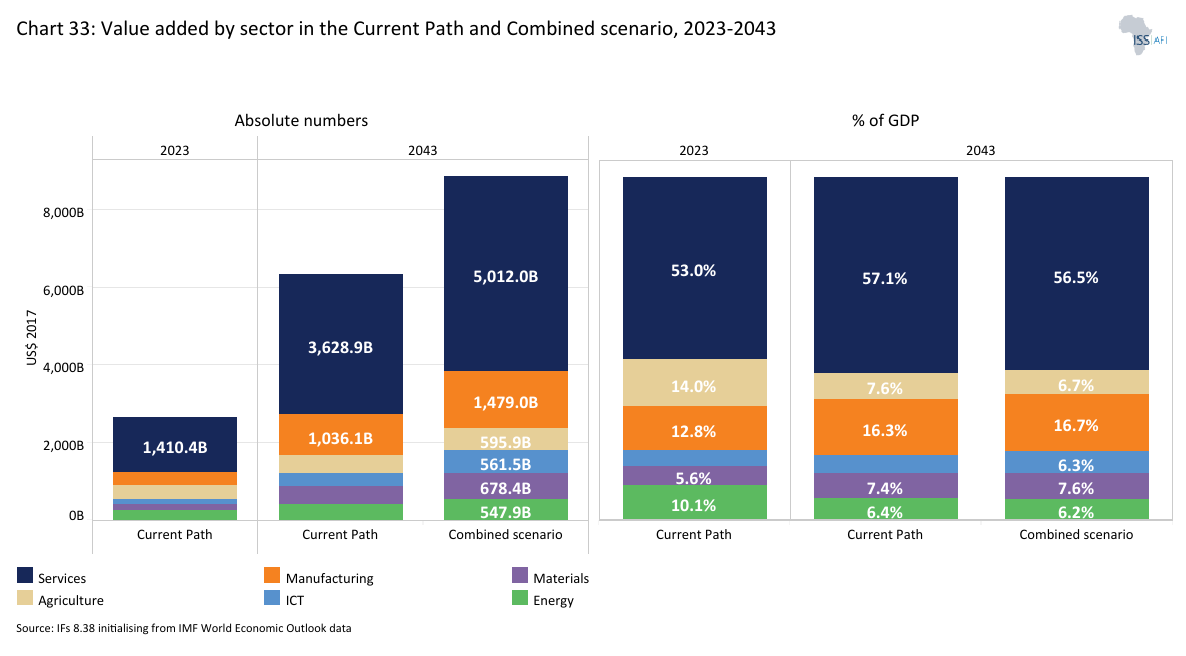
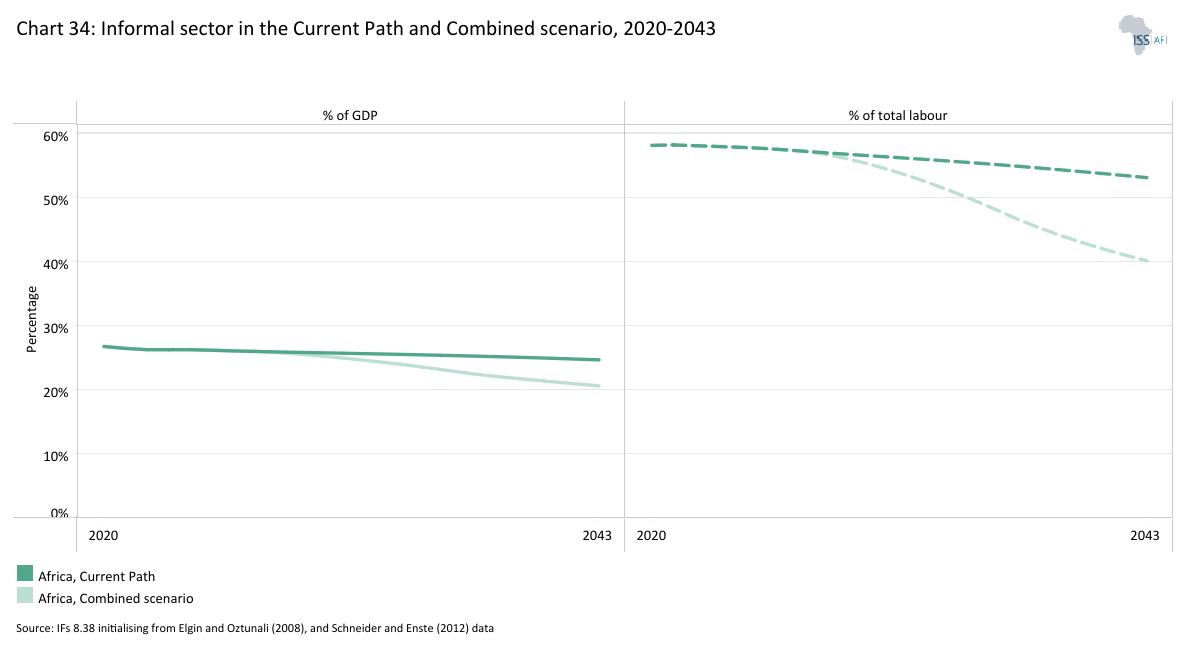
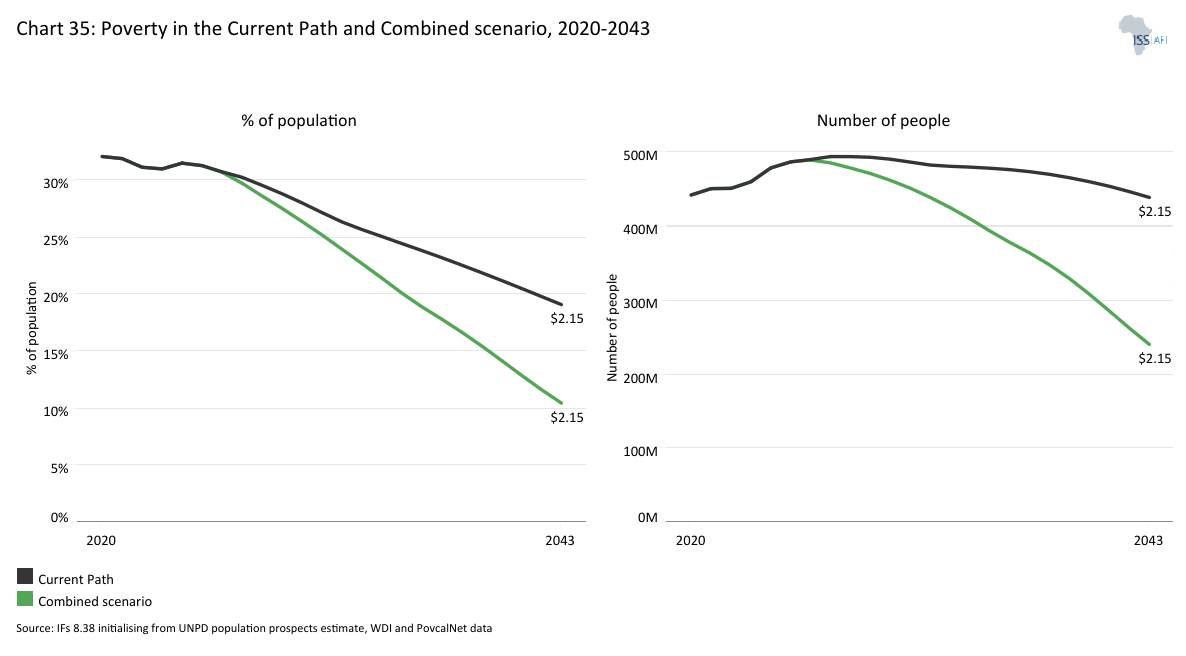
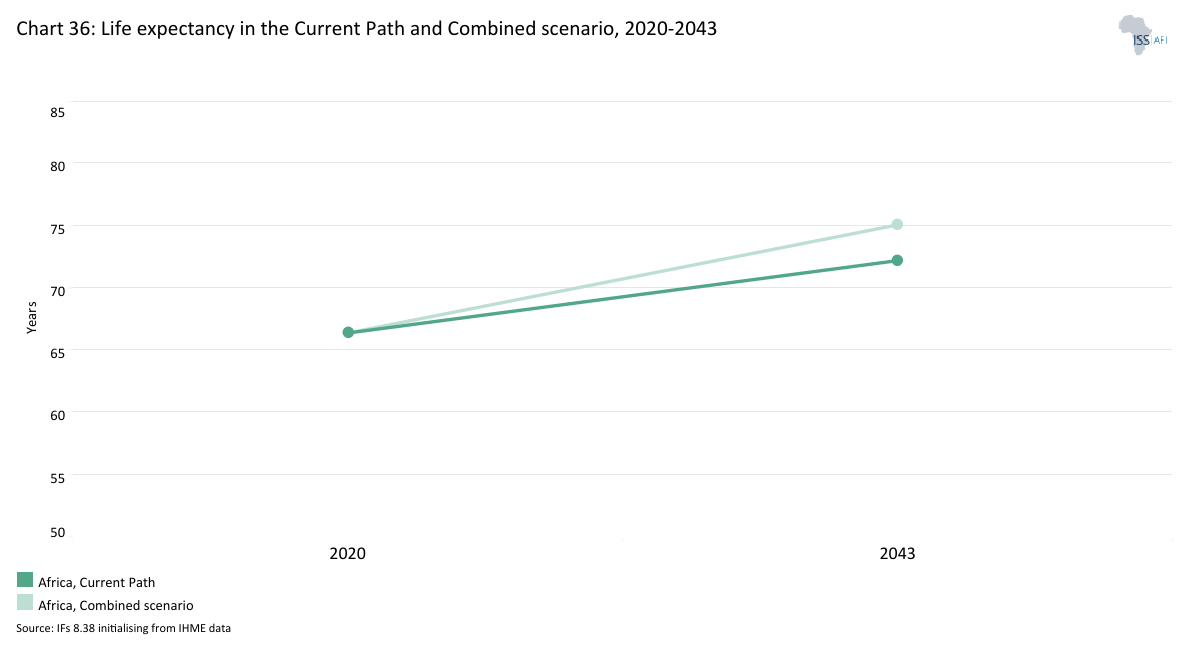
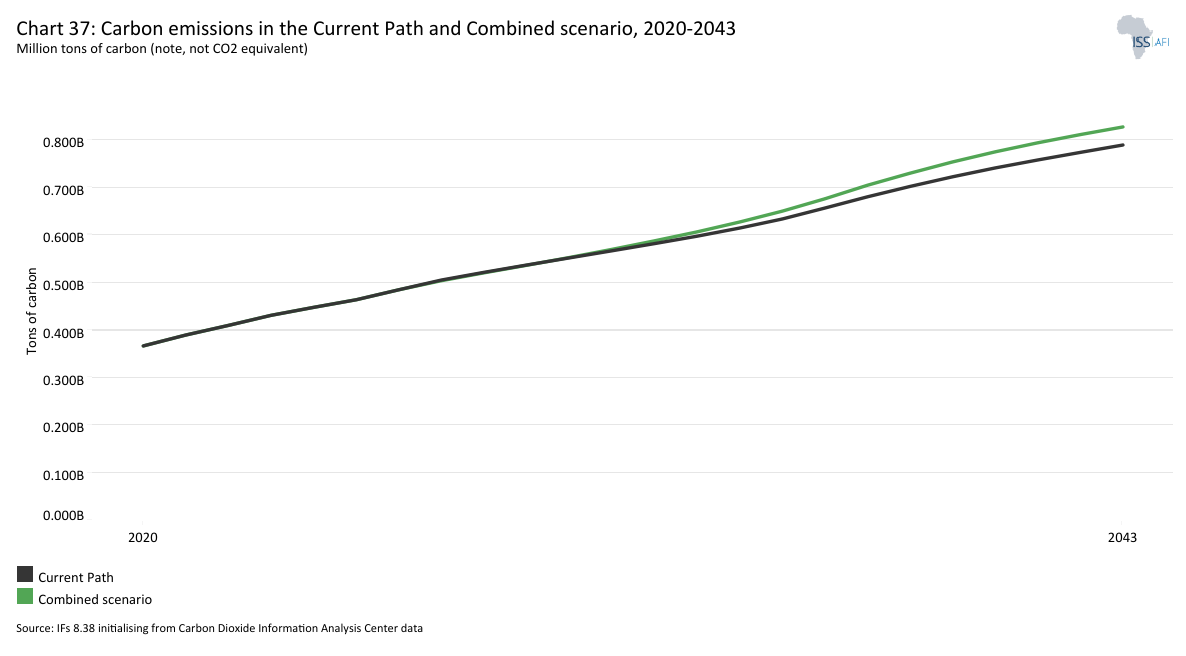
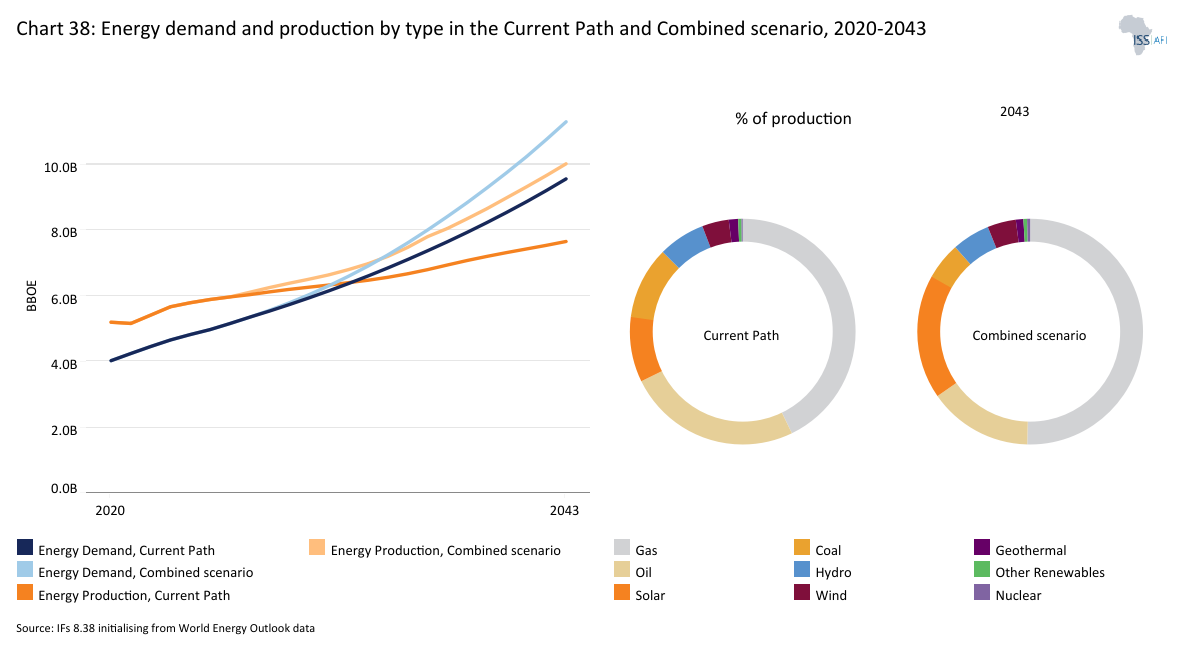
Chart 1 is a political map of Africa.
Africa is the world’s second-largest continent after Asia, spanning about 30.37 million km² or roughly 20% of Earth’s land area. Geographically, it straddles the Equator and is bounded by the Mediterranean Sea to the north, the Red Sea and Indian Ocean to the east, and the Atlantic Ocean to the west. The continent stretches about 8 000 km north-south and 7 400 km east-west.
Africa’s northern extremity reaches into the temperate zone, but most of the landmass lies in tropical latitudes, giving rise to generally warm climates. The Sahara Desert dominates northern Africa, at around 8.6-9 million km², it is the world’s largest hot desert, spanning from the Atlantic coast to the Red Sea. In contrast, equatorial Africa is home to lush rainforests; the Congo Basin rainforest is the planet’s second-largest after the Amazon, covering roughly 300 million hectares (3 million km²).
Between these extremes lie the Sahel (a semi-arid belt south of the Sahara) and vast savanna grasslands. Major mountain highlands punctuate the continent, especially along the Great Rift Valley in the east. Mount Kilimanjaro in Tanzania rises to 5 895 m, the highest point in Africa, while the Atlas Mountains of the northwest and Ethiopia’s highlands are other prominent uplands. Africa’s longest rivers have been cradles of civilisation: the Nile River (6 650 km) is the longest in the world, flowing northward through 11 countries to the Mediterranean, and the Congo River (about 4 700 km) is the second-longest in Africa and by far the most voluminous, draining the continent’s largest basin into the Atlantic. Other major rivers include West Africa’s Niger (approximately 4 180 km) and Southern Africa’s Zambezi (approximately 2 574 km, featuring Victoria Falls).
Africa’s diverse terrain also encompasses the Kalahari and Namib Deserts in the south, the volcanic Great Lakes region (with Lake Victoria as Africa’s largest lake), and a generally elevated plateau that gives the continent an average altitude higher than that of Europe. This rich physical geography underpins Africa’s biodiversity, from rainforests teeming with species to savannas supporting the continent’s iconic megafauna, while also posing challenges such as arid expanses and limited natural harbours (Africa’s coastline, though long, has relatively few deep indentations).
Administratively, Africa is divided into 54 internationally recognised sovereign countries (all members of the United Nations), along with a handful of territories or disputed areas (the African Union, a continental body, counts 55 member states, including the Sahrawi Arab Democratic Republic/Western Sahara). These modern states are largely a legacy of colonial history. By the late 19th century, the “Scramble for Africa,” European powers partitioned nearly the entire continent into colonies. All but two African countries, Liberia and Ethiopia, were under colonial rule in the early 20th century.
After World War II, decolonisation swept the continent: beginning in the 1950s, dozens of nations attained independence (the 1960 “Year of Africa” saw 17 new countries). By the late 1970s, most of today’s African states were sovereign. The newest African country is South Sudan, which gained independence in 2011. Crucially, the post-colonial leaders upheld the colonial borders to avoid endless territorial disputes, despite those borders often cutting across ethnic or historical lines. This has left Africa with a patchwork of states varying greatly in size and shape, from Algeria (the largest by area, 2.38 million km²) and the DR Congo to island microstates like Seychelles (455 km²). Population distribution is likewise uneven: Nigeria, for example, has over 220 million people (Africa’s most populous nation), whereas several Saharan countries and small islands have under 2 million each.
Today, all African states (including the contested Western Sahara) are members of the African Union (AU), which was founded (as the OAU) in 1963 to promote unity and development. Many countries also cooperate through regional blocs. For instance, 12 West African nations form ECOWAS, and 16 Southern African nations comprise the Southern African Development Community (SADC). These and other Regional Economic Communities (East African Community, the Intergovernmental Authority on Development (IGAD), etc.) facilitate economic and political coordination across sub-regions.
Regarding internal governance, most African countries are unitary states with central governments subdividing the country into provinces or regions for administration. A few are federations, notably Nigeria’s 36 states and Ethiopia’s ethnically based regions, granting substantial autonomy to subnational units. Capital cities and major administrative centres are spread throughout the continent, with Cairo, Lagos, Kinshasa and Johannesburg among the largest urban agglomerations. Politically, Africa’s nations exhibit a range of systems from long-standing multiparty democracies (e.g. Ghana, Senegal) to authoritarian regimes or fragile states, often reflecting the varied post-independence trajectories. Nonetheless, Africa has seen an expansion of democratic institutions since the 1990s, alongside efforts to resolve conflicts and improve governance through AU initiatives.
Africa’s countries span the full spectrum of development levels, but overall, the continent remains the least economically affluent major region. A majority of the world’s low-income countries are in Africa. The World Bank classified 22 African countries as low-income in 2023. This accounts for almost 41% of Africa’s states and over 80% of all low-income states globally. By contrast, South Asia, a region of eight countries often compared to Africa, has reduced its share of low-income economies from 100% in 1987 to just 13% in 2023. Twenty-three African nations were in the lower-middle-income bracket, while only eight (Algeria, Botswana, Equatorial Guinea, Gabon, Libya, Mauritius, Namibia and South Africa) were upper-middle-income. Only Seychelles qualified as a high-income economy by World Bank criteria. This means Africa has the fewest high-income countries of any continent. Overall, Africa’s GDP per capita remains well below the global average, reflecting challenges such as limited industrialisation, infrastructure gaps, financial constraints and historical inequalities. However, there is significant variation: for example, small resource-rich states (like Gabon or Botswana) enjoy per capita incomes far above those of large, impoverished countries (like Burundi or Niger).
Africa’s cultural and linguistic diversity is unparalleled. The continent is home to an estimated 1 500 to 3 000 languages, roughly one-third of all languages on Earth. These fall into four major language families: Afro-Asiatic (around 200 languages across North Africa and the Horn, including Arabic, Amharic, Somali, Hausa), Niger-Congo (the largest group, over 1 000 languages widespread in West, Central and Southern Africa, notably the Bantu languages like Swahili, Yoruba, Igbo, Zulu), Nilo-Saharan (around 140 languages in pockets of the Sahara and East-Central Africa, e.g. Dinka, Kanuri) and Khoisan (a few dozen click-based languages in Southern Africa).
In addition, due to colonisation, European languages serve as official tongues in many countries. English is an official language in 23 African countries, French in 21, Arabic in 13, Portuguese in 6, Spanish in one and Swahili in at least 4. Most African states are multilingual, often recognising an indigenous lingua franca alongside a colonial language for government and education. For example, Swahili (Kiswahili), an indigenous pan-African lingua franca, is widely spoken in East Africa and was recently added as an official language of the African Union.
Other widely spoken African languages include Arabic (in North Africa and the Sahel), Amharic (Ethiopia), Yoruba and Igbo (Nigeria), Fulani (across the Sahel), Oromo (Horn of Africa) and many others, each with tens of millions of speakers. This mosaic of languages can be a developmental challenge (for instance, less than 20% of students in Francophone Africa are taught in their mother tongue). Still, it is also a rich cultural heritage. Efforts are underway to promote bilingual education and preserve endangered African languages.
Parallel to its linguistic variety, Africa’s ethnic composition is extraordinarily diverse. There are over 3 000 distinct ethnic groups across the continent. By comparison, no African country (except possibly Somalia or Swaziland) is ethnically homogeneous. Most nations comprise dozens of ethnic communities; Nigeria alone has over 250 ethnic groups, DR Congo over 200, while Tanzania has more than 100 distinct groups. These groups range in size from millions-strong peoples like the Arabs of North Africa, Hausa of West Africa, Yoruba and Igbo of Nigeria, Oromo and Amhara of Ethiopia, or Bantu clusters (e.g. Shona, Zulu, Luba), to small indigenous communities numbering only a few thousand. Ethnicity, defined by shared language, culture and ancestry, remains a key identity marker for most Africans, alongside nationality.
This enormous diversity is a source of cultural richness (manifested in Africa’s variety of traditions, music, art and social structures) but also a source of social complexity and potential tension. Colonial-era borders often grouped disparate peoples into one state or split the same ethnic group across countries, sometimes contributing to ethno-political rivalries. Several of Africa’s post-independence conflicts have had ethnic dimensions, from Nigeria’s Biafra war in the 1960s to inter-ethnic violence in Rwanda, Sudan, the Ivory Coast and others. That said, most African countries have also seen long periods of peaceful coexistence among their ethnic groups, and national identities have strengthened over time. Many governments maintain a delicate balance of power among major communities, and regional organisations like the AU emphasise non-discrimination and inclusivity.
Religiously, Africa is also diverse but largely dominated by Christianity and Islam, with roughly 45% of Africans Christian and 40% Muslim, plus sizable adherents of indigenous traditional beliefs. The religious mix often correlates with geography (for example, North Africa and the Sahel are predominantly Muslim, and sub-Saharan Africa is predominantly Christian except in the Horn and parts of West Africa). Importantly, religious and ethnic identities sometimes overlap; for example, Arab and Berber populations in the north are mostly Muslim, while many Bantu groups in southern Africa are Christian, but in other cases they cut across each other (Nigeria has both Christian and Muslim Yoruba and other groups). This pluralistic tapestry of ethnicities, languages and faiths makes Africa a continent of immense cultural complexity. Pan-African institutions often celebrate this diversity as a strength, even as they acknowledge its practical challenges for unity and development.
In summary, Africa’s political map, with its intricate blend of geographical features, colonial legacies, socio-economic disparities and cultural pluralism, provides the essential context for understanding the continent’s current development path and prospects.
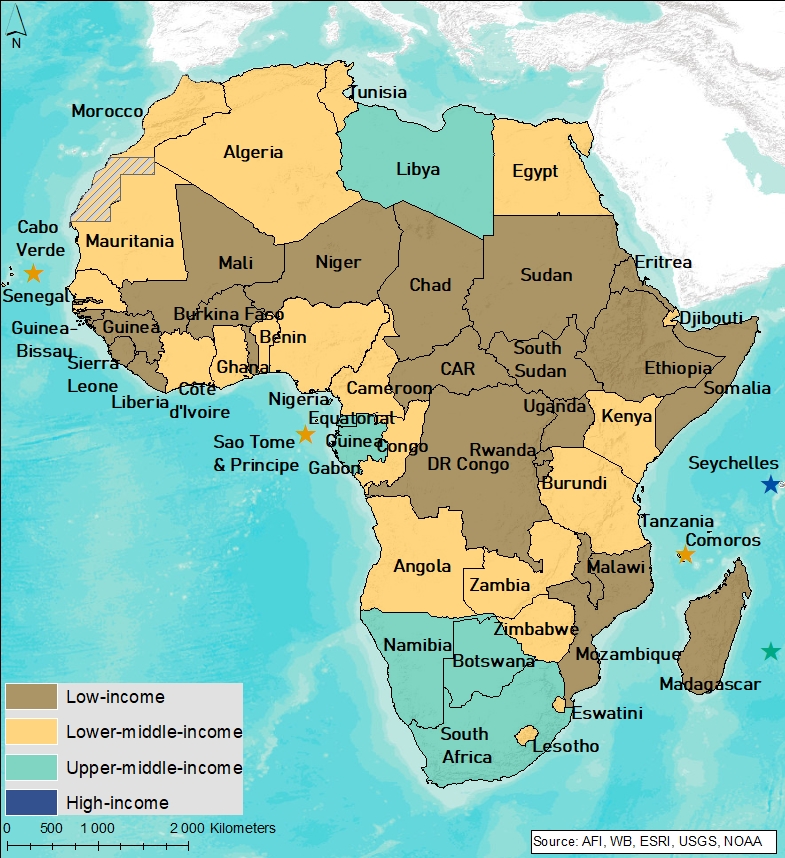
Chart 2 presents the population structure from 2020 to 2043 in the Current Path.
Africa’s population has been growing faster than that of any other region, rising from about 644 million people in 1990 to roughly 1.5 billion in 2024. This represents nearly 18% of the world’s population, up from just 12% in 1990. The Current Path indicates that Africa’s population will continue to expand rapidly, reaching approximately 2.3 billion by 2043. By comparison, South Asia’s population (currently about 2.0 billion) is slightly larger today but growing more slowly. Africa is on course to overtake South Asia in total population around the middle of the century due to its higher growth rate. The United Nations forecasts that more than a quarter of the world’s people will be African by 2050, underscoring Africa’s demographic weight in the coming decades.
Africa is demographically the world’s youngest continent, with a median age of less than 20 years, far lower than that of any other region. In 2019, the median age in Africa was 19.7 years, compared to 31 years in South America and about 27 years in Southern Asia. This youthful age structure is reflected in the very large share of children in Africa’s population. As of 2023, an estimated 40% of Africans were under the age of 15, compared to about 25% of the global population being under 15 years. South Asia’s population is also youthful but somewhat older, with a median age in the late 20s and a smaller proportion of children due to faster fertility decline. Latin America’s demographic transition is even more advanced: its median age is now 31.7 years, up from 18 years in 1950, and only about 22% of Latin Americans are under 15. These comparisons highlight that Africa stands out for its youthful demographic profile, which brings opportunities and challenges. On one hand, a young population can energise a continent’s workforce and consumer base; on the other, it creates immense demand for basic services like education, healthcare and jobs for the growing ranks of youth.
Africa’s age structure is gradually evolving as the continent undergoes a slow demographic transition. Under the Current Path, the share of children will decline over time, even as absolute numbers still increase. By 2043, children under 15 will make up roughly one-third of Africa’s population, indicating a slowly narrowing base of the population pyramid. This decline is driven by falling fertility rates and improved child survival. Africa’s total fertility rate (TFR), which is the average number of children per woman, has begun to decrease from very high levels. It fell from about 6.6 in 1960 to 3.8 in 2024, and will drop to about 3.2 by 2043 under the Current Path. Nevertheless, African fertility remains high compared to other regions. For example, South Asia’s TFR is around 2.2 (near the replacement level) and in Latin America it is even lower at about 1.8.
Africa’s higher birth rates mean its population will continue growing faster and longer than elsewhere. In fact, five of the eight countries expected to account for over half of global population growth through 2050 are in Africa. In short, Africa’s demographic transition is in progress but lags behind peer regions: fertility is declining gradually and more children are surviving to adulthood, which will slowly reduce the youth dependency burden in the decades ahead. However, until fertility falls further, the continent’s population momentum will remain strong and will keep adding large numbers of people each year, even as growth slows modestly.
The share of the working-age population (15–64 years) is rising due to these trends. In 2023, about 56% of Africans were of working age, up from roughly 50% in the 1980s. In other words, the dependency ratio (the ratio of children and elderly to working-age adults) will improve over the next two decades. This is a positive development because a higher working-age share creates the potential for a demographic dividend, boosting economic growth when more people are in the labour force relative to dependants. By 2043, Africa’s working-age bracket will reach about 61% of the population under the Current Path, which is equivalent to roughly 1.6 working-age persons per dependant, inching closer to the threshold of 1.7 workers per dependant often seen as necessary to decisively reap a first demographic dividend. For context, the global average today is about 67% working-age (around two workers per dependant), a level that East Asia and Latin America have already surpassed. Africa is moving in the same direction: the number of dependants per adult is slowly falling. The labour force is set to expand substantially. Africa’s working-age population is projected to roughly double by 2050, which could fuel faster economic growth if those people can be productively employed.
Africa will also see growth in its elderly population. Though the share of elders remains small, the proportion of people aged 65 and above will rise from about 3.7% in 2023 to around 5.4% by 2043. Life expectancy on the continent will rise from 66 years in 2024 to 72.2 years by 2043 under the Current Path. This greying of the population is modest compared to other regions; Europe and East Asia have over 15% of their population above 65 years, but it signals an emerging need for policies and programs to support an ageing cohort. Healthcare systems and social services in Africa will increasingly need to cater to the elderly even as they continue to focus on the young. Improving pension systems, elderly healthcare and social safety nets will become more important as the absolute number of African seniors grows.
Overall, Africa’s evolving population structure presents a two-sided dynamic for policymakers. On one side is the promise of a massive working-age cohort that, if equipped with skills and jobs, can significantly boost productivity and development, the so-called demographic dividend. On the other side is the sobering reality that this dividend is not automatic. The swelling ranks of youth and young adults will put tremendous pressure on job creation, education and health services in the near term. Many African economies already struggle with high youth unemployment and underemployment, challenges that could intensify if economic growth and job creation do not keep pace with labour force growth.
The next 20 years are thus a critical period to implement policies that accelerate the demographic transition and harness its benefits. These include investing in girls’ education, expanding access to family planning, improving child survival and health, and stimulating economic sectors that can absorb young workers. Such measures can help to speed up the decline in fertility and enhance the productivity of the future workforce. Without sufficient investment in human capital and economic opportunities, the demographic dividend could be deferred or missed, leaving a large youth population frustrated by a lack of prospects.
Chart 3 presents a population density map of Africa for 2023.
Africa’s population distribution reflects a complex interplay of geography, economic opportunity and historical settlement patterns. The continent’s 1.5 billion people are unevenly spread, with significant concentrations in the fertile river basins, coastal zones, megacities and highland regions. The Nile Valley, the West African coastal belt and the Great Lakes region are among the most densely populated areas. At the same time, vast expanses such as the Sahara Desert, the Kalahari Desert and parts of the Sahel remain sparsely inhabited due to harsh climatic conditions.
Urbanisation continues to reshape Africa’s demographic landscape, with megacities such as Lagos, Cairo, Kinshasa, Johannesburg and Nairobi emerging as critical hubs of economic activity and migration. In 2023, the continent’s average urbanisation rate was about 45%, but this masks sharp contrasts across income groups and regions. North Africa is the most urbanised while upper-middle-income countries, such as those in Southern Africa, generally also record higher urbanisation levels, often above 65%, while low-income, primarily agrarian economies in Central and East Africa remain predominantly rural.
Regional differences are pronounced. North Africa exhibits dense populations along Mediterranean coasts and river valleys. At the same time, West Africa has large rural populations and rapidly growing urban clusters along trade corridors from Abidjan to Lagos. East Africa shows high rural density in fertile highlands, particularly in Ethiopia, Rwanda and Uganda. At the same time, Southern Africa is more urbanised, with population spread influenced by mining, industry and service hubs.
Compared with South Asia, Africa has a lower overall population density, around 52 people per square kilometre versus South Asia’s 308. However, its urban centres are growing faster in relative terms, reflecting accelerating rural-to-urban migration. Similarly, South America shows a more even spread of urbanisation across its territory. In contrast, Africa’s population distribution remains heavily concentrated in specific ecological and economic zones, leaving large areas sparsely populated.
From a policy perspective, the population distribution and rapid urbanisation rates underscore the need for spatial planning, infrastructure investment and regional economic integration to balance development between densely populated urban areas and underserved rural and semi-arid regions. This requires targeted investments in urban planning, transport corridors, energy access and digital connectivity to bridge geographic divides and unlock the full economic potential of both urban growth poles and rural economies.
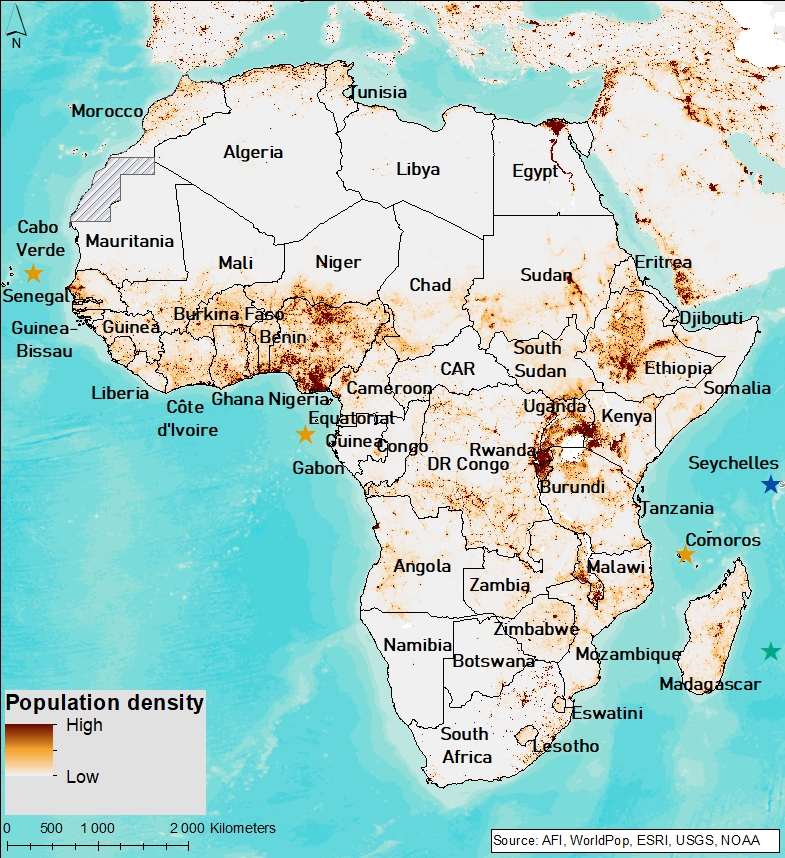
Chart 4 presents the proportion of the population living in urban and rural areas between 1990 and 2043 in the Current Path.
Africa has undergone a steady and transformative urbanisation process over the past three decades. The proportion of people living in urban areas has risen from approximately 31% in 1990 to 45% in May 2025, driven by rural-to-urban migration, natural urban population growth and the expansion of secondary cities. This trend will continue under the Current Path, with the level of urbanisation surpassing 50% around 2037/38 and reaching 52.1% by 2043. From a comparative perspective, Africa’s levels of urbanisation are lower than South America’s, which is currently over 80%, but is converging toward Asia’s, which is currently 53% (albeit with greater variation between countries and regions).
Africa’s urbanisation will advance across all income groups, but at different speeds and from different baselines. Upper-middle-income African countries will remain the most urbanised, increasing from nearly 70% in 2023 to 76.5% in 2043, reflecting both their mature urban systems and continued economic pull of metropolitan centres. Lower-middle-income countries will see urbanisation rise from 49.2% to almost 58% over the same period, driven by industrialisation corridors, agricultural transformation and expanding services sectors. Low-income countries, although starting from a low base, will also experience a notable shift, from 32.5% in 2023 to 41.6% in 2043, as demographic pressures, infrastructure investment and climate-related livelihood changes accelerate migration to towns and cities.
Despite these trends, rural populations will continue to grow in absolute terms in many parts of Africa, especially in low-income countries where agriculture remains the primary livelihood, keeping pressure on rural services and livelihoods. This dual growth of urban and rural populations poses a spatial planning challenge. Urban centres require large-scale infrastructure upgrades, affordable housing and job creation strategies. At the same time, rural regions will need sustained investment in connectivity, agricultural value chains and essential services to prevent uneven development and rising inequality.
Harnessing the economic potential of this urban transition, while avoiding the pitfalls of unplanned growth, will be central to achieving Agenda 2063 targets for inclusive and sustainable development and SDG 11 on sustainable cities. However, as rapid urbanisation coexists with expanding absolute rural populations in many low-income countries, policy priorities therefore need to balance city-region investments (mass transit, affordable housing, resilient infrastructure, serviced land and municipal finance reforms) with rural connectivity and basic services (all-weather roads, digital links, electricity, water and sanitation) to avoid widening spatial inequality. This is consistent with the AfDB’s High 5s (“Improve the quality of life,” “Integrate Africa,” “Industrialise Africa”, “Feed Africa” and “Light up and Power Africa”) and with removing logistics bottlenecks to unlock the African Continental Free Trade Area (AfCFTA) market access for firms in both metropolitan and hinterland locations.
Chart 5 presents a stacked area graph that includes each country in Africa’s economy from 1990 with a forecast to 2043, including the associated growth rate.
Africa’s economy has expanded substantially over the past three decades, with GDP at market exchange rates (MER) rising from almost US$1 trillion in 1990 to US$2.66 trillion in 2023, representing an average annual growth rate of 3.3%. Under the Current Path, GDP (MER) will more than double, reaching US$6.36 trillion by 2043, with average annual growth accelerating to 4.6% between 2024 and 2043. While this trajectory reflects steady progress, it remains below the 7% annual growth target envisioned in the African Union’s Agenda 2063 for achieving inclusive and sustainable prosperity.
Growth patterns differ markedly across income groups. The Current Path suggests that low-income countries will outpace all others, expanding at an average rate of 6.31% annually between 2024 and 2043, a reflection of the catch-up effect, rapid urbanisation and demographic momentum, followed by lower-middle-income economies at 4.65%, and upper-middle-income countries at 2.57%. The catch-up dynamic is consistent with Agenda 2063 and AfDB’s High 5 priorities, which emphasise accelerated growth in the least-developed economies through industrialisation, agricultural transformation and infrastructure-led integration.
Africa’s average growth has often trailed developing Asia, particularly South Asia, which the World Bank and IMF forecast to maintain the highest growth rates globally, about 5.8% in 2025 and averaging 6.2% in 2026-27, driven by strong private investment, large domestic markets and diversified exports. In contrast, Latin America and the Caribbean (LAC) are forecasted to grow by a modest 2.3-2.5%, constrained by low productivity growth, political uncertainty and structural rigidities. This positioning leaves Africa between a high-performing Asia and a slower-growing LAC, but with much greater volatility due to commodity dependence and recurrent shocks.
Africa’s growth trajectory is shaped by a complex interplay of structural drivers and persistent constraints. The continent’s youthful demographics and rapid urbanisation are expanding domestic markets and labour supply, offering the potential for a demographic dividend similar to that once leveraged in parts of East and South Asia. However, unlike South Asia, which is further along in its fertility transition, Africa’s demographic window will only open fully with substantial investments in education, healthcare and job creation.
Economic performance is further constrained by heavy commodity dependence, with over half of African economies classified as commodity-dependent by UNCTAD, exposing them to price volatility and external shocks, a stark contrast to South Asia’s manufacturing- and services-led model and parts of Latin America with more diversified export baskets. Infrastructure and investment gaps, particularly in energy, transport and digital connectivity remain significant, keeping productivity low and trade costs high.
While Africa leads globally in mobile-money penetration, according to Global Findex, access to long-term credit and capital, particularly for small to medium enterprises (SMEs) and infrastructure, remains limited compared to South Asia and LAC. The AfCFTA offers a unique opportunity to reshape the continent’s growth model by boosting intra-African trade and building regional value chains. However, realising this potential requires accelerated investment in connecting infrastructure, industrial capacity, harmonised standards and stronger trade facilitation.
Africa’s growth potential is high, but its trajectory remains volatile. To match South Asia’s pace and structurally outpace LAC, the continent must diversify exports, strengthen governance, deepen regional integration, accelerate infrastructure development, mobilise private capital and invest in human capital at scale. These priorities are central to policy frameworks such as the Agenda 2063 First and Second Ten-Year Implementation Plans (FTYIP and STYIP, the AfCFTA, the Programme Infrastructure Development for Africa (PIDA), and strategies of regional economic communities. Implementing these measures would help unlock the demographic dividend, raise productivity and sustain higher growth rates. Without decisive action, Africa risks falling short of its potential, particularly when compared to peer regions that have successfully harnessed structural transformation to achieve rapid and sustained development.
Chart 6 presents the size of the informal economy as a per cent of GDP and in absolute terms, as well as the per cent of total non-agriculture labour involved in the informal economy, from 2020 to 2043.
In 2023, Africa’s informal sector accounted for 26.3% of GDP, nearly double the share observed in South Asia (approximately 14%) and South America (about 13%), and employed almost 58% of the labour force, a rate between that of South America (approximately 44.7%) and South Asia (almost 78%). Under the Current Path, this contribution will decline modestly to 24.7% of GDP and 53.1% of employment by 2043, signalling gradual structural transformation but leaving informality entrenched as a dominant labour market feature.
Informality is more pronounced across Africa’s income groups in lower-middle-income and low-income countries. In 2023, informal GDP shares stood at 30.6% and 31.7% for these groups, respectively, compared with just 14.7% for upper-middle-income countries. Under the Current Path, these figures will fall to approximately 27% for lower-middle-income, 28.2% for low-income and 13.8% for upper-middle-income economies by 2043. Employment patterns follow a similar trend: upper-middle-income countries’ informal employment will remain relatively low, inching up from 22.7% in 2023 to 23.4% in 2043, while lower-middle-income and low-income countries will see declines from 57.5% to 54.2% and approximately 66% to 56.5%, respectively.
Africa’s slower pace of economic formalisation reflects a combination of labour market informality traps, weak industrial absorption capacity and the persistence of subsistence and low-productivity service activities. While South America has reduced informality through stronger social protection, tax reform and industrial upgrading, and South Asia is benefiting from export-oriented manufacturing, Africa’s path has been constrained by low levels of human capacity development, poor infrastructure, underdeveloped manufacturing bases, inadequate SME financing and regulatory burdens.
Upper-middle-income African countries are best positioned to reach South American informality levels (less than 13% GDP share) before 2043, provided they expand SME formalisation incentives, digitise business registration systems and implement targeted tax reforms. Lower-middle-income countries could make substantial gains if they integrate regional value chains, supported by targeted skills development, export-oriented industrial policy and the digitalisation of microfinance. For low-income countries, foundational reforms, such as investing in agro-processing hubs, expanding basic infrastructure and strengthening social safety nets, are essential to shift large informal agricultural labour pools into semi-formal manufacturing and services.
Across all income groups, aligning formalisation strategies with Agenda 2063’s industrialisation and inclusive growth targets will be critical to maximising fiscal revenue, boosting productivity and sustaining poverty reduction. Key policy guidance can be drawn from the AU’s Labour Migration Governance Framework, which supports cross-border labour mobility and formal sector opportunities, and the ILO’s Recommendation No. 204 on transitioning from the informal to the formal economy, which provides direction on legal, institutional and social protection reforms. Together, these frameworks emphasise the need for labour-intensive manufacturing, targeted skills upgrading, digitalisation of microenterprises and expanded social protection coverage. These interventions can reduce vulnerability, increase productivity and create stronger incentives for formal participation across Africa’s diverse economies.
Chart 7 depicts GDP per capita in the Current Path from 1990 to 2043.
Africa’s GDP per capita, measured in purchasing power parity (PPP), increased from US$3 790 in 1990 to US$4 850 in 2023, reflecting an average annual growth rate of just 0.8%. This rate is significantly lower than that of peer regions, 3.7% in South Asia and 1.1% in South America over the same period. Africa now has the lowest GDP per capita of the three regions, having been overtaken by South Asia in 2014. In 2023, South Asia’s GDP per capita reached US$6 560, while South America’s was US$14 780. Under the Current Path, Africa’s per capita income will grow slowly, at 1.2% annually, to US$6 210 by 2043, still trailing its peers, South Asia at 2.8% and South America at 1.5% over the 2024-2043 period because of rapid population growth, modest economic growth rates and relatively high levels of inequality.
The average GDP per capita for upper-middle-income African countries will expand from US$13 000 in 2023 to US$14 870 by 2043 at just 0.68% annually, roughly matching South America’s current average. The average for lower-middle-income countries will grow from US$5 880 to US$7 650 at 1.4% annually. In contrast, that for low-income countries will expand fastest, from US$1 850 to US$3 060 at 2.5% annually, reflecting catch-up effects from a low base, a pattern consistent with the convergence hypothesis in growth theory.
This modest per capita income growth is shaped by enabling factors and structural bottlenecks. On the positive side, Africa’s demographic profile, resource endowments and rapid urbanisation create a foundation for market expansion, industrialisation and agglomeration economies. Regional integration through the AfCFTA and the spread of digital innovation, especially mobile financial services, offer potential productivity gains and inclusion benefits, echoing McMillan and Rodrik’s findings on structural change as a growth driver.
However, these merits are offset by deep-seated constraints: low productivity in agriculture and manufacturing, overreliance on volatile commodity exports, infrastructure deficits in energy, transport and logistics, and acute skills mismatches. Persistent governance challenges, political instability and climate vulnerabilities further undermine resilience and deter investment, reflecting the institutional quality-growth nexus highlighted in Robinson and Acemoglu’s work.
The Current Path trajectory falls short of the African Union’s Agenda 2063 and the African Development Bank’s High 5s, aiming for sustained, inclusive and high-growth pathways that would elevate most African countries to upper-middle- or high-income status by mid-century. Achieving these ambitions requires accelerating structural transformation through industrial policy and value addition, strengthening human capital via universal education and healthcare (SDGs 3 and 4), investing in renewable energy and digital infrastructure to lower costs and increase competitiveness, and mainstreaming climate resilience into economic planning. Without these interventions, Africa risks maintaining a growth path that narrows, but does not close, the per capita income gap with South Asia and South America.
Chart 8 presents extreme poverty as per cent and total numbers of the population for the Current Path, from 2020 to 2043.
In 2022, the World Bank updated the poverty lines to 2017 constant dollar values as follows:
- The previous US$1.90 extreme poverty line is now set at US$2.15, also for use with low-income countries.
- US$3.20 for lower-middle-income countries, now US$3.65 in 2017 values.
- US$5.50 for upper-middle-income countries, now US$6.85 in 2017 values.
- US$22.70 for high-income countries. The Bank has not yet announced the new poverty line in 2017 US$ prices for high-income countries.
Monetary poverty only tells part of the story, however. In addition, the global Multidimensional Poverty Index (MPI) measures acute multidimensional poverty by measuring each person’s overlapping deprivations across ten indicators in three equally weighted dimensions: health, education and standard of living. The MPI complements the international US$2.15 a day poverty rate by identifying who is multidimensionally poor and also shows the composition of multidimensional poverty. The headcount or incidence of multidimensional poverty is often several percentage points higher than that of monetary poverty. This implies that individuals living above the monetary poverty line may still suffer deprivations in health, education and/or standard of living.[x]
Africa has made notable progress in reducing income poverty since the 1990s. The share of people living in extreme poverty, defined as living on less than US$2.15 per day, fell from 45.5% (293 million people) in 1990 to around 31% (461 million people) in 2023. This is a substantial improvement, but still lags behind peer regions. South Asia, for example, reduced extreme poverty from 50% in 1990 to just 9% in 2023, while South America cut its rate from 16.3% to about 3% over the same period. The Current Path suggests that Africa’s extreme poverty rate will fall to 19.1% (440 million people) by 2043, yet this will remain far above South Asia’s 2.5% and South America’s 2%, converging towards minimal rates.
The persistence of high absolute numbers, forecasted at nearly double the 1990 figure by 2043, is driven by rapid population growth, insufficient pro-poor growth strategies, relatively high levels of inequality and structural constraints in labour absorption. While most large South Asian economies have transitioned into middle-income status, many African states, especially in the Sahel and parts of Central Africa, remain trapped in cycles of low productivity, vulnerability to commodity shocks and fragility. This gap underscores the urgency for inclusive economic transformation as articulated in the African Union’s Agenda 2063 and AfDB’s High 5s, which prioritise industrialisation, economic diversification and job creation as levers for poverty eradication.
Disaggregating by income group shows the scale of the challenge. In low-income African countries, extreme poverty will decline from 44.6% in 2023 to 26.8% in 2043, but absolute numbers will stagnate at around 271 million people, peaking at 304 million around 2029–2030. In lower-middle-income countries, the extreme poverty rate will fall from 23.4% to 13.6%, with the number of poor decreasing from 175 million to 154 million. In upper-middle-income countries, poverty will drop from 11.3% to 9.3%, though numbers will edge up slightly from 14.5 million to 14.8 million. These differences highlight the asymmetric capacity of African economies to translate growth into broad-based welfare improvements.
However, monetary poverty alone does not capture the full extent of deprivation in Africa. The 2024 Global Multidimensional Poverty Index (MPI) reveals that around 52% of the population in sub-Saharan Africa lives in multidimensional poverty, far above the global average and more than double the region’s income poverty rate. This translates to roughly 544 million people deprived of health, education and living standards across 46 countries. Africa accounts for nearly half of the 1.1 billion people worldwide in acute multidimensional poverty, and more than half are children. Conflict-affected areas, such as parts of the Sahel, Sudan and the DR Congo, have the highest deprivation levels, where progress has stalled or reversed. By 2030, almost 60% of the world’s extreme poor are expected to live in conflict-affected economies, up from just over half now.
Children bear a disproportionate share of the burden; 317 million in sub-Saharan Africa are multidimensionally poor, and almost 27% of children under five suffer from severe food poverty. These overlapping deprivations create intergenerational poverty traps, where lack of nutrition, education and health care reinforce low productivity and limited economic mobility.
Multidimensional poverty remains significant even in relatively wealthier African economies. Namibia, an upper-middle-income country, has 40.9% of its population living in multidimensional poverty and another 19.2% vulnerable. In Ethiopia, despite its projected transition to middle-income status by 2025, 68.7% of the population was multidimensionally poor as of 2019. In the DR Congo, conflict and infrastructure collapse have left 3.9 million in emergency hunger and 23.8 million in crisis levels, figures that reveal poverty well beyond income measures.
Tackling poverty in Africa, therefore, requires a dual-track strategy that addresses both income and multidimensional poverty. On the income side, accelerating structural transformation through labour-intensive industrialisation, agricultural modernisation and intra-African trade via the AfCFTA is key. On the multidimensional front, investments must target universal access to healthcare, quality education, safe water, sanitation and affordable housing. In fragile contexts, this must be coupled with peacebuilding, governance reforms and climate resilience. Child-focused nutrition and social protection are critical to break intergenerational poverty traps. Aligning these interventions with Agenda 2063’s Aspiration 1 (A Prosperous Africa) and SDGs 1, 3, 4 and 8 will ensure that poverty reduction is embedded within a broader economic transformation agenda, narrowing the gap with South Asia and South America and reducing the risk of a permanent low-income equilibrium.
Chart 9 shows the Continental Development Plan.
Agenda 2063 is the continental umbrella. It sets the long-term vision, “The Africa We Want”, and is executed through successive Ten-Year Implementation Plans. The Second Ten-Year Implementation Plan (STYIP, 2024–2033) reframes this decade as one of acceleration, translating lessons from the first plan into tighter results frameworks, clearer institutional responsibilities and stronger financing and monitoring arrangements. In practice, the STYIP is the hinge: it links the high-level aspirations of Agenda 2063 to the sectoral and regional plans that actually move projects, money and regulations on the ground.
Market integration and industrialisation anchor the economic transformation agenda, and here the AfCFTA is the flagship. AfCFTA is explicitly branded by the AU as an Agenda 2063 project because dismantling tariff and non-tariff barriers, opening services markets and enabling movement of persons are the levers that turn a fragmented continent into a single production and demand base. The AU’s 2023 theme, “Acceleration of AfCFTA implementation”, underlined that linkage. Operational instruments such as the Pan-African Payments and Settlement System (PAPSS) reduce currency-conversion frictions and aim to make cross-border trade settle in local currencies. At the same time, the Single African Air Transport Market (SAATM) connects people and freight by liberalising skies, conceived as Agenda 2063 flagships that make AfCFTA tradeable in practice.
Infrastructure is the connective tissue that allows integration to translate into growth. The Programme for Infrastructure Development in Africa - Priority Action Plan (PIDA-PAP 2 for 2021–2030) curates a portfolio of regional energy, transport, digital and transboundary water projects selected to reflect Agenda 2063 priorities, using an integrated corridor approach to crowd-in private capital and lift bankability. In other words, PIDA-PAP2 is the hard-asset pathway through which Agenda 2063’s aspirations for an integrated, competitive Africa become investable projects.
Productive transformation in food systems sits under the Comprehensive Africa Agriculture Development Programme (CAADP) and the Malabo Declaration (2014–2025), which AU leaders designed to push agricultural productivity, resilience and trade as the foundation for inclusive growth. The Malabo era culminates in 2025 and is being succeeded by a Post-Malabo roadmap; both are deliberately aligned to Agenda 2063 because raising on-farm productivity, cutting food import dependence and scaling agro-processing are preconditions for broad-based industrialisation, poverty reduction and export diversification in the 2063 horizon.
Human capital, science and digital are the capability stack of Agenda 2063. The AU’s Science, Technology and Innovation Strategy for Africa 2034 (STISA-2034) is the updated science agenda meant to drive innovation-led growth and support industrial upgrading, health security and climate resilience; it is framed explicitly as a delivery instrument for Agenda 2063. In parallel, the Digital Transformation Strategy for Africa (2020–2030) provides the policy scaffolding for connectivity, data governance and digital trade, again positioned by the AU as aligned with Agenda 2063 and the SDGs, with the goal of an integrated and inclusive digital society and economy. Together, STISA-2034 and the digital strategy equip countries to exploit AfCFTA scale effects, adopt standards and build regional value chains in knowledge- and data-intensive sectors.
Climate and health security are the resilience pillars that keep growth durable along the 2063 path. The AU Climate Change and Resilient Development Strategy & Action Plan (2022–2032) is deliberately framed as an Agenda 2063 support instrument, aligning adaptation, mitigation and finance to protect development gains and open access to climate capital. On health, the Africa CDC Strategic Plan (2023–2027) operationalises the “New Public Health Order,” linking surveillance, manufacturing, workforce and regulation (via the African Medicines Agency) to Agenda 2063’s prosperity and human-development aspirations. In both domains, the message is the same: resilience is not peripheral to Agenda 2063; it is a core enabler of its macro-objectives.
Regional Economic Communities (RECs) translate Agenda 2063 into regional delivery compacts. SADC’s Vision 2050 and its Regional Indicative Strategic Development Plan (RISDP) 2020-2030 were explicitly aligned to Agenda 2063 by ministerial directive and now prioritise industrialisation, infrastructure, human capital and cross-cutting climate goals in a way that mirrors the continental plan. ECOWAS Vision 2050 likewise states its linkage to Agenda 2063 and Agenda 2030, and the EAC’s Vision 2050 and Sixth Development Strategy anchor targets in both Agenda 2063 and the SDGs while pushing trade, industrialisation and digital transformation. The net effect is a cascading architecture: from continental goals to regional strategies to national plans, improving coherence and measurability.
What does this integrated architecture imply for implementation? First, Agenda 2063 is no longer abstract: it is operationalised through AfCFTA, PIDA-PAP2, CAADP/Post-Malabo, STISA-2034, the Digital Strategy, the AU Climate Strategy and the Africa CDC plan, each with defined institutions and scorecards under the STYIP. Second, delivery depends on knitting these plans together at the point of execution, for example, using AfCFTA rules and PAPSS to make regional agro-processing investments (PIDA corridors) bankable, while STISA-2034 and the Digital Strategy build the skills and data pipes that firms need, and the Climate Strategy de-risks projects for concessional finance. Third, RECs act as the last-mile orchestrators, aligning regional regulations, logistics and standards so that national reforms add up to continental outcomes. The through-line is clear: Agenda 2063 provides the compass; the sectoral and regional plans provide the routes; and the STYIP is the dashboard that keeps the convoy on schedule.
The eight sectoral scenarios, as well as their relationship to the Current Path and the Combined scenario, are explained in the Technical page. Chart 10 summarises the approach.
Chart 11 presents the mortality distribution in 2023.
The Demographics and Health scenario envisions ambitious improvements in child and maternal mortality rates, enhanced access to modern contraception, and decreased mortality from communicable diseases (e.g., AIDS, diarrhoea, malaria, respiratory infections) and non-communicable diseases (e.g., diabetes), alongside advancements in safe water access and sanitation. This scenario assumes a swift demographic transition supported by heightened health and water, sanitation, and hygiene (WaSH) infrastructure investments.
Visit the themes on Demographics and Health/WaSH for more details on the scenario structure and interventions.
Africa’s health profile reflects a double burden of disease, persisting communicable, maternal, neonatal and nutritional conditions alongside a rapidly rising tide of non-communicable diseases (NCDs). Between 2000 and 2019, deaths from communicable, maternal, perinatal and nutritional causes declined by about 31%, from 5.9 million to 4.1 million, reflecting progress in expanding immunisation, improved child survival and better access to basic health interventions. Yet these conditions remain dominant, with neonatal disorders (11.3%), lower respiratory infections (9.9%), diarrhoeal diseases (6.4%), HIV/AIDS (5.6%) and malaria (5.5%) ranking among the top causes of death in 2019. While malaria had dropped to 7th place by 2019, by 2021 it again ranked among the top five, underscoring the fragility of recent gains and the risks of climate change, weak health systems and conflict in reversing progress.
Looking forward, the Current Path suggests a continued decline in deaths from infectious causes, but not enough to erase them as major killers. Respiratory infection- and malaria-related deaths will drop modestly, from 771 050 and 677 290 in 2023 to around 716 550 and 527 330 by 2043, respectively. Mortality from other communicable diseases will drop from 2.12 million to 1.86 million over the same period.
Communicable mortality trends vary by income group. AIDS remains more prevalent in upper-middle-income countries, while malaria, respiratory infections and diarrhoeal diseases dominate in low-income and lower-middle-income countries, where poor sanitation and limited health infrastructure compound vulnerabilities. HIV/AIDS-related deaths in upper-middle-income African countries will fall from about 149 000 in 2023 to 101 170 by 2043, reflecting greater access to antiretroviral treatment. However, inequalities in rural areas remain a concern.
Low-income countries carry the heaviest malaria, respiratory infections and diarrhoeal diseases burden. In 2023, they accounted for approximately 287 000 malaria deaths, 323 000 respiratory infection deaths and 316 000 diarrhoeal deaths. While these figures will decline to roughly 176 000, 286 000 and 220 000 by 2043, respectively, they will remain high, highlighting persistent gaps in water, sanitation and universal health coverage. In lower-middle-income countries, malaria- and respiratory infection-related deaths will also drop slightly from about 386 000 and 402 000 to 348 000 and 395 000, respectively.
In contrast, Africa faces a sharp rise in NCDs. Between 2000 and 2019, NCD-related deaths increased by almost 38%, from 2.10 million (24.1% of total deaths) to 2.89 million (37.1%). In 2019, ischaemic heart disease (5.5%), stroke (5.5%), road injuries (3.8%) and liver cirrhosis (2.5%) emerged as major killers, reflecting Africa’s epidemiological transition alongside rapid urbanisation, dietary changes and rising obesity. By 2021, stroke had surged to the third leading cause of death, highlighting the growing burden of cardiovascular disease.
The Current Path indicates a steep rise in NCD mortality. Deaths from cardiovascular diseases will grow from 1.84 million in 2023 to 3.44 million by 2043, while deaths from malignant neoplasms will rise from 770 000 to 1.45 million. Other NCD-related deaths will also increase, from approximately 580 000 to 790 000 over the same period.
This burden will be felt universally across income groups. In upper-middle-income countries, cardiovascular disease and malignant neoplasm deaths will rise from 231 000 and 106 000 in 2023 to 409 000 and 176 000 by 2043. In lower-middle-income countries, they will expand from 1 million and 392 000 to 1.8 million and 710 000, while in low-income countries, they will climb from about 600 000 and 273 000 to 1.3 million and 566 000, respectively.
Thus, this dual challenge shapes Africa’s health outlook: while communicable diseases remain widespread, NCDs are rising rapidly due to urbanisation, dietary changes, sedentary lifestyles, and ageing populations. The consequence is a growing strain on already under-resourced health systems, which must simultaneously invest in infectious disease control and prevention and treatment of chronic conditions.
To navigate this epidemiological transition, Africa must scale up integrated health strategies that strengthen primary healthcare systems, expand access to universal health coverage and invest in disease surveillance and epidemiological capacity. Expanding prevention programs for NCDs, such as tobacco and alcohol regulation, nutrition policies and road safety campaigns, will be critical, alongside ongoing malaria, diarrhoea and HIV/AIDS control efforts. Furthermore, health sector reforms should be linked to broader continental initiatives like the Africa CDC’s New Public Health Order, Agenda 2063’s health priorities and the SDGs, ensuring health security and resilience are at the centre of Africa’s development trajectory.
Africa’s Agenda 2063 and the Africa Health Strategy (2016–2030) emphasise the dual challenge of finishing the unfinished agenda on communicable disease control while addressing the surge of NCDs through prevention, early detection and health system strengthening. Comparatively, the health burden in South Asia has shifted decisively toward NCDs, with India and Bangladesh reducing child mortality and infectious disease deaths to levels far below Africa’s. South America has also transitioned more rapidly, benefiting from stronger social protection and universal health care systems.
In sum, the continent’s progress in mortality reduction remains fragile and uneven, with low-income countries at risk of being trapped with a double disease penalty. Without scaled-up investment in universal health coverage, resilient primary health care and climate-sensitive disease surveillance, the continent risks falling short of Agenda 2063 health targets and SDG 3, particularly in reducing neonatal mortality, ending preventable deaths from communicable diseases and tackling NCDs.
Chart 12 depicts the infant mortality rate in the Current Path versus the Demographics and Health scenario, from 2020 to 2043.
The infant mortality rate is the probability of a child born in a specific year dying before reaching the age of one. It measures the child-born survival rate and reflects the social, economic and environmental conditions in which children live, including their health care. It is measured as the number of infant deaths per 1 000 live births and is an important marker of the overall quality of the health system in a country.
Africa has recorded significant improvements in child survival over the past three decades. In 2024, the continent’s infant mortality rate (IMR) stood at 41 deaths per 1 000 live births, representing a 60% decline from 1990 levels. The Current Path suggests further progress to approximately 27 deaths per 1 000 live births by 2043. However, income-group disparities will persist. Low-income countries will see the largest improvements, with infant mortality declining from 43.3 deaths per 1 000 live births in 2023 to 23.7 by 2043, surpassing lower-middle-income country performance by around 2025/26. This trajectory reflects progress in maternal and child health interventions among African low-income countries. In lower-middle-income countries, IMR will decrease by about 12 deaths, from 42.8 to 30.9, during the same period. Upper-middle-income countries will experience slower gains, with rates dropping by only four deaths per 1 000 live births, from 24 in 2023 to about 20 in 2043.
Lower-middle-income countries lag behind low-income peers in achieving sharper improvements, despite relatively stronger economies, a paradox that reflects structural health system challenges. Lower-middle-income countries often face widening inequalities between urban and rural populations, with healthcare investments disproportionately concentrated in cities. Moreover, these countries experience a middle-income trap in health financing, external donor support declines as incomes rise, but domestic fiscal space for healthcare remains constrained, leading to underfunded primary care and child health services. By contrast, low-income countries continue to attract targeted donor programs for child survival (for example, Gavi, the Vaccine Alliance, and Global Fund support for HIV, TB and malaria), which directly improve child mortality outcomes. This divergence underscores the importance of equitable health financing, prioritisation of rural healthcare delivery, and better integration of maternal and child health services into universal health coverage frameworks.
Despite the overall progress under the Current Path, Africa’s infant mortality rates remain relatively high compared to peer regions. In 2022, sub-Saharan Africa accounted for 57% of global under-five deaths (about 2.8 million) while representing only 30% of global live births. The region also recorded the highest neonatal mortality rate in the world (27 deaths per 1 000 live births), well above central and southern Asia (21 per 1 000). These figures highlight both the progress made and the urgent need for accelerated interventions in maternal and child health.
Alternative policy pathways show even greater potential. Under the Demographics and Health scenario, which envisions faster investments in healthcare access, immunisation and maternal health, Africa’s IMR will fall to 21 deaths per 1 000 live births by 2043, six deaths lower than the Current Path forecast. Disaggregated by income groups, upper-middle-income countries would reduce IMR to about 16 per 1 000 live births (four deaths below the Current Path), while lower-middle-income countries would achieve the largest additional gains, reaching 23 per 1 000 (seven deaths lower). In low-income countries, IMR could decline to 19 per 1 000 (five deaths below the baseline), marking a dramatic improvement compared to historical performance.
To sustain and accelerate progress in reducing infant mortality, Africa must prioritise short-term, high-impact interventions, particularly in low-income and lower-middle-income countries where child survival remains most precarious. Central to this effort is the strengthening of primary healthcare systems, ensuring they are adequately staffed, financed and equipped to deliver essential maternal and child health services. Expanding immunisation programs, improving maternal and child nutrition and guaranteeing universal access to skilled birth attendants will directly address the leading causes of infant and neonatal deaths. These must be complemented by investments in clean water, sanitation and reliable electricity access, which are vital for reducing infection risks and ensuring safe deliveries, especially in fragile and conflict-affected contexts.
If scaled effectively, such interventions would enable Africa to narrow its gap with South Asia and advance towards Agenda 2063’s Aspiration 1, which envisions a “healthy and well-nourished Africa.” They would also bring the continent closer to achieving SDG 3.2, which commits to reducing neonatal mortality to at least 12 deaths per 1 000 live births and under-five mortality to at least 25 deaths per 1 000 live births by 2030. Achieving these targets will require increased domestic resource mobilisation and sustained international support. Still, the payoff is clear: accelerated reductions in infant mortality not only save lives but also strengthen human capital foundations critical for Africa’s long-term development.
Chart 13 presents the demographic dividend in the Current Path compared to the Demographics and Health scenario, from 2020 to 2043.
The dividend is the window of economic growth opportunity that opens when the ratio of working-age persons to dependents increases to 1.7 to 1 and higher.
The concept of the demographic dividend refers to the accelerated economic growth potential that arises when a country’s working-age population grows larger relative to its dependent population (children and elderly). This shift can unlock higher savings, greater labour supply, and enhanced productivity. However, as highlighted by Bloom, Canning and Sevilla, these benefits are not automatic but require deliberate investments in education, health, employment creation, and governance.
Africa’s age structure has been shifting gradually over the past three decades, but the transition remains slow compared to peer regions. The continent’s working-age to dependant population ratio (demographic dividend ratio) improved modestly from 1.1 working-age persons to every dependant in 1990 to 1.32 in 2023. This lags behind South Asia and South America, which entered their demographic windows in 2011 and 2000, respectively, and are now benefiting from higher savings, productivity and accelerated growth. The Current Path suggests that Africa’s dividend ratio will reach 1.57 by 2043, still below the benchmark of 1.7 working age persons to every dependant that marks the onset of the first demographic dividend.
The Demographics and Health scenario accelerates this progress, with Africa’s dividend ratio reaching 1.72 by 2043, just crossing the threshold to signal entry into the demographic window. This scenario suggests that, with coordinated investments in reproductive health, universal secondary education and vocational and digital skills development, Africa can enter its demographic window by 2043, setting the stage for more inclusive and sustained economic growth in the second half of the century. Equally critical is creating sufficient decent jobs in manufacturing, services, and green industries to absorb the expanding labour force. Without these complementary measures, Africa’s demographic transition could become a liability rather than a dividend, as large youth cohorts risk exclusion from economic opportunities.
However, the continental average ratio masks significant disparities. Low-income and lower-middle-income countries will remain the main constraint: their ratios rise from 1.19 and 1.36 in 2023 to 1.46 and 1.63 by 2043 under the Current Path. With strengthened investments in maternal health, child survival and fertility decline under the Demographics and Health scenario, these groups will reach 1.64 and 1.76, respectively. By contrast, upper-middle-income African countries entered their demographic window in 2003, with the ratio peaking at 1.97 in 2010-11 and reaching 1.86 in 2023. This ratio will improve further to 2.04 under the Demographics and Health scenario, compared to 2.01 under the Current Path, suggesting that these economies will continue reaping demographic dividends earlier and more strongly than their lower-income peers.
Africa’s delay in realising its demographic dividend underscores the interplay of high fertility, limited access to family planning, underinvestment in girls’ education and weak job markets. Unlike South Asia, which benefitted from mass female education and rapid industrialisation during its demographic transition, many African countries remain heavily agrarian, conflict-prone and resource-dependent. Without rapid job creation in manufacturing, services and modern agriculture, the growing working-age population risks becoming a liability rather than an asset.
Policy priorities, therefore, include expanding access to reproductive health and family planning, accelerating investments in universal education (particularly for girls), fostering labour-intensive industrialisation and building social protection systems to cushion vulnerable groups. These align with SDG 3 (health), SDG 4 (education) and SDG 8 (decent work), as well as the African Union’s roadmap for harnessing the demographic dividend by 2030.
Chart 14 shows the crop production and demand from 1990 to 2043.
The Agriculture scenario envisions an agricultural revolution that ensures food security through ambitious yet feasible increases in yields per hectare, thanks to improved management, seed, and fertiliser technology, as well as expanded irrigation. Efforts to reduce food loss and waste are emphasised, with increased calorie consumption serving as an indicator of self-sufficiency and prioritising it over food exports. Additionally, enhanced forest protection signifies a commitment to sustainable land use practices.
Visit the theme on Agriculture for our conceptualisation and details on the scenario structure and interventions.
Africa’s agricultural sector has undergone significant changes since 1990, reflecting both structural improvements in output and persistent vulnerabilities that undermine food security. In 2024, the sector employed more than 65% of the continent’s labour force and contributed approximately 32% of GDP, highlighting its crucial role in livelihoods and economic stability, particularly in rural areas.
The continent’s crop production has expanded steadily, but not fast enough to meet rising demand driven by population growth, urbanisation and dietary shifts. This widening imbalance underscores the continent’s continued dependence on food imports and exposes its agricultural systems to climate shocks, global price volatility and structural weaknesses in productivity.
In 1990, Africa already faced a crop production deficit of over 25 million metric tons, with demand at 404 million metric tons compared to production of 379 million metric tons. Demand and production grew rapidly over the next three decades, but demand consistently outpaced supply. By 2023, crop demand had tripled to 1.25 billion metric tons, while production reached only 1.12 billion metric tons, leaving a deficit of 131 million metric tons. The Current Path shows this gap worsening further: by 2043, crop demand will be 2.1 billion metric tons, while production will reach just 1.47 billion metric tons, resulting in a staggering 627 million metric tons deficit.
The production-demand imbalance is not uniform across the continent. Low-income countries face the sharpest challenges. Their crop demand will nearly double from 381 million metric tons in 2023 to 725 million by 2043, while production will rise more slowly from 345 to 488 million. This leaves them with a deficit of 237 million metric tons by 2043, up dramatically from just 35.5 million in 2023. These countries are typically characterised by rain-fed smallholder farming, limited mechanisation and high exposure to climate variability, constraining productivity growth despite abundant labour and land resources.
Lower-middle-income countries, which account for the bulk of Africa’s population, will see demand rise from 743 million metric tons in 2023 to 1.21 billion in 2043, while production will increase from 669 million to 868 million metric tons. This leaves them with the largest absolute deficit of 340 million metric tons by 2043, compared to 74 million in 2023. While these economies often have larger domestic markets and better integration into regional value chains, they still struggle with yield gaps, post-harvest losses and limited access to agricultural finance and technology.
Upper-middle-income countries display relatively stronger performance but remain structurally dependent on imports. Their crop demand will rise from 126 million metric tons in 2023 to 163 million by 2043, while production will increase from 105 million to 113 million metric tons. This results in a more modest deficit of 49.25 million metric tons by 2043, up from 20.64 million in 2023. These economies tend to have more diversified agricultural systems, better infrastructure and higher productivity. However, urbanisation and income growth drive strong demand for cereals, processed foods and animal feed, keeping them net importers.
Africa’s agricultural productivity remains far below that of peer regions. The Current Path suggests that the average crop yields in Africa will rise only modestly, from about three metric tons per hectare during 1990-2023 to nearly five in 2024-2043. By contrast, South Asia’s yields will almost double, from 5 to 9, while South America’s will climb from 10 to 15 over the same period.
South Asia, once heavily dependent on food imports, transformed its agricultural base through the Green Revolution, deploying irrigation, hybrid seeds and widespread fertiliser use to attain near self-sufficiency by the late 20th century. Similarly, South America, led by Brazil and Argentina, built globally competitive agribusiness sectors through technological innovation, large-scale commercial farming and a strategic export orientation.
Africa, by contrast, remains constrained by structural bottlenecks. Agriculture is still dominated by smallholder farmers with limited access to modern inputs, credit, infrastructure and markets. These weaknesses not only suppress productivity but also expose the continent to climate-related shocks and deepen its reliance on costly food imports. Without bold policy interventions to modernise farming systems, strengthen value chains and unlock investment, Africa risks falling further behind in global agricultural competitiveness.
Africa’s widening crop production deficit has profound implications for food security and development. It highlights the urgency of advancing Africa’s agricultural transformation agenda, a central pillar of the African Union’s Agenda 2063, the Comprehensive Africa Agriculture Development Programme (CAADP) and the Malabo Declaration on Accelerated Agricultural Growth. Priority areas include boosting irrigation coverage, expanding access to improved seeds and fertilisers, scaling climate-smart agriculture and strengthening intra-African trade under the AfCFTA to reduce dependence on extra-continental imports. Without such interventions, Africa risks deepening its food import bill, which already exceeds US$35 billion annually, and undermining its ability to achieve SDG 2 on ending hunger.
Chart 15 presents the import dependence in the Current Path and the Agriculture scenario from 2020 to 2043.
Africa’s agricultural landscape is increasingly defined by a persistent reliance on food imports. Estimates suggest that over 82% of Africa’s basic food imports originate from outside the continent, highlighting the structural weakness of domestic food systems and the continent's vulnerability to global shocks. This dependence is particularly acute for wheat, where Eastern Africa relies on imports for roughly 84% of its demand, exposing the subregion to supply disruptions such as those caused by the Russia-Ukraine war. Collectively, African countries spend about US$50 billion annually on food imports, a figure projected to rise to US$110 billion by 2025 without substantial corrective measures.
In 2023, imports supplied 11% of Africa’s total crop demand. This dependency starkly contrasts with South Asia, where imports accounted for just 0.6% of crop demand, and South America, which has remained largely self-sufficient since the 1960s due to sustained agricultural investment and productivity growth. Under the Current Path, Africa’s crop import dependency will worsen to 30.8% by 2043 as demand continues to outstrip production capacity. Crop imports will surge from US$34.9 billion in 2023 to US$141.7 billion by 2043, while exports expand marginally, from US$10.1 billion to US$13.3 billion. This trajectory underscores structural weaknesses, including low irrigation coverage, climate vulnerability, underdeveloped agro-processing and limited investment in R&D, that prevent the continent from meeting its food demand.
While Africa’s import dependency burden will worsen across the board, it varies across income groups. In 2023, upper-middle-income countries had the highest dependency (17.3%), followed by lower-middle-income countries (10.7%) and low-income countries (9.1%). However, low-income countries will face the sharpest deterioration by 2043, with dependency rising to 33.9%, compared to 31% for upper-middle-income and 28.8% for lower-middle-income countries. This trend underscores the vulnerability of poorer countries with weaker production bases, which will increasingly rely on imports to feed rapidly growing populations.
By contrast, the Agriculture scenario reflects the ambition of Agenda 2063 and the Malabo Declaration, which prioritise food security, intra-African trade and resilience. By 2043, crop import dependence would fall by nearly half relative to the Current Path, reaching 16.2%. Imports will be US$34.3 billion less than the Current Path forecast (approximately US$107.3 billion), while exports would almost triple to US$38.2 billion, which is US$24.9 billion higher than the Current Path forecast. The most dramatic gains occur among upper-middle-income countries, where import dependence declines to just 8.3% (22.7 percentage points below the Current Path). Low-income and lower-middle-income countries also benefit considerably, with their dependence reduced by 14 and 13 percentage points, respectively, compared to their baseline forecasts.
This trajectory signals that scaling agricultural productivity, through irrigation expansion, mechanisation, improved seed varieties, climate-smart practices and agro-processing, is essential to narrow Africa’s food gap and capture its US$1 trillion and US$2.4 trillion food market potential by 2030 and 2050, respectively. The Agriculture scenario illustrates that with coordinated policy reform, investment and intra-African market integration via the AfCFTA, the continent can reduce its external vulnerabilities, strengthen food sovereignty and move decisively toward the vision of self-reliance articulated in its continental development agendas.
Chart 16 presents the progress through the educational system compared to the African income group (primary gross enrolment, primary completion, lower-secondary gross enrolment, lower-secondary completion, upper-secondary enrolment, upper-secondary completion, tertiary enrolment and tertiary completion) in 2023 and 2043.
The Education scenario represents reasonable but ambitious improved intake, transition and graduation rates from primary to tertiary levels and better quality of education at primary and secondary levels. It also models substantive progress towards gender parity at all levels, additional vocational training at the secondary school level and increases in the share of science and engineering graduates.
Visit the theme on Education for our conceptualisation and details on the scenario structure and interventions.
Africa’s education system, while diverse across 54 countries, broadly follows the three-tier structure of primary, secondary and tertiary education. Access, retention and quality vary significantly across regions, shaped by poverty, inequality, conflict and demographic pressures. Sub-Saharan Africa has the highest rates of education exclusion globally: more than 20% of children aged 6-11 are out of school, one-third of adolescents aged 12-14, and nearly 60% of youth aged 15-17 are not enrolled. With Africa’s school-age population still expanding rapidly, exclusion risks deepening unless urgent reforms are pursued.
Under the Current Path, educational attainment will rise only modestly. The average number of years of schooling among youth aged 15-24 years, a key predictor of human capital, will increase from 7.26 in 2023 to 8.21 by 2043, with the gender gap shifting from a narrow advantage for boys (0.06 years) to one for girls (0.24 years). This reflects positive but limited gains relative to South Asia and South America, where average attainment will climb from 9.52 and 9.02 years in 2023 to 10.22 and 9.36 years, respectively. The gap underscores Africa’s slower human capital accumulation compared to peer regions.
Progress varies sharply by income group. Low-income countries, where structural constraints such as fragile school systems, underfunding and conflict-related disruptions are most severe, will see attainment increase from 5.93 years in 2023 to 7.45 years by 2043. Lower-middle-income countries will move from 7.81 to 8.56 years, reflecting stronger investment in universal education programs. Upper-middle-income countries, already relatively advanced, will stagnate, rising only from 10.3 to 10.51 years over the same period. These disparities reflect differences in state capacity and uneven investments in education infrastructure, teacher training and curriculum quality.
Beyond years of schooling, the quality of education, scaled from 0 to 100, remains a central weakness. In 2023, Africa’s primary education quality score was 31.9, slightly below South Asia (32.1) and far behind South America (37.6). Under the Current Path, Africa will only improve marginally to 33.9 by 2043, while South Asia and South America will reach 37 and 41.5, respectively. In secondary education, Africa’s quality score stagnates at 40, while South Asia rises from 41.9 to 45.7 and South America from 44.6 to 48.4. These gaps point to systemic issues in pedagogy, curriculum alignment and resource allocation.
Girls outperform boys in both primary and secondary learning outcomes, though the gap is small. This reflects global trends but in Africa also signals rising male disengagement from formal education, often linked to early entry into labour markets, conflict exposure and weak retention strategies.
Performance also diverges across Africa’s income groups. In primary education, upper-middle-income countries perform close to South America’s level, while in secondary education, they nearly match South Asia. However, lower-middle-income countries currently lead in secondary education quality, with scores around 42, though these stagnate until 2043. They will be overtaken after 2033 by upper-middle-income countries, which benefit from better-resourced systems. Meanwhile, low-income countries face persistent quality deficits, reflecting overcrowded classrooms, under-trained teachers and limited access to learning materials.
At the post-basic level, structural weaknesses further constrain the education funnel. High dropout rates, limited tertiary access and poor alignment between academic curricula and labour market needs continue to erode the continent’s potential demographic dividend. Several countries grapple with a persistent skills mismatch, particularly in fast-growing sectors like ICT, the green economy and advanced industrial services. Enrolment in Technical and Vocational Education and Training (TVET) and Science, Technology, Engineering and Mathematics (STEM) fields remains disproportionately low, curbing the supply of workforce-ready graduates. This restricts Africa’s competitiveness compared to South Asia, where investments in STEM education and vocational pathways have underpinned industrialisation, and South America, where tertiary expansion has helped broaden middle-class opportunities.
Addressing these bottlenecks is central to Africa’s development trajectory. The AU’s Continental Education Strategy for Africa (CESA 16-25 and 26-35) and the Agenda 2063 goal of transforming Africa into a knowledge society emphasise investment in equitable access, teacher training, curriculum reform and digital learning. Strengthening vocational pathways, scaling STEM and improving tertiary access are vital for aligning education outcomes with the AfCFTA’s employment opportunities, the African Development Bank’s Jobs for Youth in Africa Strategy and the SDGs. Without these structural reforms, Africa risks perpetuating low productivity and persistent poverty traps despite gradual gains in access and attainment. By contrast, South Asia’s gains in educational attainment and learning outcomes were driven by targeted mass literacy campaigns, expansion of secondary schooling and early investments in digital and vocational training. At the same time, South America benefited from stronger state capacity and inclusive social protection policies.
Africa’s Current Path trajectory suggests progress, but at a pace too slow to unlock the continent’s demographic dividend. More transformative interventions, anchored in equity, quality and employability, are necessary to align educational outcomes with the continent’s broader goals of inclusive growth, structural transformation and global competitiveness.
Chart 17 depicts the mean years of education in the Current Path compared to the Education scenario (for the 15 to 24 age group), from 2020 to 2043.
The average years of education in the adult population aged 15 to 24 is a good first indicator of how the stock of knowledge in society is changing.
The Education scenario outlines a more ambitious and inclusive trajectory for Africa’s education systems, one that delivers measurable gains in both educational attainment and learning quality by 2043. Under this scenario, average educational attainment among youth aged 15-24 will rise to 9.1 years, nearly one full year above the Current Path forecast. While this increase may appear modest, it reflects a major development in retention and progression through upper-secondary and tertiary education, which are often the weakest links in Africa’s education funnel. The gender gap remains marginal, but girls will benefit slightly more than boys, continuing a positive trend toward greater parity. Disaggregated by income groups, low-income countries record the largest gains, an additional year above the Current Path by 2043, followed by lower-middle-income countries (+0.81 years) and upper-middle-income countries (+0.35 years).
The Education scenario also delivers important improvements in the quality of learning, addressing one of the continent’s most persistent challenges. At the primary level, quality scores rise to approximately 40 by 2043, nearly six points higher than under the Current Path forecast. Lower-middle-income countries see the greatest relative gains, underscoring the role of targeted investments in teacher training and classroom infrastructure. At the secondary level, average scores climb to 46.4 by 2043, representing an improvement of about six points above the baseline. Upper-middle-income countries will achieve the highest average, with quality scores reaching 50 by 2043, but low-income and lower-middle-income countries also benefit substantially, narrowing inter-group disparities.
These improvements are underpinned by systemic reforms embedded in the Education scenario, including expanded teacher professional development, competency-based curriculum reforms and a major expansion of digital learning platforms. Particular emphasis is placed on rural and underserved regions, where exclusion remains highest. Importantly, this scenario aligns closely with the CESA (16-25 and 26-35), the AU’s Agenda 2063 and the SDG 4 goal of ensuring inclusive and equitable quality education. By modernising learning systems and expanding post-basic pathways, especially in Technical and Vocational Education and Training (TVET) and Science, Technology, Engineering and Mathematics (STEM) fields, the scenario positions Africa to generate a workforce better aligned with emerging opportunities in digital industries, renewable energy, agro-industrialisation and advanced services.
If fully implemented, the Education scenario provides a viable pathway to revitalising Africa’s human capital base. By combining broader access with improved learning outcomes, Africa can significantly enhance productivity, stimulate innovation and build resilience against the risks of jobless growth. As the continent approaches its demographic transition, education reforms will be pivotal to unlocking the first and second demographic dividends, curbing youth unemployment and ensuring that rapid population growth translates into inclusive, long-term prosperity.
Chart 18 presents manufacturing as a share of GDP in the Current Path compared to the African income group, from 2020 to 2043.
In the Manufacturing scenario, reasonable but ambitious growth in manufacturing is envisaged through increased investment in the sector, in research and development (R&D), and through improved government regulation of businesses. This aims to enhance total labour participation rates, particularly among females, where appropriate.
Visit the theme on Manufacturing for our conceptualisation and details on the scenario structure and interventions.
Africa’s manufacturing sector sits at the heart of the continent’s structural transformation agenda, with potential to nearly double output from around US$500 billion now to over US$1 trillion by 2030. Manufacturing has the capacity to generate millions of jobs, reduce dependence on commodity exports and drive value addition. Key subsectors include food and beverages, metals, chemicals and agro-processing, each offering significant opportunities for regional value chains. Yet, despite these promises, the sector’s growth has been constrained by persistent bottlenecks, including limited infrastructure, skills shortages, inadequate access to finance, weak regional value chains and policy fragmentation. The AfCFTA is emerging as a critical driver of industrialisation by fostering market integration. At the same time, digital transformation, technology adoption and workforce upskilling will be essential for Africa to seize new opportunities in industrial development and green growth.
In 2023, manufacturing contributed just 12.8% of Africa’s GDP, trailing South Asia (14%) and South America (16%). Services dominate Africa’s economies, accounting for 53% of GDP in 2023, followed by agriculture (14%), energy (10.1%), materials (5.6%) and ICT (4.3%). This profile illustrates both Africa’s ongoing structural transition and continued vulnerabilities. Services dominate in larger economies and resource-dependent ones, where public administration, trade and financial services underpin GDP. Meanwhile, mineral exports remain central in many countries, shaping external earnings but limiting diversification.
The Current Path shows modest but important shifts. Manufacturing will gradually surpass agriculture in its contribution to GDP by 2026-27, rising to 16.3% by 2043, while agriculture will decline to 7.6%, reflecting urbanisation, labour shifts and productivity gains. Services will expand further to 57.1% of GDP, consolidating its role as the continent’s largest economic driver. ICT and materials will also increase slightly, while the energy sector’s share declines to 6.4%. This structural shift indicates a gradual move away from primary agriculture toward manufacturing and knowledge-based sectors (structural rebalancing toward higher-productivity sectors), though the pace remains modest compared to Asia’s rapid industrialisation trajectory.
Differences across Africa’s income groups reveal divergent industrialisation pathways. In low-income countries, agriculture remains the backbone (24.8% of GDP in 2023), but will fall to 9.5% by 2043 as manufacturing share expands from 10.8% to 16.1%. Lower-middle-income countries will also see manufacturing share rise considerably, from 13.2% to 17.2% over the same period, while agriculture falls to 8.3%. In upper-middle-income economies, the contribution of services to GDP declines slightly, while manufacturing, although growing, remains subdued at just over 13% by 2043. This structural imbalance highlights both the opportunities and risks: while low-income and lower-middle-income countries are positioned to benefit from catch-up industrialisation, upper-middle-income countries risk premature deindustrialisation if they fail to upgrade toward advanced manufacturing and technology-intensive industries.
Relative to peer regions, Africa’s industrial base is underdeveloped. South Asia leveraged export-oriented light manufacturing, strong investment in human capital and integration into global supply chains to achieve sustained manufacturing growth. South America, though more commodity-dependent, maintains higher productivity in agro-processing and resource-based manufacturing. Africa’s challenge lies in breaking out of commodity dependence and import reliance, while capturing opportunities in agro-processing, pharmaceuticals, automotive and digital manufacturing.
Africa must address structural constraints to accelerate industrialisation and sectoral upgrading while leveraging continental development frameworks such as the AU’s Agenda 2063 and the AfDB’s High 5s. Closing infrastructure gaps in energy, transport and logistics is essential for lowering production costs and fostering competitiveness, directly advancing Agenda 2063’s Aspiration One for a prosperous Africa and the AfDB’s goal to “Integrate Africa.” Expanding access to finance for SMEs and industrial clusters will integrate smaller firms into regional and global value chains. At the same time, investments in TVET systems are critical for building the skilled workforce envisioned in Agenda 2063’s skills revolution and the AfDB’s priority to “Improve the Quality of Life for Africans.” The AfCFTA serves as a cornerstone for harmonising standards, reducing non-tariff barriers and promoting regional specialisation in agro-processing, light manufacturing and digital services, thereby supporting both “Industrialise Africa” and “Feed Africa.” Finally, a decisive pivot toward digital and green industrialisation would enable the continent to leapfrog into future-ready industries, in line with global climate commitments and Agenda 2063’s aspirations for environmentally sustainable development. Together, these reforms can transform manufacturing from its current modest share of GDP into a dynamic engine of inclusive growth, job creation and continental self-reliance.
Chart 19 presents the contribution of the manufacturing sector to GDP in the Current Path and in the Manufacturing scenario, from 20202019 to 2043. The data is in US$ and % of GDP.
Africa’s economic transformation depends heavily on its ability to shift from an agrarian base to a more diversified structure anchored in advanced manufacturing and high-value services. Historically, economic development follows the three-sector hypothesis: agriculture dominates in low-income contexts, manufacturing rises with industrialisation and high-value services expand as economies mature into high-income status. However, Africa’s current growth model has been shaped by service-led expansion, not by strategic design but by default. Constrained by capital scarcity, weak infrastructure, limited technological capacity and skills shortages, the continent has largely bypassed manufacturing, moving directly from low-value agriculture into low-value, informal services. While this trajectory has generated employment, it has locked many economies into activities such as petty trade and basic retail that create jobs but contribute little to productivity growth or export competitiveness. This informal services trap mirrors the stalled experiences of several Latin American economies, where early deindustrialisation contributed to the persistence of the middle-income trap. Africa risks a similar fate without deliberate industrial policies: growth without transformation, employment without prosperity.
The Manufacturing scenario envisions a stronger role for industry in driving structural change. Under this scenario, the share of manufacturing in GDP rises to 18.1% by 2043, 1.8 percentage points above the Current Path forecast. Gains are highest among upper-middle-income countries (+3.24 points), reflecting their greater capacity for value addition in sectors such as mineral beneficiation, automotive assembly, textile and industrial services. Lower-middle-income countries record improvements of +1.71 points, while low-income countries see smaller gains of +0.85, constrained by weaker infrastructure, limited capital and skills shortages. This rebalancing highlights the uneven readiness of Africa’s economies to industrialise.
At the continental level, absolute output grows across all sectors under the Manufacturing scenario, with manufacturing showing the highest gains above the Current Path by 2043. Services experience early momentum of incremental growth, expanding more rapidly in the short to medium term, but are eventually surpassed by manufacturing by 2043, a pattern also observed in lower-middle- and upper-middle-income countries, confirming the transformative role of manufacturing. Manufacturing-led development stimulates complementary growth in logistics, ICT, business services and input demand from agriculture, creating dynamic linkages that broaden Africa’s productive base.
At the income group level, two differences stand out. First, the services sector still records stronger gains by 2043 relative to the Current Path in low-income countries, reflecting their slower pace of industrialisation. Second, in upper-middle-income countries, absolute values for materials, energy and ICT decline slightly relative to the baseline, highlighting the structural reallocation of resources towards more competitive industries.
A stronger and more diversified manufacturing sector bolsters public revenue generation, expanding Africa’s fiscal space. Under the Manufacturing scenario, government revenue rises from 19.5% of GDP in 2023 (US$520 billion) to 22.9% in 2043 (US$1.52 trillion). This is higher than the 22.6% (US$1.44 trillion) forecast under the Current Path. The additional fiscal resources can be reinvested in infrastructure, skills development and industrial support programs, creating a virtuous cycle of industrialisation and sustainable growth.
By 2043, Africa’s GDP will reach US$6.64 trillion under the Manufacturing scenario, around US$280 billion higher than the Current Path. GDP per capita also rises to US$6 400, roughly US$190 higher than the baseline forecast. These gains underscore the catalytic role of industrialisation in boosting productivity and household incomes.
The scenario contributes to moderate but meaningful poverty reduction. Extreme poverty (at US$2.15/day) declines from 31% in 2023 to 18.3% by 2043, compared to 19.1% under the Current Path. The reduction is driven by higher employment generation, particularly in labour-intensive manufacturing, and targeted social transfers supporting vulnerable populations. Importantly, manufacturing-led growth absorbs underemployed youth and rural labour, offering pathways for broad-based empowerment and economic mobility.
However, Africa must guard against the middle-income trap, where countries experience rapid growth in the transition from low- to middle-income status but stagnate before reaching high-income levels. Latin America offers cautionary lessons: resource dependence, weak industrial upgrading and limited productivity growth left many economies stuck at middle-income status for decades. Africa risks a similar trajectory if it bypasses deep industrialisation in favour of premature service-sector expansion. The Manufacturing scenario highlights that sustained industrial policy, workforce upskilling and regional integration are critical to avoid this trap. Strengthening SME participation in value chains, investing in digital and green manufacturing and leveraging the AfCFTA to expand regional markets will be essential to sustaining momentum beyond the middle-income threshold.
In summary, the Manufacturing scenario demonstrates that industrialisation is central to Africa’s long-term development. By raising the share of manufacturing to nearly one-fifth of GDP, the continent can accelerate growth, expand fiscal space, reduce poverty and build resilience against global commodity volatility. But without deliberate strategies to deepen and upgrade industrial production, Africa risks following South America into the middle-income trap, rather than emulating South Asia’s pathway of sustained, manufacturing-driven transformation.
Chart 20 shows exports and imports as per cent of GDP from 1990 to 2043.
The AfCFTA scenario represents the impact of fully implementing the African Continental Free Trade Agreement by 2034. It increases exports in manufacturing, agriculture, services, ICT, materials and energy. It also includes an improvement in multifactor productivity growth emanating from trade and a reduction in tariffs for all sectors.
Visit the theme on AfCFTA for our conceptualisation and details on the scenario structure and interventions.
Africa’s trade profile remains shaped by its historic role as a supplier of primary commodities and an importer of manufactured products. Oil, gas, minerals and agricultural raw materials dominate the export basket, while finished goods, machinery, vehicles and pharmaceuticals make up the bulk of imports. This composition leaves the continent vulnerable to commodity price volatility and external shocks, while limiting the scope for industrial upgrading. The AfCFTA, launched in 2019 and operational since 2021, was conceived as a bold response to these structural weaknesses, to create a unified market and a combined GDP.
Implementation of the AfCFTA has been uneven but encouraging. Tariff reductions, pilot trade initiatives and harmonisation of rules of origin have already produced measurable results: intra-African trade increased to 15% in 2023, reaching US$192 billion. However, this progress is still lagging significantly behind, compared to intra-European Union (EU) trade, which stood at around 70% and intra-Asian trade at around 60% in the same year. EU and Asia intra-continental trade statistics reflect dense, production-sharing value chains that tie firms, labour and markets together.
The remaining 85% of African trade, amounting to approximately US$1.07 trillion, is extra-African trade, primarily with partners such as China, the EU, the United States and India. China, in particular, has emerged as Africa’s largest single-country trading partner, absorbing a large share of commodity exports while supplying manufactured imports. Within Africa, South Africa plays a pivotal role as a hub for value-added exports in sectors such as automotive, processed foods and chemicals, particularly within the Southern African Customs Union (SACU).
In 2023, Africa’s merchandise imports stood at US$676 billion, down 3.7% from 2022, while exports contracted more sharply by 9% to US$610.5 billion. This downturn underscores Africa’s vulnerability to fluctuations in global demand and commodity prices, as well as disruptions to global supply chains. Under the Current Path, exports will expand to US$1.78 trillion by 2043 (28% of GDP), while imports rise to US$2.02 trillion (31.7% of GDP). Trade openness, measured as the sum of exports and imports relative to GDP, will increase from 44% in 2024 to 59.8% by 2043.
The AfCFTA scenario, however, offers a more transformative trajectory. By 2043, exports will reach US$2.18 trillion (31.4% of GDP), imports US$2.39 trillion (34.3% of GDP) and trade openness 65.7%, significantly higher than under the Current Path. Under the AfCFTA scenario, Africa’s trade deficit narrows from 4.8% of GDP in 2023 to 2.9% by 2043, compared to 3.7% forecast under the Current Path. Much of this development will come from non-traditional exports, agro-processed goods, textiles, pharmaceuticals and light manufacturing, driven by deeper regional integration, improved logistics and enhanced enterprise competitiveness. By removing tariffs on goods, cutting non-tariff barriers and harmonising regulations, the AfCFTA is expected to increase the share of intra-African trade by over 50% by 2040.
Still, challenges remain. Implementing AfCFTA protocols requires stronger customs capacity, better infrastructure (ports, corridors, energy grids) and significant investments in trade finance and SME readiness. Without these, Africa risks missing the opportunity to diversify away from primary commodities. At the same time, if these efforts succeed, Africa could replicate elements of the East Asian experience, where regional integration and manufacturing-led exports propelled economies out of poverty traps and into sustained middle-income and high-income growth.
Africa’s future trade performance will hinge on whether the AfCFTA evolves from a political aspiration into a fully functional economic space. If effectively implemented, it has the potential not only to raise trade as a share of GDP but also to fundamentally alter the composition of Africa’s trade, from raw commodities to diversified, value-added goods and services, placing the continent on a more resilient and inclusive growth path.
Chart 21 shows the trade balance as a share of GDP in the Current Path compared to the AfCFTA scenario, from 2020 to 2043.
Africa’s trade balance has fluctuated in recent years, reflecting commodity price volatility and persistent dependence on imported manufactured goods. In 2022, the continent recorded a modest surplus of US$18.1 billion, buoyed by high commodity prices, particularly oil and minerals. However, in 2023, this position reversed into a deficit of US$65.5 billion, underscoring the fragility of Africa’s external accounts and its limited capacity to shield itself from global market fluctuations.
Under the Current Path, this trade deficit will worsen significantly, reaching US$240 billion (3.71% of GDP) by 2043, as import demand continues to outpace export diversification. This deepening deficit reflects structural constraints: Africa’s continued reliance on primary commodities, underdeveloped regional value chains and the limited competitiveness of its manufacturing base. As a result, the continent remains highly vulnerable to global demand shifts and terms-of-trade shocks.
The AfCFTA scenario will not eliminate the deficit, but will moderate the trajectory. By 2043, the deficit narrows by US$30 billion, reaching US$210 billion (2.9% of GDP). The improvement reflects AfCFTA-driven gains in intra-African trade, particularly in agro-processing, light manufacturing and value-added goods. Harmonisation of rules of origin, removal of non-tariff barriers and investments in trade facilitation are projected to boost Africa’s capacity to retain more value from its resources, diversify its export base and reduce reliance on imports from Asia, Europe and North America.
However, the persistence of a trade deficit even under the AfCFTA scenarios highlights a central policy challenge. While AfCFTA can significantly expand intra-African trade and reduce vulnerability, it cannot resolve the structural asymmetry between Africa’s import dependence on high-value manufactured goods and its export concentration in raw commodities. This asymmetry contrasts with South Asia, where industrial upgrading enabled stronger export-led growth, and South America, where persistent resource dependence has kept many economies in chronic trade imbalances. Africa’s trajectory risks following the South American pattern unless deeper reforms are implemented.
To fully harness AfCFTA’s potential, Africa must complement trade integration with industrial policy, infrastructure investment and skills development. Scaling up manufacturing capacity, strengthening logistics corridors and fostering SME competitiveness are crucial to generating export surpluses. Equally important are policies that expand regional value chains in sectors such as agro-processing, automotive assembly, pharmaceuticals and green technologies. By doing so, Africa can move from managing deficits to building sustainable trade surpluses that anchor long-term resilience and inclusive growth.
Chart 22 presents the Current Path access to electricity for urban, rural and total population from 1990 to 2043.
The Large Infrastructure and Leapfrogging scenario involves ambitious investments in road and renewable energy infrastructure, improved electricity access and accelerated broadband connectivity. It emphasises adopting modern technologies to enhance government efficiency and the rapid formalisation of the informal sector, incorporating significant investments in major infrastructure projects like rail, ports, and airports, while highlighting the positive impacts of renewables and ICT.
Visit the themes on Large Infrastructure and Leapfrogging for our conceptualisation and details on the scenario structure and interventions.
A stark paradox marks Africa’s energy infrastructure. The continent has abundant, world-class renewable energy potential, especially solar, yet continues to struggle with low access, unreliable supply and dependence on traditional fuels. The continent holds around 60% of global solar potential, yet in 2022 it accounted for only 1% of installed solar PV capacity. Instead, the energy mix remains dominated by traditional biomass (39.3%), followed by oil (26.5%), natural gas (17.9%) and coal (13.2%), while renewables (hydro, wind and solar) and nuclear together accounted for just 1.7%. This imbalance is shaped by inadequate transmission infrastructure, insufficient financing, fragmented regulation and weak local manufacturing and technical capacity.
The utilisation of renewables, particularly solar and wind, remains marginal even in the electricity generation mix. In 2022, renewables accounted for just 21% of electricity generation, overwhelmingly from hydropower (18.3%), while wind and solar contributed only 2.7%. By contrast, fossil fuels provided over three-quarters of power, led by natural gas (42%) and coal (26.1%).
In terms of access, more than 640 million Africans lacked access to electricity in 2022, translating to an access rate just above 40%, the lowest globally. While African governments have shown increasing commitment to expand connectivity, through initiatives such as the African Single Electricity Market (AfSEM) and the Programme for Infrastructure Development in Africa (PIDA), capacity additions remain insufficient and lag far behind peers. For example, in 2024, the continent added a total of 6.5 GW of new utility-scale capacity, a notable improvement, but still far behind India’s 18 GW in renewables alone.
Comparing historical progress, Africa’s electricity access has risen gradually from less than 30% in 1990 to 57.9% in 2023. However, access remains deeply unequal, with sharp urban–rural disparities. Urban connectivity reached 82.1% in 2023, more than twice the rural rate of 40.6%. Comparatively, South Asia, which had similar challenges in the 1990s (access below 15%), has now achieved near-universal coverage through rapid grid expansion and investment in renewables, underlining the scale of Africa’s lag. South America, though more advanced than Africa, also still struggles with rural gaps, suggesting that Africa’s challenge, while more severe, is not unique.
Income-level disparities are also pronounced. While countries such as Egypt, Tunisia and Seychelles have achieved near-universal access, much of sub-Saharan Africa, particularly low-income countries, remains energy-poor. In 2023, electricity access in low-income countries stood at only 37.9% (21.8% rural, 71.5% urban), compared with 68.4% in lower-middle-income countries (48.5% rural, 88.8% urban) and nearly 91% in upper-middle-income countries (84.1% rural, 93.3% urban). These patterns reveal that while higher-income African economies are nearing universal access, rural populations in low- and lower-middle-income economies remain locked out of basic energy services.
Looking ahead, the Current Path forecasts incremental but uneven progress. By 2043, Africa’s electricity access rate will rise to 73%, with 90% of urban areas connected, but only 55.7% of rural populations. Upper-middle-income countries will approach universal access at 95%, with rural-urban disparities narrowing (89.5% vs 95.8%). Lower-middle-income countries will improve to 82.2% access overall (64.4% rural, approximately 94% urban). Low-income countries, however, will lag, reaching only 59.4% access, with rural areas at just 40.8% compared to 83.8% in urban areas. This urban-rural divide underscores the centrality of off-grid and mini-grid solutions as part of a diversified electrification strategy, particularly in fragile and remote regions where extending national grids is economically unfeasible.
Achieving universal access requires not only scaling renewable energy but also addressing affordability and reliability. Initiatives such as the African Development Bank’s New Deal on Energy for Africa and the SDG7 target universal access by 2030. Still, under the Current Path, Africa will miss this goal by over a decade. Bridging this gap will demand accelerated investment in solar and wind generation, regional interconnections under AfSEM and innovative financing models that crowd in private capital. Equally important is integrating energy access into broader strategies for industrialisation and human development under Agenda 2063, since reliable electricity is foundational for manufacturing, digitalisation, education and healthcare.
Chart 23 shows the number of people using cookstoves in the Current Path versus the Large Infrastructure and Leapfrogging scenario from 2020 to 2043.
Access to clean cooking solutions is one of Africa’s most pressing but under-addressed development challenges, sitting at the intersection of energy access, public health, gender equity and environmental sustainability. In 2022, nearly one billion Africans lacked access to clean cooking fuels, forcing continued reliance on biomass, mainly firewood and charcoal, at enormous human and ecological cost. Indoor air pollution from traditional stoves remains a leading cause of respiratory illness and premature death, disproportionately affecting women and children. At the same time, firewood collection consumes time that could otherwise be spent on education and income-generating activities.
As of 2023, only 36% of African households (about 80.6 million people) used modern fuel cookstoves such as LPG or electric stoves. By contrast, adoption exceeds 90% in South Asia and South America, underscoring Africa’s lag in this dimension of the energy transition. Most African households, 60.2% (134.7 million people), still relied on traditional stoves, while another 3.8% (8.7 million people) used improved but still polluting biomass stoves.
Under the Current Path, progress will be gradual but insufficient. By 2043, modern fuel cookstove adoption will increase to 57.2% (233.4 million people), while traditional stove use will decline to 40.2% (164.1 million people). Improved stoves will account for 2.6% (10.6 million people). Yet population growth means absolute numbers remain high and the pace of energy transition remains too slow, particularly in rural and low-income countries where affordability, cultural practices and distribution logistics continue to limit uptake.
The disparities across income groups are stark. In low-income countries, dependence on traditional cookstoves is extreme. In 2023, 87.5% of households (72.7 million people) relied on them, with just 8% (6.6 million people) using modern fuel stoves and 4.6% (3.8 million people) using improved stoves. By 2043, under the Current Path, traditional stoves will still dominate at 61.2% (100 million people), with modern fuel adoption climbing only to 35.3% (57.6 million people). In lower-middle-income countries, reliance on traditional stoves stood at 50.3% (59.4 million people) in 2023. This share will decline to 29.3% (61.8 million people) by 2043 under the Current Path. Modern stove adoption will rise strongly from 45.8% (54 million people) to 68.5% (144.4 million people), reflecting faster transitions in these economies, while improved stove use remains marginal. Upper-middle-income countries already have widespread adoption of clean cooking. In 2023, 88% of households (19.9 million people) already used modern stoves, a share that will climb to 93.4% (31.2 million people) by 2043. Traditional stove reliance will shrink further from 11% (2.5 million people) in 2023 to 6.3% (2.1 million) by 2043 under the Current Path.
By contrast, the Large Infrastructure and Leapfrogging scenario envisions a faster, more transformative transition. It demonstrates what could be achieved through stronger electrification, targeted subsidies and expanded distribution networks for clean cooking technologies. Under this scenario, the adoption of modern fuel cookstoves in Africa rises to 64.1% (262 million people) by 2043, with sharper declines in traditional stove usage to 33.7% (137 million) and improved stove reliance dropping to 2.2% (9 million). Gains are broad-based across all income groups: modern cookstove adoption rises to 43.9% in low-income countries (71.7 million people), almost 75% in lower-middle-income countries (158 million people) and 95.1% in upper-middle-income countries (31.8 million people).
The Large Infrastructure and Leapfrogging scenario reflects the broader benefits of electrification, targeted subsidies for clean appliances and infrastructure investment, coupled with public awareness campaigns to overcome cultural barriers and affordability constraints. It also aligns with Africa’s policy priorities under the Agenda 2063, the AfDB’s New Deal on Energy and the SDG7 target of universal access to modern energy. Importantly, lessons from South Asia, particularly India’s Pradhan Mantri Ujjwala Yojana (PMUY), a program that provided free LPG connections to more than 90 million poor households, illustrate how state-backed subsidies, supply chain expansion and behavioural campaigns can rapidly accelerate the adoption of modern cooking fuels. For Africa, replicating such targeted interventions, alongside scaling distributed renewable solutions, could drive a similar breakthrough.
While the Current Path demonstrates only incremental gains, the Large Infrastructure and Leapfrogging scenario shows how decisive policy and investment can close the clean cooking gap more rapidly. By reducing reliance on biomass, Africa would not only advance its health and gender equity goals but also accelerate climate commitments, curb deforestation and improve energy security, laying the foundation for a healthier and more sustainable energy future.
Chart 24 presents the percentage of the population and number of people with access to mobile and fixed broadband in the Current Path compared to the Large Infrastructure and Leapfrogging scenario, from 2020 to 2043. The user can toggle between mobile and fixed broadband.
Digital connectivity has emerged as a defining frontiers of Africa’s development. Over the past decade, mobile broadband adoption has surged, providing millions of Africans with their first gateway to the internet. In contrast, fixed broadband penetration remains limited, reflecting structural barriers such as incomplete fibre rollout, weak last-mile connectivity, high costs in rural areas and uneven regulatory environments. This divide not only constrains digital inclusion but also limits Africa’s ability to fully harness the productivity and competitiveness gains of the digital economy.
As of 2023, Africa recorded only 49 million fixed broadband subscribers, translating to just 3.3 subscriptions per 100 people, broadly in line with South Asia but lagging South America, where penetration reached above 20 subscribers per 100 people. Under the Current Path, Africa will make steady but insufficient gains, reaching 468 million fixed broadband subscribers (20.3 per 100 people) by 2043. The Large Infrastructure and Leapfrogging scenario, however, envisions more ambitious progress through aggressive investment in fibre backbones, public-private partnerships and universal service initiatives. Under this scenario, Africa would reach 533 million fixed broadband subscribers (23.2 per 100 people) by 2034, marking a more inclusive and competitive digital future.
While progress remains uneven across income groups, the Large Infrastructure and Leapfrogging scenario delivers clear penetration gains across Africa. In upper-middle-income countries, fixed broadband rises from 7.3 subscribers per 100 people in 2023 to 31.4 by 2043, compared to 27.3 under the Current Path. Lower-middle-income countries expand from 3.7 to 23.9, outpacing the baseline forecast of 21.0. Even low-income countries experience rapid growth, with penetration accelerating from 1.9 in 2023 to 21.1 by 2043, compared to 18.5 under the baseline. These gains underscore the transformative impact of targeted investment and large-scale infrastructure roll-out in narrowing the continent’s digital divide.
By contrast, mobile broadband has been Africa’s digital success story. As of 2023, the continent registered about 837 million mobile broadband subscriptions, equivalent to 56.3 subscriptions per 100 people. This trajectory is broadly in line with South Asia but lags South America, where penetration reached approximately 95 per 100. Mobile broadband will continue to expand rapidly: under the Current Path, subscriptions rise to 3.2 billion by 2043 (139.8 per 100 people). The Large Infrastructure and Leapfrogging scenario pushes this slightly further to 3.3 billion (141.5 per 100 people). The relatively narrow margin reflects already-high penetration, but masks persistent challenges around network quality, data affordability and 4G/5G readiness. Africa’s mobile ecosystem is characterised by multi-SIM usage and shared device ownership, explaining why subscriptions exceed forecasted total population by 2043.
Income-level disparities are also evident in mobile broadband penetration. In upper-middle-income countries, subscriptions rise from 122 per 100 people in 2023 to 158 by 2043 under the Large Infrastructure and Leapfrogging scenario, marginally higher than the 152 forecasted under the Current Path. Lower-middle-income countries see stronger gains, increasing from 61 to 149.4 per 100, compared with 148.8 under the baseline. In low-income countries, subscriptions expand from 36 in 2023 to 130 per 100 by 2043, versus 128 under the Current Path. These patterns highlight both the rapid growth potential of mobile broadband and the narrowing, but still persistent, income-based digital divide. Low-income and lower-middle-income countries continue to trail across both fixed and mobile broadband penetration, underscoring the need for targeted subsidies, community Wi-Fi initiatives and innovative financing models to close rural gaps, especially in low-income groups.
Africa’s digital future hinges on its ability to move beyond basic connectivity toward affordable, high-quality and inclusive digital services. Initiatives such as the Smart Africa Alliance, the African Union’s Digital Transformation Strategy (2020–2030) and World Bank–supported regional fibre projects highlight continental ambitions to universalise broadband access. The Large Infrastructure and Leapfrogging scenario demonstrates that with the right mix of investment, regulation and innovation, Africa can compress decades of digital development into one generation, supporting industrialisation, youth employment and Africa’s ambition to become a global digital competitor under Agenda 2063.
India’s digital revolution offers a relevant benchmark for Africa. Through policies promoting cheap mobile data, competitive telecom markets and rapid 4G rollout, India achieved some of the lowest mobile data prices globally and expanded internet access to hundreds of millions within a decade. Initiatives like the Digital India program and the government-backed BharatNet fibre rollout also improved rural connectivity. For Africa, a similar focus on affordability, spectrum management and large-scale rural fibre investments could fast-track broadband adoption, narrow the digital divide and unlock productivity gains across sectors.
Chart 25 depicts the trends in Foreign Direct Investment, aid and remittances as a percentage of GDP, from 1990 to 2043.
The Financial Flows scenario represents a reasonable but ambitious increase in inward flows of worker remittances, aid to poor countries and an increase in the stock of foreign direct investment (FDI) and additional portfolio investment inflows. We reduce outward financial flows to emulate a reduction in illicit financial outflows.
Visit the theme on Financial Flows for our conceptualisation and details on the scenario structure and interventions.
The trajectory of financial flows into Africa since 1990 has been marked by volatility but gradual expansion, reflecting shifting global capital trends, commodity cycles, geopolitical shifts and domestic reforms. In particular, foreign direct investment (FDI) has experienced significant up- and downswings across income groups but shows an overall upward trend. In 1990, FDI inflows stood at just 0.45% of GDP; by 2023, they had risen to 3.02% of GDP, underscoring Africa’s growing, though still uneven, integration into global capital markets. Compared with South Asia, where FDI reached approximately 2% of GDP in 2023, Africa’s performance is more robust. However, it still lags behind Latin America, which consistently attracts higher-quality, market-oriented investment.
However, Africa remains a small share of global FDI in absolute terms. Africa drew roughly US$53 billion in 2023, compared with US$621 billion for developing Asia and about US$193 billion for the developing Americas. The comparison underscores the size of the prize if Africa can de-risk projects and crowd in longer-tenor capital under the Financial Flows scenario.
Under the Current Path, FDI inflows will increase only modestly to 3.55% of GDP by 2043. The Financial Flows scenario, however, envisions robust reforms, greater investor confidence and stronger capital market development, raising FDI inflows to 5.21% by 2043. Under this scenario, Africa’s share of FDI inflows in GDP will surpass South America’s level in 2033. This higher trajectory signals the potential for Africa to attract more stable, long-term investment into infrastructure, manufacturing and digital sectors if regulatory and governance barriers are addressed.
Remittances have emerged as another critical pillar of Africa’s financial flows, often more resilient than FDI or aid. Their trajectory has also been uneven but broadly positive. Net remittances rose from 1.45% of GDP in 1990 to 2.36% in 2023, peaking at 3% in 2018. Under the Current Path, net remittances will decline slightly to 2.16% of GDP by 2043, reflecting tightening global labour markets and migration policy constraints. The Financial Flows scenario moderates this decline to 2.64% of GDP by 2043, sustained by stronger diaspora engagement strategies, digital remittance platforms and lower transfer costs. The impact of remittances is especially pronounced in low-income and lower-middle-income countries, where they often exceed aid and FDI combined, providing a vital cushion for household consumption, education and health. By contrast, upper-middle-income countries are increasingly less reliant on remittances, consistent with global patterns seen in South America, where remittances are now marginal.
Official development assistance (ODA), once Africa’s primary external finance source, has steadily declined in relative importance. From 7.26% of GDP in 1990, aid dropped to 2.22% by 2023 and is forecast to decline further to 1.49% by 2043 under the Current Path. Even under the Financial Flows scenario, aid remains marginal at 1.56% by 2043, although it continues to play an outsized role in low-income countries, where it is forecasted to stabilise at around 5% of GDP. In contrast, upper-middle-income countries have already transitioned away from aid reliance, resembling South America’s trajectory, where ODA has largely phased out. South Asia, meanwhile, managed a faster transition away from aid dependency by leveraging large-scale FDI and remittances alongside aggressive industrialisation. In lower-middle-income countries, aid is increasingly marginal as private investment and domestic revenues take on a larger role in financing development.
Africa’s financial landscape reflects a decisive shift away from aid dependence towards FDI and remittances as the main external drivers. Yet disparities across income groups are stark: middle-income countries attract high-value FDI and reduce reliance on aid and remittances, while low-income countries remain aid-dependent with modest FDI and high reliance on remittances. The Financial Flows scenario illustrates Africa’s potential to secure greater FDI and stabilise remittances, but also highlights persistent structural vulnerabilities. Unlike South Asia, where remittances are reinvested in education and SMEs, or South America, where deeper financial markets mobilise FDI into higher value sectors, Africa must do more to channel financial flows into productive investment, industrialisation and inclusive job creation.
The evolution of financial flows in the continent presents a dual challenge: attracting more productive, long-term capital while effectively harnessing the resources that are already present. Reforms are needed to reduce regulatory risks, enhance infrastructure and strengthen governance to improve FDI. Regarding remittances, policies should focus on lowering transaction costs, formalising transfer channels and mobilising diaspora savings for productive investments, such as financing SMEs or infrastructure bonds. Regarding aid, the focus should be on quality and targeting rather than quantity. It is essential to direct concessional finance to fragile and low-income states where it is still crucial and to leverage blended finance instruments to attract private investment in other areas. By implementing these measures, financial flows can help close Africa’s financing gap while promoting the goals outlined in Agenda 2063 and the SDGs.
To translate larger external flows into structural transformation, Africa should hard-wire three flagship platforms into national financing strategies. First, fast-track the AfCFTA Protocol on Investment, adopted by AU Heads of State in February 2023, to operationalise common rules on promotion, facilitation and responsible investment, and set up the newly created Pan-African Trade and Investment Agency to pipeline bankable, cross-border projects and crowd in long-term capital. Second, fully align country plans with Agenda 2063’s financing and domestic resource mobilisation (DRM) framework, which envisages DRM covering 70–80% of needs, by scaling revenue and savings mobilisation, building regional capital markets and curbing illicit financial flows as set out in AU financing guidance. Third, leverage the G20 Compact with Africa (CwA) to improve macro, business and financing frameworks that de-risk private investment, using CwA’s coordinated reform matrix and partner tooling to expand PPPs, blended-finance vehicles and guarantees for infrastructure and industrial value chains.
Chart 26 shows government revenue in the Current Path compared to the Financial Flows scenario from 2020 to 2043. The data is in US$ 2017 and % of GDP.
According to Wagner’s Law, the principle of increasing state activity, public expenditure, and revenue mobilisation tends to expand as economies grow and diversify. Rising national incomes generate greater demands for infrastructure, social protection, education, healthcare, and administrative oversight, inevitably increasing the size and complexity of the state. For Africa, where structural transformation is underway but incomplete, Wagner’s Law implies that government revenue should rise in tandem with economic development. Yet the pace, breadth, and equity of revenue mobilisation remain uneven across the continent.
Historically, Africa’s fiscal systems have been shaped by dependence on natural resource rents and trade taxes, resulting in volatile revenues and a narrow tax base. Since 1990, reforms supported by institutions such as the African Development Bank and the African Tax Administration Forum (ATAF) have sought to strengthen domestic resource mobilisation, improve VAT systems and reduce reliance on trade tariffs. These efforts have supported gradual gains: government revenue rose from 18.7% of GDP in 2020 (US$439 billion) to 19.5% in 2023 (US$520 billion). In comparative terms, Africa’s revenue effort is stronger than South Asia’s (where averages remain closer to 17% of GDP). Still, it lags well behind South America’s 30%, reflecting the latter’s deeper fiscal capacity and broader tax systems. However, in absolute terms, Africa continues to lag both regions, underscoring the structural weaknesses of its fiscal base and the challenges of translating economic growth into broad-based public revenue.
Looking ahead, under the Current Path, Africa’s government revenue will rise modestly to 22.6% of GDP (US$1.44 trillion) by 2043. By contrast, the Financial Flows scenario suggests a slightly stronger outcome, with revenue reaching 22.8% of GDP (US$1.52 trillion) by 2043. Though the incremental difference of roughly US$100 billion may appear modest, it reflects the compounded effects of enhanced FDI inflows, greater tax administration efficiency, increased domestic savings mobilisation and more effective allocation of aid and remittance inflows into productive sectors. The outcome aligns with Wagner’s Law, confirming that economic expansion supported by external financial flows naturally fuels fiscal capacity growth.
The distribution of gains differs by income group. Low-income African countries, where fiscal space is narrowest, benefit the most: their revenue share rises by 0.5 percentage points (US$16 billion) above the Current Path by 2043, enabling stronger investments in human capital and basic services. This reflects the outsized impact of even modest improvements in tax collection and external flows in fragile fiscal environments. Lower-middle-income countries experience smaller but still meaningful improvements (+0.15 percentage points, or US$35 billion). In contrast, upper-middle-income countries, already near their structural revenue ceilings, see only marginal gains (+0.01 percentage points, or US$16 billion). These variations reflect structural realities: low-income economies rely more heavily on external inflows and donor-backed reforms. At the same time, upper-middle-income countries have relatively mature tax systems but face challenges of efficiency and compliance.
Compared to peer regions, Africa still faces a significant fiscal gap. South America’s higher ratios demonstrate what is possible when diversified economies sustain progressive taxation and broader social compacts. At the same time, South Asia’s faster revenue growth reflects aggressive formalisation and expansion of tax bases alongside rapid industrialisation. For Africa to converge, governments must tackle persistent bottlenecks, including the large informal sector, weak tax compliance and illicit financial flows, which drain an estimated US$88 billion annually from the continent.
The Financial Flows scenario reinforces the importance of strengthening domestic resource mobilisation under frameworks such as the Agenda 2063 and the Addis Ababa Action Agenda on Financing for Development. Strategic reforms, such as digitalisation of tax systems, tackling base erosion and profit shifting and aligning tax incentives with industrial policy, will be crucial to closing the fiscal gap. At the same time, improved governance and accountability are needed to ensure that higher revenues are channelled into productive investments that accelerate industrialisation, human capital development and regional integration, avoiding the fiscal inefficiencies that can otherwise dilute Wagner’s Law effects.
Chart 27 presents the Current Path of government effectiveness from 1990 to 2043.
This scenario assumes better governance consisting of stability, capacity and inclusion. It measures a state’s progress using the average of these three indices. To this end, it includes an index (0 to 1) for each dimension, with higher scores indicating improved outcomes.
Visit the theme on Governance for a full conceptualisation and details on the scenario structure and interventions.
Government effectiveness is a cornerstone of development, reflecting the quality of public service delivery, the professionalism and independence of the civil service, the quality of policy formulation and implementation, and the government’s credibility in maintaining its commitments. On the World Bank’s Worldwide Governance Indicators (WGI) index (ranging from -2.5 for weakest to 2.5 for strongest performance), Africa’s average performance has consistently lagged behind global peers. In 2023, Africa’s regional average was -0.76, well below South America (-0.37) and Asia (-0.04), highlighting persistent institutional weaknesses across much of the continent. At the extremes, Mauritius stood out with a positive score of 0.71, signalling strong state capacity, while Somalia recorded -1.98, reflecting ongoing fragility and conflict.
The variation in government effectiveness across African income groups mirrors structural disparities in state capacity. In upper-middle-income countries, government effectiveness averaged -0.32 in 2023, reflecting relatively stronger bureaucratic capacity and policy implementation in countries like Botswana, Mauritius and South Africa. By contrast, lower-middle-income countries averaged -0.66, weighed down by limited fiscal space, politicised bureaucracies and capacity constraints in populous economies such as Nigeria and Ethiopia. Low-income countries performed worst, averaging -1.13, with fragile states in the Sahel, Horn of Africa and Central Africa facing acute governance deficits exacerbated by insecurity, weak institutions and aid dependence.
The Current Path forecasts gradual improvement in governance performance, but still at levels below peer regions. By 2043, Africa’s government effectiveness index will improve modestly to around -0.36, narrowing the gap but still trailing South Asia and South America. At the income group level, upper-middle-income countries will cross into positive territory at 0.07, signalling convergence with middle-performing countries in Latin America and parts of Asia. Lower-middle-income countries will improve to -0.22, suggesting gradual gains in service delivery and institutional quality. In contrast, low-income countries will rise to -0.72, still reflecting fragile governance environments where reform momentum may be undermined by instability or resource constraints.
While Africa’s government effectiveness index shows gradual improvement, fragile and conflict-affected states represent a stark divergence from the continental average. Countries such as Somalia, South Sudan, DR Congo, Chad and the Central African Republic consistently rank at the bottom of the World Bank’s WGI indicators, with scores below -1.5. In these contexts, weak institutions, protracted conflict, corruption and lack of administrative capacity undermine service delivery and policy implementation. This matters for Africa’s broader trajectory: fragile states account for almost a third of the continent’s population and nearly half of its extreme poor, meaning that their governance deficits drag down regional averages and complicate the achievement of Agenda 2063 and the SDGs.
Comparatively, fragile states in South Asia, such as Afghanistan, also lagged behind regional peers. Still, stronger institutional anchors in India, Bangladesh and Sri Lanka helped the region maintain higher averages overall. South America, despite political instability in some countries like Venezuela, has avoided the scale of institutional collapse that is evident in parts of Africa.
The persistence of fragile governance in several African states underscores the importance of conflict-sensitive governance reforms, targeted international support and regional cooperation mechanisms such as the African Peer Review Mechanism (APRM) to prevent state fragility from spilling across borders and to ensure more inclusive continental progress. Strengthening public financial management systems, decentralising service delivery and improving accountability through digitalisation and civic engagement will also be critical to achieving governance convergence with other regions. Without these reforms, Africa risks remaining on a slower governance improvement path, limiting its ability to mobilise resources and implement transformative development strategies.
Chart 28 shows the composite governance index in the Current Path compared to the Governance scenario from 2020 to 2043.
Africa’s governance landscape is assessed most prominently through the Ibrahim Index of African Governance (IIAG), which tracks dimensions such as security and rule of law, participation, human rights, economic opportunity, and human development. Despite being the only continent with a dedicated governance index, Africa grapples with uneven performance across its regions and income groups.
In 2023, the continent’s average governance score (the composite governance index in the modelling) stood at 0.46 out of a possible 1, below South America’s 0.62 and South Asia’s 0.51, highlighting persistent institutional weaknesses compared with peer regions. Within Africa, governance outcomes diverge sharply by income level: upper-middle-income countries averaged 0.54, compared with 0.48 for lower-middle-income countries and just 0.41 for low-income countries. High performers such as Mauritius, Cabo Verde and Botswana demonstrate the dividends of strong institutions. At the same time, fragile states like Somalia, South Sudan and the Central African Republic continue to pull down the continental average.
Under the Current Path, Africa’s composite governance index will rise modestly to 0.54 by 2043, reflecting incremental institutional strengthening but falling short of the levels seen in more advanced developing regions. Upper-middle-income countries will improve to 0.60, while lower-middle- and low-income countries will rise to 0.56 and 0.50, respectively. These gains, though encouraging, remain uneven and expose the challenge of aligning governance progress with Africa’s demographic and economic transitions.
By contrast, the Governance Scenario envisions a more ambitious and coordinated improvement, lifting Africa’s composite governance index to 0.56 by 2043, a 0.02 point gain above the Current Path across all income groups. Although seemingly modest, this improvement is transformative in its fiscal and social implications. Stronger institutions enhance the efficiency of public spending, reduce leakages and improve accountability, thereby enabling governments to expand social investment without fiscal instability. For instance, government-to-household welfare transfers will rise from US$208 billion (7.82% of GDP) to US$527 billion (7.75% of GDP) under the Governance scenario, compared with US$451 billion (7.09% of GDP) under the Current Path. This underscores governance’s role in deepening social protection and reducing inequality.
Improved governance also strengthens macroeconomic outcomes. Africa’s GDP (MER) will rise from US$2.66 trillion in 2023 to US$6.8 trillion in 2043 under the Governance scenario, compared with US$6.36 trillion in the Current Path. This difference of nearly US$440 billion reflects gains from reduced corruption, greater investor confidence, more predictable regulatory frameworks and more efficient public resource allocation. These dynamics are central to Africa’s aspirations under Agenda 2063, particularly the flagship goal of creating capable institutions and transformative leadership as prerequisites for inclusive and sustainable growth.
When compared with peer regions, Africa’s gradual governance improvement is promising but insufficient. South America’s stronger average is underpinned by decades of institutional consolidation and social investment. At the same time, South Asia’s governance transition has benefited from robust state capacity in large economies such as India. For Africa, accelerating institutional reform, reducing fragility and fully implementing continental mechanisms such as the APRM are critical to catch up.
The Governance scenario demonstrates that strengthening institutions is not only about enhancing state capacity but also about delivering inclusive development outcomes. By improving government effectiveness, transparency and accountability, Africa can reduce poverty and inequality, mobilise more domestic resources and create a more enabling environment for private sector-led growth. These reforms are essential to avoiding governance fragility traps in low-income states, consolidating democratic gains in middle-income countries, and aligning fiscal and institutional performance with the aspirations of Agenda 2063 and the SDGs’ governance agenda (Goal 16). Ultimately, embedding governance reform within Africa’s broader transformation agenda provides the foundation for sustained growth, equitable service delivery and resilience against shocks, ensuring that Africa’s demographic and economic transitions translate into long-term prosperity.
Chart 29 presents GDP per capita in purchasing power parity (PPP) in the Current Path and each of the eight sectoral scenarios. The data is from 2020 with a forecast to 2043.
On the Current Path, Africa’s GDP per capita (PPP) rises from US$4 850 in 2023 to US$6 210 by 2043. While this suggests moderate gains, the pace remains insufficient to unlock the continent’s full potential or move decisively beyond the middle-income trap. This sluggish improvement highlights the structural disconnect between aggregate GDP growth and household welfare, aggravated by rapid population growth, high dependency ratios and the prevalence of informal and low-productivity employment. Compared with South Asia, which has leveraged industrialisation and human capital gains to sustain faster per capita growth, and South America, which maintains higher absolute income levels despite slower growth, Africa risks falling further behind unless growth is translated more effectively into broad-based improvements in household incomes and other indices of progress.
Contrastingly, the scenario analysis shows that targeted reforms can deliver higher and more inclusive growth. Among these, the AfCFTA scenario produces the largest gains, raising GDP per capita to US$6 590 by 2043, followed by the Governance scenario, which lifts it to US$6 500. These outcomes highlight how regional integration and institutional effectiveness are economy-wide multipliers, reinforcing productivity, competitiveness and resilience.
Other scenarios also contribute positively, though with smaller gains. The Demographics and Health scenario lifts GDP per capita to US$6 420, highlighting the benefits of improved health outcomes and a more favourable dependency ratio. The Manufacturing scenario raises it to US$6 400, underscoring the productivity dividends of industrialisation and value addition. The Agriculture and Financial Flows scenarios push GDP per capita to US$6 370, reflecting the importance of food security, rural transformation and stronger investment inflows. The Education scenario yields a similar though slightly smaller gain at US$6 350, emphasising the long-term returns of human capital investment. The Large Infrastructure and Leapfrogging scenario adds the least increment, raising GDP per capita to US$6 310, as much of its impact lies in enabling rather than directly driving productivity growth. In addition, it must be noted that some elements relating to infrastructure, such as potable water, improved sanitation and irrigation are included in the relevant scenarios and not in the Large Infrastructure and Leapfrogging scenario.
While the sequence of some scenario impacts differs by income group, AfCFTA and governance remain the top drivers. Thus, for Africa to unlock its full demographic and structural potential, AfCFTA and governance reforms must remain the cornerstone of its long-term development agenda under frameworks such as Agenda 2063 and the SDGs. In upper-middle-income countries, the Large Infrastructure and Leapfrogging scenario ranks third, reflecting the greater role of connectivity and digitalisation in more advanced economies. By contrast, the Demographics and Health scenario contributes the lowest incremental gain, as fertility and mortality rates are already relatively lower. In lower-middle-income countries, the Manufacturing scenario ranks third, underscoring the centrality of industrialisation in economies with expanding labour forces and urbanising populations. The Demographics and Health scenario follows in fourth place, reflecting the gradual but slower demographic transition in these countries. In low-income countries, agriculture remains critical. The Agriculture scenario ranks third, highlighting the importance of food systems and rural productivity for poverty reduction. The Demographics and Health scenario follows, pointing to the role of fertility decline, improved health and reduced child mortality in shaping income gains.
The large impact of the AfCFTA scenario underscores the transformative impact of continental trade integration. By reducing tariff and non-tariff barriers, harmonising rules of origin and improving trade facilitation, AfCFTA creates a unified African market that allows firms to exploit economies of scale, reorganise into regional value chains and access new opportunities in manufacturing and services. The World Bank suggests that full AfCFTA implementation could increase real incomes in Africa by around 7% or US$450 billion by 2035, driven largely by trade-facilitation and services liberalisation rather than tariffs alone. This explains why gains are evident across all income groups: upper-middle-income economies benefit from scaling competitive industries. In contrast, low- and lower-middle-income economies gain through cheaper inputs, expanded markets and job creation in agro-processing and light manufacturing. However, the magnitude of gains differs; countries with stronger industrial bases and logistics infrastructure convert a greater share of integration benefits into per capita growth, while poorer economies experience delayed effects until complementary investments in roads, border posts, standards agencies and skills catch up.
The Governance scenario demonstrates that strengthening institutions delivers equally powerful returns. Improved government effectiveness, better policy implementation and reduced corruption enhance investor confidence, raise the efficiency of public spending and lower transaction costs across the economy. Empirical evidence from the World Bank’s Worldwide Governance Indicators (WGI) shows a strong correlation between institutional quality and income per capita. At the same time, AfDB’s outlook for 2024 confirms that governance reforms underpin higher growth and investment flows across African sub-regions. Here too, income group differences matter: low-income countries enjoy the largest marginal returns from basic improvements in public financial management, service delivery and procurement integrity; lower-middle-income countries gain from regulatory reforms that formalise firms and deepen access to credit; and upper-middle-income countries benefit from second-generation reforms such as state-owned enterprise restructuring, competition policy and judicial efficiency.
Overall, the sequence and magnitude of all eight scenario gains underscore the complementarity of reforms. Infra-Africa trade integration, governance reforms and industrial development mutually reinforce one another, while education, health, agriculture and infrastructure create the enabling conditions for sustained growth. The results highlight that reform in one sector is sufficient on its own; instead, an integrated reform agenda, rooted in the aspirations of Agenda 2063, is necessary to accelerate convergence, avoid the middle-income trap and secure a future of shared prosperity for Africa’s growing population.
Chart 30 presents poverty in the Current Path and for each scenario, from 2020 to 2043. The user can select the number of extremely poor people or the percentage of the population.
Poverty remains one of Africa’s most persistent development challenges, with nearly one-third of its population living below the extreme poverty threshold of US$2.15 per day (2017 PPP) in 2023. Under the Current Path, progress is steady but insufficient: poverty falls from 31% (461 million people) in 2023 to 19.1% of the population (440 million people) by 2043. While this decline represents important gains, the sheer scale of Africa’s population growth means that hundreds of millions will remain trapped in deprivation. Compared to South Asia and South America, which have experienced much sharper declines in poverty since the 1990s, albeit with lower rates of population growth, and through rapid industrialisation, export diversification and robust social protection systems, Africa’s baseline trajectory underscores the risk of entrenched inequality and slow structural transformation.
Among the sectoral scenarios, the Governance scenario delivers the most substantial impact, reducing poverty to 17.4% (400 million people) by 2043. This outcome underscores how institutional effectiveness, transparent public spending and stronger accountability mechanisms directly translate into improved service delivery, equitable resource distribution and broader welfare gains. Remember that the Governance scenario includes social welfare transfers, positively impacting poverty. The Education and AfCFTA scenarios follow closely at 17.5% (approximately 402 million people), though driven by different mechanisms. Education expands human capital, improves labour market readiness and enhances productivity, while AfCFTA accelerates job creation in tradable sectors, stimulates SMEs and improves household incomes through deeper regional integration.
The Agriculture scenario brings poverty down to 17.8%, reflecting the direct role of food security and rural livelihoods in welfare gains, particularly in low-income economies where agriculture remains the main employer. The Demographics and Health scenario reduces poverty to 18.2%, emphasising how improvements in health outcomes and lower dependency ratios support household resilience. The Manufacturing scenario achieves 18.3%, highlighting the role of industrialisation in creating employment, but also revealing that industrial gains take longer to diffuse into household incomes. The Financial Flows and Large Infrastructure and Leapfrogging scenarios deliver smaller reductions, 18.4% and 18.6%, respectively, showing that while capital inflows, connectivity and energy access are enablers, they require strong institutional and social policy linkages to translate into pro-poor growth.
Differences across income groups further explain the variation in outcomes. In low-income countries, poverty remains stubbornly high due to weak structural transformation, limited fiscal space and high dependency on subsistence agriculture; here, the AfCFTA scenario has the greatest impact by creating access to new regional markets and diversifying economic opportunities. In lower-middle-income countries, the Education scenario proves most effective, reflecting the catalytic role of skills development and vocational training in unlocking youth employment potential. For upper-middle-income countries, gains are more incremental, since poverty levels are already lower; here, governance reforms and industrial upgrading provide the strongest levers for further progress.
Overall, the analysis demonstrates that while all scenarios deliver improvements relative to the Current Path, governance and AfCFTA stand out as the most transformative levers for poverty reduction. Effective governance ensures that growth is inclusive and equitably distributed, while AfCFTA expands the scale of opportunities available to households, particularly in low- and lower-middle-income countries. Without progress in these two areas, sectoral interventions risk delivering only modest poverty reduction in the face of Africa’s demographic and structural pressures.
Chart 31 presents GDP in the Current Path and in the Combined scenario, from 2020 to 2043. The data is in US$ 2017 and at market exchange rates.
The Combined scenario consists of the combination of all eight sectoral scenarios, namely Governance, Demographics and Health, Education, Large Infrastructure and Leapfrogging, Agriculture, Manufacturing, AfCFTA and Financial Flows.
On the Current Path, Africa’s GDP (MER) will expand from US$2.66 trillion in 2023 to US$6.36 trillion by 2043, translating to an average annual growth rate of about 4.6%. This growth reflects incremental progress in investment, consumption and exports. Still, it remains insufficient to achieve the scale of transformation outlined in the AU’s Agenda 2063 and the SDGs, both of which call for accelerated structural change, job creation and resilience in the face of climate and demographic pressures. Compared to South Asia, which is expected to maintain higher average growth driven by rapid industrialisation and human capital improvements, Africa’s trajectory on the Current Path highlights both progress and its limitations.
The Combined scenario, by contrast, envisions the coordinated and effective implementation of interventions across multiple development pillars. In this integrated framework, reforms are not pursued in isolation but reinforce one another, generating compounding productivity and efficiency gains. Under this scenario, Africa’s average annual GDP growth accelerates to 6.2%, a level comparable to the growth surges that lifted parts of East and South Asia into middle- and high-income status.
As a result, Africa’s GDP (MER) rises to US$8.87 trillion by 2043, approximately US$2.51 trillion higher than the Current Path forecast. This substantial differential illustrates the synergistic effect of multi-sector reform, where strategic alignment in policy implementation magnifies development outcomes far beyond what incremental, sector-specific improvements can achieve. The scenario also reflects Africa’s growing capacity to harness the opportunities of regional integration through AfCFTA, while mobilising both domestic and international capital more effectively under stronger governance and institutional conditions.
The gains from the Combined scenario vary across income groups but are universally positive. Low-income countries record the most dramatic acceleration, with average annual GDP growth rising to 8.3% by 2043, around two percentage points higher than their Current Path forecast. This surge reflects the transformative potential of combining agricultural modernisation, demographic transition and structural diversification. Lower-middle-income countries also benefit strongly, with growth averaging 6.4%, a 1.7 percentage point increase relative to the Current Path. These economies gain most from industrialisation, trade integration and human capital improvements. Upper-middle-income countries, while already more structurally diversified, still see their growth rise to 4.3% by 2043, also 1.7 percentage points above baseline, reflecting the continued benefits of governance reforms, advanced services and infrastructure-led competitiveness.
The Combined scenario demonstrates that Africa’s growth ceiling is far higher than Current Path forecasts suggest, provided reforms are integrated, sequenced and sustained. The policy challenge is therefore not only about designing effective interventions within single sectors, but about ensuring cross-sector alignment, where progress in education and health feeds into productivity gains, infrastructure complements industrial growth and governance improvements amplify investment returns. If realised, this trajectory could place Africa firmly on the path to sustained prosperity, helping the continent escape the middle-income trap, achieve broad-based poverty reduction and fulfil the aspirations of Agenda 2063.
Chart 32 presents GDP per capita in purchasing power parity (PPP) in the Current Path and the Combined scenario. The data is from 2020 with a forecast to 2043.
While Africa’s aggregate GDP expands strongly under the Combined scenario, its most important impact is seen in per capita incomes, which provide a clearer measure of improving living standards. By 2043, Africa’s GDP per capita (PPP) would reach US$8 040, about US$1 830 higher than the Current Path forecast of US$6 210. This uplift represents not just faster economic growth, but the cumulative effect of coordinated reforms in governance, education, health, trade, manufacturing, agriculture, infrastructure and financial mobilisation.
The distribution of gains across income groups highlights the broad-based benefits of an integrated reform agenda. Upper-middle-income countries, already at relatively higher levels, see GDP per capita rise from US$13 000 in 2023 to US$18 790 by 2043, compared with just US$14 870 under the Current Path. This suggests that stronger governance, institutional reforms and regional integration help consolidate higher incomes and sustain growth in economies at risk of the middle-income trap.
For lower-middle-income countries, GDP per capita climbs from US$5 880 in 2023 to US$9 980 by 2043, a significant increase over the US$7 800 projected under the baseline. Here, the gains reflect the combined impact of industrialisation, human capital improvements and market integration, which create opportunities for large, youthful populations.
The largest relative improvement is seen in low-income countries, where GDP per capita more than doubles from US$1 850 in 2023 to US$4 060 by 2043, compared with only US$3 060 under the Current Path. These outcomes show how reforms in agriculture, education and demographic-health transitions can unlock transformative welfare gains in the continent’s most vulnerable economies.
The Combined scenario demonstrates that Africa’s long-term prosperity is achievable only through integrated, multi-sectoral reform. For upper-middle-income countries, the challenge is to avoid stagnation by deepening structural transformation and innovation. For lower-middle-income countries, the priority is accelerating industrialisation and trade integration to absorb large labour surpluses. For low-income countries, agricultural modernisation, basic infrastructure and human capital investment are critical to breaking cycles of poverty and dependency. In all cases, aligning these reforms with Agenda 2063 and the SDGs will be essential to translating aggregate growth into meaningful improvements in living standards.
Chart 33 presents the value added by sector in the Current Path and in the Combined scenario, from 2023 to 2043. The data is in US$ 2017 and as a percentage of GDP.
The modelling provides forecasts in six economic sectors, namely agriculture, energy, materials (including mining), manufactures, services and ICTech.
Africa’s economic transformation is fundamentally about shifting the balance of value creation from low-productivity agriculture toward manufacturing and modern services. Under the Current Path, this transition remains incomplete, with agriculture continuing to employ most of the labour force, especially in low- and lower-middle-income countries, despite its declining share of GDP, and manufacturing showing only modest gains compared to the services sector. The Combined scenario, however, presents a more productivity-driven structural shift, where coordinated investments in governance, infrastructure, education, trade integration and industrial policy catalyse diversification and industrialisation.
By 2043, the ICT sector’s share of GDP rises by 1.12 percentage points above the Current Path, reaching approximately 6.3%. This reflects the digital transformation agenda sweeping across Africa, supported by initiatives like the Smart Africa Alliance and national broadband strategies accelerating connectivity and digital inclusion. Manufacturing and materials also expand their GDP shares by 0.37 and 0.25 percentage points to reach 16.66% and 7.64%, respectively, signalling stronger industrial linkages and greater domestic value addition in sectors such as agro-processing, mineral beneficiation and light manufacturing. In contrast, agriculture and services contract marginally in proportional terms, not because they decline in absolute size, but because productivity in higher-value sectors grows faster.
The structural transformation pattern differs across income groups. Upper-middle-income African countries experience larger marginal gains in manufacturing, reflecting their stronger industrial bases, better infrastructure and greater integration into global value chains. Lower-middle-income countries follow the continental pattern, with balanced gains across ICT, manufacturing and materials. However, low-income countries record positive marginal gains only in ICT and materials, while agriculture remains structurally dominant in employment but less dynamic in terms of value-added growth. This divergence highlights the risk of a two-speed Africa, where some economies progress toward high-income structural transformation while others risk being left behind.
Despite proportional shifts, absolute output expands across all sectors under the Combined scenario, underscoring the positive spillover effects of technological upgrading and industrial dynamism. By 2043, the services sector remains the largest contributor in absolute terms, adding US$1.38 trillion more than in the Current Path. Manufacturing follows with an additional US$442.7 billion, ICT with US$230.6 billion, materials with US$207.9 billion, energy with US$139.2 billion and agriculture with US$110.1 billion. These broad-based gains demonstrate that sectoral expansion is not a zero-sum game: as manufacturing and ICT expand, they create multiplier effects across logistics, finance, energy and agriculture, reinforcing the overall growth trajectory.
The Combined scenario aligns with the aspirations of Agenda 2063 and the AfCFTA industrialisation agenda, both of which emphasise structural transformation as the cornerstone of Africa’s journey toward high-income status. By expanding ICT and manufacturing while sustaining productivity gains in services and agriculture, Africa can not only raise incomes but also avoid the middle-income trap, where economies stagnate due to weak innovation and shallow industrial bases. The challenge, however, lies in ensuring that low-income countries are not locked into primary production. Targeted investments in education, skills training, SME support and regional value chains are therefore essential to ensure all income groups can participate in, and benefit from, Africa’s structural transformation.
Chart 34 presents the size of the informal sector in the Current Path and in the Combined scenario, from 2020 to 2043.
The informal sector has long functioned as a buffer for employment in Africa, especially in urban and peri-urban centres where formal job creation lags behind labour force growth. While it provides essential income-generating opportunities for millions, informality is typically associated with low productivity, limited access to social protection, weak regulatory oversight and heightened vulnerability to economic shocks. For many households, informal activities are a survival strategy rather than a pathway to upward mobility.
Under the Current Path, informality persists as a defining feature of Africa’s economies. The informal sector’s share of GDP remains above 24%, while informal employment accounts for over 53% of the labour force by 2043. This trajectory underscores persistent gaps in job creation within high-productivity sectors such as manufacturing, ICT and modern services. It also reflects the limited impact of current policies aimed at enterprise registration, tax compliance and SME financing, many of which have been fragmented or insufficiently enforced. Importantly, income group disparities remain stark: low-income countries are forecasted to retain the highest informality levels, while upper-middle-income countries see gradual declines, reflecting stronger formal labour markets and institutional capacity.
By contrast, the Combined scenario charts a more transformative pathway. Under this scenario, the informal sector’s share of GDP declines to 20.6% by 2043, while informal employment drops sharply to 40.1% of the labour force, a reduction of 13 percentage points compared to the Current Path. These improvements are the cumulative result of integrated reforms: education and skills development equip youth for formal jobs; governance reforms reduce bureaucratic and regulatory bottlenecks; financial deepening expands credit and insurance access for SMEs; and industrialisation and trade integration create higher-productivity opportunities that draw workers away from subsistence-level activities.
The informal employment trajectory aligns Africa more closely with the experiences of South America, where sustained industrialisation, export diversification, and targeted social policies gradually reduced informality. However, Africa’s larger demographic pressures, particularly its rapidly expanding youth population, mean that without comprehensive reform, informality risks becoming entrenched, perpetuating cycles of poverty and vulnerability.
For Africa to fully unlock the potential of the Combined scenario, policy priorities must focus on both the demand and supply sides of the labour market. On the demand side, this means scaling up investments in labour-intensive manufacturing, agro-processing and digital services that can absorb large numbers of workers. Regarding supply, reforms should target education, TVET and digital literacy to prepare the workforce for evolving job demands. Equally, governments must expand social protection floors to gradually integrate informal workers into contributory schemes, while simultaneously reducing barriers to SME registration and taxation. Aligning these reforms with Agenda 2063’s aspirations for inclusive growth and the SDG target of decent work for all (SDG 8) will ensure that Africa’s demographic and economic transitions deliver broad-based benefits.
Chart 35 presents poverty in the Current Path and the Combined scenario, 2020 to 2043
Unlike siloed interventions, the Combined scenario tackles both the drivers and consequences of poverty, delivering a transformative reduction in extreme deprivation. By 2043, the share of Africans living below the US$2.15/day poverty line falls to 10.9% of the population (about 241 million people). This outcome is 8.2 percentage points lower than the Current Path forecast and means that 199 million more people are lifted out of poverty than would otherwise be the case.
The benefits are particularly pronounced in low-income countries, where poverty reduction is most urgent. By 2043, about 120.5 million additional people will be lifted out of poverty compared with the Current Path forecast of 270.6 million people. This reflects the compounding impact of investments in health, education and agricultural productivity. Lower-middle-income countries also make substantial gains, with an extra 74.3 million people escaping poverty compared to the Current Path’s 154.1 million forecast. In upper-middle-income countries, where poverty rates are already lower, the gains are more modest but still meaningful: 3.9 million additional people lifted out of poverty relative to the 14.8 million forecast under the baseline.
The Combined scenario also demonstrates that reducing poverty is not only about raising incomes but also about tackling income inequality. Africa’s Gini coefficient, which stagnates at 0.40 between 2023 and 2043 under the Current Path, declines to 0.37 by 2043 under the Combined scenario. This improvement reflects the distributive effects of more inclusive growth, targeted social protection and wider access to education, health and productive assets.
Income inequality remains highest in upper-middle-income countries, where the Gini stagnates at 0.47 under the Current Path. However, under the Combined scenario, it declines to 0.45, reflecting better redistribution mechanisms and stronger labour market integration. Lower-middle- and low-income countries also see reductions of around 0.2 points, reinforcing the role of redistributive policies, inclusive industrialisation and expanded formal employment in narrowing inequality.
The Combined scenario highlights that poverty reduction in Africa requires growth and redistribution. Pro-poor policies, such as targeted cash transfers, universal health and education access and rural infrastructure, must complement macroeconomic reforms that drive industrialisation and job creation. Furthermore, tailoring poverty reduction strategies to income group contexts is critical: low-income countries require large-scale investments in basic services and agricultural productivity, while middle-income economies must focus on SME development, value chain integration and labour-intensive industrialisation. Aligning these strategies with Agenda 2063’s aspiration of “A prosperous Africa based on inclusive growth and sustainable development” and the SDGs will ensure that poverty reduction is embedded in Africa’s long-term transformation.
Chart 36 compares life expectancy in the Current Path with the Combined scenario from 2020 to 2043.
Life expectancy is a central measure of human development, reflecting not only the strength of healthcare systems but also the broader socio-economic and environmental conditions that shape well-being. In 2023, Africa’s life expectancy stood at 67.3 years, one of the lowest amongst global regions, compared to 71 years in South Asia and 77 years in South America. This gap highlights the combined effects of Africa’s high burden of communicable diseases, rising prevalence of NCDs, limited access to quality healthcare, persistent poverty and inadequate nutrition.
Under the Current Path, gradual progress is expected, with life expectancy forecasted to rise to 72.2 years by 2043. This trajectory reflects improvements in disease control (notably malaria and HIV/AIDS), better maternal and child health and modest investments in healthcare systems. However, it still falls short of the pace achieved in South Asia, where aggressive health system strengthening, education gains and targeted poverty reduction policies enabled a rapid rise in life expectancy.
The Combined Scenario, by contrast, forecasts a much stronger improvement, with life expectancy reaching 75.1 years by 2043, 2.9 years higher than the Current Path forecast. This outcome demonstrates the synergies created by cross-sectoral reforms. Expanded access to quality education contributes to better health literacy and maternal care, infrastructure investment improves water, sanitation and energy for health facilities, governance reforms reduce resource leakages and social equity measures expand access to essential health services. Together, these drivers create a healthier population that is less vulnerable to preventable deaths.
Improvements are evident across all income groups. Upper-middle-income countries maintain the highest life expectancy levels, consolidating gains through stronger healthcare systems and higher social spending. Still, the Combined scenario ensures that even low- and lower-middle-income countries make major gains, with all groups reaching above 74 years by 2043. This narrowing of gaps suggests progress toward a more equitable health transition across Africa’s diverse economies and the African Union’s Agenda 2063 life expectancy target of 75. Generally, the Combined scenario trajectory reflects the transformative effect of targeted interventions in health, nutrition and social protection, especially across the low-income and lower-middle-income countries.
Gender dynamics also follow global patterns, with women consistently outliving men. Under the Combined scenario, female life expectancy rises from 69.3 years in 2023 to 77.3 years by 2043, compared with 74.5 years under the Current Path. For men, life expectancy increases from 65.2 years in 2023 to 72.9 years, relative to 70 years under the Current Path. The persistence of the gender gap reflects both biological factors and social conditions. Still, the fact that men and women see notable gains illustrates the broad-based benefits of improved healthcare systems, safer environments and expanded access to essential services.
The rise in life expectancy under the Combined scenario demonstrates that health outcomes cannot be divorced from multi-sectoral progress. Beyond strengthening healthcare systems, gains depend on investments in education, clean water, sanitation, nutrition, energy access and poverty reduction. Governance improvements and reduced inequality also contribute by ensuring that resources are better allocated and services are more evenly distributed. These advances align directly with Agenda 2063’s Aspiration 1 for a healthy and well-nourished Africa and SDG 3 (Good Health and Well-being).
Chart 37 compares carbon emissions in the Current Path with the Combined scenario from 2020 to 2043.
Africa’s carbon profile is shaped by its dual status as the least industrialised region and one of the most climate-vulnerable. Despite being home to nearly 18% of the world’s population, the continent consumes just 6% of global energy and contributes less than 3% of global energy-related CO₂ emissions. On a per-capita basis, Africa emits about 1 tonne of CO₂ annually, compared to 2.5 tonnes in South America and 4-5 tonnes in Asia. This disparity highlights Africa’s historic underdevelopment and its potential to pursue a low-carbon development pathway that balances industrialisation with climate goals, as well as its vulnerability to climate change impacts driven largely by other regions.
Under the Current Path, Africa’s carbon emissions from fossil fuels will grow from 432 million tons in 2023 to about 790 million tons by 2043. While this marks a steady increase, Africa’s per capita emissions will remain far below global averages. For comparison, Africa’s total emissions are lower than those of South Asia, despite South Asia’s larger population, and slightly higher than South America, which has already reached higher levels of industrialisation. This gap underscores Africa’s potential to industrialise without replicating the high-carbon trajectories of peer regions.
The Combined scenario forecasts that emissions will rise slightly faster, reaching 828 million tons by 2043, or 38 million tons higher than the baseline forecast. These additional emissions largely stem from accelerated industrialisation and expanded energy access, particularly in low-income and lower-middle-income countries, where emissions rise by 13 million and 29 million tons above their baseline forecasts, respectively. In contrast, upper-middle-income countries reduce their emissions by 4 million tons relative to the Current Path, reflecting earlier adoption of renewables, efficiency gains and clean technology.
By 2043, lower-middle-income countries will be Africa’s largest emitters, driven by rapid urbanisation, expanding manufacturing bases and rising household energy demand. This contrasts with upper-middle-income economies, which achieve relative decoupling of growth and emissions through renewable adoption, and with low-income economies, where energy poverty still limits emissions despite population growth.
The Combined scenario illustrates the trade-off between growth and emissions: industrialisation and energy access expand, but emissions also rise. However, Africa’s absolute contribution to global emissions remains modest, and its per capita emissions will still be among the lowest worldwide, reinforcing the continent’s case for climate justice in global negotiations.
Meeting development and climate goals will require Africa to double or triple its annual energy buildout, scaling renewable energy, mini-grids and regional power pools under initiatives like the AfSEM and the PIDA. Complementary policies, such as carbon pricing, efficiency standards and targeted support for green manufacturing, can ensure that emissions growth remains aligned with Agenda 2063’s aspirations for sustainable industrialisation and SDG 13 on climate action. If implemented effectively, these measures would allow Africa to sustain rapid growth while positioning itself as a leader in green industrialisation, avoiding the high-emission traps experienced by other regions during their development.
Chart 38 compares energy production from 2020 to 2043 in the Current Path with the Combined scenario in nine types, namely oil, gas, coal, hydro, nuclear, solar, wind, geothermal and other renewables. The data is converted into billion barrels of oil equivalent (BOE) to allow for comparisons between different sources. Note that energy production could be for domestic use or export.
Energy production remains one of Africa’s most pressing development bottlenecks, with far-reaching implications for industrialisation, trade competitiveness and inclusive growth. Despite being richly endowed with fossil fuel reserves and world-class renewable potential, Africa continues to face structural deficits in energy supply, particularly in low- and lower-middle-income countries. This energy gap is a key factor constraining progress toward the African Union’s Agenda 2063 targets, which prioritise universal access to affordable, reliable and sustainable energy as a cornerstone for economic transformation.
Under the Current Path, Africa’s total energy production will grow from 5.67 billion barrels of oil equivalent (BOE) in 2023 to 7.66 billion BOE by 2043. The production mix remains dominated by fossil fuels, particularly oil, natural gas and coal, with relatively modest growth in renewables. This trajectory leaves the continent vulnerable to global energy price volatility and carbon lock-in, while also failing to meet the rapidly growing demand from industrialisation, digitalisation and urbanisation.
The Combined scenario envisions a more ambitious energy transformation. By 2043, Africa’s energy production rises to 10.02 billion BOE, which is 2.36 billion BOE higher than the Current Path forecast. The bulk of this expansion is driven by renewables, with solar energy emerging as the dominant contributor. Solar alone accounts for nearly half of the additional production (45%, or 1.07 billion BOE) by 2043. Solar energy production rises dramatically from 23.4 million BOE in 2023 to 1.79 billion BOE by 2043 under the Combined scenario, compared to only 722 million BOE under the Current Path. This trajectory reflects Africa’s unparalleled solar potential, which is estimated at more than 60% of the world’s best solar resources.
Wind energy also significantly contributes, expanding from 19.4 million BOE in 2023 to 410 million BOE by 2043 under the Combined scenario, compared with 293 million BOE under the Current Path. This growth is supported by emerging initiatives in wind mapping, regional wind corridors such as in North and East Africa, hybrid energy systems and targeted deployment in remote zones with favourable conditions. Solar and wind illustrate how Africa could leapfrog traditional energy pathways and build a renewable-heavy generation mix that meets demand and aligns with global climate goals.
Even with this rapid expansion, energy demand will outpace domestic production by the early 2030s. Under the Current Path, the continent shifts from a production surplus of 1.01 billion BOE in 2023 to a deficit of 1.91 billion BOE by 2043. The Combined scenario narrows but does not eliminate this gap: by 2043, Africa still faces a deficit of 1.3 billion BOE, highlighting the scale of the challenge posed by industrialisation, digital infrastructure expansion, population growth and rising household consumption.
The deficit is most acute in low- and lower-middle-income countries. In lower-middle-income countries, the energy balance flips from a surplus of 310 million BOE in 2023 to a deficit of 1.62 billion BOE by 2043 under the Combined scenario, an improvement on the 1.84 billion BOE deficit forecasted under the Current Path, but still a substantial shortfall. In low-income countries, the deficit expands from approximately 100 million BOE in 2023 to 760 million BOE by 2043 under the Combined scenario, slightly better than the 790 million BOE deficit forecasted under the Current Path. By contrast, upper-middle-income countries maintain an energy surplus. Under the Combined scenario, their surplus expands from 790 million BOE in 2023 to 1.12 billion BOE by 2043, whereas under the Current Path, it will decline to approximately 740 million BOE. This divergence reflects differences in energy mix, investment capacity and industrial structure, with upper-middle-income economies better positioned to scale renewables and manage demand growth.
Africa’s energy challenge stems not from a lack of resources but from financing shortfalls, weak transmission infrastructure and fragmented policy frameworks. The Combined scenario underscores both the opportunities and the constraints of the continent’s energy transition. Renewables, particularly solar and wind, have the potential to drive a historic shift in supply, yet without massive and sustained investment in generation, storage, transmission and distribution, rising demand will continue to outpace production. Continental initiatives such as the AfSEM, the PIDA and the AfDB’s New Deal on Energy for Africa provide the strategic scaffolding for scaling renewable investment and enabling cross-border power trade. However, to align with Agenda 2063 and SDG 7 (universal access to clean energy by 2030), Africa must double or triple its renewable buildout, mobilise blended finance for energy infrastructure and mainstream decentralised off-grid solutions for rural electrification. Without such steps, the continent risks deepening its production–demand deficit, which would constrain industrialisation, slow digitalisation and reinforce inequities in energy access across income groups.
Chart 39 summarises the policy recommendations for Africa.
Africa stands at a critical stage of its development trajectory. With its population forecasted to rise from 1.5 billion in 2024 to 2.3 billion by 2043 under the Current Path, the continent faces the dual challenge of scaling services and infrastructure while creating millions of jobs for a fast-growing youth population. Moreover, Africa’s GDP (MER) is set to grow to US$6.36 trillion by 2043, with GDP per capita reaching US$6 210, but nearly one-fifth (19.1%) of Africans would remain trapped in extreme poverty (living under US$2.15/day). Structural transformation remains incomplete, with low-value services dominating output while agriculture and informal employment still absorb the majority of labour. The scenarios examined in this report demonstrate that coordinated reforms across trade through AfCFTA, governance, agriculture, education, manufacturing, financial flows, large infrastructure, as well as health and demographics can robustly enhance Africa’s prospects, lifting GDP to nearly US$9 trillion, rising GDP per capita to about US$8 040, reducing extreme poverty to 10.9% and raising life expectancy above 75 years by 2043.
The analysis shows that Africa’s baseline trajectory delivers steady but insufficient progress, falling short of the transformative aspirations set out in Agenda 2063 and the SDGs. Incremental reforms, while helpful, will not unlock the demographic dividend nor shield the continent from intensifying climate risks, conflict dynamics and volatility in global markets. More decisive action is required. Among the scenarios examined, trade integration under the AfCFTA and institutional strengthening through better governance emerge as the most transformative, offering the strongest potential to expand markets, reduce poverty and raise incomes. Education and manufacturing provide critical complementary drivers, equipping young people with skills while creating jobs in higher-productivity sectors. Infrastructure investment and digital leapfrogging are essential enablers of these shifts, from powering industrial corridors to expanding broadband connectivity. The Combined scenario demonstrates that the whole is far greater than the sum of its parts: when the interventions in the eight scenarios are pursued coherently, cross-sectoral reforms multiply gains, accelerating Africa’s convergence with peer regions.
Realising this vision requires ambitious but concrete policy action. Africa must deepen regional integration by fully implementing AfCFTA protocols, harmonising standards and investing in cross-border transport and energy corridors that reduce trade costs and unlock regional value chains. Stronger governance is essential, with countries needing to tackle corruption, strengthen the rule of law and professionalise public administration to improve fiscal efficiency and build investor confidence. Human capital investments must accelerate, with universal access to quality education and vocational training tailored to the needs of labour markets, particularly in STEM and digital skills, complemented by universal health coverage and child- and maternal-health interventions that extend life expectancy. Industrialisation strategies should prioritise agro-processing, light manufacturing and mineral beneficiation, supported by SME financing and targeted infrastructure to reduce dependence on raw commodity exports. Financial flows need to be mobilised more effectively, through deeper capital markets, diaspora bonds and blended finance instruments, alongside stronger measures to curb illicit financial flows and expand tax revenues. At the same time, Africa must fast-track its energy transition by doubling or tripling its annual energy buildout, scaling renewables, off-grid and mini-grid solutions, and regional power pools like the ASEM to achieve universal access and underpin industrial growth while pursuing a low-carbon growth model.
Finally, inclusive development demands that poverty reduction and equity remain at the centre of this agenda. Expanding social protection, child-focused programs and climate adaptation measures, especially in fragile and low-income countries, will be critical to breaking intergenerational poverty traps and ensuring that growth is broadly shared.
If these interventions are effectively implemented, Africa will not simply catch up with its peers; it has the chance to lead. With the world’s largest concentration of solar potential, the fastest-growing workforce and vast natural resources, Africa could become the frontline of green industrialisation and inclusive growth. A continent that today contributes less than 3% of global CO₂ emissions could demonstrate how to power rapid economic transformation without replicating the high-carbon, high-inequality pathways of the past. The choice is stark: remain locked in a cycle of modest progress and persistent vulnerability, or seize this historic demographic and resource-driven moment to transform the continent’s future. With vision, political will and coordinated reform, Africa can emerge not as a follower, but as a global leader in shaping a sustainable, equitable and prosperous 21st-century economy.
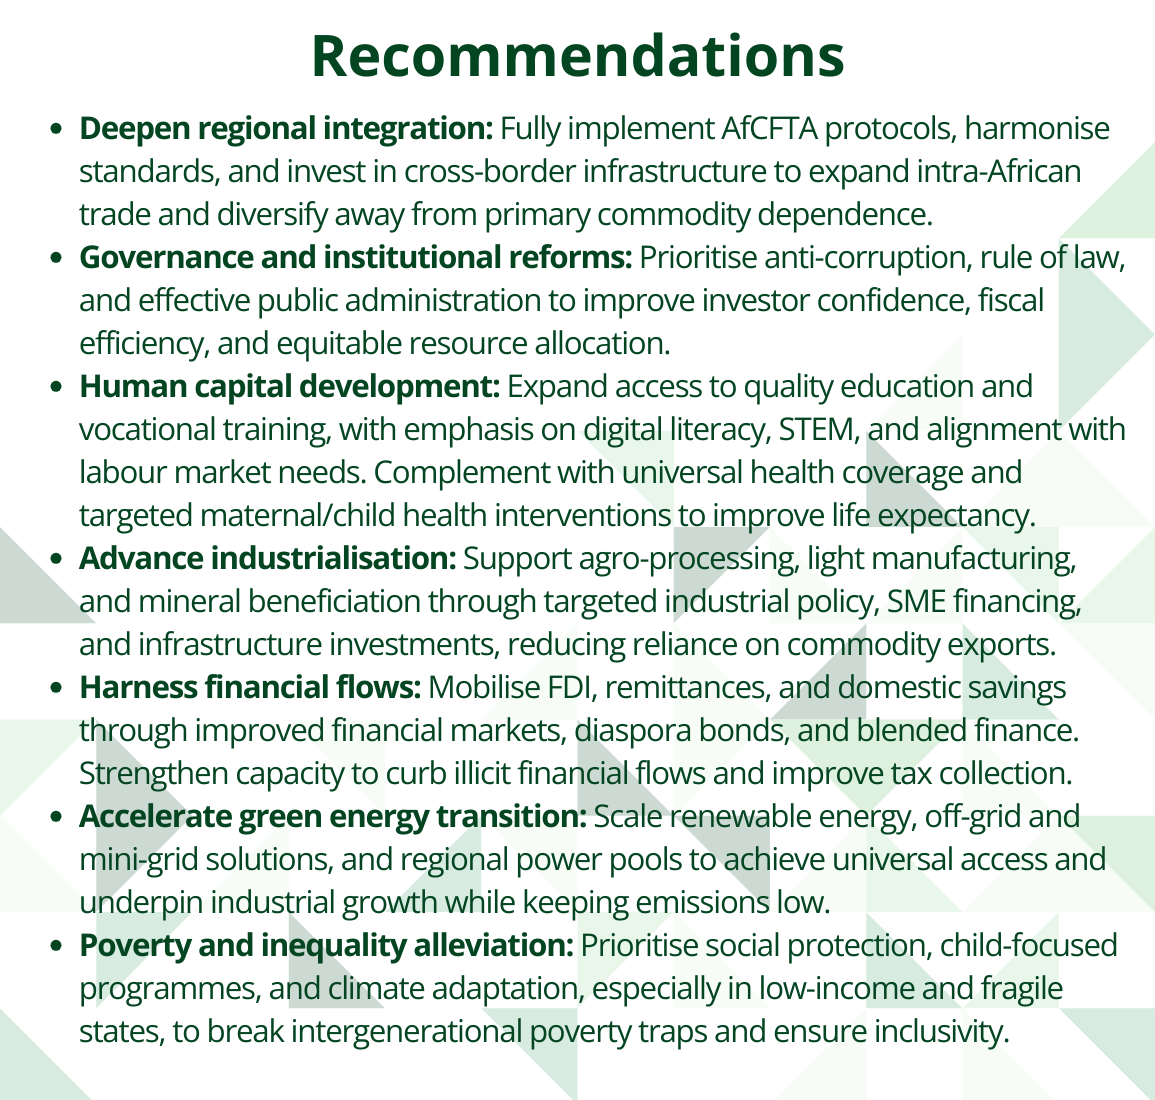
Page information
Contact at AFI team is Marvellous Ngundu and Jakkie Cilliers
This entry was last updated on 12 June 2026 using IFs v8.38.
Donors and sponsors


Reuse our work
- All visualizations, data, and text produced by African Futures are completely open access under the Creative Commons BY license. You have the permission to use, distribute, and reproduce these in any medium, provided the source and authors are credited.
- The data produced by third parties and made available by African Futures is subject to the license terms from the original third-party authors. We will always indicate the original source of the data in our documentation, so you should always check the license of any such third-party data before use and redistribution.
- All of our charts can be embedded in any site.
Cite this research
Marvellous Ngundu and Jakkie Cilliers (2026) Africa Development Futures. Published online at futures.issafrica.org. Retrieved from https://futures.issafrica.org/geographic/regions/africa/ [Online Resource] Updated 12 June 2026.