 AMU
AMU
Feedback welcome
Our aim is to use the best data to inform our analysis. See our Technical page for information on the IFs forecasting platform. We appreciate your help and references for improvements via our feedback form.
In this entry, we first describe the Current Path forecast for the Arab Maghreb Union (AMU) as it is expected to unfold to 2043, the end of the third ten-year implementation plan of the African Union’s Agenda 2063 long-term vision for Africa. The Current Path in the International Futures (IFs) forecasting model initialises from country-level data that is drawn from a range of data providers. We prioritise data from national sources.
The Current Path forecast is divided into summaries on demographics, economics, poverty, health/WaSH and climate change/energy. A second section then presents a single positive scenario for potential improvements in stability, demographics, health/WaSH, agriculture, education, manufacturing/transfers, leapfrogging, free trade, financial flows, infrastructure, governance and the impact of various scenarios on carbon emissions. With the individual impact of these sectors and dimensions having been considered, a final section presents the impact of the Combined Agenda 2063 scenario.
We generally review the impact of each scenario and the Combined Agenda 2063 scenario on gross domestic product per person and extreme poverty except for Health/WaSH that uses life expectancy and infant mortality.
The information is presented graphically and supported by brief interpretive text.
All US$ numbers are in 2017 values.
Summary
- Current Path forecast
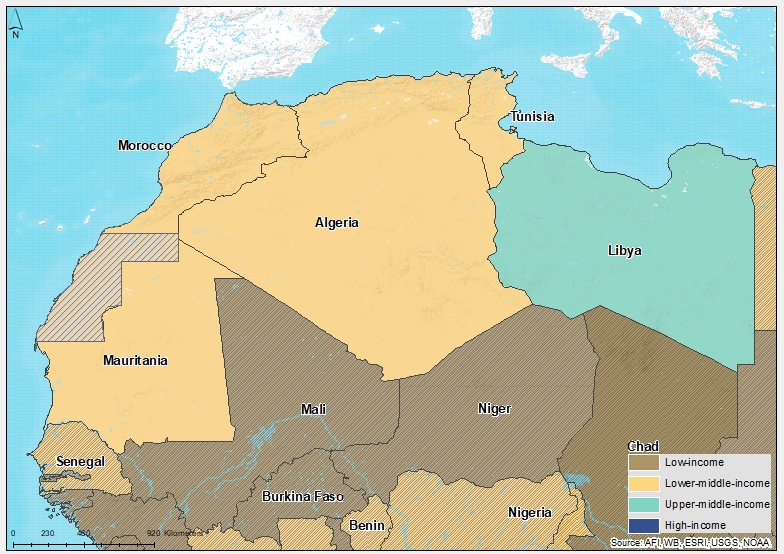
- The Arab Maghreb Union (AMU) comprises five members: Algeria, Libya, Mauritania, Morocco and Tunisia. The World Bank classifies Libya as an upper middle-income country while Algeria, Morocco, Mauritania and Tunisia are all considered lower middle-income countries. Jump to forecast: Current Path
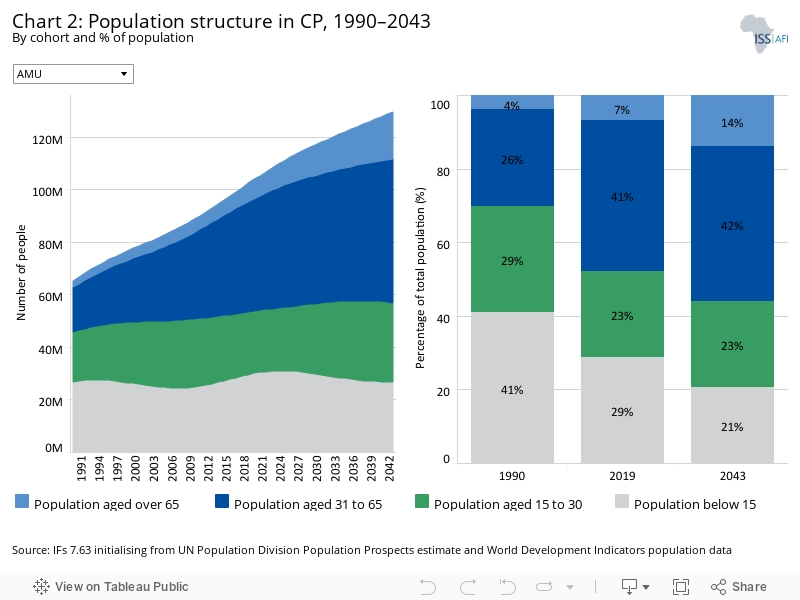
- The total population of AMU was 102.3 million in 2019 and is forecast to increase to 129.5 million by 2043. The AMU countries’ population structure is typical of countries with relatively high life expectancy and low fertility rates. Jump to Demographics: Current Path
- Economically, the AMU countries are relatively small. Their combined GDP was US$551.2 billion in 2019, equivalent to Nigeria's GDP. Algeria has the largest GDP in the zone with a GDP of US$266.5 billion, while Mauritania has the lowest GDP with US$9.9 billion in 2019. Jump to Economics: Current Path
- At US$1.90 per person a day, Mauritania is the only country within AMU members that has not yet achieved the SDG goal of eradicating extreme poverty. In the Current Path forecast, Mauritania will miss the target by a large margin as the poverty rate is forecast to be about 15.7% by 2030. Jump to Poverty: Current Path
- Carbon emissions in the AMU zone are relatively low; they stood at 99 million tons in 2019. In the Current Path forecast, carbon emissions in the area will continue to increase to 141 million tons of carbon by 2043. With an estimated 45 million tons of carbon, Algeria is the largest carbon emitter in the AMU area. Jump to Carbon emissions/Energy: Current Path
- Sectoral scenarios
- The Stability scenario models an improvement to current average levels of stability in the AMU area. It reduces the number of extremely poor people by 0.1 million compared to the Current Path forecast in 2043. Jump to Stability scenario
- In the Demographic scenario, the working-age population to dependants ratio is 2.0 by 2043 against 1.9 in the Current Path forecast in the same year. Only Mauritania has not yet achieved the minimum ratio of 1.7 working-age people for each dependant necessary for a country to expect the demographic dividend. Jump to Demographic scenario
- In the Health/WaSH scenario, the average life expectancy in the AMU is forecast to reach 80.1 years by 2043, a marginal increase above the 79.6 years in the Current Path forecast by 2043. Jump to Health/WaSH scenario
- In the Agriculture scenario, average crop yields in the AMU are 20% higher than the Current Path forecast by 2043 and reduce the proportion of people surviving on US$1.90 per day by 0.2 percentage points to 0.4% by 2043. Jump to Agriculture scenario
- In the Education scenario, the average GDP per capita in the AMU increases from US$12 000 in 2019 to US$14 500, an approximately 21% increase between 2019 and 2043 compared to 18% in the Current Path forecast over the same period. Jump to Education scenario
- In the Manufacturing/Transfers scenario, the value added of the manufacturing sector is US$12.7 billion, larger than the value forecast in the Current Path forecast in 2043. Jump to Manufacturing/Transfers scenario
- The average fixed broadband subscription is very low in the AMU area; it was seven subscriptions per 100 people in 2019. In the Leapfrogging scenario, the average fixed broadband subscriptions increase to about 50 subscriptions per 100 people by 2043 against 34 subscriptions per 100 people in the Current Path forecast, 47% higher than the Current Path forecast in 2043. Jump to Leapfrogging scenario
- In the Free Trade scenario, only Mauritania is not on track to achieve the SDG goal of eradicating extreme poverty by 2030. In this scenario, the poverty rate (<US$1.90) in Mauritania is 15% by 2030, while Algeria, Libya, Morocco and Tunisia already have their extreme poverty rate below 3% as of 2019. Jump to Free Trade scenario
- In the Financial Flows scenario, the total remittances to the AMU area are US$8.1 billion (0.8% of GDP) by 2043 compared to US$6.9 billion (0.7% of GDP) in the Current Path forecast, equivalent to US$1.2 billion larger than the Current Path forecast in 2043. Jump to Financial Flows scenario
- All the AMU countries gain from the Infrastructure scenario, improving access by at least two percentage points above the Current Path forecast by 2043. Libya will have the highest access by 2043 (100% in the scenario). Jump to Infrastructure scenario
- The Governance scenario improves the average government effectiveness score of the AMU by 31.5% between 2019 and 2043 compared to 21% in the Current Path forecast over the same period. Government is more effective in service delivery in Morocco than the other AMU countries. Jump to Goverance scenario
- The Free Trade scenario has the most significant impact on carbon emissions in the AMU countries, followed by the Manufacturing/Transfers scenario. Jump to Impact of scenario on carbon emissions
- Combined Agenda 2063 scenario
- In the Combined Agenda 2063 scenario, the average GDP per capita in the AMU area increases by 32.9% between 2019 and 2043 compared to 1.1% in the Current Path forecast over the same period. In 2043, the average GDP per capita is US$4 501 higher than in the Current Path forecast. Jump to Combined Agenda 2063 scenario
- Despite the massive impact of the Combined Agenda 2063 scenario on poverty reduction in the AMU, Mauritania is not on track to achieve the SDG goal of eradicating extreme poverty by 2030. Jump to Combined Agenda 2063 scenario
- In the Combined Agenda 2063 scenario, the carbon emissions in the AMU zone are about 16.3%, or 23 million tons of carbon, higher than the Current Path forecast. Compared to the Current Path forecast, Algeria sees the most significant increase in carbon emissions. Jump to Combined Agenda 2063 scenario
All charts for AMU
- Chart 1: Political map of AMU
- Chart 2: Population structure in CP, 1990–2043
- Chart 3: Urban and rural population in CP, 1990–2043
- Chart 4: Population density map for 2019
- Chart 5: GDP in CP, 1990–2043
- Chart 6: GDP per capita in CP, 1990–2043
- Chart 7: Informal sector value in CP, 2015–2043
- Chart 8: Value added by sector in CP, 2015–2043
- Chart 9: Agriculture production/demand in CP, 1990–2043
- Chart 10: Poverty in CP, 2015–2043
- Chart 11: Energy production by type in CP, 1990–2043
- Chart 12: Carbon emissions in CP, 1990–2043
- Chart 13: Governance security in CP and Stability scenario, 2019–2043
- Chart 14: GDP per capita in CP and Stability scenario, 2019–2043
- Chart 15: Poverty in CP and Stability scenario, 2019–2043
- Chart 16: Demographic dividend in CP and Demog scenario, 2019–2043
- Chart 17: Infant mortality in CP and Demog scenario, 2019–2043
- Chart 18: GDP per capita in CP and Demog scenario, 2019–2043
- Chart 19: Poverty in CP and Demog scenario, 2019–2043
- Chart 20: Life expectancy in CP and Health/WaSH scenario, 2019–2043
- Chart 21: Infant mortality in CP and Health/WaSH scenario, 2019–2043
- Chart 22: Yield/hectare in CP and Agric scenario, 2019–2043
- Chart 23: Agriculture imports in CP and Agric scenario, 2019–2043
- Chart 24: GDP per capita in the CP and Agric scenario, 2019–2043
- Chart 25: Poverty in CP and Agric scenario, 2019–2043
- Chart 26: Mean years of education in CP and Educ scenario, 2019–2043
- Chart 27: Education quality in CP and Educ scenario, 2019–2043
- Chart 28: GDP per capita in CP and Educ scenario, 2019–2043
- Chart 29: Poverty in CP and Educ scenario, 2019–2043
- Chart 30: Value added by sector in CP and Manufac/Transfers scenario, 2019–2043
- Chart 31: Gov welfare transfers in CP and Manufac/Transfers scenario, 2019–2043
- Chart 32: GDP per capita in CP and Manufac/Transfers scenario, 2019–2043
- Chart 33: Poverty in CP and Manufac/Transfers scenario, 2019–2043
- Chart 34: Fixed broadband access in CP and Leapfrogging scenario, 2019–2043
- Chart 35: Mobile broadband access in CP and Leapfrogging scenario, 2019–2043
- Chart 36: Electricity access in CP and Leapfrogging scenario, 2019–2043
- Chart 37: GDP per capita in CP and Leapfrogging scenario, 2019–2043
- Chart 38: Poverty in CP and Leapfrogging scenario, 2019–2043
- Chart 39: Trade balance in CP and Free Trade scenario, 2019–2043
- Chart 40: GDP per capita in CP and Free Trade scenario, 2019–2043
- Chart 41: Poverty in CP and Free Trade scenario, 2019–2043
- Chart 42: Foreign aid in CP and Financial Flows scenario, 2019–2043
- Chart 43: Inflow of FDI in CP and Financial Flows scenario, 2019–2043
- Chart 44: Remittances in CP and Financial Flows scenario, 2019–2043
- Chart 45: GDP per capita in CP and Financial Flows scenario, 2019–2043
- Chart 46: Poverty in CP and Financial Flows scenario, 2019–2043
- Chart 47: Electricity access in CP and Infrastructure scenario, 2019–2043
- Chart 48: Rural road access in CP and Infrastructure scenario, 2019–2043
- Chart 49: GDP per capita in CP and Infrastructure scenario, 2019–2043
- Chart 50: Poverty in CP and Infrastructure scenario, 2019–2043
- Chart 51: Gov effectiveness in CP and Governance scenario, 2019–2043
- Chart 52: GDP per capita in CP and Governance scenario, 2019–2043
- Chart 53: Poverty in CP and Governance scenario, 2019–2043
- Chart 54: Carbon emissions in CP and scenarios, 2019–2043
- Chart 55: GDP per capita in CP and scenarios, 2019–2043
- Chart 56: GDP per capita in CP and Combined scenario, 2019–2043
- Chart 57: Poverty in CP and Combined scenario, 2019–2043
- Chart 58: Value added by sector in CP and Combined scenario, 2019–2043
- Chart 59: GDP in CP and Combined scenario, 2019–2043
- Chart 60: Carbon emissions in CP and Combined scenario, 2019–2043


This page provides an overview of the key characteristics of AMU along its likely (or Current Path) development trajectory. The Current Path forecast from the International Futures forecasting (IFs) platform is a dynamic scenario that imitates the continuation of current policies and environmental conditions. The Current Path is therefore in congruence with historical patterns and produces a series of dynamic forecasts endogenised in relationships across crucial global systems. We use 2019 as a standard reference year and the forecasts generally extend to 2043 to coincide with the end of the third ten-year implementation plan of the African Union’s Agenda 2063 long-term development vision.
The AMU is an economic and political organisation formed by the five Maghreb countries: Algeria, Libya, Morocco, Tunisia and Mauritania. These countries have strong historical, cultural and language affinities. The AMU was established on 17 February 1989 and is headquartered in Rabat, Morocco. The AMU represents 19% of Africa's area and 40% of the Arab world. It borders the Mediterranean Sea and the Atlantic Ocean and is rich in natural resources, including oil, gas, phosphates, iron ore, agricultural products, vast fishing banks and tourist attractions.
The Union has been unable to achieve tangible progress on its goals due to deep economic and political disagreements between Morocco and Algeria regarding, among others, the issue of Western Sahara. Competing domestic interests combined with political deadlocks among AMU members have resulted in a neglect of regional integration efforts within the Maghreb. No high-level meetings have taken place since 3 July 2008 and the Union is seen as largely dormant.
The World Bank classifies Libya as an upper middle-income country while Algeria, Morocco, Mauritania and Tunisia are considered lower middle-income countries.
Collectively, the AMU countries had a population of 102.3 million in 2019, representing about 8% of Africa’s population. In the Current Path forecast, the region's total population will increase to 129.5 million by 2043. At this point, the AMU will account for 6% of Africa’s population. Of the population, 28.8% is below 15 years of age and it is forecast to decline gradually to 20.6% by 2043. The elderly population comprised about 7% in 2019 and it is projected to be 14% by 2043.
Algeria is the most populous country in the AMU, with 43 million people in 2019 and 57 million by 2043 while Mauritania has the lowest population (4.5 million in 2019 and 7.8 million by 2043).
The AMU countries’ population structure is typical of countries with relatively high life expectancy and low fertility rates.
The working-age cohort, 15- to 64 years of age, is the largest share of the population, and this can be a potential source of growth provided the labour force is well trained and there are employment opportunities. In 2019, the working-age population constituted about 64.4% of the population, and it is forecast to increase slightly to 65.5% by 2043.
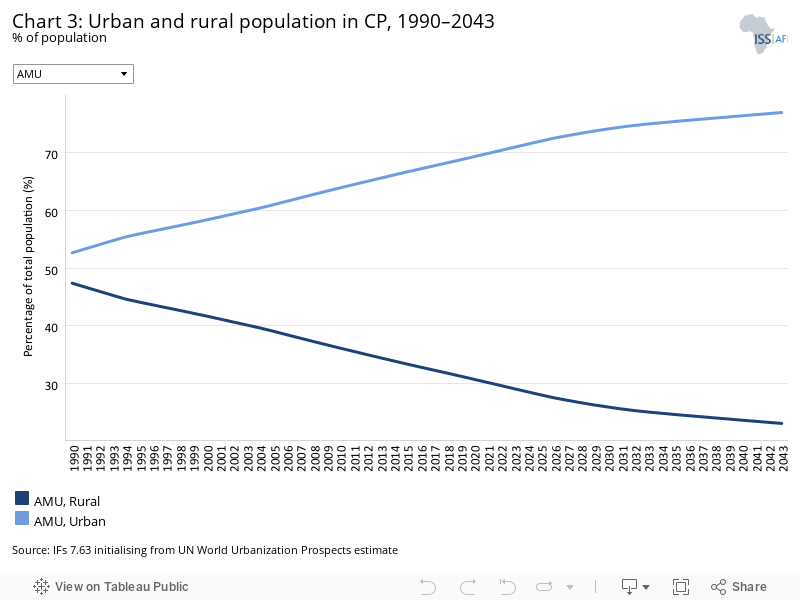
Urbanisation rates are high in the AMU countries. In 2019, 70.3 million, or 69%, of the AMU population lived in urban areas, up from 53% in 1990. The urban population is projected to be 100 million by 2043, equivalent to 77% of the regional population. Libya has the highest urbanisation rate (81.5%) among the AMU members, while Mauritania is the most rural country in the region, with 54.6% of its population living in urban areas in 2019. This high level of urbanisation comes with challenges associated with urban planning, job creation for the urban youth and environmental degradation. In 2019, about 31% of the AMU population lived in rural areas. In the Current Path forecast, it will decline to about 23% by 2043, equivalent to 30 million people.
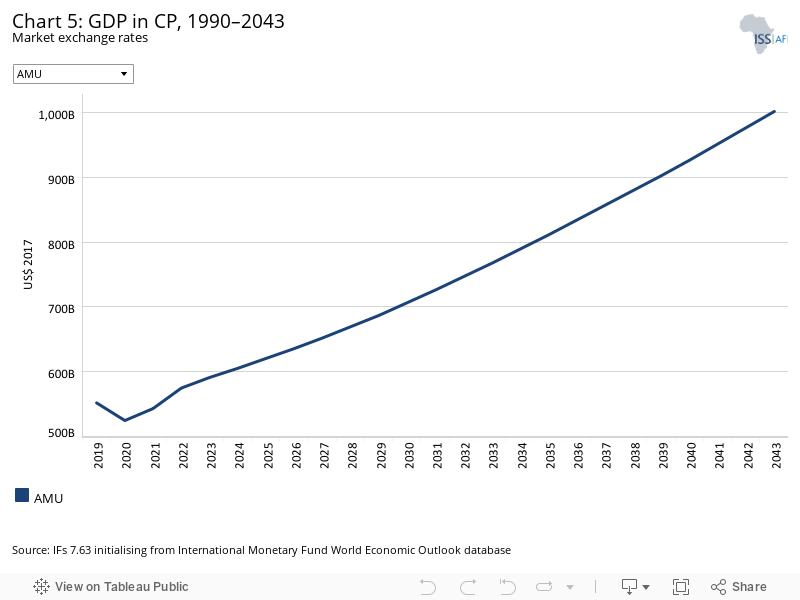
Economically, the AMU countries are relatively small. Their combined GDP was US$551.2 billion as of 2019, 114% up from US$257.3 billion in 1990. This is equivalent to Nigeria's GDP and their total exports in 2019 were equivalent to Croatia's. All member countries have fairly large agricultural or raw materials sectors and are consequently quite vulnerable to exogenous shocks, such as the vagaries of weather and fluctuations in commodity world market prices.
The AMU economy has suffered two major recessions within the last decade: the GDP of the AMU contracted in 2011, due to the effect of the Arab Spring, and in 2020, due to the COVID-19 pandemic.
Algeria, which is a large producer of gas and oil, has the largest GDP in the zone, at US$266.5 billion, while Mauritania has the lowest GDP, at US$9.9 billion in 2019. In the Current Path forecast, the size of the regional economy is forecast to reach US$992 billion by 2043, which is equivalent to an 80% increase between 2019 and 2043. By 2043, Algeria will have the largest economy within the AMU members with a GDP of US$465.1 billion, while Mauritania will still have the smallest economy with a GDP of US$27.1 billion. Growth is hampered by the long-standing rivalries and lack of economic cooperation.
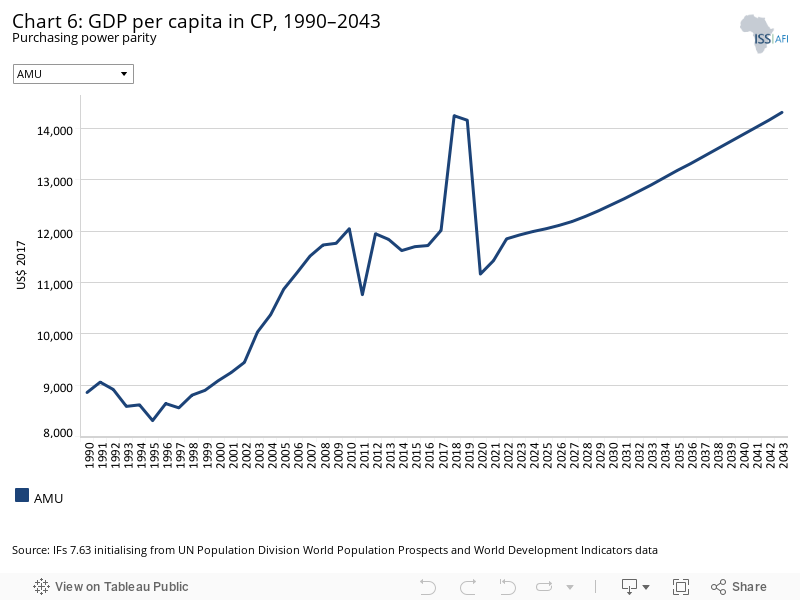
Although many of the charts in the sectoral scenarios also include GDP per capita, this overview is an essential point of departure for interpreting the general economic outlook of [the AMU].
The GDP per capita (PPP) of the AMU was US$14 159 in 2019 compared to US$8 854 in 1990, equivalent to a nearly 60% increase between 1990 and 2019. In 2011, the average income of the AMU zone declined to almost its level in 2004 due to the economic recession associated with the Arab Spring. The second significant decline in the GDP per capita within the last decade was caused by the COVID-19 pandemic in 2020. The wealthiest country based on GDP per capita at purchasing power parity is Libya, with a GDP per capita of US$20 295 in 2019. The GDP per capita of Libya dropped by more than 60% in 2011 from its level of 2010 due to the Arab Spring. The country will likely not recover its pre-Arab Spring GDP per capita in the Current Path forecast horizon. Mauritania has the lowest GDP per capita in the zone, which was about US$4 137 in 2019. In the Current Path forecast, the GDP per capita (PPP) of the AMU is forecast to be US$14 312 by 2043.
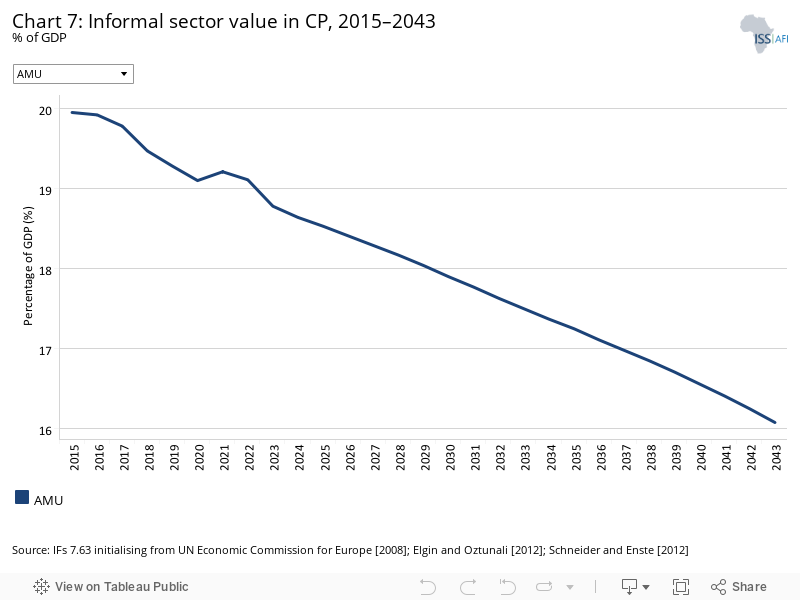
The size of the informal economy represented about 19% of the total GDP of the AMU in 2019. In the Current Path forecast, the size of informality in the region is forecast to decline gradually to 16% by 2043. Mauritania has the highest level of informality in the AMU zone, while Libya has the lowest level. As of 2019, IFs estimates informality rates ranged from 23% of GDP in Mauritania, 22.9% of GDP in Tunisia, 21.7% in Morocco, 18.3% in Algeria, to 13.5% in Libya. In the Current Path forecast, Libya will still have the lowest level of informality by 2043 (9.2% of GDP). The size of the informal sector in Mauritania will decline gradually across the forecast horizon, but the country will have the highest level of informality by 2043 (20.6% of GDP).
Reforms to reduce informality, such as clearing the hurdles to registering a business, tackling corruption and improving access to finance are necessary as the informal economy is generally associated with low productivity and poverty.
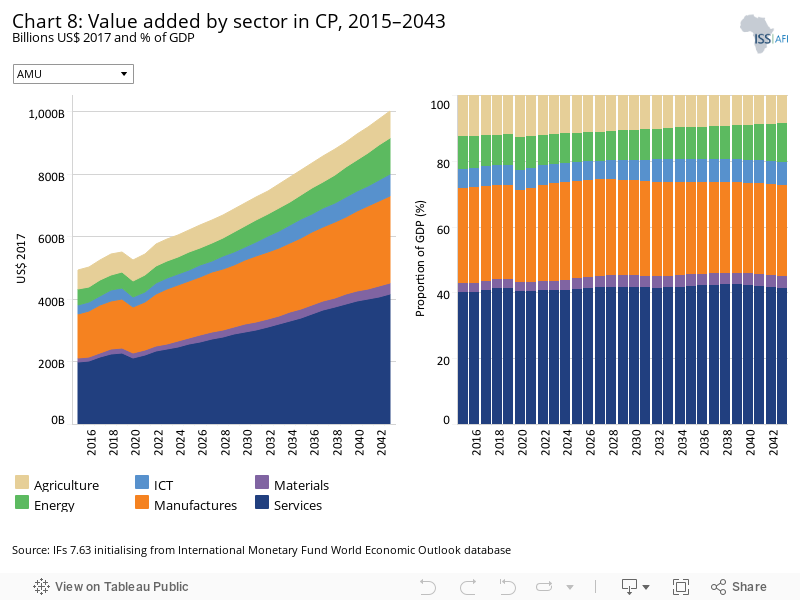
The IFs platform uses data from the Global Trade and Analysis Project (GTAP) to classify economic activity into six sectors: agriculture, energy, materials (including mining), manufactures, services and information and communications technology (ICT). Most other sources use a threefold distinction between only agriculture, industry and services with the result that data may differ.
Like most African countries, the service sector is the dominant sector of the AMU economy. In absolute terms, the value added or output of all the sectors increases across the forecast horizon. Specifically, the value added of the service sector increases by more than 80% between 2019 and 2043. The manufacturing output increases by 76.5%, 30.4% for agriculture, 127.6% for energy, 124.4% for materials and 112% for ICT (from a very low base) between 2019 and 2043. By 2043, the service sector will have the highest output (US$) while the lowest output will come from materials. In percentage of GDP, the service sector accounted for about 41% of GDP in 2019, followed by the manufacturing industry, which accounted for 28.5% of GDP. Agriculture, which is the third major sector, accounted for 12% of GDP in 2019.
The Current Path forecast is that the energy sector will overtake the agriculture sector by 2036 to become the third-largest sector after service and manufacturing. By 2043, the share of the service sector in GDP will slightly increase to 41.3%, while that of manufacturing will slightly decline to 27.7% of GDP compared to 28.5% in 2019. This implies that premature deindustrialisation will continue in the AMU area; the manufacturing share of GDP declines while the countries are still underdeveloped. Overall, the structural transformation process, which consists of moving resources from low productivity sectors to more productive sectors such as manufacturing and services, is slow in the AMU area
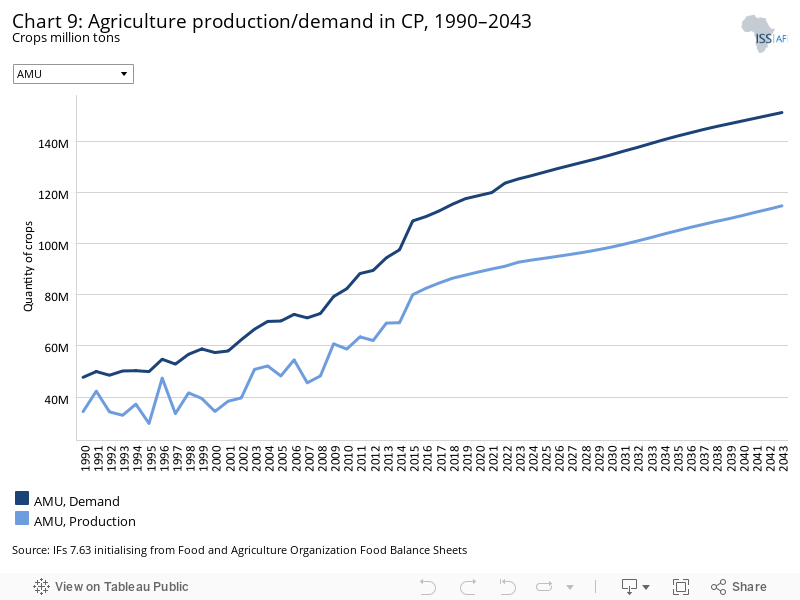
The data on agricultural production and demand in the IFs forecasting platform initialises from data provided on food balances by the Food and Agriculture Organization (FAO). IFs contains data on numerous types of agriculture but aggregates its forecast into crops, meat and fish, presented in million metric tons. Chart 9 shows agricultural production and demand as a total of all three categories.
The total agriculture demand in the AMU is forecast to increase from 47.7 million metric tons in 1990 to 151 million metric tons by 2043, while agriculture production will increase from 34.3 million metric tons to 114.6 million metric tons. This is equivalent to a deficit of 36.4 million metric tons in 2043.
Morocco has the highest agriculture production in the AMU zone, estimated at 30 million metric tons in 2019, while Mauritania has the lowest agriculture production (0.4 million metric tons). In per capita production, Libya has the highest agriculture production per capita estimated at about 1.1 million metric tons in 2019, while Mauritania has the lowest agriculture production per capita (0.09 million metric tons) in 2019.
Food insecurity is very high in Mauritania compared to its peers in the AMU due to difficult farming conditions, insufficient rain and recurrent locust infestations.
In the Current Path forecast, Mauritania will still record the highest food deficit of the AMU members by 2043.
There are numerous methodologies and approaches to defining poverty. We measure income poverty and use GDP per capita as a proxy. In 2015, the World Bank adopted the measure of US$1.90 per person a day (in 2011 international prices), also used to measure progress towards the achievement of Sustainable Development Goal 1 of eradicating extreme poverty. To account for extreme poverty in richer countries occurring at slightly higher levels of income than in poor countries, the World Bank introduced three additional poverty lines in 2017:
- US$3.20 for lower middle-income countries
- US$5.50 for upper middle-income countries
- US$22.70 for high-income countries.
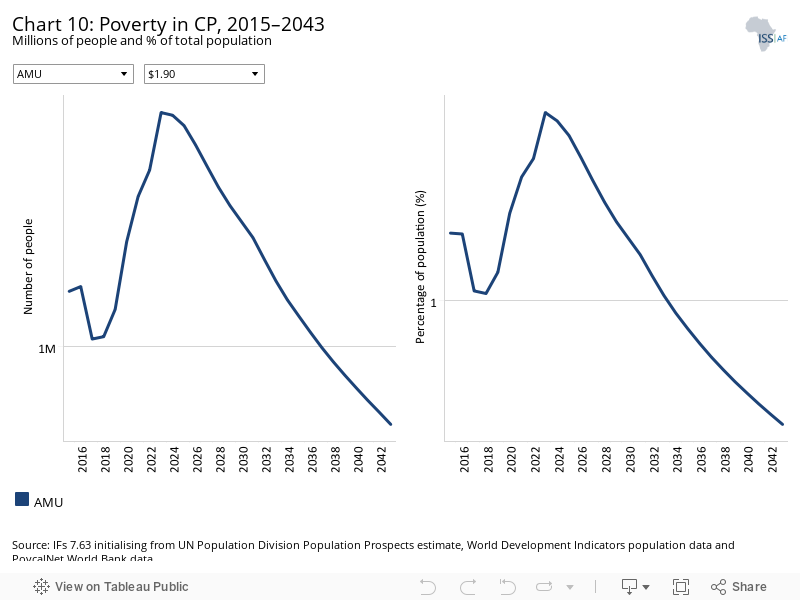
At the regional level, the AMU has achieved SDG Goal 1 of the eradication of extreme poverty, although not in Mauritania. Technically, less than 3% of the population of all countries in the world should be surviving below US$1.90 per day (extreme poverty) by 2030. At the regional level, this headline goal has long before been achieved.
Using the poverty threshold of US$1.90 per day, about 1.1 million people lived in extreme poverty in 2019. This translates to an average poverty rate of 1.1% in the region, already below 3%.
Due to the economic fallout associated with the COVID-19 pandemic, the number of poor people will increase and peak in 2023 before starting to decline. The poverty rate will peak at 1.65% in 2023. In the Current Path forecast, fewer than one million people will be surviving under US$1.90 per day by 2043. This translates to a poverty rate of 0.57%.
With a poverty rate of 11.4% in 2019, Mauritania is the only country of the AMU that has not yet achieved SGD Goal 1 of eradicating extreme poverty. Extreme poverty in Mauritania is forecast to increase to 20.3% in 2023 before it starts to decline. In the Current Path forecast, Mauritania will get to about 15.7% by 2030 and 7.1% by 2043. The achievement of regional targets regarding poverty hinges, therefore, on Mauritania.
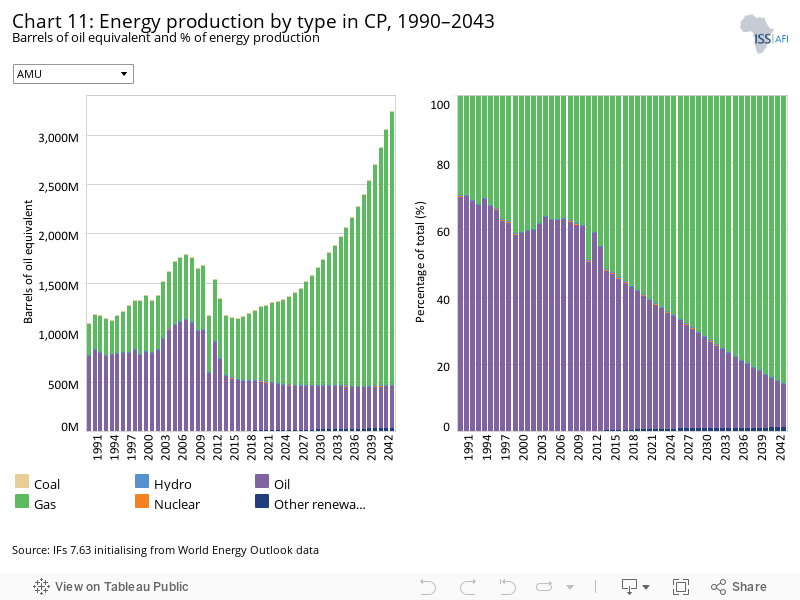
The IFs platform forecasts six types of energy, namely oil, gas, coal, hydro, nuclear and other renewables. To allow comparisons between different types of energy, the data is converted into billion barrels of oil equivalent (BBOE). The energy contained in a barrel of oil is approximately 5.8 million British thermal units (MBTUs) or 1 700 kilowatt-hours (kWh) of energy.
Oil and gas are the dominant sources of energy in the AMU area. Until 2013, oil was the leading energy source in the region and accounted for 54.9% of energy production. Currently, the volume of gas produced has overtaken that of oil. In 2019, gas production was 711 million barrels of oil equivalent while oil production stood at 507 million barrels.
In the Current Path forecast, gas production will significantly increase to reach 2.8 billion barrels of oil equivalent by 2043, while oil production will decline to 420 million barrels in the same year. By 2043, gas will account for 85.7% of total energy production, while oil will account for 13.1%. While Algeria and Libya are significant oil and gas exporters, other members import most of their energy needs. For instance, Morocco imports 95% of its energy needs.
The energy production from renewable sources is still at the embryonic stage in the region. The energy from other renewable sources is forecast to reach 34 million barrels of oil equivalent or barely 1% of total energy production by 2043. The region has vast potential for renewable energy and governments in the AMU should capitalise on it to accelerate their energy transition.
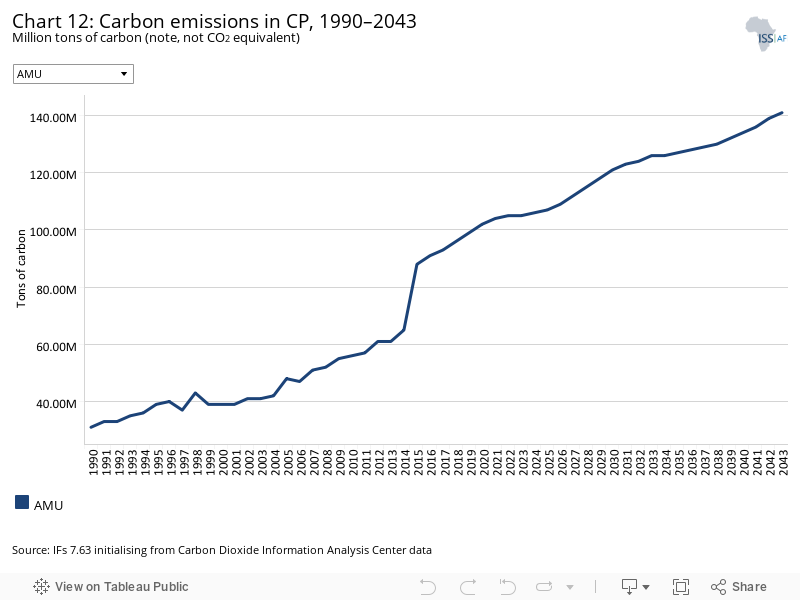
Carbon is released in many ways, but the three most important contributors to greenhouse gases are carbon dioxide (CO2), carbon monoxide (CO) and methane (CH4). Since each has a different molecular weight, IFs uses carbon. Many other sites and calculations use CO2 equivalent.
Carbon emissions in the AMU zone increased from 31 million tons of carbon in 1990 to 96 million tons of carbon in 2019, more than 200% increase within two decades although from a very low base. In the Current Path forecast, carbon emissions in the area will increase to 141 million tons by 2043. Emitting an estimated 45 million tons of carbon, Algeria is by far the largest contributor to carbon emissions in the AMU, followed by Libya. In the Current Path forecast, Algeria and Libya will be the largest contributors to carbon emissions in the region by 2043, collectively responsible for around 70% of the AMU’s emissions.
Sectoral Scenarios for AMU
Download to pdfThe Stability scenario represents reasonable but ambitious reductions in risk of regime instability and lower levels of internal conflict. Stability is generally a prerequisite for other aspects of development and this would encourage inflows of foreign direct investment (FDI) and improve business confidence. Better governance through the accountability that follows substantive democracy is modelled separately.
The intervention is explained here in the thematic part of the website.
IFs governance security index ranges from 0 (low security) to 1 (high security). The Current Path forecast for the AMU shows more stability than the average for Africa. Specifically, the score for the AMU on the government security index was 12% higher than the average for Africa in 2019. The scenario improves security and stability in the AMU: by 2043, the average score in the Stability scenario is 0.89, about 9.8% higher than in the Current Path forecast. At the country level, Morocco is more stable than its peers within the AMU. Due to the protracted political crisis in Libya, the country ranks at the bottom of the government security index.
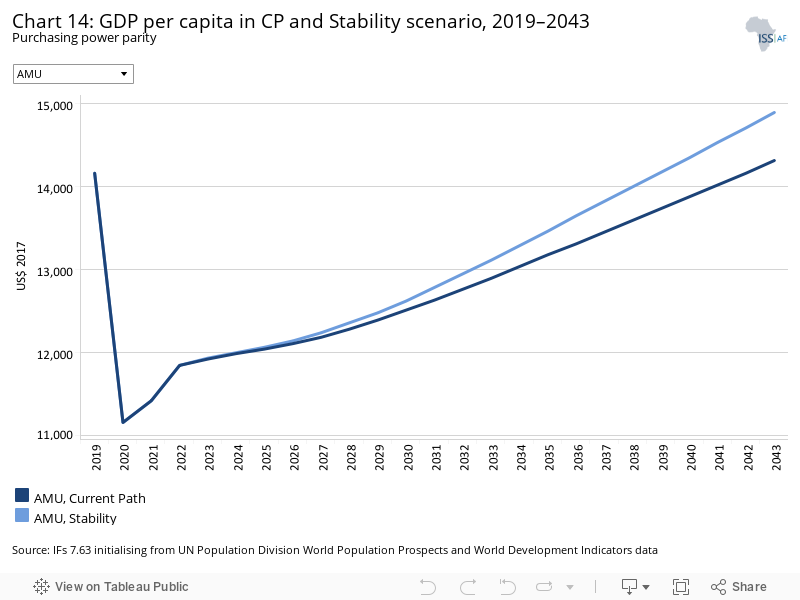
Stability is one of the key preconditions for sustained growth and development. In the Stability scenario, the size of the GDP per capita (PPP) of the AMU is US$14 889 by 2043 compared to US$14 312 in the Current Path forecast in the same year. In other words, the average GDP per capita in the scenario is US$587 larger than the Current Path forecast in 2043.
In this scenario, the biggest improvement in GDP per capita compared to the Current Path forecast in 2043 comes from Libya (US$1 930), currently the most unstable country within the AMU. Efforts to bring stability to Libya will attract foreign and domestic investment in the country, which will, in turn, stimulate growth and income.
Given its potential to enhance growth, governments and policymakers should take proactive measures for more social and political stability within the AMU region.
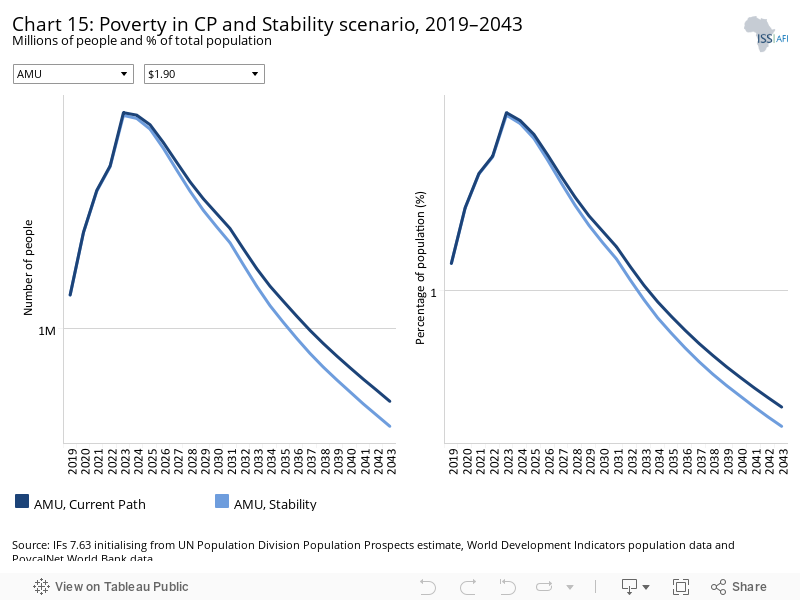
In the Stability scenario, the number of people surviving below US$1.90 per day is 0.6 million in 2043, compared to 0.7 million in the Current Path forecast. In other words, the number of people living in extreme poverty is 0.1 million fewer than in the Current Path forecast. This is equivalent to a poverty rate of 0.5% compared to 0.6% in the Current Path forecast in 2043.
Mauritania will have the highest rate of poverty among AMU members by 2043. In the Stability scenario, Mauritania will have a poverty rate of 6.2% compared to 7.1% in the Current Path forecast in 2043. Overall, the Stability scenario has a marginal impact on poverty in the AMU region.
This section presents the impact of a Demographic scenario that aims to hasten and increase the demographic dividend through reasonable but ambitious reductions in the communicable-disease burden for children under five, the maternal mortality ratio and increased access to modern contraception.
The intervention is explained here in the thematic part of the website.
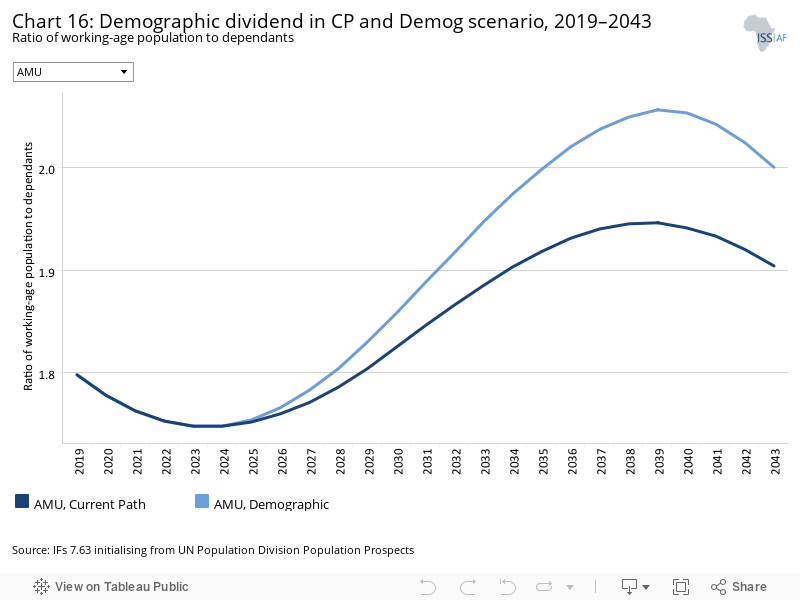
Demographers typically differentiate between a first, second and even a third demographic dividend. We focus here on the contribution of the size of the labour force (between 15 and 64 years of age) relative to dependants (children and the elderly) as part of the first dividend. A window of opportunity opens when the ratio of the working-age population to dependants is equal to or surpasses 1.7.
The AMU region has already reached this minimum ratio and its dividend is declining. In 2019, it stood at 1.8 people of working age for each dependant and in the Current Path forecast, it is expected to peak at 1.95 in 2038 before declining to 1.90 in 2043. In the Demographic scenario, the working-age population to dependants ratio is 2.00 by 2043 against 1.90 in the Current Path forecast in the same year.
Mauritania has a much younger population than other countries in the AMU and has not yet achieved the minimum ratio of 1.7 working-age people for each dependant. Its ratio of working-age people to dependants was at 1.3 in 2019 and will only get to 1.6 by 2043. As a result, Mauritania will likely not reap the demographic dividend across the forecast horizon even in the Demographic scenario. This will probably happen after 2050. Algeria is also experiencing a declining dividend but will get back above the 1.7 ratio in 2027. The ratio of working-age people to dependants is highest in Libya and will peak at above 2.3, even in the Current Path forecast.
The large size of the working-age population in the region can be a catalyst for growth if sufficient education and employment are generated to successfully harness their productive power, otherwise it could turn into a demographic ‘bomb’ as many people of working age may remain in poverty, potentially creating frustration, social tension and conflict.
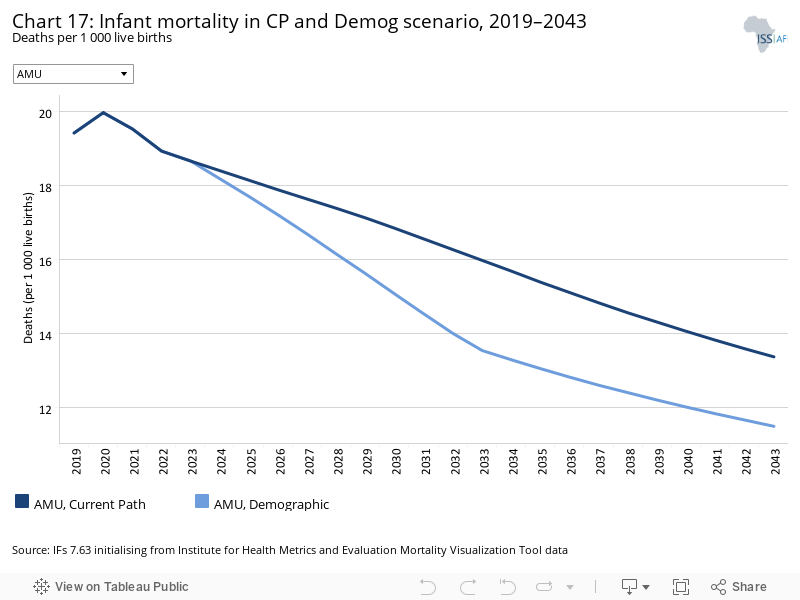
The infant mortality rate is the number of infant deaths per 1 000 live births and is an important marker of the overall quality of the health system in a country.
The AMU zone has already achieved the SDG target of reducing infant mortality, which is fewer than 25 deaths per 1 000 live births by 2030. In the Demographic scenario, the infant mortality rate is 12 deaths per 1 000 live births by 2043, compared to 13 deaths in the Current Path forecast in the same year. Prior to its civil war, Libya did the best among the AMU member states, followed by Tunisia.
The regional infant mortality masks the poor human development indicator of Mauritania. In 2019, the infant mortality rate in Mauritania was about 37 deaths per 1 000 live births. In the Current Path forecast, Mauritania will miss the SDG target by a small margin in 2030. However, in this scenario, the country achieves the SDG target by 2030 and will have an infant mortality rate of 14 deaths per 1 000 live births by 2043, compared to 17 deaths per 1 000 live births in the Current Path forecast in the same year. Algeria also does poorly.
The Demographic scenario has a modest impact on the regional GDP per capita compared to the Current Path forecast. In this scenario, the average GDP per capita of the AMU region increases from US$14 159 in 2019 to US$14 464 in 2043. This is equivalent to a 2.1% increase between 2019 and 2043 compared to 1% in the Current Path forecast. The GDP per capita in 2043 is US$146 more than in the Current Path forecast. In this scenario, Libya has the largest GDP per capita, while Mauritania is the poorest country in terms of income per capita in the region by 2043. Algeria gains significantly more than other AMU member states (US$330 by 2043) and Libya and Tunisia the least.
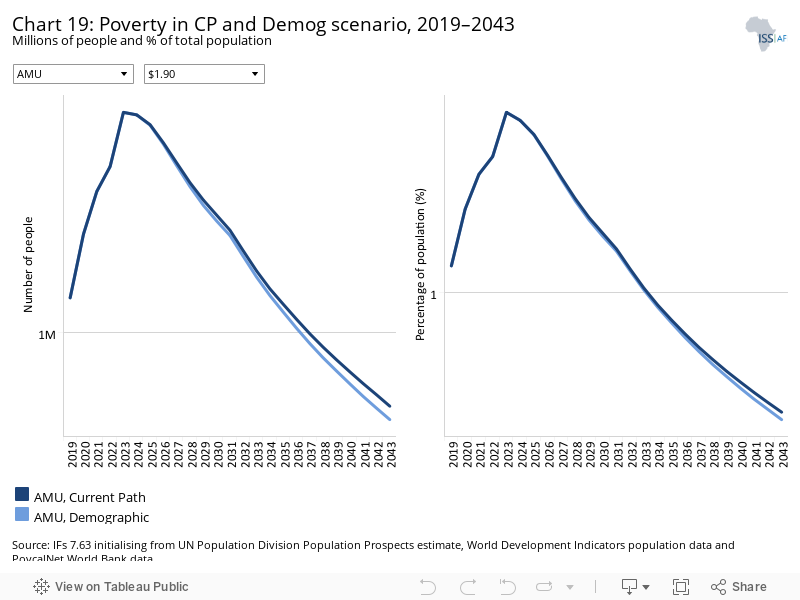
In the Demographic scenario, 0.7 million people, or only 0.5% of the AMU population, will be living in extreme poverty by 2043. In 2043, the number of people surviving on under US$1.90 is only 50 000 people fewer than the Current Path forecast.
The poverty rate in the Demographic scenario is 0.03 percentage points below the Current Path forecast in 2043. Except for Mauritania, the poverty rate at US$1.90 is less than 1% in all the AMU countries. Mauritania had a poverty rate of about 11% in 2019, and it is forecast to be 6.8% by 2043 in the scenario. Mauritania is not on track to achieve Goal 1 of the SDGs by 2030, even in the Demographic scenario.
This section presents reasonable but ambitious improvements in the Health/WaSH scenario, which include reductions in the mortality rate associated with both communicable diseases (e.g. AIDS, diarrhoea, malaria and respiratory infections) and non-communicable diseases (NCDs) (e.g. diabetes), as well as improvements in access to safe water and better sanitation. The acronym WaSH stands for water, sanitation and hygiene.
The intervention is explained here in the thematic part of the website.
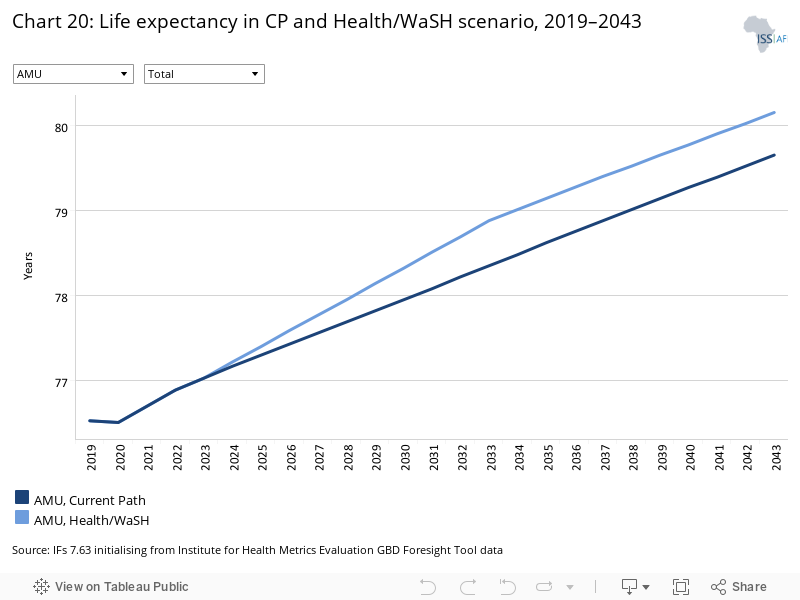
The average life expectancy at birth in the AMU zone was 76.5 years in 2019, about 10 years above the average for Africa in the same year.
In 2019, life expectancy among the AMU member states ranged from 77.7 years in Algeria to 70.8 years in Mauritania. In the Health/WaSH scenario, the average life expectancy in the AMU is forecast to reach 80.1 years by 2043, a marginal increase above the 79.6 years in the Current Path forecast in 2043. In the Health/WaSH scenario, Algeria has the highest life expectancy (81 years) in 2043 while Mauritania has the lowest (76.2 years).
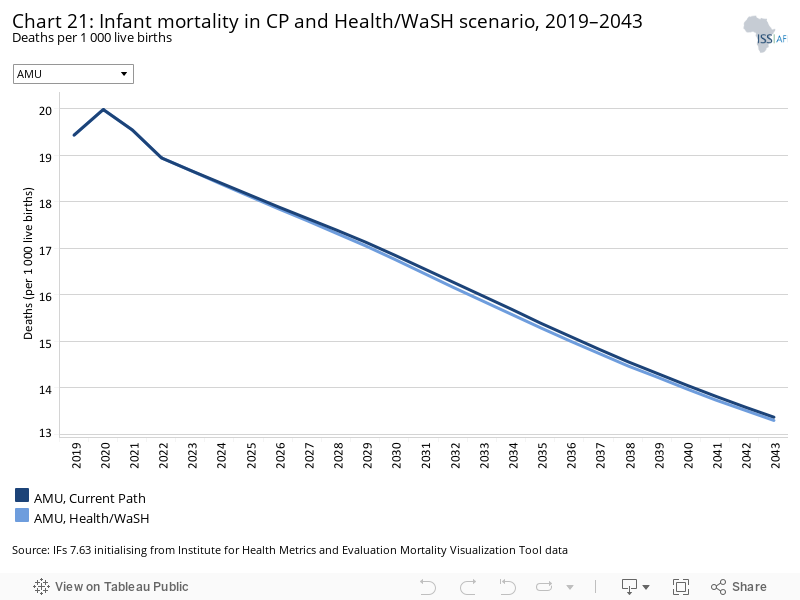
In 2019, the average infant mortality rate in AMU was 19 deaths per 1 000 live births, below the SDG target of 25 deaths per 1 000 live births by 2030 and is forecast to decline to 13.4 in the Current Path forecast in 2043. In the Health/WaSH scenario, the average by 2043 is 13.3 compared to 13.4 in the Current Path forecast in the same year. These rates remain above the world average in 2043.
Infant mortality is particularly high in Mauritania (35.6 deaths per 1 000 live births in 2019). This is due to factors such as poverty, especially in the rural areas. Even in the Health/WaSH scenario, Mauritania is not on track to achieve the SDG target by 2030. Infant mortality in Mauritania is forecast to be 27 deaths per 1 000 live births in the Health/WaSH scenario and 27.4 in the Current Path forecast by 2030 and 17 and 17.3 respectively in 2043. The scenario has a marginal impact on the infant mortality rate in AMU countries
The Agriculture scenario represents reasonable but ambitious increases in yields per hectare (reflecting better management and seed and fertilizer technology), increased land under irrigation and reduced loss and waste. Where appropriate, it includes an increase in calorie consumption, reflecting the prioritisation of food self-sufficiency above food exports as a desirable policy objective.
The intervention is explained here in the thematic part of the website.
The data on yield per hectare (in metric tons) is for crops but does not distinguish between different categories of crops.
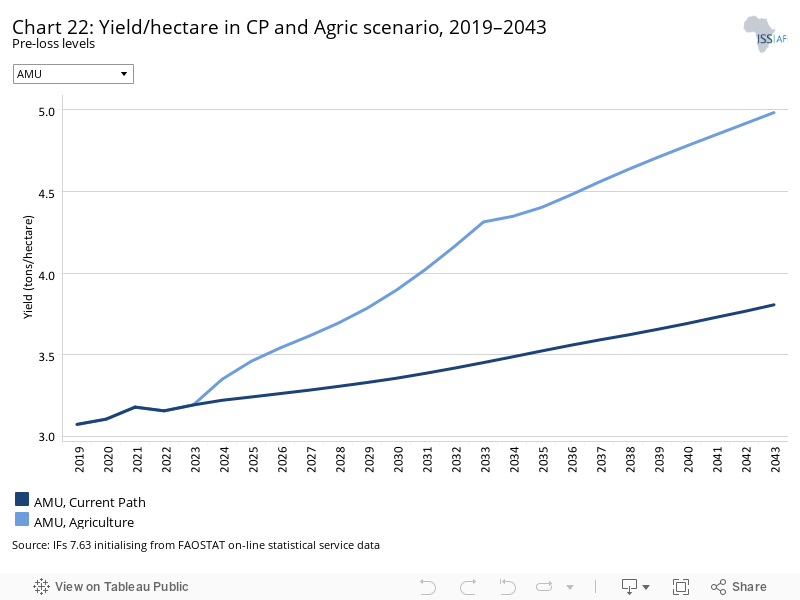
Agriculture yields are meagre in the AMU countries. The average crop yield of the region was 3 tons per hectare in 2019, and it is forecast to reach 3.8 tons per hectare by 2043 in the Current Path forecast, a 26.6% increase between 2019 and 2043. At the country level, crop yield is exceptionally low in Mauritania. It is currently estimated at one ton per hectare.
In the Agriculture scenario, the average crop yield of the AMU region is forecast to reach 5 tons per hectare by 2043, compared to 3.8 tons per hectare in the Current Path forecast in 2043, an increase of 20%. At the country level, Morocco and Libya have the highest crop yield in the region. In the Agriculture scenario, crop yield ranges from 6 tons per hectare in Morocco to 4 tons per hectare in Mauritania by 2043.
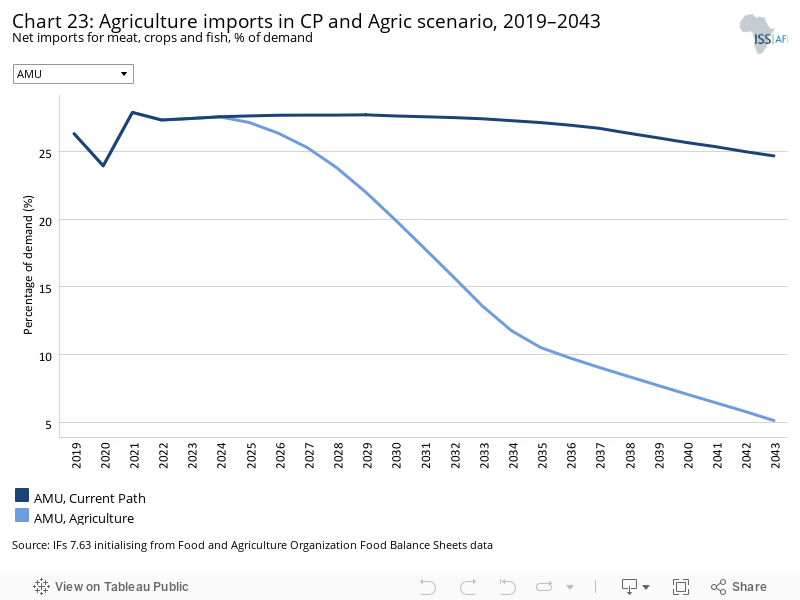
In 2019, agricultural imports accounted for 29.4% of total agricultural demand in the AMU area. It is forecast to slightly decline to 28.2% by 2043 in the Current Path forecast, equivalent to only a 1.2 percentage-point decline between 2019 and 2043. However, the Agriculture scenario dramatically impacts on agriculture imports, which decline from 29.4% of total agricultural demand in 2019 to 4.3% of total demand by 2043. This is equivalent to 25.1 percentage points lower than the Current Path forecast.
These regional figures mask the situation of Mauritania where agriculture import dependence is forecast to decline to 60.2% of total agricultural demand in the scenario by 2043, compared to 87% in the Current Path forecast in the same year. Mauritania remains highly food insecure and reliant on external food aid. As in much of the Sahel, agriculture in Mauritania is poorly mechanised and almost entirely dependent upon the limited and variable summer rainfall, making it highly vulnerable to climate variability and change. In dry years, the country faces serious challenges related to food security and must rely on grain purchases and food aid to meet food requirements.
Going forward, Morocco and Libya are forecast to have an agricultural surplus, which will undoubtedly be exported to other countries. Agricultural surplus of Morocco will be equivalent to 1.7% of total agricultural demand in the country by 2030 and will increase to 31.8% by 2043; that of Libya will increase from 0.2% of total agricultural demand in 2041 to 1.6% in 2043.
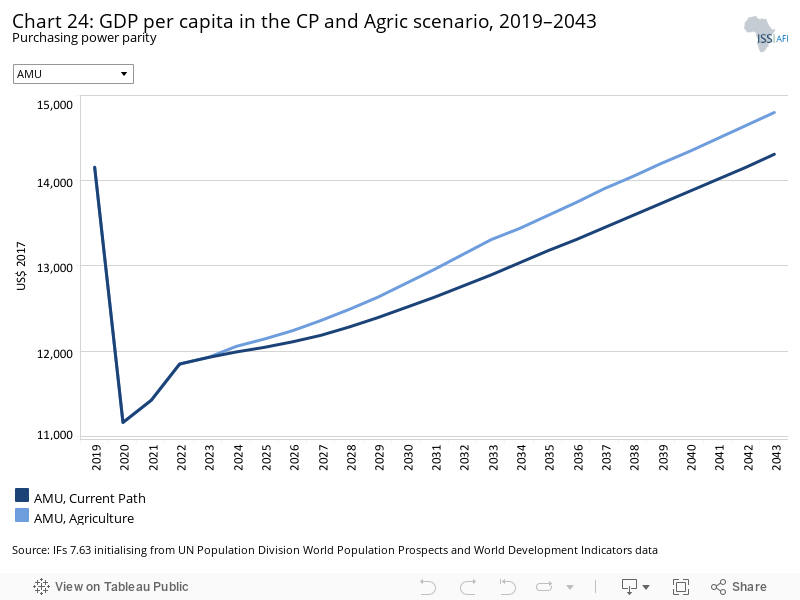
In the Agriculture scenario, the regional GDP per capita increases from US$14 159 in 2019 to US$14 802, about a 4.5% increase between 2019 and 2043 compared to 1.1% in the Current Path forecast. In 2043, the regional GDP per capita is US$490 higher than in the Current Path forecast. In the Agriculture scenario, the GDP per capita (PPP) ranges from US$31 304 in Libya to US$6 631 in Mauritania by 2043. The AMU countries should invest in and modernise their agriculture sector to stimulate growth, increase consumption and income and pave the way for agro-industries.
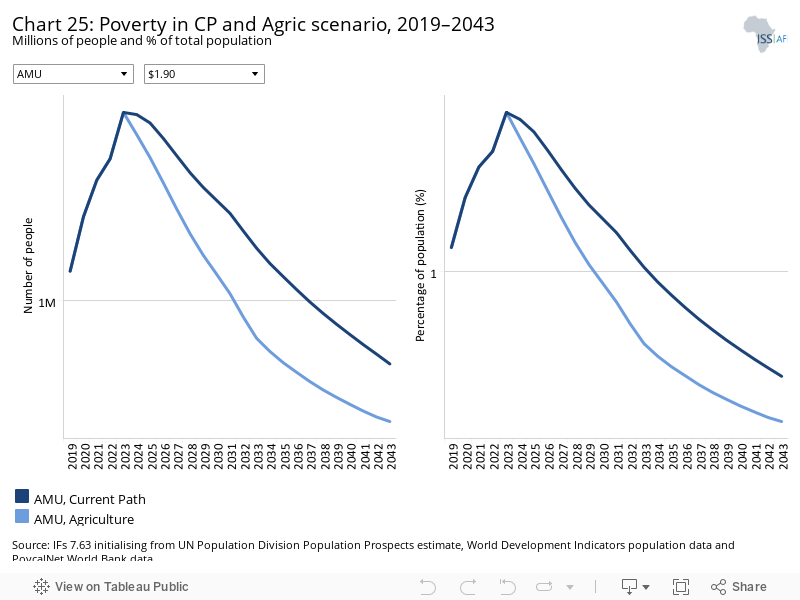
The Agriculture scenario contributes significantly to reducing extreme poverty in the AMU area. While 0.7 million people will be living in extreme poverty by 2043 in the Current Path forecast, it is about 0.5 million people in the Agriculture scenario, 0.2 million fewer poor people than in the Current Path forecast in 2043. The poverty rate will decline to 0.4% in the scenario compared to 0.6% in the Current Path forecast in 2043. The extreme poverty rate at US$1.90 ranges from 0.02% in Algeria to 4.8% in Mauritania in the Agriculture scenario in 2043. Even in the Agriculture scenario, Mauritania is not on track to achieve the SDG goal to eradicate extreme poverty by 2030. The rest of the countries currently have their poverty rate below 3%.
The Education scenario represents reasonable but ambitious improved intake, transition and graduation rates from primary to tertiary levels and better quality of education. It also models substantive progress towards gender parity at all levels, additional vocational training at secondary school level and increases in the share of science and engineering graduates.
The intervention is explained here in the thematic part of the website.
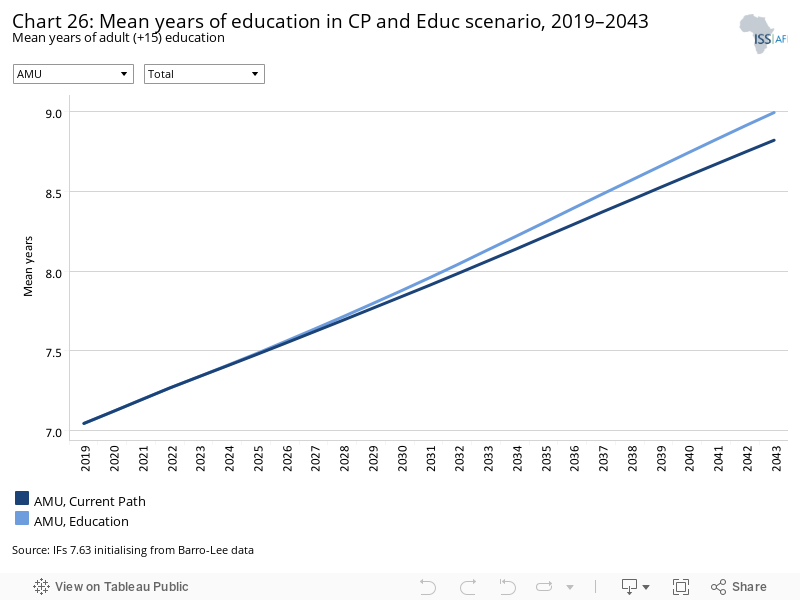
The mean years of education is a good indicator of the stock of education in a country. At the country level, Libya has the highest mean years of schooling (both male and female), while Mauritania has the lowest mean years of education. In the Education scenario, the mean adult years of schooling increases from 7 years in 2019 to 9 years in 2043, a 28.5% increase between 2019 and 2043 compared to 25.7% in the Current Path forecast. Because education levels in the region are already high, the Education scenario improves the adult total mean years of education marginally compared to the Current Path forecast. In 2043, the total mean years of schooling in the scenario is only 0.2 years above the Current Path forecast. The mean years of education for men increases from 7.4 years in 2019 to 9 years in 2043, while that of women increases from 6.7 years in 2019 to 9 years in 2043, implying gender parity in mean years of education by 2043. In this scenario, the total adult mean years of education ranges from 10.8 years in Libya to 7 years in Mauritania by 2043.
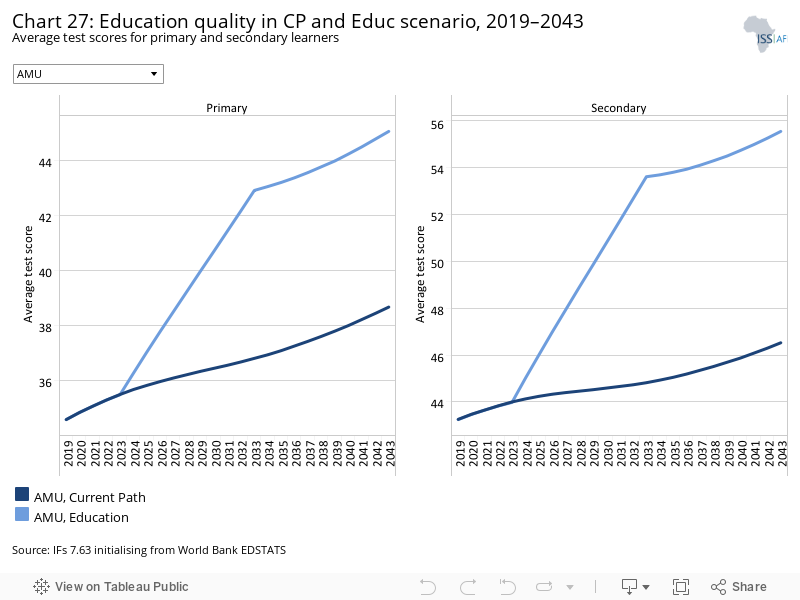
Getting more children into school is essential but ensuring that they actually learn is more important. Many empirical studies have reported that educational quality impacts economic growth more than educational quantity. The quality of education is usually tracked using harmonised test scores.
In the Education scenario, the average test score in the AMU at the secondary level is 55.8% in 2043, up from 43.2% in 2019, about nine percentage points above the Current Path forecast in the same year. At the primary level, the average test score in the AMU is 44.6% in the scenario in 2043, up from 34.6% in 2019. This is equivalent to a six percentage-point improvement above the Current Path forecast in 2043. Based on the test scores, Libya has the best quality of education among the AMU members, while Mauritania has the worst quality of education.
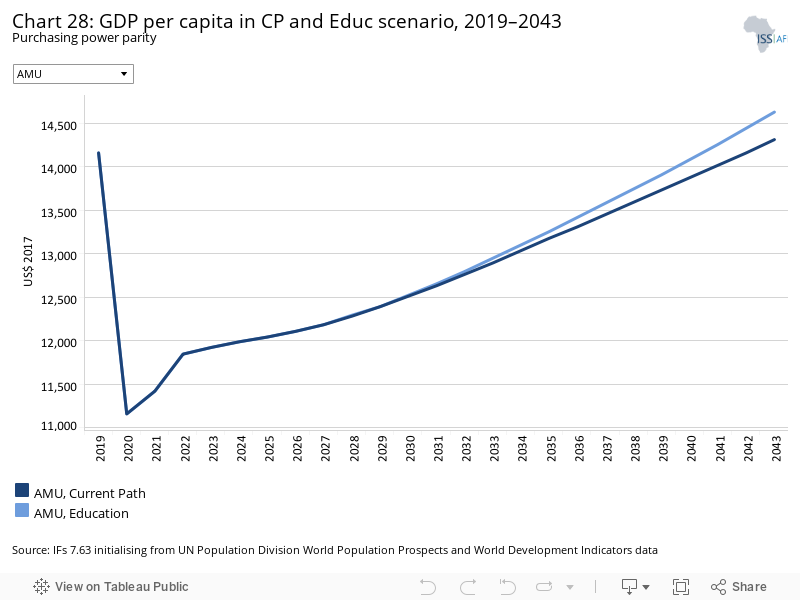
Investment in education takes time to yield benefits in terms of productivity and income. In the Education scenario, the regional GDP per capita increases from US$14 159 in 2019 to US$14 628, about a 3.3% increase between 2019 and 2043, compared to 1.1% in the Current Path forecast. In 2043, the regional GDP per capita is US$316 higher than in the Current Path forecast. The GDP per capita (PPP) ranges from US$31 773 in Libya to US$6 047 in Mauritania by 2043 in the Education scenario.
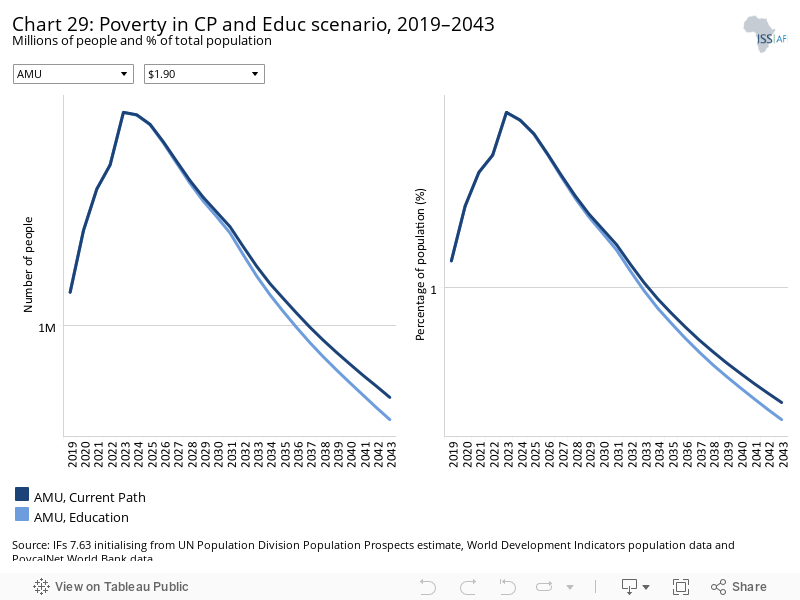
Education is a powerful tool to reduce poverty and income inequality in a country as it improves the job and income prospects of the poor segment of society. However, this takes time to materialise and, given low levels of extreme poverty in AMU, the Education scenario makes only a marginal contribution to poverty reduction by 2043.
While 0.7 million people will be living in extreme poverty by 2043 in the Current Path forecast, it is about 0.65 million people in the Education scenario, 0.82 million fewer poor people than in the Current Path forecast in 2043. The poverty rate stands at 0.51% in the scenario against 0.57% in the Current Path forecast in 2043. The extreme poverty rate at US$1.90 ranges from 0.02% in Algeria to 6.4% in Mauritania in the Education scenario in 2043. Although Mauritania gains most in poverty reduction in the Education scenario, it is not on track to achieve the SDG goal of eradicating extreme poverty by 2030. The poverty rate in Mauritania is forecast to be 15.5% in 2030 and 6.4% in 2043 in the Education scenario.
The Manufacturing/Transfers scenario represents reasonable but ambitious manufacturing growth through greater investment in the economy, investments in research and development, and promotion of the export of manufactured goods. It is accompanied by an increase in welfare transfers (social grants) to moderate the initial increases in inequality that are typically associated with a manufacturing transition. To this end, the scenario improves tax administration and increases government revenues.
The intervention is explained here in the thematic part of the website.
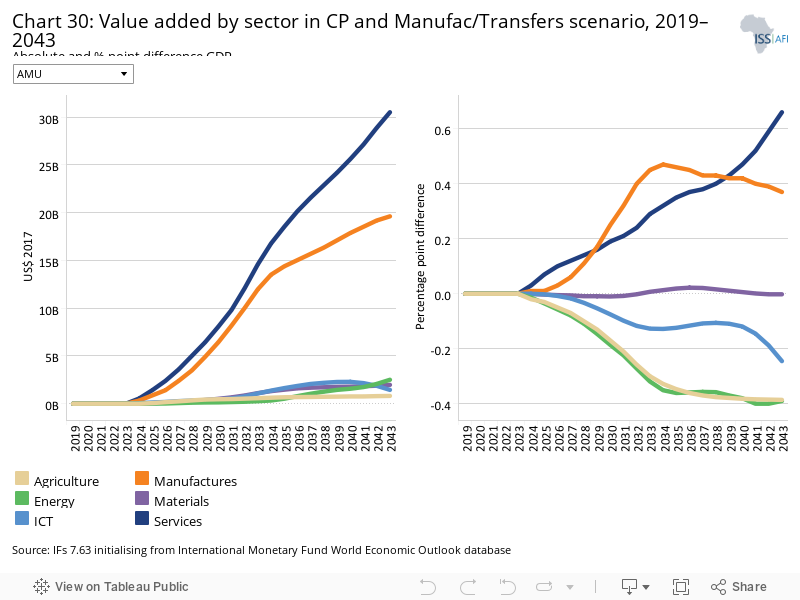
Chart 30 should be read with Chart 8 that presents a stacked area graph on the contribution to GDP and size, in billion US$, of the Current Path economy for each of the sectors.
The value (US$) of all the sectors in the Manufacturing/Transfers scenario is larger than in the Current Path forecast in 2043. The most important improvement is from the service sector, with its value in the scenario US$30.6 billion larger than the value forecast in the Current Path forecast in 2043. In percentage of GDP, it is only 0.4 percentage points above the Current Path forecast in the same year. The service sector is followed by the manufacturing sector, with its value in the scenario US$19.7 billion larger than the value forecast in the Current Path forecast in 2043. The value of energy, material and agriculture in the scenario is respectively US$2.5 billion, US$1.9 billion and US$0.8 billion larger than the Current Path by 2043, while the value of the ICT is US$1.4 billion larger in the scenario than the Current Path in 2043. In the scenario, the share of agriculture in GDP is 0.4 percentage points below the Current Path in 2043. The structural transformation process leads to the resource movement from agriculture to higher productivity sectors such as manufacturing and service. As a result, the share of agriculture in GDP and employment declines over time and that of service and manufacturing increases.
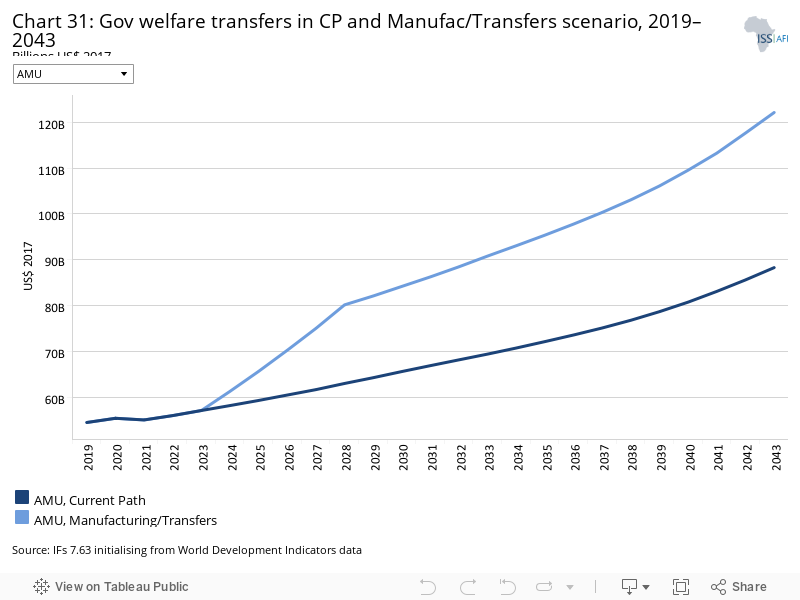
In the Manufacturing/Transfers scenario, government welfare transfers to unskilled workers in the AMU increase from US$54.6 billion in 2019 to US$122.1 billion, equivalent to a 123.6% improvement between 2019 and 2043 compared to 61.7% in the Current Path forecast. In this scenario, government welfare transfers to unskilled workers is US$33.8 billion larger than the Current Path forecast. In the Manufacturing/Transfers scenario, government welfare transfers range from US$74.2 billion in Algeria to US$3.1 billion in Mauritania. Algeria sees the biggest improvement in household welfare transfers (US$22.4 billion) compared to the Current Path in 2043 while Libya sees the least (US$320 million).
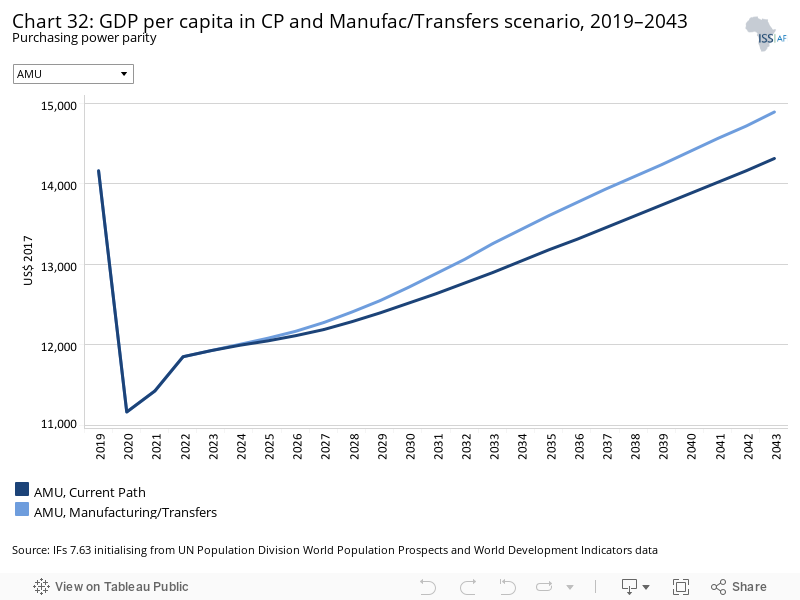
In the Manufacturing/Transfers scenario, the regional GDP per capita increases from US$14 159 in 2019 to US$14 889, equivalent to a 5.1% increase between 2019 and 2043 against 1.1% in the Current Path forecast. In 2043, the regional GDP per capita is US$577, or 4%, higher than the Current Path forecast. In the Manufacturing/Transfers scenario, the GDP per capita (PPP) ranges from US$31 544 in Libya to US$5 985 in Mauritania by 2043. Strengthening the industrialisation process is necessary for a sustainable, diversified and inclusive economy that is resilient to external shocks. Due to lower labour costs and favourable government policy, Morocco has been able to attract European auto groups and the country is on the verge of becoming a car-making hub in Africa.
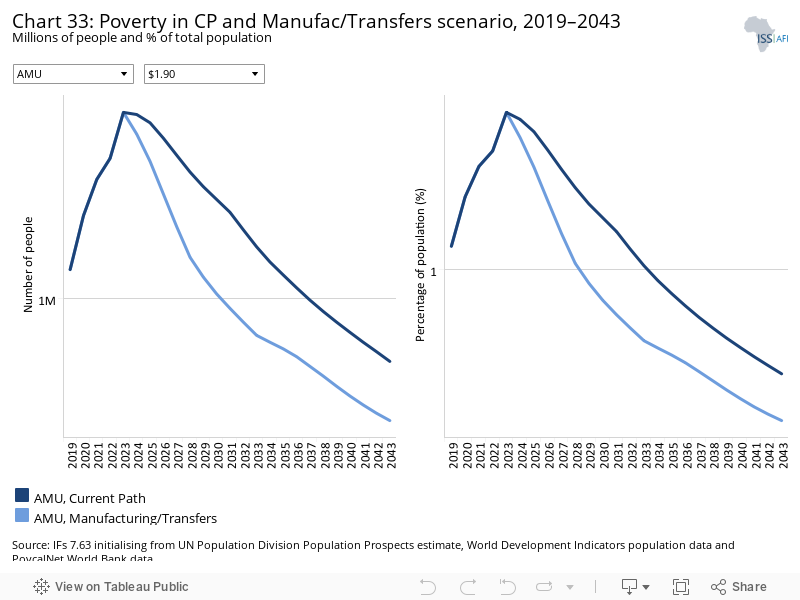
Using US$1.90, the AMU zone would have about 0.5 million extremely poor people in 2043 in the Manufacturing/Transfers scenario compared to 0.7 million in the Current Path forecast in the same year, a difference of 0.2 million people. The poverty rate stands at 0.4% in the Manufacturing/Transfers scenario compared to 0.6% in the Current Path forecast in 2043, a 0.2 percentage-point difference.
In the Manufacturing/Transfers scenario, only Mauritania is not on track to achieve the SDG goal of eradicating extreme poverty by 2030. In this scenario, the poverty rate in Mauritania is 11.6% by 2030 and 4.9% in 2043, while Algeria, Libya, Morocco and Tunisia already have their extreme poverty rate below 3% as of 2019.
The Leapfrogging scenario represents a reasonable but ambitious adoption of and investment in renewable energy technologies, resulting in better access to electricity in urban and rural areas. The scenario includes accelerated access to mobile and fixed broadband and the adoption of modern technology that improves government efficiency and allows for the more rapid formalisation of the informal sector.
The intervention is explained here in the thematic part of the website.
Fixed broadband includes cable modem Internet connections, DSL Internet connections of at least 256 KB/s, fibre and other fixed broadband technology connections (such as satellite broadband Internet, ethernet local area networks, fixed-wireless access, wireless local area networks, WiMAX, etc.).
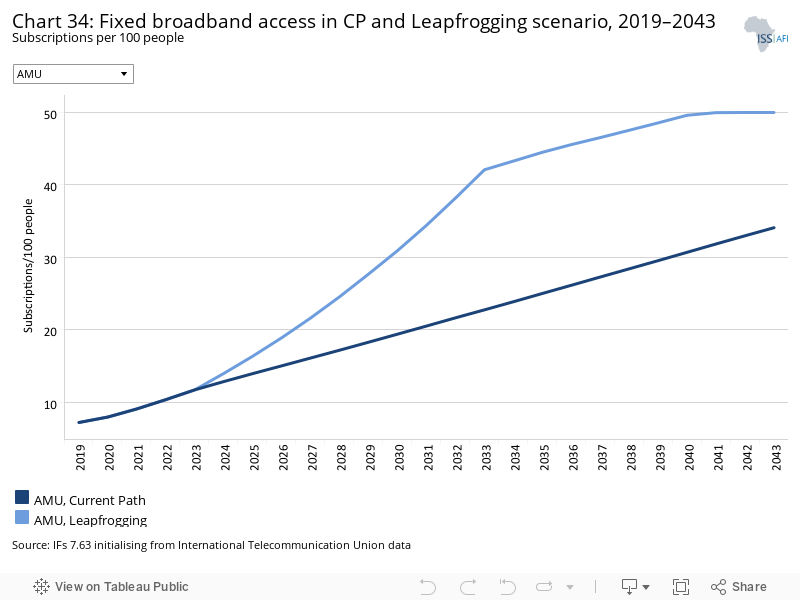
The average fixed broadband subscription is very low in the AMU area; it was seven subscriptions per 100 people in 2019. In the Leapfrogging scenario, the average fixed broadband subscriptions increase to about 50 subscriptions per 100 people by 2043, which is 47% higher than the Current Path forecast in the same year. Algeria and Morocco, with respectively 10 and 8 subscriptions per 100 people in 2019, have the highest fixed broadband subscriptions in the region. Mauritania has the lowest fixed broadband subscription (2.5 subscriptions per 100 people in 2019). However, in the Leapfrogging scenario, the countries will converge to 50 subscriptions per 100 people by 2043, with the most significant improvement from Mauritania.
Mobile broadband refers to wireless Internet access delivered through cellular towers to computers and other digital devices.
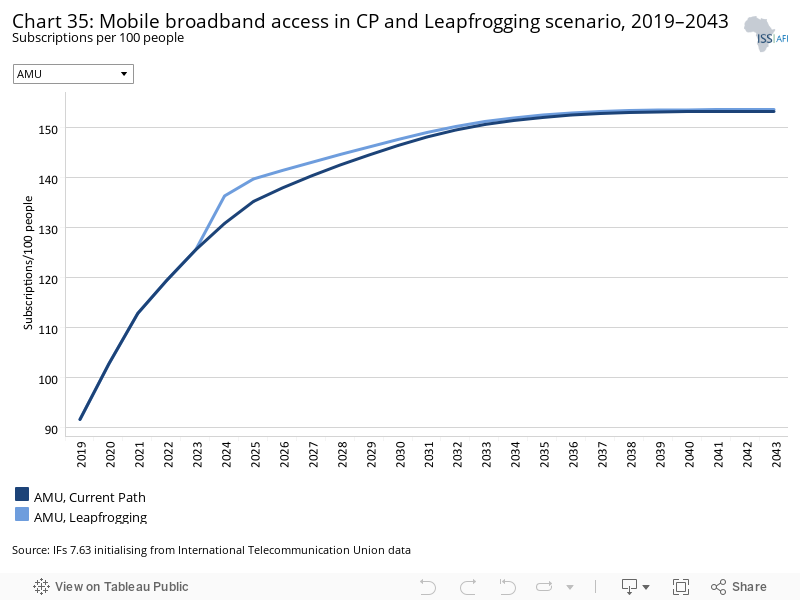
The average mobile broadband subscriptions rate was 91.6 subscriptions per 100 people in 2019. In the Leapfrogging scenario, it increases to about 153.6 subscriptions per 100 people by 2043 compared to 153.2 subscriptions per 100 people in the Current Path forecast. In other words, mobile broadband subscriptions in the scenario are only 0.4 percentage points higher than the Current Path forecast in 2043. Currently, mobile broadband subscription is above 80 subscriptions per 100 people in all the AMU member countries, except in Mauritania where mobile broadband subscription is still low, about 42 subscriptions per 100 people in 2019. Mobile broadband subscription in Mauritania is forecast to reach 152.2 subscriptions per 100 people in 2043 compared to 151.9 in the Current Path forecast in the same year, on par with the other AMU countries.
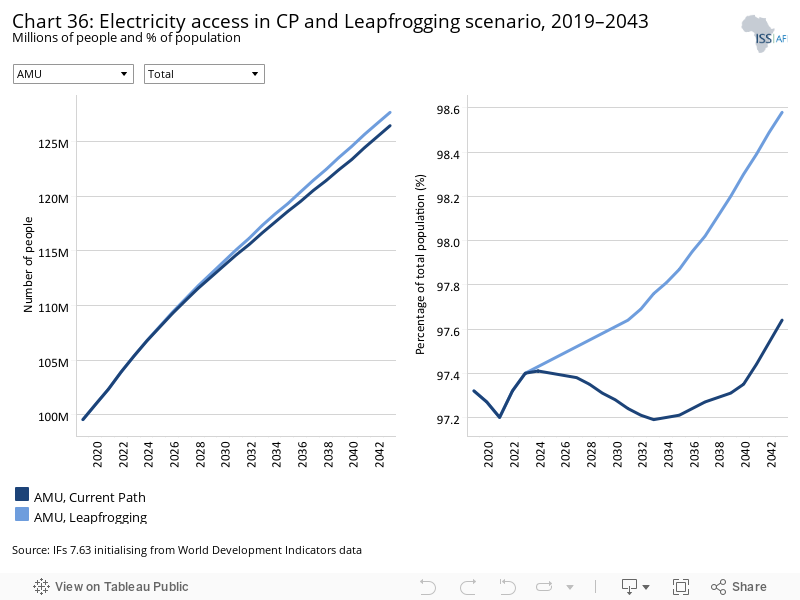
Currently, the AMU area has almost achieved universal access to electricity. In 2019, 99.6 million people had access to electricity, which translates to an electrification rate of 97.3%. In the Leapfrogging scenario, the electrification rate increases to 98.6% (127.7 million people) by 2043 against 97.6% (126.5 million people) in the Current Path forecast in the same year.
The electrification rate was 95.7% and 98.5% in rural and urban areas respectively in 2019. In the Leapfrogging scenario, the electrification rate increases to 97.2% and 99.2% in rural and urban areas, respectively.
These regional averages mask the low electricity access rate in Mauritania where, in 2019, only 42% of the population had access to electricity, with a 5% and 75% access rate in rural and urban areas, respectively. Coming from a lower base than others, Mauritania makes rapid progress and reaches 80.6% in 2043, with 57.7% in rural areas and 91.1% in urban areas.
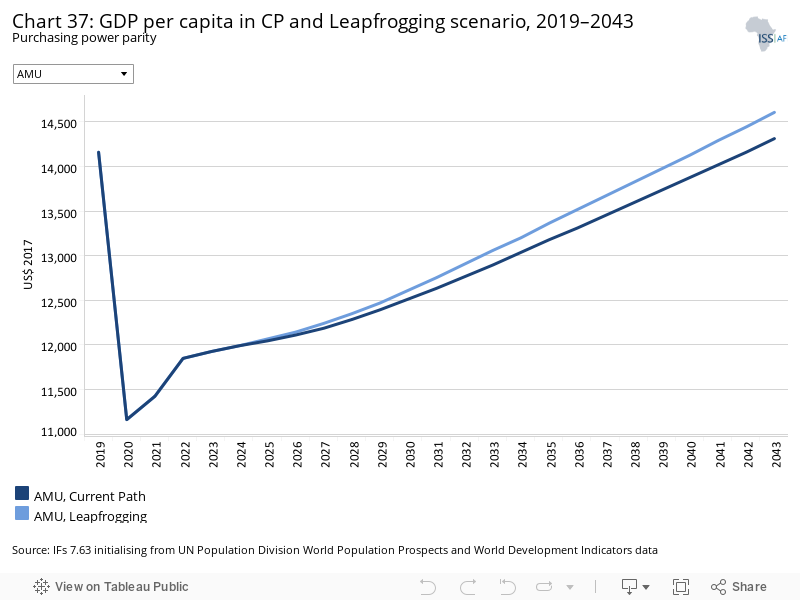
In the Leapfrogging scenario, the regional GDP per capita increases from US$14 159 in 2019 to US$14 606, about a 3.1% increase between 2019 and 2043 against 1.1% in the Current Path forecast. In 2043, the regional GDP per capita is US$294 higher than in the Current Path forecast, and it ranges from US$31 719 in Libya to US$6 145 in Mauritania by 2043. Digital connectivity increases productivity and growth. According to Google and the International Finance Corporation report, a 10% increase in mobile Internet penetration increases GDP per capita by 2.5% in Africa, compared to 2% globally. AMU countries should therefore invest more in digital connectivity.
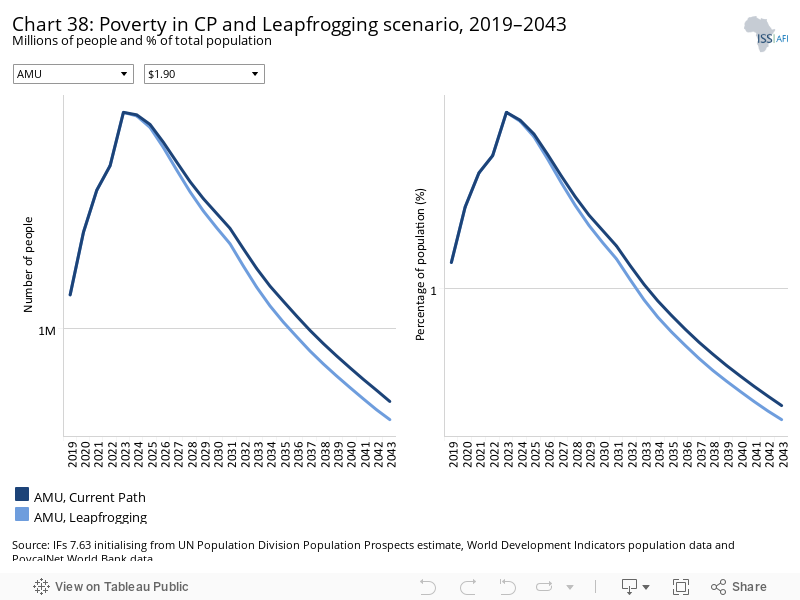
While 0.74 million people will be living in extreme poverty by 2043 in the Current Path forecast, it is about 0.67 million people in the Leapfrogging scenario, 0.07 million fewer poor people than in the Current Path forecast in 2043. The poverty rate stands at 0.52% in the Leapfrogging scenario compared to 0.57% in the Current Path forecast in 2043.
In the Leapfrogging scenario, the extreme poverty rate at US$1.90 ranges from 0.03% in Algeria to 6.5% in Mauritania in 2043. In the Leapfrogging scenario, only Mauritania is not on track to achieve the SDG goal of eradicating extreme poverty by 2030. In this scenario, the poverty rate in Mauritania is 15.1% by 2030, while Algeria, Libya, Morocco and Tunisia already have their extreme poverty rate below 3% as of 2019. Mauritania should improve access to the Internet and electricity to improve the income prospects of the poor and reduce poverty.
The Free Trade scenario represents the impact of the full implementation of the African Continental Free Trade Area (AfCFTA) by 2034 through increases in exports, improved productivity and increased trade and economic freedom.
The intervention is explained here in the thematic part of the website.
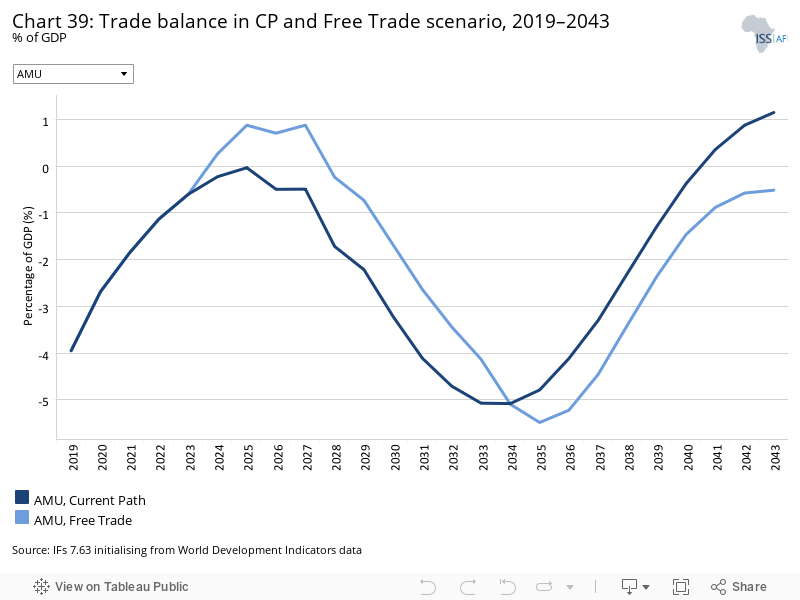
The trade balance is the difference between the value of a country's exports and its imports. A country that imports more goods and services than it exports in terms of value has a trade deficit, while a country that exports more goods and services than it imports has a trade surplus.
A trade balance is the difference between a country's exports and the value of a country's imports at a given point in time. A country that imports more goods and services than it exports in terms of value has a trade deficit, while a country that exports more goods and services than it imports has a trade surplus.
The implementation of the AfCFTA improves the AMU’s trade balance compared to the Current Path between 2023 and 2034, where the trade deficit (% of GDP) of the AMU area is lower than in the Current Path forecast.
However, after 2034, when the AfCTA is fully implemented, the trade deficit recorded in the Free Trade scenario is higher than in the Current Path forecast, because, with the removal of trade restrictions, it becomes easier to import while AMU firms face intense competition on the export markets. In 2043, the AMU area records a trade surplus worth 1.2% of GDP in the Current Path forecast compared to a deficit of about 0.4% of GDP in the Free Trade scenario.
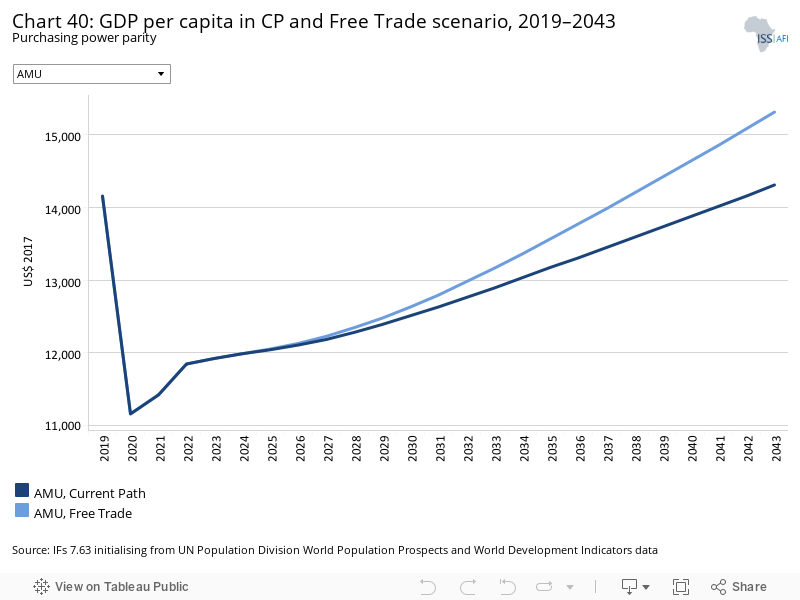
In the Free Trade scenario, the regional GDP per capita increases from US$14 159 in 2019 to US$15 314, an increase of about 8.1% between 2019 and 2043, compared to 1.1% in the Current Path forecast. In 2043, the regional GDP per capita is US$1 002 higher than in the Current Path forecast. Compared to the Current Path, the GDP per capita in the Free Trade scenario improves by US$1 207 in Libya, US$1 077 in Algeria, US$1 025 in Tunisia, US$963 in Morocco and US$518 in Mauritania. Generally, the liberalisation of trade improves productivity through competition and technology diffusion, stimulating growth and income per capita, all other things being equal.
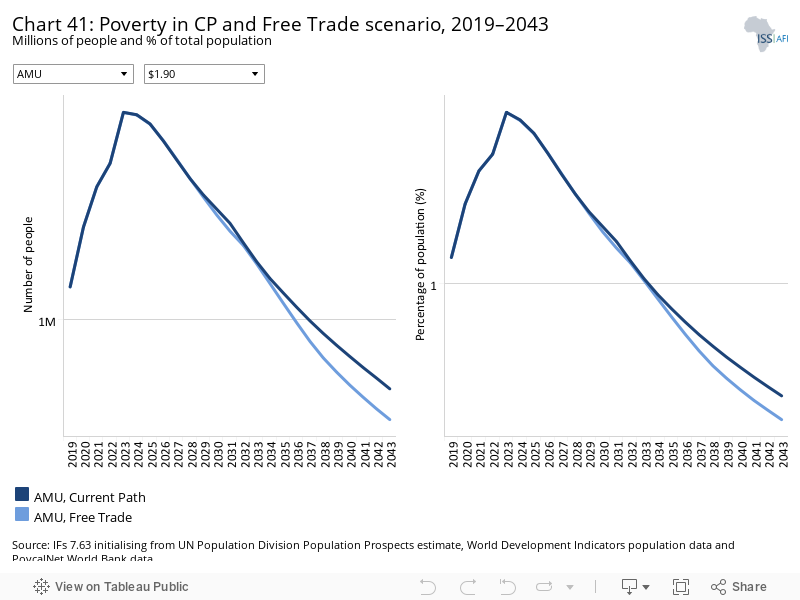
By 2043, 0.74 million people will be living in extreme poverty in the Current Path forecast than about 0.62 million people in the Free Trade scenario, 0.12 million fewer poor people than in the Current Path forecast in 2043. The poverty rate stands at 0.48% in the scenario compared to 0.57% in the Current Path forecast in 2043.
The extreme poverty rate at US$1.90 ranges from 0.02% in Algeria to 5.9% in Mauritania in the Free Trade scenario in 2043. Despite the significant contribution of the Free Trade scenario to poverty reduction, Mauritania is not on track to achieve the SDG goal of eradicating extreme poverty by 2030. In this scenario, the poverty rate in Mauritania is 15% by 2030, while Algeria, Libya, Morocco and Tunisia already have their extreme poverty rate significantly below 3% as of 2019. Overall, the Free Trade scenario improves growth and income and reduces poverty in the AMU zone.
The Financial Flows scenario represents a reasonable but ambitious increase in worker remittances and aid flows to poor countries, and an increase in the stock of foreign direct investment (FDI) and additional portfolio investment inflows to middle-income countries. We also reduced outward financial flows to emulate a reduction in illicit financial outflows.
The intervention is explained here in the thematic part of the website.
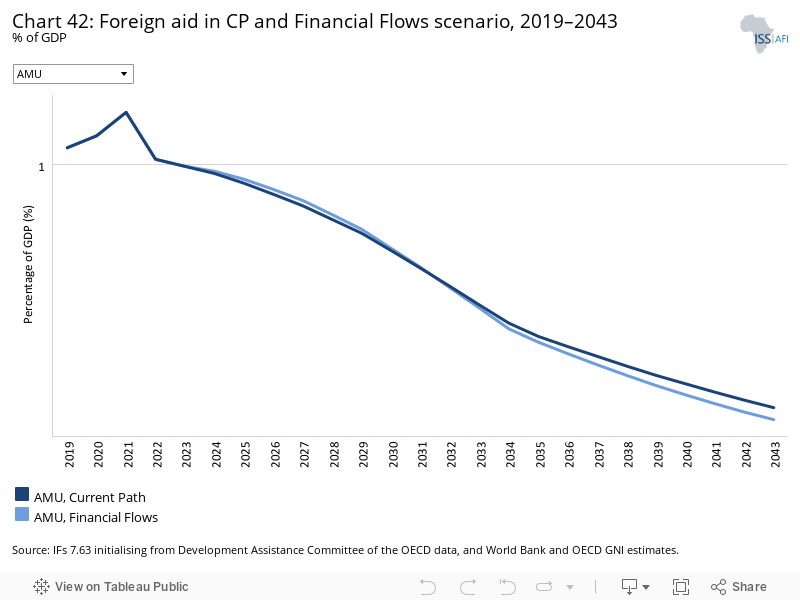
Foreign aid as a percentage of GDP is very low in the AMU countries. The average for Africa was 2.4% of GDP while it was about 1% of GDP in the AMU area in 2019. In absolute terms, most aid goes to Morocco, but measured in contribution to GDP, Mauritania is the largest recipient of aid. In this scenario, foreign aid flows to the AMU zone increase slightly above the Current Path forecast between 2023 and 2036 before declining to below the Current Path forecast level as donors prioritise low-income countries, none of which are within the AMU. By 2043, foreign aid will only represent 0.47% of GDP in the AMU area. Unsurprisingly, the bulk of aid flows to the AMU area go to Mauritania, which is the poorest country within the AMU. In 2019, aid represented about 6.3% of Mauritania's GDP, compared to less than 2% of GDP in Algeria and Libya and barely 2% of GDP for Tunisia and Morocco. By 2043, Mauritania gets the equivalent of 3% of GDP in aid, followed by 0.9% for Morocco, 0.6% in Tunisia. Libya and Algeria get even less.
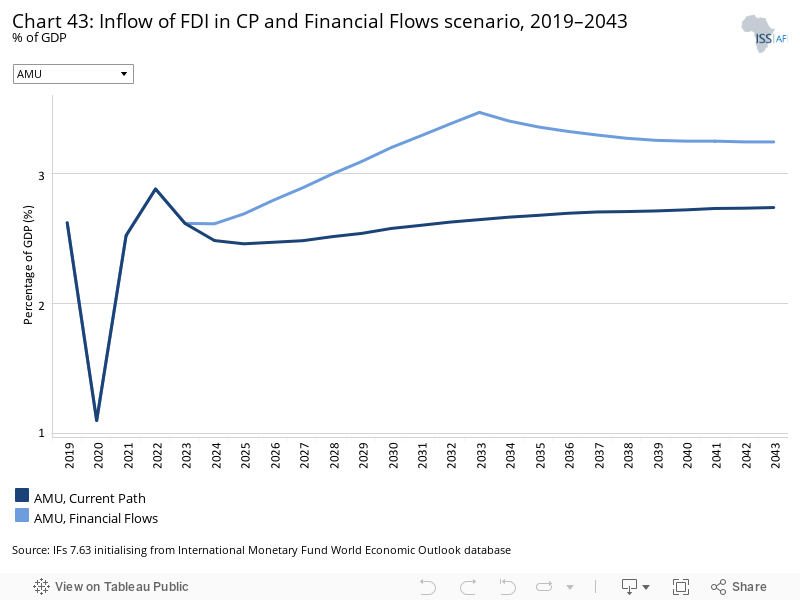
Historically, a poor business environment limits FDI flows to the AMU area. Countries like Algeria have a particularly closed economy which impedes FDI inflows.
FDI flows to the AMU area were 2.6% of the regional GDP in 2019 before dropping to 1.1% of GDP in 2020 due to the COVID-19 pandemic and its associated economic crisis. This is on par with the average for Africa, which was 2.7% of GDP in 2019 and 1.1% in 2020. In the Financial Flows scenario, FDI flows to AMU in 2043 represent about 3.2% of GDP compared to 2.7% in the Current Path forecast. As a percentage of GDP, Mauritania is the largest recipient of FDI within the AMU while Algeria receives the least. FDI inflows to Mauritania accounted for 9.6% of GDP in 2019 against 1.1% of GDP in Algeria. In the scenario, FDI inflows range from 10.3% of GDP in Mauritania to 2.1% in Algeria by 2043.
By improving the business environment, FDI can act as a catalyst for regional integration. The Algerian government has recently made some policy reforms to offer incentives to foreign investments and boost its economy. This includes the scrapping of the law that limits foreign ownership in local companies. These reforms augur well for FDI flows to Algeria and the AMU area.
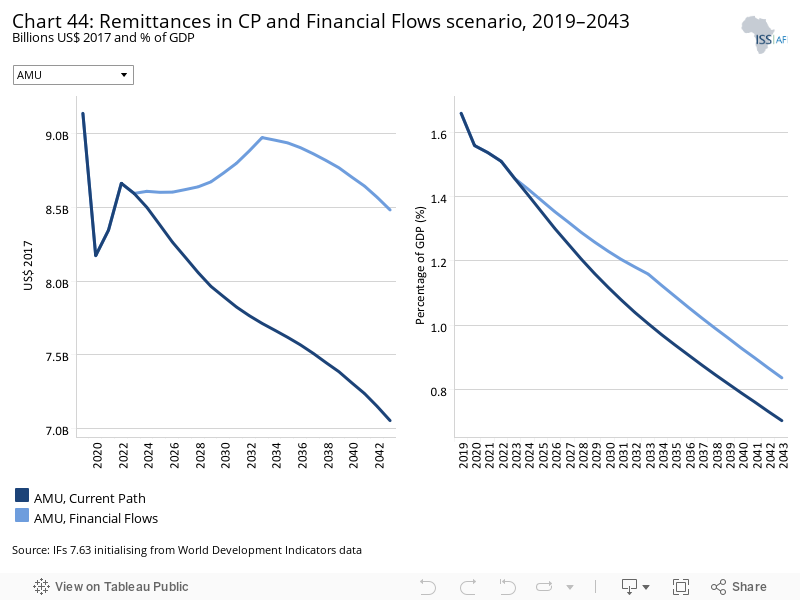
Remittance flows to the AMU amounted to US$9.1 billion in 2019, or only 1.7% of GDP, with some countries such as Libya and Mauritania experiencing net outflows. In the scenario, the total remittances to the AMU area are US$8.1 billion (0.8% of GDP) by 2043 compared to US$6.9 billion (0.7% of GDP) in the Current Path forecast. This is equivalent to US$1.2 billion more than the Current Path forecast in 2043. However, remittances to the AMU zone are projected to decline as compared to their levels in 2019.
Morocco is by far the largest recipient of remittances both in absolute terms and percentage of GDP. At the same time, Libya and Mauritania are both net suppliers of remittances to the rest of the world. Before its protracted political crisis, Libya was a destination for thousands of African migrants. Many Africans worked in Libya and Mauritania and sent money to their relatives back home.
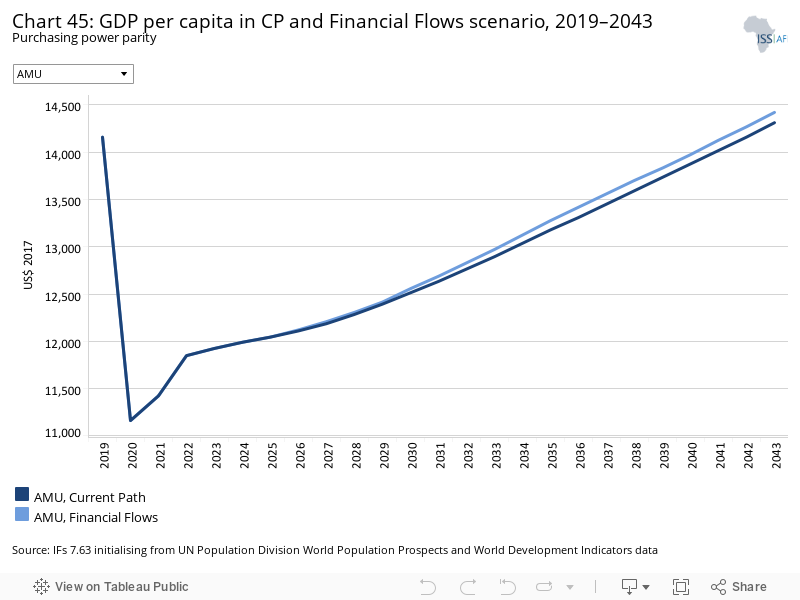
In the Financial Flows scenario, the regional GDP per capita increases from US$12 000 in 2019 to US$14 300, which is a 19% increase between 2019 and 2043 compared to 18% in the Current Path forecast. In 2043, the regional GDP per capita is US$100 higher than in the Current Path forecast. The GDP per capita in the scenario ranges from US$31 100 in Libya to US$5 900 in Mauritania. Overall, the Financial Flows scenario has a modest impact on GDP per capita in the AMU area. External financial flows such as remittances, aid and FDI are still low in the area. FDI, which can boost growth and development through capital accumulation and technology transfer, has not yet reached the level that would make it a game changer in the AMU countries.
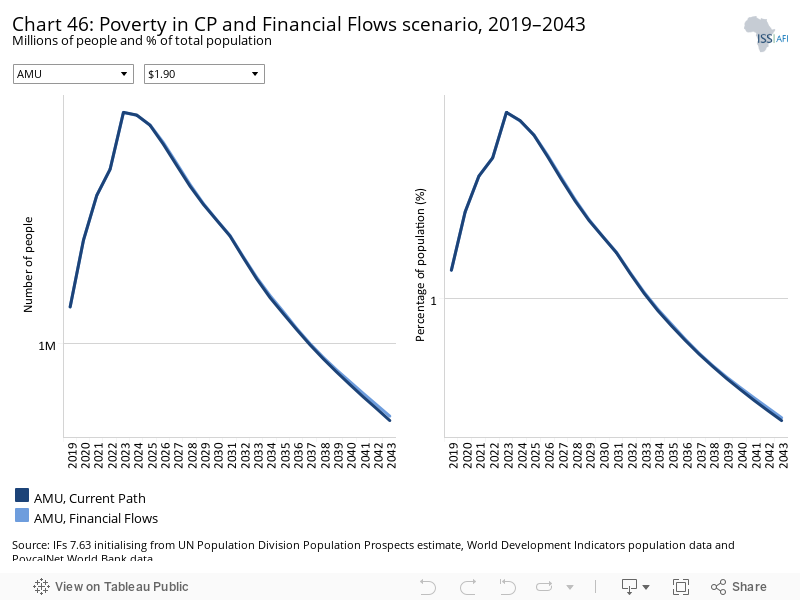
By 2043, 0.74 million people will be living in extreme poverty in both the Current Path forecast and in the Financial Flows scenario. This is equivalent to 20 000 fewer extremely poor people than in the Current Path forecast in 2043. The poverty rate stands at 0.57% in the scenario by 2043, the same as in the Current Path forecast.
The extreme poverty rate at US$1.90 ranges from 0.03% in Algeria to 6.8% in Mauritania in the Financial Flows scenario in 2043. Mauritania is the only AMU country that is not on track to achieve the SDG goal of eradicating extreme poverty by 2030. In this scenario, the poverty rate in Mauritania is 15.5% by 2030, while Algeria, Libya, Morocco and Tunisia already have their extreme poverty rate significantly below 3% as of 2019. Overall, the impact of the scenario on poverty reduction is marginal, mainly because the extreme poverty rate is approaching its saturation level in the AMU area.
External financial flows such as remittances, aid and FDI have the potential to reduce poverty. For instance, if well managed, foreign aid can improve poor people’s education and health and enhance their job and income prospects. FDI, especially manufacturing FDI, can create more jobs in the recipient economies and reduce poverty. Remittances flowing to Africa mainly go to consumption, and it is a crucial lifeline for many poor households.
The Infrastructure scenario represents a reasonable but ambitious increase in infrastructure spending across Africa, focusing on basic infrastructure (roads, water, sanitation, electricity access and ICT) in low-income countries and increasing emphasis on advanced infrastructure (such as ports, airports, railway and electricity generation) in higher-income countries.
Note that health and sanitation infrastructure is included as part of the Health/WaSH scenario and that ICT infrastructure and more rapid uptake of renewables are part of the Leapfrogging scenario. The interventions there push directly on outcomes, whereas those modelled in this scenario increase infrastructure spending, indirectly boosting other forms of infrastructure, including that supporting health, sanitation and ICT.
The intervention is explained here in the thematic part of the website.
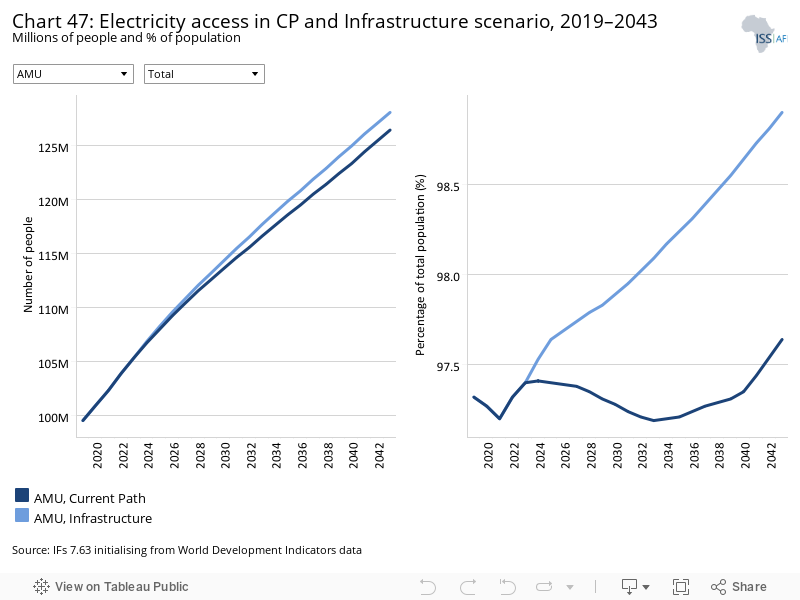
Access to electricity is nearly universal in the AMU area. In 2019, 99.6 million people had access to electricity, which translates to an electrification rate of 97.3%. In the Infrastructure scenario, the electrification rate increases to 98.9% (128.1 million people) by 2043 compared to 97.6% (126.5 million people) in the Current Path forecast in the same year. By area, the electrification rate was 95.7% and 98.5% in rural and urban areas respectively in 2019. In this scenario, the electrification rate increases to 97.6% and 99.5% in rural and urban areas, respectively. The regional average however masks the low electricity access rate in Mauritania, which is lagging. Only 42% of the population had access to electricity in Mauritania in 2019, with a 5% and 75% access rate in rural and urban areas, respectively. In the Infrastructure scenario, the electrification rate in Mauritania reaches 82.1%, with 61.2% in rural areas and 91.7% in urban areas in 2043.
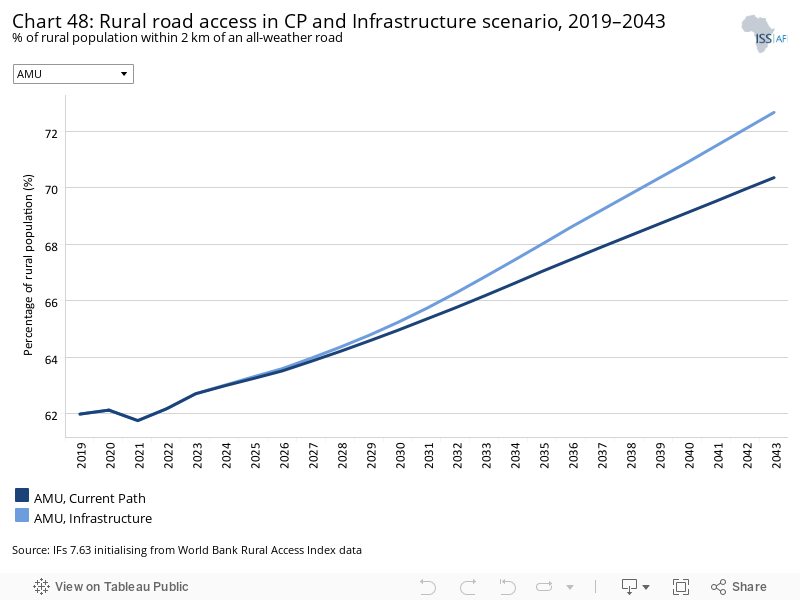
Indicator 9.1.1 in the Sustainable Development Goals refers to the proportion of the rural population who live within 2 km of an all-season road and is captured in the Rural Access Index.
In 2019, about 62% of the population in rural areas of the AMU were within 2 km from an all-weather road. The Current Path forecast is that this will improve to 70.3% by 2043 compared to 72.6% in the Infrastructure scenario in the same year. The AMU countries with the highest access are Libya (90.6% in 2019) and Algeria (86.2% in 2019). The countries with the lowest access in the AMU area are Tunisia (44.6%) and Morocco (42.8%). All the countries gain from the Infrastructure scenario, improving access by at least two percentage points above the Current Path forecast by 2043. Libya will have the highest access by 2043 (100% in the scenario and 97% in the Current Path forecast).
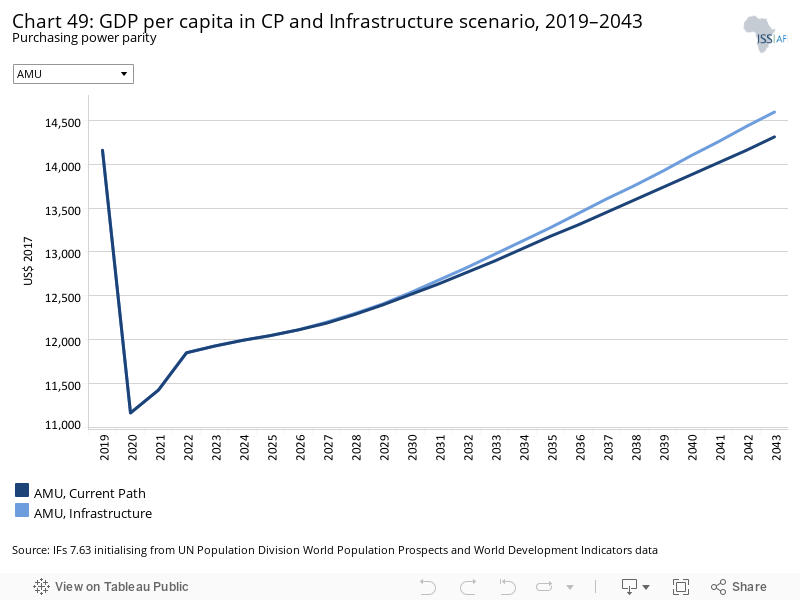
In the Infrastructure scenario, the regional GDP per capita increases from US$14 159 in 2019 to US$14 595, equivalent to a nearly 3.1% increase between 2019 and 2043 compared to 1.1% in the Current Path forecast. In 2043, the regional GDP per capita is US$283 higher than the Current Path forecast. Compared to the Current Path forecast, the GDP per capita in the scenario ranges from US$374 in Libya to US$214 in Morocco. The provision of quality roads reduces transaction cost, improves productivity and ultimately stimulates growth.
By 2043, 0.74 million people will be living in extreme poverty in the Current Path forecast compared to 0.68 million people in the Infrastructure scenario. This is equivalent to 0.06 million fewer poor people than in the Current Path forecast in 2043. The poverty rate stands at 0.53% in this scenario compared to 0.57% in the Current Path forecast in 2043. The extreme poverty rate at US$1.90 ranges from 0.02% in Algeria to 6.5% in Mauritania in the Infrastructure scenario in 2043. Even in the scenario, Mauritania will miss the SDG target of less than 3% of extreme poverty by 2030. In the Infrastructure scenario, the poverty rate in Mauritania is 15.5% by 2030, while Algeria, Libya, Morocco and Tunisia have already achieved the SDG target. Overall, the Infrastructure scenario, which improves basic and advanced infrastructure, reduces extreme poverty in the AMU area.
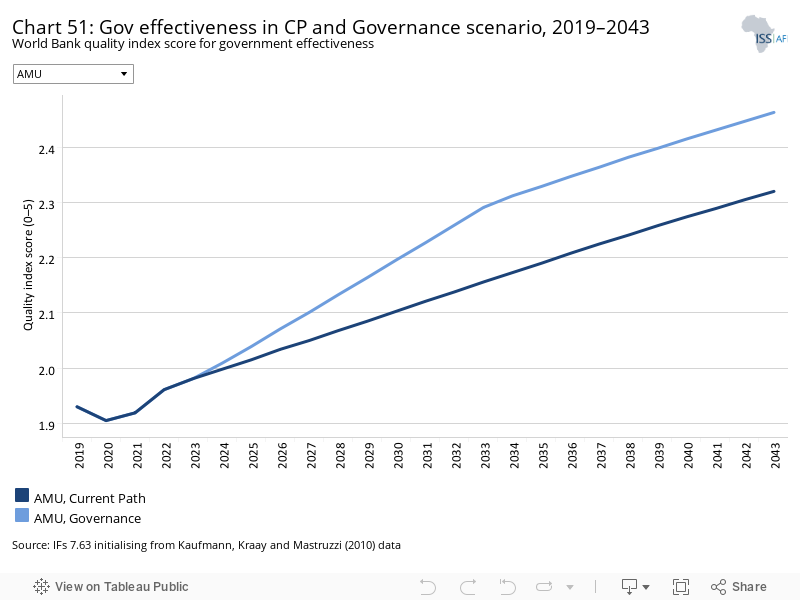
The Governance scenario represents a reasonable but ambitious improvement in accountability and reduces corruption, and hence improves the quality of service delivery by government.
The intervention is explained here in the thematic part of the website.
As defined by the World Bank, government effectiveness ‘captures perceptions of the quality of public services, the quality of the civil service and the degree of its independence from political pressures, the quality of policy formulation and implementation, and the credibility of the government’s commitment to such policies’.
The average score for government effectiveness for AMU was 1.9 (out of a maximum score of 5) in 2019. In the Governance scenario, the score increases to 2.5 by 2043 compared to 2.3 in the Current Path forecast. This translates to an improvement of 31.5% between 2019 and 2043 compared to 21% in the Current Path forecast. Government is more effective in service delivery in Morocco than its peers in the AMU. In the Governance scenario, the government effectiveness score ranges from 2.9 in Morocco to 2.1 in Mauritania. The low level of government effectiveness in Mauritania reflects the inadequate provision of essential public services compared to its peers in AMU. Mauritania lags in terms of electrification rate, clean water access and poverty alleviation.
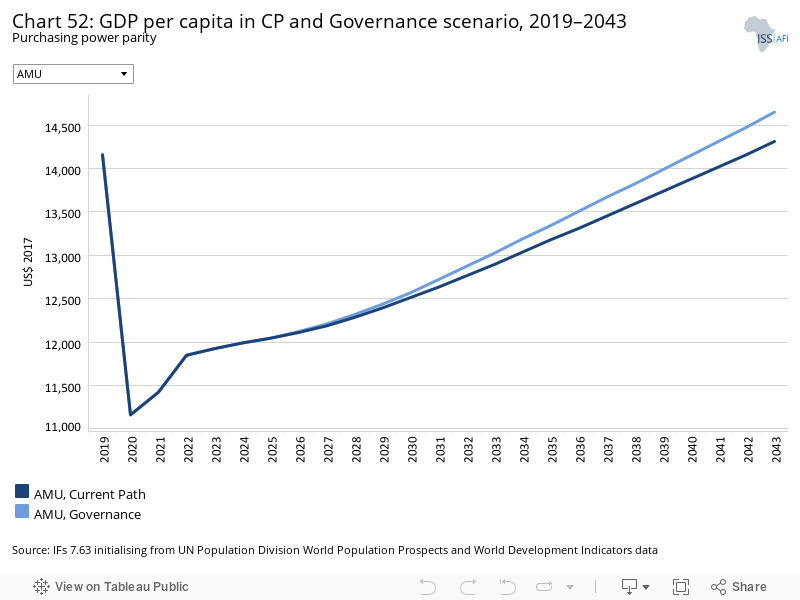
Chart 52 shows the average GDP per capita (PPP) of the AMU in the Current Path forecast and the Governance scenario from 2019 to 2043. In the Governance scenario, the regional GDP per capita increased from US$14 159 in 2019 to US$14 650, equivalent to a 3.5% increase between 2019 and 2043 compared to 1.1% in the Current Path forecast. Compared to the Current Path forecast in 2043, the Governance scenario improves the GDP per capita by US$290 in Libya, US$344 in Algeria, US$343 in Tunisia and Morocco, and US$197 in Mauritania. Critical determinants of growth depend on governance and institutional setting in a country. AMU countries should improve governance to unlock economic growth and income levels.
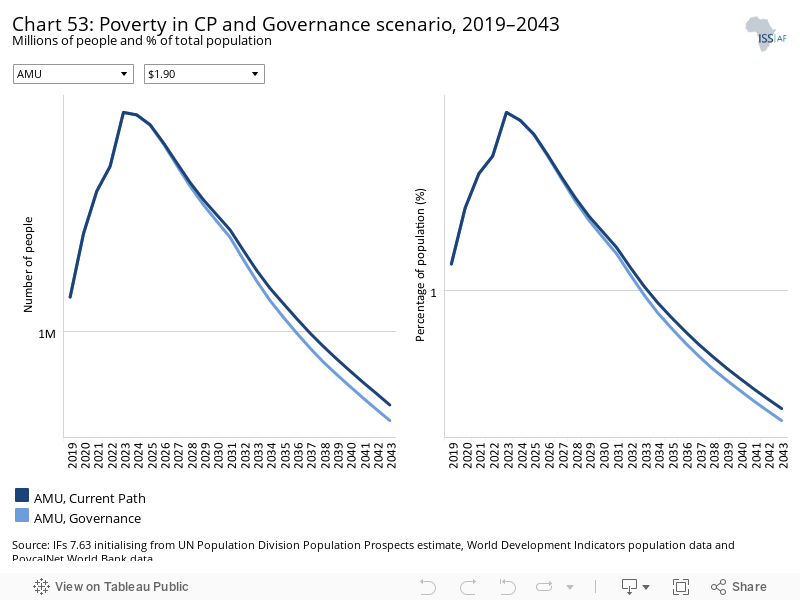
The extreme poverty rate at US$1.90 is very low in the AMU zone. As the poverty rate is approaching its saturation level, it declines very slowly.
In 2019, 1.1 million people, or 1.1%, of the AMU population lived in extreme poverty. By 2043, 0.74 million people will be living in extreme poverty, compared to 0.68 million people in the Governance scenario. This is equivalent to 0.06 million fewer poor people than in the Current Path forecast in 2043. In this scenario, the poverty rate stands at 0.53%, compared to 0.57% in the Current Path forecast in 2043, and the extreme poverty rate at US$1.90 ranges from 0.03% in Algeria to 6.6% in Mauritania in 2043. The low average poverty, however, masks some differences at the country level. Mauritania is not on track to achieve the SDG goal of eradicating extreme poverty by 2030. In this scenario, the poverty rate in Mauritania is 15.4% by 2030, while Algeria, Libya, Morocco and Tunisia already have their extreme poverty rate significantly below 3% as of 2019. The rate of extreme poverty in Mauritania declines to 6.6% by 2043.
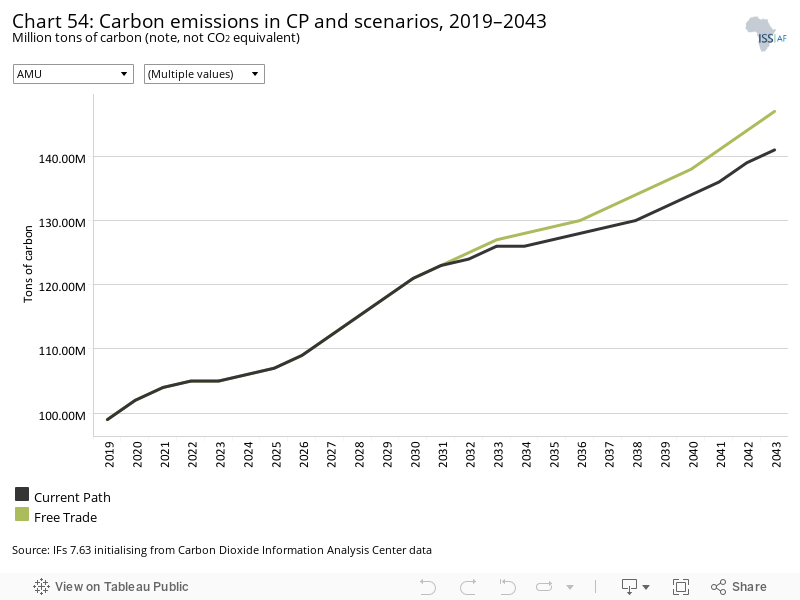
This section presents projections for carbon emissions in the Current Path for AMU and the 11 scenarios. Note that IFs uses carbon equivalents rather than CO2 equivalents.
The Free Trade scenario has the most significant impact on carbon emissions, followed by the Stability scenario. The Demographic scenario has the lowest level of carbon emission. The reduction of population growth reduces population pressure on the utilisation of resources and hence minimises environmental degradation. Except for the Demographic scenario, the quantity of carbon emissions in all the scenarios is higher than in the Current Path forecast in 2043. By 2043, the carbon emissions range from 147 million tons for the Free Trade scenario to 140 million tons of carbon for the Demographic scenario. The large amount of carbon emissions in the Free Trade scenario can be explained by the fact that the AfCFTA agreement is expected to increase trade in manufacturing goods, which means more carbon-intensive manufacturing given the low level of renewable energy production in AMU and Africa as a whole.
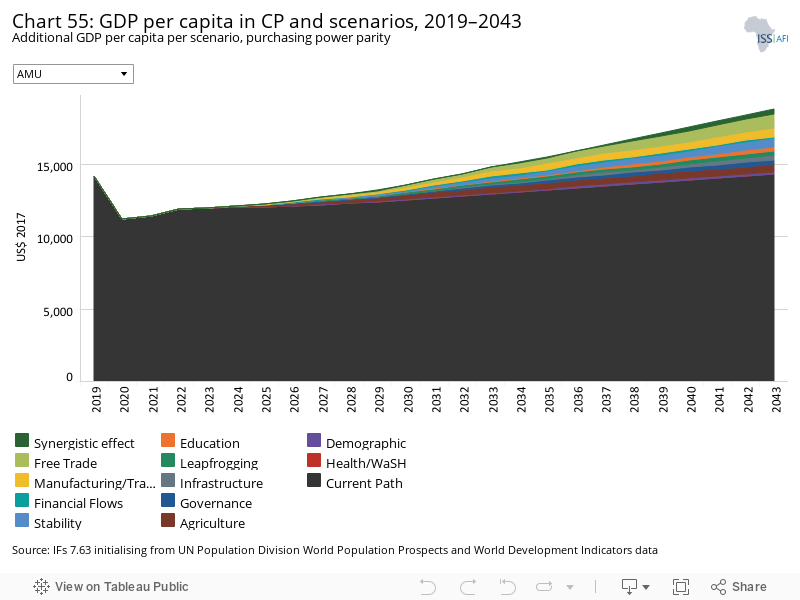
The Combined Agenda 2063 scenario consists of the combination of all 11 sectoral scenarios presented above, namely the Stability, Demographic, Health/WaSH, Agriculture, Education, Manufacturing/Transfers, Leapfrogging, Free Trade, Financial Flows, Infrastructure and Governance scenarios. The cumulative impact of better education, health, infrastructure, etc. means that countries get an additional benefit in the integrated IFs forecasting platform that we refer to as the synergistic effect. Chart 55 presents the contribution of each of these 12 components to GDP per capita in the Combined Agenda 2063 scenario.
Compared to the Current Path forecast, the Free Trade scenario has the most significant impact on GDP per capita. In contrast, the Health/WaSH scenario has the lowest contribution to GDP per capita in the AMU area. Specifically, the GDP per capita in the Free Trade scenario is US$1 003 larger than in the Current Path forecast, while the Health/WaSH scenario makes no impact by 2043. The AMU zone has almost achieved universal access in WaSH infrastructure. Therefore, additional improvement has little impact on growth and no impact on income per capita.
Most of the AMU countries’ economies are very closed and constraining; trade liberalisation will lead to the elimination of trade and non-trade barriers and improvement in the business environment. As a result, competition, technology diffusion and FDI inflows will increase with a positive effect on growth and income levels.
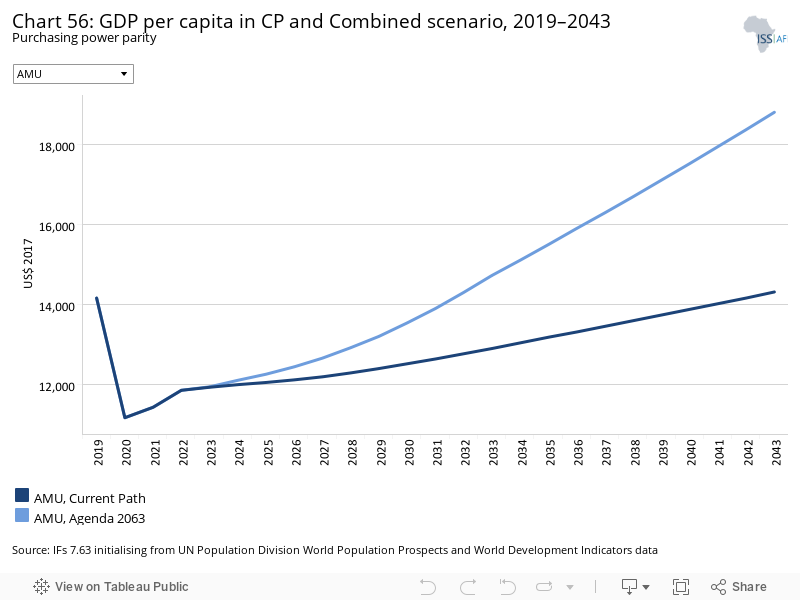
Whereas Chart 55 presents a stacked area graph on the contribution of each scenario to GDP per capita as well as the additional benefit or synergistic effect, Chart 56 presents only the GDP per capita in the Current Path forecast and the Combined Agenda 2063 scenario.
The Combined Agenda 2063 scenario increases the average GDP per capita of the AMU from US$14 159 in 2019 to US$18 813, equivalent to a 32.9% increase between 2019 and 2043 compared to 1.1% in the Current Path forecast. In 2043, the regional GDP per capita is US$4 501 higher than in the Current Path forecast. Compared to the Current Path forecast, the most significant improvement in GDP per capita comes from Libya. In the Combined Agenda 2063 scenario, the GDP per capita is US$6 769 larger than the Current Path in Libya, US$4 818 in Algeria, US$4 4458 in Tunisia, US$3984 in Morocco and US$2 929 in Mauritania. The Combined Agenda 2063 scenario shows that a policy push across all the development sectors is necessary to achieve sustained growth and development in the AMU area.
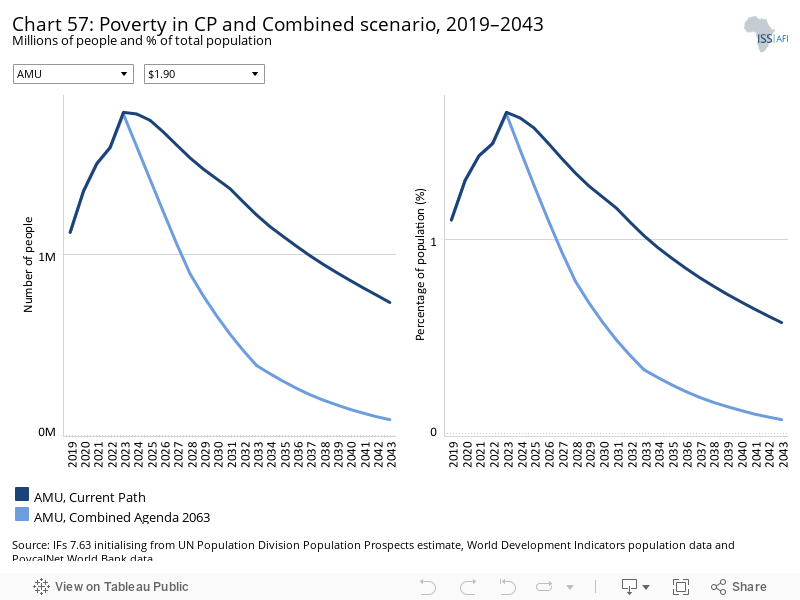
The Combined Agenda 2063 scenario has a significant impact on poverty reduction in the AMU. In 2019, 1.1 million people, or 1.1%, of the AMU population, lived in extreme poverty. By 2043, 736 000 people will be living in extreme poverty in the Current Path forecast compared to 88 000 people in the Combined Agenda 2063 scenario. This is equivalent to an 88%, or 648 000 fewer poor people, reduction than the Current Path forecast in 2043. The poverty rate stands at 0.069% in the scenario, compared to 0.57% in the Current Path forecast in 2043.
Despite the massive impact of the Combined Agenda 2063 scenario on poverty reduction, Mauritania is not on track to achieve the SDG goal of eradicating extreme poverty by 2030. In this scenario, the poverty rate at the $1.90 poverty line in Mauritania is 7.1% by 2030, while Algeria, Libya, Morocco and Tunisia already had their extreme poverty rate significantly below 3% in 2019 and less than 0.5% in 2043. Mauritania should make an effort to catch up with its peers in AMU regarding poverty reduction and development in general.
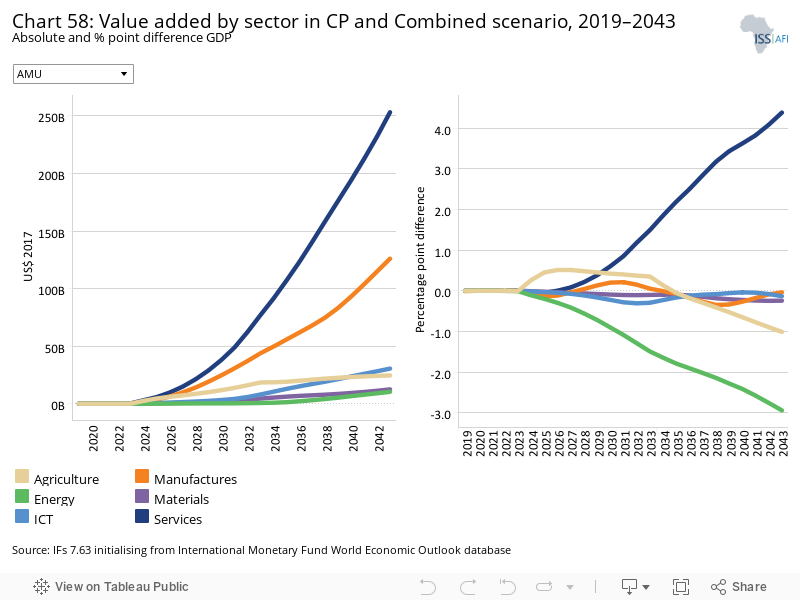
See Chart 8 to view the Current Path forecast of the sectoral composition of the economy.
Compared to the Current Path forecast, the service sector gets the most significant improvement, with its value in the Combined Agenda 2063 scenario US$253.2 billion larger than the value forecast in the Current Path forecast in 2043. In percentage of GDP, it is 4.4 percentage points above the Current Path forecast in the same year. The service sector is followed by the manufacturing industry, with its value in the scenario US$126 billion larger than the value forecast in the Current Path forecast in 2043. The value of ICT, agriculture, materials and energy in the scenario are respectively US$30.5billion, US$24.6 billion and US$12.5 billion, and US$10.4 billion larger than the Current Path forecast by 2043. Although in absolute terms, the value of all the sectors in the scenario is higher than the Current Path forecast, only the value of the services and the manufacturing sectors as a percentage of GDP is higher than the Current Path forecast. The service sector will continue to be the dominant sector of the AMU economy.
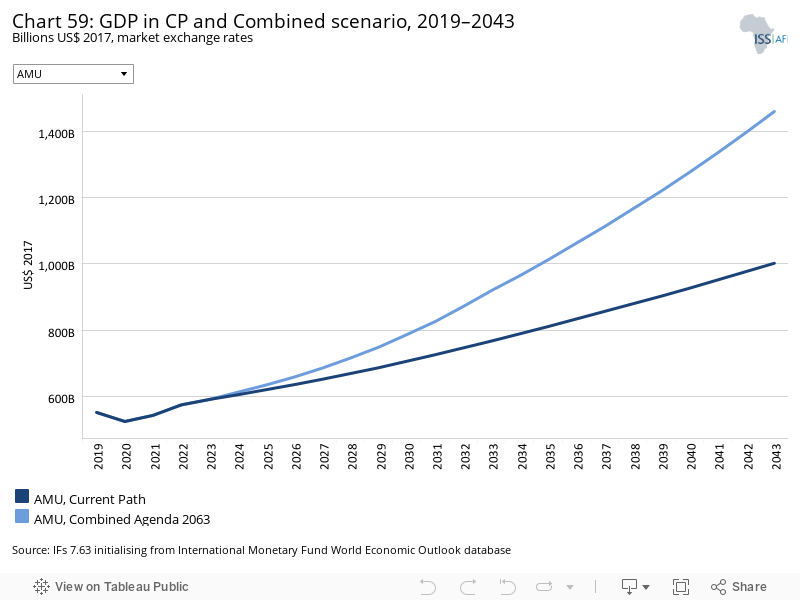
The Combined Agenda 2063 scenario has a dramatic impact on the expansion of the AMU economy. The size of the AMU economy (GDP) expands from US$551.5 billion in 2019 to US$1 459.5 trillion in 2043, which is more than a 165% increase between 2019 and 2043 in the scenario, compared to 81.6% in the Current Path forecast over the same period.
In 2043, the GDP of the AMU zone in the Combined Agenda 2063 scenario is about 46%, or US$457.8 billion, more significant than the Current Path forecast. Compared to the Current Path forecast, Algeria has the most significant improvement in GDP. By 2043, the GDP in the Combined Agenda 2063 scenario is US$192.6 billion larger than the Current Path forecast in Algeria, US$146.3 billion in Morocco, US$49.4 billion in Libya, US$49.1 billion in Tunisia, and US$19.8 billion in Mauritania. The Combined Agenda 2063 scenario shows that a policy push across all the development sectors is necessary to achieve sustained growth and development in the AMU area.
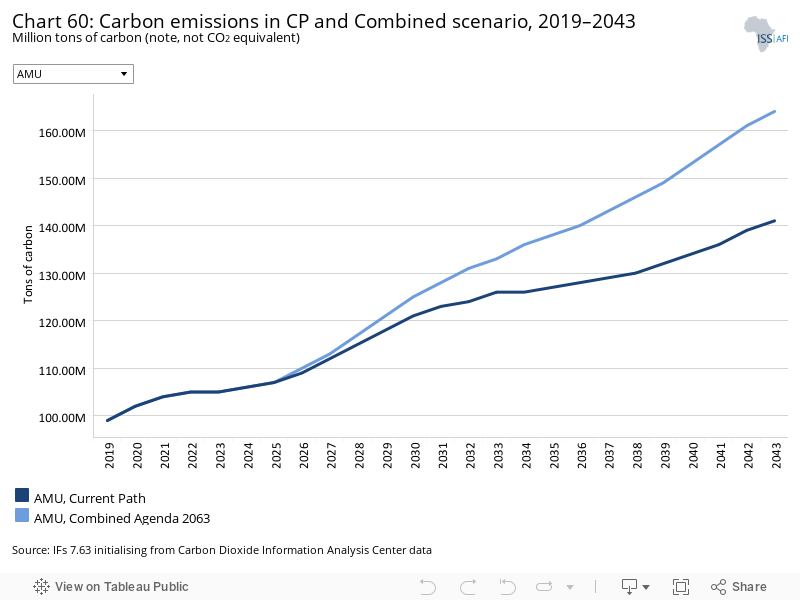
The Combined Agenda 2063 scenario has a significant impact on carbon emission in the AMU zone: carbon emissions increase from 99 million tons of carbon in 2019 to 164 million tons of carbon by 2043, which is a 65.6% increase between 2019 and 2043, compared to 42.4% in the Current Path forecast over the same period. In 2043, the carbon emissions in the AMU zone in the Combined Agenda 2063 scenario are about 16.3%, or 23 million tons of carbon, higher than the Current Path forecast. Compared to the Current Path forecast, Algeria gets the most significant increase in carbon emissions. By 2043, the carbon emissions in the Combined Agenda 2063 scenario will be 9 million tons of carbon higher than the Current Path forecast in Algeria, 8 million higher in Morocco, 2.5 million in Libya and 2.4 million in Tunisia, and 0.9 million in Mauritania. The Combined Agenda 2063 scenario stimulates high growth in the AMU area but the opportunity cost in terms of environmental degradation is high. To mitigate the environmental impact of the Combined Agenda 2063 scenario, its implementation should be accompanied by concrete steps to accelerate the energy transition.
Page information
Contact at AFI team is Kouassi Yeboua
This entry was last updated on 25 June 2024 using IFs v7.63.
Donors and sponsors


Reuse our work
- All visualizations, data, and text produced by African Futures are completely open access under the Creative Commons BY license. You have the permission to use, distribute, and reproduce these in any medium, provided the source and authors are credited.
- The data produced by third parties and made available by African Futures is subject to the license terms from the original third-party authors. We will always indicate the original source of the data in our documentation, so you should always check the license of any such third-party data before use and redistribution.
- All of our charts can be embedded in any site.
Cite this research
Kouassi Yeboua (2025) AMU. Published online at futures.issafrica.org. Retrieved from https://futures.issafrica.org/geographic/recs/amu/ [Online Resource] Updated 25 June 2024.