 South Africa
Feedback welcome
Our aim is to use the best data to inform our analysis. See our About page for information on the IFs forecasting platform. We appreciate your help and references for improvements via our feedback form.
In this entry, we first describe the Current Path forecast for South Africa as it is expected to unfold to 2043, the end of the third ten-year implementation plan of the African Union’s Agenda 2063 long-term vision for Africa. The Current Path in the International Futures (IFs) forecasting model initialises from country-level data that is drawn from a range of data providers. We prioritise data from national sources.
The Current Path forecast is divided into summaries on demographics, economics, poverty, health/WaSH and climate change/energy. A second section then presents a single positive scenario for potential improvements in stability, demographics, health/WaSH, agriculture, education, manufacturing/transfers, leapfrogging, free trade, financial flows, infrastructure, governance and the impact of various scenarios on carbon emissions. With the individual impact of these sectors and dimensions having been considered, a final section presents the impact of the Combined Agenda 2063 scenario.
We generally review the impact of each scenario and the Combined Agenda 2063 scenario on gross domestic product (GDP) per person and extreme poverty except for Health/WaSH that uses life expectancy and infant mortality.
The information is presented graphically and supported by brief interpretive text.
All US$ numbers are in 2017 values.
Summary
- Current Path forecast
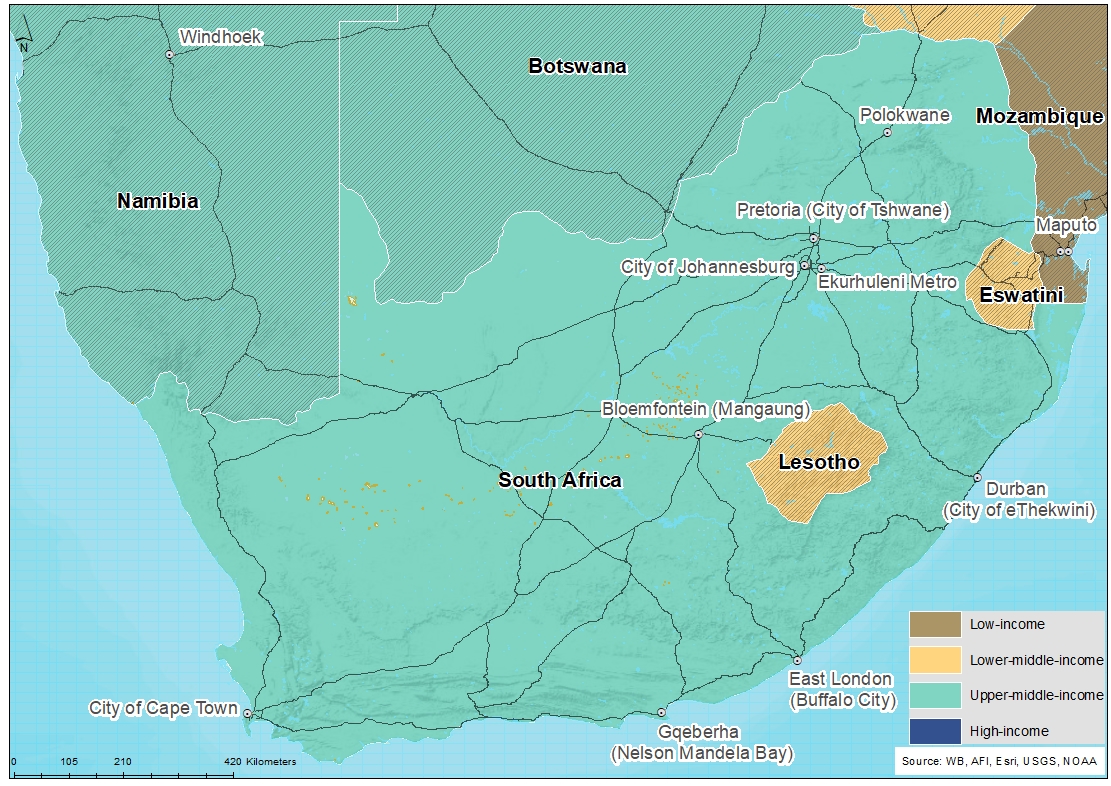
- South Africa is Africa’s second largest and most developed economy. It is classified as one of seven upper middle-income countries in Africa but has suffered from slow economic growth and poor governance for more than a decade. Jump to forecast: Current Path
- With a median age of 27 years in 2019, which is forecast to increase to 33 years by 2043, South Africa is in a potential demographic window of opportunity. Jump to Demographics: Current Path
- On its current trajectory, South Africa is caught in a classic middle-income growth trap and is steadily falling further below the average growth rate of upper middle-income countries globally. Jump to Economics: Current Path
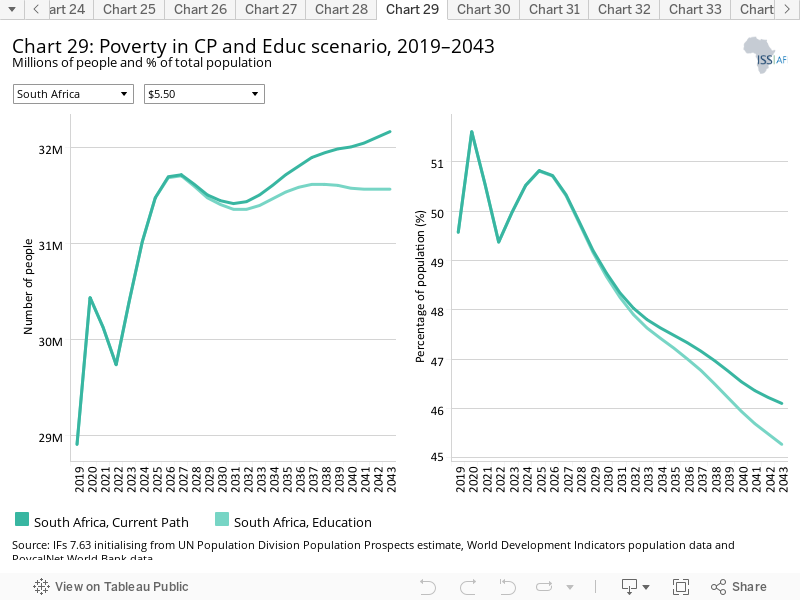
- At the US$5.50 income level the portion of people living in extreme poverty in South Africa was at 28.9 million (50% of its population) in 2019, forecast to increase to 32 million (46%) by 2043. Jump to Poverty: Current Path
- South Africa is dependent on coal for 96% of its energy production and, as a result, is the largest carbon emitter in Africa and 14th largest globally. For more than a decade the country has suffered from electricity outages that constrain economic growth. Jump to Carbon emissions/Energy: Current Path
- Sectoral Scenarios
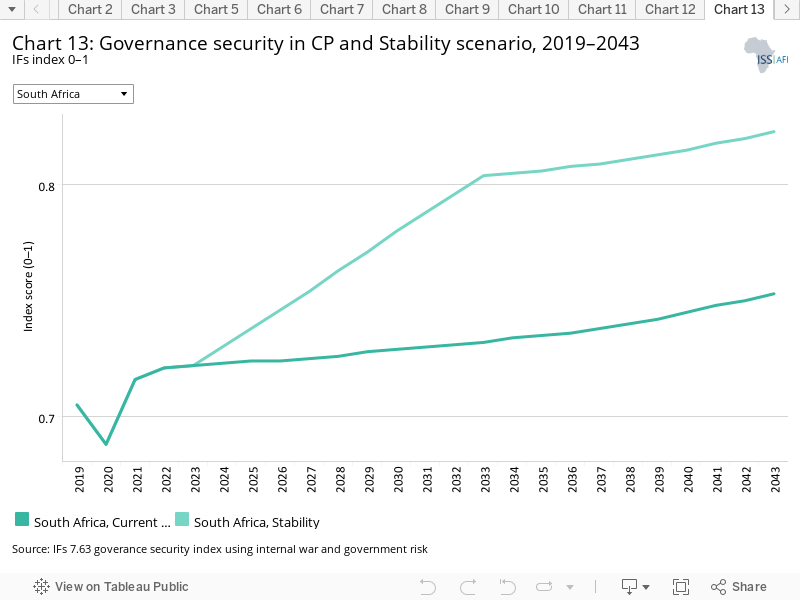
- South Africa has high levels of crime, including homicide, that serve as drag on growth. The Stability scenario improves South Africa’s security index ranking by 9.3% in 2043 compared to the Current Path forecast. Jump to Stability scenario
- Given its positive location on the demographic transition, the Demographic scenario has limited impact on South Africa, advancing the moment of its peak dividend by three years as well as slightly increasing the ratio of working-age persons to dependants. Jump to Demographic scenario
- Because of HIV/AIDS, South Africa’s life expectancy is significantly below that of its peers. The Health/WaSH scenario increases life expectancy by 1.8 years above the Current Path forecast in 2043. Jump to Health/WaSH scenario
- Although the agriculture sector contributes only around 2% to the GDP, South Africa is one of the few African countries that is food secure. The Agriculture scenario increases crop yields by 6.3% in 2043. However, a growing population and the impacts of climate change will result in significant constraints within the sector. Jump to Agriculture scenario
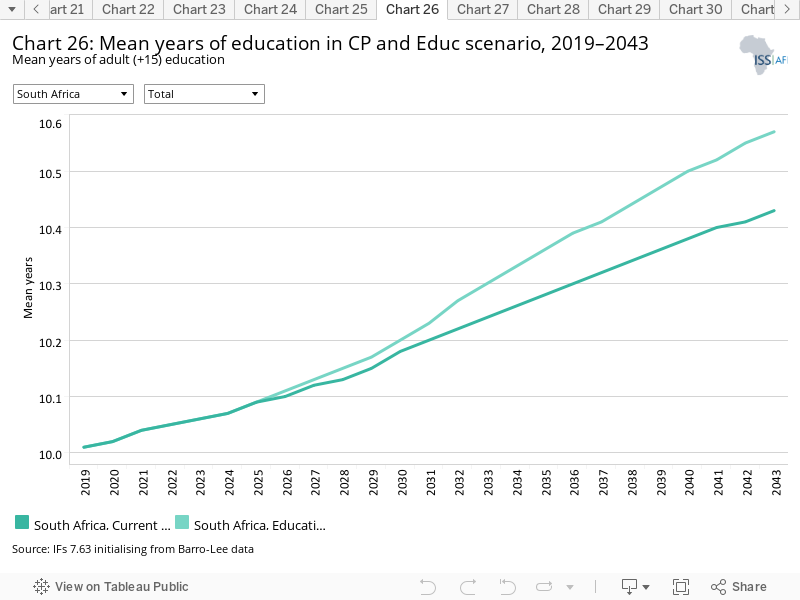
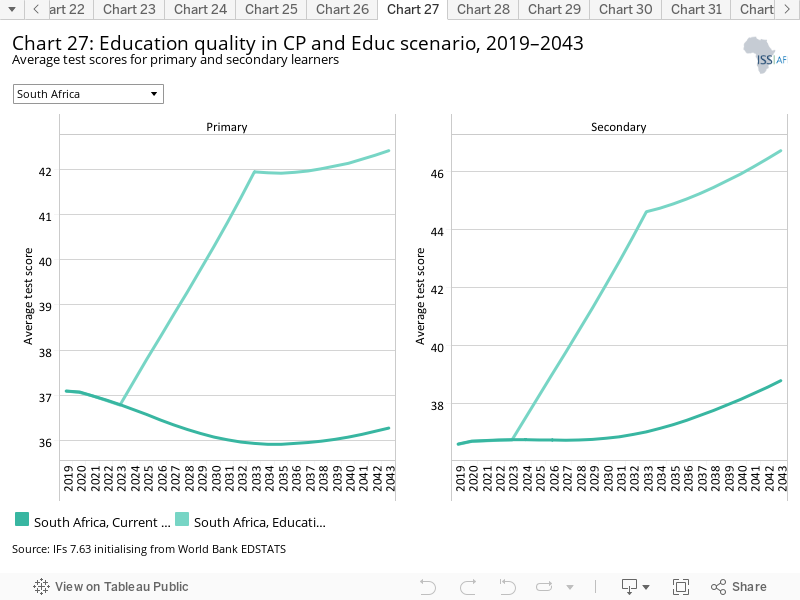
- The average number of years of education in South Africa is high, but education quality is low. The Education scenario modestly improves the mean years of adult education and improves primary and secondary quality scores by 17% and 21% respectively in 2043. Jump to Education scenario
- Instead of an economy that is US$694.4 billion in size in 2043, the Manufacturing/Transfers scenario will result in an economy that is US$98.9 billion larger in 2043 — a difference of 8%. Jump to Manufacturing/Transfers scenario
- In the Leapfrogging scenario, South Africa’s rate of fixed broadband subscribers per 100 people increases by more than 80% by 2043. Mobile broadband reaches 155 subscribers per 100 people by 2024 and stays at saturation levels throughout the forecast horizon. Jump to Leapfrogging scenario
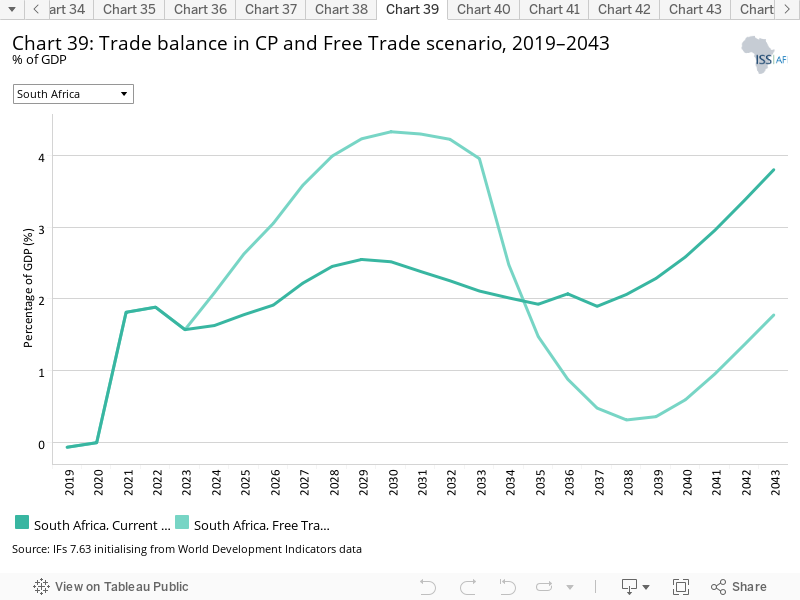
- Imports and exports grow more rapidly in the Free Trade scenario than in the Current Path forecast. In the Free Trade scenario, South Africa’s trade balance improves to peak at 2.8% of GDP in 2034 before declining to -0.02% of GDP in 2038. Jump to Free Trade scenario
- In the Financial Flows scenario, FDI inflows increase to 2.5% of GDP in 2043 compared to 1.9% in the Current Path forecast. The impact will increase South Africa’s stock of FDI in 2043 by 28% to US$271.2 billion. Jump to Financial Flows scenario
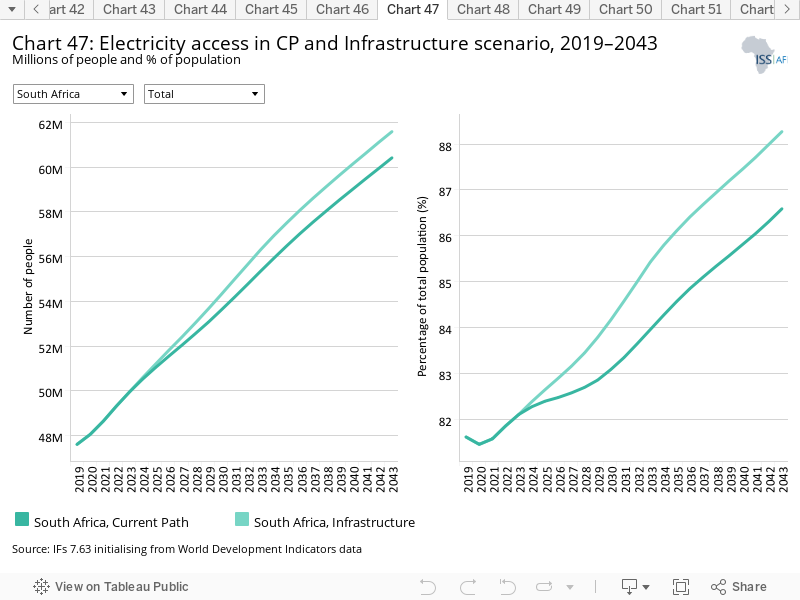
- South Africa has high levels of electricity access compared to most other African countries. In the Current Path forecast, access rates improve to 86.6% and to 88.3% in the Infrastructure scenario. Jump to Infrastructure scenario
- Because South Africa already scores high on various measures of governance, the Governance scenario has limited impact on government effectiveness. Jump to Governance scenario
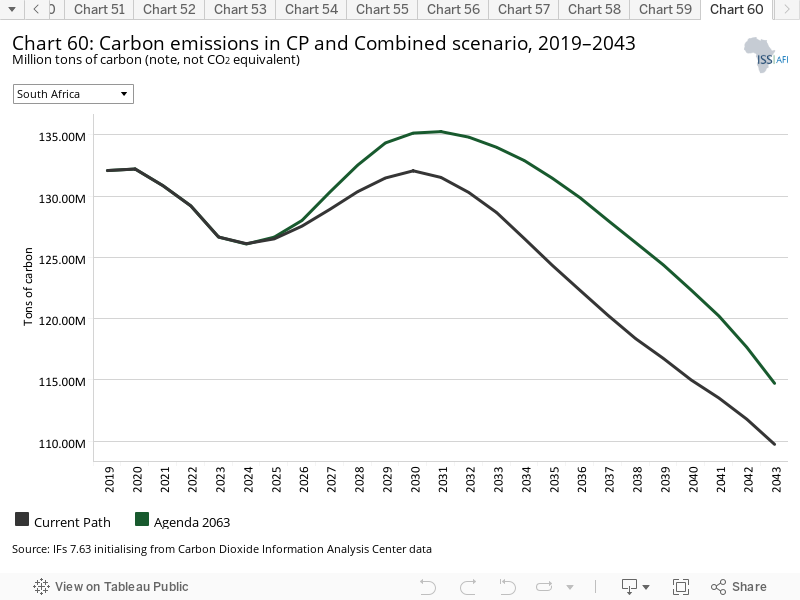
- South Africa’s carbon emissions are set to decline as the country transitions away from its high reliance on coal for electricity generation. On the Current Path, annual emissions will be 17% below the 2019 amount in 2043 and in the Combined Agenda 2063 scenario emissions will be 13% lower. Jump to Impact of scenarios on carbon emissions
- Combined Agenda 2063 scenario Jump to Combined Agenda 2063 scenario
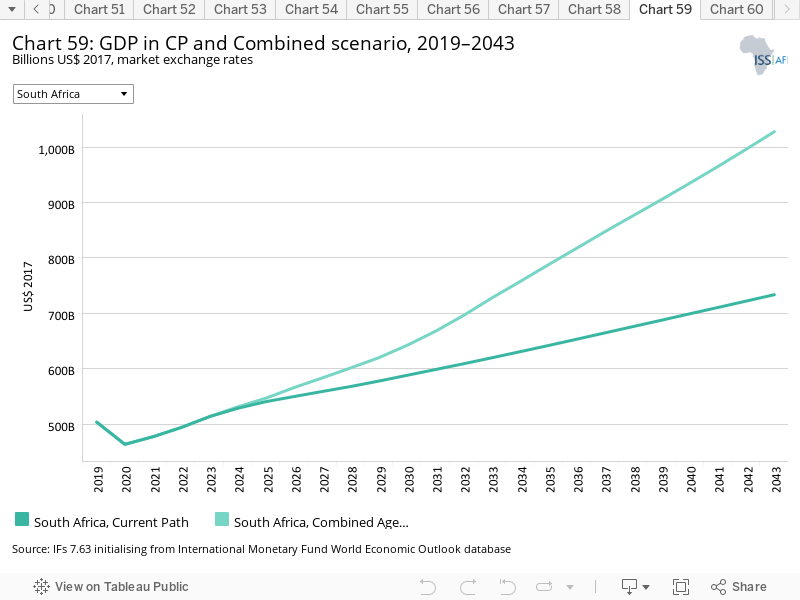
- In the Combined Agenda 2063 scenario, the South African economy will be US$294.5 billion (or 40%) larger in 2043 and the GDP per capita will improve by 22% above the Current Path forecast, but carbon emissions will only have increased by 4.5% as the country reduces its reliance on coal-fired electricity generation.
All charts for South Africa
- Chart 1: Political map of South Africa
- Chart 2: Population structure in CP, 1990–2043
- Chart 3: Urban and rural population in CP, 1990–2043
- Chart 4: Population density map for 2019
- Chart 5: GDP in CP, 1990–2043
- Chart 6: GDP per capita in CP, 1990–2043
- Chart 7: Informal sector value in CP, 2015–2043
- Chart 8: Value added by sector in CP, 2015–2043
- Chart 9: Agriculture production/demand in CP, 1990–2043
- Chart 10: Poverty in CP, 2015–2043
- Chart 11: Energy production by type in CP, 1990–2043
- Chart 12: Carbon emissions in CP, 1990–2043
- Chart 13: Governance security in CP and Stability scenario, 2019–2043
- Chart 14: GDP per capita in CP and Stability scenario, 2019–2043
- Chart 15: Poverty in CP and Stability scenario, 2019–2043
- Chart 16: Demographic dividend in CP and Demog scenario, 2019–2043
- Chart 17: Infant mortality in CP and Demog scenario, 2019–2043
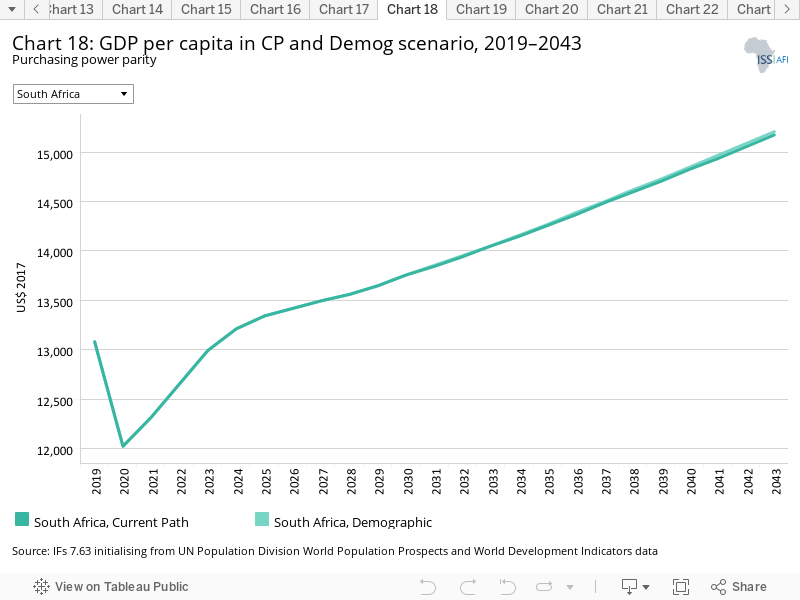
- Chart 18: GDP per capita in CP and Demog scenario, 2019–2043
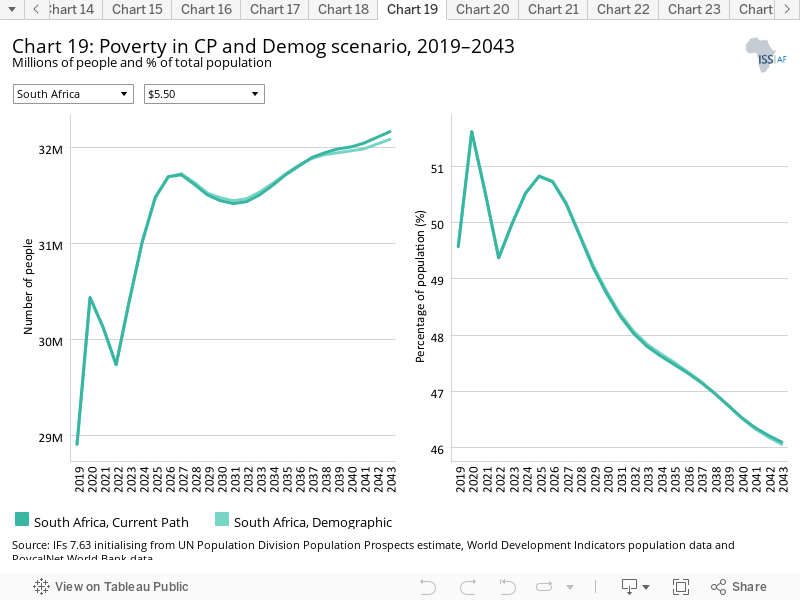
- Chart 19: Poverty in CP and Demog scenario, 2019–2043
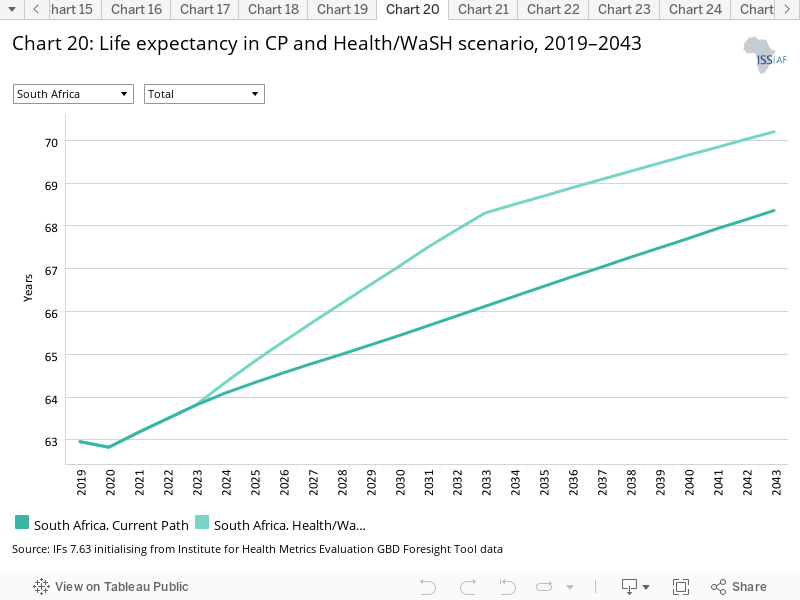
- Chart 20: Life expectancy in CP and Health/WaSH scenario, 2019–2043
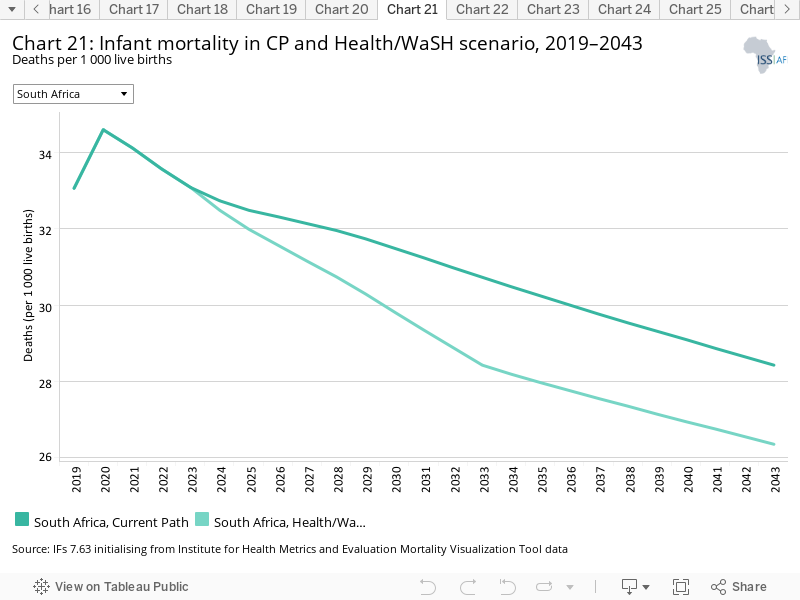
- Chart 21: Infant mortality in CP and Health/WaSH scenario, 2019–2043
- Chart 22: Yield/hectare in CP and Agric scenario, 2019–2043
- Chart 23: Agriculture imports in CP and Agric scenario, 2019–2043
- Chart 24: GDP per capita in the CP and Agric scenario, 2019–2043
- Chart 25: Poverty in CP and Agric scenario, 2019–2043
- Chart 26: Mean years of education in CP and Educ scenario, 2019–2043
- Chart 27: Education quality in CP and Educ scenario, 2019–2043
- Chart 28: GDP per capita in CP and Educ scenario, 2019–2043
- Chart 29: Poverty in CP and Educ scenario, 2019–2043
- Chart 30: Value added by sector in CP and Manufac/Transfers scenario, 2019–2043
- Chart 31: Gov welfare transfers in CP and Manufac/Transfers scenario, 2019–2043
- Chart 32: GDP per capita in CP and Manufac/Transfers scenario, 2019–2043
- Chart 33: Poverty in CP and Manufac/Transfers scenario, 2019–2043
- Chart 34: Fixed broadband access in CP and Leapfrogging scenario, 2019–2043
- Chart 35: Mobile broadband access in CP and Leapfrogging scenario, 2019–2043
- Chart 36: Electricity access in CP and Leapfrogging scenario, 2019–2043
- Chart 37: GDP per capita in CP and Leapfrogging scenario, 2019–2043
- Chart 38: Poverty in CP and Leapfrogging scenario, 2019–2043
- Chart 39: Trade balance in CP and Free Trade scenario, 2019–2043
- Chart 40: GDP per capita in CP and Free Trade scenario, 2019–2043
- Chart 41: Poverty in CP and Free Trade scenario, 2019–2043
- Chart 42: Foreign aid in CP and Financial Flows scenario, 2019–2043
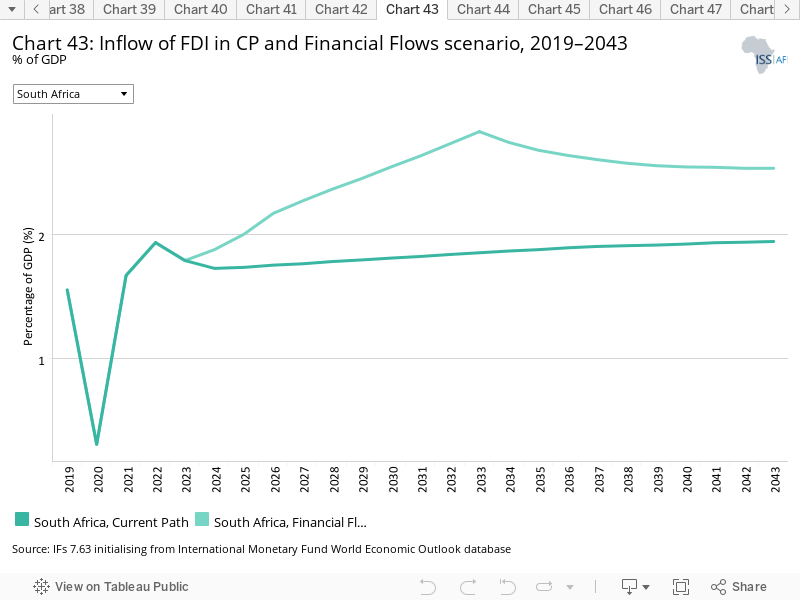
- Chart 43: Inflow of FDI in CP and Financial Flows scenario, 2019–2043
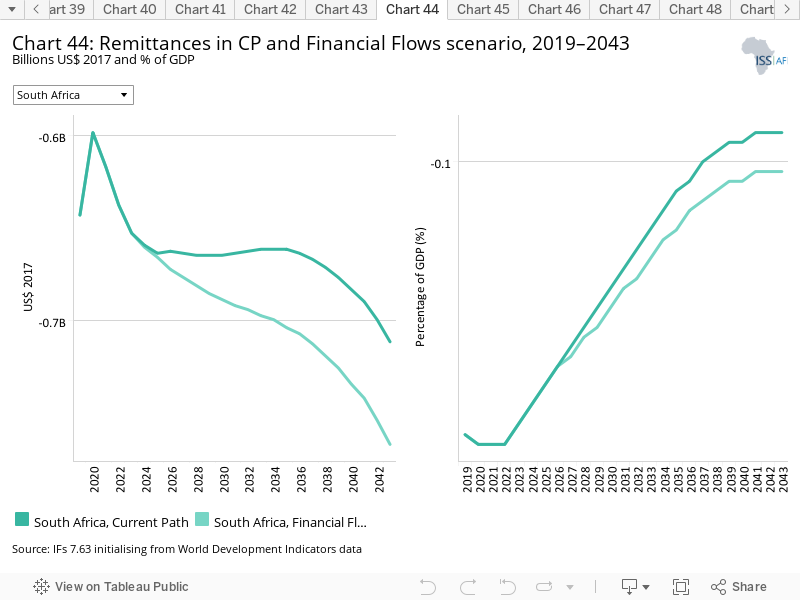
- Chart 44: Remittances in CP and Financial Flows scenario, 2019–2043
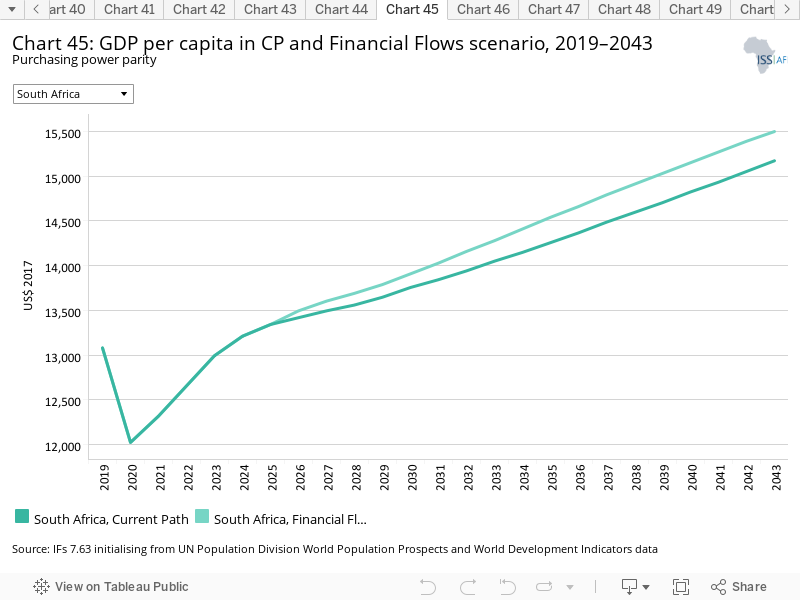
- Chart 45: GDP per capita in CP and Financial Flows scenario, 2019–2043
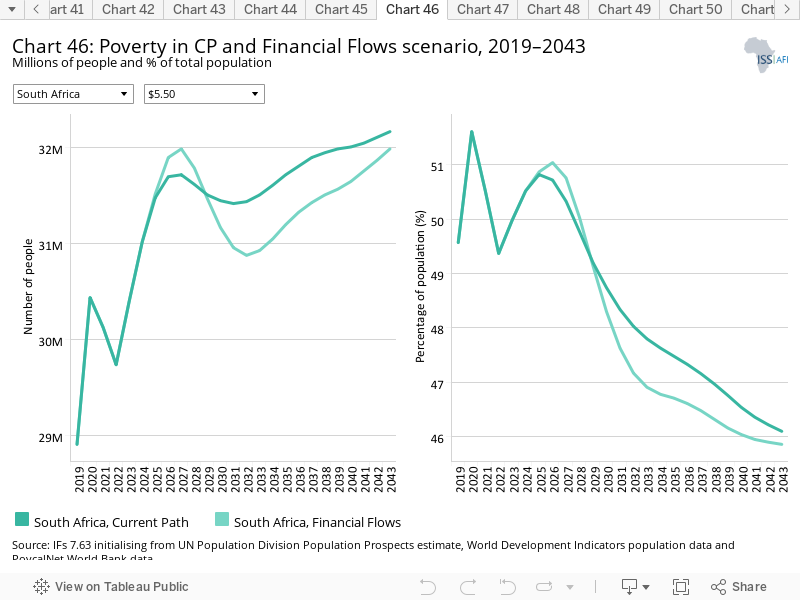
- Chart 46: Poverty in CP and Financial Flows scenario, 2019–2043
- Chart 47: Electricity access in CP and Infrastructure scenario, 2019–2043
- Chart 48: Rural road access in CP and Infrastructure scenario, 2019–2043
- Chart 49: GDP per capita in CP and Infrastructure scenario, 2019–2043
- Chart 50: Poverty in CP and Infrastructure scenario, 2019–2043
- Chart 51: Gov effectiveness in CP and Governance scenario, 2019–2043
- Chart 52: GDP per capita in CP and Governance scenario, 2019–2043
- Chart 53: Poverty in CP and Governance scenario, 2019–2043
- Chart 54: Carbon emissions in CP and scenarios, 2019–2043
- Chart 55: GDP per capita in CP and scenarios, 2019–2043
- Chart 56: GDP per capita in CP and Combined scenario, 2019–2043
- Chart 57: Poverty in CP and Combined scenario, 2019–2043
- Chart 58: Value added by sector in CP and Combined scenario, 2019–2043
- Chart 59: GDP in CP and Combined scenario, 2019–2043
- Chart 60: Carbon emissions in CP and Combined scenario, 2019–2043


This page provides an overview of the key characteristics of South Africa along its likely (or Current Path) development trajectory. The Current Path forecast from the International Futures forecasting (IFs) platform is a dynamic scenario that imitates the continuation of current policies and environmental conditions. The Current Path is therefore in congruence with historical patterns and produces a series of dynamic forecasts endogenised in relationships across crucial global systems. We use 2019 as a standard reference year and the forecasts generally extend to 2043 to coincide with the end of the third ten-year implementation plan of the African Union’s Agenda 2063 long-term development vision.
Located at the southernmost tip of Africa, the Republic of South Africa is one of seven upper middle-income countries in Africa. It is a member of the South African Customs Union (SACU) and the Southern African Development Community (SADC). South Africa is situated in the subtropical zone of the southern hemisphere. Its vast coastline stretches from the tropical border of Mozambique in the warm Indian Ocean, around Africa’s most southern tip and all the way to the border of Namibia’s cold Atlantic Ocean. The country’s geographical location and complex topography means that South Africa is subject to a range of climatological conditions. Annual rainfall is highly variable following a declining pattern from the wet and humid eastern coast to the arid western coast. South Africa shares borders with Namibia (that it previously administered), Botswana and Zimbabwe to the north, Mozambique and Eswatini to the east and completely surrounds the independent Kingdom of Lesotho.
South Africa has nine provinces. The economic heartland, the province of Gauteng, includes the commercial hub Johannesburg, as well as the administrative capital Tshwane (Pretoria). The legislature, consisting of a National Assembly and National Council of Provinces, is located in Cape Town in the Western Cape province. Although the smallest province geographically, Gauteng has the largest population at more than 15 million people, followed by KwaZulu-Natal on the east coast. The Western Cape and Eastern Cape have similar population sizes at between 6 and 7 million people each. The Free State and Northern Cape provinces have the smallest populations.
Formerly the Union of South Africa, the country became an independent republic in 1961 and was, from 1948 to 1990, ruled by the whites-only National Party. Internal revolt against the racial system of apartheid saw successive waves of unrest that, together with global pressure, led to the unbanning of a number of political parties, including the African National Congress (ANC), and the release of Nelson Mandela from prison in 1990. These events followed the collapse of the Soviet Union and several years of armed conflict with its neighbours during which apartheid South Africa was increasingly isolated from the international community and under various types of sporting, arms and financial sanctions.
The subsequent constitutional negotiations resulted in a liberal constitution with a clear separation of powers and an entrenched bill of rights. South Africa has a three-tier system of government and an independent judiciary. The three spheres of government (at national, provincial and local levels) all have legislative and executive authority and function as distinctive, interdependent and interrelated authorities. The ANC has won every election since the country’s first democratic elections in 1994 and governs in all provinces except the Western Cape which has been governed by the official opposition, the Democratic Alliance, since 2009.
South Africa has the second largest economy in Africa, after Nigeria, and relatively high average income per capita compared to most other countries in the region, although lower than Seychelles, Mauritius and neighbouring Botswana. Colonialism, apartheid and recently poor governance have resulted in extreme levels of inequality, with high rates of poverty, unemployment, crime and violence.
Unlike many other countries with similar challenges, South Africa has a relatively small informal economy and an increased portion of its population survives on social grants from the government. It has a thriving tourist industry that suffered significant losses due to travel restrictions imposed by the COVID-19 pandemic.
South Africa suffers from low levels of investor confidence and government inefficiencies have increased that have seen declining levels of average income for several years, in part due to more than a decade of crippling electricity shortages when the government did not respond to repeated warnings of imminent shortages. A similar situation is now emerging related to water in spite of several years of repeat warnings of an impending crisis due to ageing and failing infrastructure, electricity loadshedding, rapid urbanisation and significant volumes of nonrevenue water.
The election of Cyril Ramaphosa to lead the ANC in December 2017 and assume the presidency of the country shortly thereafter has seen regular announcement of programmes to turn South Africa’s developmental fortunes around, end corruption and improve development outcomes. The COVID-19 pandemic, poor decision-making and a lack of decisive action regularly stimies progress in spite of South Africa's sophisticated private sector, highly developed financial markets and substantial natural assets.
During its three decades of democracy, South Africa's economy grew by 2.4% a year from 1994 to 2023.
Population dynamics play an important role in economic development, and South Africa has clear potential given the relative size of its working-age population to dependants (also see Chart 16).
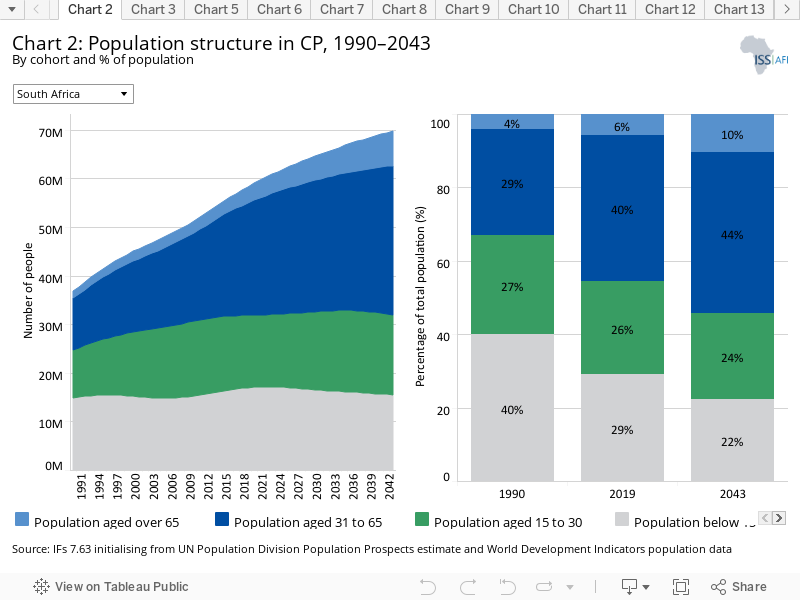
The country’s population amounted to around 58 million people in 2019 and is expected to grow to approximately 65 million by 2030 and 70 million by 2043. Its average total fertility rate fell from 4.4 births per woman in 1990 to around 2.4 in 2019. It will get to replacement level of 2.1 by 2034. Large inward migration flows from the region have, however, introduced uncertainty in the forecasts with unsettling social consequences together with a steady loss of skills through outward migration.
In addition, the population is ageing. Whereas nearly 6% of South Africans were 65 and older in 2019, by 2043 that portion will have increased to 10% while the median age increases from 27 in 2019 to 33 years in 2043. At the same time, the child population age cohort is expected to shrink from 29% in 2019 to 22% in 2043.
The country’s low savings rate contributes to sustained levels of poverty and demands for state benefits for the foreseeable future. [1South Africa also has a very low savings rate: on average, South Africans can only expect to earn 16% of their working salaries in retirement, compared to 69.5% in Brazil and 87.4% in India. See: Organisation for Economic Co-operation and Development (OECD), Pensions at a glance 2017] At the same time, a smaller child population could provide a much-needed opportunity for quality improvements in services such as education.
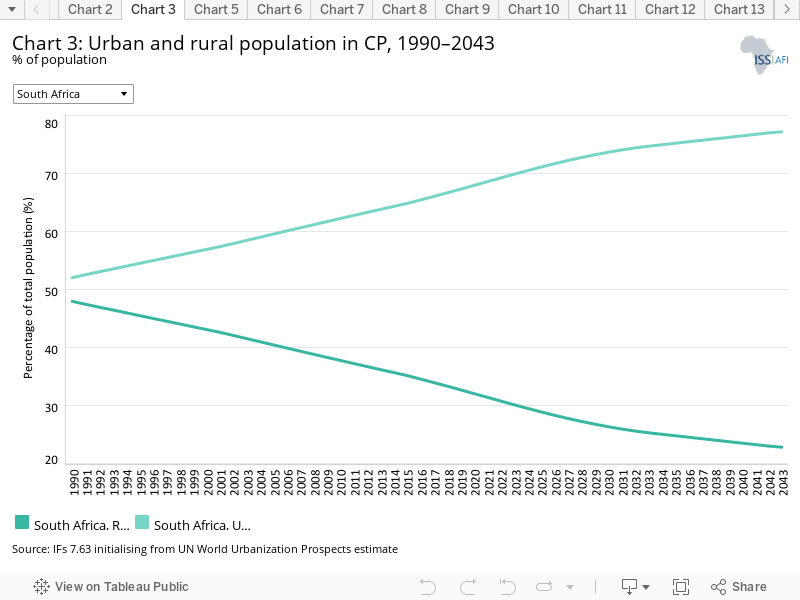
South Africa’s 1 200 towns and cities host nearly 70% of the country’s population while generating 86% of all formal economic activity. [2A le Roux et al. Profiling the vulnerabilities and risks of South African settlements. Understanding the social and environmental implications of global change. 2017, 26–35] In 2019, 67.3% (around 39 million) of South Africa’s population lived in urban areas, forecast to increase to 77.2% (54 million) in 2043. Internal migration, especially from traditional authority areas to service towns and inter-provincial travel, e.g. Eastern Cape to Western Cape migration, plays a major role in urbanisation. Much of the anticipated growth in the next two decades will take place in Gauteng, KwaZulu-Natal and the Western Cape with 97% of all growth expected to happen in South Africa’s network of cities and towns. [3A Le Roux, K Arnold, S Makhanya and G Mans, Green Book. South Africa’s urban future: Growth projections for 2050. Pretoria: CSIR, 2019] This will undoubtedly place enormous pressure on the delivery of housing and basic services.
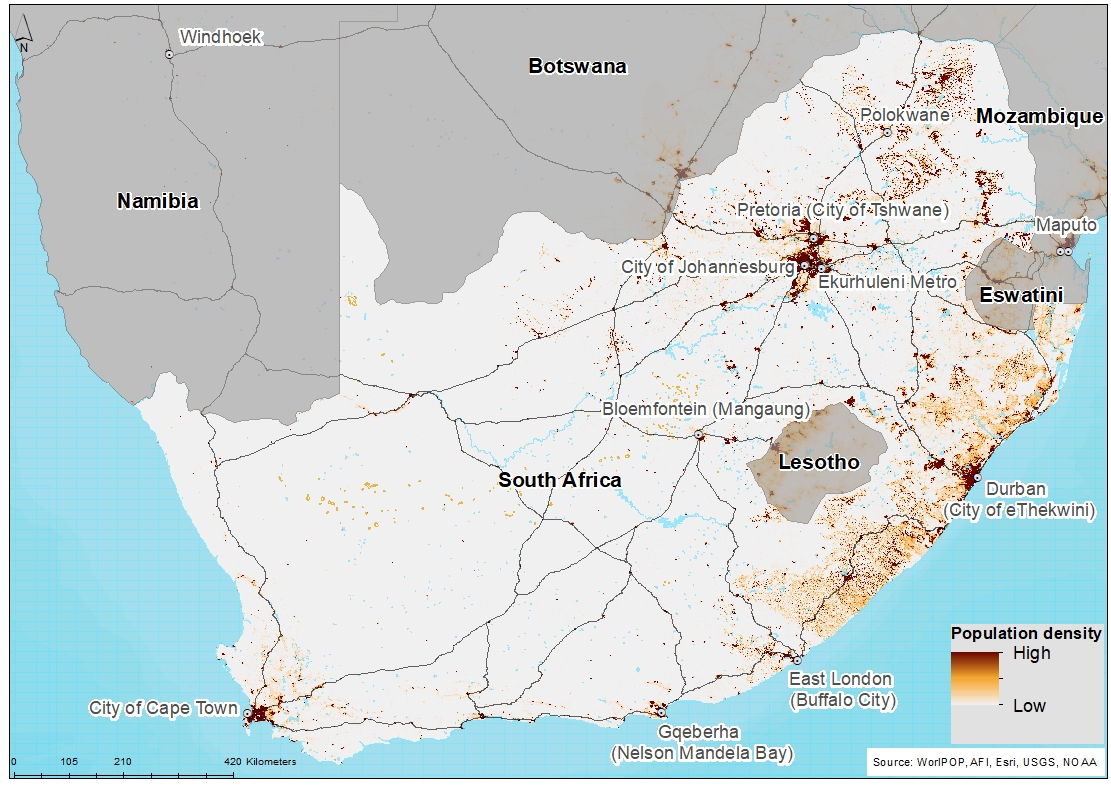
South Africa has an average population density of 49 persons per square kilometre, roughly equivalent to the average population density for Africa. The density however ranges from dense metropolitan areas such as Johannesburg to the sparsely populated plains of the Karoo in the Northern Cape.
Chart 4 indicates the spatial distribution of South Africa’s population, indicating how the landscape is dominated by the metropolitan population clusters of Johannesburg, Tshwane, Ekurhuleni, Cape Town, eThekwini and Nelson Mandela Bay as well as the densely populated rural areas of Limpopo, the Eastern Cape and KwaZulu-Natal provinces. Gauteng, the smallest province, is the most densely populated while the Northern Cape province, geographically the largest, has the lowest population density. More than 40% of South Africans live in one of eight metropolitan municipalities of which three are in Gauteng (Ekurhuleni, Johannesburg and Tshwane), two in the Eastern Cape (Buffalo City and Nelson Mandela Bay), one in the Western Cape (Cape Town), one in the Free State (Mangaung), and one in KwaZulu-Natal (eThekwini).
South Africa is caught in a classic middle-income growth trap, growing more slowly than the average growth rate of upper middle-income countries globally.
The trap is the result of the skewed, two-legged structure of its economy, which has a small but skilled and highly productive (private) sector, a relatively small informal sector, and a large, poorly skilled and unproductive, economically inactive sector, with a substantive public sector somewhere in between these extremes. South Africa’s challenges are rooted in apartheid but have been worsened by the global financial crisis of 2007/08, the impact of poor (and bad) governance, state capture, lack of electricity availability and recently, the impacts of the COVID-19 pandemic. The pandemic was followed by two years of higher growth, but lagged thereafter. Addressing the nation on 21 April 2020, President Cyril Ramaphosa sought to turn the COVID-19 crisis into an opportunity, promising ‘not merely to return our economy to where it was before the coronavirus, but to forge a new economy in a new global reality.’ [4President Cyril Ramaphosa: Additional Coronavirus COVID-19 economic and social relief measures, 21 April 2020] That, he argued, required a new social compact to accelerate the structural reforms needed to reduce the cost of doing business, promote localisation and industrialisation, overhaul state-owned enterprises and strengthen the informal sector. Little has come of these promises, however and the modest post-COVID recovery did not extend fully to the job market. The official unemployment rate remains extremely high. Since its first democratic elections in 1994 economic growth has consistently been too low to create jobs for the flood of annual new entrants to the labou market and those previously unemployed. Thus poverty in South Africa is widespread and inequality amongst the highest in the world. According to the 2022 World Inequality Report, the top 10% of earners held between 50% and 65% of the country's welath whereas the bottom 50% of the population has never captured more than 5% to 10% of South Africa's national income.
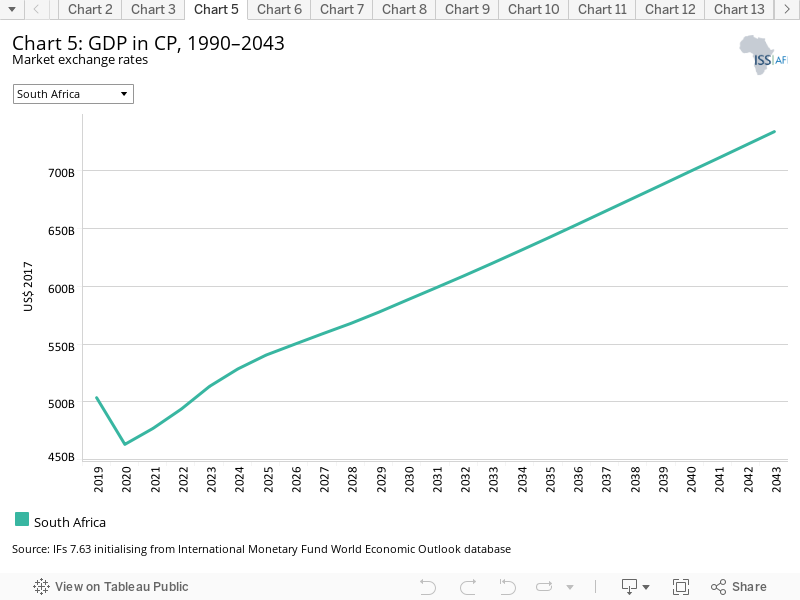
In the Current Path forecast, the growth rates are expected to linger below 2% throughout the forecast horizon, with GDP forecast to grow to US$733.7 billion by 2043.
Although many of the charts in the sectoral scenarios also include GDP per capita, this overview is an essential point of departure for interpreting the general economic outlook of South Africa.
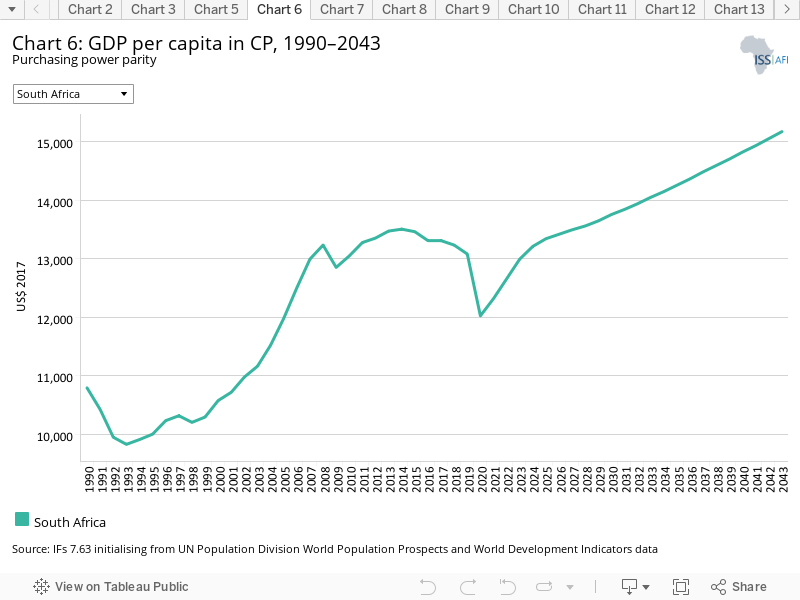
South Africa’s GDP per capita peaked in 1981 and declined thereafter as apartheid and global isolation took their toll. The economy started to recover after the historic political transition in 1994 and, from 1999 to 2008, the GDP per capita grew rapidly. Growth slowed down after the 2007/08 global financial crisis that hit South Africa slightly later from 2010 to 2013. In 1990, with the end of apartheid, South Africa’s GDP per capita was 167% that of the average for upper middle-income countries globally. By 2019, it had declined to 71% and in the Current Path forecast it is expected to drop to around 53% in 2043. In 2023, South Africa's GDP per capita was lower than it was in 2007.
This is in stark contrast to countries like South Korea and Taiwan that historically had lower GDP per capita figures than South Africa but have since surpassed the country’s per capita income.
Years of steady deindustrialisation, weak investment, a growing social-grant-dependent population and bad policy in areas such as education have undermined South Africa’s growth, particularly during the ruinous administration of former president Jacob Zuma from 2009 to 2017.
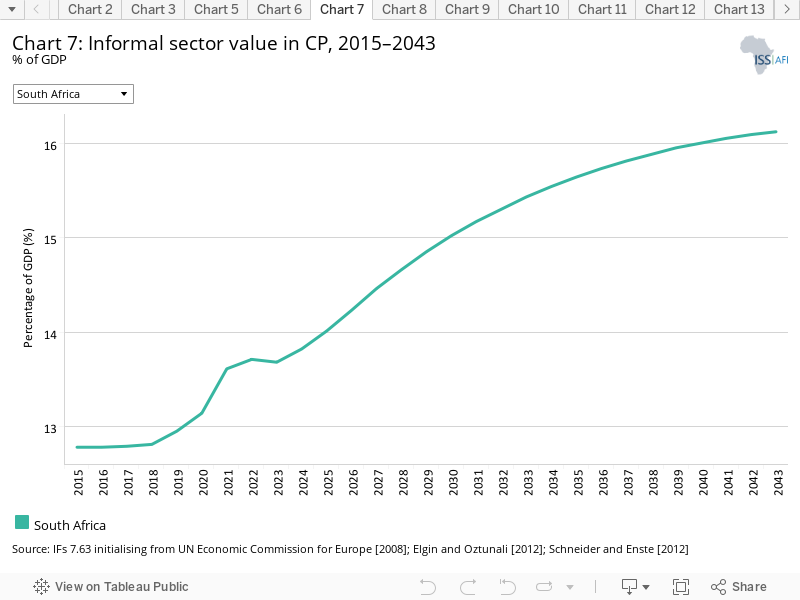
South Africa has a small informal sector relative to its formal sector when compared to other developing countries and given its extraordinarily high levels of unemployment and inequality. Only around 19% of the labour force is employed in the informal sector, and this is forecast to increase to 39% in 2043. In IFs, as a portion of GDP, the size of South Africa’s informal sector is forecast to increase from 13% of GDP in 2019 (US$65.2 billion) to just over 16% (US$118.2 billion) in 2043. The IFs forecast for a large increase in size of the informal sector as well as of informal labour is largely due to slow economic growth and the ongoing growth in the size of South Africa’s labour force. The small size of its informal economy and the limited number of informal workers contribute to inequality, extreme poverty and high levels of unemployment. Rates of entrepreneurship and self-employment in South Africa are also low and, as a result, a large portion of South Africa’s working-age population is not economically active. [5H Bhorat and B Stanwix, Policy Choices for the Labour Market, in G Mills, M Jonas, H Bhorat and R Hartley, Better Choices: Ensuring South Africa’s Future, Picador Africa, Pan Macmillan, 2022, 80–82.]
Instead of unlocking economic opportunities such as reforms of the country’s rigid labour market and programmes that provide low-skilled entrepreneurs with business skills in addition to loan programmes, the response by the government has been to roll out a massive social grants programme and constrain skilled inward migration. [6H Bhorat and B Stanwix, Policy Choices for the Labour Market, in G Mills, M Jonas, H Bhorat and R Hartley, Better Choices: Ensuring South Africa’s Future, Picador Africa, Pan Macmillan, 2022, 80–82.]
The forecast for robust growth in the size of the informal sector and the portion of the labour force active in the informal sector reflect limited opportunities for formal sector growth, reflecting slow economic growth.
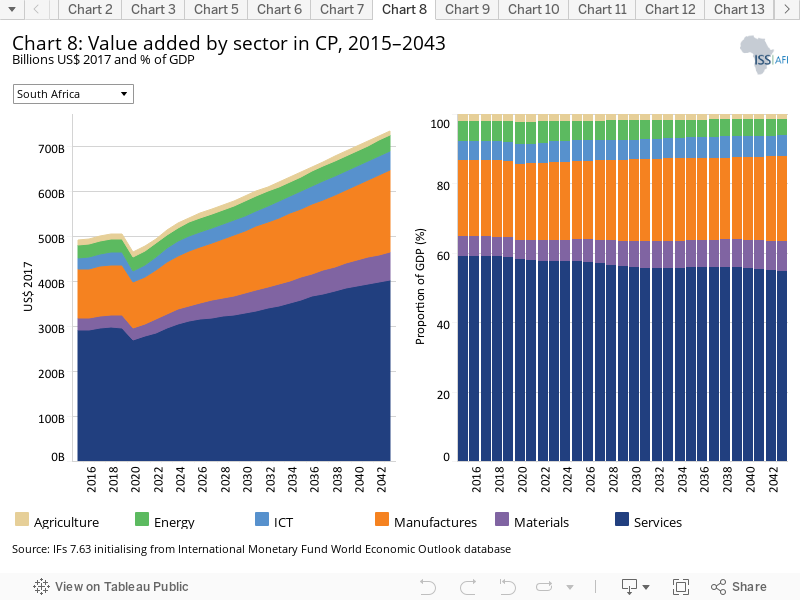
The IFs platform uses data from the Global Trade and Analysis Project (GTAP) to classify economic activity into six sectors: agriculture, energy, materials (including mining), manufactures, services and information and communications technology (ICT). Most other sources use a threefold distinction between only agriculture, industry and services with the result that data may differ.
In 2019, agriculture contributed 2.1% to the GDP, energy 5.9%, materials 5.6% manufacturing 22.1%, services 58.8% and ICT 5.5%. In the Current Path forecast, these values remain relatively constant to 2043 with a modest increase in the contribution from manufacturing, materials and ICT, while the agriculture and energy sectors decline in percentage contribution to the GDP. For example, by 2043 the value of the agriculture sector would be similar in value to 2019, at US$10.4 billion, having declined from 2.1% of GDP in 2019 to 1.4% in 2043.
The contribution to the GDP from ICT is forecast to modestly increase from 5.6% in 2019 to 5.9% of the GDP by 2043, increasing from US$27.9 billion in 2019 to US$43.5 billion in 2043. The contribution is far below that of a country such as South Korea (10%) and below the average for Africa’s seven upper middle-income countries. Yet, in 2019, South Africa’s ICT sector was the largest in Africa. By 2043, it could be overtaken in absolute size by the ICT sector in Nigeria, Egypt and Ethiopia.
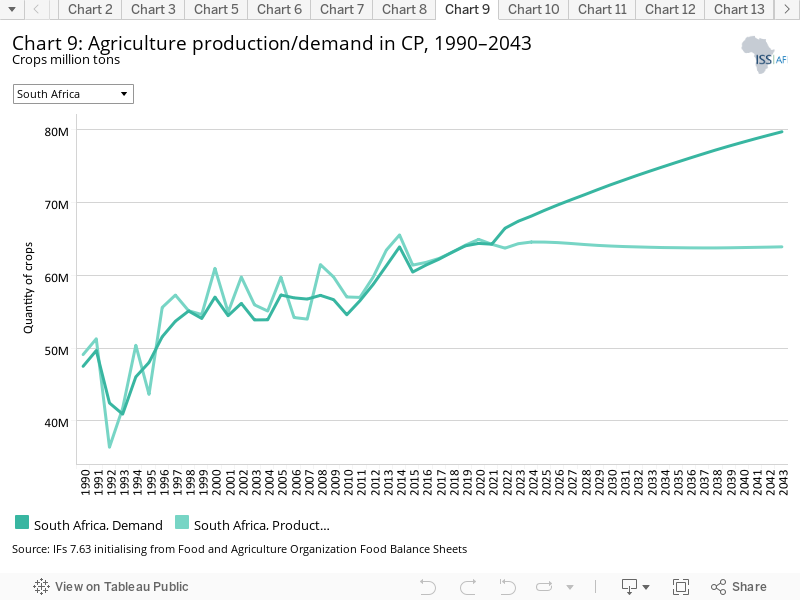
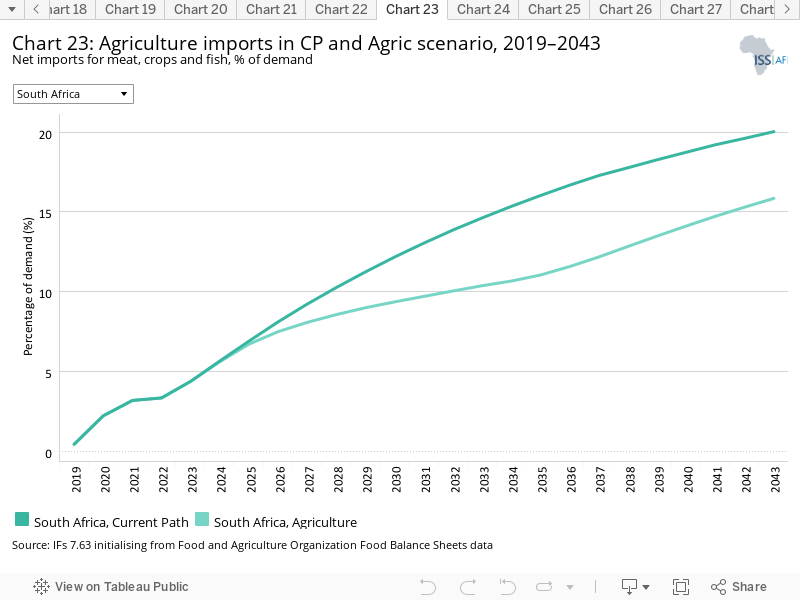
The data on agricultural production and demand in the IFs forecasting platform initialises from data provided on food balances by the Food and Agriculture Organization (FAO). IFs contains data on numerous types of agriculture but aggregates its forecast into crops, meat and fish, presented in million metric tons. Chart 9 shows agricultural production and demand as a total of all three categories.
South Africa is one of a handful of African countries that is largely food secure at the national level and is a net exporter of agricultural and processed food products. It does that on the back of a small but highly productive agricultural sector (also see Chart 8). However, the Current Path forecast is for a steady deterioration of its food security situation and South Africa is forecast to become a net agriculture importer, which will expose its food supply to greater vulnerability due to supply and price shocks. The IFs Current Path forecast is that demand will start to outstrip supply beyond 2021 to the extent that the country will be dependent on imports for 20% of its agricultural requirements by 2043, equivalent to US$20.3 billion. By 2043, agricultural production is forecast to be 63.9 million metric tons and demand would exceed 79 million metric tons, translating to a 15.8 million metric ton shortfall.
South Africa's history and racialised politics mean that land ownership and policy is heavily politicised. In an effort to address the historical inequity in ownership, the government has, since 1994, embarked upon a land redistribution program but implementation has been slow and successive targets have been missed. The latest target is for a target of redistributing 30% of the 1994 white farmer land (77 580 hectares) by 2030. Already most commercial farm enterprises are black owned while white farmers now own 61 million ha of freehold farmland, representing 78% of freehold farmland and covering about 50% of the total surface area of South Africa. Progress with land reform and redistribution was at around 24% by 2022 with the 2030 target now in reach but most large commercial farms, estimated at around 2 600, are still most white-owned. These are responsible for 67% of all farm income and employ more than half the agricultural labour force.[7J Kirsten and W Sihlobo, Land reform in South Africa: 5 myths about farming debunked, The Conversation, 26 November 2022]
Only about one fifth of the available farmland is suitable for field crop, irrigation and horticultural production and more that half only suitable for extensive grazing, meaning that the potential for farm land to create full-time sustainable livelihoods is limited. A major constraint on land reform and is the communal land useage patterns in former so-called homelands.[8J Kirsten and W Sihlobo, Land reform in South Africa: 5 myths about farming debunked, The Conversation, 26 November 2022.]
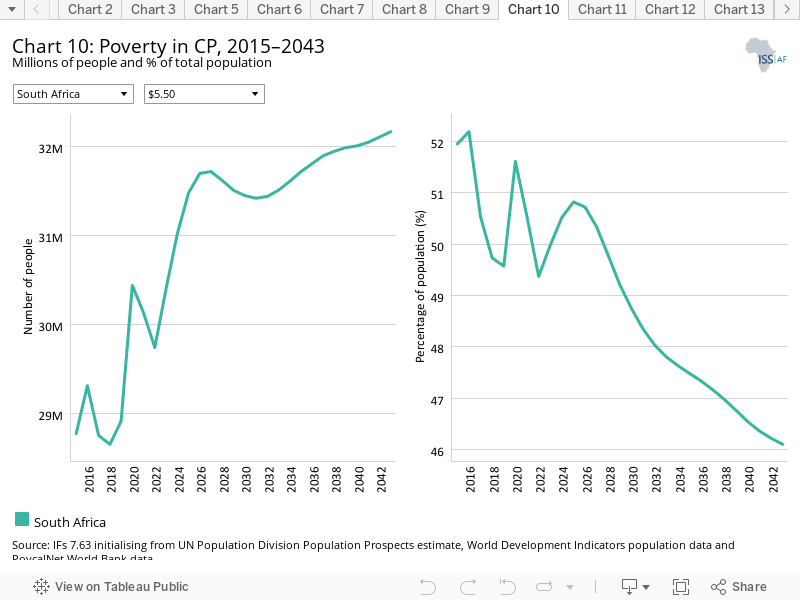
There are numerous methodologies and approaches to defining poverty. We measure income poverty and use GDP per capita as a proxy. In 2015, the World Bank adopted the measure of US$1.90 per person per day (in 2011 international prices), also used to measure progress towards the achievement of Sustainable Development Goal 1 of eradicating extreme poverty. To account for extreme poverty in richer countries occurring at slightly higher levels of income than in poor countries, the World Bank introduced three additional poverty lines in 2017:
- US$3.20 for lower middle-income countries
- US$5.50 for upper middle-income countries
- US$22.70 for high-income countries.
Using the extreme poverty line of US$1.90 per day, South Africa had 10 million people (17% of its population) in extreme poverty in 2019, forecast to reach 10.8 million in 2030 (16.8%) and 10.5 million by 2043 (15%). At the US$5.50 income level, the portion of people living in poverty in South Africa stood at 28.9 million (50%) in 2019, forecast to increase to 32 million (46%) by 2043. These numbers are more than double the average for upper middle-income countries globally.
Among the seven upper middle-income countries in Africa, only Namibia has higher rates of extreme poverty and globally only China, Brazil and Mexico have larger numbers of people living below the US$5.50 poverty line.
Because of its extraordinarily high levels of inequality and unemployment, its relatively modest economic growth forecasts and relatively small informal sector, South Africa is expected to see a far smaller drop in extreme poverty than most of its peers
Social grants from the government already support around a third (20 million) of South Africans and play an important role in constraining further increases in poverty and have helped to reduce inequality but is pushing the limits of fiscal prudence.
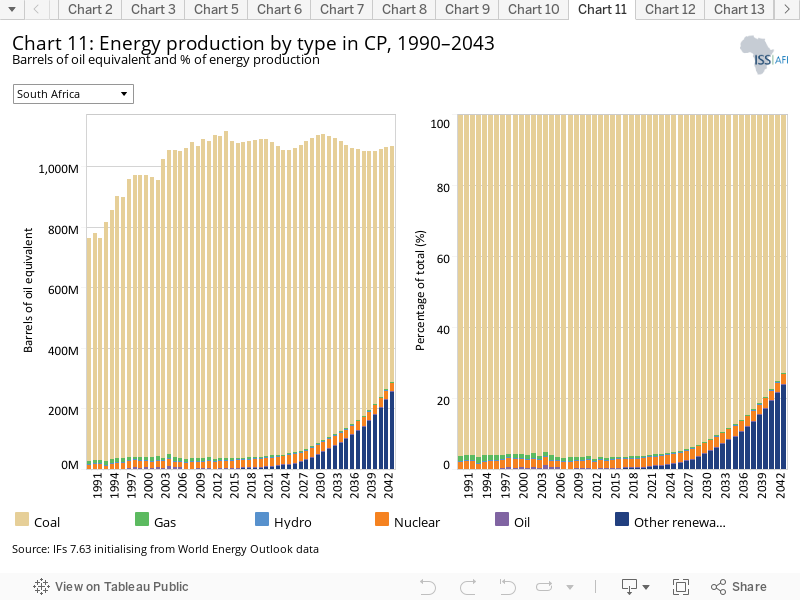
The IFs platform forecasts six types of energy, namely oil, gas, coal, hydro, nuclear and other renewables. To allow comparisons between different types of energy, the data is converted into billion barrels of oil equivalent (BBOE). The energy contained in a barrel of oil is approximately 5.8 million British thermal units (MBTUs) or 1 700 kilowatt-hours (kWh) of energy.
Poor planning has led to ongoing electricity shortages in South Africa that have lasted more than a decade and are expected to continue until at least to 2025/26.
The updated Integrated Resource Plan [9As published in Government Gazette, 42779:652, 18 October 2019] that was approved by the cabinet in October 2019 goes some way in acknowledging the potential for a renewable-based energy system and movement away from an economy that is essentially powered by coal. In 2019, coal contributed 1.046 BBOE (or 96%) of South Africa’s energy production, followed by 2.6% from nuclear. As a result, South Africa is the largest emitter of carbon in Africa and the 14th largest globally (see Chart 12). By 2043, 73% of South Africa’s energy production will come from coal and 24% from renewables. South Africa currently imports power from the region, including 1.150 GW from the Cahora Bassa hydropower dam in neighbouring Mozambique but the agreement is unlikely to be renewed when it lapses in 2030.
Because of a modest economic growth forecast and improvements in energy efficiency, South Africa’s total energy production remains relatively constant across the forecast horizon with a gradual uptake of renewables.
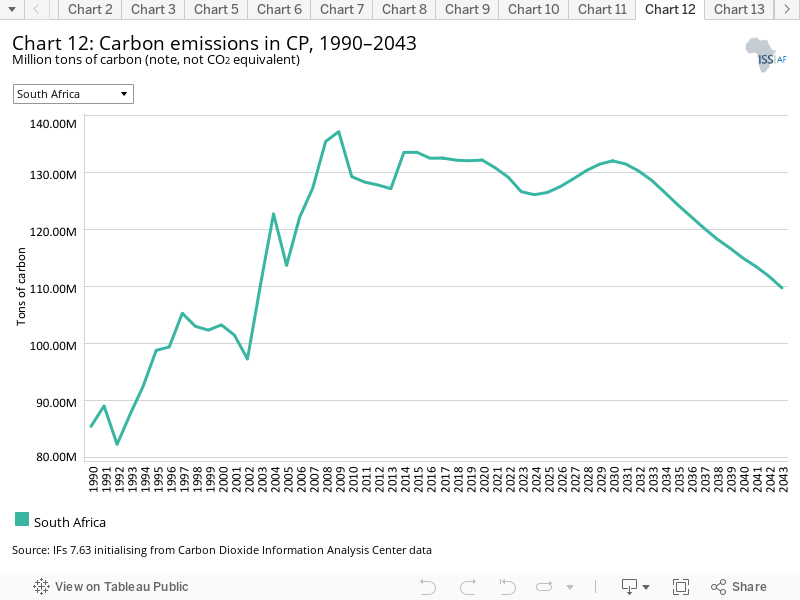
Carbon is released in many ways, but the three most important contributors to greenhouse gases are carbon dioxide (CO2), carbon monoxide (CO) and methane (CH4). Since each has a different molecular weight, IFs uses carbon. Many other sites and calculations use CO2 equivalent.
Because of its large reliance on coal for electricity production, South Africa is the largest emitter of carbon in Africa, releasing 132 million tons of carbon into the atmosphere in 2019. Coming from such high levels, carbon emissions are set to decline to 110 million tons in 2043, at which point South Africa’s emissions will be overtaken by Nigeria and Egypt in Africa, and the country will change from being the 14th to the 17th largest emitter of carbon globally.
Sectoral Scenarios for South Africa
Download to pdfThe Stability scenario represents reasonable but ambitious reductions in risk of regime instability and lower levels of internal conflict including crime. Stability and the rule of law are generally a prerequisite for other aspects of development and encourage inflows of foreign direct investment (FDI) and improve business confidence. Better governance through the accountability that follows substantive democracy is modelled separately.
The intervention is explained in detail on the Stability theme.
Homicides serve as a useful proxy for broader violence patterns in a society. According to data from the Global Burden of Disease Study 2017, [10Global Burden of Disease Collaborative Network, Global burden of disease study 2017 (GBD 2017): Burden by risk 1990–2017, Seattle: Institute for Health Metrics and Evaluation (IHME), 2018.] South Africa ranked sixth globally for homicide death rates among adult men and second globally for women, with most deaths occurring among those aged 15–64. The homicide death rate among children under 15 from violence, traffic accidents and communicable diseases (see Charts 20 on life expectancy) is also particularly high. A separate 2018 study found that the yearly cost of violence against children alone came to nearly 5% of the GDP. [11C Hsiao et al, Violence against children in South Africa: The cost of inaction to society and the economy, BJM Global Health, 3:e000573, 2017, 1–7.] The overall burden of violence in South Africa was estimated to cost the economy as much as 13% of the GDP in 2016.[12The cost of violence to South Africa’s economy was recently estimated at over US$97 billion. See: Institute for Economics & Peace (IEP), Global peace index 2019: Measuring peace in a complex world, 2019, 99] A 2023 report by the World Bank estimates that the impact of crime is 'at least 10 percent of GDP per year, comprising transfer, protection, and opportunity costs.'
Within IFs, high levels of crime from homicide rates impact social capital and translate into a drag on growth.
Because of its high levels of crime, including murder rates, the IFs governance security index ranks South Africa at 25th in Africa — although it is always important to recognise that South Africa is one of the few African countries that produces regular crime statistics. The result of its poor ranking on the index translates into lower than expected productivity when considering its levels of education and income.
The Stability scenario improves South Africa’s security index by 9.3% in 2043 compared to the Current Path forecast.
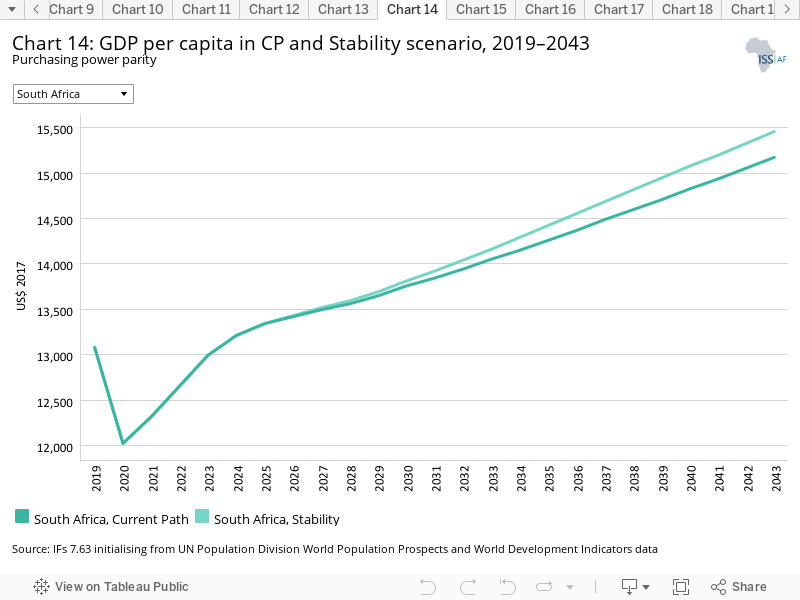
The GDP per capita in 2019 was US$13 080 and is forecasted to improve to US$15 173 in 2043 in the Current Path forecast. The Stability scenario improves the GDP per capita to US$15 456, a modest improvement of US$283 (2%).
According to the World Economic Forum, lack of security acts as a major deterrent to investment in South Africa (see Chart 42), as do issues relating to government adaptability, the lack of business dynamism because of its rigid labour market, and administrative burdens. [13K Schwab, Insight report: The global competitiveness report 2019, World Economic Forum, 2019, 19] These issues detract from the attraction of its developed financial services, legal system and the quality of its democracy. Improved security from this scenario, therefore, has important forward linkages to improved governance and growth that are reflected in the Combined Agenda 2063 scenario.
The Stability scenario reduces extreme poverty (using US$1.90 per day) by 210 000 people compared to the Current Path forecast in 2043 and by 380 000 people using US$5.50. Given the endemic nature of poverty in South Africa (standing at 49.6% in 2019), these are small reductions. Eventually, only rapid, inclusive economic growth will substantively alleviate extreme poverty in South Africa.
This section presents the impact of a Demographic scenario that aims to hasten and increase the demographic dividend through reasonable but ambitious reductions in the communicable-disease burden for children under five, the maternal mortality ratio and increased access to modern contraception.
The intervention is explained here in the thematic part of the website.
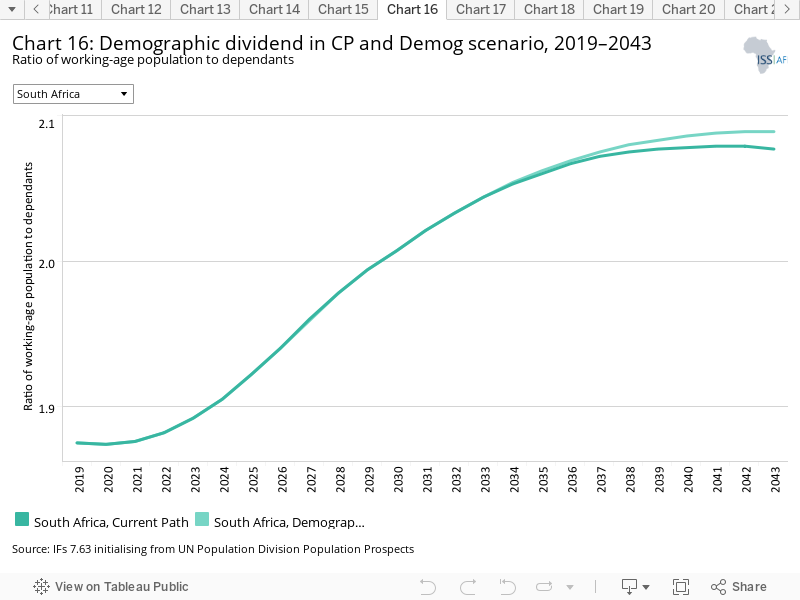
Demographers typically differentiate between a first, second and even a third demographic dividend. We focus here on the contribution of the size of the labour force (between 15 and 64 years of age) relative to dependants (children and the elderly) as part of the first dividend. A window of opportunity opens when the ratio of the working-age population to dependants is equal to or surpasses 1.7.
Key to South Africa’s growth potential is its position in a window of demographic opportunity with the ratio of its working-age persons to dependants in 2019 already at 1.9:1. Only seven other African countries are in this fortunate position. Apart from Mauritius and Seychelles, the others are all in North Africa. In the Current Path forecast, South Africa’s demographic dividend is still increasing and will peak at 2.1:1 in 2041 before starting to decline.
Outside Africa, most upper middle-income countries have passed their peak dividend and are already experiencing a decline in the ratio of working-age persons to dependants. South Africa’s working-age population is, however, set to increase from 65% of its total population in 2019 to 68% by 2043. The larger pool of workers could potentially accelerate rates of economic expansion
Given its existing positive location in the demographic transition, the Demographic scenario has limited impact on South Africa, slightly increasing the ratio of working-age persons to dependants by 2043.
The extent to which South Africa will be able to feed, educate and create employment opportunities for its large working-age population (as well as ensure that its workforce is healthy) is therefore very important.
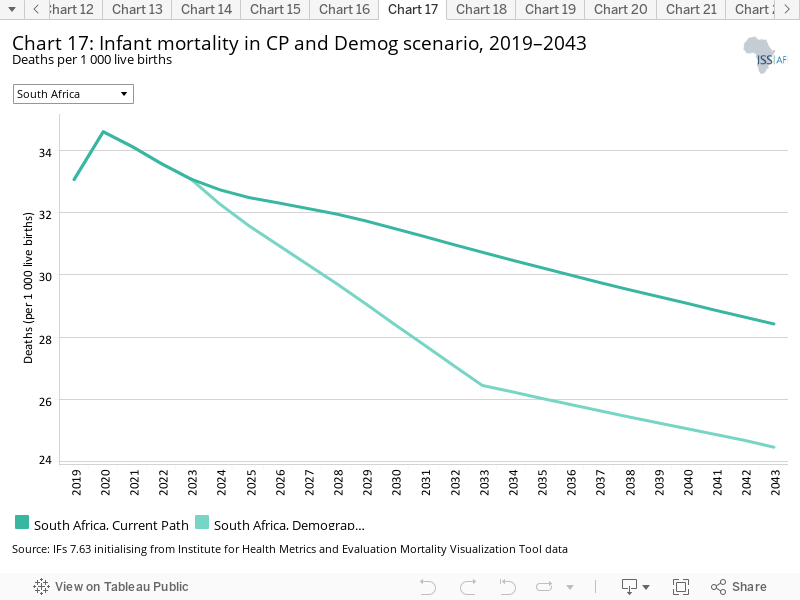
The infant mortality rate is the number of infant deaths per 1 000 live births and is an important marker of the overall quality of the health system in a country.
In 2019, infant deaths per 1 000 live births in South Africa were almost three times the average of upper middle-income countries globally (33.1 vs 12.2), mostly due to HIV infections. And, while the average for upper middle-income countries globally can expect a near halving of infant mortality rates by 2043 (to 7.5), the Current Path forecast for South Africa in 2043 is still an extraordinarily high 28.4 deaths per 1 000 live births. At that point, infant mortality rates in South Africa will even be above the rates for low and lower middle-income countries globally, largely due to the lingering impact of HIV/AIDS. In the Demographic scenario, South Africa’s rates decline to 24.5 in 2043, a reduction of 14% on the Current Path forecast.
Because South Africa is already experiencing a first demographic dividend, the impact of the Demographic scenario on the GDP per capita is negligible. The GDP per capita in South Africa increases from US$13 080 in 2019 to US$15 206 in 2043 in the Demographic scenario, US$33 above the Current Path forecast for the same year. The income gap between South Africa and the average for upper middle-income countries in Africa will continue to grow throughout the forecast horizon.
As South Africa is already experiencing a first demographic dividend, the impact of the Demographic scenario on rates of extreme poverty is modest, reducing extreme poverty by 30 000 persons in 2043 compared to the Current Path forecast using US$1.90 and 80 000 using US$5.50. Given the high rates of extreme poverty in South Africa, these are marginal reductions.
This section presents reasonable but ambitious improvements in the Health/WaSH scenario, which include reductions in the mortality rate associated with both communicable diseases (e.g. AIDS, diarrhoea, malaria and respiratory infections) and non-communicable diseases (NCDs) (e.g. diabetes), as well as improvements in access to safe water and better sanitation. The acronym WaSH stands for water, sanitation and hygiene.
The intervention is explained here in the thematic part of the website.
Life expectancy at birth is one of the best aggregate measures of health and well-being and a powerful tool in explaining the huge drag that poor human capital in South Africa has on economic growth.
At the height of the HIV/AIDS scourge in 2006, life expectancy in South Africa was a mere 51 years, compared to an average of 72 years for upper middle-income countries globally. South Africa’s life expectancy has subsequently recovered to its previous trajectory, but in 2019 it was still 13 years below that of upper middle-income countries globally (63 years vs 76 years) in large part due to an unusually high burden of communicable diseases, in particular HIV/AIDS and tuberculosis. In 2019, South Africa’s life expectancy was also lower than the average for upper middle-income countries in Africa by 1.7 years and lower than the average for Africa by 2.8 years. The Current Path forecast is that the gap between South Africa and the average for upper middle-income countries globally will remain relatively constant to 2043. In the Health/WaSH scenario, life expectancy in South Africa improves by 1.8 years above the Current Path forecast by 2043, to 70.2 years.
Signing the Presidential Health Compact in July 2019, President Ramaphosa publicly acknowledged the crisis in South Africa’s health system. The biggest obstacles to achieving improved health outcomes are a poorly functioning public healthcare system, over-servicing and inflated costs in the private healthcare system, and public debt. [14This was, among others, the reason for a five-year health market inquiry by the Competition Commission, which tabled its final report in late 2019.]
Better management and more competition are vital, but given poor efficiencies and high debt levels, South Africa will struggle to implement the National Health Insurance scheme as envisioned in its 2017 White Paper.
In 2019, South Africa had an infant mortality rate of 33.1 deaths per 1 000 live births (the 13th highest in Africa, largely as a result of HIV infections), forecast to decline to 28.4 by 2043 in the Current Path forecast. Similar to life expectancy, the difference between rates of infant mortality in South Africa and the average for upper middle-income countries globally is large.
In the Health/WaSH scenario, South Africa reduces the rate of infant mortality to 26.3 by 2043 — a reduction of 7.4% below the Current Path forecast.
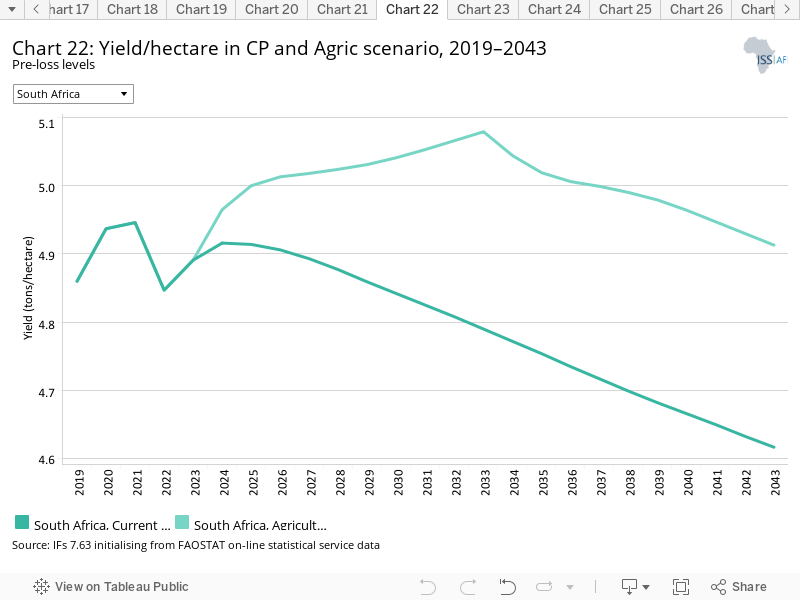
The Agriculture scenario represents reasonable but ambitious increases in yields per hectare (reflecting better management and seed and fertilizer technology), increased land under irrigation and reduced loss and waste. Where appropriate, it includes an increase in calorie consumption, reflecting the prioritisation of food self-sufficiency above food exports as a desirable policy objective.
The intervention is explained here in the thematic part of the website.
The data on yield per hectare (in metric tons) is for crops but does not distinguish between different categories of crops.
In 2019, South Africa produced 4.9 metric tons of crops per hectare, which is forecast to decline to 4.6 tons by 2043, largely due to the impact of climate change.
Initialising from IPCC data, IFs includes country-level estimations of the impact of increased carbon emissions. These are that South Africa would likely experience an average of above 1 °C warming from 2019 to 2043 and a 2.6% decline in precipitation that results in an average agricultural yield decline of 4%. The 2019 situation was that crop yields in South Africa were the 12th highest in the continent, although substantially below countries such as Mauritius, Eswatini and Egypt, albeit slightly higher than the average for upper middle-income countries in Africa.
In the Agriculture scenario, yields improve by 6.3% in 2043, compared to the Current Path forecast, reversing the decline in the Current Path. This is likely if a suite of adaptation mechanisms is employed by the agricultural sector to mitigate the negative impacts of climate change.
South Africa’s agriculture sector consists of a small but highly productive private sector and large expanses of subsistence and smallholder farming in the former apartheid homelands. The ownership of private farming land is skewed in favour of large commercial farmers while productivity in the former homelands is constrained by traditional land tenure practices. Both trajectories paint a worrisome picture for food security given the growth in population expected throughout the forecast horizon.
In spite of its small agriculture sector, South Africa is one of the few African countries that are largely food secure, and the country makes a significant contribution to the food required in the SADC region. [15M Arnoldi, Pandemic to shift focus to localisation, says Agbiz, Engineering News, 28 April 2020] The future situation is, however, less promising. In the Current Path forecast, South Africa’s dependence on agricultural crop imports grows to 20% of demand in 2043; in the Agriculture scenario, it is 15.9%.
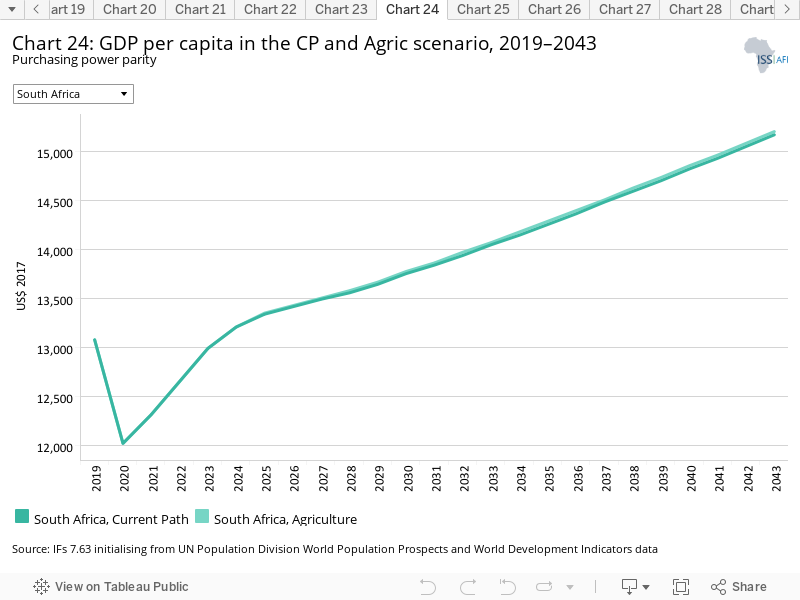
In 2019, South Africa’s GDP per capita was US$13 080 per person, improving to US$15 173 by 2043 in the Current Path forecast. Given the small size of the agriculture sector, accounting for 2.1% of the GDP in 2019, the 6% improvement in yields (Chart 22) has little impact on the GDP per capita. The Agricultural Scenario improves per capita income to US$15 206 — an improvement of US$33 above the Current Path forecast. There is, however, the significant potential to improve the livelihoods of subsistence and small-scale farmers in the former homelands.
Improving the contribution that the agriculture sector makes to poverty alleviation in South Africa requires land reform, particularly in the former homelands and the release of large tracts of government-owned land for productive use, together with appropriate support of new famers. South Africa can increase land under cultivation using available state-owned land and tenure reform in the former homeland areas.
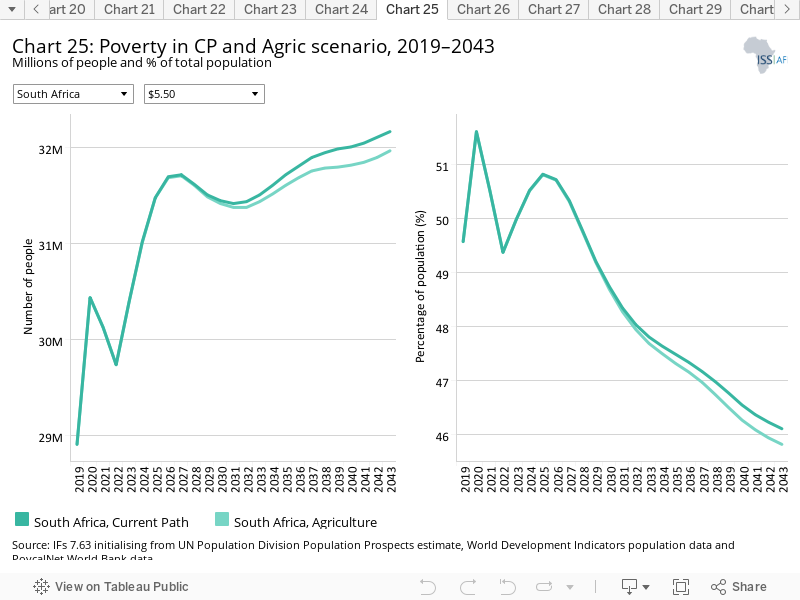
In the Agriculture scenario, the poverty rate will decrease from 49.1% in 2019 to 45.8% by 2043. Poverty rates will however still be above the average for upper middle-income economies in Africa.
The Agriculture scenario will result in a modest 204 000 fewer people in extreme poverty by 2043 (using US$5.50) compared to the Current Path forecast. The number of people living in extreme poverty in 2043 will beat 32.17 million and 31.97 million in the Current Path forecast and Agriculture scenario, respectively.
The Education scenario represents reasonable but ambitious improved intake, transition and graduation rates from primary to tertiary levels and better quality of education. It also models substantive progress towards gender parity at all levels, additional vocational training at secondary school level and increases in the share of science and engineering graduates.
The intervention is explained here in the thematic part of the website.
With the advent of democracy, the South African education system has had to compensate for successive generations of low spending on black learners. This challenge has been compounded by considerable policy incoherence, bad management, corruption, aggressive unionisation and insufficient focus on technical and vocational education at secondary and at tertiary levels — an issue that is now attracting more government attention.
In contrast to its poor indices in health, South Africa provides more education than comparable global and African averages. Mean years of adult (15 years and older) education in 2019 was 10 years in South Africa, two years above the mean for upper middle-income countries globally and almost four years more than the average for Africa. Young South Africans (15 to 24 years of age) have an even larger advantage. In the Current Path forecast, the mean years of adult education in South Africa would improve to 10.4 years in 2043.
In 2019, government spending on education was at 5.2% of the GDP, almost two percentage points above the average for upper middle-income countries globally and one percentage point above the average for Africa. In 2019, South Africa had the 16th largest education expenditure in Africa (as a per cent of GDP) but in absolute numbers, it had the largest education budget in Africa.
In the Education scenario, South Africa’s mean years of adult education modestly increase by 0.2 years to 10.6 years in 2043. Because the intervention is also aimed at closing the gap between males and females, the improvements in mean years of female education are larger.
South Africa’s high levels of mean years of education (quantity) compared to its peers are, however, offset by poor scores in education quality. In 2019, the South African average of 37 out of a possible 100 for both primary and secondary education test scores, scoring seven and three percentage points below the average for upper middle-income countries globally.
The Current Path gap between South Africa and the average for upper middle-income countries globally is forecast to increase to 2043, largely due to the impact of lower levels of spending on education as the economy is forecast to grow slowly. The Education scenario improves primary and secondary quality scores by 17% and 21% respectively in 2043.
A comprehensive report [16S van der Berg et al, Identifying Binding Constraints in Education: Synthesis Report for the Programme to Support Pro-Poor Policy Development (PsPPd), Stellenbosch: Research on Socio-economic Policy, Department of Economics, University of Stellenbosch, 24 May 2016, 5–6.] identified four binding constraints to improved educational outcomes in South Africa for learners from low- income backgrounds:
- Weak institutional functionality impacting most negatively at the provincial level.
- Undue union influence.
- Teachers’ lacking basic levels of content knowledge and pedagogical skills.
- Wasted learning time and insufficient opportunity to learn.
The result, the report found, is that around 60% of South African children did not learn to read for meaning in any language by the end of Grade 3.
South Africa has no vocational enrolment at lower secondary levels, and at the upper secondary level in 2016 its proportion of learners in vocational training (12%) was very low. [17UNESCO, UIS Statistics Database]
Data on the National Senior Certificate (NSC) also speaks to the lack of preparation among learners to enter science, technology and mathematics (STEM) fields. [18DBE, Report on the 2019 National Senior Certificate Examination, 2020]
These concerns have been amplified by the COVID-19 pandemic that has disrupted education in South Africa and elsewhere, with likely learning loss experienced disproportionately by more vulnerable learners.
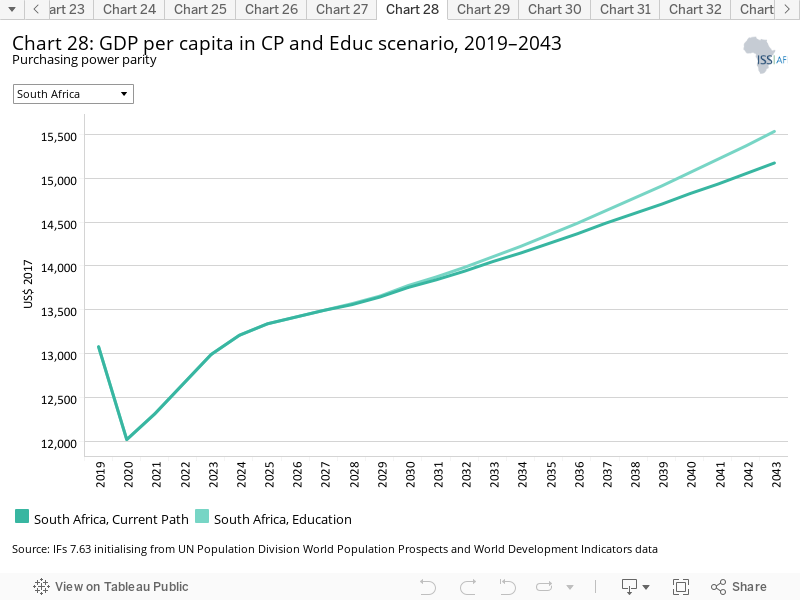
The GDP per capita was US$13 080 in 2019, improving to US$15 173 in the Current Path forecast. In the Education scenario, the GDP per capita improves to US$15 533 in 2043, an increase of 2.4% (US$360) in 2043.
The Manufacturing/Transfers scenario represents reasonable but ambitious manufacturing growth through greater investment in the economy, investments in research and development, and promotion of the export of manufactured goods. It is accompanied by an increase in welfare transfers (social grants) to moderate the initial increases in inequality that are typically associated with a manufacturing transition. To this end, the scenario improves tax administration and increases government revenues.
The intervention is explained here in the thematic part of the website.
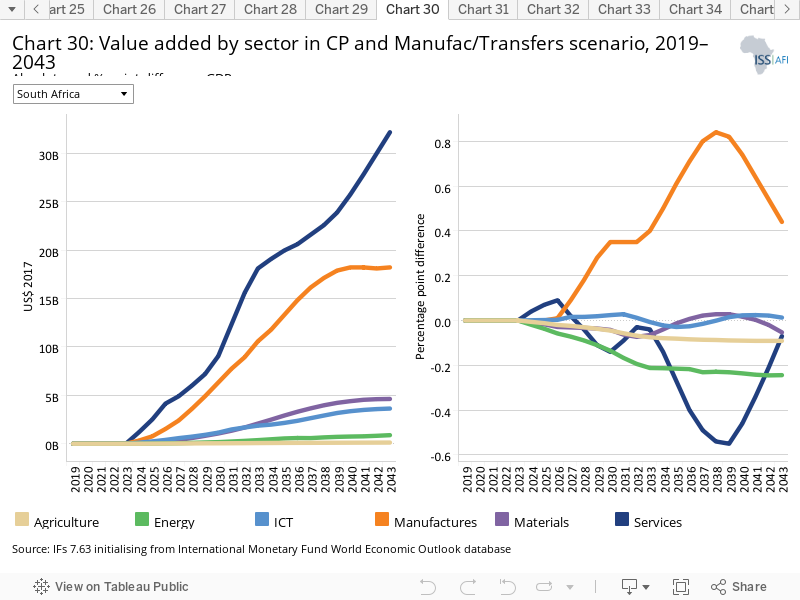
Chart 30 should be read with Chart 8 that presents a stacked area graph on the contribution to GDP and size, in billion US$, of the Current Path economy for each of the sectors.
During his June 2019 State of the Nation address, President Ramaphosa spoke about the need to ‘rebuild the foundations of our economy by revitalising and expanding the productive sectors’ that ‘requires us to reimagine our industrial strategy, to unleash private investment and energise the state to boost economic inclusion.’ [19South African Government, State of the Nation Address by President Cyril Ramaphosa, 20 June 2019]
Instead of an economy that is US$694.4 billion in size in 2043, the Manufacturing/Transfers scenario results in an economy that is US$98.9 billion larger at US$793.3 billion, a difference of 8%. The main reason for this increase is the increase in the size of the manufacturing sector that contributes 0.44 percentage points more to the GDP in 2043 compared to the Current Path forecast. Hence the manufacturing sector is US$18.2 billion larger in 2043 compared to the Current Path forecast and the service sector US$32.2 billion larger.
The ICT sector also grows by an additional 0.01 percentage points as a result of the Manufacturing/Transfers scenario. All other sectors decline in their contribution, although, since the economy is growing more rapidly, all are larger.
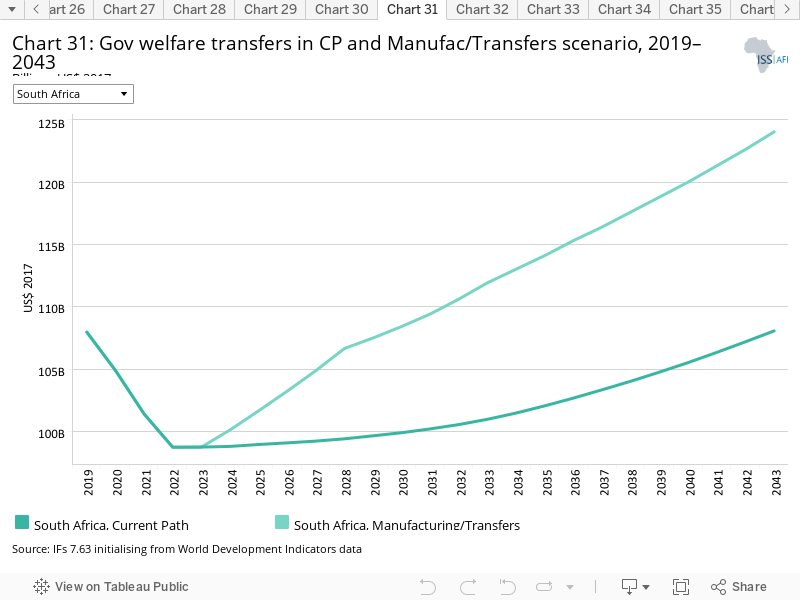
In an effort to reduce inequality and extreme poverty, South Africa has a progressive tax regime and already allocates a significant portion of government expenditure to social grants/transfers. In the Manufacturing/Transfers scenario, transfers to unskilled workers are increased from US$108.07 billion in the Current Path forecast to US$124.04 billion in 2043 — a difference of almost US$16 billion.
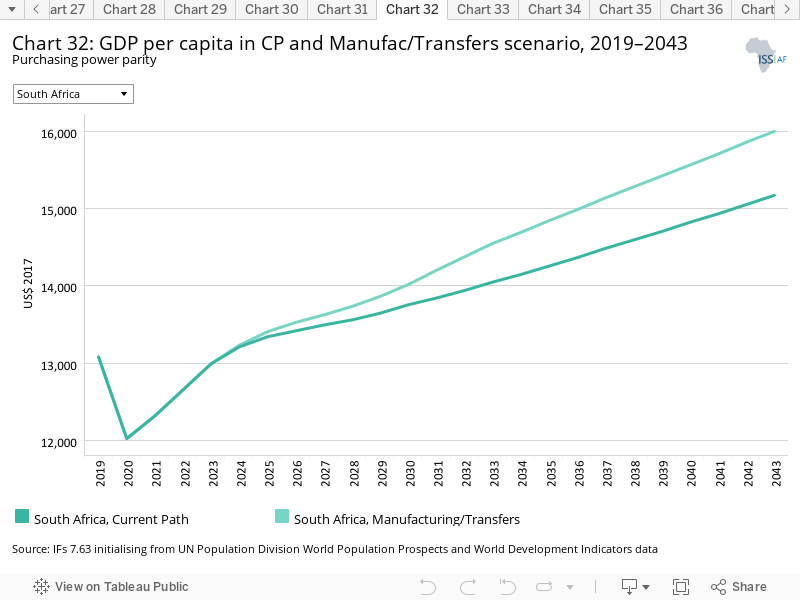
The Manufacturing/Transfers scenario will have a significant impact on the GDP per capita of South Africa in 2043, increasing it by 5.5% (US$828) above the Current Path forecast. The GDP per capita is expected to increase by 2043 to US$16 001 compared to US$15 173 in the Current Path forecast.
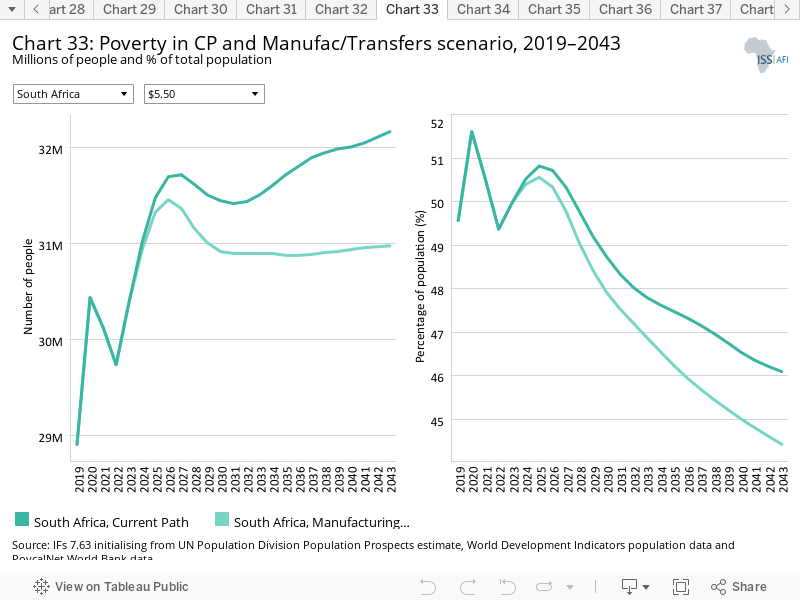
In 2019, 49.6% (28.9 million people) of South Africans lived below the US$5.50 poverty line, a number that modestly declines to 46.1% (32.2 million) by 2043 in the Current Path forecast. The Manufacturing/Transfers scenario would reduce South Africa’s rate of extreme poverty by almost two percentage points to 44.4% (or 31 million people).
The Leapfrogging scenario represents a reasonable but ambitious adoption of and investment in renewable energy technologies, resulting in better access to electricity in urban and rural areas. The scenario includes accelerated access to mobile and fixed broadband and the adoption of modern technology that improves government efficiency and allows for the more rapid formalisation of the informal sector.
The intervention is explained here in the thematic part of the website.
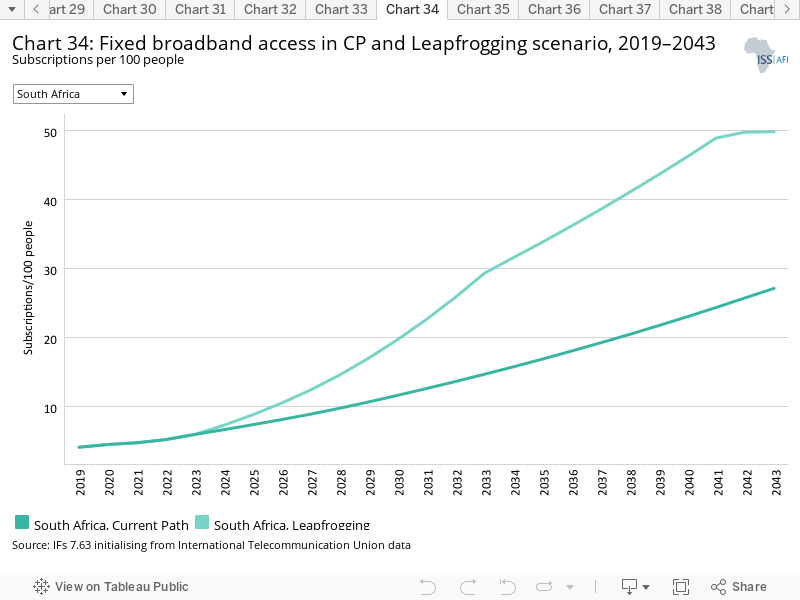
Fixed broadband includes cable modem Internet connections, DSL Internet connections of at least 256 KB/s, fibre and other fixed broadband technology connections (such as satellite broadband Internet, ethernet local area networks, fixed-wireless access, wireless local area networks, WiMAX, etc.).
In 2019, South Africa had 4 fixed broadband subscribers per 100 people, a number set to increase to 27.1 in 2043 in the Current Path forecast. The average for Africa in 2019 was 3.2, improving to 27.7 in 2043 in the Current Path forecast. In 2019, South Africa only had the 15th highest penetration rate in Africa and was surpassed by a number of lower middle-income countries on the continent. In the Leapfrogging scenario, South Africa’s ratio increases to 49.8 by 2043, increasing by more than 80%, while Africa’s ratio increases to 47.9 in this scenario. Mobile broadband increases are more rapid (see Chart 35).
South Africa’s ICT sector is forecast to increase in size from 5.5% to 6% of the GDP from 2019 to 2043 in the Current Path forecast. The average size of the ICT sector in Africa in the Leapfrogging scenario is to increase from 5.6% in 2019 to 6.8% in 2043.
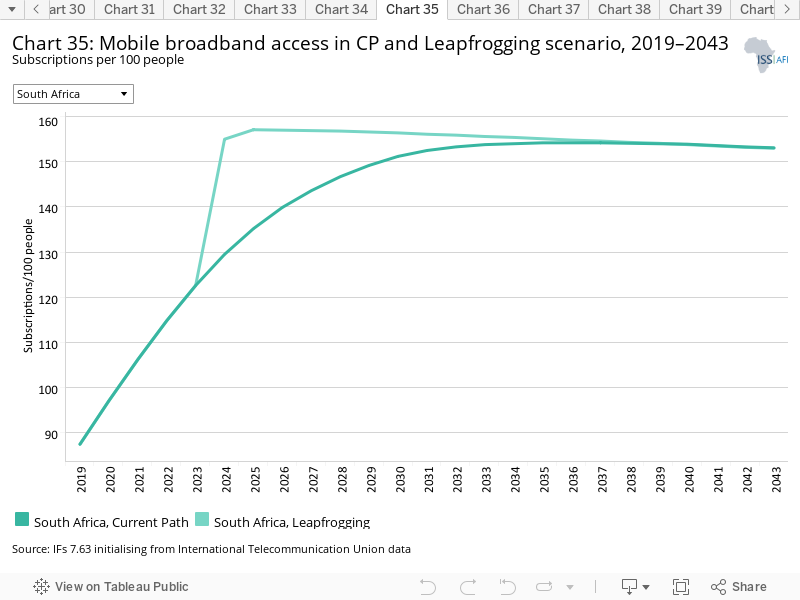
Mobile broadband refers to wireless Internet access delivered through cellular towers to computers and other digital devices.
Mobile broadband is exploding in Africa. In 2019, 40.5 out of 100 Africans had mobile broadband. South Africa had more than double that rate at 87.5 subscribers per 100 people. In the Current Path forecast, South Africa would get to 155 per 100 people by 2024, and then level off due to the saturation effect, while the average for Africa in 2043 would be 144 subscriptions per 100 persons.
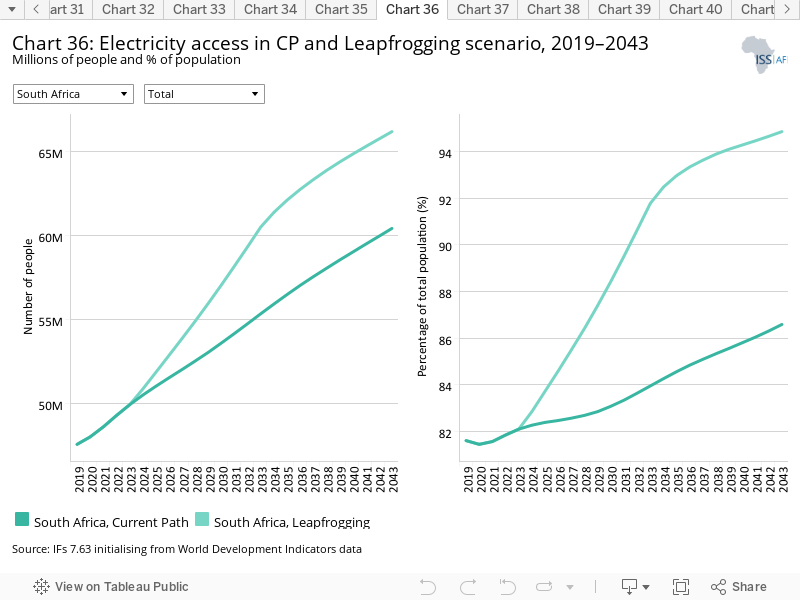
South Africa has made significant progress in rolling out electricity access for its population compared to most other African countries, except for countries in North Africa which have done exceptionally well. Already, in 2019, 81.6% of South Africans had access to electricity (the tenth highest rate in Africa), a number set to increase to 86.6% in the Current Path forecast and 94.8% in the Leapfrogging scenario. The average for Africa was 53.2% in 2019, improving to 72.7% in 2043 in the Current Path and 83.8% in the Leapfrogging scenario. Unlike many other African countries, electricity access in rural areas in South Africa is only two percentage points below urban access, standing at 80.3% in 2019. The average rural access in Africa in 2019 was 39%. However, since 2007, South Africa has experienced ongoing power constraints due to a lack of generation capacity.
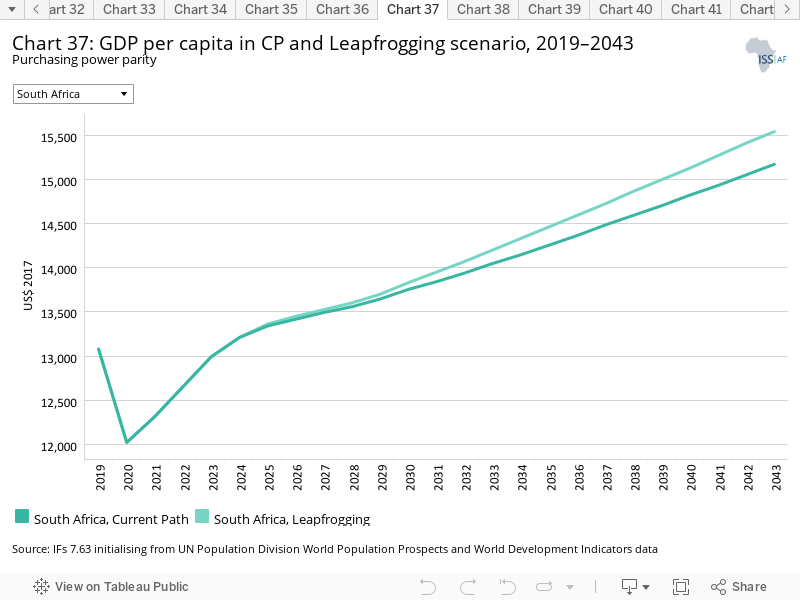
Government inaction (and slow action) has exacerbated South Africa’s electricity crisis, which will remain a constraint on South Africa’s growth in the near future. In fact, without resolving its electricity generation problems, GDP growth will stay hobbled. The GDP per capita was US$13 167 in 2019 and is set to improve to US$15 173 in the Current Path to 2043. In the Leapfrogging scenario, the GDP per capita increases to US$15 534, an improvement of 2.4% (US$370) in the Current Path forecast for 2043. The country could be doing much better. This relatively poor performance is reflected when considering that the absolute increase in GDP per capita in South Africa in the Leapfrogging scenario is only the 23rd highest in Africa, a low ranking considering its status as one of seven upper middle-income countries on the continent.
High levels of inequality and unemployment mean that the Leapfrogging scenario makes limited contributions to poverty reduction in South Africa. Using US$1.90, only 170 000 fewer South Africans would be considered absolutely poor in 2043. Using US$5.50, the reduction is 390 000 compared to the Current Path forecast.
The Free Trade scenario represents the impact of the full implementation of the African Continental Free Trade Area (AfCFTA) by 2034 through increases in exports, improved productivity and increased trade and economic freedom.
The intervention is explained here in the thematic part of the website.
The trade balance is the difference between the value of a country's exports and its imports. A country that imports more goods and services than it exports in terms of value has a trade deficit, while a country that exports more goods and services than it imports has a trade surplus.
GDP growth in South Africa has a propensity to rapidly increase imports and often results in a negative trade balance that requires efforts to temper growth down.
South Africa’s annual trade balance has generally deteriorated since a positive peak of 8.7% of GDP in 1987. In 2019, South Africa’s trade balance was modestly negative at 0.07% of GDP. Imports and exports both grow more rapidly in the Free Trade scenario than in the Current Path. In the Free Trade scenario, South Africa’s trade balance improves to peak at 4.3% of GDP in 2030 before declining to 0.3% of GDP in 2038. The increase in export value is largely due to more manufactured exports.
Next to Nigeria and Egypt, South Africa will experience the largest growth in the value of its exports and imports in the Free Trade scenario
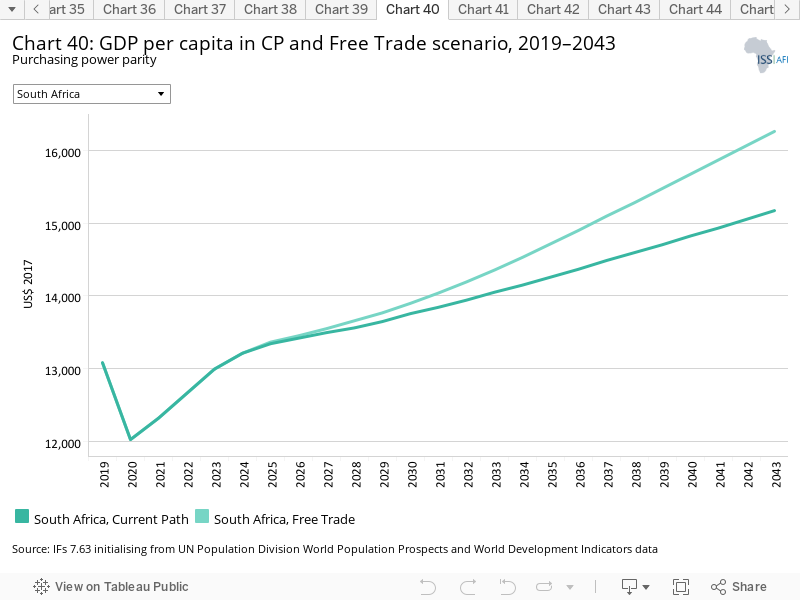
South Africa stands to benefit greatly from the Free Trade scenario. Only Seychelles, Libya, Cape Verde, Eswatini, Egypt and Botswana will gain a larger increase in GDP per capita from the Free Trade scenario. The GDP per capita in South Africa was US$13 167 in 2019 and is set to increase to US$15 173 on the Current Path forecast. In the Free Trade scenario, South Africa’s GDP per capita increases to US$16 263, an improvement of more than 7% (or US$1 090).
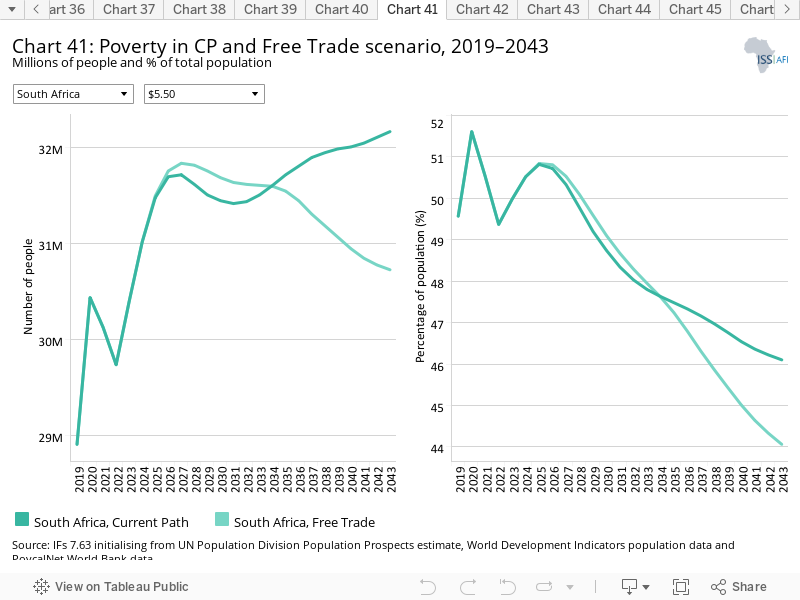
Trade openness will reduce poverty in the long term after initially increasing it due to the redistributive effects of trade. Most African countries export primary commodities and low-tech manufacturing products, and therefore a continental free trade agreement (AfCFTA) that reduces tariffs and non-tariff barriers across Africa will increase competition among countries in primary commodities and low-tech manufacturing exports. Countries with inefficient, high-cost manufacturing sectors might be displaced as the AfCFTA is implemented, thereby pushing up poverty rates. In the long term, as the economy adjusts and produces and exports its comparatively advantaged (lower relative cost) goods and services, poverty rates will decline.
In the Free Trade scenario, 734 000 fewer South Africans will be extremely poor in 2043 (using US$1.90), a difference of one percentage point. Using US$5.50, the number would be 1.44 million fewer poor people. Again, high levels of inequality mean that economic growth has a marginal impact on poverty reduction.
The Financial Flows scenario represents a reasonable but ambitious increase in worker remittances and aid flows to poor countries, and an increase in the stock of foreign direct investment (FDI) and additional portfolio investment inflows to middle-income countries. We also reduced outward financial flows to emulate a reduction in illicit financial outflows.
The intervention is explained here in the thematic part of the website.
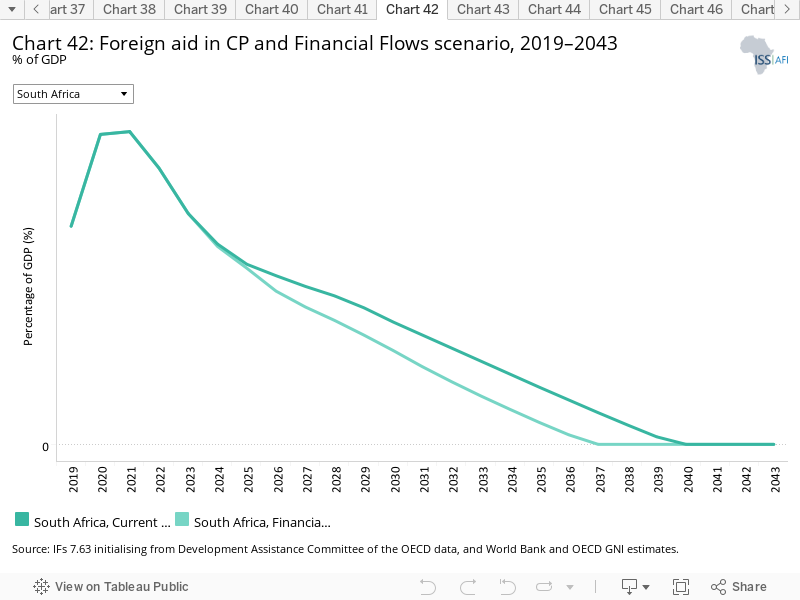
Given its status as an upper middle-income country, South Africa gets very little aid, which is also declining. In 2019, the country received aid equivalent to 0.6% of the GDP (US$2.8 billion). Since the Financial Flows scenario increases aid to low-income countries, the amount of aid going to middle-income countries declines and South Africa gets no aid from 2037 onwards in the Financial Flows scenario. In the Current Path forecast, aid to South Africa will end in 2040.
Investor confidence in South Africa is low. In 2019, South Africa received FDI inflows of roughly 1.55% of GDP, significantly below the average for Africa at 2.8%. The average for upper middle-income countries globally was at 3.3% of GDP. In the Current Path forecast, FDI inflows increase to 1.9% of GDP in 2043. In the Financial Flows scenario, FDI inflows increase to 2.5% of GDP in 2043. The impact is forecast to increase South Africa’s stock of FDI in 2043 to US$271.2 billion from the Current Path forecast of US$230.5 billion — a difference of 28%. The stock of FDI in South Africa was US$137 billion in 2019.
Although it did attract more FDI after its transition to democracy in 1994, inflows slowed after 2000. The Ramaphosa government has been actively pursuing domestic and international investment and hosted investment summits in 2018, 2019 and 2022 — against a target to raise US$100 billion in new investment over five years. These targets have fallen foul of COVID-19 and ongoing challenges in infrastructure, poor investment climate and, recently, indications of instability with large riots in KwaZulu-Natal and Gauteng in July 2021 that accompanied the incarceration of former president Jacob Zuma.
Without unlocking and sustaining significantly larger levels of domestic and foreign investment, South Africa will not escape its slow economic growth trajectory.
South Africa has been a source of outward remittance flows to many of its neighbouring countries on the back of its historical reliance on labour from countries such as Lesotho for its mines. The size of its gold and other mining activities has, however, declined over successive decades. In 2019, South Africa served as a source for remittances amounting to US$643 million. In the Current Path forecast, remittance outflows will modestly increase to US$712 million and to US$767 million in the Financial Flows scenario.
In 2019, the GDP per capita in South Africa was US$13 167 and is forecast to increase to US$15 173 in 2043 in the Current Path forecast. In the Financial Flows scenario, GDP per capita increases by 2.2% (US$327) to US$15 500. Since South Africa does not receive much aid and is a source country for remittances, the increase is attributable to larger FDI inflows.
The Financial Flows scenario has little impact on extreme poverty in South Africa because the country has very high levels of inequality, does not receive much aid, is a net provider of remittances to its neighbours, and receives low levels of FDI. Using the US$1.90 GDP per capita extreme poverty line, 100 000 fewer South Africans will live below US$1.90 in 2043 and 180 000 fewer using US$5.50.
The Infrastructure scenario represents a reasonable but ambitious increase in infrastructure spending across Africa, focusing on basic infrastructure (roads, water, sanitation, electricity access and ICT) in low-income countries and increasing emphasis on advanced infrastructure (such as ports, airports, railway and electricity generation) in higher-income countries.
Note that health and sanitation infrastructure is included as part of theHealth/WaSH scenario and that ICT infrastructure and more rapid uptake of renewables are part of the Leapfrogging scenario. The interventions there push directly on outcomes, whereas those modelled in this scenario increase infrastructure spending, indirectly boosting other forms of infrastructure, including that supporting health, sanitation and ICT.
The intervention is explained here in the thematic part of the website.
South Africa has high levels of electricity access in urban and rural areas compared to most other African countries. In 2019, 81.6% of South Africa’s population had access to electricity. In the Current Path forecast, that number increases to 86.6%, and it increases to 88.3% in the Infrastructure scenario. The country has, however, suffered from a deficit in electricity generation for more than a decade.
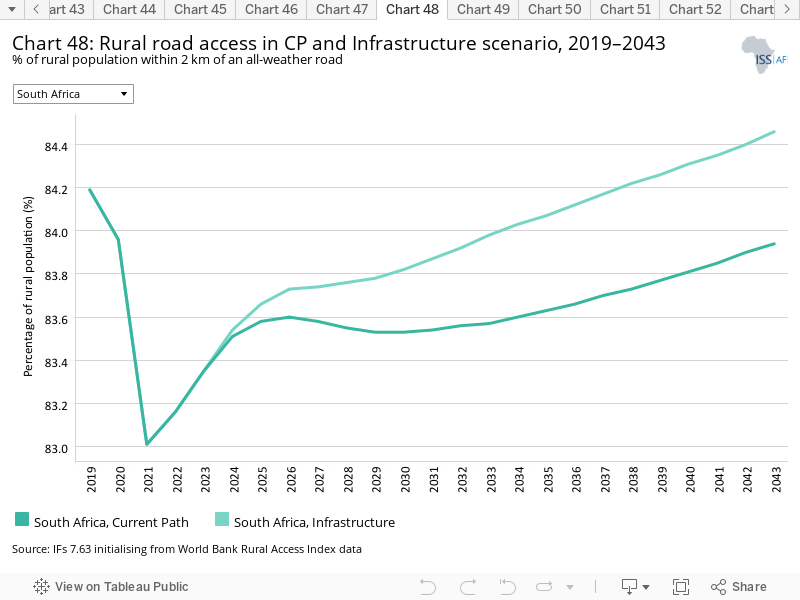
Indicator 9.1.1 in the Sustainable Development Goals refers to the proportion of the rural population who live within 2 km of an all-season road and is captured in the Rural Access Index.
Measuring rural accessibility is a very important development indicator. The road network in South Africa plays a vital role in the economy, given the nature of the country’s agriculture and mining sector as well as its distributed network of cities and towns.
Next to Egypt and Algeria, South Africa has the largest network of roads in Africa, although lack of maintenance in recent years has led to a significant deterioration, especially in the Free State province. In 2019, 84.2% of South Africans living in rural areas lived within 2 km of an all-season road. In the Current Path forecast, that number will increase to 83.9% and to 84.5% in the Infrastructure scenario.
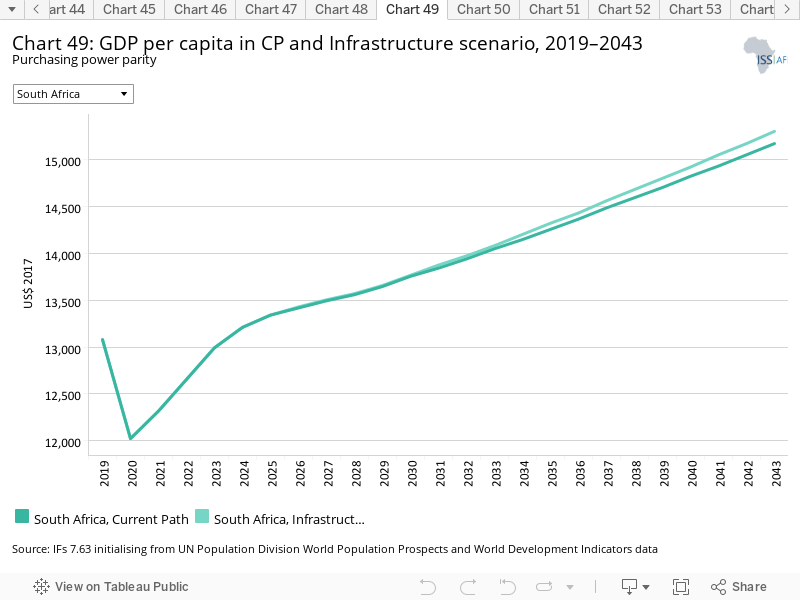
By 2043, the GDP per capita is expected to increase to US$15 304 in the Infrastructure scenario, compared to US$15 173 in the Current Path forecast — an increase of only US$131 per capita. The GDP per capita for South Africa is expected to continue to lag behind its income peers, with a growing per capita income gap throughout the forecast horizon.
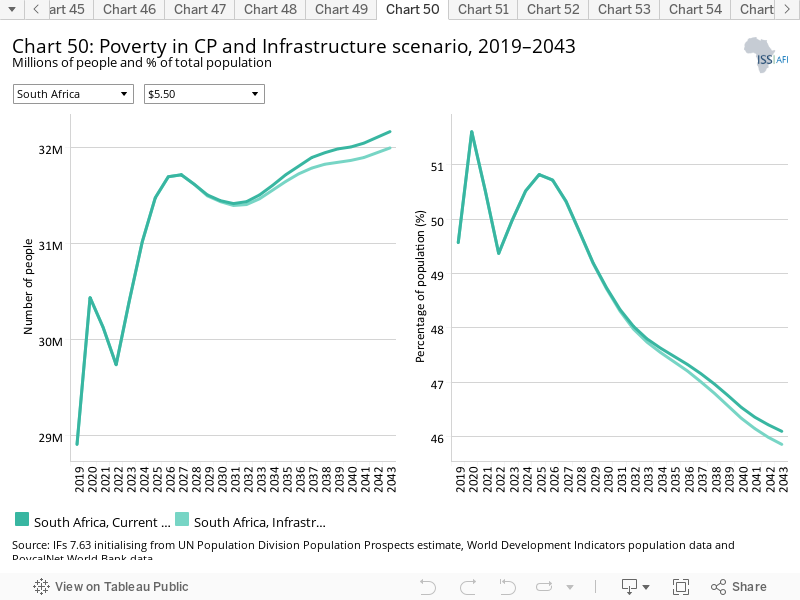
The Infrastructure scenario has little impact on extreme poverty in South Africa because the country has very high levels of inequality. South Africa also has much higher levels of basic infrastructure by comparable African standards. Using the US$1.90 GDP per capita extreme poverty line, 100 000 fewer South Africans will live below US$1.90 in 2043, and 170 000 fewer using US$5.50.
The Governance scenario represents a reasonable but ambitious improvement in accountability and reduces corruption, and hence improves the quality of service delivery by government.
The intervention is explained here in the thematic part of the website.
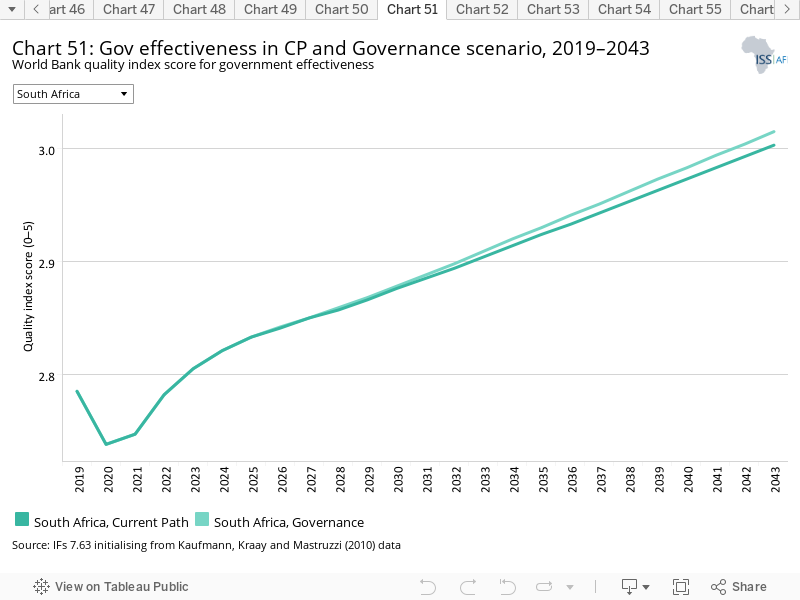
Chart 51 presents the impact of the interventions in the Governance scenario on government effectiveness. As defined by the World Bank, government effectiveness ‘captures perceptions of the quality of public services, the quality of the civil service and the degree of its independence from political pressures, the quality of policy formulation and implementation, and the credibility of the government’s commitment to such policies’.
Compared to most African countries, South Africa has high levels of democracy reflected in its liberal constitution and bill of rights, but these do not translate into more accountability or, indeed, better governance. Governance effectiveness in South Africa has actually steadily declined over the last two decades, affected by state capture, corruption and various inefficiencies but was still, in 2019, the fourth highest in Africa. The prospect for betterment is not a straightforward task but has improved significantly under the administration of President Ramaphosa. The improvements in effectiveness in the Governance scenario are, however, minimal.
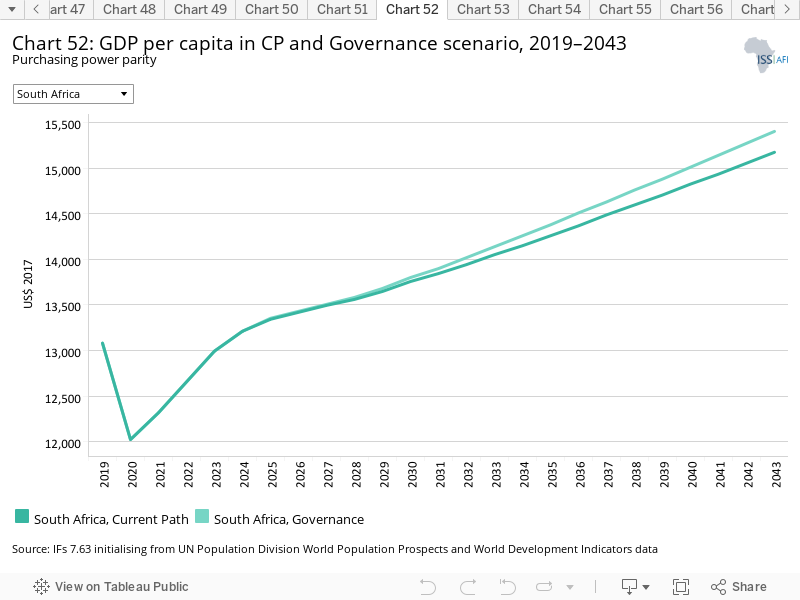
The Governance scenario has a small impact on South Africa’s GDP per capita. The GDP per capita is expected to increase to US$15 402 in this scenario compared to US$15 173 in the Current Path forecast for 2043, an increase below 2%.
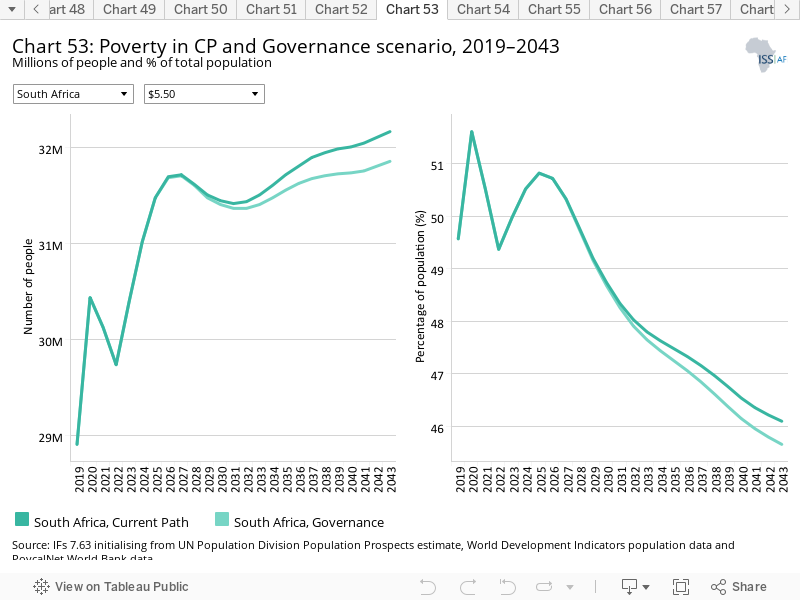
The Governance scenario has little impact on extreme poverty in South Africa because the country has very high levels of inequality and already has high levels of democracy by comparable African standards. Using the US$1.90 GDP per capita extreme poverty line, 180 000 fewer South Africans will live below US$1.90 and 310 000 fewer using US$5.50 in 2043.
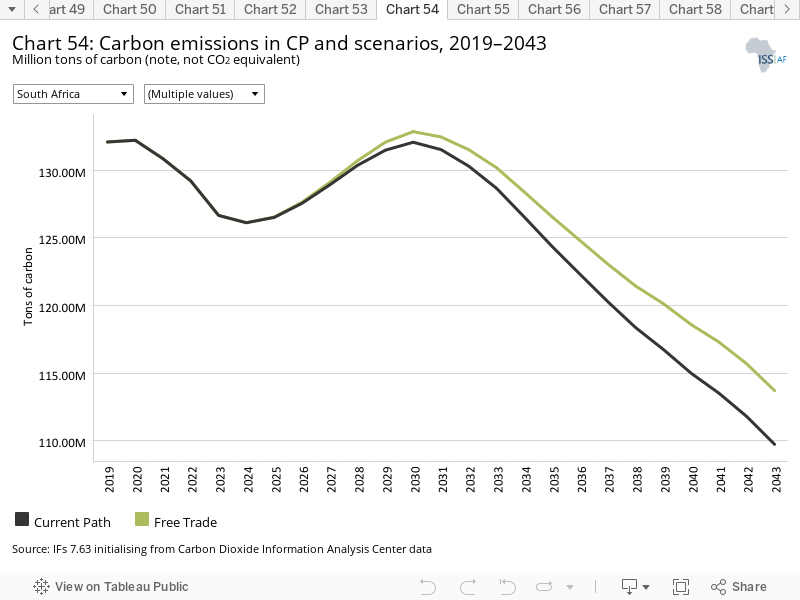
Chart 54 displays projected tons of carbon emissions for South Africa in the Current Path and the 11 intervention scenarios. Note that IFs uses carbon equivalents rather than CO2 equivalents.
South Africa’s carbon emissions are projected to increase most in the Free Trade scenario, emitting an additional 4 million tons of carbon by 2043 compared to the Current Path forecast, i.e. releasing 3.7% more carbon in that year. This increase reflects the fact that the South African economy will be largest in this scenario compared to any other. In the Free Trade scenario, the South African economy is 7.9% larger in 2043. The potential for large reductions in carbon is best reflected in the Leapfrogging scenario which reduces carbon emissions by 5.2 million tons below the Current Path forecast in 2043 in spite of the fact that the economy will be 3.7% larger.
The updated Integrated Resource Plan (IRP 2019) that was approved by the cabinet in October 2019 offers hope of a more rapid energy transition away from coal towards gas and renewables, although both come off a very low base. [20As published in Government Gazette, 42779:652, 18 October 2019] Should South Africa adopt a ‘least cost’ energy scenario, it could be possible to achieve the 70% renewable target by 2050 set out by the Council for Scientific and Industrial Research in July 2020. [21JG Wright and JR Calitz, Systems analysis to support increasingly ambitious CO2 emissions scenarios in the South African electricity system. Technical report prepared for Meridian Economics, 16 July 2020] In addition to the existing contracted commitment to extend electricity production from coal by 5.7 GW, which should be online within the next two years, the IRP 2019 envisions an additional 1 GW of capacity from coal by 2030. To this end, the IRP 2019 envisions incremental capacity addition (modular) and flexible technology, to complement the existing installed capacity prior to 2030 but that envisions ‘a completely different energy mix relative to the current mix’ thereafter. [22Department of Energy (Republic of South Africa), Integrated Resource Plan (IRP2019), October 2019, 15]
In July 2022 President Ramaphosa unveiled a raft of proposals that would, once implemented, end recurring load-shedding, accelerate the transition to renewables and unlock the constraint that limited electricity production has on economic growth.
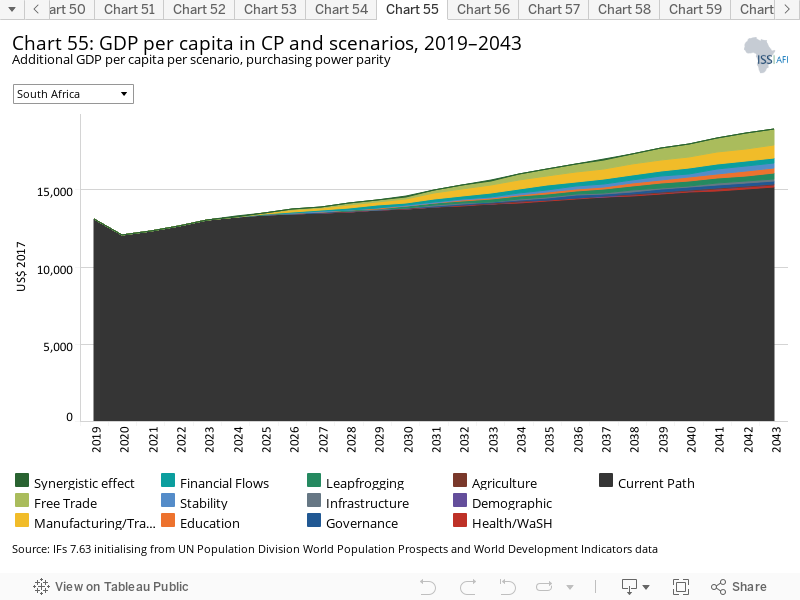
The Combined Agenda 2063 scenario consists of the combination of all 11 sectoral scenarios presented above, namely the Stability, Demographic, Health/WaSH, Agriculture, Education, Manufacturing/Transfers, Leapfrogging, Free Trade, Financial Flows, Infrastructure and Governance scenarios. The cumulative impact of better education, health, infrastructure, etc. means that countries get an additional benefit in the integrated IFs forecasting platform that we refer to as the synergistic effect. Chart 55 presents the contribution of each of these 12 components to GDP per capita in the Combined Agenda 2063 scenario as a stacked area graph.
In 2019, the GDP per capita in South Africa was US$13 167 and is set to increase to US$15 173 by 2043 in the Current Path forecast. The Free Trade scenario makes the largest contribution to the GDP per capita in 2043 (a US$1 090 improvement), followed by the Manufacturing/Transfers scenario (US$828.4 improvement) and the Leapfrogging scenario (US$370.6 improvement). Because South Africa is already in a demographic window of opportunity, the Demographic scenario makes the least contribution to the GDP per capita by 2043, on par with the Agriculture scenario which, due to its small size, contributes less than 2% of GDP by 2043.
Poor human capital is the largest structural constraint on South Africa’s growth, even as a focus on investment and modern industrialisation is needed to unlock more rapid growth in the short and medium-term. [23A Markle and J Cilliers, South Africa first! Getting to Thuma Mina, ISS, Southern Africa Report 36, March 2020, 3.]
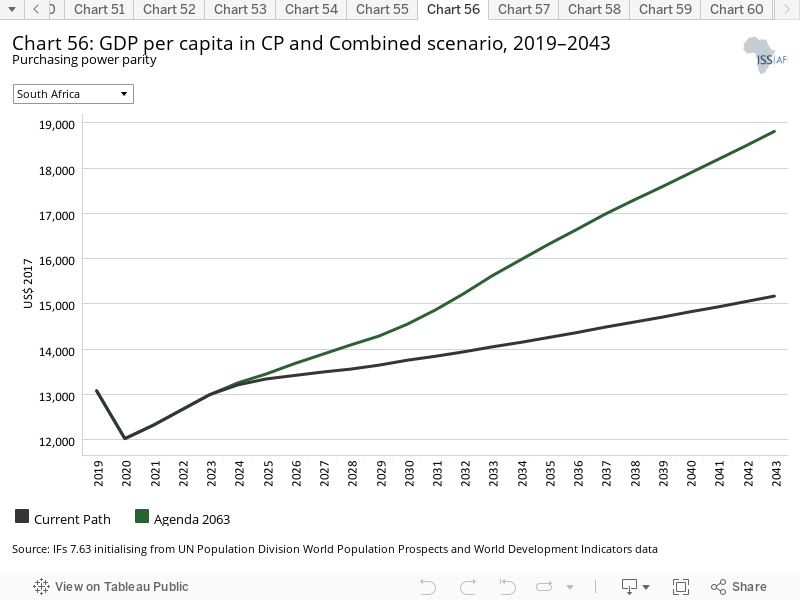
Whereas Chart 55 presents a stacked area graph on the contribution of each scenario to GDP per capita as well as the additional benefit or synergistic effect, Chart 56 presents only the GDP per capita in the Current Path forecast and the Combined Agenda 2063 scenario.
In the Combined Agenda 2063 scenario, the GDP per capita improves to US$18 813 — an increase of 22% above the 2043 Current Path forecast of US$15 173. Looking to 2043, South Africa must aspire to better education and health outcomes if it is to change its current mediocre long-term growth forecast. More immediate progress depends on ramping up investment in renewable energy solutions as a pathway to modern industrialisation, significantly higher levels of investment in the economy and improvements to the ease of doing business. South Africa also needs to deal with crime.
The drivers of South Africa's high levels of violent crime are multidimentional and requires an integrated response. High crime rates damage the economy, contribute to the misallocation and inefficient use of resources and undermines the country's development objectives of high and inclusive growth. Numerous studies have been done that indicate that well-designed and implemented policies that target priority crimes, murder in particular, can yield results in the medium term. Tackling organised crime, which has thrived on the declining capacity of the policy and justice institutions with large impacts on economic activity could be another.
Change to South Africa’s Current Path prospects will inevitably require deliberate choices, determined implementation, leadership and some pain.
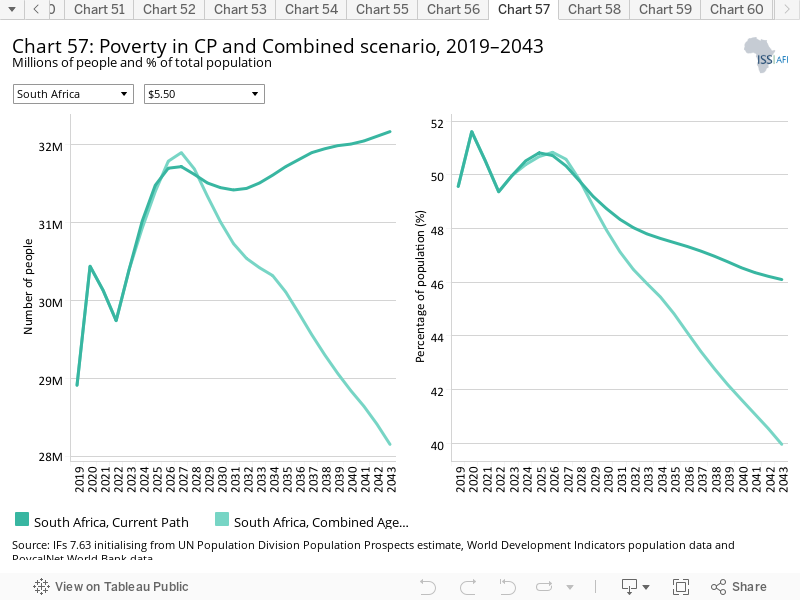
Using US$1.90, South Africa had 10 million people (17% of its population) living in extreme poverty in 2019 and is forecast to reach 10.5 million people (15% of its population) by 2043. In the Combined Agenda 2063 scenario, extreme poverty will decline to 11.5% (8.1 million people) in 2043, some four percentage points lower. At the US$5.50 income level, the proportion of people living in poverty in South Africa was at around 28.9 million (49.6%) in 2019 and is forecast to increase to 32 million (46.1%) in 2043. In the Combined Agenda 2063scenario, it will decline to 28 million people (40%), a difference of 6.1 percentage points.
The relatively small drop in extreme poverty compared to most of its peers in the Combined Agenda 2063 forecast is because of South Africa’s extraordinarily high levels of inequality and unemployment, its constrained economic growth forecasts and its relatively small informal sector.
Social grants from the government already support around a third of South Africans and play an important role in constraining further increases in poverty and inequality.
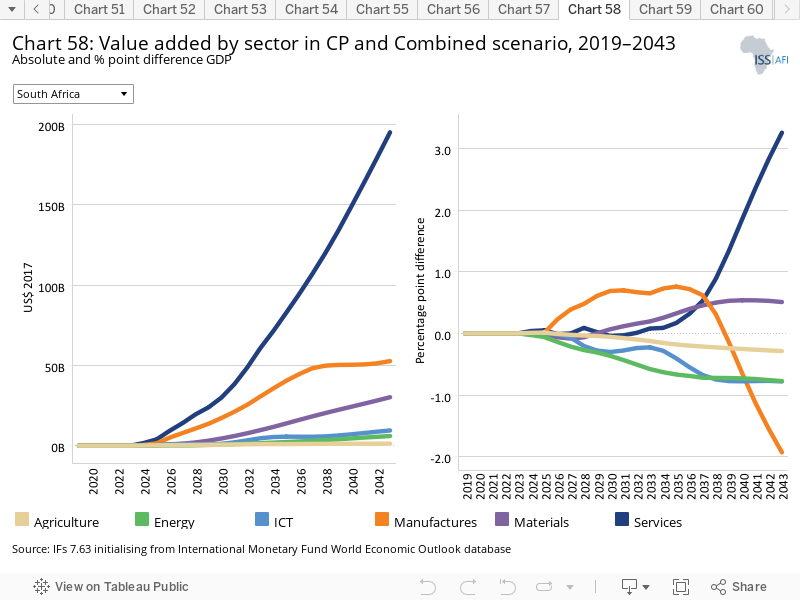
See Chart 8 to view the Current Path forecast of the sectoral composition of the economy.
The Combined Agenda 2063 scenario will result in an economy that is significantly larger in 2043 (see Chart 59). By 2043, the service sector will contribute an additional 3.3 percentage points (or US$195.1 billion) to South Africa’s GDP above the Current Path forecast. The only other sector to grow in relative terms will be materials, growing with an additional 0.51 percentage points above the Current Path forecast. All other sectors will contribute less to the GDP, but all sectors will be larger. For example, the size of the manufacturing sector will increase by US$53 billion and the materials sector by US$30.2 billion. Recent events such as the 2018, 2019 and 2022 South Africa Investment Conferences and policies such as the 2019 White Paper on Science, Technology and Innovation reflect a commitment to improving the climate for investment and innovation. However, achieving sustained, inclusive growth requires a reliable supply of electricity, reining in the dysfunctional state-owned enterprises and a move towards a more flexible, pro-growth approach to the economy.
In 2019 the size of the South African economy stood at S$503.7 billion. In the Combined Agenda 2063 scenario, the South African economy will be US$294.5 billion (or 40%) larger in 2043 (at US$1 028 billion compared to US$733.7 billion in the Current Path forecast).
Poor human capital stands out as South Africa’s greatest challenge to sustained, rapid growth. The country has a small comparative advantage in both knowledge capital, which is a net contributor to growth, and in physical capital. The positive contribution from knowledge capital is underpinned by South Africa’s relatively high levels of integration into the global economy compared to most other African economies, and the positive impact of knowledge diffusion through the larger number of trade and multinational corporations active in the country compared to other African countries. The positive impact of physical capital flows from South Africa’s relatively high levels of infrastructure and basic service provision such as water and sanitation.
Coming from very high levels of carbon emissions (due to its reliance on coal for electricity generation) means that South Africa has significant potential to reduce emissions. In the Current Path forecast, carbon emissions reduce from 132 million tons in 2019 to 110 million tons in 2043. By 2043, in the Combined Agenda 2063 scenario, South Africa will be the third largest emitter of carbon in Africa, having been overtaken by Nigeria and Egypt, and the country will have changed from being the 14th to the 16th largest emitter of carbon globally.
Endnotes
South Africa also has a very low savings rate: on average, South Africans can only expect to earn 16% of their working salaries in retirement, compared to 69.5% in Brazil and 87.4% in India. See: Organisation for Economic Co-operation and Development (OECD), Pensions at a glance 2017
A le Roux et al. Profiling the vulnerabilities and risks of South African settlements. Understanding the social and environmental implications of global change. 2017, 26–35
A Le Roux, K Arnold, S Makhanya and G Mans, Green Book. South Africa’s urban future: Growth projections for 2050. Pretoria: CSIR, 2019
President Cyril Ramaphosa: Additional Coronavirus COVID-19 economic and social relief measures, 21 April 2020
H Bhorat and B Stanwix, Policy Choices for the Labour Market, in G Mills, M Jonas, H Bhorat and R Hartley, Better Choices: Ensuring South Africa’s Future, Picador Africa, Pan Macmillan, 2022, 80–82.
H Bhorat and B Stanwix, Policy Choices for the Labour Market, in G Mills, M Jonas, H Bhorat and R Hartley, Better Choices: Ensuring South Africa’s Future, Picador Africa, Pan Macmillan, 2022, 80–82.
J Kirsten and W Sihlobo, Land reform in South Africa: 5 myths about farming debunked, The Conversation, 26 November 2022
J Kirsten and W Sihlobo, Land reform in South Africa: 5 myths about farming debunked, The Conversation, 26 November 2022.
As published in Government Gazette, 42779:652, 18 October 2019
Global Burden of Disease Collaborative Network, Global burden of disease study 2017 (GBD 2017): Burden by risk 1990–2017, Seattle: Institute for Health Metrics and Evaluation (IHME), 2018.
C Hsiao et al, Violence against children in South Africa: The cost of inaction to society and the economy, BJM Global Health, 3:e000573, 2017, 1–7.
The cost of violence to South Africa’s economy was recently estimated at over US$97 billion. See: Institute for Economics & Peace (IEP), Global peace index 2019: Measuring peace in a complex world, 2019, 99
K Schwab, Insight report: The global competitiveness report 2019, World Economic Forum, 2019, 19
This was, among others, the reason for a five-year health market inquiry by the Competition Commission, which tabled its final report in late 2019.
M Arnoldi, Pandemic to shift focus to localisation, says Agbiz, Engineering News, 28 April 2020
S van der Berg et al, Identifying Binding Constraints in Education: Synthesis Report for the Programme to Support Pro-Poor Policy Development (PsPPd), Stellenbosch: Research on Socio-economic Policy, Department of Economics, University of Stellenbosch, 24 May 2016, 5–6.
UNESCO, UIS Statistics Database
DBE, Report on the 2019 National Senior Certificate Examination, 2020
South African Government, State of the Nation Address by President Cyril Ramaphosa, 20 June 2019
As published in Government Gazette, 42779:652, 18 October 2019
JG Wright and JR Calitz, Systems analysis to support increasingly ambitious CO2 emissions scenarios in the South African electricity system. Technical report prepared for Meridian Economics, 16 July 2020
Department of Energy (Republic of South Africa), Integrated Resource Plan (IRP2019), October 2019, 15
A Markle and J Cilliers, South Africa first! Getting to Thuma Mina, ISS, Southern Africa Report 36, March 2020, 3.
Page information
Contact at AFI team is Jakkie Cilliers
This entry was last updated on 29 April 2024 using IFs v7.63.
Donors and sponsors


Reuse our work
- All visualizations, data, and text produced by African Futures are completely open access under the Creative Commons BY license. You have the permission to use, distribute, and reproduce these in any medium, provided the source and authors are credited.
- The data produced by third parties and made available by African Futures is subject to the license terms from the original third-party authors. We will always indicate the original source of the data in our documentation, so you should always check the license of any such third-party data before use and redistribution.
- All of our charts can be embedded in any site.
Cite this research
Jakkie Cilliers (2024) South Africa. Published online at futures.issafrica.org. Retrieved from https://futures.issafrica.org/geographic/countries/south-africa/ [Online Resource] Updated 29 April 2024.