 Niger
Niger
Feedback welcome
Our aim is to use the best data to inform our analysis. See our About page for information on the IFs forecasting platform. We appreciate your help and references for improvements via our feedback form.
In this entry, we first describe the Current Path (CP) forecast for Niger as it is expected to unfold to 2043, the end of the third ten-year implementation plan of the African Union’s Agenda 2063 long-term vision for Africa. The Current Path in the International Futures (IFs) forecasting model initialises from country-level data that is drawn from a range of data providers. We prioritise data from national sources.
The Current Path forecast is divided into summaries on demographics, economics, poverty, health/WaSH and climate change/energy. A second section then presents a single positive scenario for potential improvements in stability, demographics, health/WaSH, agriculture, education, manufacturing/transfers, leapfrogging, free trade, financial flows, infrastructure, governance and the impact of various scenarios on carbon emissions. With the individual impact of these sectors and dimensions having been considered, a final section presents the impact of the Combined Agenda 2063 scenario.
We generally review the impact of each scenario and the Combined Agenda 2063 scenario on gross domestic product (GDP) per person and extreme poverty except for Health/WaSH that uses life expectancy and infant mortality.
The information is presented graphically and supported by brief interpretive text.
All US$ numbers are in 2017 values.
Summary
- Current Path forecast
- Niger is a large landlocked country in West Africa with a population of 23.28 million people. With a GDP per capita (PPP) of US$1 047 in 2019, Niger is one of the world’s least developed countries that consistently ranks at the bottom of the United Nations Human Development Index. Jump to Current Path forecast
- Niger is projected to continue recording explosive population growth with its population more than doubling to reach 51.5 million people in 2043 — a result of only slowly decreasing fertility rates combined with an expected above-average increase in life expectancy. The region will remain predominantly rural and only see a modest increase in its urbanisation rate from 16.4% in 2019 to 18.7% in 2043. Jump to Demographics: Current Path
- Economic growth is expected in the region and increase its GDP (MER) more than fourfold to US$61.73 billion in 2043. Niger is forecast to more than double its GDP per capita to US$2 052 by 2043 but remain below the average of its low-income peer group on the continent at USD$3 790. Jump to Economics: Current Path
- The poverty rate in Niger is projected to decrease drastically from 44.26% in 2019 to 14.84% in 2043 and the number of people living below the US$1.90 poverty line to reduce from 10.3 million to 7.64 million people. Jump to Poverty: Current Path
- Niger’s emitted 1.14 million tons of carbon in 2019. Carbon emissions are forecast to increase almost sevenfold to 7.71 million tons by 2043, increasing 576.3% from a very low base between 2019 and 2043. Jump to Carbon emissions/Energy: Current Path
- Sectoral scenarios
- The Stability scenario has the potential to accelerate poverty reduction and bring the share of the population living below US$1.90 down to 13.6% by 2043 versus 14.84% in the Current Path. Jump to Stability scenario
- The interventions in the Demographic scenario will dramatically lower Niger’s total fertility rate by almost 50% from 6.8 births per woman in 2019 to 3.55 in 2043 and accelerate the country’s demographic transition. Jump to Demographic scenario
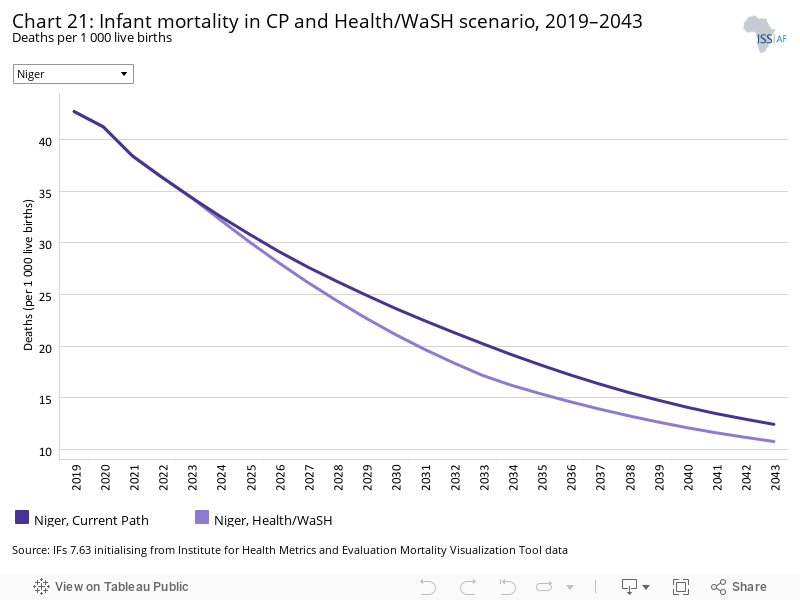
- The Health/WaSH scenario has the potential to increase life expectancy in Niger from 64.48 years in 2019 to 74.12 years in 2043 compared to 73.65 years on the Current Path. Jump to Health/WaSH scenario
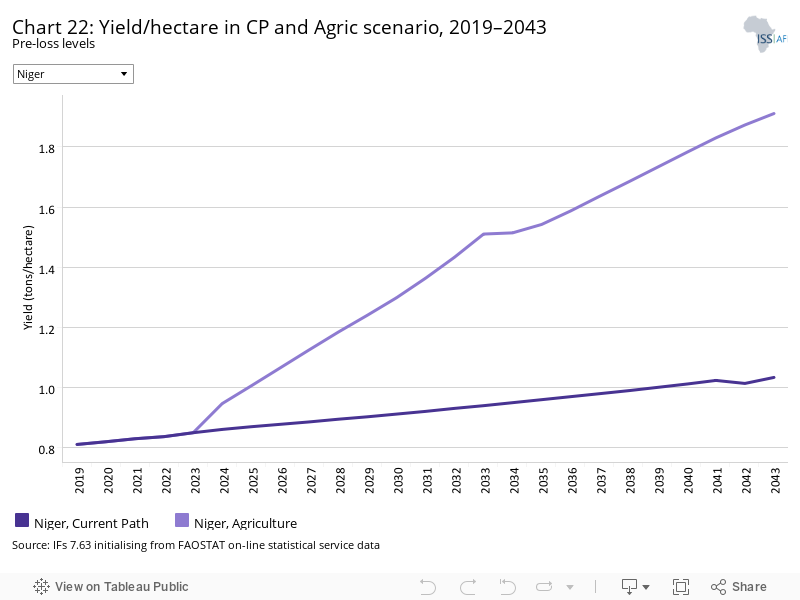
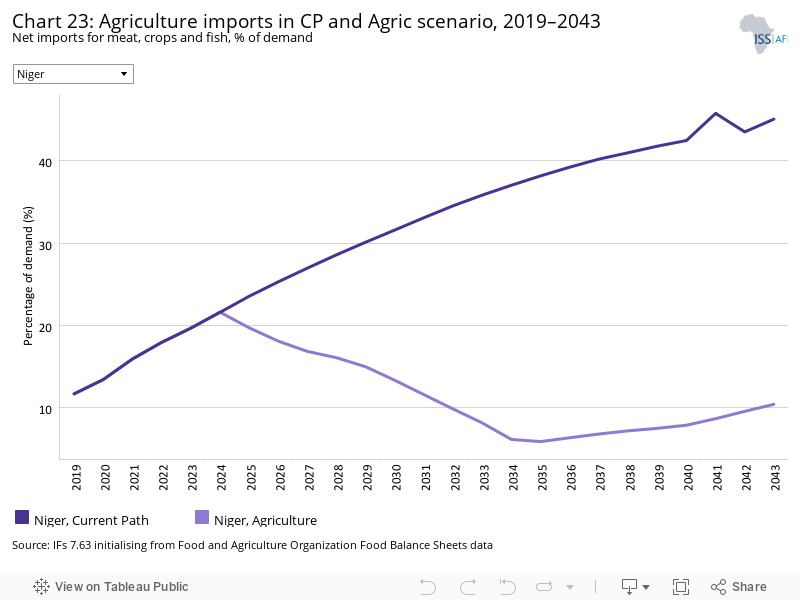
- The Agriculture scenario has the potential to drastically reduce Niger’s food import dependence with net food imports accounting for 10.39% of agricultural demand in 2043 compared to 45.9% in the Current Path. Jump to Agriculture scenario
- The Education scenario only translates into a modest increase in Niger’s GDP per capita: US$2 352 compared to US$2 232 in the Current Path. Jump to Education scenario
- In the Manufacturing/Transfers scenario, in the longer-term, the service sector is projected to experience the largest percentage point gain in terms of its relative contribution to GDP. Jump to Manufacturing/Transfers scenario
- The Leapfrogging scenario will accelerate access to electricity and push access rates to 56.7% by 2043 compared to 40.7% in the Current Path. Jump to Leapfrogging scenario
- In the Free Trade scenario, GDP per capita is expected to be US$239 higher than on the Current Path. Jump to Free Trade scenario
- In the Financial Flows scenario, FDI inflows are set to account for 7.86% of GDP compared to 7.09% in the Current Path forecast. Jump to Financial Flows scenario
- The Infrastructure scenario will improve electricity access rates from 19.34% in 2019 to 44.3% in 2043 compared to 40.7% in the Current Path forecast. Jump to Infrastructure scenario
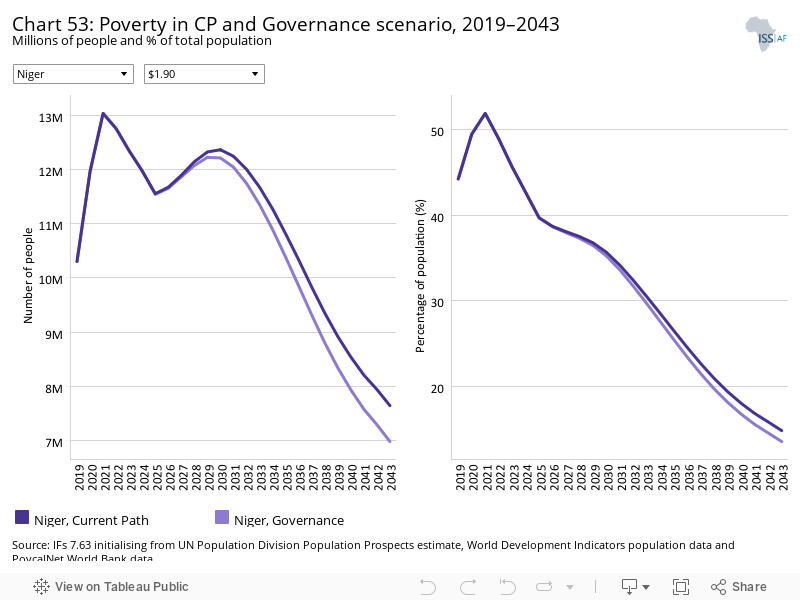
- In the Governance scenario, the share of the population living below the poverty line will be reduced to 13.56% by 2043 compared to 14.48% in the Current Path forecast. Jump to Governance scenario
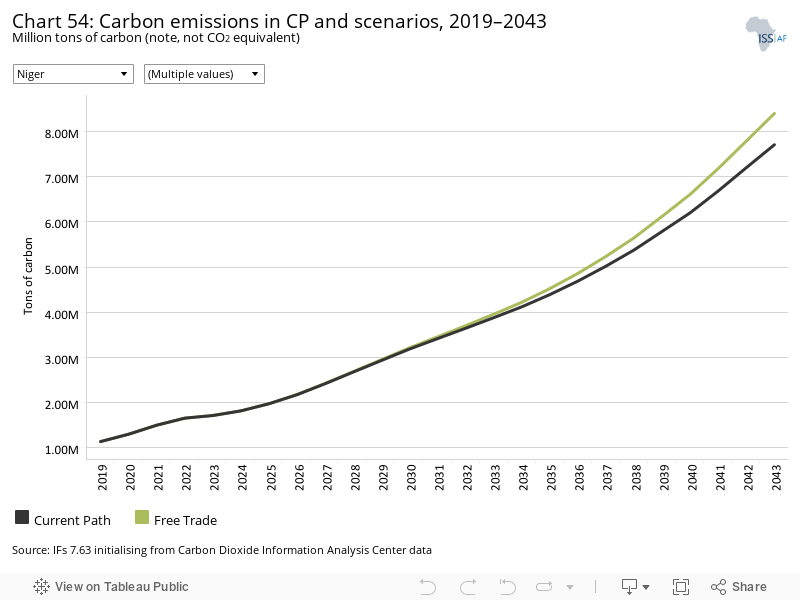
- Among the sectoral interventions, it is the Agriculture and the Free Trade scenarios that are expected to have the biggest impact on carbon emissions by 2043, resulting in emissions of 8.48 million and 8.4 million tons of carbon, respectively. Jump to Impact of scenarios on carbon emissions
- Combined Agenda 2063 scenario
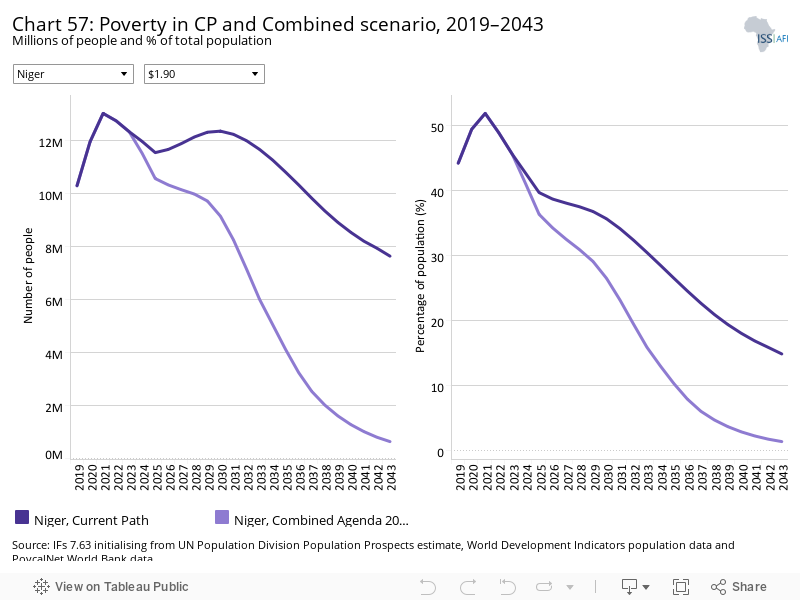
- In the Combined Agenda scenario, carbon emissions increase tenfold by 2043 reaching 11.2 million tons of carbon in Niger. The scenario sees a significant increase in Niger’s GDP per capita in 2043 which will be US$3 858 compared to US$2 232 in the Current Path forecast. Niger will essentially eliminate extreme poverty by 2043: 1.3% of the population, or 0.64 million people, is expected to live below the US$1.90 poverty line compared to 14.84%, or 7.64 million people, in the Current Path forecast. Jump to Combined Agenda 2063 scenario
All charts for Niger
- Chart 1: Political map of Niger
- Chart 2: Population structure in CP, 1990–2043
- Chart 3: Urban and rural population in CP, 1990–2043
- Chart 4: Population density map for 2019
- Chart 5: GDP in CP, 1990–2043
- Chart 6: GDP per capita in CP, 1990–2043
- Chart 7: Informal sector value in CP, 2015–2043
- Chart 8: Value added by sector in CP, 2015–2043
- Chart 9: Agriculture production/demand in CP, 1990–2043
- Chart 10: Poverty in CP, 2015–2043
- Chart 11: Energy production by type in CP, 1990–2043
- Chart 12: Carbon emissions in CP, 1990–2043
- Chart 13: Governance security in CP and Stability scenario, 2019–2043
- Chart 14: GDP per capita in CP and Stability scenario, 2019–2043
- Chart 15: Poverty in CP and Stability scenario, 2019–2043
- Chart 16: Demographic dividend in CP and Demog scenario, 2019–2043
- Chart 17: Infant mortality in CP and Demog scenario, 2019–2043
- Chart 18: GDP per capita in CP and Demog scenario, 2019–2043
- Chart 19: Poverty in CP and Demog scenario, 2019–2043
- Chart 20: Life expectancy in CP and Health/WaSH scenario, 2019–2043
- Chart 21: Infant mortality in CP and Health/WaSH scenario, 2019–2043
- Chart 22: Yield/hectare in CP and Agric scenario, 2019–2043
- Chart 23: Agriculture imports in CP and Agric scenario, 2019–2043
- Chart 24: GDP per capita in the CP and Agric scenario, 2019–2043
- Chart 25: Poverty in CP and Agric scenario, 2019–2043
- Chart 26: Mean years of education in CP and Educ scenario, 2019–2043
- Chart 27: Education quality in CP and Educ scenario, 2019–2043
- Chart 28: GDP per capita in CP and Educ scenario, 2019–2043
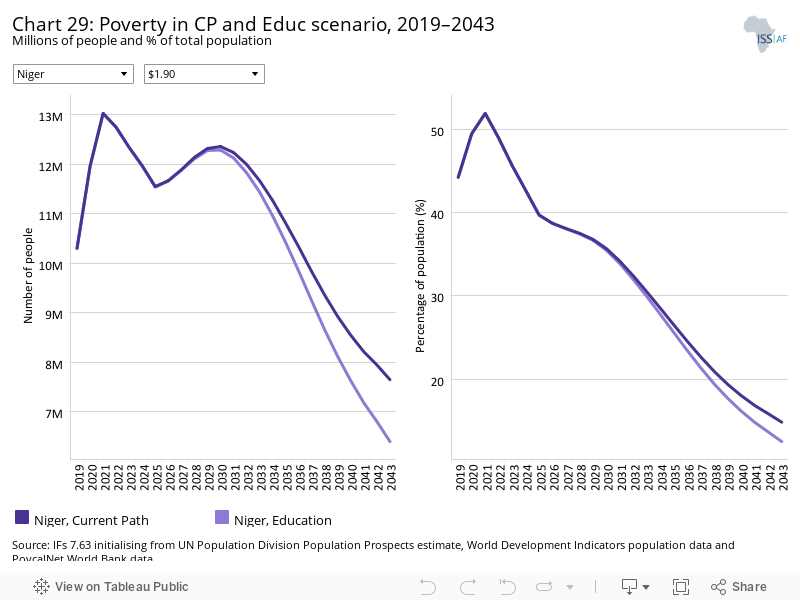
- Chart 29: Poverty in CP and Educ scenario, 2019–2043
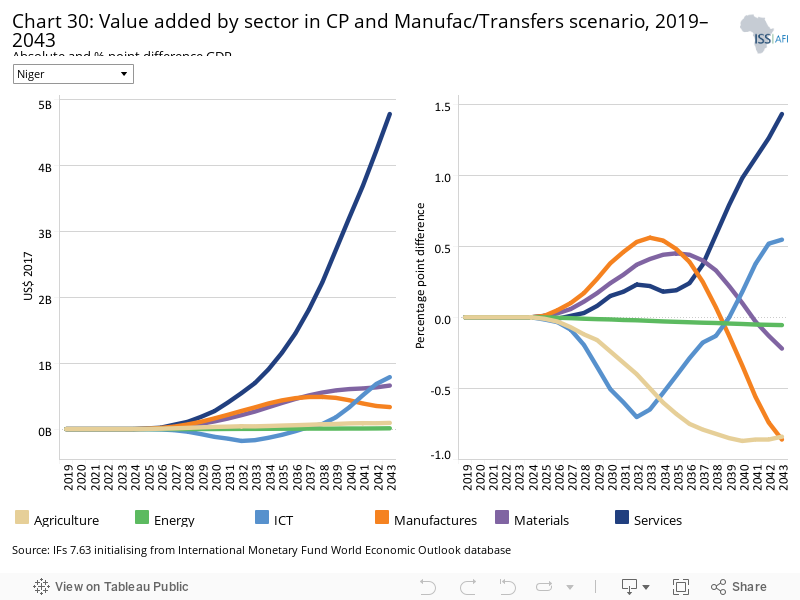
- Chart 30: Value added by sector in CP and Manufac/Transfers scenario, 2019–2043
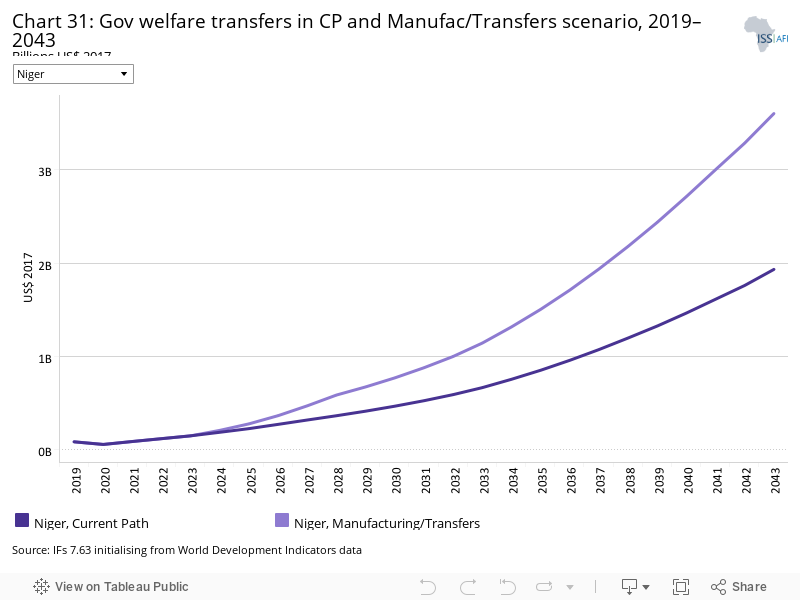
- Chart 31: Gov welfare transfers in CP and Manufac/Transfers scenario, 2019–2043
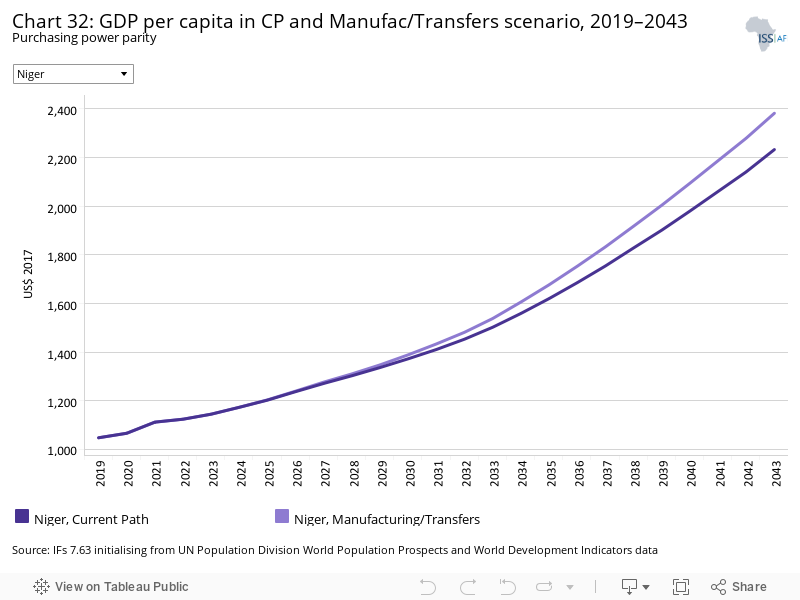
- Chart 32: GDP per capita in CP and Manufac/Transfers scenario, 2019–2043
- Chart 33: Poverty in CP and Manufac/Transfers scenario, 2019–2043
- Chart 34: Fixed broadband access in CP and Leapfrogging scenario, 2019–2043
- Chart 35: Mobile broadband access in CP and Leapfrogging scenario, 2019–2043
- Chart 36: Electricity access in CP and Leapfrogging scenario, 2019–2043
- Chart 37: GDP per capita in CP and Leapfrogging scenario, 2019–2043
- Chart 38: Poverty in CP and Leapfrogging scenario, 2019–2043
- Chart 39: Trade balance in CP and Free Trade scenario, 2019–2043
- Chart 40: GDP per capita in CP and Free Trade scenario, 2019–2043
- Chart 41: Poverty in CP and Free Trade scenario, 2019–2043
- Chart 42: Foreign aid in CP and Financial Flows scenario, 2019–2043
- Chart 43: Inflow of FDI in CP and Financial Flows scenario, 2019–2043
- Chart 44: Remittances in CP and Financial Flows scenario, 2019–2043
- Chart 45: GDP per capita in CP and Financial Flows scenario, 2019–2043
- Chart 46: Poverty in CP and Financial Flows scenario, 2019–2043
- Chart 47: Electricity access in CP and Infrastructure scenario, 2019–2043
- Chart 48: Rural road access in CP and Infrastructure scenario, 2019–2043
- Chart 49: GDP per capita in CP and Infrastructure scenario, 2019–2043
- Chart 50: Poverty in CP and Infrastructure scenario, 2019–2043
- Chart 51: Gov effectiveness in CP and Governance scenario, 2019–2043
- Chart 52: GDP per capita in CP and Governance scenario, 2019–2043
- Chart 53: Poverty in CP and Governance scenario, 2019–2043
- Chart 54: Carbon emissions in CP and scenarios, 2019–2043
- Chart 55: GDP per capita in CP and scenarios, 2019–2043
- Chart 56: GDP per capita in CP and Combined scenario, 2019–2043
- Chart 57: Poverty in CP and Combined scenario, 2019–2043
- Chart 58: Value added by sector in CP and Combined scenario, 2019–2043
- Chart 59: GDP in CP and Combined scenario, 2019–2043
- Chart 60: Carbon emissions in CP and Combined scenario, 2019–2043
This page provides an overview of the critical characteristics of Niger along its likely (or Current Path) development trajectory. The Current Path forecast from the International Futures forecasting (IFs) platform is a dynamic scenario that imitates continuing current policies and environmental conditions. The Current Path is, therefore, in congruence with historical patterns and produces a series of dynamic forecasts endogenised in relationships across crucial global systems. We use 2019 as a standard reference year, and the estimates generally extend to 2043 to coincide with the end of the third ten-year implementation plan of the African Union’s Agenda 2063 long-term development vision.
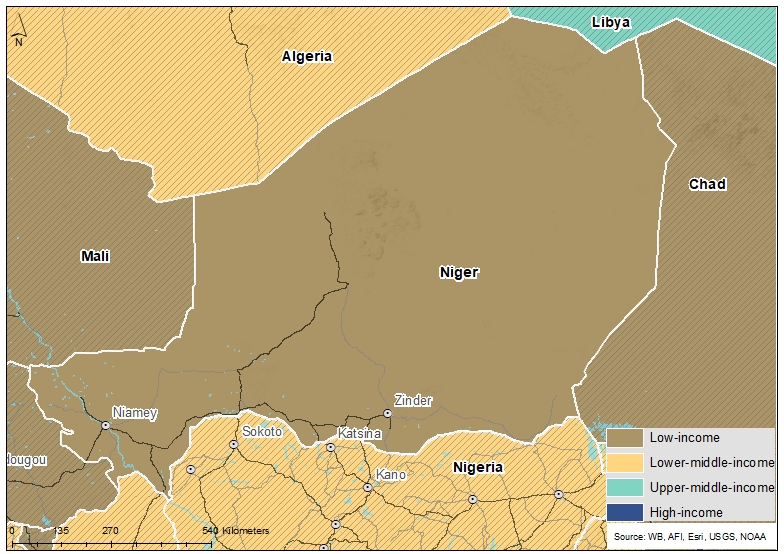
The Republic of Niger, or Niger, is a landlocked country in West Africa named after the Niger River, the country’s only perennial river that is about 550 km long. With a vast land area of almost 1 270 000 km2, it is the second largest landlocked country in West Africa behind Chad, its neighbour to the east. Niger is a unitary state bordered by Libya to the north-east, Nigeria to the south, Benin and Burkina Faso to the south-west, Mali to the west, and Algeria to the north-west.
Over 80% of Niger’s land area is arid and lies in the Sahara Desert. The remaining land areas are threatened by periodic drought and desertification. The country’s economy is dominated by subsistence agriculture, with some export agriculture in the more fertile south and the export of raw materials, especially uranium ore. Niger faces serious challenges to development due to its landlocked position, desert terrain, inefficient agriculture, explosive population growth, poor educational outcomes, deep-seated poverty, lack of infrastructure, poor healthcare, and environmental degradation.
Historically, what is now Niger has been on the fringes of several large states. Since independence, Nigeriens have lived under five constitutions and three periods of military rule. After the military coup in 2010, Niger became a democratic, multiparty state. Its new constitution, which restored the semi-presidential system of government of the 1999 constitution, in which the president and a prime minister named by the president share executive power, was approved on 31 October 2010.
In 2020, Mohamed Bazoum of the Nigerien Party for Democracy and Socialism was elected president in polls held in December 2020 and February 2021, which marked the first democratic transfer of power in Niger’s history. However, on 26 July 2023 the presidential guard detained President Bazoum and Presidential Guard commander General Abdourahamane Tchiani proclaimed himself the leader of a new military junta. In response to the coup, ECOWAS imposed sanctions on Niger, which then announced that it was leaving ECOWAS to pursue a confederation with Burkina Faso and Mali and that it intended to expand the Alliance of Sahel States (AES), established shortly after the coup. Niger subsequently decided to leave the G5 anti-jihadi force in the Sahel region and requested France to withdraw its 1 500 troops from the country.
Niger is technically still a member of the Economic Community of West African States (ECOWAS), although it has announced its withdrawal with immediate effect. The treaty requires a notification process of one year.
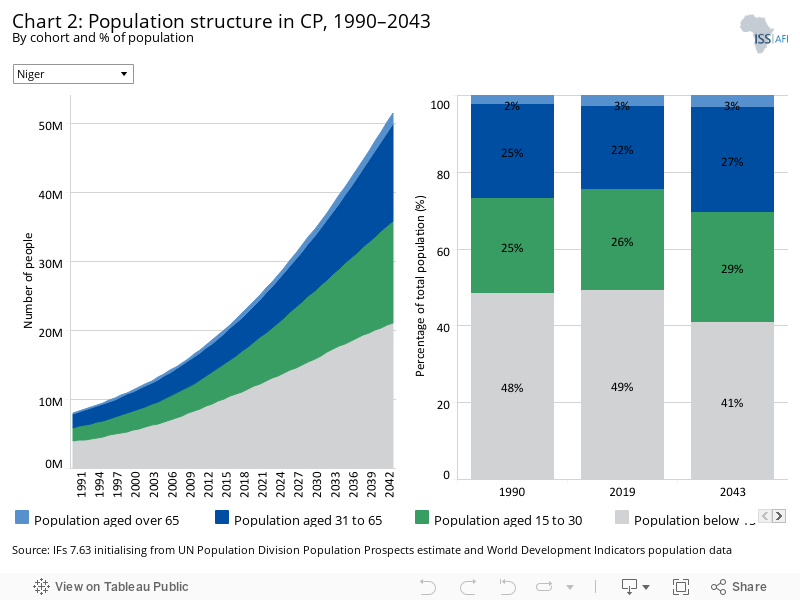
Niger has the fastest growing populations globally. Coming from a baseline of just over 8 million people in 1990, by 2019 the country’s population had increased almost threefold to 23.3 million people. Over the coming two decades, Niger’s population is expected to more than double and amount to 51.5 million people. In 2019, the population growth rate stood at 3.8%, the highest in the world when it comes to natural population growth. Population growth in Niger is driven by natural population growth, in other words, births outstripping deaths. The country has the highest average total fertility rate in the world.
Niger also has the world’s youngest population, followed by Somalia in East Africa and Mali in West Africa. In 2019, half of Niger’s population was younger than 15.3 compared to the average median age of 17.9 years for the group of Africa’s low-income economies. In the Current Path forecast, Niger’s demographic structure is expected to change only very slowly. Historically, the country’s fertility rate has been extremely high. In 2019, it stood at an average of 6.8 births per woman, the highest globally and significantly above the average of 4.9 for its low-income peer group. By 2043, Niger’s fertility rate is expected to drop to 4.04 births per woman. As a consequence, the median age is projected to increase to 19.3 years — still the second lowest globally to be preceded only by Chad. Even in 2043, close to 70% of Niger’s population is projected to be younger than 30.
The slow decrease in fertility rates contrasts with an expected above-average increase in life expectancy — a combination that accelerates Niger’s explosive population growth. In 2019, the country’s average life expectancy was 64.5 years. On average, women reached 65.7 years and men 63.2. The country’s low life expectancy stems from a high disease burden, driven to a large extent by low access levels to safe water and improved sanitation. With a rate of 5.3 deaths per 1 000 people, Niger’s communicable-disease burden is higher than the average rate of its African income peer group which is 4.1.
On the Current Path, the average citizen of Niger can expect to live to 73.6 years — a gain of almost 10 years over the coming two decades, which would lie above the 2043 average for Africa’s low-income economies (at 70.8 years). A higher life expectancy would be a boost to Niger’s workforce. By 2043, the country’s working-age cohort is expected to account for 55.9% of the population compared to 48.1 in 2019. The ratio of people of working age relative to the dependent population is improving, but too slowly. Niger is moving through the demographic transition in slow motion. In fact, on the Current Path, it is expected to reach the peak of its demographic ‘sweet spot’ only in 2084 (from 0.92 in 2019 to 2.16 in 2084), more than ten years later than the average of its low-income peer group and at the absolute global bottom.
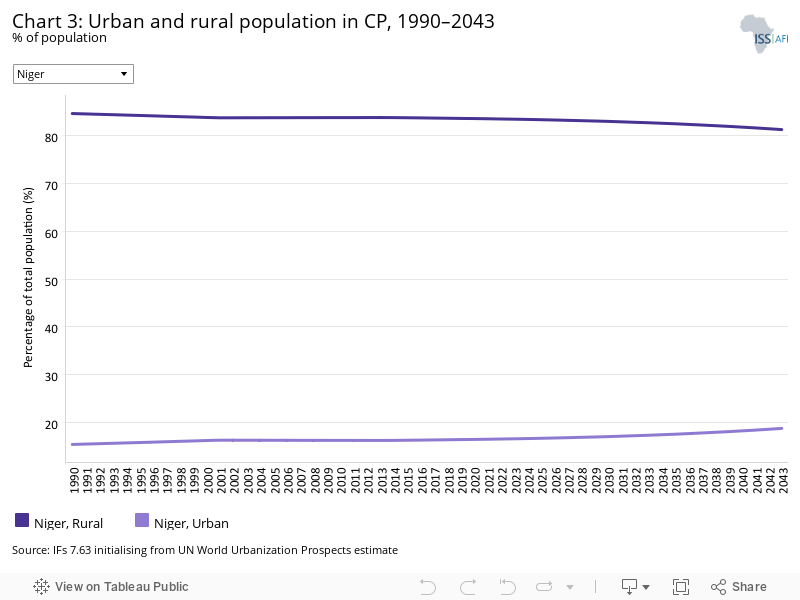
Niger is a latecomer to the global trend of urbanisation too. The overwhelming majority of the country’s population lives in rural areas. In 2019, this was 83.6% of the overall population while only 16.4% of the population lived in urban areas. This is an extraordinarily low rate of urbanisation. The average rate of urbanisation in the group of Africa’s low-income countries is 31% versus 69% living in rural areas. On the Current Path, Niger’s rate of urbanisation is expected to increase only modestly to 18.7% in 2043. Over 80% of its people are projected to continue to live in rural areas. The anticipated ratio for its low-income peer group on the continent is 40.7% urban versus 59% rural in 2043.
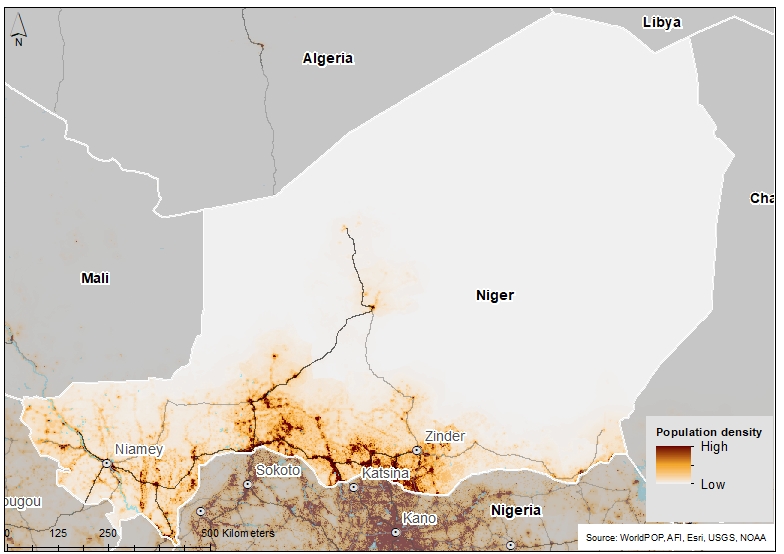
Niger’s population of about 23.3 million people mostly lives in clusters in the far south and west of the country. With 80% of the country’s land area being arid, population density is low. It is estimated that 94% of the population lives on just 35% of the land. Niger’s capital and largest city is Niamey, located in Niger's south-west corner on the River Niger. The second and third largest cities are Maradi and Zinder, respectively.
Niger is divided into seven regions and one capital district. These regions are subdivided into 36 departments that are broken down into urban and rural communes and administrative posts for largely uninhabited desert areas or military zones.
Nigerien society is ethnically diverse. The largest ethnic groups are the Hausa, who also represent the major ethnic group in neighbouring northern Nigeria, and the Zarma Songhai, who also live in parts of Mali. Both groups are sedentary farmers who inhabit the arable, southern part of Niger. The Kanuri (including Beriberi and Manga), on the other hand, make up the majority of the sedentary farmers in the far south-east. The remainder of the Nigerien people are nomadic or semi-nomadic livestock-raising peoples — Tuareg, Fulani, Toubou and Diffa Arabs.
Explosive population growth has led to increased competition over scarce natural resources, including violent conflict.
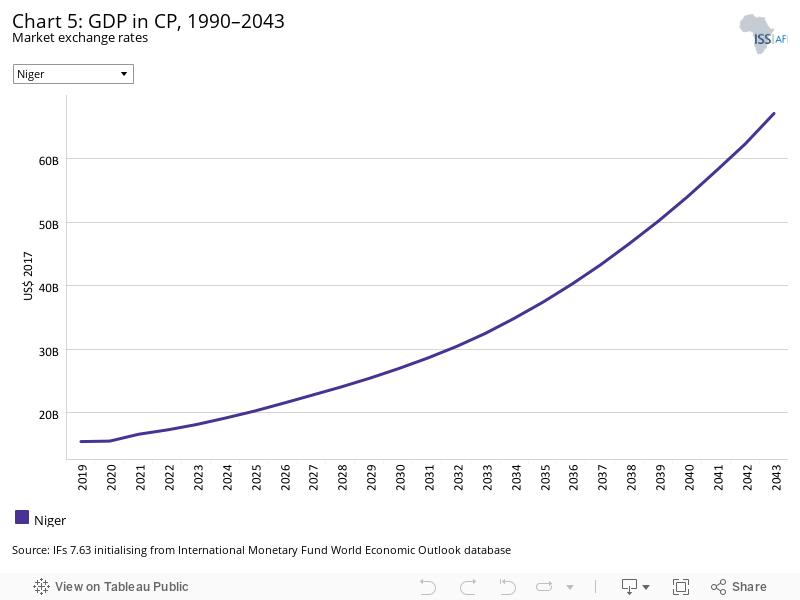
Between 1990 and 2019, Niger’s GDP increased more than threefold from US$4.9 billion in 1990 to US$15.5 billion in 2019. The country ranks tenth out of 23 African low-income economies with Sudan and Ethiopia being the lead economies. In 2043, Niger’s GDP is forecast to be US$67.1 billion, more than four times as large as in 2019. In other words, the economy is expected to expand, but with projected average annual growth rates of just over 7% at best over the coming two decades. Such expansion might be insufficient to significantly boost human development.
Niger’s economy is dominated by subsistence farming, livestock, and some of the world's largest uranium deposits. Drought cycles, desertification, explosive population growth, as well as the slash in global demand for uranium provoked by the COVID-19 pandemic are major obstacles.
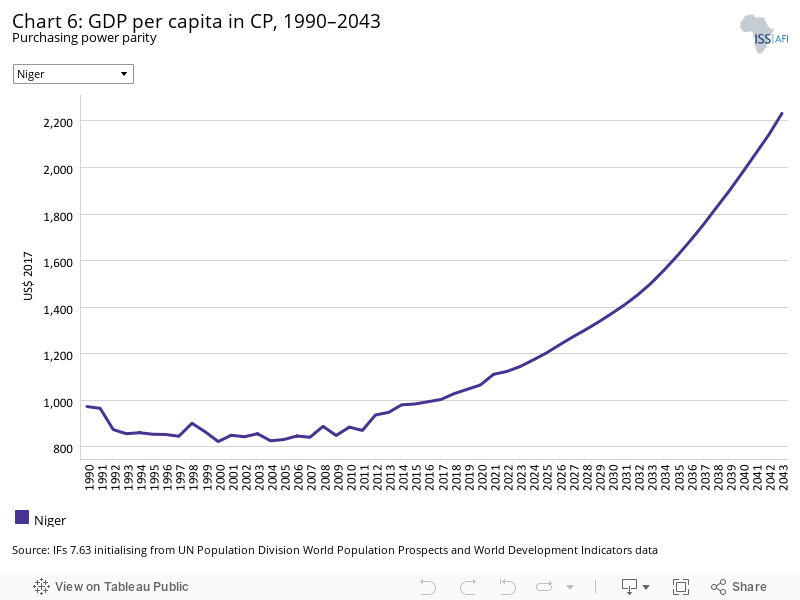
Although many of the charts in the sectoral scenarios also include GDP per capita, this overview is an essential point of departure for interpreting the general economic outlook of Niger.
In 2019, Niger’s GDP per capita ranked 19 out of 23 at a value of US$1 047 — US$570 below the average of its Africa low-income peer group. Only the Democratic Republic of Congo, Somalia, Central African Republic and Burundi had a lower GDP per capita than Niger in 2019. In the Current Path forecast, the country’s per capita income is expected to more than double to US$2 232 per capita by 2043, but it is projected to maintain its position within its peer group. In other words, Niger’s GDP per capita is expected to remain below the average for Africa low-income economies at USD$3 790.
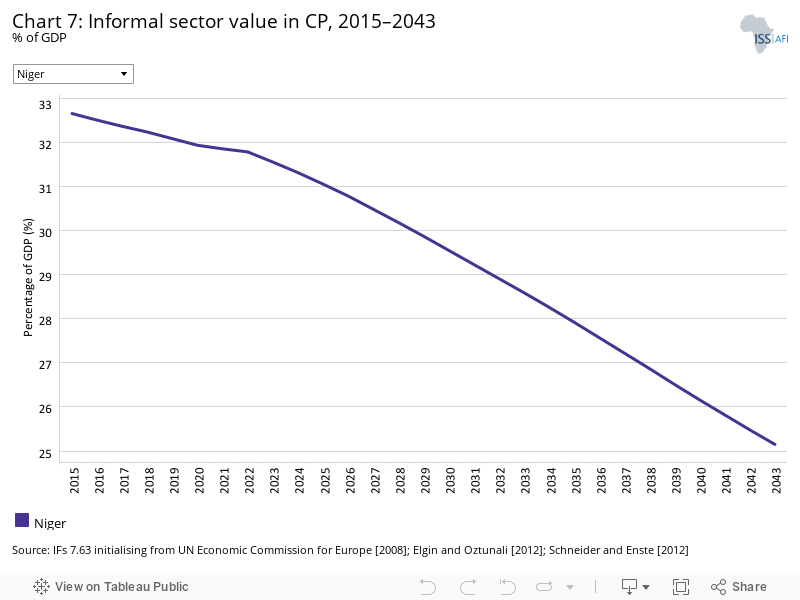
In 2019, Niger’s informal sector accounted for approximately 32.1% of GDP. On average, the informal sector accounted for about 30.1% of GDP in Africa’s low-income economies. By 2043, Niger’s informal sector is forecast to account for 25.1% of GDP likely reflecting the anticipated improvement in state capacity, including for taxation.
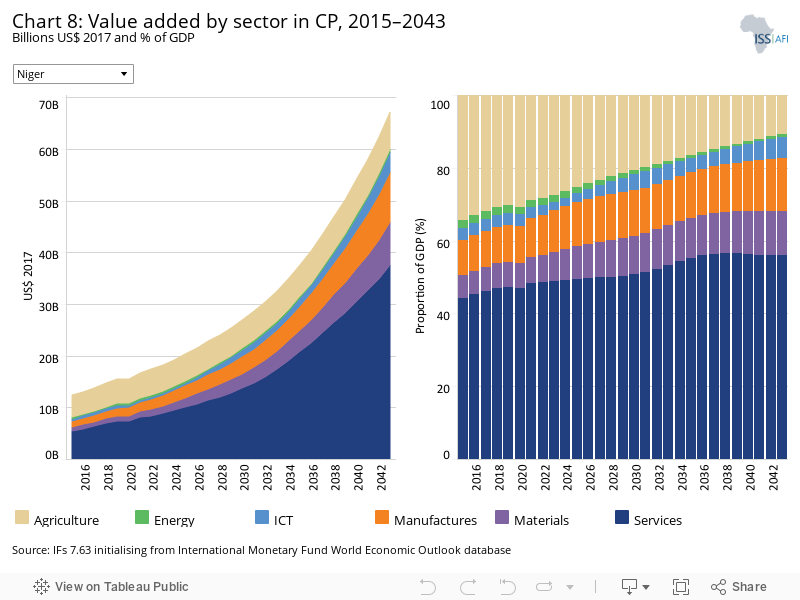
The IFs platform uses data from the Global Trade and Analysis Project (GTAP) to classify economic activity into six sectors: agriculture, energy, materials (including mining), manufacturing, services and information and communication technologies (ICT). Most other sources use a threefold distinction between only agriculture, industry and services with the result that data may differ.
In 2019, Niger’s service sector accounted for almost half (47.4%) of the country’s GDP (US$7.3 billion), followed by agriculture which represented close to 30.3% (US$4.69 billion). In the future, the service sector is expected to remain the most important contributor to Niger’s GDP. Its share is set to grow to almost 55.9% by 2043 at a value of US$37.51 billion. At the same time, the contribution of the agriculture sector is forecast to drop to just over 10.7% (US$7.17 billion). The manufacturing sector, on the other hand, at 10.2% in 2019 the third largest contributor to Niger’s GDP, is forecast to increase only modestly by 2.3 percentage points to 14.5% in 2043. This is synonymous with an expansion of its GDP contribution from US$1.58 billion in 2019 to almost US$9.73 billion in 2043.
Niger’s expected trajectory roughly mirrors that of its low-income peer group with the service sector representing both the current and future lion’s share of contribution to GDP, followed by the agriculture and manufacturing sectors, which are respectively expected to lose and gain ground.
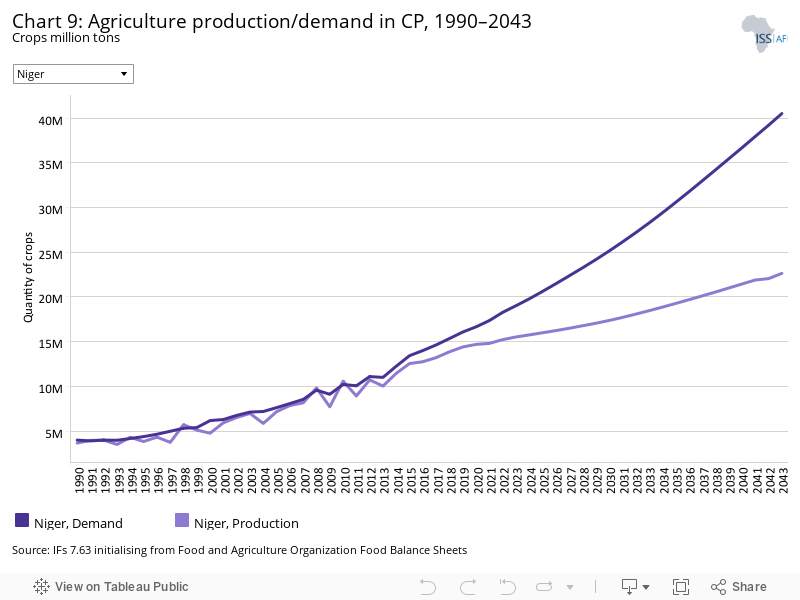
The data on agricultural production and demand in the IFs forecasting platform initialises from data provided on food balances by the Food and Agriculture Organization (FAO). IFs contains data on numerous types of agriculture but aggregates its forecast into crops, meat and fish, presented in million metric tons. Chart 9 shows agricultural production and demand as a total of all three categories.
At only 0.81 million metric tons per hectare in 2019, the country’s crop yield is the lowest within its low-income peer group on the continent. This reflects low productivity and low profitability. Rwanda, the frontrunner in this category, has more than ten times the crop yield of Niger. The average crop yield for Africa’s low-income economies in 2019 stood at 2.6 metric tons per hectare. By 2043, it is expected to increase to 3.5 metric tons per hectare compared to Niger’s at 1.03 metric tons per hectare.
The lion’s share of Niger’s agricultural output is crops. In 2019, the country’s crop production amounted to about 12.38 million metric tons compared to the average output of 13.82 million metric tons in its Africa low-income peer group. This gap is projected to widen by 2043 with Niger expected to increase its output to 15.7 million metric tons versus the group’s average output reaching 20.05 million metric tons.
More importantly, already at present, Niger’s agricultural production does not meet demand. In 2019, the gap between production and demand came to 1.67 million metric tons. By 2043, this gap is expected to widen to 17.87 metric tons. Agricultural demand is fuelled by Niger’s extremely fast-expanding population. In combination with low productivity, competition over scarce resources resulting in insecurity, as well as environmental degradation and high exposure to climate change-related risks, food insecurity is worsened.
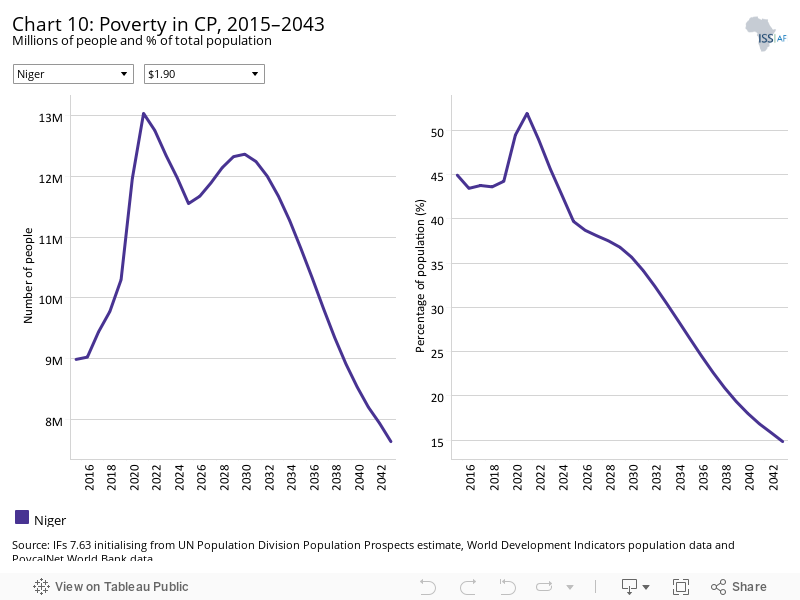
There are numerous methodologies for and approaches to defining poverty. We measure income poverty and use GDP per capita as a proxy. In 2015, the World Bank adopted the measure of US$1.90 per person per day (in 2011 international prices), also used to measure progress towards the achievement of Sustainable Development Goal (SDG) 1 of eradicating extreme poverty. To account for extreme poverty in richer countries occurring at slightly higher levels of income than in poor countries, the World Bank introduced three additional poverty lines in 2017:
- US$3.20 for lower middle-income countries
- US$5.50 for upper middle-income countries
- US$22.70 for high-income countries.
As a low-income country, Niger uses the US$1.90 benchmark to define extreme poverty. The country’s poverty burden is high. In 2019, 44.26% of the population was living below the poverty line, which corresponds to 10.3 million people. Niger’s poverty rate lies about 3.5 percentage points below the average of its low-income peer group on the continent (47.75%).
On the Current Path, the number of people living in extreme poverty in Niger is expected to drop to 7.64 million people by 2043. The country’s poverty rate is projected to decline to 14.76% by then — a drastic reduction by almost 70%. Over the same period, Africa’s low-income economies will on average reduce their poverty rates by 46.45%. In 2019, Niger had the ninth lowest poverty rate among Africa’s low-income economies. By 2043, it is expected to improve its position by three ranks.
Social welfare (government to household welfare transfers) in Niger is expected to increase from US$0.08 billion to US$1.93 billion in 2043.
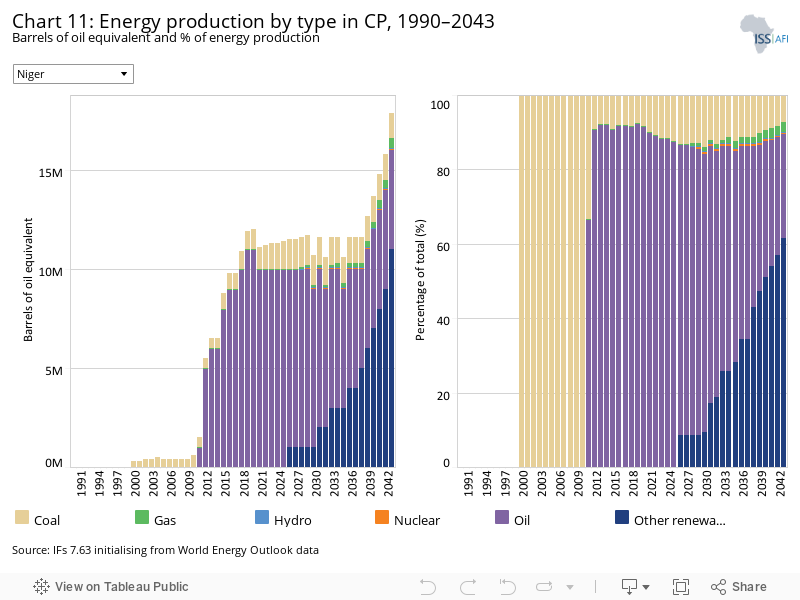
The IFs platform forecasts six types of energy, namely oil, gas, coal, hydro, nuclear and other renewables. To allow comparisons between different types of energy, the data is converted into billion barrels of oil equivalent (BBOE). The energy contained in a barrel of oil is approximately 5.8 million British thermal units (MBTUs) or 1 700 kilowatt-hours (kWh) of energy.
In 2019, Niger’s total energy production was about 0.0119 million barrels of oil. By 2043, it is estimated to increase to 0.0173 million barrels. The country’s current energy mix is heavily reliant on oil, which accounts for 92.4% of total production, followed by coal at 7.6%.
The Current Path forecast indicates a significant change in Niger’s energy mix in the future. From 2026 onwards, renewables are expected to take off to eventually account for 61.5% of total energy production. Oil is projected to drop to 27.9% of total production while the share of coal is projected to remain fairly steady. The share of gas, only playing a minor role in 2019, is expected to increase modestly to account for 2.8% by 2043.
The anticipated share of renewables in Niger’s energy production profile by far exceeds the average of 39% that is anticipated for Africa’s low-income economies. This can be explained by Niger’s significant renewable energy resources (mostly solar and wind) that can be exploited to power the growing economy.
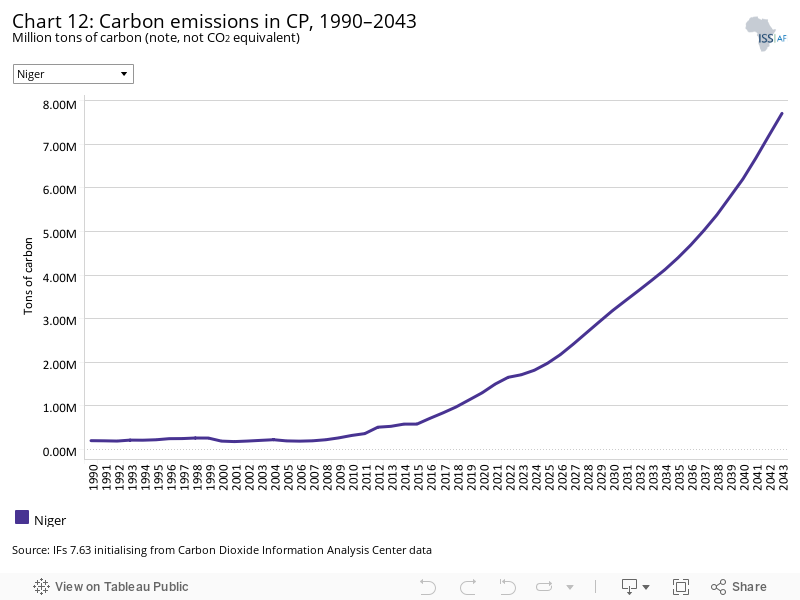
Carbon is released in many ways, but the three most important contributors to greenhouse gases are carbon dioxide (CO2), carbon monoxide (CO) and methane (CH4). Since each has a different molecular weight, IFs uses carbon. Many other sites and calculations use CO2 equivalent.
Niger’s emitted 1.14 million tons of carbon in 2019. Carbon emissions are forecast to increase almost sevenfold to 7.71 million tons by 2043, increasing 576.3% from a very low base between 2019 and 2043.
Sectoral Scenarios for Niger
Download to pdfThe Stability scenario represents reasonable but ambitious reductions in risk of regime instability and lower levels of internal conflict. Stability is generally a prerequisite for other aspects of development and this would encourage inflows of foreign direct investment (FDI) and improve business confidence. Better governance through the accountability that follows substantive democracy is modelled separately.
The intervention is explained here in the thematic part of the website.
The Stability scenario reflects significant interventions, including increasing regime stability, lowering levels of internal conflict, improving gender empowerment and addressing high levels of corruption.
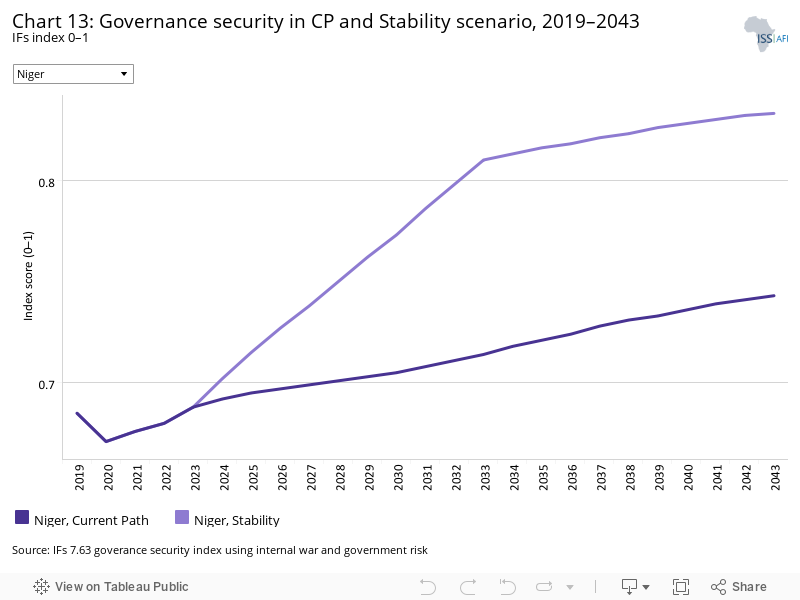
In 2019, Niger scored 0.69 on the governance security index, which was higher than the average score of 0.64 for its Africa low-income peer group. With a score of 0.76, Rwanda leads the group.
The broader Sahel crisis has been destabilising the region for more than ten years. Similar to its neighbours Mali and Burkina Faso, Niger faces several security challenges. These include the Boko Haram insurgency in the Lake Chad Basin, the Sahelian insurgency led by the Islamic State in the Greater Sahara (ISGS) in northern Tillaberi, and the Al-Qaeda-affiliated Jama’at Nusrat al-Islam (JNIM) activity in south-western Tillaberi.
ACLED summarises: ‘Since early 2021, the country has been marked by significant instability — militants believed to be ISGS have killed an estimated 390 people in various parts of the Tillaberi region and neighboring Tahoua. A series of large-scale killings targeting civilians of Djerma and Tuareg ethnicity resulted in most of the deaths reported.’
In the Stability scenario, governance security in Niger is projected to improve to a score of 0.83 by 2043 compared to 0.74 on the Current Path. Niger is on par with the projected average of 0.83 for its peer group in Africa in 2043.
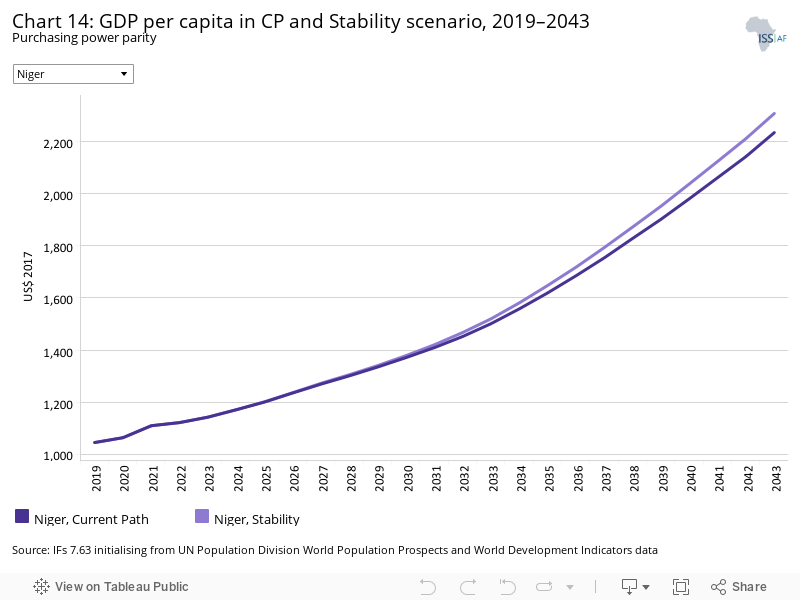
In 2019, Niger’s GDP per capita was US$1 047. Given the high levels of insecurity in the country, it is not surprising that the Stability scenario can make a significant difference by increasing GDP per capita to US$2 305 by 2043 — a 120% increase between 2019 and 2043 compared to the 113% increase in the Current Path forecast over the same period. Still, Niger’s GDP per capita is projected to lag behind the average of its peer low-income group at US$3 975 in 2043 in the same scenario. The GDP per capita of the continent’s low-income economies is projected to have grown by 139% by 2043 in the Stability scenario.
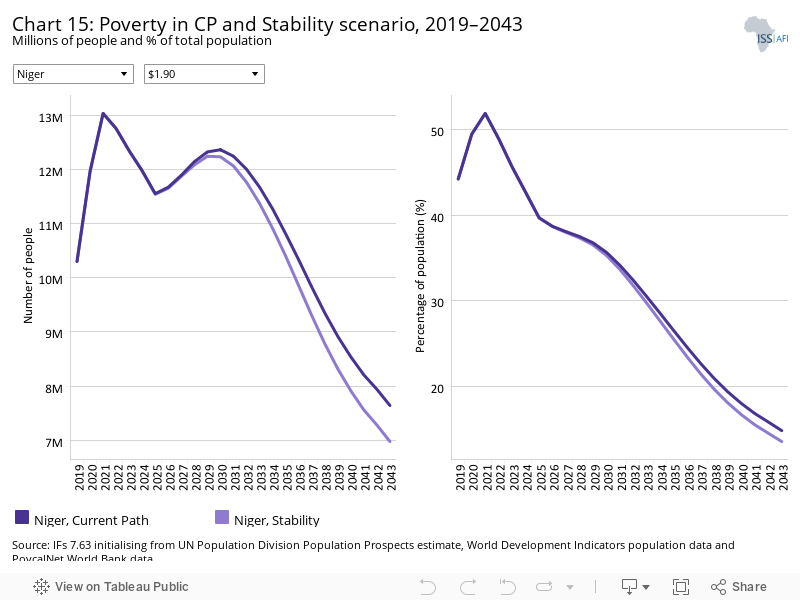
As a low-income economy, Niger uses the US$1.90 benchmark to define extreme poverty. The Stability scenario has the potential to reduce the number of people living in extreme poverty from 10.3 million in 2019 to 7 million people in 2043 — a difference of about 700 000 people compared to the Current Path forecast.
In the Stability scenario, Niger’s poverty rate could drop from 44.26% in 2019 to 13.56% in 2043, compared to 14.84% in the Current Path forecast. In other words, with the interventions included in the Stability scenario, Niger could speed up its poverty reduction efforts.
This section presents the impact of a Demographic scenario that aims to hasten and increase the demographic dividend through reasonable but ambitious reductions in the communicable-disease burden for children under five, the maternal mortality ratio and increased access to modern contraception.
The intervention is explained here in the thematic part of the website.
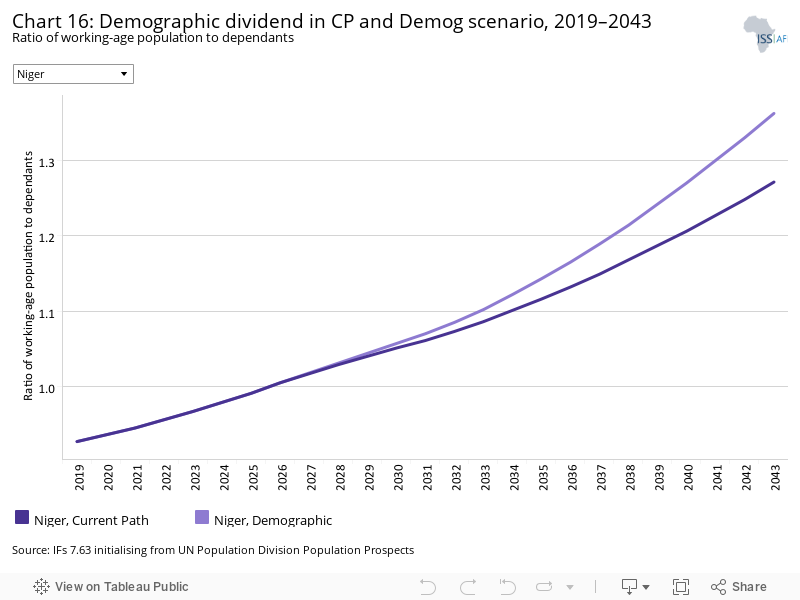
Demographers typically differentiate between a first, second and even a third demographic dividend. We focus here on the contribution of the size of the labour force (between 15 and 64 years of age) relative to dependants (children and the elderly) as part of the first dividend. A window of opportunity opens when the ratio of the working-age population to dependants is equal to or surpasses 1.7.
Increasing access to modern contraception will have a dramatic impact on Niger’s total fertility rate which could drop by almost 50% from 6.8 births per woman in 2019 to 3.55 in 2043. On the Current Path, it would take the country roughly two more decades to reach a comparable fertility rate. A lower total fertility rate would slow down Niger’s population growth and change the population age structure, resulting in a more favourable ratio between people of working age and dependants, especially children. In the interventions in the Demographic scenario, Niger has the potential to accelerate its demographic transition by increasing the ratio between workers and dependants from 0.93 in 2019 to 1.36 in 2043 compared to 1.27 on the Current Path. Arriving at the ‘demographic sweet spot’, however, remains out of reach for Niger. In contrast, Africa’s low-income economies would on average get there by 2042 already (from 1.53 in 2019 to 1.74 in 2043).
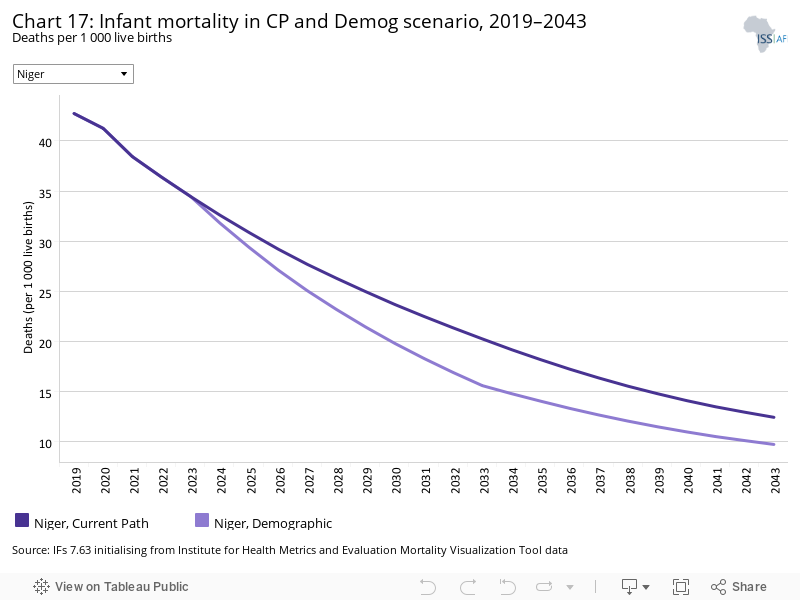
The infant mortality rate is the number of infant deaths per 1 000 live births and is an important marker of the overall quality of the health system in a country.
At 42.7 infant deaths per 1 000 live births, infant mortality in Niger is high, although it has improved drastically since 1990 when it stood at a rate of 129.2. In fact, Niger outperforms its low-income peer group with an average of 48.46 infant deaths per 1 000 live births, having the seventh lowest infant mortality rate in that group. The Demographic scenario could reduce Niger’s infant mortality rate to 9.7 deaths per 1 000 live births by 2043 compared to 12.39 deaths in the Current Path forecast. In the same scenario, the average low-income country in Africa would achieve a rate of 16.9 by 2043.
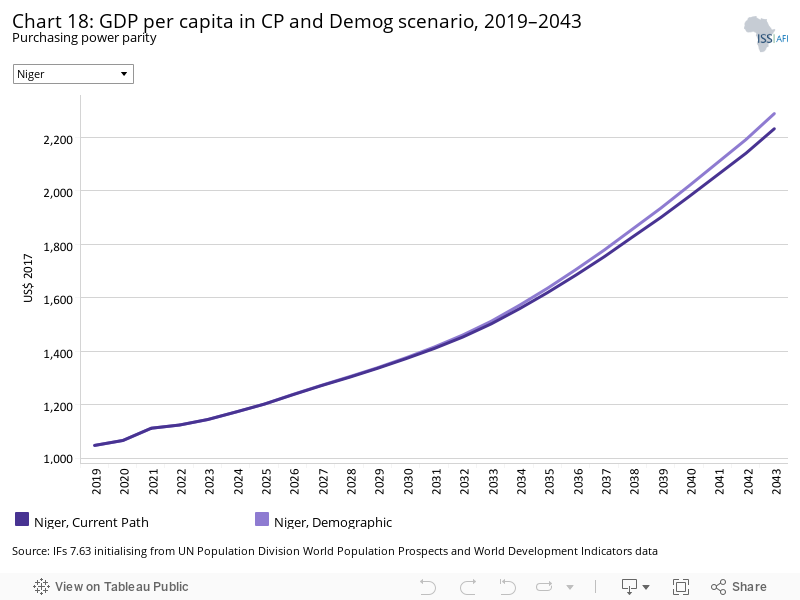
In 2019, Niger’s GDP per capita was US$1 047. In the Demographic scenario, Niger’s GDP per capita is expected to increase to US$2 289 by 2043. The existing gap between the country’s GDP per capita and the expected average GDP per capita of its Africa low-income peer group is set to remain in place. The latter is expected to have an average GDP per capita of US$3 925 in 2043 in the Demographic scenario.
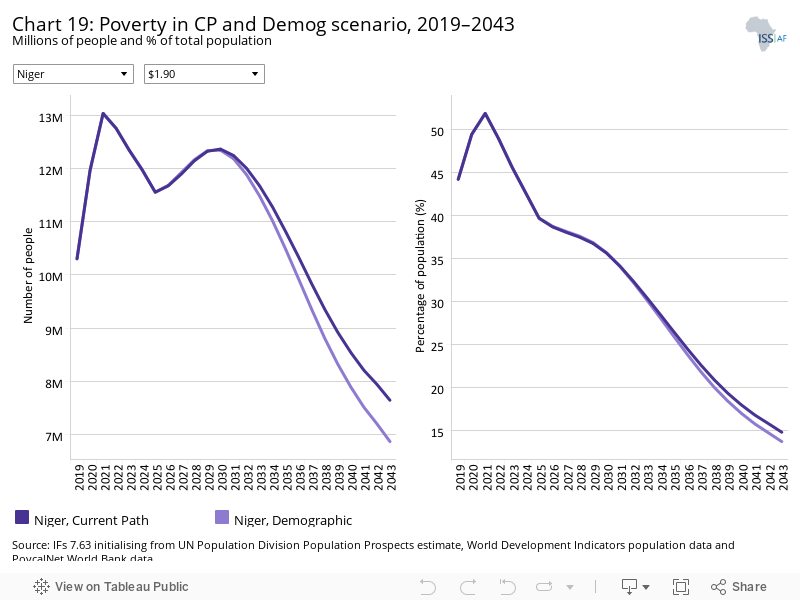
Compared to the Current Path, the Demographic scenario could reduce the number of people living in extreme poverty by 770 000 in 2043. An expected total of 6.98 million people or 13.75% of the population would be living below the poverty line by 2043 compared to 14.84% in the Current Path. Niger will continue to perform above the average of its low-income peers. On average, the group of Africa’s low-income economies is projected to have a poverty rate of 23.67% in the Demographic scenario.
This section presents reasonable but ambitious improvements in the Health/WaSH scenario, which include reductions in the mortality rate associated with both communicable diseases (e.g. AIDS, diarrhoea, malaria and respiratory infections) and non-communicable diseases (NCDs) (e.g. diabetes), as well as improvements in access to safe water and better sanitation. The acronym WaSH stands for water, sanitation and hygiene.
The intervention is explained here in the thematic part of the website.
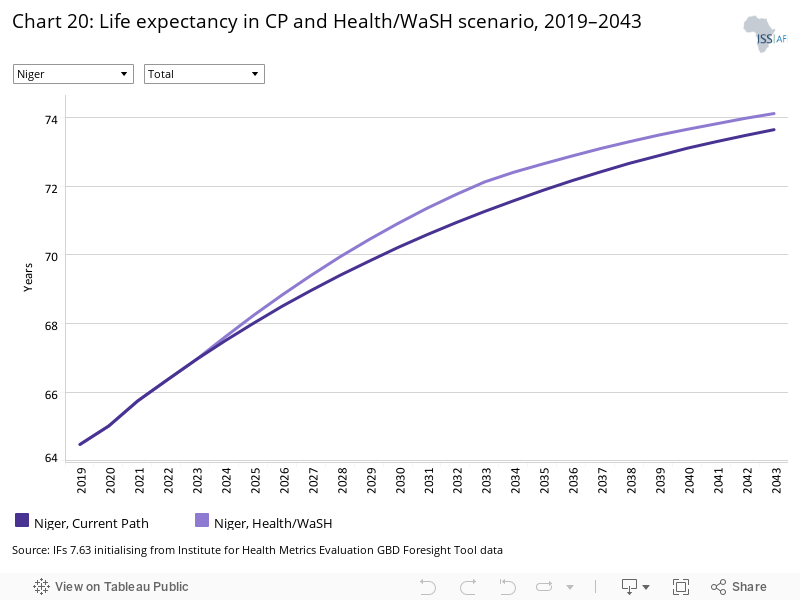
The Health/WaSH scenario has the potential to increase life expectancy in Niger from 64.48 years in 2019 to 74.12 years in 2043, compared to 73.65 years on the Current Path. The country would especially benefit from the interventions in the medium term. By 2033, the difference in the gain in life expectancy between the Current Path forecast and the Health/WaSH scenario comes close to a year. As in the case of infant mortality, Niger performs better in life expectancy than the average African low-income economy with a baseline of 63.78 years that is projected to increase to 70.85 years on the Current Path and to 70.85 years in the Health/WaSH scenario.
The Health/WaSH scenario will also have a positive impact on Niger’s infant mortality rate. It could drop to 10.78 deaths per live births by 2043 compared to an expected rate of 12.39 on the Current Path. Niger does better in infant mortality than the average low-income economy in Africa which is expected to record an infant mortality rate of 21.29 infant deaths per 1 000 live births on the Current Path and of 18.85 in the Health/WaSH scenario. In fact, in the latter, Niger’s projected infant mortality rate of 10.78 infant deaths per 1 000 live births will be similar to the average rate of Africa’s high-income economies in 2019 (9.78 infant deaths per 1000 live births).
The Agriculture scenario represents reasonable but ambitious increases in yields per hectare (reflecting better management and seed and fertiliser technology), increased land under irrigation and reduced loss and waste. Where appropriate, it includes an increase in calorie consumption, reflecting the prioritisation of food self-sufficiency above food exports as a desirable policy objective.
The intervention is explained here in the thematic part of the website.
The data on yield per hectare (in metric tons) is for crops but does not distinguish between different categories of crops.
In 2019, yield in Niger stood at 0.81 metric tons per hectare which is relatively low compared to the average of 2.66 metric tons per hectare for its low-income peer group. According to the Current Path forecast, by 2043, yield in Niger is expected to increase modestly to 1.05 metric tons per hectare — an increase by 30.3%. In the Agriculture scenario, on the other hand, yield could more than double over the same time period and amount to 1.91 metric tons per hectare.
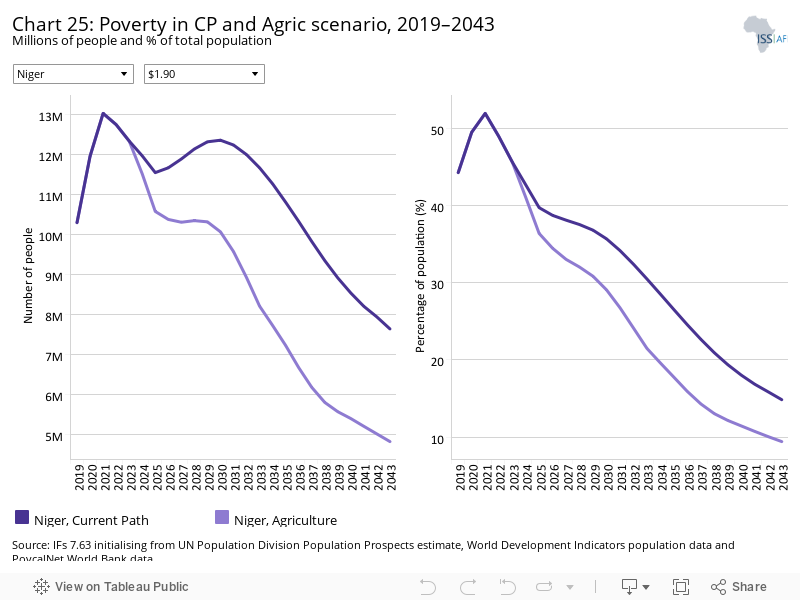
Already in 2019, agricultural demand in Niger exceeded production resulting in import dependence. More specifically, net agricultural imports accounted for 11.66% of the country’s demand. On the Current Path, the gap between demand and production is projected to increase because demand is increasingly outpacing production. This is set to lead to greater import dependence. By 2043, net agricultural imports are expected to account for 45.09% of agricultural demand by 2043. The Agriculture scenario has the potential to counter the rapid increase in demand due to population growth. By 2043, imports would account for 10.39% of demand, a little lower than 2019 levels.
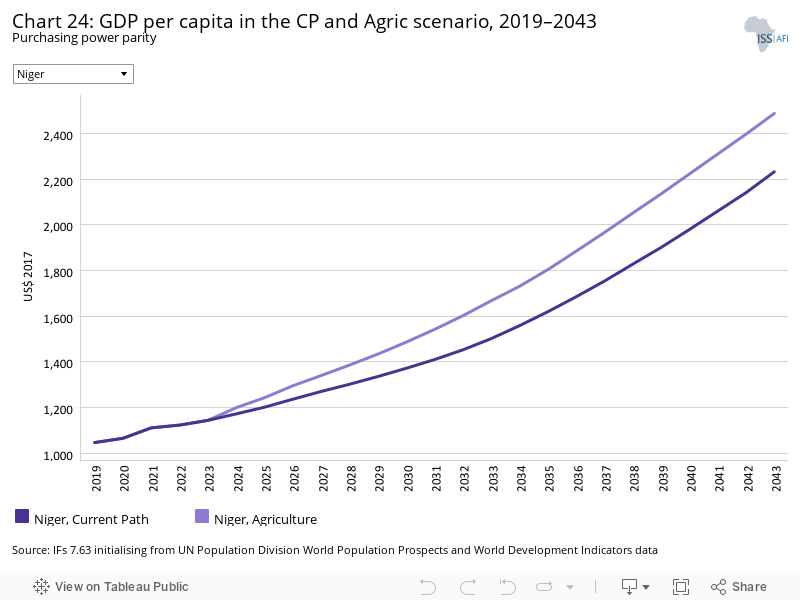
The Agriculture scenario is expected to push Niger’s GDP per capita to US$2 487 by 2043 compared to the Current Path forecast of US$2 232. Despite this boost, Niger’s GDP per capita is projected to remain below the average of its Africa low-income peer economies set to reach US$4 094 in the Agriculture scenario.
The impact of the interventions in the Agriculture scenario on poverty in Niger is a reduction in the share of the population living below the poverty line in 2043 — 9.41% instead of 14.84% in the Current Path forecast. The Agriculture scenario has the potential to prevent 2.8 million people falling into poverty by 2043, with the anticipated total being 4.83 million people compared to 7.643 in the Current Path forecast. Niger performs above average compared to its low-income country peer group with an average share of 18.27% of the population living below the poverty line.
The Education scenario represents reasonable but ambitious improved intake, transition and graduation rates from primary to tertiary levels and better quality of education. It also models substantive progress towards gender parity at all levels, additional vocational training at secondary school level and increases in the share of science and engineering graduates.
The intervention is explained here in the thematic part of the website.
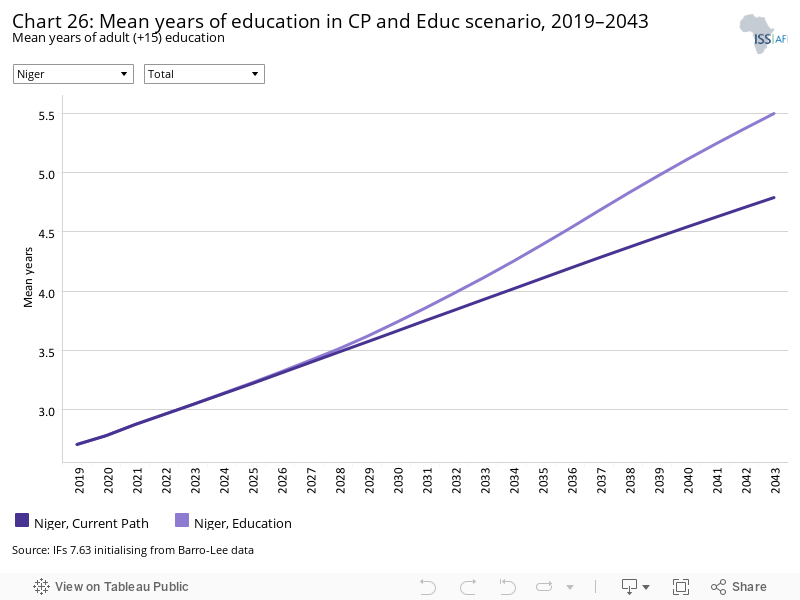
With a mean of 2.7 years of education among the adult population in 2019, Niger’s educational outcomes are extremely poor. Educational outcomes for girls are even worse with a mean of 2.1 years. According to UNICEF, ‘geographic gaps in school coverage and poor retention rates remain unaddressed, quality has worsened, and inequities have deepened, with the poorest and rural children least likely to attend school’.
The Education scenario has the potential to increase Niger’s mean years of education to 5.5 years by 2043. This represents an improvement of 0.7 years compared to the Current Path forecast of 4.8 years in 2043. Female education outcomes would still lag behind those for males (5.1 versus 5.9 mean years of education, respectively). Globally, Niger ranks last educational performance measured in mean years of education. Together with Mali it is the only African low-income country with a mean below 3 years of education, which means that most Nigeriens will not have primary education by 2043. The average mean for the group is 4.4 years of education in 2019. By 2043, this will increase to 6.1 years on the Current Path and to 6.6 years in the Education scenario.
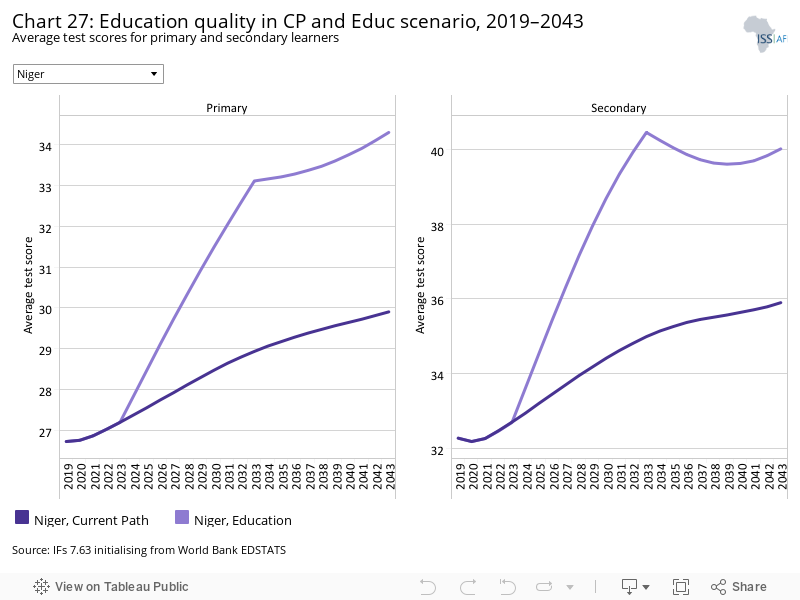
Niger’s primary test score in 2019 was 26.7%. According to the Current Path forecast, it will improve to 29.9% in 2043. The Education scenario is expected to accelerate improvements, pushing average test scores for primary learners to 34.3% by 2043 — an increase by 4.4 percentage points compared to the Current Path forecast.
In the Education scenario, the test score at the secondary level could increase by 4.1 percentage points from 32.2% in 2019 to 40% in 2043 versus 35.9% in the Current Path scenario.
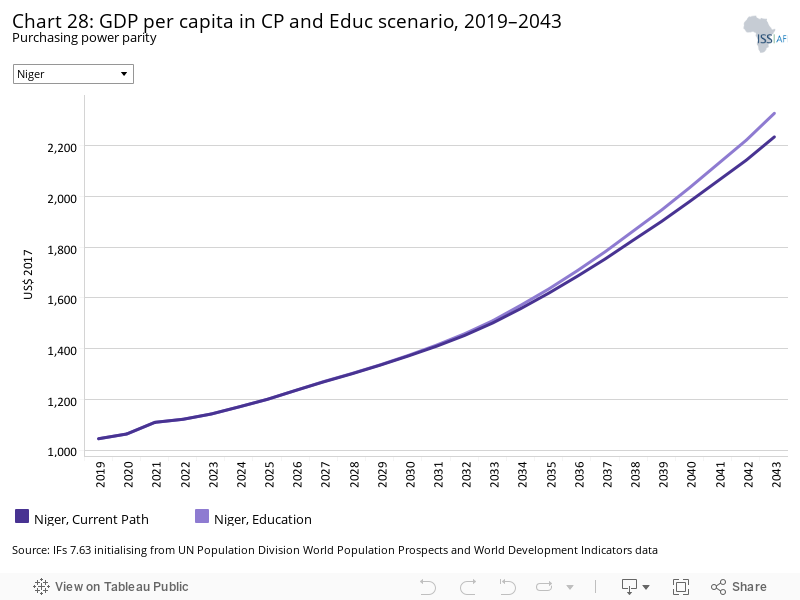
Niger’s GDP per capita will increase to US$2 232 on the Current Path compared to US$2 325 in the Education scenario in 2043 (a difference of US$93). The country’s GDP per capita is forecast to continue to lag behind the average GDP per capita for Africa’s lower middle-income economies. In the Education scenario, the latter is projected to reach US$3 923 by 2043.
In the Education scenario, it is expected that 12.51% of Niger’s population will live in extreme poverty by 2043, down from 44.26% in 2019 and compared to 14.84% according to the Current Path forecast. This translates to a projected total of 6.392 million poor people in 2043 — 1.25 million fewer than in the Current Path forecast.
The Manufacturing/Transfers scenario represents reasonable but ambitious manufacturing growth through greater investment in the economy, investments in research and development, and promotion of the export of manufactured goods. It is accompanied by an increase in welfare transfers (social grants) to moderate the initial increases in inequality that are typically associated with a manufacturing transition. To this end, the scenario improves tax administration and increases government revenues.
The intervention is explained here in the thematic part of the website.
Chart 30 should be read with Chart 8 that presents a stacked area graph on the contribution to GDP and size, in billion US$, of the Current Path economy for each of the sectors.
In the Manufacturing/Transfers scenario, the service sector will experience the largest gain in terms of its relative contribution to GDP. Its contribution is expected to have increased by 0.59 percentage points in 2043. The service sector is followed by the manufacturing sector that is projected to see its relative contribution to GDP increase by 0.49 in 2043. It needs to be noted, however, that the trend for both the relative contribution of services and manufacturing to GDP does not follow a linear development.
The value of the service sector is forecast to increase by US$18.2 billion in the Manufacturing/Transfers scenario compared to the Current Path forecast. The Manufacturing/Transfers scenario has the potential for the manufacturing sector to contribute US$6.82 billion more to the economy by 2043 compared to the Current Path. The ICT sector is expected to contribute an additional US$2.1 million in this scenario.
In the Manufacturing/Transfers scenario, government to household welfare transfers are forecast to increase from US$0.08 billion in 2019 to US$3.61 billion in 2043 — a massive increase over the coming two decades. This corresponds to a jump from about 0.75% to 6.48% of GDP. In the Current Path, government to household transfers are expected to grow at a much slower rate reaching US$1.93 billion in 2043, which corresponds to 4.39% of GDP.
Low-income Africa as a group comes from a higher average baseline. Government to household welfare transfers accounted for 2.2% of GDP in 2019. In 2043, they are likely to account for 4.65% and 2.05% of GDP in the Current Path and the Manufacturing/Transfers scenario, respectively.
Niger’s GDP per capita is expected to increase by US$150 in the Manufacturing/Transfers scenario compared to the Current Path (US$2 382 versus US$2 232) in 2043. In the Manufacture/Transfers scenario, Niger’s 2043 GDP per capita is projected to be more than 68% lower than the average GDP per capita of its low-income peer group. The 69% gap that exists on the Current Path is therefore set to reduce only marginally.
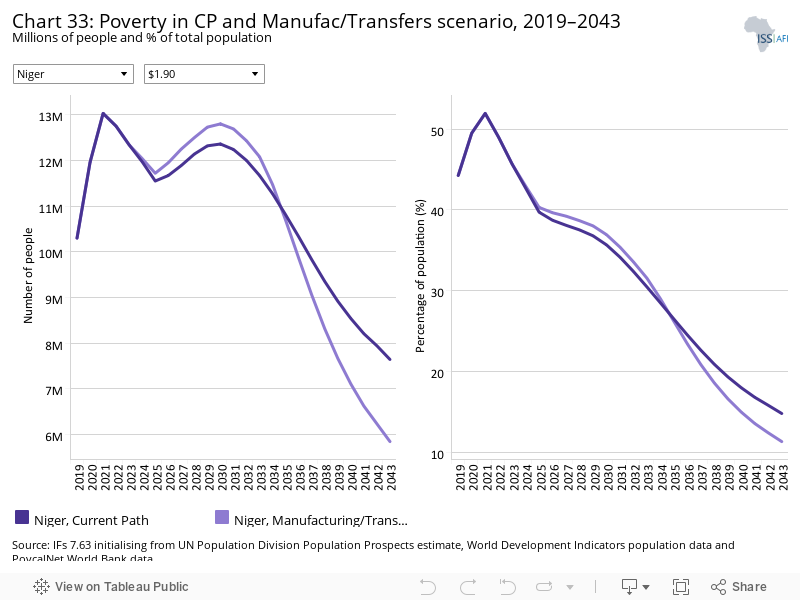
For Niger, the Manufacturing/Transfers scenario has the potential to reduce the share of the population living in extreme poverty from 44.26% in 2019 to 11.37% in 2043 compared to 14.84% in the Current Path forecast. This is a 3.47 percentage points improvement that would translate to about 1.8 million people escaping poverty in 2043 through the interventions in the Manufacturing/Transfers scenario. Niger’s poverty rate would be about half of the average poverty rate in its Africa low-income peer group: 11.37% compared to 22.23% in the Manufacturing/Transfers scenario.
The Leapfrogging scenario represents a reasonable but ambitious adoption of and investment in renewable energy technologies, resulting in better access to electricity in urban and rural areas. The scenario includes accelerated access to mobile and fixed broadband and the adoption of modern technology that improves government efficiency and allows for the more rapid formalisation of the informal sector.
The intervention is explained here in the thematic part of the website.
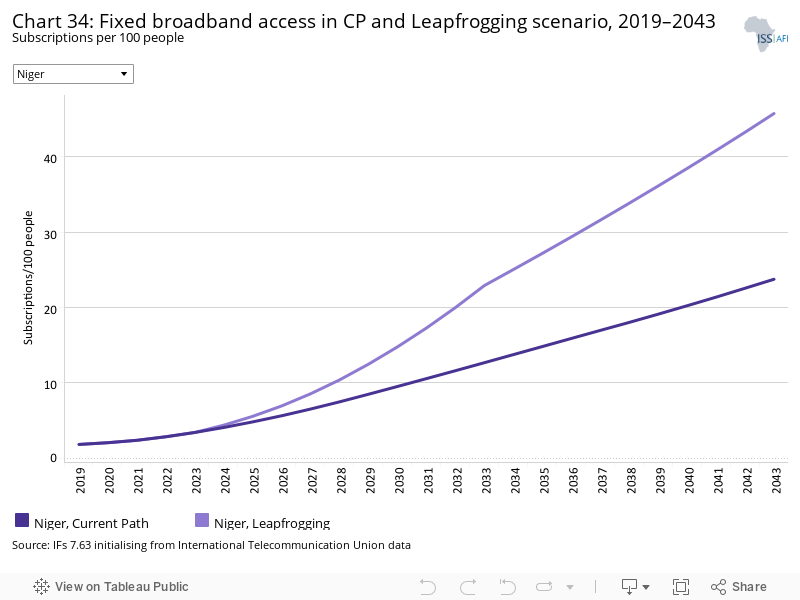
Fixed broadband includes cable modem Internet connections, DSL Internet connections of at least 256 KB/s, fibre and other fixed broadband technology connections (such as satellite broadband Internet, ethernet local area networks, fixed-wireless access, wireless local area networks, WiMAX, etc.).
Niger, like most low-income African economies, had a very low fixed broadband rate of 1.84 subscriptions per 100 people in 2019. In the Leapfrogging scenario, by 2043, fixed broadband is set to increase to 45.71 subscriptions per 100 people versus 23.74 on the Current Path. Regarding fixed broadband subscriptions, Niger performs below the average of its income peer group. The latter recorded an average of 2.27 subscriptions in 2019 — a rate that by 2043 could increase to 48.25 in the Leapfrogging scenario, or to 28.9 in the Current Path forecast.
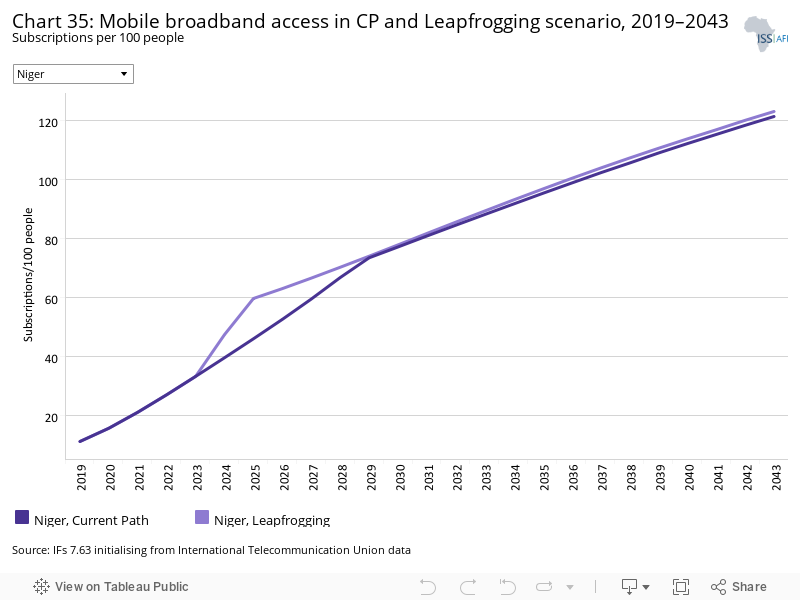
Mobile broadband refers to wireless Internet access delivered through cellular towers to computers and other digital devices.
In 2019, Niger had 11.5 mobile broadband subscriptions per 100 people, a rate that is significantly lower than the group average of 22.93 subscriptions per 100 people for Africa’s low-income economies. In fact, Niger ranks 17th out of 23 in this group.
The Leapfrogging scenario has the potential to help Niger make up some ground, although it is unlikely to match the expected average subscription rate of its low-income peer group. Mobile broadband in Niger is projected to increase to 123.10 subscriptions per 100 people by 2043, compared to 121.4 subscriptions on the Current Path — a relatively small difference. The greatest benefit of the interventions in the Leapfrogging scenario plays out in the medium term around 2024/25 when projected subscriptions are indeed tangibly higher than in the Current Path forecast. In other words, mobile broadband subscriptions in Niger are expected to increase either way but more quickly in the Leapfrogging scenario.
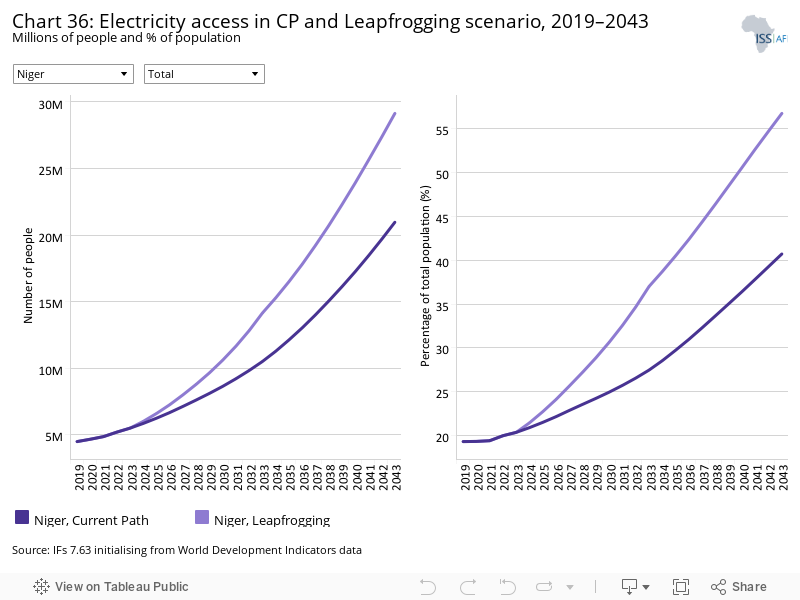
Access to electricity remains a key challenge for Niger. With a severely underdeveloped power infrastructure, the country relies heavily on importing electricity from neighbouring Nigeria. Historically, Niger has been importing electricity at very low prices, which has not incentivised boosting its own much needed generation capacity.
In 2019, only 19.34% of Niger’s population had access to electricity. In fact, Niger ranks 20th out of Africa’s 23 low-income economies on access to electricity. At 32.17% the Leapfrogging scenario has an average access rate that is almost 10 percentage points higher. In the Current Path scenario, 40.7% of Nigeriens are expected to have access to electricity by 2043, whereas in the Leapfrogging scenario, access to electricity is projected to expand faster, providing access to 56.7% of the population by 2043. Niger will not be in a position to catch up with its peers, however. On average, its low-income peer group will have an access level of 75.05% in the Leapfrogging scenario; almost 20 percentage points above Niger’s expected rate.
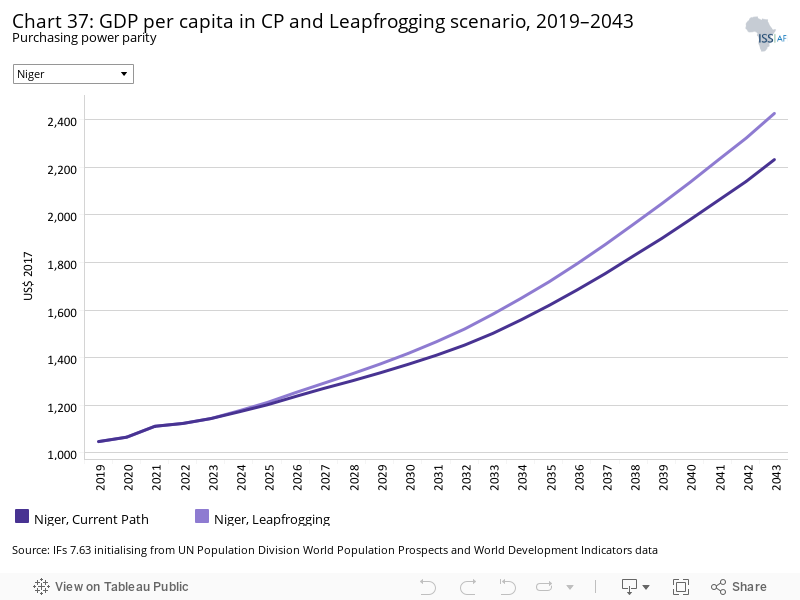
In the Leapfrogging scenario, Niger’s GDP per capita is expected to experience a larger increase than on the Current Path: from US$1 047 in 2019 to US$2 426, compared to from US$1 047 to US$2 232, respectively. In the Leapfrogging scenario, Niger’s projected future GDP per capita will still be significantly lower than the projected average for Africa’s low-income economies at US$4 130 by 2043.
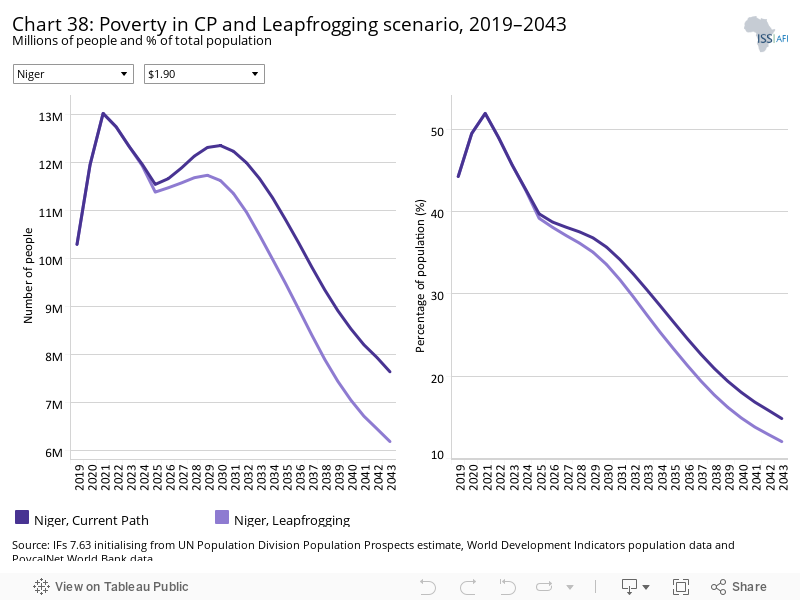
The interventions in the Leapfrogging scenario are projected to benefit poverty reduction efforts in Niger. The share of the population living below the poverty line could drop from 44.26% to 12.04% by 2043 compared to 14.84% on the Current Path trajectory — a gain of close to 3 percentage points. When assessing absolute numbers, the Leapfrogging scenario would reduce the number of people living in poverty to 6.19 million versus the projected 7.64 million in the Current Path forecast. In other words, 1.45 million Nigeriens would escape poverty in the Leapfrogging scenario.
The Free Trade scenario represents the impact of the full implementation of the African Continental Free Trade Area (AfCFTA) by 2034 through increases in exports, improved productivity and increased trade and economic freedom.
The intervention is explained here in the thematic part of the website.
The trade balance is the difference between the value of a country's exports and its imports. A country that imports more goods and services than it exports in terms of value has a trade deficit, while a country that exports more goods and services than it imports has a trade surplus.
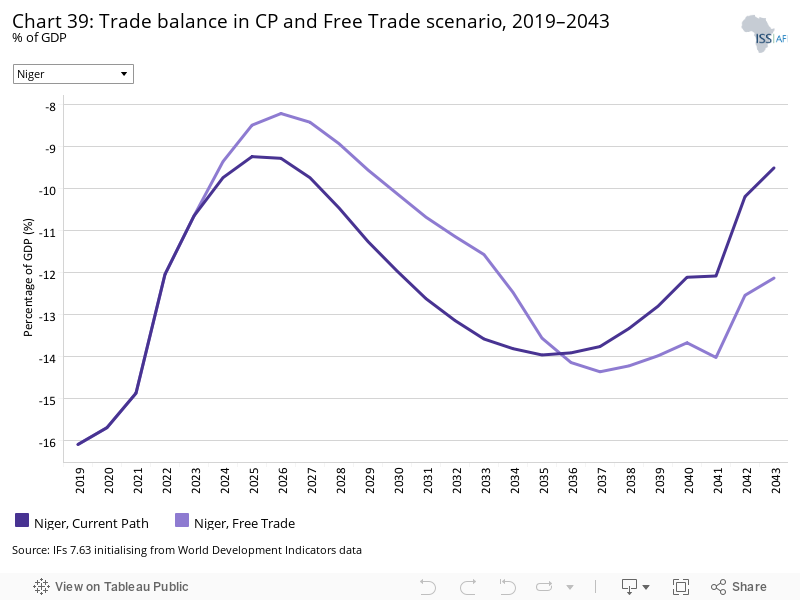
In 2019, Niger had a trade deficit that accounted for 16.1% of GDP. In the Free Trade scenario, the country’s trade balance is set to improve with the deficit accounting for 8.22% of GDP by 2026 before worsening again to 14.7% by 2037, and finally settling at 12.4% of GDP in 2043 versus 9.52% in the Current Path forecast. Essentially, in any case, Niger is expected to have a negative trade balance by 2043, but in the Free Trade scenario the deficit would be higher than in the Current Path forecast.
However, the implementation of the AfCFTA in the Free Trade scenario would improve the short- and medium-term trade deficit for Niger compared to the Current Path forecast. With the removal of trade restrictions, following a trade liberalisation, it becomes easier to import while Niger firms face intense competition on the export markets. However, only trade balance is not a viable indicator to conclude that Niger will be a loser in the implementation of AfCFTA, other indicators need to be considered.
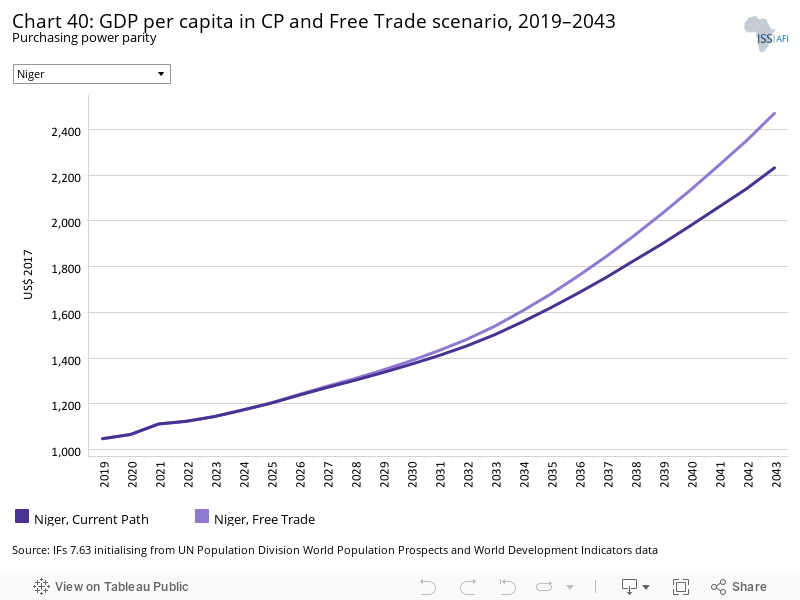
In the Free Trade scenario, Niger’s GDP per capita is expected to experience a larger increase than on the Current Path: from US$1 047 in 2019 to US$2 471 versus from US$1 047 to US$2 232, respectively. In the Free Trade scenario, Niger’s projected future GDP per capita will still be significantly lower than the projected average for Africa’s low-income economies at US$4 255 in the Free Trade scenario or US$3 790 in the Current Path forecast by 2043.
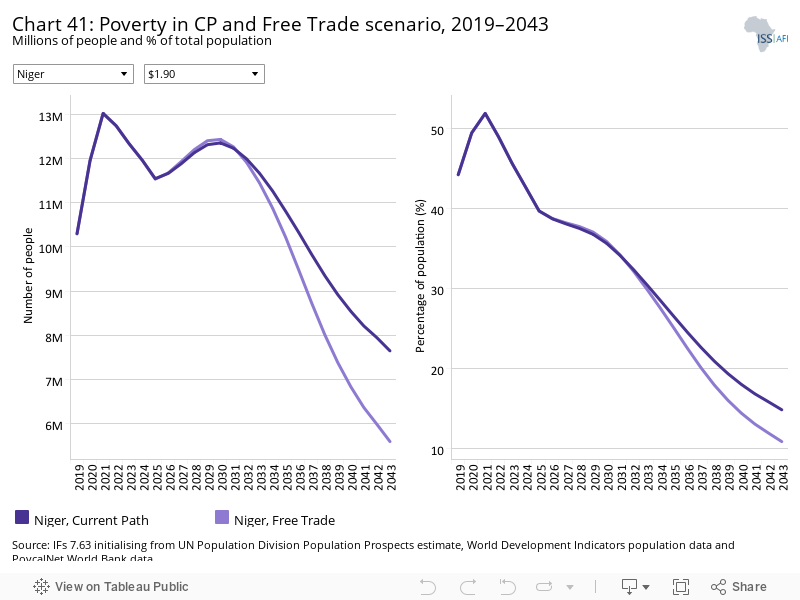
Trade openness will reduce poverty in the long term after initially increasing it due to the redistributive effects of trade. Most African countries export primary commodities and low-tech manufacturing products, and therefore a continental free trade agreement (AfCFTA) that reduces tariffs and non-tariff barriers across Africa will increase competition among countries in primary commodities and low-tech manufacturing exports. Countries with inefficient, high-cost manufacturing sectors might be displaced as the AfCFTA is implemented, thereby pushing up poverty rates. In the long term, as the economy adjusts and produces and exports its comparatively advantaged (lower relative cost) goods and services, poverty rates will decline.
In the Free Trade scenario, extreme poverty in Niger is expected to decrease more rapidly than on the Current Path. By 2043, 10.86% of people are forecast to live in extreme poverty in the Free Trade scenario compared to 14.84% in the Current Path forecast. The 6.06 percentage point difference translates into 2.06 million Nigeriens that would be able to escape poverty in the Free Trade scenario. In that scenario, the average poverty level in Africa’s low-income economies is projected to be 20.33% in 2043.
The Financial Flows scenario represents a reasonable but ambitious increase in worker remittances and aid flows to poor countries, and an increase in the stock of foreign direct investment (FDI) and additional portfolio investment inflows to middle-income countries. We also reduced outward financial flows to emulate a reduction in illicit financial outflows.
The intervention is explained here in the thematic part of the website.
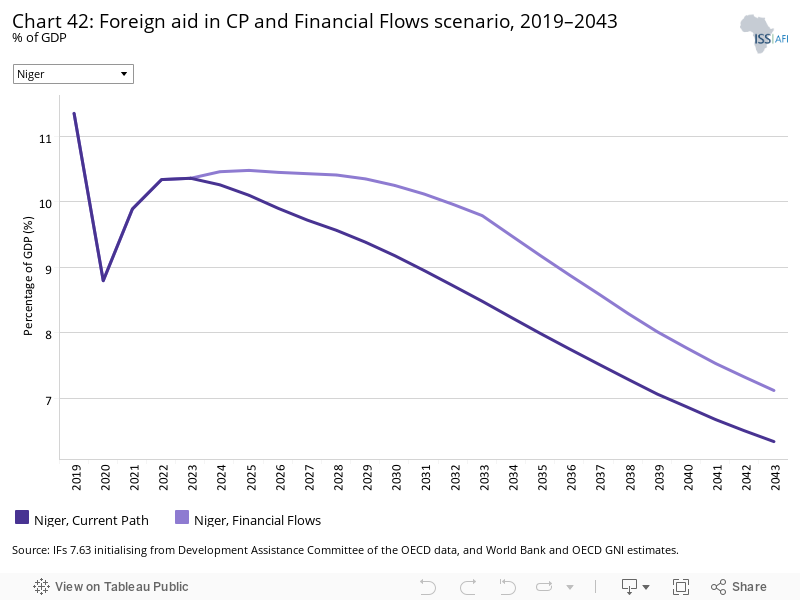
At 11.35% of GDP in 2019, foreign aid flows to Niger are above the average of 8.55% of GDP for low-income economies on the continent. In both the Current Path forecast and the Financial Flows scenario, foreign aid as a share of GDP is projected to become less significant by 2043, dropping to 7.12% of GDP in the Financial Flows scenario and to 6.34% in the Current Path forecast. In Africa’s low-income economies, aid will account for on average 3.79% of GDP in the Current Path forecast and 4.19% in the Financial Flows scenario.
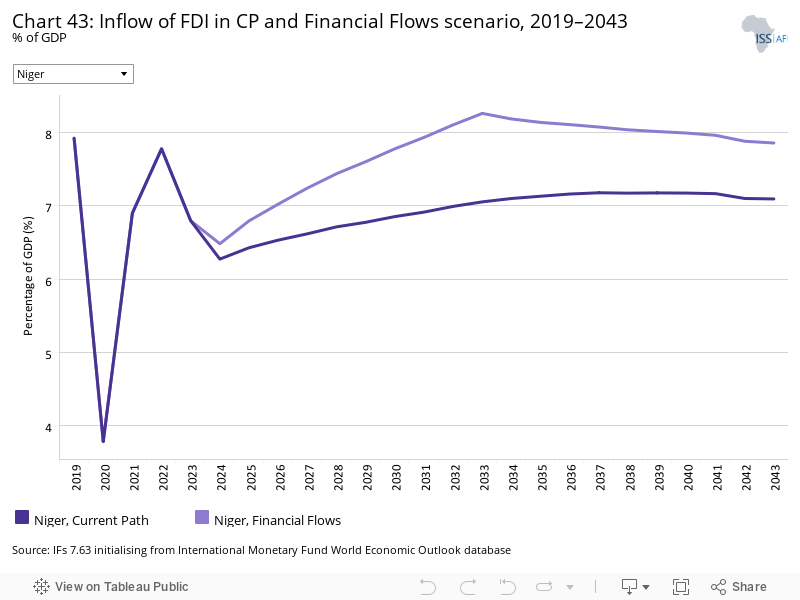
FDI flows to Niger accounted for 7.92% of GDP in 2019, close to double the average for Africa’s low-income economies. The impact of the COVID-19 pandemic on FDI flows manifests in the sharp drop to 3.78% in 2020. In the Financial Flows scenario, FDI as a share of GDP is projected to recover but not surpass pre-pandemic levels. By 2043, FDI flows are set to account for 7.86% of Niger’s GDP compared to 7.09% in the Current Path forecast. The average for Africa’s lower middle-income economies is expected to make up 5.18% of GDP in the Financial Flows scenario and 4.67% in the Current Path forecast.
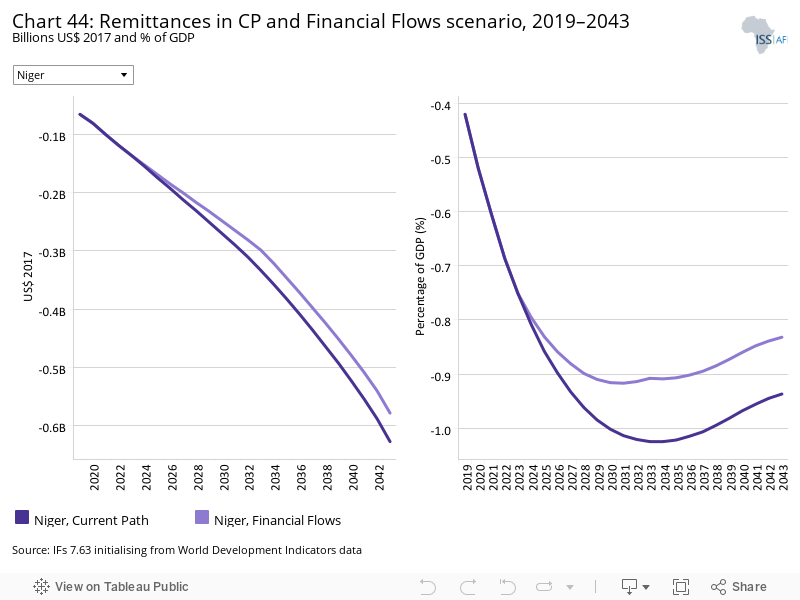
Niger is a net sender of remittances. In 2019, remittances sent amounted to US$0.06 billion representing 0.42% of GDP. On the Current Path, by 2043, the country will send about ten times as much money abroad: US$0.66 billion, or 9.48% of GDP. In the Financial Flows scenario instead, Niger would be sending US$0.58 billion abroad, accounting for 0.83% of GDP.
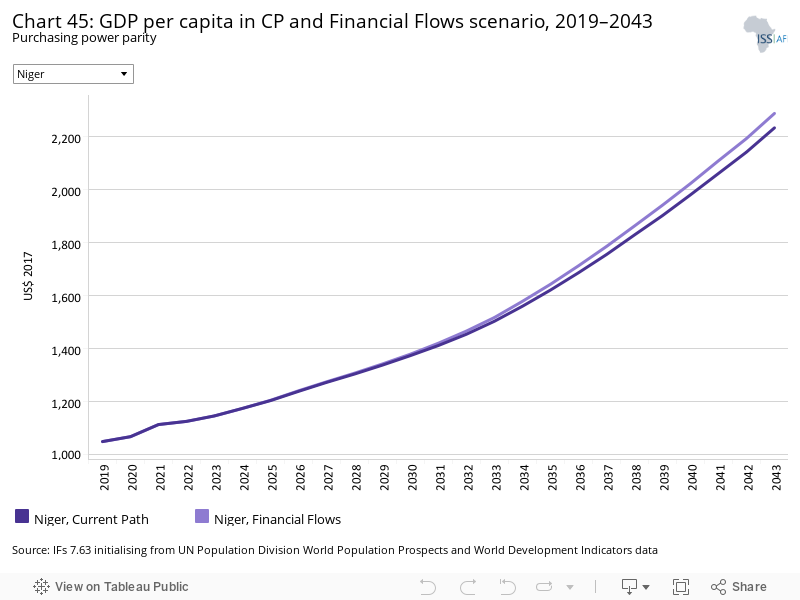
In the Financial Flows scenario, Niger’s GDP per capita is expected to experience a larger increase than on the Current Path: from US$1 047 in 2019 to US$2 287 versus from US$1 047 to US$2 232, respectively. By 2043, Niger’s future GDP per capita is still projected to be significantly lower than the expected average for Africa’s low-income economies at US$4 130 in the Financial Flows scenario.
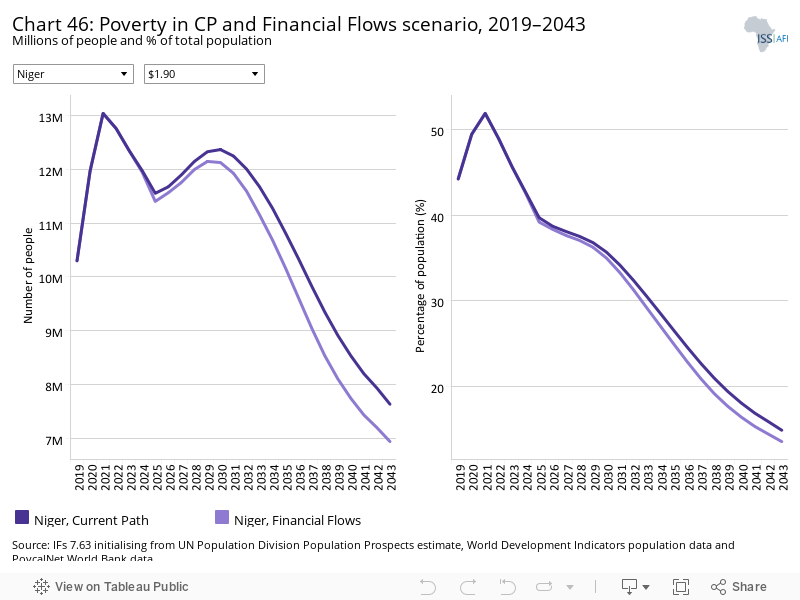
The interventions in the Financial Flows scenario have the potential to reduce the share of Nigeriens living in extreme poverty to 13.51% by 2043 compared to 14.84% in the Current Path forecast. This means that 6.95 million people instead of 7.64 million people could live below the poverty line in 2043 — a difference of 690 000 people. In the Financial Flows scenario, the projected average poverty rate in 2043 for Africa’s low-income economies is about 10 percentage points higher than Niger’s.
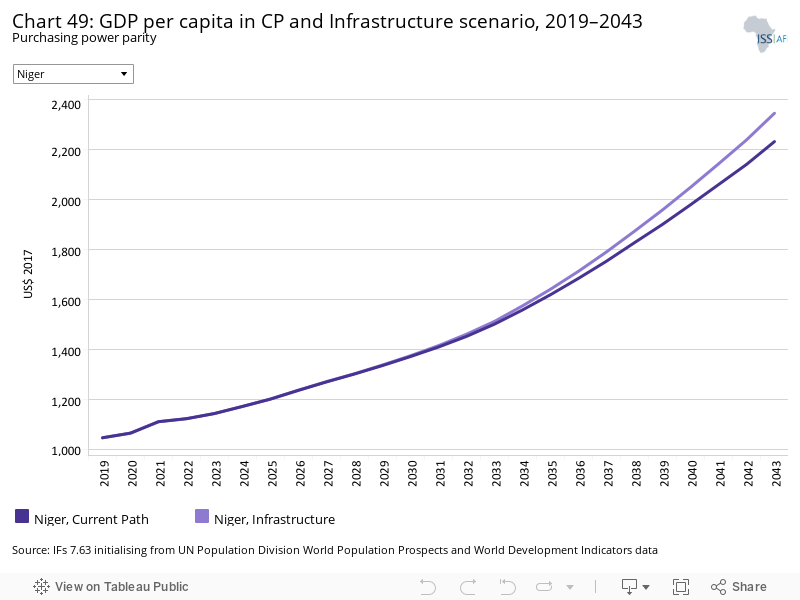
The Infrastructure scenario represents a reasonable but ambitious increase in infrastructure spending across Africa, focusing on basic infrastructure (roads, water, sanitation, electricity access and ICT) in low-income countries and increasing emphasis on advanced infrastructure (such as ports, airports, railway and electricity generation) in higher-income countries.
Note that health and sanitation infrastructure is included as part of the Health/WaSH scenario and that ICT infrastructure and more rapid uptake of renewables are part of the Leapfrogging scenario. The interventions there push directly on outcomes, whereas those modelled in this scenario increase infrastructure spending, indirectly boosting other forms of infrastructure, including those supporting health, sanitation and ICT.
The intervention is explained here in the thematic part of the website.
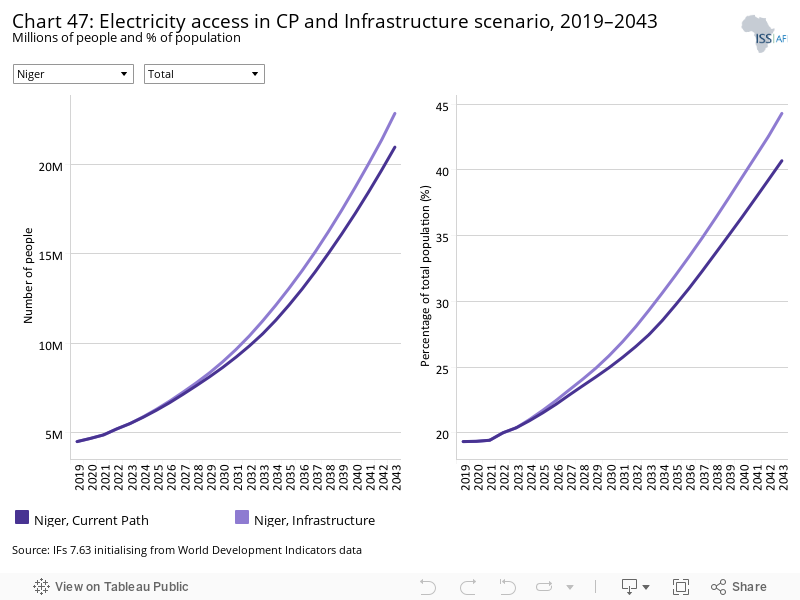
In 2019, only 4.5 million Nigeriens had access to electricity, accounting for about 19% of the population. In urban areas, access rates were more than twice as high reaching 50.9%. The interventions in the Infrastructure scenario have the potential to increase Niger’s overall electricity access rate to 44.3% by 2043 compared to 40.8% on the Current Path. This means that 8.17 million more Nigeriens could benefit from access to electricity by 2043 (29.13 million as opposed to 20.96 million).
Rural areas would benefit more from the interventions in the Infrastructure scenario than urban areas. Access rates in rural areas would increase about threefold from 13.16% in 2019 to 39.95% by 2043 compared to an expected increase from 50.93% in 2019 to 76.63% by 2043 in urban areas.
Indicator 9.1.1 in the Sustainable Development Goals refers to the proportion of the rural population who live within 2 km of an all-season road and is captured in the Rural Access Index.
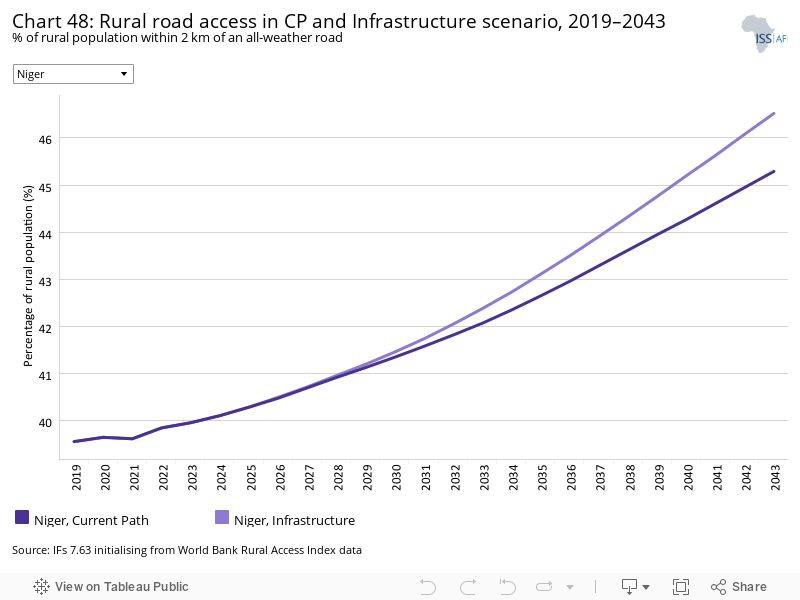
Investments in rural road infrastructure are associated with positive socio-economic impacts, such as increased rural incomes and poverty reduction, improving maternal health as well as paediatric health and heightened agricultural productivity. In 2019, 39.56% of Niger’s rural population had access to an all-weather road. This is below the average access rate of its Africa low-income peer group which stands at 43%. The Infrastructure scenario has the potential to improve road access in rural Niger. By 2043, it is projected that 46.52% of Niger’s rural population will have access to an all-weather road within a distance of 2 km compared to 45.32% in the Current Path forecast.
Improvements in the Infrastructure scenario are expected to push GDP per capita from US$1 047 in 2019 to US$2 346 in 2043 — US$114 above the Current Path forecast in the same year. Despite the expected increases in the Infrastructure scenario and the Current Path forecast, Niger’s GDP per capita is projected to remain significantly lower than the average of its low-income peer group on the continent. By 2043, the latter is expected to reach US$3 949 in the Infrastructure scenario, more than 68% higher than Niger’s expected GDP per capita in the same scenario.
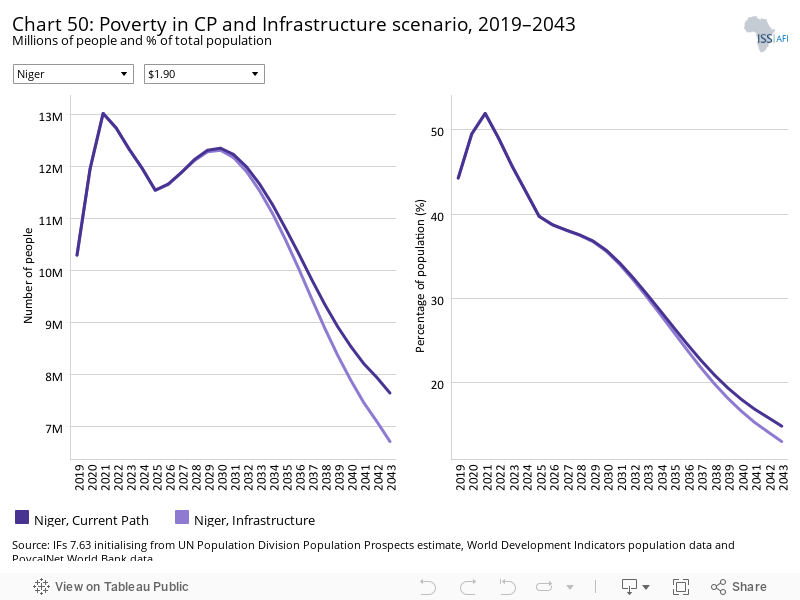
In the Infrastructure scenario, the share of Nigeriens living in extreme poverty is expected to drop from 44.26% in 2019 to 13.01% in 2043. This is an improvement of 1.83 percentage points relative to the Current Path forecast of 14.84%. It means that 930 000 people could escape poverty over the coming two decades through the interventions in the Infrastructure scenario.
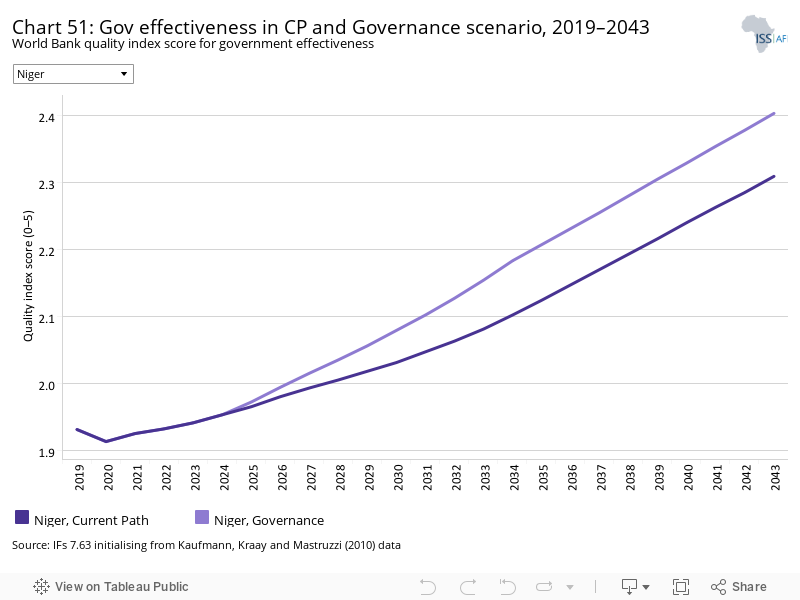
The Governance scenario represents a reasonable but ambitious improvement in accountability and reduces corruption, and hence improves the quality of service delivery by government.
The intervention is explained here in the thematic part of the website.
As defined by the World Bank, government effectiveness ‘captures perceptions of the quality of public services, the quality of the civil service and the degree of its independence from political pressures, the quality of policy formulation and implementation, and the credibility of the government’s commitment to such policies’.
Chart 51 presents the impact of the interventions in the Governance scenario on government effectiveness.
In 2019, Niger ranked fifth in government effectiveness within its Africa low-income peer group behind Ethiopia, Burkina Faso, Uganda and Rwanda as the group’s frontrunner. Niger’s score of 1.93 hence lies above the average group score of 1.37. In the Current Path forecast and in the Governance scenario, Niger’s government effectiveness quality score is projected to improve to 2.3 and 2.4, respectively, by 2043. Africa’s low-income economies could reach an average score of 2.03 in the Governance scenario compared to 1.89 in the Current Path forecast.
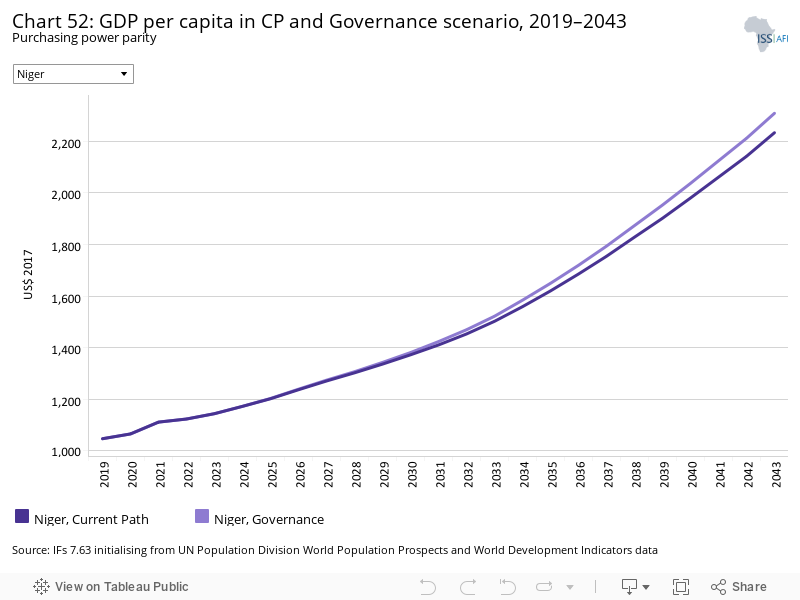
In the Current Path forecast, GDP per capita is expected to increase to US$2 232 in 2043, while the interventions in the Governance scenario have the potential to increase GDP per capita from US$1 047 in 2019 to US$2 308 in 2043. In any case, Niger is expected to lag behind the average GDP per capita for Africa’s low-income economies which is projected to be US$3 790 on the Current Path and US$3 917 in the Governance scenario.
This section presents projections for carbon emissions in the Current Path for Niger and the 11 scenarios. Note that IFs uses carbon equivalents rather than CO2 equivalents.
Among the sectoral interventions, it is the Agriculture and the Free Trade scenarios that are expected to have the biggest impact on carbon emissions by 2043, resulting in emissions of 8.48 million and 8.4 million tons of carbon, respectively. At 8.15 million tons of carbon, the Manufacturing/Transfers scenario is projected to lead to the third highest emissions in 2043, followed by the Infrastructure scenario. The Health/WaSH scenario would have the smallest impact on increasing carbon emissions, and the only scenario that would reduce those compared to the Current Path forecast of 7.71 million tons of carbon is the Demographic scenario.
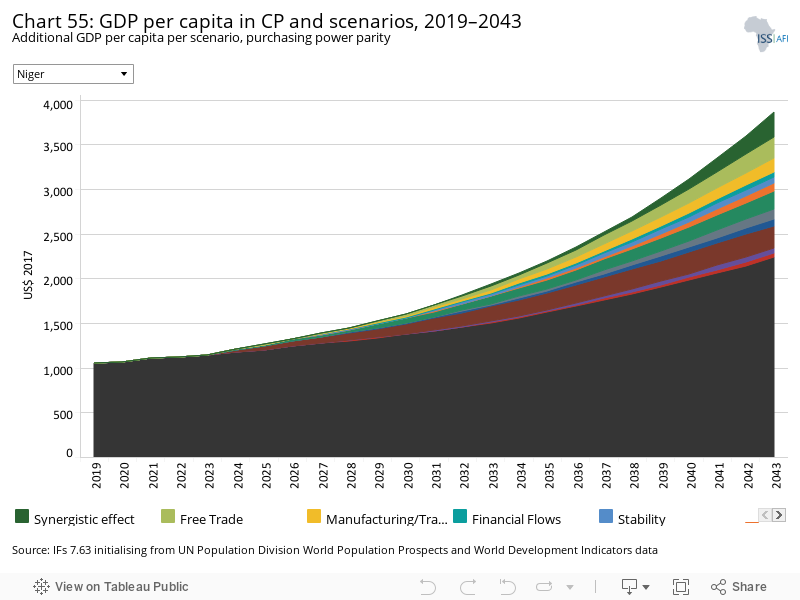
The Combined Agenda 2063 scenario consists of the combination of all 11 sectoral scenarios presented above, namely the Stability, Demographic, Health/WaSH, Agriculture, Education, Manufacturing/Transfers, Leapfrogging, Free Trade, Financial Flows, Infrastructure and Governance scenarios. The cumulative impact of better education, health, infrastructure, etc. means that countries get an additional benefit in the integrated IFs forecasting platform that we refer to as the synergistic effect. Chart 55 presents the contribution of each of these 12 components to GDP per capita in the Combined Agenda 2063 scenario as a stacked area graph.
The synergistic effect of all the scenarios on GDP per capita is about US$277 in 2043. Among the sectoral interventions, the Agriculture scenario is projected to have the greatest impact on GDP per capita, leading to an increase of US$255 by 2043. The second and third largest impacts on GDP per capita could be achieved in the Free Trade and the Leapfrogging scenarios: additions to GDP per capita of US$238.7 and US$194, respectively. The Health/WaSH and the Demographic scenarios would have the smallest impact on GDP per capita.
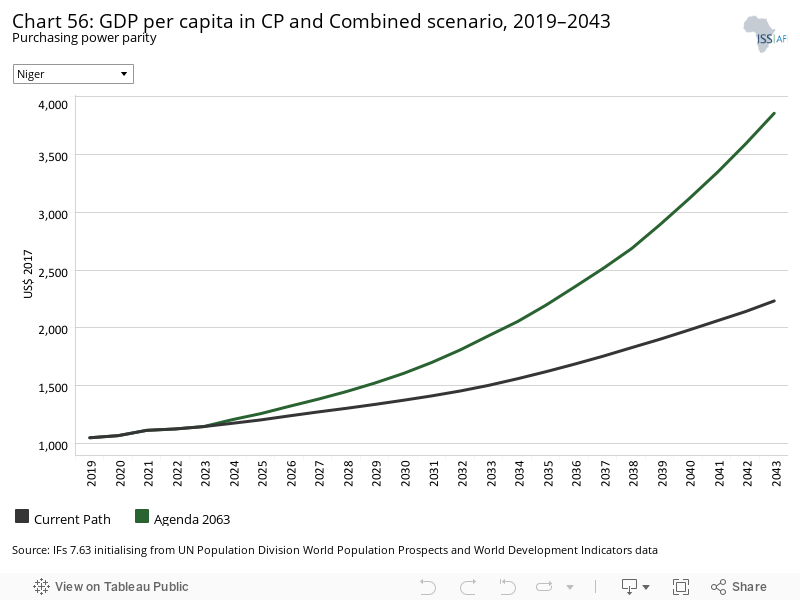
Whereas Chart 55 presents a stacked area graph on the contribution of each scenario to GDP per capita as well as the additional benefit or synergistic effect, Chart 56 presents only the GDP per capita in the Current Path forecast and the Combined Agenda 2063 scenario.
In the Combined Agenda 2063 scenario, Niger’s GDP per capita could reach US$3 858 in 2043. In the Current Path forecast, the country’s GDP per capita increases to US$2 232 in 2043 — US$1 625, or 73%, lower than in the Combined Agenda 2063 scenario in the same year.
In the Combined Agenda 2063 scenario, Niger can get close to eliminating extreme poverty. By 2043, only 1.3% of the population is expected to live below the poverty line, which translates to 644 000 people. In comparison, in the Current Path forecast, 14.84% of Nigeriens, or 7.643 million people, are projected to live in poverty.
The Combined Agenda 2063 scenario shows that a policy push across all the development sectors is necessary to achieve inclusive sustained growth in Niger.
See Chart 8 to view the Current Path forecast of the sectoral composition of the economy.
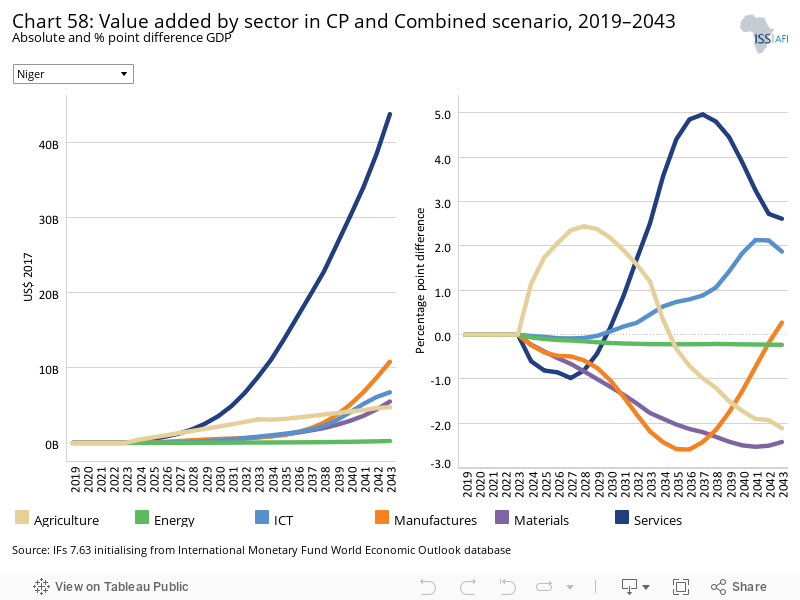
The evolution of the various sectors in terms of their relative contribution to GDP does not follow a linear trajectory. In the Combined Agenda 2063 scenario and looking to 2043, the service sector will experience the greatest increase in terms of its relative contribution to Niger’s GDP compared to the Current Path: an additional 2.6 percentage points in 2043. This translates to an increase in GDP of US$43.83 billion attributable to services alone. The boost for services through the Combined Agenda 2063 interventions is most pronounced in 2037 when the difference in percentage points compared to the Current Path is 4.96. The agriculture sector is also projected to increase its relative contribution to GDP compared to the Current Path adding up to 2.44 percentage points in 2028. In 2043, agriculture will contribute an extra US$4.8 billion to Niger’s GDP even though the relative contribution of the sector starts declining from 2028. The ICT sector is projected to steadily increase its relative contribution to GDP in the Combined Agenda 2063 scenario gaining 1.87 percentage points. In terms of its absolute additional contribution to GDP, in the Combined Agenda 2063 scenario, the manufacturing sector will add an extra US$10.8 billion to Niger’s GDP by 2043 — more than any other sector with the exception of services.
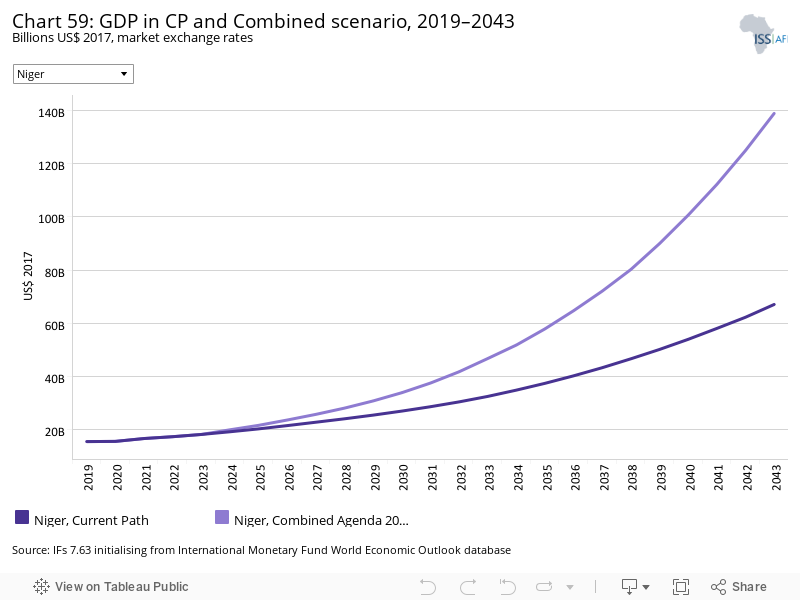
In the Current Path forecast, Niger’s GDP is projected to expand more than fourfold from US$15.5 billion to US$67.1 billion by 2043. In the Combined Agenda 2062 scenario, the country’s GDP could reach US$139 billion and hence be more than twice as large.
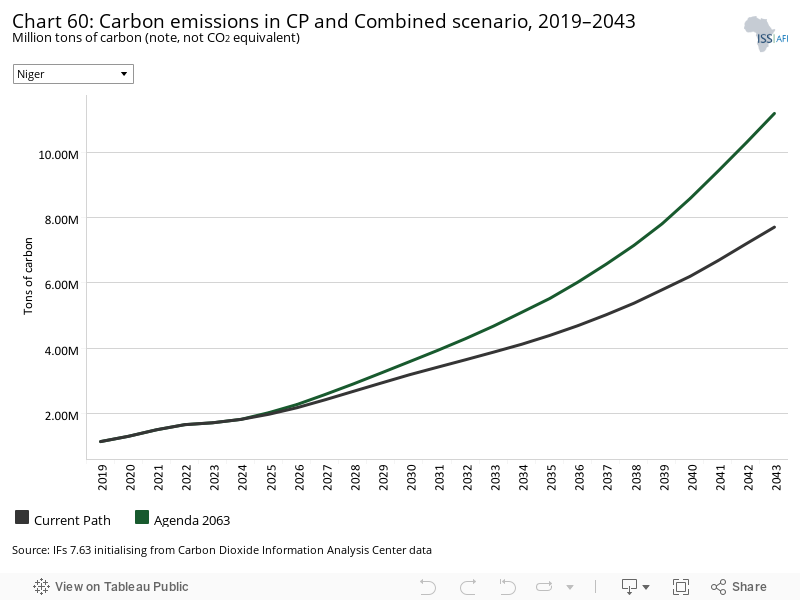
In 2019, Niger’s carbon emissions stood at 1.14 million tons; carbon emissions are projected to increase the most in the Combined Agenda 2063 scenario which combines all the sectoral scenarios. According to the Combined Agenda 2063 scenario, by 2043 Niger is projected to emit 11.2 million tons, more than ten times the volume of emission in 2019 (1.14 million tons) and 3.5 million tons more than according to the Current Path forecast (7.7 million tons by 2043). The greater increase in the Combined Agenda 2063 scenario is the result of higher economic growth which means greater demand for energy.
Page information
Contact at AFI team is Kouassi Yeboua
This entry was last updated on 5 July 2024 using IFs v7.63.
Donors and sponsors


Reuse our work
- All visualizations, data, and text produced by African Futures are completely open access under the Creative Commons BY license. You have the permission to use, distribute, and reproduce these in any medium, provided the source and authors are credited.
- The data produced by third parties and made available by African Futures is subject to the license terms from the original third-party authors. We will always indicate the original source of the data in our documentation, so you should always check the license of any such third-party data before use and redistribution.
- All of our charts can be embedded in any site.
Cite this research
Kouassi Yeboua (2024) Niger. Published online at futures.issafrica.org. Retrieved from https://futures.issafrica.org/geographic/countries/niger/ [Online Resource] Updated 5 July 2024.