 Namibia
Feedback welcome
Our aim is to use the best data to inform our analysis. See our Technical page for information on the IFs forecasting platform. We appreciate your help and references for improvements via our feedback form.
Please note: This country report was developed using African Futures’ previous analytical framework, which organised the assessment across 11 sectoral scenarios. We have since updated and streamlined the analytical architecture to 8 sectoral scenarios. While the two frameworks remain broadly aligned, the current structure improves consistency, comparability and integration across themes and geographic studies. This page will therefore be updated to the current framework in due course. Read more about our analytical framework on the Technical Page.
In this entry, we first describe the Current Path forecast for Namibia as it is expected to unfold to 2043, the end of the third ten-year implementation plan of the African Union’s Agenda 2063 long-term vision for Africa. The Current Path in the International Futures (IFs) forecasting model initialises from country-level data that is drawn from a range of data providers. We prioritise data from national sources.
The Current Path forecast is divided into summaries on demographics, economics, poverty, health/WaSH and climate change/energy. A second section then presents a single positive scenario for potential improvements in stability, demographics, health/WaSH, agriculture, education, manufacturing/transfers, leapfrogging, free trade, financial flows, infrastructure, governance and the impact of various scenarios on carbon emissions. With the individual impact of these sectors and dimensions having been considered, a final section presents the impact of the Combined Agenda 2063 scenario.
We generally review the impact of each scenario and the Combined Agenda 2063 scenario on gross domestic product (GDP) per person and extreme poverty except for Health/WaSH that uses life expectancy and infant mortality.
The information is presented graphically and supported by brief interpretive text.
All US$ numbers are in 2017 values.
*The country's income status has changed since the analysis was initally completed. The new income status will be reflected when the report is updated in the future.
Executive Summary
- Current Path forecast
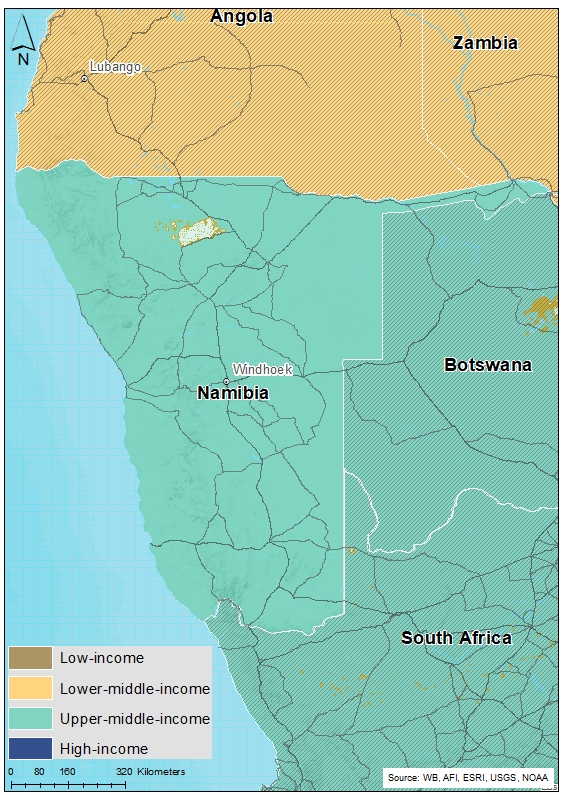
- Namibia is an upper middle-income country in Southern Africa that borders the cold South Atlantic Ocean to the west, South Africa to the south, Angola to the north and Botswana to the east. Namibia is a member of the Southern African Development Community (SADC) and Southern African Customs Union (SACU). Jump to forecast: Current Path
- The country is expected to witness a slower urbanisation rate compared to the past two decades, such that by 2043, 66.3% of the population will reside in urban areas, up from the 50.3% in 2019. Jump to Demographics: Current Path
- The Current Path forecast leads to an increase in GDP per capita from US$6 227 in 2019 to US$15 293 in 2043 and reduces the country’s level of informality, with a decrease in the size of the informal sector’s contribution to GDP, from 17% in 2019 to 14.5% in 2043. Jump to Economics: Current Path
- The country still struggles with the number of people living below the poverty line of US$5.50 per day, despite declining from 65.8% of the population (1.7 million people) in 2019 to 47% of the population (1.8 million people) in 2043. Jump to Poverty: Current Path
- Namibia increases its carbon emissions from 1.3 million in 2019 to 3.2 million tons in 2043. Jump to Carbon emissions/Energy: Current Path
- Sectoral scenarios
- The Stability will also increase GDP per capita by 3% over the Current Path to reach US$15 729 and reduce the poverty rate to 45.7% of the population in 2043 instead of the 47% in the Jump to Stability scenario
- The Demographic scenario advances the point at which Namibia could benefit from a demographic dividend by 2033 so that by 2043, it will have a ratio of 1.93 working-age persons to every dependant. Jump to Demographic scenario
- The Health/WaSH scenario will increase life expectancy from 66.3 years in 2019 to 74.6 years by 2043 and reduce the infant mortality per 1 000 live births from 28 deaths in 2019 to 10.9 in 2043. Jump to Health/WaSH scenario
- In the Agriculture scenario, the GDP per capita will increase by 5% over the Current Path forecast and the extreme poverty rate will decline by an extra 1.5 percentage points compared to the Current Path. Jump to Agriculture scenario
- The Education scenario will increase the mean years of adult education from 7 years in 2019 to 9.1 years and improve average test scores for primary and secondary education to 43.4% and 54.1%, respectively, by 2043. Jump to Education scenario
- In the Manufacturing/Transfers scenario, government welfare transfers to households will rise from US$1.3 billion in 2019 to US$5.3 billion in 2043. The scenario will further increase GDP per capita by additional an US$1 351 (8.8%) compared to the Current Path, whereas the extreme poverty rate will decline to 41.2 depicting a 5.8 percentage points decline over the Current Path estimate. Jump to Manufacturing/Transfer scenario
- In the Leapfrogging scenario, the GDP per capita will increase by 4.7% over the Current Path forecast while extreme poverty will reduce by 1.6 percentage points below the Current Path to reach 45.4% by 2043. Jump to Leapfrogging scenario
- The Free Trade scenario will increase the trade deficit in Namibia from 5.2% of GDP in 2019 to 10.3% of GDP in 2043. It will further raise GDP per capita to US$16 361, which is 7% above the Current Path forecast, and reduce the rate of extreme poverty by 2.7 percentage points below the Current Path to reach 44.3% by 2043. Jump to Free Trade scenario
- The Financial Flows scenario will decrease aid as a percentage of GDP from 2.1% in 2019 to 0.07% in 2043, while increasing the contribution of foreign direct investment from 4.9% of GDP in 2019 to 8.5% of GDP in 2043. Jump to Financial Flow scenario
- The Infrastructure scenario will increase access to electricity from 50.1% in 2019 to 78.9% of the population in 2043. The GDP per capita will increase by 0.5% above the Current Path forecast in 2043, while the extreme poverty rate declines to 47% of the population. Jump to Infrastructure scenario
- The Governance scenario increases the government effectiveness index score will increase from 2.73 in 2019 to 3.11 in 2043. The GDP per capita in this scenario will increase by 2% above the Current Path, while the extreme poverty rate declines to 46.2% in 2043. Jump to Governance scenario
- While Namibia’s carbon emissions are projected to increase in all the scenarios, the Manufacturing/Transfers scenario will have the greatest effect resulting in emissions of 3.5 million tons of carbon in 2043. Jump to Impact of scenarios on carbon emissions
- Combined Agenda 2063 scenario Jump to Combined Agenda 2063 scenario
- In the Combined Agenda 2063 scenario, Namibia will witness an increase in GDP per capita to US$23 262 in 2043 — a 52.1% increase over the Current Path forecast. The size of the economy is expected to grow by an additional 66.8% compared to the Current Path forecast. There is a significant reduction in the proportion of people living below the poverty line to 28.7% of the population — a 18.3 percentage point decline compared to the Current Path forecast.
All charts for Namibia Development Futures
- Chart 1: Political map of Namibia
- Chart 2: Population structure in CP, 1990–2043
- Chart 3: Urban and rural population in CP, 1990–2043
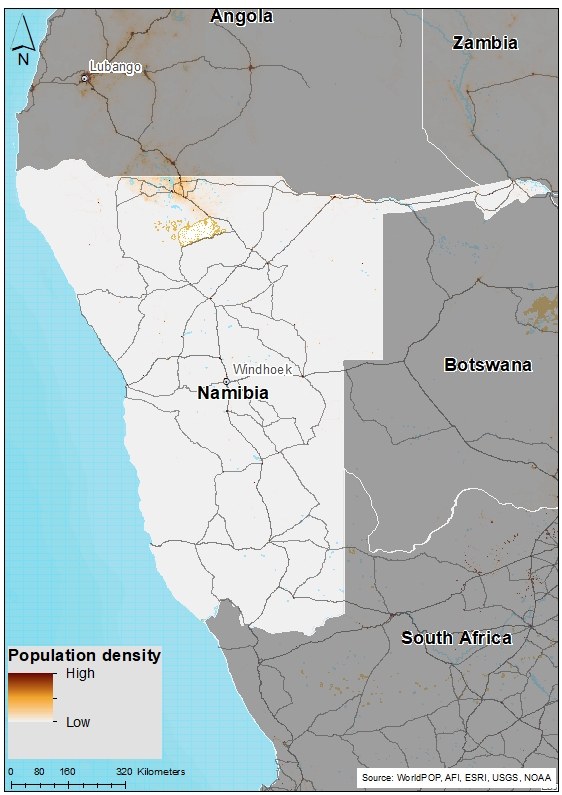
- Chart 4: Population density map for 2019
- Chart 5: GDP in CP, 1990–2043
- Chart 6: GDP per capita in CP, 1990–2043
- Chart 7: Informal sector value in CP, 2015–2043
- Chart 8: Value added by sector in CP, 2015–2043
- Chart 9: Agriculture production/demand in CP, 1990–2043
- Chart 10: Poverty in CP, 2015–2043
- Chart 11: Energy production by type in CP, 1990–2043
- Chart 12: Carbon emissions in CP, 1990–2043
- Chart 13: Governance security in CP and Stability scenario, 2019–2043
- Chart 14: GDP per capita in CP and Stability scenario, 2019–2043
- Chart 15: Poverty in CP and Stability scenario, 2019–2043
- Chart 16: Demographic dividend in CP and Demog scenario, 2019–2043
- Chart 17: Infant mortality in CP and Demog scenario, 2019–2043
- Chart 18: GDP per capita in CP and Demog scenario, 2019–2043
- Chart 19: Poverty in CP and Demog scenario, 2019–2043
- Chart 20: Life expectancy in CP and Health/WaSH scenario, 2019–2043
- Chart 21: Infant mortality in CP and Health/WaSH scenario, 2019–2043
- Chart 22: Yield/hectare in CP and Agric scenario, 2019–2043
- Chart 23: Agriculture imports in CP and Agric scenario, 2019–2043
- Chart 24: GDP per capita in the CP and Agric scenario, 2019–2043
- Chart 25: Poverty in CP and Agric scenario, 2019–2043
- Chart 26: Mean years of education in CP and Educ scenario, 2019–2043
- Chart 27: Education quality in CP and Educ scenario, 2019–2043
- Chart 28: GDP per capita in CP and Educ scenario, 2019–2043
- Chart 29: Poverty in CP and Educ scenario, 2019–2043
- Chart 30: Value added by sector in CP and Manufac/Transfers scenario, 2019–2043
- Chart 31: Gov welfare transfers in CP and Manufac/Transfers scenario, 2019–2043
- Chart 32: GDP per capita in CP and Manufac/Transfers scenario, 2019–2043
- Chart 33: Poverty in CP and Manufac/Transfers scenario, 2019–2043
- Chart 34: Fixed broadband access in CP and Leapfrogging scenario, 2019–2043
- Chart 35: Mobile broadband access in CP and Leapfrogging scenario, 2019–2043
- Chart 36: Electricity access in CP and Leapfrogging scenario, 2019–2043
- Chart 37: GDP per capita in CP and Leapfrogging scenario, 2019–2043
- Chart 38: Poverty in CP and Leapfrogging scenario, 2019–2043
- Chart 39: Trade balance in CP and Free Trade scenario, 2019–2043
- Chart 40: GDP per capita in CP and Free Trade scenario, 2019–2043
- Chart 41: Poverty in CP and Free Trade scenario, 2019–2043
- Chart 42: Foreign aid in CP and Financial Flows scenario, 2019–2043
- Chart 43: Inflow of FDI in CP and Financial Flows scenario, 2019–2043
- Chart 44: Remittances in CP and Financial Flows scenario, 2019–2043
- Chart 45: GDP per capita in CP and Financial Flows scenario, 2019–2043
- Chart 46: Poverty in CP and Financial Flows scenario, 2019–2043
- Chart 47: Electricity access in CP and Infrastructure scenario, 2019–2043
- Chart 48: Rural road access in CP and Infrastructure scenario, 2019–2043
- Chart 49: GDP per capita in CP and Infrastructure scenario, 2019–2043
- Chart 50: Poverty in CP and Infrastructure scenario, 2019–2043
- Chart 51: Gov effectiveness in CP and Governance scenario, 2019–2043
- Chart 52: GDP per capita in CP and Governance scenario, 2019–2043
- Chart 53: Poverty in CP and Governance scenario, 2019–2043
- Chart 54: Carbon emissions in CP and scenarios, 2019–2043
- Chart 55: GDP per capita in CP and scenarios, 2019–2043
- Chart 56: GDP per capita in CP and Combined scenario, 2019–2043
- Chart 57: Poverty in CP and Combined scenario, 2019–2043
- Chart 58: Value added by sector in CP and Combined scenario, 2019–2043
- Chart 59: GDP in CP and Combined scenario, 2019–2043
- Chart 60: Carbon emissions in CP and Combined scenario, 2019–2043


Namibia Development Futures: Current Path
Download to pdfThis page provides an overview of the key characteristics of Namibia along its likely (or Current Path) development trajectory. The Current Path forecast from the International Futures forecasting (IFs) platform is a dynamic scenario that imitates the continuation of current policies and environmental conditions. The Current Path is therefore in congruence with historical patterns and produces a series of dynamic forecasts endogenised in relationships across crucial global systems. We use 2019 as a standard reference year and the forecasts generally extend to 2043 to coincide with the end of the third ten-year implementation plan of the African Union’s Agenda 2063 long-term development vision.
Namibia is an upper middle-income country in Southern Africa that borders the cold South Atlantic Ocean to the west, South Africa to the south, Angola to the north and Botswana to the east. Namibia is a member of the Southern African Development Community (SADC) and South African Customs Union (SACU). From 1884, the country was under the rule of Germany and called German South West Africa.
During World War 1 South Africa intervened militarily and deposed the German colonial administration. The Treaty of Versailles and a League of Nations Class C mandate permitted South Africa to administer South West Africa until its territorial inhabitants were prepared for self-determination. South Africa interpreted the mandate as a veiled annexation and by 1920 had taken over administrative and legislative power. The subsequent decades saw an increase in tensions and hostilities, failed negotiations, regional and proxy battles and, eventually, a fight for independence. The eventual transition to independence included negotiations between South Africa, the South West Africa People's Organisation Party (SWAPO), neighbouring countries, UN officials and a special group of Western powers. The Tripartite Accord signed in 1988 to end the war meant that the country finally gained independence from South Africa in 1990 with SWAPO winning the parliamentary elections.
The capital city of Windhoek is the largest city in the country. The official language of the country is English but there are several indigenous and inherited languages such as Ovambo, Khoekhoe, Afrikaans, Kavango, Herero, Setswana, Naro and German. SWAPO has ruled the country since independence.
Namibia occupies a large geographic area of 824 292 km² with a population of about 2.5 million in 2019. Its geography consists of the Namib Desert along the coast and the Kalahari Desert in the east. The Caprivi Strip that was included into the country in 1890 gave Germany access to the Zambezi river.
The Namibian economy primarily depends on the country’s large natural resources deposits. It has large deposits of diamonds, uranium, lead, tin, marble and granite, gold, copper, zinc and prolific fisheries, and natural gas, which is yet to be fully exploited. The mining industry accounts for half of the country’s export revenue. Namibia is the fourth largest exporter of non-fuel minerals on the continent and fifth largest producer of uranium globally. Namibia also boasts a vibrant tourism sector that contributes just shy of 15% to the economy. However, the country has fallen into a classic middle-income trap given slow growth, high levels of poverty and inequality. Namibia is the second most unequal country in the world after South Africa with a Gini coefficient of 59.1 in 2015. The 2021 Multidimensional Poverty Index estimates that 43.3% of the Namibian population are multidimensionally poor.
Namibia was ranked the seventh most populous country in Southern Africa out of the ten countries and the 41st most populous country in Africa for 2019. The population of Namibia increased from 1.4 million people in 1990 to 2.5 million in 2019, constituting growth of about 79% in the period. In the Current Path forecast, the population of the country is projected to rise to 3.8 million by 2043, equivalent to an increase of about 52%. At that point, Namibia will be the 42nd most populous country in Africa, having been overtaken in population size by The Gambia. Namibia’s population growth rate declined from 4.3% per annum in 1990 to 2.2% in 2019 and is projected to decline further to 1.2% in 2043 reflecting the expected decline in fertility rates as a result of the decrease in fertility rates in the period.
Regardless, the growth in the population is still rapid due to its youthful population. The country had a median age of 21.8 years and a youth bulge of 45.1% in 2019. In 2019, 37% of Namibia’s population was 15 years and younger, the aged population 65 years and older stood at 4%, and the working-age population (15–60 years) constituted 59% of the population.
The large youthful population poses a challenge for youth employment in Namibia. The 2018 Namibian National Labour Force Survey estimated youth unemployment to be around 46% — up from 43% in 2016. On average, Namibians are only able to become economically independent when they reach the age of 27 years. Some young people in their thirties are still dependent on their families for survival due to the lack of employment opportunities. Such a high unemployment rate can be a catalyst for potential instability in the country — a country not unfamiliar with a violent past.
Namibia has made the urban transition much faster than the rest of Africa that is only expected to obtain similar levels by 2038. In 1990, of about 1 million Namibians, 72.3% of the total population resided in rural spaces. By 2019, the country had achieved parity in terms of rural–urban settlement with 50.3% of its population (equivalent to about 1.3 million Namibians) still living in urban areas, making it the 23rd most urbanised country in Africa and the fourth most urbanised country in Southern Africa. Urban centres have social amenities such as better healthcare and educational facilities, recreational centres and employment opportunities. These factors attract people to the urban areas in search of work and better living conditions. Many people do so in hopes of escaping unemployment and poor rural infrastructure, healthcare and educational opportunities in rural areas. However, cities in Southern Africa are not able to accommodate the high inflow of rural, oftentimes young, migrants, which results in high urban poverty, development of informal housing, congestion and an increase in the crime rate in urban centres. On the Current Path, the urban population will increase by 16 percentage points to 66.3% of the total population in 2043, corresponding to 2.5 million people. By then, Namibia will be the 18th most urbanised country in Africa overtaking countries such as Cameroon, Nigeria, Liberia and Côte d'Ivoire.
The total land area of Namibia is approximately 824 292 km². It is the least densely populated country in Africa with an estimated population density in 2019 of 0.031 people per hectare, much lower than the African average of 0.45 and the average of 0.16 for upper middle-income Africa. On the Current Path, it is projected that Namibia’s population density will increase to 0.046 people hectare by 2043, which will only slightly exceed Libya at 0.043. The Khomas region, in which Windhoek is located, is the most densely populated region in Namibia followed by Ohangwena, Omusati, Oshikoto and Oshana, all of which are located in the northern parts of the country bordering Angola. Windhoek has a population of over 268 000, followed by Rundu and Walvis Bay. The most sparsely populated region is the Zambezi region in the salient Caprivi Strip.
The GDP of Namibia almost tripled from US$5.7 billion in 1990 to US$16.3 billion in 2019. The economy primarily relies on the production and export of primary goods such as beef, fish and minerals with a negligible industrial base. With the end of the war and after attaining independence in 1990, the Namibian government has committed itself to economic diversification to address the structural inequalities of the country's economy. Accordingly, Namibia implemented liberalisation policies such as the enactment of the foreign investment act and establishment of export processing zones in order to attract foreign direct investment. Between 1991 and 2015, the economy grew at an average of 4.4%. The growth can partly be attributed to the boom in exports and increased investment in mineral extraction as well as benefitting from a much more stable region and its newfound independence. The country also welcomed and opened its doors to neighbouring as well as international tourists, and many refugees returned home.
Due to its high dependence on the export of primary commodities, Namibia remains susceptible to global commodity price fluctuation. As such, the decline in global commodity prices in 2015 caused the economy to stagnate in 2016 and recess afterwards. As in other countries, the COVID-19 pandemic had a devastating effect on the economy of Namibia causing GDP to contract by 8.5% in 2020. On the Current Path, the country’s GDP will reach US$41.5 billion in 2043 constituting an increase of 154.6% over the forecast period.
The discovery of oil/gas and an ambitious green hydrogen project that's turned into ammonia for transportation has significant potential for future economic growth. Recently Portugal's Galp Energia indicated that it had found at least 10 billion barrels of oil equivalent (BBOE) in its Mopane field, in the largely unexplored Orange Basin. This is one of the largest recent oil finds globally although the country has yet to start production which is scheduled to start in 2029/30.
The plan with green hydrogen is to tap solar powerfrom the Namib desert by erecting a vast array of panels channeling the energy to electrolyzers that split water into hydrogen and oxygen. The product is then turned into green ammonia, loaded onto tankers and transported north to Europe. The business plan is that the costs of producing hydrogen will fall at the same time as the European Union imposes stricter rules on the use of fossil fuels that power industries in line with its Carbon Border Adjustment Mechanism (CBAM).
The associated effect has not yet been included in our forecasts below.
Although many of the charts in the sectoral scenarios also include GDP per capita, this overview is an essential point of departure for interpreting the general economic outlook of Namibia.
Between 1990 and 2019, Namibia's GDP per capita increased by 67.3% from US$6 227 to US$10 419. While the average GDP growth was about 3.9% over the period, population growth within the same period was 2%. Namibia’s GDP per capita has thus grown rapidly compared to the average for upper middle-income countries in Africa. It increased from US$12 361 in 1990 to US$14 235 in 2019.
With the projected increase in GDP and reduction in population growth, GDP per capita will rise over the next 24 years, such that by 2043, it will increase to US$15 293, which will be 86.2% of the Current Path average of US$17 734 for upper middle-income countries in Africa.
The informal sector plays a pivotal role in Nambia as it serves as a source of livelihood for many citizens. In 2018, the Namibian Labour Force Survey estimated that about 57% of Namibians were employed in the informal sector. About 70% of the informal labour are women, who are usually young and self-employed, while 81% of the rural population are employed in the informal sector.4. The informal sector consists of small-scale manufacturing, mining and construction, subsistence farming, craft making and petty trading, among others.
Many Namibians prefer to work in the informal sector because of the less stringent requirements compared to the formal sector. Informal sector jobs require no job applications, ID, letters of reference, certificates and other administrative barriers. However, informal workers have unstable incomes, are paid low wages with no employment benefits nor social security, oftentimes work under harsh conditions and are exploited by their employers. Strict business registration procedures coupled with high fees also act as disincentives to registering businesses as threse require tax clearance, business registrations, social security, business bank accounts and affirmative action commission letters. Informal business people often do not have the requisite education, training and skills to operate their business effectively. Aside from the tough regulatory environment, most informal businesses do not have access to capital to expand.
The size of the informal sector in Namibia in 2019 amounted to US$2.5 billion, equivalent to 17% of GDP, which was above the average of 14% for upper middle-income African countries. It means that in terms of formalisation of the economy, Namibia is performing poorer than its income peers on the continent. On the Current Path, the size of the informal economy will increase to US$5.5 billion in 2043, although its contribution to GDP will decline to 14.5% of GDP within the same period. The number of people employed by the informal sector as a percentage of the total labour will decline from 43.5% in 2019 to 36.7% in 2043, consistent with the decline in the informal economy’s contribution to GDP. By 2043, the size of the informal sector in Namibia will be on par with the average for upper middle-income Africa.
The IFs platform uses data from the Global Trade and Analysis Project (GTAP) to classify economic activity into six sectors: agriculture, energy, materials (including mining), manufacturing, services and information and communication technologies (ICT). Most other sources use a threefold distinction between only agriculture, industry and services with the result that data may differ.
The three largest contributors to GDP in Namibia in 2019 were the service, manufacturing and agriculture sectors, respectively. The service sector contributed US$9.8 billion, equivalent to 60% of GDP; this is expected to increase to US$25.0 billion in 2043, representing 60.3% of GDP. The manufacturing sector, which is currently the second largest contributor to GDP, contributed US$3.2 billion, equivalent to about 19.4% of GDP. The sector’s contribution to GDP is projected to rise to 20.7% in 2043, valued at US$8.6 billion.
The agriculture sector contributed US$1.4 billion, constituting 8.6% of GDP in 2019. By 2043, both the materials and ICT sectors will overtake the agriculture sector’s contribution, which is forecast to be 4.2% of GDP; the materials sector will contribute 7.4% to GDP compared to 5.1% in 2019, and the ICT sector will contribute 7.2% to GDP, up from 6.8% in 2019. The contributions of the materials and ICT sectors in 2043 will correspond to US$3.1 billion and US$3 billion, respectively. The growth in the share of the manufacturing sector reflects the structural transformation of the economy, which is key for creating decent and sustainable jobs. Nonetheless, the decline in the agriculture sector is a major concern for future food security in the country.
The data on agricultural production and demand in the IFs forecasting platform initialises from data provided on food balances by the Food and Agriculture Organization (FAO). IFs contains data on numerous types of agriculture but aggregates its forecast into crops, meat and fish, presented in million metric tons. Chart 9 shows agricultural production and demand as a total of all three categories.
Agriculture forms an integral part of the Namibian economy as about 70% of Namibians directly or indirectly rely on agriculture as a source of livelihood, and the sector employs a third of the labour force.
Total agricultural land was 388 100 km2, constituting over 47.1% of the total land in the country, in 2018, with 800 000 hectares of arable land in 2019. However, only about 2% of the total land in Namibia receives adequate rainfall for sustaining crops. Challenges facing the agriculture sector include drought, variable rainfall patterns, and subsistence and rudimentary farming practices resulting in low crop yields. The sector faces high post-harvest losses, poor land management practices as well as limiting marketing opportunities for rural farmers and processing capacities. Some of the agricultural commodities produced in Namibia include maize, wheat, sorghum, pearl millet, grapes, dates and a variety of beans.
Livestock production is also an important component of the Namibian economy. Cattle grazing is common in the northern and central regions while goat and sheep rearing is predominant in the southern region. In 1990, domestic demand exceeded agricultural production in Namibia by 140 000 metric tons, meaning that the country had an excess demand for agricultural commodities. However, since then, both domestic demand and production have been volatile, fluctuating around the equilibrium where demand equals production. For instance, from 1992 to 1995, 2001 to 2006 and 2013 to 2017, production exceeded domestic demand. The country also experienced a severe drought in 2019 that affected its agricultural output and harvest.
By 2019, domestic demand had outgrown domestic production leading to excess demand of 40 000 metric tons. Although yield per hectare is projected to increase from 1.6 metric tons in 2019 to two metric tons in 2043, increasing domestic production to 2.4 million metric tons, it will still not be enough to meet domestic demand. By 2043, agriculture demand will surpass domestic production by 1.25 million metric tons, equivalent to a 51.4% shortfall. This means that the country faces the risk of food insecurity in the future if drastic measures are not adopted to revamp the agriculture sector and to increase domestic production. This is a difficult task for an arid country with low yields and limited grazing capacity per hectare.
There are numerous methodologies for and approaches to defining poverty. We measure income poverty and use GDP per capita as a proxy. In 2015, the World Bank adopted the measure of US$1.90 per person per day (in 2011 international prices), also used to measure progress towards the achievement of Sustainable Development Goal (SDG) 1 of eradicating extreme poverty. To account for extreme poverty in richer countries occurring at slightly higher levels of income than in poor countries, the World Bank introduced three additional poverty lines in 2017:
- US$3.20 for lower middle-income countries
- US$5.50 for upper middle-income countries
- US$22.70 for high-income countries.
Namibia is an upper middle-income country, and therefore uses the US$5.50 benchmark for extreme poverty. Despite being an upper middle-income, poverty and inequality levels in Namibian are very high. According to the 2021 Multidimensional Poverty Index, 43.3% of the Namibian population are multidimensionally poor. Inequality is high in Namibia, and it was ranked as the second most unequal country in the world in 2017 after South Africa. About 20% of Namibians live in informal settlements, and it was estimated that about 90% of Namibians in 2018 were unable to buy a house as they do not qualify for housing loans. Thus, there is a large number of Namibians without access to formal housing who mostly find refuge in informal settlements. Poverty levels in Namibia are severe in the northern regions of Kavango, Oshikoto, Zambezi, Kunene and Ohangwena, where about a third of the population lives in extreme poverty. The upper middle-income status of the country also makes its poor population unqualified for donor assistance and humanitarian aid. The Namibian Vision 2030 seeks to transform the economy and eliminate extreme poverty by 2030. The agenda focuses primarily on healthcare, housing, education and providing equal opportunities for citizens.
The number of Namibians living below the extreme poverty line of US$5.50 per day in 2019 was 1.7 million, equivalent to 65.8% of the population. The number of people in extreme poverty is set to increase over the period, peaking at 2.12 million in 2030 before declining. By 2043, the number of people in extreme poverty in Namibia will have reduced to 1.8 million, constituting 47% of the population. This corresponds to an 18.8 percentage point decrease in the extreme poverty rate in Namibia over the 24-year period. Throughout the period under consideration, the proportion of poor people in Namibia is higher than the average for upper middle-income countries in Africa, such that by 2043, the extreme poverty rate in Namibia will be 7.3 percentage points higher than the projected Current Path average of 39.7% for upper middle-income countries in Africa.
The IFs platform forecasts six types of energy, namely oil, gas, coal, hydro, nuclear and other renewables. To allow comparisons between different types of energy, the data is converted into billion barrels of oil equivalent (BBOE). The energy contained in a barrel of oil is approximately 5.8 million British thermal units (MBTUs) or 1 700 kilowatt-hours (kWh) of energy.
The country has low energy production and relies on imports for its energy needs, importing electricity, coal and petroleum products for its domestic usage. In 1990, Namibia produced 800 000 BOE of hydro as the sole energy produced. By 2019, the production of hydro had increased to 100 000 barrels BOE and remained the only energy produced in the country. Namibia has a potential for wind, biomass and solar generation and is also one of the leading producers of uranium in the world, providing about 8.2% of the world's production. Over the last few years, the country has embarked on reforms in order to implement its transition from traditional energy to renewable energy. In pursuit of this, 70 electricity distributors were consolidated into five regional electricity distribution companies (REDs). Also, the country established transparent tariff setting procedures and abandoned the single buyer model. As a result, Namibia will begin the production of other renewable energies in 2035, whose production in that year will be valued at 50 000 BOE, representing 53% of total energy production. On the Current Path, it is projected that by 2043, the production of other renewable energies will constitute about 50% of total energy production, which will correspond to 120 000 BOE. This will be complemented by the projection of 90 000 BOE of hydro and 10 000 BOE of gas equivalent to 45% and 5% of total energy production, respectively, in that year.
Recently significant offshore oil and gas discoveries have been announced by oil majors like Shell, TotalEnergies, and QatarEnergy and the country has witnessed a surge in exploration activities. At the beginning of 2024, Portugal’s Galp Energia announced the discovery of a substantial offshore light oil reserve, followed by plans to explore deeper depths.
Carbon is released in many ways, but the three most important contributors to greenhouse gases are carbon dioxide (CO2), carbon monoxide (CO) and methane (CH4). Since each has a different molecular weight, IFs uses carbon. Many other sites and calculations use CO2 equivalent.
Carbon emissions in Namibia are very low, moving from almost zero emission in 1990 to about 1.3 million tons in 2019. The contribution of Namibia to global carbon emissions is just 0.05%. Although the country’s emissions are dwarfed in regard to its neighbour South Africa, it is reliant on imports from there. On the Current Path, carbon emissions are projected to increase to 3.2 million tons by 2043, constituting an increase of 166.7% over the 2019 figure. The country has projected to cut greenhouse gas emission by 91% by 2030 together with an energy transition plan to renewable energy. This will have to include breaking its overdependence on South Africa’s fossil-dependent electricity producer, Eskom.
Sectoral Scenarios for Namibia Development Futures
Download to pdfThe Stability scenario represents reasonable but ambitious reductions in risk of regime instability and lower levels of internal conflict. Stability is generally a prerequisite for other aspects of development and this would encourage inflows of foreign direct investment (FDI) and improve business confidence. Better governance through the accountability that follows substantive democracy is modelled separately.
The intervention is explained here in the thematic part of the website.
Namibia gained independence from South Africa in 1990 after a long and drawn-out fight. Since then, the country has enjoyed stability. The ruling South West Africa People's Organisation (SWAPO) Party of Namibia has won all elections in the country with an overwhelming majority since 1990. However, the party lost its supermajority in the 2019 general elections after failing to obtain two-thirds of the seats in the national assembly which it had achieved since 1994. Also, President Hage Geingob won his re-election bid by a narrow margin of 54% compared to the 87% he obtained in 2014 — the lowest in the history of the party. The dwindling fortune of SWAPO and the growth of opposition parties is good for multiparty democracy in the country but also signals a changing environment in the decades to come.
The score of Namibia on the governance security index for 2019 was 0.74, which was slightly above the average of 0.72 for upper middle-income countries in Africa and above 0.69 for Africa. In the Stability scenario, Namibia's score on the governance security index is projected to increase 0.89, about 9% above the Current Path forecast by 2043 and 15.6% above the Current Path average of 0.77 for upper middle-income countries in Africa in the same year.
The GDP per capita for Namibia in 2019 was US$10 419, which was 18.6% lower than the average of US$14 235 for upper middle-income countries in Africa. In the Stability scenario, GDP per capita is projected to reach US$15 729 by 2043, representing about 3% (US$436) increase over the Current Path forecast for that year. This estimation is, however, 12.7% below the Current Path average of US$17 734 for upper middle-income countries in Africa. The expected economic growth in GDP in the Stability scenario can be explained by the fact that regime stability and good governance in the form of rule of law, transparency and accountability and reduced corruption attract larger inflows of foreign investment, which eventually promote economic growth.
In 2019, the number of poor people living on less than US$5.50 in Namibia was 1.67 million (65.8% of the population). In the Stability scenario, the number of poor people is projected to reach 1.74 million (45.7% of the population), compared to the Current Path forecast of 1.79 million people (47% of the population) in 2043. This means that the Stability scenario could result in a decline in extreme poverty by 50 000 additional people, which is equivalent to a 1.3 percentage point reduction. The projection in this scenario is also 6 percentage points higher than the Current Path average of 39.7% for upper middle-income countries in Africa in 2043.
This section presents the impact of a Demographic scenario that aims to hasten and increase the demographic dividend through reasonable but ambitious reductions in the communicable-disease burden for children under five, the maternal mortality ratio and increased access to modern contraception.
The intervention is explained here in the thematic part of the website.
Demographers typically differentiate between a first, second and even a third demographic dividend. We focus here on the contribution of the size of the labour force (between 15 and 64 years of age) relative to dependants (children and the elderly) as part of the first dividend. A window of opportunity opens when the ratio of the working-age population to dependants is equal to or surpasses 1.7.
In 2019, there were 1.47 working-age persons for every dependant in Namibia. This was 25.9% lower than the average of 1.85 for upper middle-income countries in Africa. Namibia will achieve the minimum ratio of 1.7 by 2033 in both the Current Path forecast and the Demographic scenario, after which it enters a period of potentially higher economic growth given its larger labour force compared to dependent children and elderly.
By 2043, the ratio of the working-age population to dependants is projected to be 1.93 in the Demographic scenario, which will be slightly higher than the Current Path forecast of 1.92 but about 5% below the projected Current Path average of 2.02 for upper middle-income countries in Africa. The increased demographic dividend in Namibia follows on from the projected decline in population growth as a result of a reduction in fertility rates over the past couple of decades.
The infant mortality rate is the number of infant deaths per 1 000 live births and is an important marker of the overall quality of the health system in a country.
The infant mortality rate in Namibia in 2019 was 28 deaths per 1 000 live births, 2.4 deaths below the average upper middle-income countries in Africa. In the Demographic scenario, infant mortality in Namibia will fall to 13.4 deaths per 1 000 live births by 2043. This represents nearly 2 deaths fewer than the Current Path forecast at 15.3 deaths.
In the Demographic scenario, GDP per capita for Namibia is projected to reach US$15 336, which is US$45 (0.3%) above the projected US$15 293 on the Current Path in the same year. The additional gains in GDP per capita are low in the Demographic scenario — a result of the country already experiencing low fertility rates, a reduction in population growth and an increase in the ratio of working-age people to dependants. However, the projected GDP per capita in the Demographic scenario will still be 15.6% less than the Current Path average for lower middle-income countries in Africa.
In the Demographic scenario, the number of poor people in Namibia by 2043 is projected to decline to 1.78 million people, equivalent to 46.9% of the population. This means that the Demographic scenario will reduce extreme poverty in Namibia by 10 000 people by 2043, equivalent to 0.1 percentage points below the Current Path forecast and 7.2 percentage points above the Current Path average for upper middle-income countries in Africa in 2043. The decline in extreme poverty in the Demographic scenario stems from the expected reduction in fertility rates and Namibia’s smaller population compared to the Current Path forecast. However, since fertility rates are already low, the impact is minimal.
This section presents reasonable but ambitious improvements in the Health/WaSH scenario, which include reductions in the mortality rate associated with both communicable diseases (e.g. AIDS, diarrhoea, malaria and respiratory infections) and non-communicable diseases (NCDs) (e.g. diabetes), as well as improvements in access to safe water and better sanitation. The acronym WaSH stands for water, sanitation and hygiene.
The intervention is explained here in the thematic part of the website.
The Namibian health system is comprised of four components: intermediate and referral hospitals, clinics, health centres and district hospitals. Despite being an upper middle-income country, it has a high rate of HIV/AIDS, ranking the sixth highest in the world, sharing the burden with many of its Southern African neighbours. For instance, in 2014, the country spent US$200 million on the prevention and treatment of HIV/AIDS cases, and about 210 000 Namibians were living with HIV/AIDS in 2019. The doctor to patient ratio is very low; it is estimated that there are about 0.33 doctors for every 1 000 people in the country. While the public healthcare system serves 82% of the population, the private sector which is more lucrative has about 72% of the doctors in the country serving just 18% of the Namibian population. To address the shortage of doctors in the country, the government is providing scholarships to medical students who will eventually join the public sector.
The average life expectancy at birth in Namibia in 2019 was 66.3 years, which was above the average of 64.7 for upper middle-income countries in Africa. This relatively higher life expectancy in Namibia can be explained by Namibia’s success in reducing deaths emanating from communicable diseases. Between 2005 and 2019, deaths from communicable diseases declined significantly from 16 600 to 8 200. Non-communicable diseases such as HIV/AIDS, cardiovascular diseases, lower respiratory infections, tuberculosis, diarrhoea and cerebrovascular diseases, among others, are the leading causes of death in the country.
On average, females have a higher life expectancy at birth (70.6 years) compared to males (61.7 years). Half of all deaths in males are as a result of injuries with a significant prevalence of self-harm among young men. In the Health/WaSH scenario, life expectancy will increase to 74.6 years by 2043, which will be 0.8 years above the Current Path forecast of 73.8 and about 5 years higher than the Current Path average of 70 years for upper middle-income African countries. In both the Current Path forecast and the Health/WaSH scenario, females will continue to enjoy a longer life expectancy compared to males. By 2043, average female life expectancy will be 10.2 years longer than that of males in both the Current Path forecast and the Demographic scenario.
The infant mortality rate per 1 000 live births in 2019 in Namibia was 28, which was lower than the average of 30.4 for upper middle-income countries in Africa. By 2043, infant mortality per 1 000 live births in the country will be 14.3 in the Health/WaSH scenario and 15.3 in the Current Path forecast. Also, the projections for infant mortality in the Health/WaSH scenario are 10.9 deaths fewer compared to the Current Path average of 25.2 for upper middle-income countries in Africa. However, the Demographic scenario leads to a much quicker reduction in infant mortality compared to the Health/WaSH scenario.
The Agriculture scenario represents reasonable but ambitious increases in yields per hectare (reflecting better management and seed and fertiliser technology), increased land under irrigation and reduced loss and waste. Where appropriate, it includes an increase in calorie consumption, reflecting the prioritisation of food self-sufficiency above food exports as a desirable policy objective.
The intervention is explained here in the thematic part of the website.
The data on yield per hectare (in metric tons) is for crops but does not distinguish between different categories of crops.
The average yield per hectare for crops in Namibia was 1.6 metric tons in 2019, which was just a third of the average of 4.7 metric tons per hectare for upper middle-income countries in Africa. This is not surprising given that the country is subjected to regular droughts with a climate that is not suitable for agriculture. In the Current Path forecast, yields per hectare will increase by 25% to 2 metric tons by 2043. In the Agriculture scenario, yield per hectare will increase quicker such as that by 2043, it will reach almost 3 metric tons, 0.95 metric tons (or 47%) above the projections in the Current Path. As a result, annual crop production in Namibia will increase from about 1.2 million metric tons in 2019 to 2.1 million metric tons in the Agriculture scenario in 2043, which will be 50% above the Current Path forecast of 1.4 million metric tons for that year.
Agricultural exports in the form of animal products, live animals and crops account for about 10.7% of Namibians export. The country exports meat to Europe and South Africa. In 2016, Namibia became the only country in Africa that was qualified to export beef to the United States. However, the country also imports large volumes of fruits and vegetables due to the unfavourable climate. Namibia’s net agricultural import for 2019 was 1.8% of agricultural demand, 1 percentage point below the average for upper middle-income countries in Africa. In an effort to improve agricultural productivity and ensure food security, the government initiated the Green Scheme to boost the development of irrigation and increase crop production. As a result, the AgriBusDev company was set up to oversee the implementation of the Green Scheme programme which has so far supervised at least 11 Green Scheme irrigation projects. Also, the government established the Agro-Marketing and Trade Agency (AMTA) to coordinate and manage the marketing and trading of agricultural products in the country through the national strategic food reserves facilities and the fresh produce business hubs for food security.
Based on the Current Path forecast, net agricultural imports will increase to 34.4% of total demand by 2043, signalling a growth in the importation of agricultural goods, also due to changes in dietary preferences. In the Agriculture scenario, this phenomenon is mitigated such that by 2043, import dependency is projected to reach 16.3%. Although this is quite high, it will be below the projected Current Path average of 20.7% for upper middle-income countries in Africa on the Current Path.
By 2043, GDP per capita in the Agriculture scenario will increase from US$10 419 in 2019 to US$16 023, constituting about 5% (US$730) growth above the Current Path forecast. This will be 10.6% lower than the Current Path average of US$17 734 for upper middle-income countries in Africa. The agriculture sector plays an integral role in job creation especially for the rural population in Namibia, therefore, improvements in agriculture in terms of improved methods of farming and higher yielding seeds will improve local economic development and impact the economy as a whole.
In the Agriculture scenario, it is forecasted that the number of people that will be living in extreme poverty in Namibia will be 1.73 million (45.5% of the population) by 2043. This represents a 1.5 percentage point decline from the Current Path forecast of 47% in the same year. The extreme poverty rate in this scenario will however be 5.8 percentage points above the Current Path average for upper middle-income countries in Africa. With agriculture serving as a source of livelihood directly or indirectly to over 70% of the population, the Agriculture scenario has the potential to reduce extreme poverty by 60 000 people, underlining the need to prioritise agriculture and embark on an agricultural revolution.
The Education scenario represents reasonable but ambitious improved intake, transition and graduation rates from primary to tertiary levels and better quality of education. It also models substantive progress towards gender parity at all levels, additional vocational training at secondary school level and increases in the share of science and engineering graduates.
The intervention is explained here in the thematic part of the website.
The constitution of the new government guaranteed the right to education for all of the citizens of Namibia. In 2001, the Education Act extended the free tuition to secondary school up to Grade 12. As a result, education is free and compulsory from age 6 to 16. However, learners are required to pay for learning materials such as stationery, books, uniforms and hostel. As a result, the country has made great strides in improving educational outcomes. Primary enrolment increased from 60% in 1990 to 95% in the early 2000s, and it is estimated that the literacy rate for people 15 years and older in the country is about 91.5%. The government has increased its expenditure on education, constituting about 20% of GDP in 2016 — far higher than most advanced countries. Despite this progress, the educational system is still plagued with challenges relating to the quality of education in the country, such as inadequate schools, lack of qualified teachers, high repetition and dropout rates as well as inequality in educational standards across schools. There are also problems relating to skills development of learners.
In 2019, the mean years of adult education in Namibia was estimated to be 7 years, which was 40% lower than the average of 9.8 for upper middle-income countries on the continent. In terms of gender disparity, the mean years of education for females was 7.3, which was 0.5 years higher than for males making Namibia one of the few countries in Africa whose gender disparity in educational attainment is in favour of females. However, this gap in favour of females for mean years of education in Namibia is higher than the average of 0.2 years for upper middle-income countries in Africa, meaning that Namibia has performed relatively poorly at closing the gender gap in access to education.
In the Education scenario, the mean years of adult education will rise to 9.1 years by 2043, which will be 1.3 years below the average for upper middle-income countries in Africa, but 0.1 years above the Current Path forecast. Also, the gender gap regarding mean years of education will be 0.5 years in favour of females in 2043 in the Current Path forecast and 0.4 years in the Education scenario.
In 2019, primary education quality in Namibia was below the average for upper middle-income Africa and set to strongly improve in the Education scenario. Secondary education quality, currently above the average for its peer group, is set to improve rapidly in the Education scenario.
The average test score for primary learners in Namibia in 2019 was 32.5%, lower than the average of 37.1% for upper middle-income countries in Africa. The Education scenario will increase average test scores for primary learners so that by 2043, the average test score for primary learners in Namibia of 43.4% will be 16.4% above the Current Path forecast. Also, the quality of primary education in the Education scenario will be 15.7% higher than the Current Path average of 37.5% for upper middle-income African countries.
By 2043, the average test scores for secondary learners in the Education scenario will improve from 43% to 54.1%. This will be about 20% above the Current Path forecast and be 31.3% higher than the Current Path average for upper middle-income countries in Africa.
By 2043, GDP per capita as a result of the Education scenario will increase to US$15 849, representing an increase of US$556 above the Current Path forecast in the same year, translating into an improvement of 3.6%. The contribution of education to economic growth stems from its contribution to the human capital formation of the economy, which is a significant factor for economic growth. However, this impact takes time to materialise. The projected GDP per capita in the Education scenario will be 11.9% below the Current Path average of US$17 734 for upper middle-income countries in Africa.
By 2043, in the Education scenario, the number of extremely poor people will be 1.71 million, equivalent to 45% of Namibia’s population, meaning that the Education scenario will reduce extreme poverty for about 80 000 people in 2043 relative to the Current Path forecast. This is comparable to a 2 percentage point decline in extreme poverty in the same period. Education equips people with the requisite skills to either start a business or acquire jobs that help to improve their income, thereby improving their standard of living. The proportion of poor people based on the Education scenario in Namibia will be 5.3 percentage points above the average for upper middle-income countries in Africa on Current Path in 2043.
The Manufacturing/Transfers scenario represents reasonable but ambitious manufacturing growth through greater investment in the economy, investments in research and development, and promotion of the export of manufactured goods. It is accompanied by an increase in welfare transfers (social grants) to moderate the initial increases in inequality that are typically associated with a manufacturing transition. To this end, the scenario improves tax administration and increases government revenues.
The intervention is explained here in the thematic part of the website.
Chart 30 should be read with Chart 8 that presents a stacked area graph on the contribution to GDP and size, in billion US$, of the Current Path economy for each of the sectors.
The three sectors that made the largest contributors to GDP in Namibia in 2019 were services (60%), manufacturing (19.4%) and agriculture (8.6%). In the Current Path forecast, the service sector increases its contribution to 60.3%, manufacturing increases to 20.7% and agriculture declines to 4.2%. In the Manufacturing/Transfers scenario the service sector is projected to contribute US$1.3 billion more to GDP, equivalent to 3.9 percentage points above the Current Path, by 2043. The ICT sector is also projected to contribute an additional US$80 million to GDP by 2043, although its rate of contribution will correspond to 0.4 percentage points above the Current Path. The energy sector will make an absolute contribution of an additional US$20 million, equivalent to a rate of contribution of 1 percentage points above the Current Path by 2043. The agriculture, manufacturing and materials sectors’ contribution will decline to 0.49, 0.38 and 0.48 percentage points, respectively, below the Current Path forecast in 2043.
The total welfare transfers to households in Namibia in 2019 amounted to US$1.3 billion. In the Manufacturing/Transfers scenario, this amount will more than quadruple to US$5.3 billion by 2043, constituting an increase of about 308.4% from 2019 to 2043. This exceeds the projected US$3.2 billion in the Current Path, meaning that the Manufacturing/Transfers scenario leads to an increase in government welfare transfers of 65.6%, equivalent to an additional US$2.1 billion relative to the Current Path in 2043.
GDP per capita in the Manufacturing/Transfers scenario will reach US$16 644 in 2043. This forecast represents an 8.8% improvement (equivalent to US$1 351) above the Current Path forecast for that year. The manufacturing sector is historically the largest provider of jobs and allows for the structural transformation of economies towards higher productivity and knowledge with spillover effects on other sectors. It is therefore not surprising that the Manufacturing/Transfers scenario leads to such a sizable improvement in GDP per capita. However, the GDP per capita for Namibia by 2043 in the Manufacturing/Transfers scenario will still be US$6.5% (US$1 090) below the average of US$17 734 for upper middle-income countries in Africa on the Current Path.
The total number of the extremely poor population in the Manufacturing/Transfers scenario by 2043 is 1.56 million, representing 41.2% of Namibia’s population. This is 230 000 people fewer than the 2043 Current Path forecast of 1.79 million, translating into a 5.8% decline in extreme poverty rate compared to the Current Path forecast for 2043. It means that Namibia can reduce poverty by aggressively pursuing a low-end manufacturing growth path including the associated investments in research and development and by promoting trade; but such a growth path needs to be accompanied by increases in welfare transfers to buffer the transition. The extreme poverty rate in Namibia in this scenario will just be 2 percentage points higher than the Current Path average among its income peers in Africa.
The Leapfrogging scenario represents a reasonable but ambitious adoption of and investment in renewable energy technologies, resulting in better access to electricity in urban and rural areas. The scenario includes accelerated access to mobile and fixed broadband and the adoption of modern technology that improves government efficiency and allows for the more rapid formalisation of the informal sector.
The intervention is explained here in the thematic part of the website.
Fixed broadband includes cable modem Internet connections, DSL Internet connections of at least 256 KB/s, fibre and other fixed broadband technology connections (such as satellite broadband Internet, ethernet local area networks, fixed-wireless access, wireless local area networks, WiMAX, etc.).
In 2019, the total number of fixed broadband subscriptions in Namibia was estimated to be about 3.5 per 100 people, which was 26% lower than the average of 4.4 for upper middle-income countries in Africa on the Current Path. In the Current Path forecast, fixed broadband subscriptions will rise to 27.6 per 100 people. However, the Leapfrogging scenario will lead to a much larger increase in fixed broadband subscriptions so that by 2043, total fixed broadband subscriptions will be 49.9 subscriptions per 100 people — 80.8% more than in the Current Path forecast in 2043. The fixed broadband subscription rate in the Leapfrogging scenario for 2043 will be 66.6% greater than the Current Path average of 29.6 subscriptions per 100 people for upper middle-income African countries.
Mobile broadband refers to wireless Internet access delivered through cellular towers to computers and other digital devices.
In 2019, Namibia had a mobile broadband subscription rate of 75.2 per 100 people, about 15% lower than the average of 49.1 for upper middle-income countries on the continent. Because mobile broadband subscriptions are already high in Namibia and the Current Path forecast is very aggressive, both the Current Path forecast and the Leapfrogging scenario reach a saturation level of 153 subscriptions per 100 people in 2043, almost equal to the average for Africa’s upper middle-income countries. However upper middle-income Africa reaches saturation by as early as 2025 in the Leapfrogging scenario.
Electricity generation in Namibia is sourced from hydropower, coal, diesel and thermal. Rising domestic consumption, which is projected to reach 1 348 MW in 2030, together with peak power challenges, transmission challenges and the fall in surplus capacity from SADC has resulted in the country resorting to independent power producers. This is worsened by the unreliable Ruacana Hydroelectric Power Station, which is the biggest local energy source; however, it fluctuates due to unreliable rainfall. The number of people who had access to electricity in 2019 was 1.3 million, constituting 50.1% of the Namibian population. This was far lower than the average of 81.6% for upper middle-income countries in Africa suggesting Namibia is lagging behind its peers in terms of electricity access.
The proportion of urban residents who had access to electricity in 2019 was 66.2%. compared to the 34.3% for rural dwellers, indicating disparity in favour of urban dwellers in access to electricity. By 2043, in the Leapfrogging scenario, about 3.4 million people in Namibia (88.1% of the population) will have access to electricity compared to 3 million (78.1% of the population) in the Current Path forecast. The per cent of people with access to electricity in the Leapfrogging scenario in 2043 will be almost equal to the average of 87.7% for upper middle-income countries in Africa on the Current Path. By 2043, the proportion of urban residents who will have access to electricity will be 90.7% and 82.5% in the Leapfrogging scenario and the Current Path forecast, respectively. The portion of people in rural areas who will have access to electricity is estimated to be 83.2% and 69.7% in the Leapfrogging scenario and the Current Path forecast, respectively. This suggests that the disparity in favour of urban residents will be lower in the Leapfrogging scenario compared to the Current Path forecast by 2043.
Access to broadband has the potential to increase GDP through its effect on reducing transaction costs for businesses. It can also open up new connectivity to a greater clientele and can help firms adopt efficient technology that can improve productivity which will ultimately lead to growth. Namibia’s GDP per capita is estimated to increase to US$16 012 in 2043 based on the Leapfrogging scenario. This constitutes an increase of US$719 (4.7%) compared to the Current Path forecast of US$15 293 in 2043. However, this will be 10.8% below the Current Path average of US$17 734 for upper middle-income countries in Africa
Based on the Leapfrogging scenario, the number of people that will be living in extreme poverty by 2043 is 1.72 million, representing 45.4% of the population. This projection is 70 000 people below the estimation of 1.79 million in the Current Path forecast in the same year. The proportion of people living in extreme poverty projected in the Leapfrogging scenario will also be 1.6 percentage points lower than the Current Path forecast and 5.7 percentage points above the Current Path average for upper middle-income African countries in 2043. Extension of electricity access, especially to rural areas, and the adoption of modern technology, including mobile telephony, can help in poverty reduction by increasing productivity and improving the output of micro and small businesses, especially in the informal sector.
The Free Trade scenario represents the impact of the full implementation of the African Continental Free Trade Area (AfCFTA) by 2034 through increases in exports, improved productivity and increased trade and economic freedom.
The intervention is explained here in the thematic part of the website.
The trade balance is the difference between the value of a country's exports and its imports. A country that imports more goods and services than it exports in terms of value has a trade deficit, while a country that exports more goods and services than it imports has a trade surplus.
Namibia boasts large deposits of mineral resources which constitute a significant proportion of its revenue. Just like many other African countries, these minerals are usually exported in their raw form without value addition. The country exports diamonds, gold, copper, uranium ore and concentrates, radioactive chemicals, and frozen fish fillets to China, South Africa, Botswana, Belgium and Spain. However, Namibia also imports large quantities of refined petroleum products, electricity, refined copper ores, diamonds and foodstuffs from South Africa, Zambia, China, Bulgaria and the Democratic Republic of the Congo. The total export value amounted to about US$6.3 billion in 2019 while the imports stood at US$8.1 billion.
In 2019, Namibia’s trade deficit represented 5.2% of GDP which was below the average of 0.61% of GDP for upper middle-income African countries on the Current Path. In the short term, Namibia’s trade balance improves, reaching a peak of a surplus of 9.8% in the Free Trade scenario and 9.1% on the Current Path in 2025. Afterwards, the trade balance worsens and bottoms at a deficit of 10.6% on the Current Path and 9.1% in this scenario. Beginning 2041, the trend is reversed such that by 2043, the Current Path forecast leads to a slightly lower deficit of 8.4% compared to the deficit of 10.3% in the Free Trade scenario. These figures suggest that trade liberalisation will improve the trade balance of Namibia in the short term; however, in the long term, it will worsen its trade balance, underlining the importance of additional measures toimprove competitiveness, particularly in growing Namibia’s manufacturing sector.
The GDP per capita for Namibia will reach US$16 361 by 2043 in the Free Trade scenario, which represents a sizable increase of 7% (US$1 068) gain compared to the projections on the Current Path in 2043. This means that Namibia has a huge potential to increase GDP if it takes advantage of the full implementation of the AfCFTA to trade more with other African countries. Intra-country trade among African countries has the benefit of increasing Namibia’s exports since it provides access to a much larger market and ultimately improves the nation’s manufacturing sector. This will lead to more rapid economic growth and increased employment in key sectors. The average GDP per capita for Namibia in the Free Trade scenario will be 8.4% lower than the projected US$17 734 Current Path average for upper middle-income African countries.
The impact of the Free Trade scenario is a small initial increase in extreme poverty, from 2031 to 2037, followed by a rapid reduction in poverty compared to the Current Path forecast. This may be attributed to the redistribution and displacement effect of trade in the short term in which some sectors initially could be made worse off as a result of the increased trade. By 2043, the number of people living in extreme poverty in the Free Trade scenario will be 1.68 million people, representing 44.3% of the population. This is a 2.7 percentage point reduction compared to the Current Path forecast, equivalent to 11 000 fewer poor people. The proportion of poor people projected in the Free Trade scenario is higher than the average of 39.7% for upper middle-income countries in Africa on the Current Path.
The Financial Flows scenario represents a reasonable but ambitious increase in worker remittances and aid flows to poor countries, and an increase in the stock of foreign direct investment (FDI) and additional portfolio investment inflows to middle-income countries. We also reduced outward financial flows to emulate a reduction in illicit financial outflows.
The intervention is explained here in the thematic part of the website.
Namibia received US$313 million (2.1% of GDP) of foreign aid in 2019. This was significantly higher than the average of 0.6% for upper middle-income countries in Africa. A significant proportion of the aid is channelled into the health sector for the treatment and prevention of HIV/AIDS and tuberculosis that is still disproportionately high in the country. Other humanitarian aid also goes to assisting the development of basic education, promotion of good governance and training on natural resources management. The decline in aid in recent years due to the country attaining upper middle-income status has had a deteriorating effect on these sectors, especially health service delivery. The absolute value of foreign aid is projected to increase to US$29.1 million and US$31.7 billion in the Financial Flows scenario and Current Path forecast, respectively, by 2043. This will correspond to 0.07% of GDP in the Financial Flows scenario which will be slightly below the Current Path forecast of 0.08% of GDP. It will also be below the projected 0.12% for average upper middle-income countries in Africa on the Current Path.
Namibia attracts FDI into its natural resources explorations as the country has large deposits of uranium, diamond, zinc, copper and oil, as well as a big tourism sector. As such, the majority of the FDI is in the mining sector from countries such as South Africa, the UK, the US and Germany. However, the investment climate in the country has worsened significantly over the last decade dropping from 54th out of 190 countries in the World Bank 2008 Ease of Doing report to 104th position in the 2020 Doing Business report. The deterioration in the investment climate in the country emanates partly from the stringent measures introduced by the government to strengthen its economy. Investment opportunities to foreigners have been restricted especially in mineral exploration due to increased state control. Also, although property rights are guaranteed by the constitution, parliament can make laws to expropriate and regulate such rights for foreigners. Despite these factors inhibiting the flow of FDI, the country boasts stable democracy, peace and flexible labour regulations that could attract FDI.
The total amount of FDI received by Namibia in 2019 was equivalent to 4.9% of GDP, which was higher than the average of 2.3% for upper middle-income African countries. It means that on average, Namibia attracts relatively more foreign aid than its income peers on the continent. By 2043, FDI in the Financial Flow scenario will increase to 8.5% of GDP. This will be above the 6.8% of GDP in the Current Path for that year and the Current Path average of 3.2% for upper middle-income countries on the continent.
Namibia is a net sender of remittances. In 2019, the country sent US$100 million in remittances, which constituted 0.3% of GDP. This was lower than the average of 0.47% for upper middle-income African countries. By 2043, total remittances sent in the Financial Flows scenario will increase to US$200 million, constituting 0.5% of GDP. This will slightly be higher than 0.49% of GDP in the Current Path forecast. The projections in both the Current Path forecast and the Financial Flows scenario are lower than the average of 0.66% of GDP for upper middle-income countries on the Current Path.
The GDP per capita in Namibia is estimated to rise to US$15 849 by 2043 in the Financial Flows scenario — an increase of US$556 (or 3.6%) above the Current Path forecast. This estimate is 11.9% below the average for upper middle-income countries in Africa, which is projected to be US$17 734 by 2043. Remittances, aid and FDI inflow stimulate economic growth through the multiplier effect on businesses and household expenditure.
Trade openness will reduce poverty in the long term after initially increasing it due to the redistributive effects of trade. Most African countries export primary commodities and low-tech
manufacturing products, and therefore a continental free trade agreement (AfCFTA) that reduces tariffs and non-tariff barriers across Africa will increase competition among countries in primary commodities and low-tech manufacturing exports. Countries with inefficient, high-cost manufacturing sectors might be displaced as the AfCFTA is implemented, thereby pushing up poverty rates. In the long term, as the economy adjusts and produces and exports its comparatively advantaged (lower relative cost) goods and services, poverty rates will decline.
In the Financial Flows scenario, the total number of extremely poor people in Namibia by 2043 will be 1.74 million, equivalent to 45.8% of the total population. This projection constitutes a decline of 50 000 people, representing a 1.2 percentage point reduction from the Current Path forecast in the same year. It will also be 6.1 percentage points above the projected Current Path average for upper middle-income countries in Africa in 2043.
The Infrastructure scenario represents a reasonable but ambitious increase in infrastructure spending across Africa, focusing on basic infrastructure (roads, water, sanitation, electricity access and ICT) in low-income countries and increasing emphasis on advanced infrastructure (such as ports, airports, railway and electricity generation) in higher-income countries.
Note that health and sanitation infrastructure is included as part of the Health/WaSH scenario and that ICT infrastructure and more rapid uptake of renewables are part of the Leapfrogging scenario. The interventions there push directly on outcomes, whereas those modelled in this scenario increase infrastructure spending, indirectly boosting other forms of infrastructure, including those supporting health, sanitation and ICT.
The intervention is explained here in the thematic part of the website.
The total number of people with access to electricity in Namibia in 2019 was 1.3 million, constituting 50.1% of the population. This is projected to increase to 3 million in the Infrastructure scenario, constituting 78.9% of the population in 2043. This will exceed the Current Path forecast of 2.97 million, representing 78.1% of the population. However, it will be lower compared to the average forecast of 87.7% for upper middle-income countries in Africa.
By 2043, electricity access for urban residents in the Infrastructure scenario will be available for 83.4% of the urban population compared to 70.4% of rural dwellers. In the Current Path, electricity access for urban residents will constitute 82.5% of the population compared to 69.7% access for the rural population. Electricity access is additionally hampered by the dispersed nature of the population.
Indicator 9.1.1 in the Sustainable Development Goals refers to the proportion of the rural population who live within 2 km of an all-season road and is captured in the Rural Access Index.
Accessibility to rural areas is essential for improving the integration and interaction between rural and urban economies, which is important for spurring local economic development. The impact of the Infrastructure scenario on rural road access is, however, quite limited. The portion of Namibians who lived within 2 km from all-weather roads in 2019 was 64% — about 20 percentage points lower than the average for upper middle-income Africa. In the Infrastructure scenario, the portion of the rural population with all-season road access will rise to 65.9% by 2043, which is marginally higher than the projected 65.7% in the Current Path forecast but below the average of 84.5% for upper middle-income countries in Africa in that year. This is the result of the low population density and dispersed nature of the rural population.
The impact of the Infrastructure scenario on GDP per capita is small since most of the additional funds are allocated to improved water access and better sanitation with limited impact on increasing average incomes. Namibia’s GDP per capita is projected to rise to US$15 369 by 2043 in the Infrastructure scenario; this is US$76 (or 0.5%) more than the projection in the Current Path forecast in the same year. Also, the estimated GDP per capita in this scenario will be 15.3% less than the Current Path average for its income peers on the continent.
The number of Namibians who live in extreme poverty in the Infrastructure scenario in 2043 will be 1.78 million (46.7% of the population). This constitutes a reduction of 10 000 people (a 0.3 percentage point decline) from the Current Path forecast of 1.79 million (47% of the population). Compared to other scenarios such as Agriculture, Free Trade and Education, the Infrastructure scenario has minimal impact on poverty reduction in Namibia. The poverty rate in the Infrastructure scenario in 2043 will also be higher than the Current Path average of 39.7% for upper middle-income countries in Africa.
The Governance scenario represents a reasonable but ambitious improvement in accountability and reduces corruption, and hence improves the quality of service delivery by government.
The intervention is explained here in the thematic part of the website.
As defined by the World Bank, government effectiveness ‘captures perceptions of the quality of public services, the quality of the civil service and the degree of its independence from political pressures, the quality of policy formulation and implementation, and the credibility of the government’s commitment to such policies’.
Chart 51 presents the impact of the interventions in the Governance scenario on government effectiveness.
Namibia does well on the World Bank government effectiveness index. In 2019, Namibia’s score for government effectiveness was 2.73 out of a possible score of 5, which was fifth highest in Africa. Government effectiveness will improve in both the Current Path forecast and Governance scenario. By 2043, Namibia’s score in government effectiveness is projected to reach 3.11, which will be a mere 0.02 points above the Current Path forecast. It will, however, be 11.5% higher than the average for upper middle-income countries in Africa.
In the Governance scenario, Namibia’s GDP per capita is projected to increase to US$15 598 in 2043, constituting an increase of US$303, about 2% above the Current Path forecast in the same year. However, this figure is 12% below the average of US$17 734 for upper middle-income countries on the continent in the same year. Good governance in the form of adherence to the rule of law, reduced corruption, improved transparency and enhanced accountability would lead to more rapid economic growth in Namibia.
The proportion of people living below the poverty line of US$5.50 is expected to decline to 46.2%, constituting 1.76 million people, in 2043 in the Governance scenario. It corresponds to about 30 000 fewer extremely poor people compared to the Current Path forecast for 2043. This is higher than the 39.7% average for upper middle-income African countries on the Current Path.
This section presents projections for carbon emissions in the Current Path for Namibia and the 11 scenarios. Note that IFs uses carbon equivalents rather than CO2 equivalents.
The intervention that will lead to the highest emission of carbon is the Manufacturing/Transfers scenario, with projected emissions of 3.5 million tons in 2043. It is not surprising given that the scenario also results in the largest growth in the size of the economy and GDP per capita. This will be followed by the Free Trade and Agriculture scenarios with estimated emissions of 3.4 million tons each. Conversely, the Infrastructure and Demographic scenarios are the interventions that lead to the least carbon emissions in 2043 due to their limited impacts on economic growth in the forecast horizon.
The Combined Agenda 2063 scenario consists of the combination of all 11 sectoral scenarios presented above, namely the Stability, Demographic, Health/WaSH, Agriculture, Education, Manufacturing/Transfers, Leapfrogging, Free Trade, Financial Flows, Infrastructure and Governance scenarios. The cumulative impact of better education, health, infrastructure, etc. means that countries get an additional benefit in the integrated IFs forecasting platform that we refer to as the synergistic effect. Chart 55 presents the contribution of each of these 12 components to GDP per capita in the Combined Agenda 2063 scenario as a stacked area graph.
The synergistic effect on GDP per capita in Namibia is projected to reach US$1 984 in 2043, meaning that intersectoral linkages and the combined effects of the various scenarios will result in additional improvement in GDP per capita. The scenarios that result in the greatest improvement in GDP per capita by 2043 are the Manufacturing/Transfers scenario followed by the Free Trade, Agriculture and then the Leapfrogging scenarios, suggesting that these are the sectors to be pursued to unlock more rapid economic growth in the next two decades. The scenarios with the least impact on GDP per capita are the Demographic and Infrastructure.
Whereas Chart 55 presents a stacked area graph on the contribution of each scenario to GDP per capita as well as the additional benefit or synergistic effect, Chart 56 presents only the GDP per capita in the Current Path forecast and the Combined Agenda 2063 scenario
Namibia’s GDP per capita is estimated to more than double from US$10 419 in 2019 to US$23 261 in 2043 in the Combined Agenda 2063 scenario, representing an increase of 152% over the forecast period. This will be US$7 968 higher than the projected US$15 293 on the Current Path meaning that the Combined Agenda 2063 scenario could improve GDP per capita by 52.1% in 2043. Also, Namibia’s GDP per capita in the Combined Agenda 2063 scenario will be 31.2% more than the Current Path average of US$17 734 for upper middle-income countries in Africa in 2043. The Combined Agenda 2063 scenario is the aggregation of all the sectoral scenarios and therefore the expected sizable impact on GDP per capita.
In the Combined Agenda 2063 scenario, both the number and proportion of poor people in Namibia will significantly decline. By 2043, about 1.09 million people in the country (28.7% of the population) will be living in extreme poverty. This means that compared with the Current Path forecast, an overwhelming 700 000 additional people of the Namibian population could be lifted out of poverty by 2043. This is equivalent to an 18.3 percentage point decline in poverty compared to the Current Path forecast in the same year. Furthermore, the projections for the proportion of poor people in Namibia in the Combined Agenda 2063 scenario will be 11 percentage points lower than the Current Path average of 39.7% for upper middle-income African countries by 2043.
See Chart 8 to view the Current Path forecast of the sectoral composition of the economy.
In the Combined Agenda 2063 scenario, the largest contributors to GDP, overall, will be the service, manufacturing and ICT sectors, respectively. By 2043, the Combined Agenda scenario will result in the service sector contributing an additional US$22.5 billion to GDP, equivalent to 8.4 percentage points of GDP above the Current Path forecast. The manufacturing sector is projected to contribute an additional US$2.2 billion in 2043 although its rate of contribution will decline such that by 2043, it will amount to 5.2 percentage points of GDP below the Current Path forecast. The ICT sector is projected to contribute an additional US$1.9 billion — equivalent to 0.2 percentage points of GDP below the Current Path forecast. The contribution of the agriculture and materials sectors will correspond to additional US$500 million and US$400 million, respectively, although their contributions to GDP would be less compared to the Current Path forecast by 2043.
|
GDP (MER) in the Combined Agenda 2063 scenario is projected to rise to US$69.2 billion, representing an increase of 324.5% over the period from 2019 to 2043. This will exceed the Current Path estimates of US$41.5 billion, meaning that the Combined Agenda 2063 will increase the size of the economy by an additional US$27.7 billion by 2043, representing a 66.8% increase compared to the Current Path forecast. The Combined Agenda 2063 scenario will lead to enormous growth in the economy due to the intersectoral impact of the policy interventions underpinning the various scenarios, which are necessary for achieving sustainable economic development in Namibia. |
In 2019, Namibia ranked 28th in terms of carbon emissions in Africa and will drop to 34th position in 2043 in the Current Path forecast given its reliance on hydro and other renewable energy sources coupled with the projected relatively slower economic growth compared to other countries. The total carbon projected to be emitted in Namibia in the Combined Agenda 2063 scenario will be 4.4 million tons, representing a 267% increase from the 1.2 million tons recorded in 2019. This constitutes almost 38% above the estimated 3.2 million tons in the Current Path forecast in 2043. It suggests that achieving sustainable economic development in Namibia will come at the cost of increased carbon emission. As such, Namibia must adopt and implement energy transition to renewable energies in order to reduce the projected carbon emission.
Page information
Contact at AFI team is Enoch Randy Aikins
This entry was last updated on 15 June 2026 using IFs v7.63.
Donors and sponsors


Reuse our work
- All visualizations, data, and text produced by African Futures are completely open access under the Creative Commons BY license. You have the permission to use, distribute, and reproduce these in any medium, provided the source and authors are credited.
- The data produced by third parties and made available by African Futures is subject to the license terms from the original third-party authors. We will always indicate the original source of the data in our documentation, so you should always check the license of any such third-party data before use and redistribution.
- All of our charts can be embedded in any site.
Cite this research
Enoch Randy Aikins (2026) Namibia Development Futures. Published online at futures.issafrica.org. Retrieved from https://futures.issafrica.org/geographic/countries/namibia/ [Online Resource] Updated 15 June 2026.