 Malawi
Feedback welcome
Our aim is to use the best data to inform our analysis. See our About page for information on the IFs forecasting platform. We appreciate your help and references for improvements via our feedback form.
Summary
- Current Path
- Malawi’s population has grown significantly from 3.6 million people in 1960 to an estimated 19.1 million in 2021. On the Current Path, Malawi’s population is expected to reach 24.2 million people by 2030, and by 2063 the country is likely to have a population of 38.8 million. Jump to Demographics
- Malawi’s score on the HDI increased from 0.34 in 1990 to 0.48 in 2019, ranking the country in 174th out of 189 countries globally. On the Current Path, Malawi's HDI score is forecast to improve and remains on par with the targets set out in MW2063 until 2050. Jump to Human Development
- The poverty rate at the national poverty line was estimated to be 51.5% in 2017, compared to 50.7% in 2011. The ambitious target of the government is to halve it by 2030. On the Current Path, the poverty rate is forecast to decline gradually to reach 52.6% by 2030, about 18 percentage points above the projected average of 34.5% for low-income Africa in the same year. Jump to Poverty and income inequality
- In 2020, only 18% of the country's total population had access to electricity, compared to 34% for the average for low-income Africa. On the Current Path, the national electricity access rate in Malawi does show improvements, reaching 26.5% of Malawi's population by 2030, but will remain far below the government's target of 50% by 2030. Jump to Infrastructure
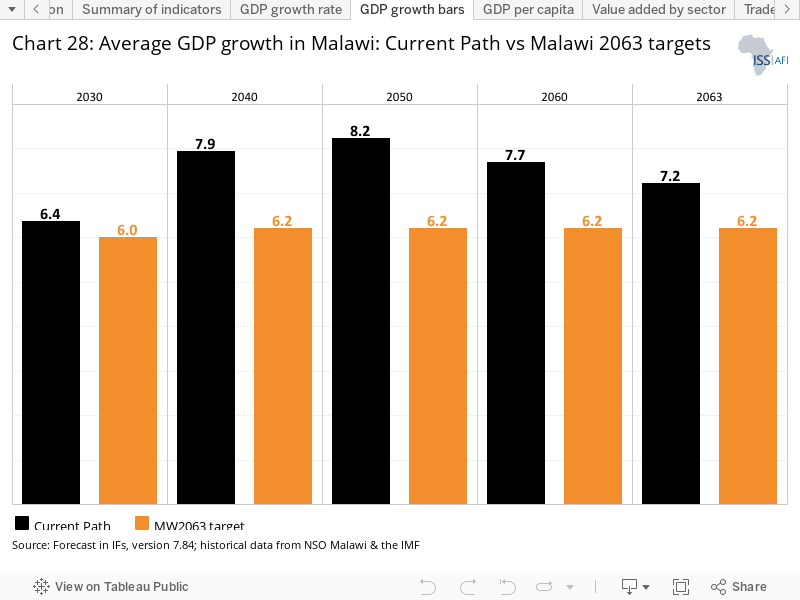
- Across the forecast horizon, the maximum economic growth rate in Malawi is 8.3%. As a result, Malawi's GDP will substantially increase by about 62.8%, from US$12.01 billion in 2020 to US$19.56 billion in 2030. The size of the economy is forecast to be US$235.3 billion by 2063. Jump to Economy
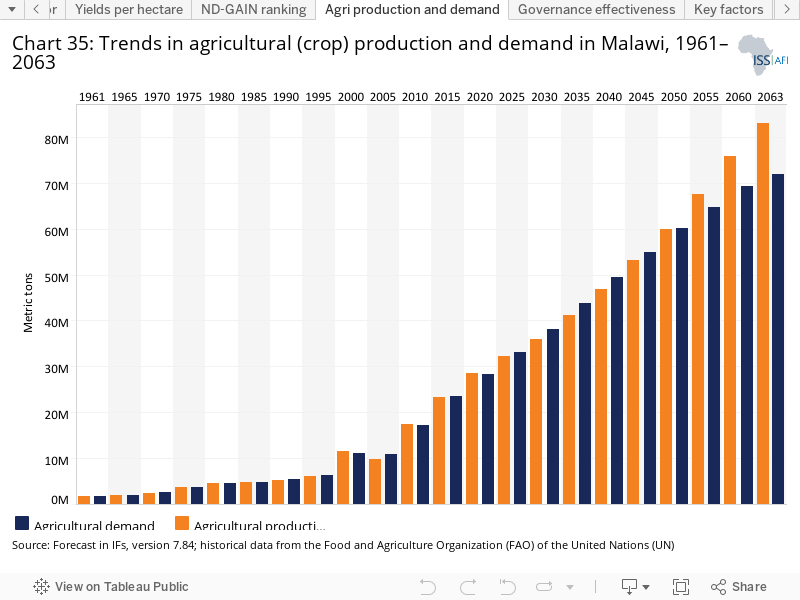
- In 2020, 27.7 million metric tons of crops were produced, a significant increase from the 5 million metric tons produced in 1990. In the Current Path forecast, crop production is forecast to increase to 34.4 million metric tons by 2030 and to an estimated 78 million metric tons by 2063. In the Current Path forecast, agricultural crop demand is set to increase from 27.4 million metric tons in 2020 to about 36.6 million metric tons by 2030 and to 67.2 million metric tons by 2063. Jump to Agriculture and climate change
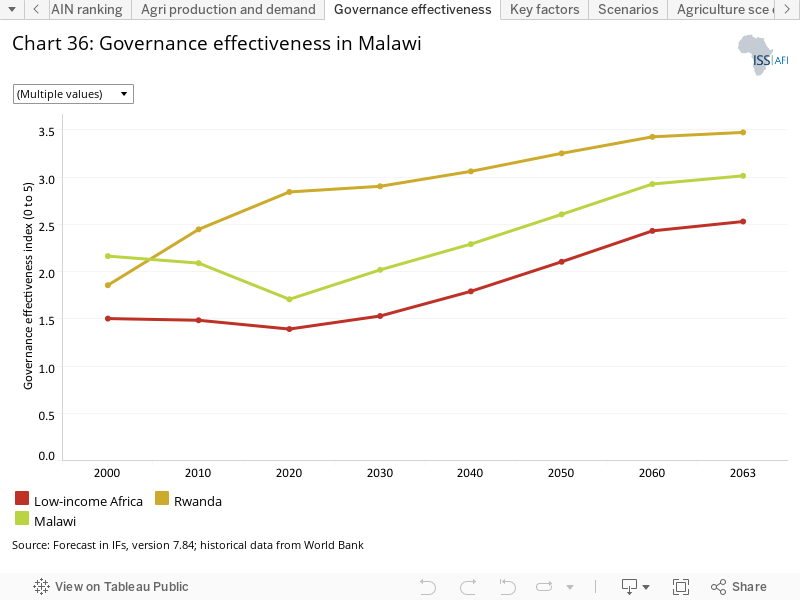
- Governance effectiveness in Malawi steadily declined over the last decade but remained above the average for its peers. In 2020, the governance effectiveness score for Malawi was 1.7 out of 5. On the Current Path, it is forecast to stay above the average for its peer income group in Africa. Jump to Governance development
- Scenarios
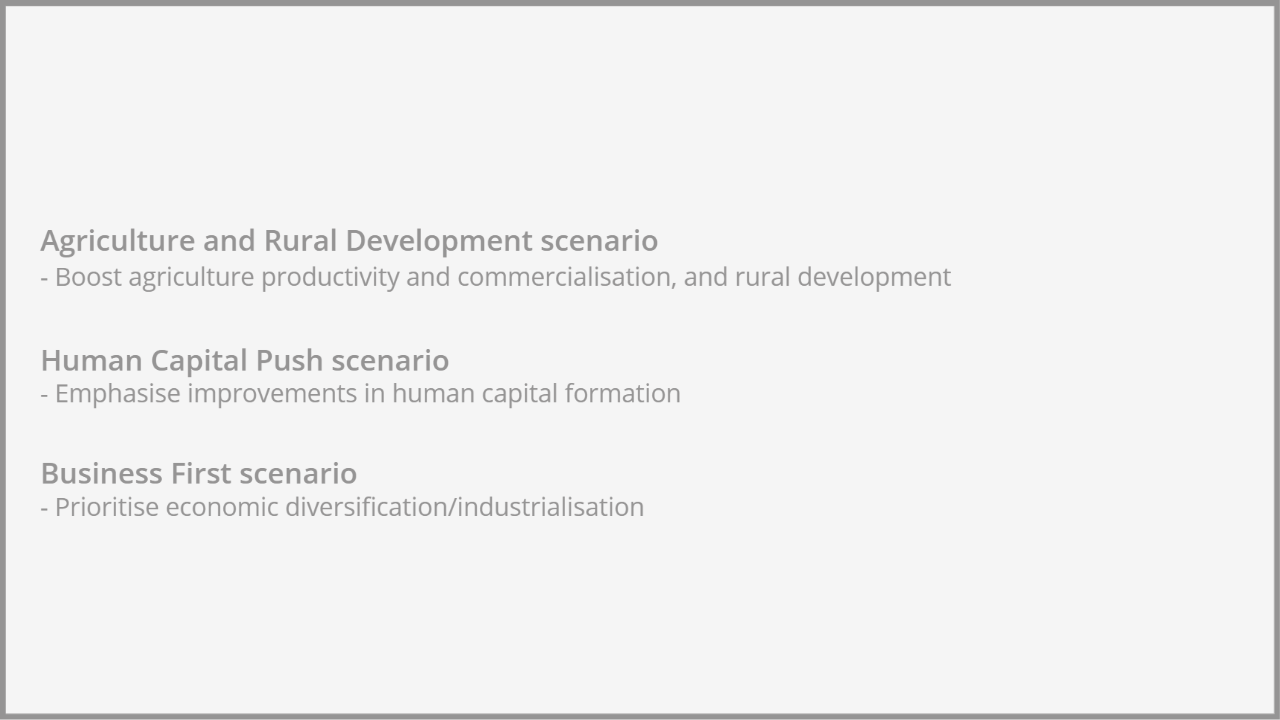
- The implementation of the Agriculture and Rural Development scenario is forecast to increase agricultural export to be 5.7 million metric tons by 2030 and 52.7 million metric tons by 2063, then about 41.5 million metric tons larger than the Current Path forecast. Malnourishment in the population is also halved by 2030 compared to the Current Path and the country becomes a net exporter of agricultural produce. Jump to Agriculture and Rural Development scenario
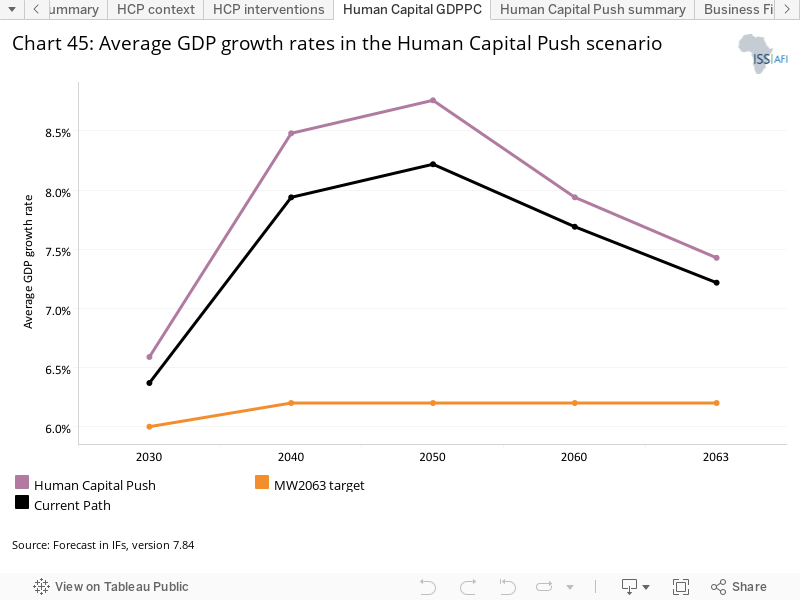
- In the Human Capital Push scenario, fertility rates are brought down to 2.3 births per woman by 2030, compared to 3.4 on the Current Path, reducing the population in 2030 to 23.5 million people instead of 24.2 million on the Current Path. This decline in the fertility rate could help Malawi start reaping its demographic dividend in 2033, eight years earlier than in the Current Path forecast. Jump to Human Capital Push scenario
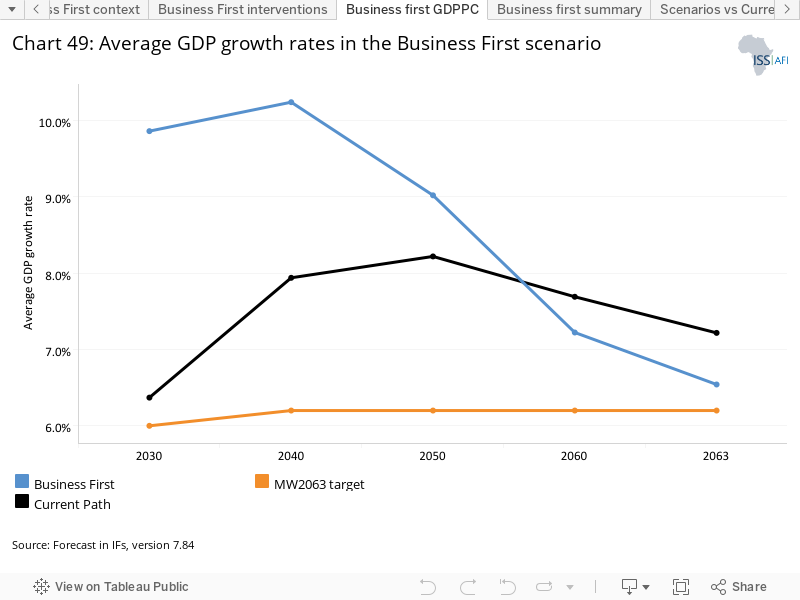
- As encapsulated in the Business First scenario, investment aimed at developing non-resources sectors such as manufacturing take time to yield expected results. This is typically associated with short- to medium-term costs relating to poverty or consumption and as such, household consumption will represent 66.7% of GDP by 2030 compared to 78.7% on the Current Path. However, in the long term, the Business First scenario generates inclusive wealth creation. The average growth rate between 2030 and 2040 is 10.2% compared with 7.3% on the Current Path. Jump to Business First scenario
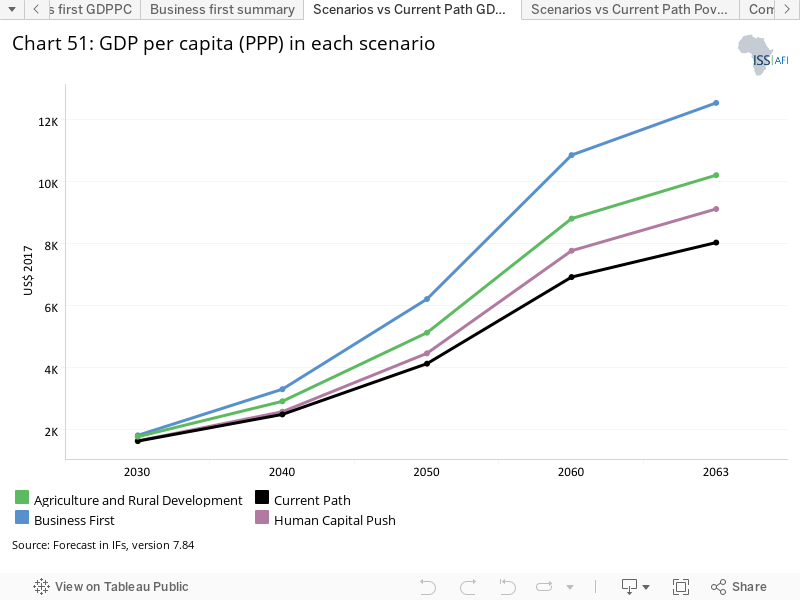
- Between the three scenarios, the Business First scenario has the biggest impact on GDP per capita by 2030 and by 2063 with GDP per capita equalling US$1 827 in 2030, and US$12 524 in 2063. Jump to Comparing scenario impact
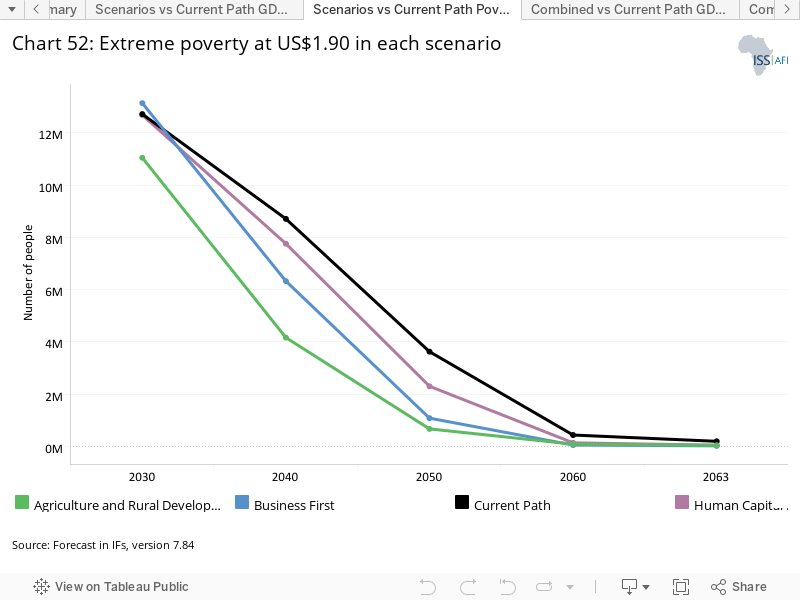
- All three scenarios lead to inclusive wealth creation as the poverty rate in each scenario is lower than the Current Path forecast, but, between 2023 and 2050, the Agriculture and Rural Development scenario leads to more inclusive wealth creation as it has the lowest number of people living in poverty. Jump to Comparing scenario impact
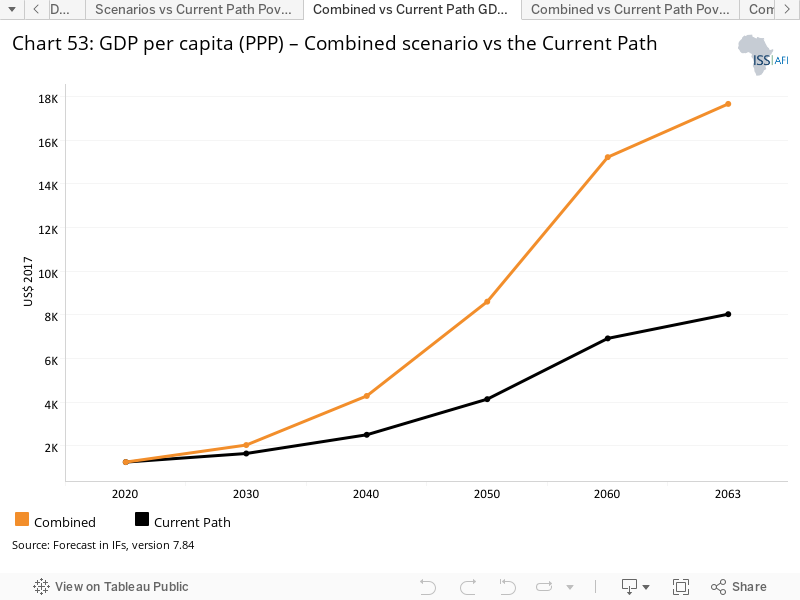
- The implementation of Combined scenario leads to an average growth rate of 8.5% between 2022 and 2030, 3.5 percentage points above the Current Path over the same period. Jump to The Combined scenario/MW2063 scenario
- In the Combined scenario, GDP per capita (PPP) is US$2 029 by 2030 (US$387 higher than the Current Path forecast) and US$17 669 by 2063 (US$9 639 more than the Current Path forecast). In the scenario, Malawi could graduate to lower middle-income status by 2032 and achieve upper middle-income status in 2058. Jump to The Combined scenario/MW2063 scenario
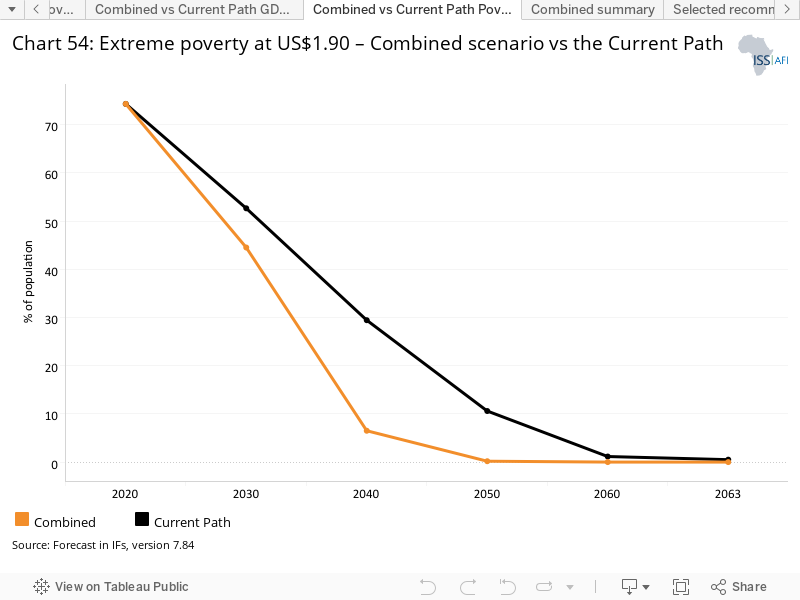
- The Combined scenario leads to more inclusive wealth creation, especially in the long term. Malawi achieves the elimination of extreme poverty (defined as the rate below 3% of the population) in 2043, 14 years earlier than the Current Path forecast. Jump to The Combined scenario/MW2063 scenario
- Conclusion and recommendations Jump to Conclusion and policy recommendations
- The starting point is to improve governance transparency and effectiveness, by improving the public financial management system, domestic revenue mobilisation and increase investigative journalism.
- Malawi has made progress in improving agriculture productivity but much more needs to be done through investments in productivity enhancing technologies, improvements in agricultural subsidy programme and by improving the rural transport network.
- Malawi needs to expand economic diversification and industrialisation for inclusive wealth creation and should do so by improving the quality of business regulation, encouraging a entrepreneurial mindset and investing in human capital and skills development.
- In sum, a dedicated implementation of these policies centred around the three pillars of MW2063 could help Malawi achieve its development objectives
All charts for Malawi
- Chart 1: Political map of Malawi
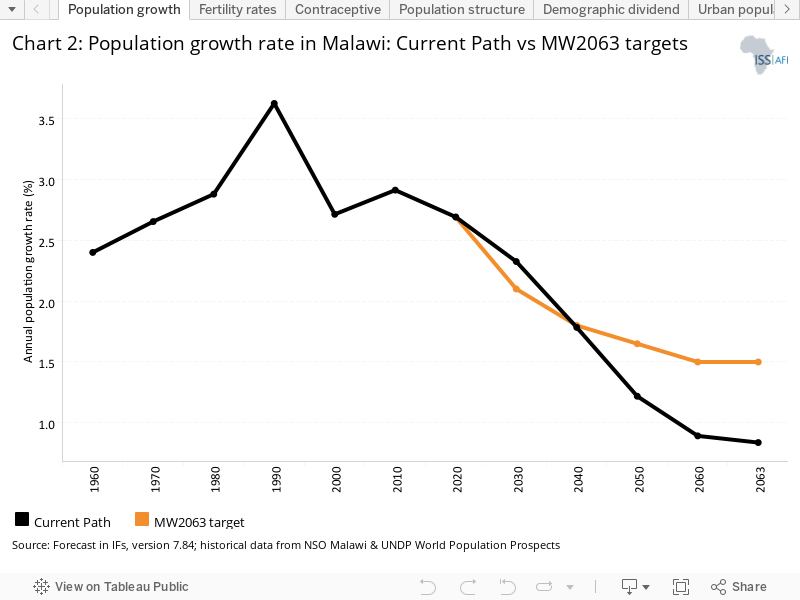
- Chart 2: Population growth rate in Malawi: Current Path vs MW2063 targets
- Chart 3: Fertility rates in Malawi: Current Path vs MIP-1 targets, 2022–2030
- Chart 4: Modern contraceptive prevalence in Malawi: Current Path vs MIP-1/SDG targets, 2022–2030
- Chart 5: Population structure in Malawi
- Chart 6: Demographic dividend
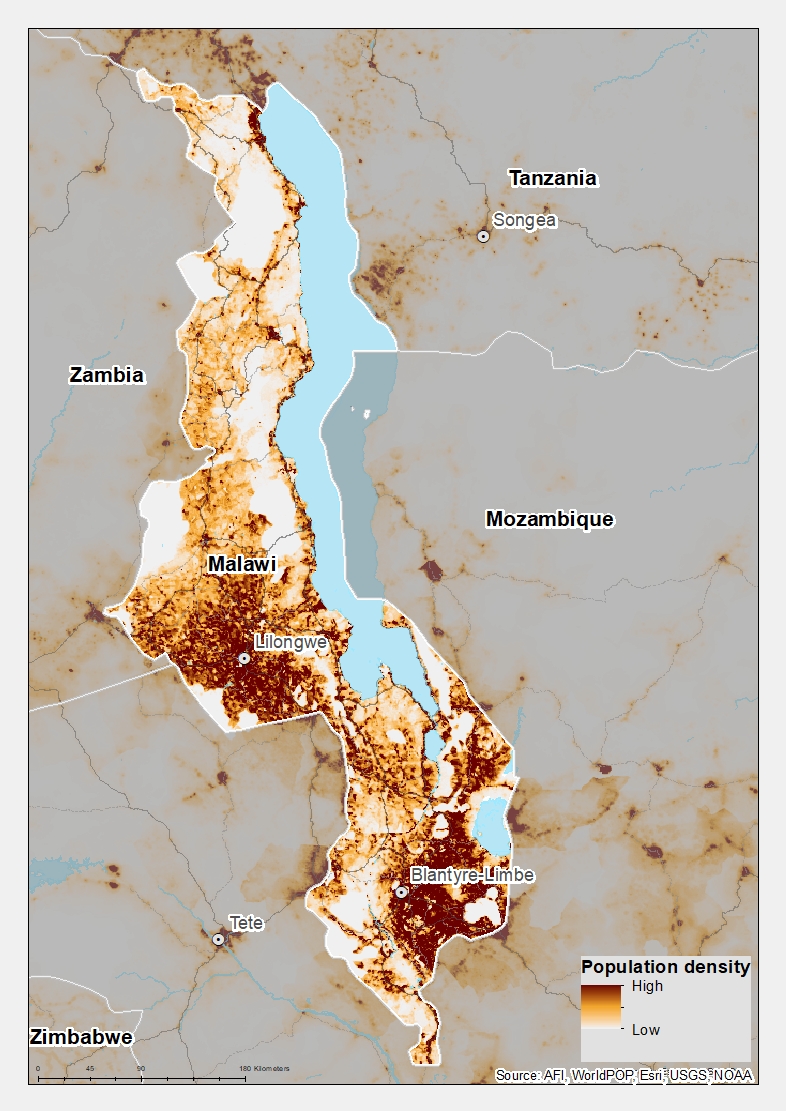
- Chart 7: Geographic distribution of Malawian population, 2020
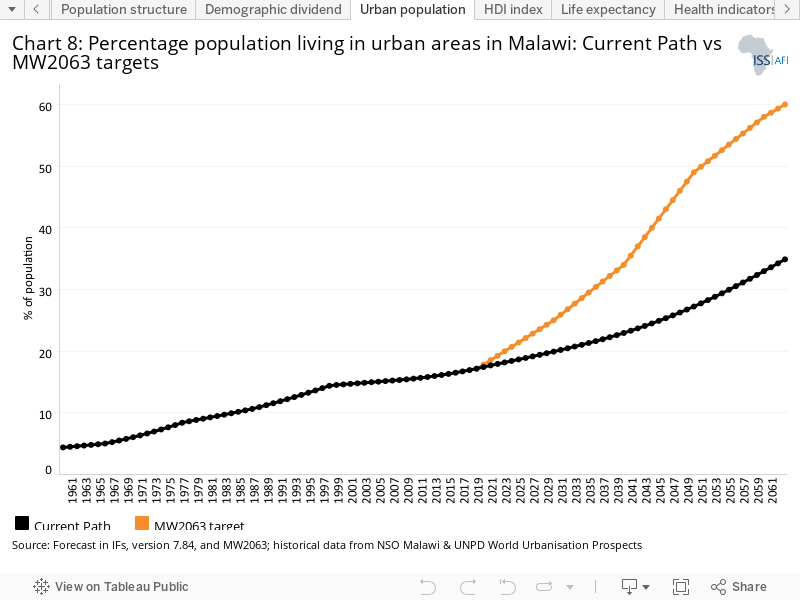
- Chart 8: Percentage population living in urban areas in Malawi: Current Path vs MW2063 targets
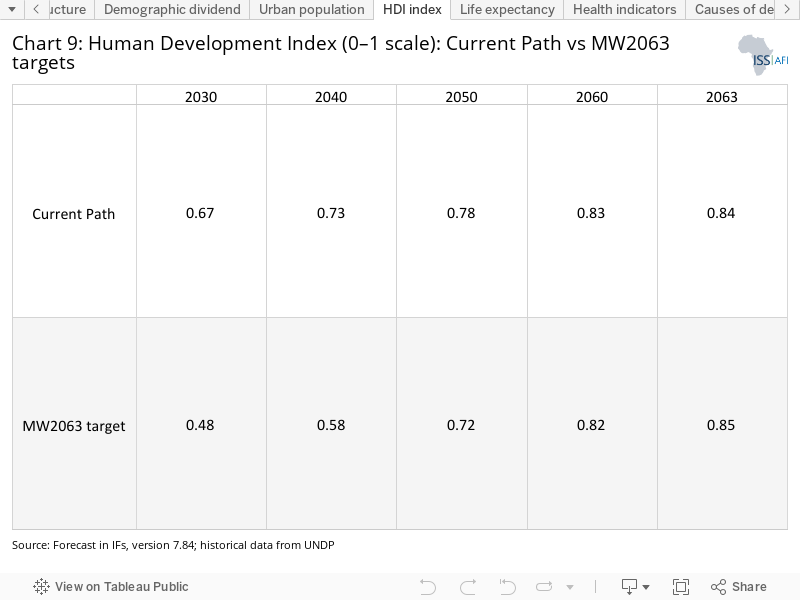
- Chart 9: Human Development Index (0–1 scale): Current Path vs MW2063 targets
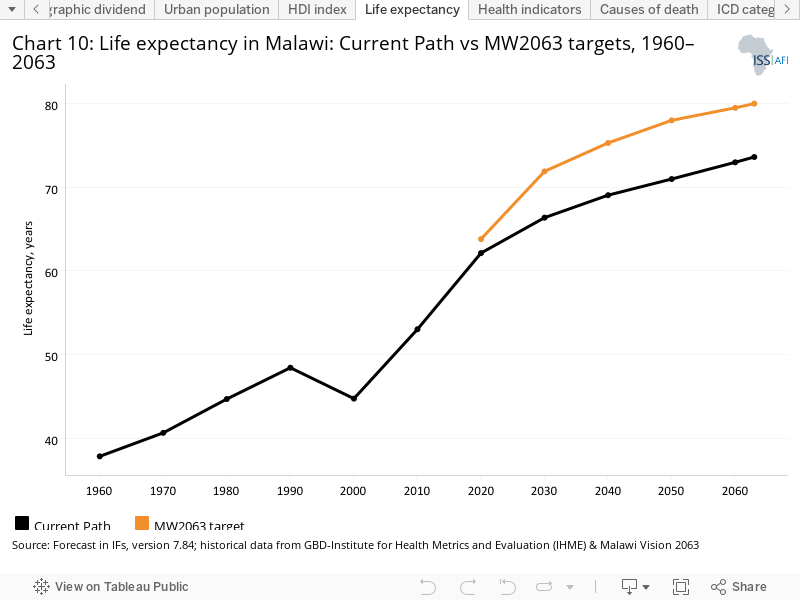
- Chart 10: Life expectancy in Malawi: Current Path vs MW2063 targets, 1960–2063
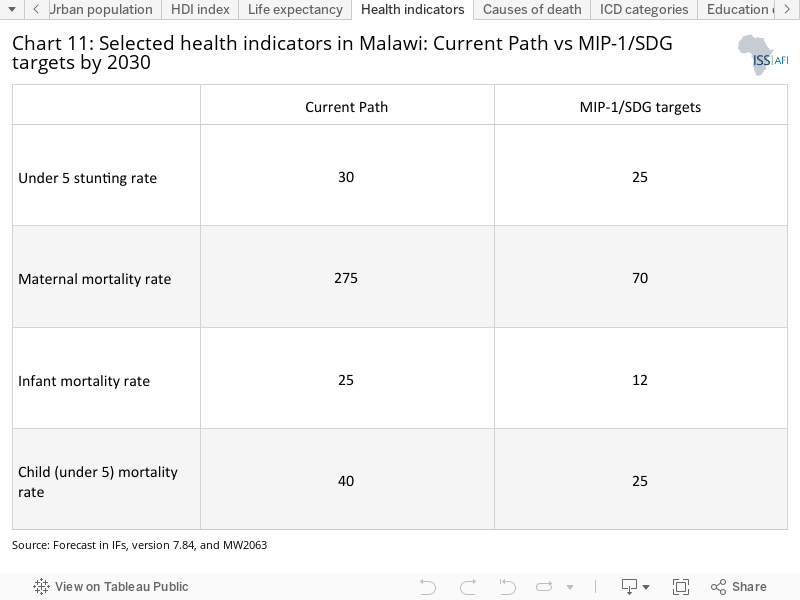
- Chart 11: Selected health indicators in Malawi: Current Path vs MIP-1/SDG targets by 2030
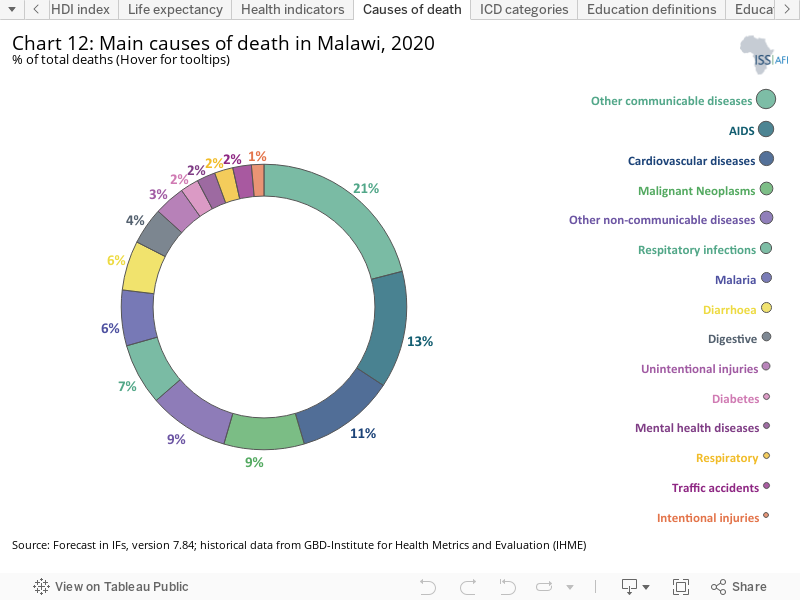
- Chart 12: Main causes of death in Malawi, 2020
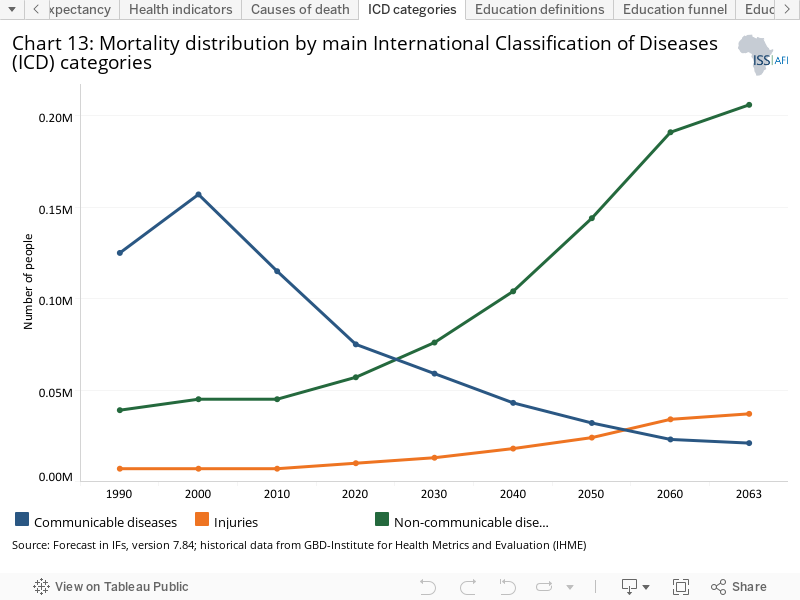
- Chart 13: Mortality distribution by main International Classification of Diseases (ICD) categories
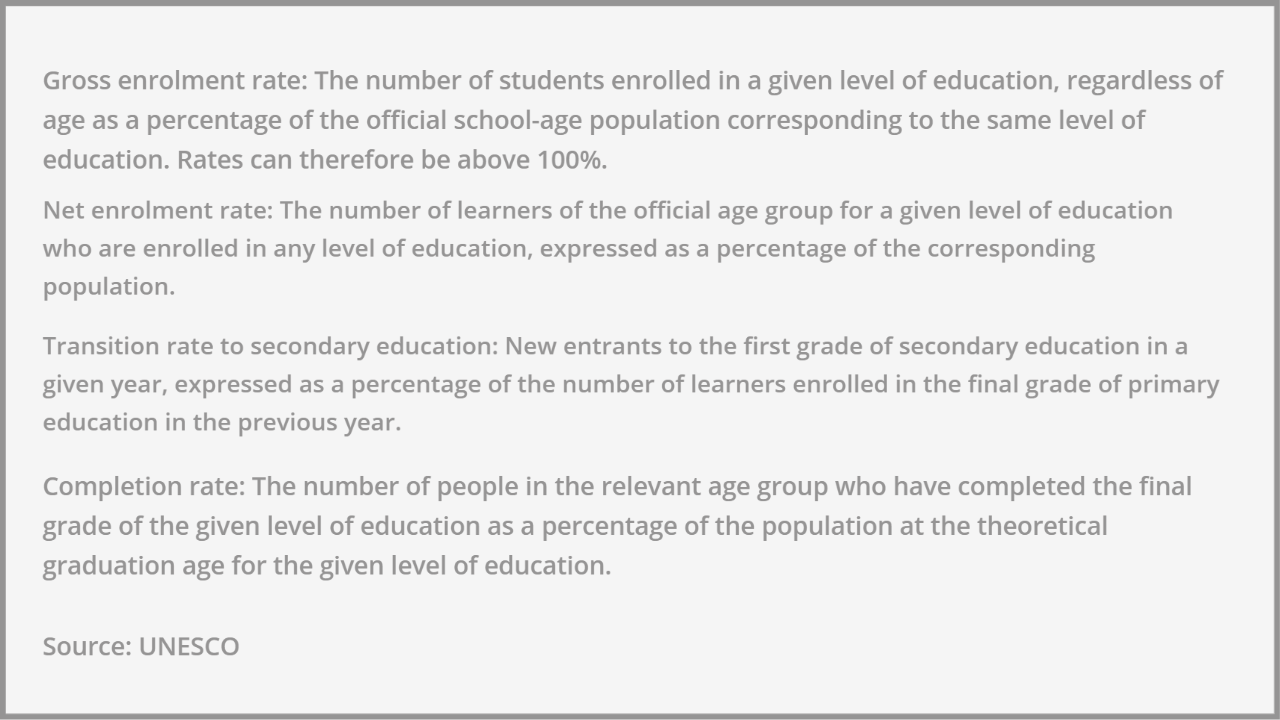
- Chart 14: Definitions in education
- Chart 15: Progress through the education funnel (2018–2019 data)
- Chart 16: Selected education indicators in Malawi: Current Path vs MW2063 targets by 2030
- Chart 17: Monetary poverty in Malawi (<US$1.90 per day and person), 1981–2063
- Chart 18: Income inequality in Malawi: Current Path vs MW2063 targets
- Chart 19: African Infrastructure Development Index (AIDI) score for all African countries
- Chart 20: Access to improved sources of water
- Chart 21: Access to improved sanitation
- Chart 22: National electricity access rate
- Chart 23: Electricity access in Malawi, rural and urban
- Chart 24: Paved roads as a proportion of total road network
- Chart 25: Internet penetration in Malawi
- Chart 26: Summary of Current Path forecast vs MIP-1 targets on key infrastructure indicators by 2030
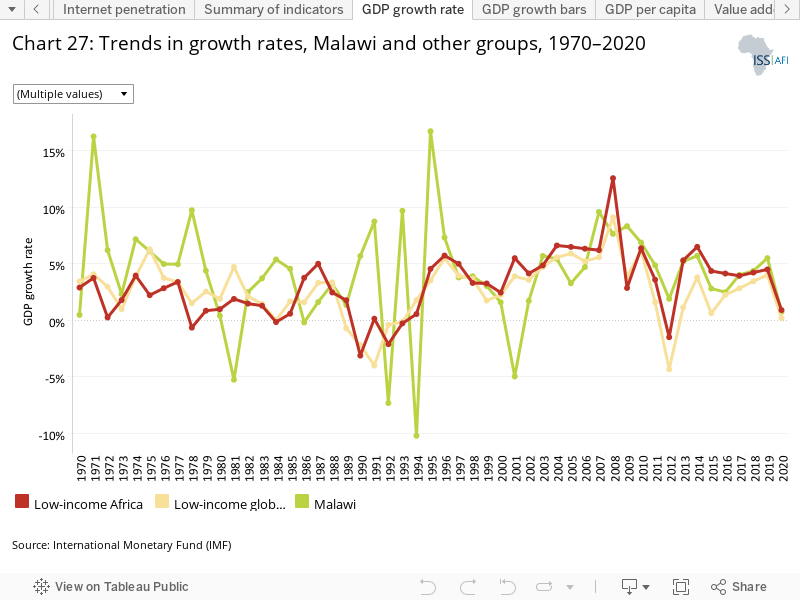
- Chart 27: Trends in growth rates, Malawi and other groups, 1970–2020
- Chart 28: Average GDP growth in Malawi: Current Path vs Malawi 2063 targets
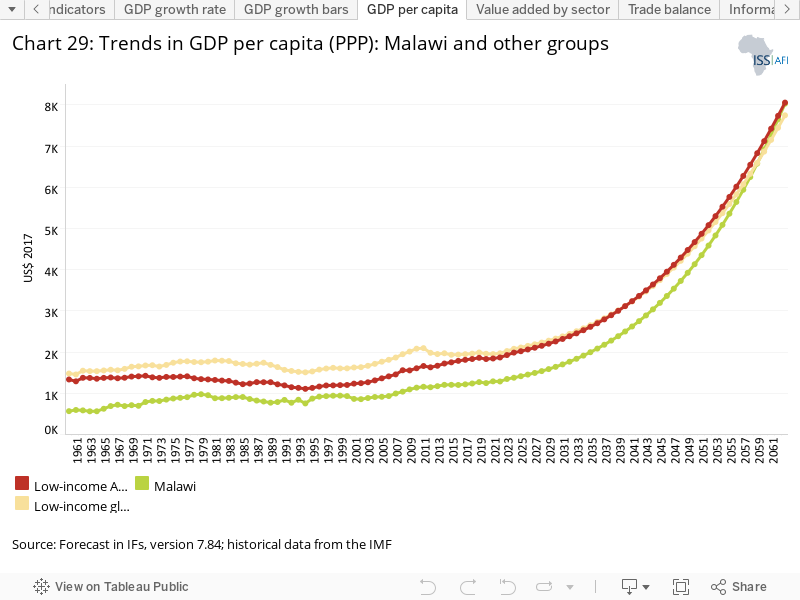
- Chart 29: Trends in GDP per capita (PPP): Malawi and other groups
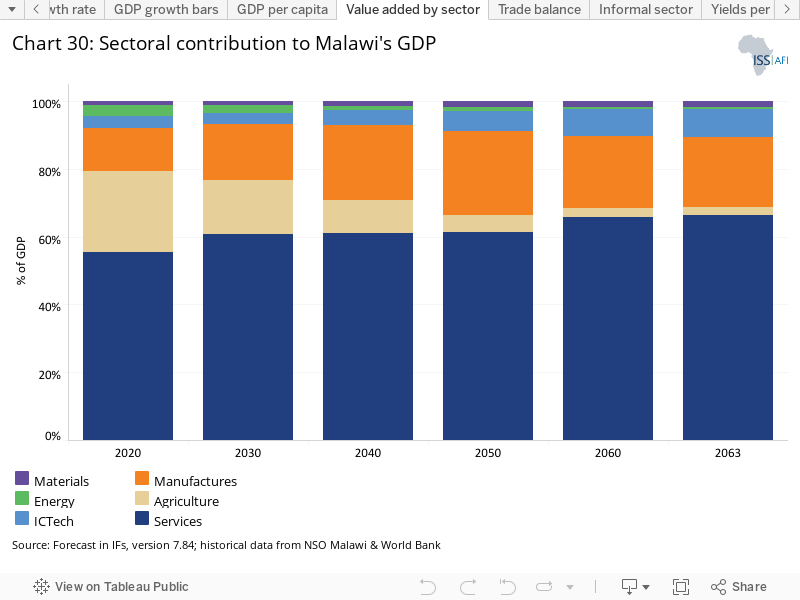
- Chart 30: Sectoral contribution to Malawi's GDP
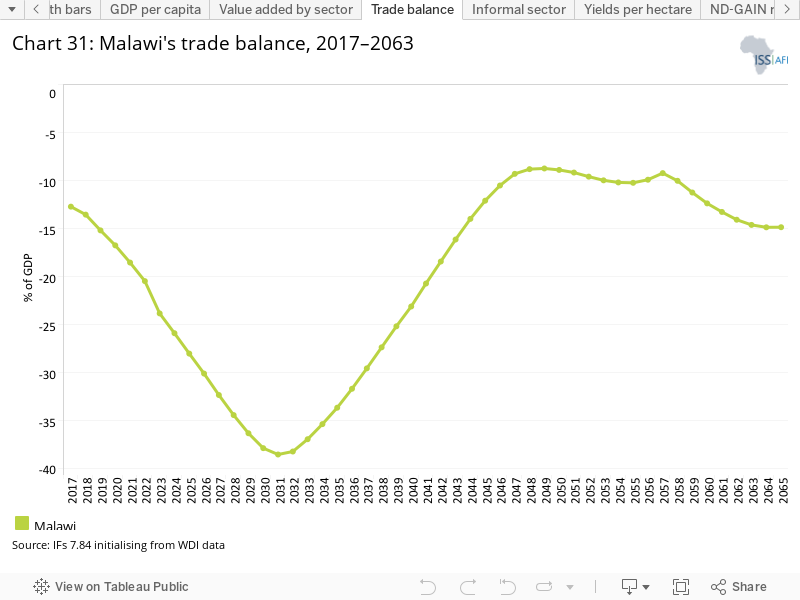
- Chart 31: Malawi's trade balance, 2017–2063
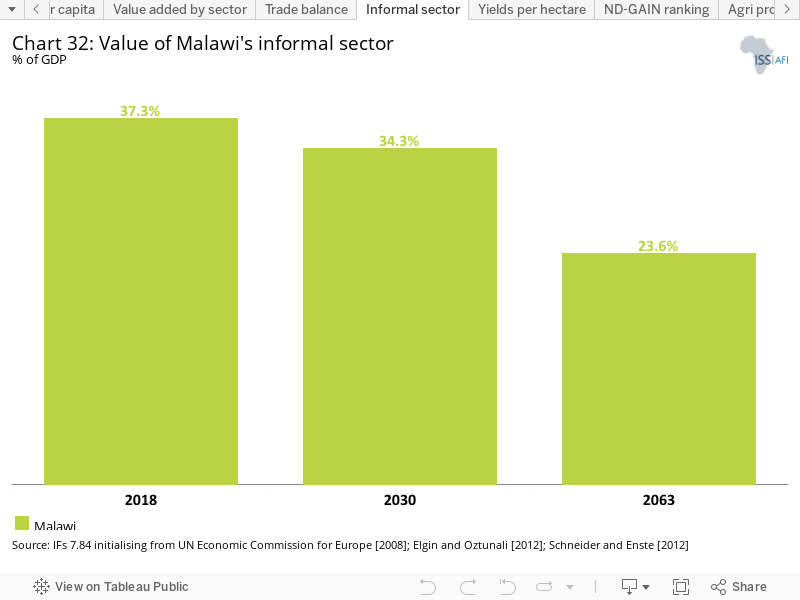
- Chart 32: Value of Malawi's informal sector
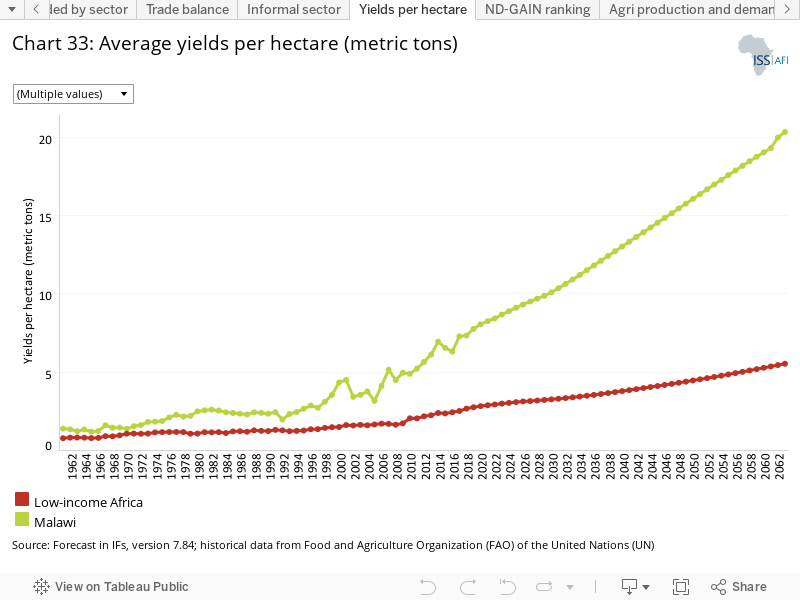
- Chart 33: Average yields per hectare (metric tons)
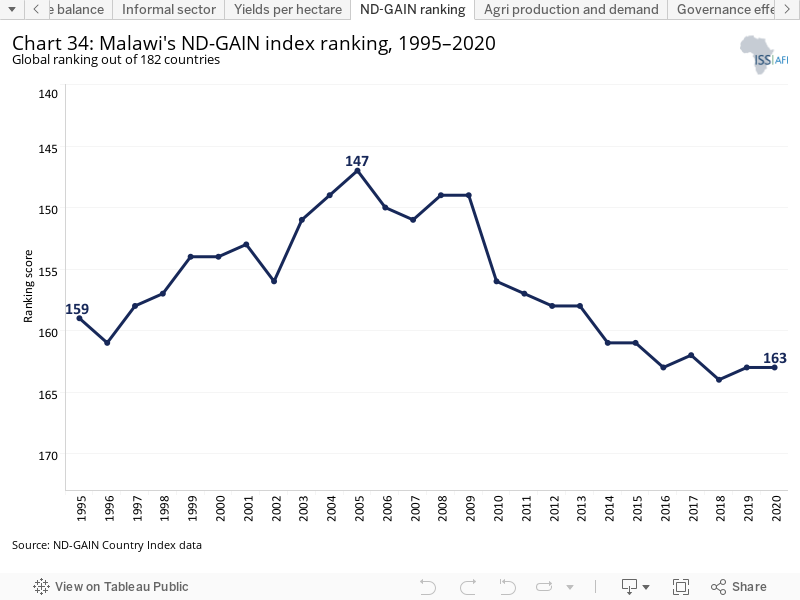
- Chart 34: Malawi's ND-GAIN index score, 1995–2020
- Chart 35: Trends in agricultural (crop) production and demand in Malawi, 1961–2063
- Chart 36: Governance effectiveness in Malawi
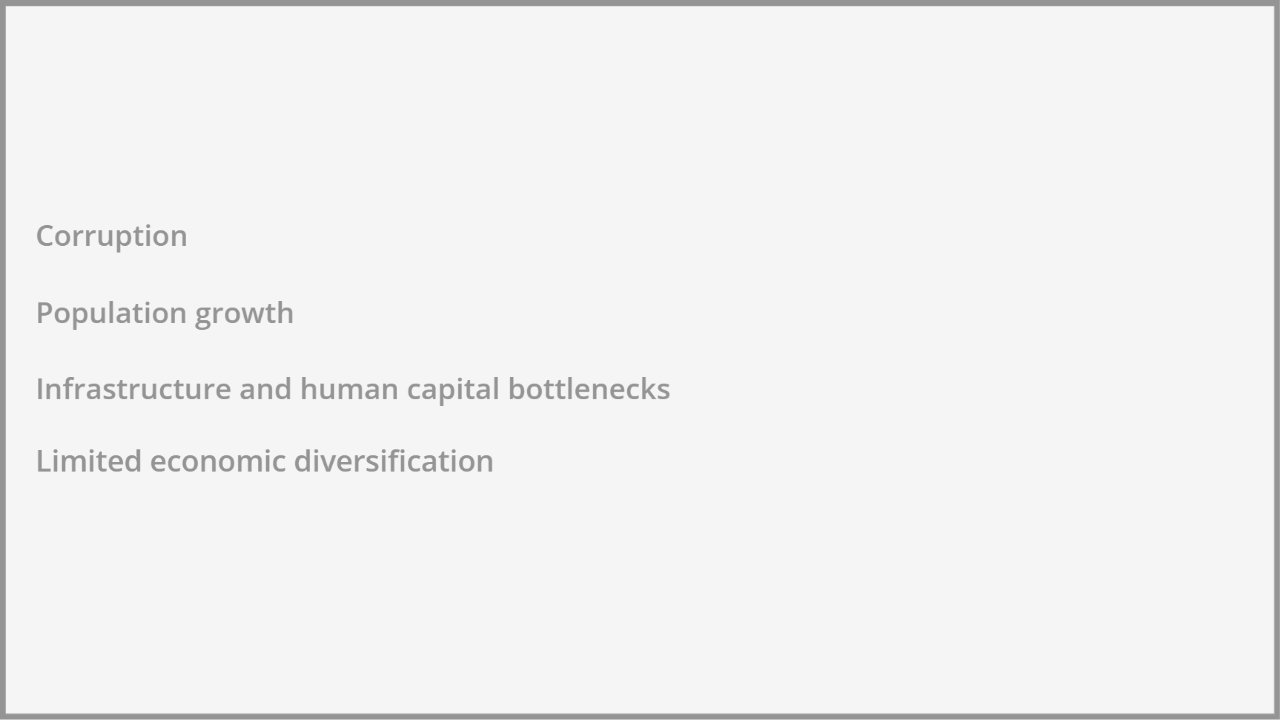
- Chart 37: Key factors impeding development progress
- Chart 38: Scenarios
- Chart 39: Urban vs rural national poverty rate, 2016/17
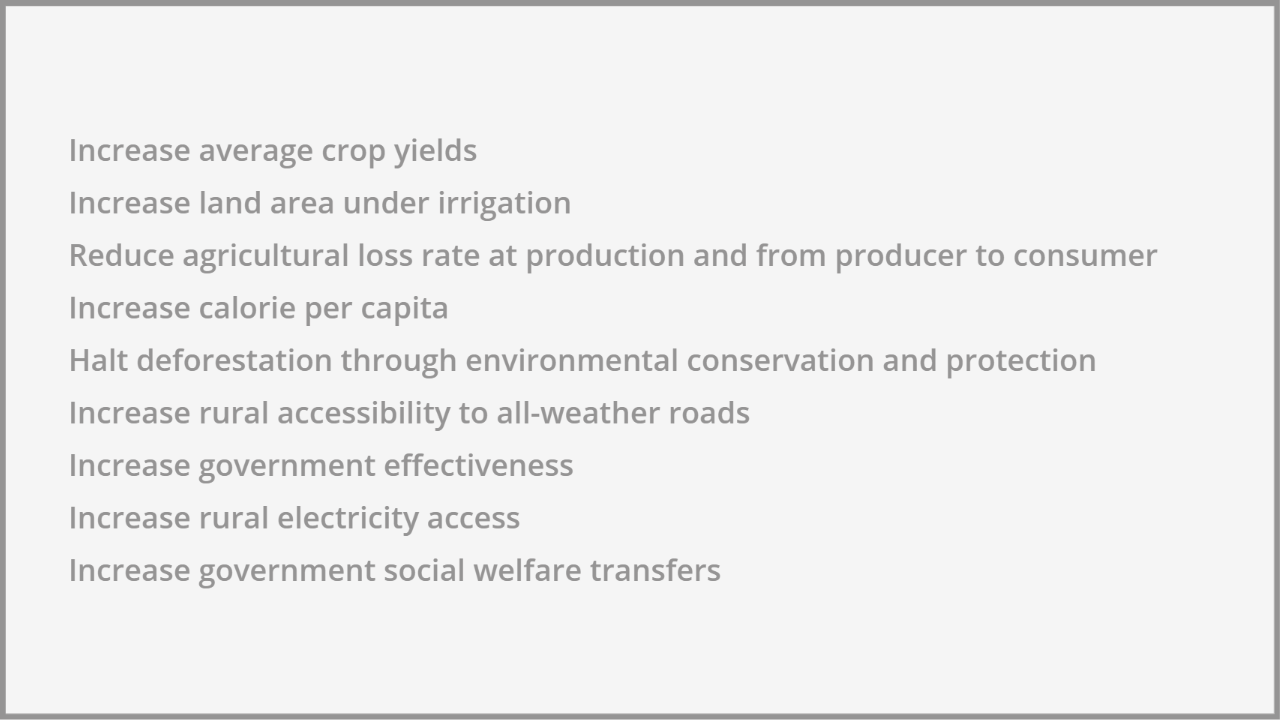
- Chart 40: Summary of the Agriculture and Rural Development scenario interventions
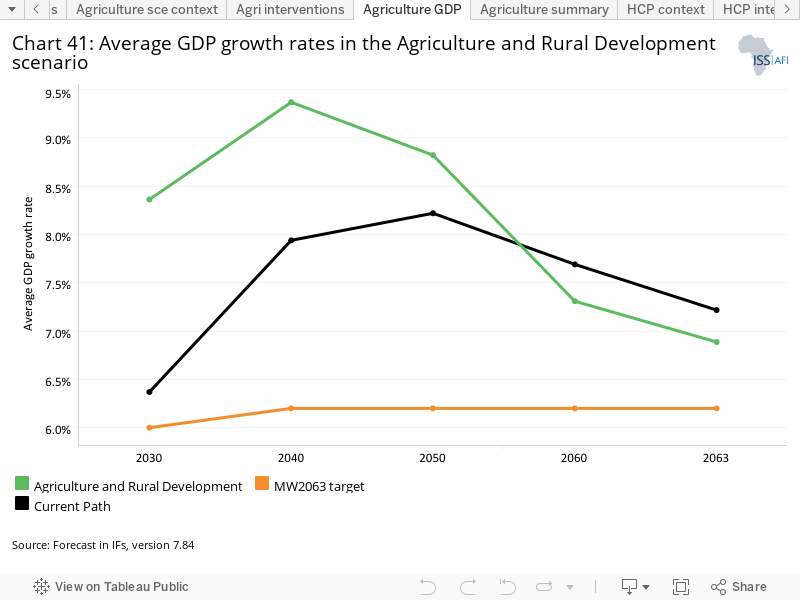
- Chart 41: Average GDP growth rates in the Agriculture and Rural Development scenario
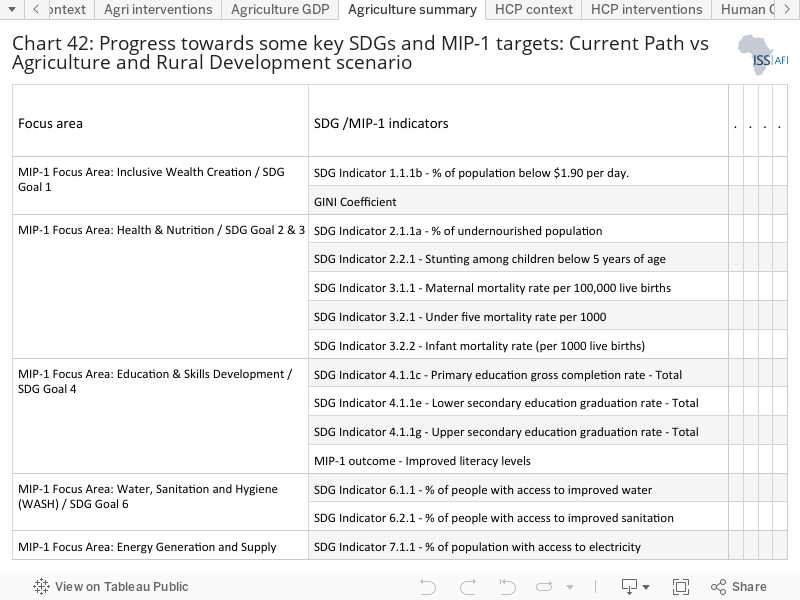
- Chart 42: Progress towards some key SDGs and MIP-1 targets: Current Path vs Agriculture and Rural Development scenario
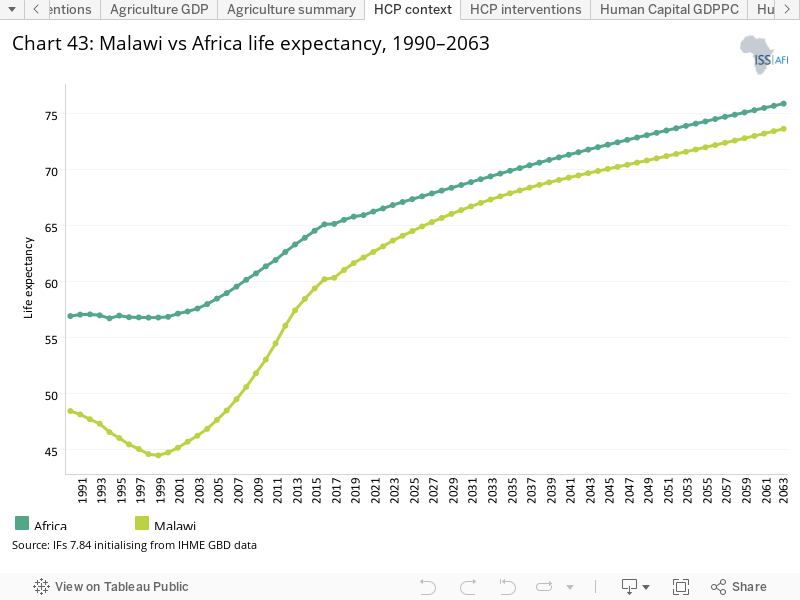
- Chart 43: Malawi vs Africa life expectancy, 1990–2063
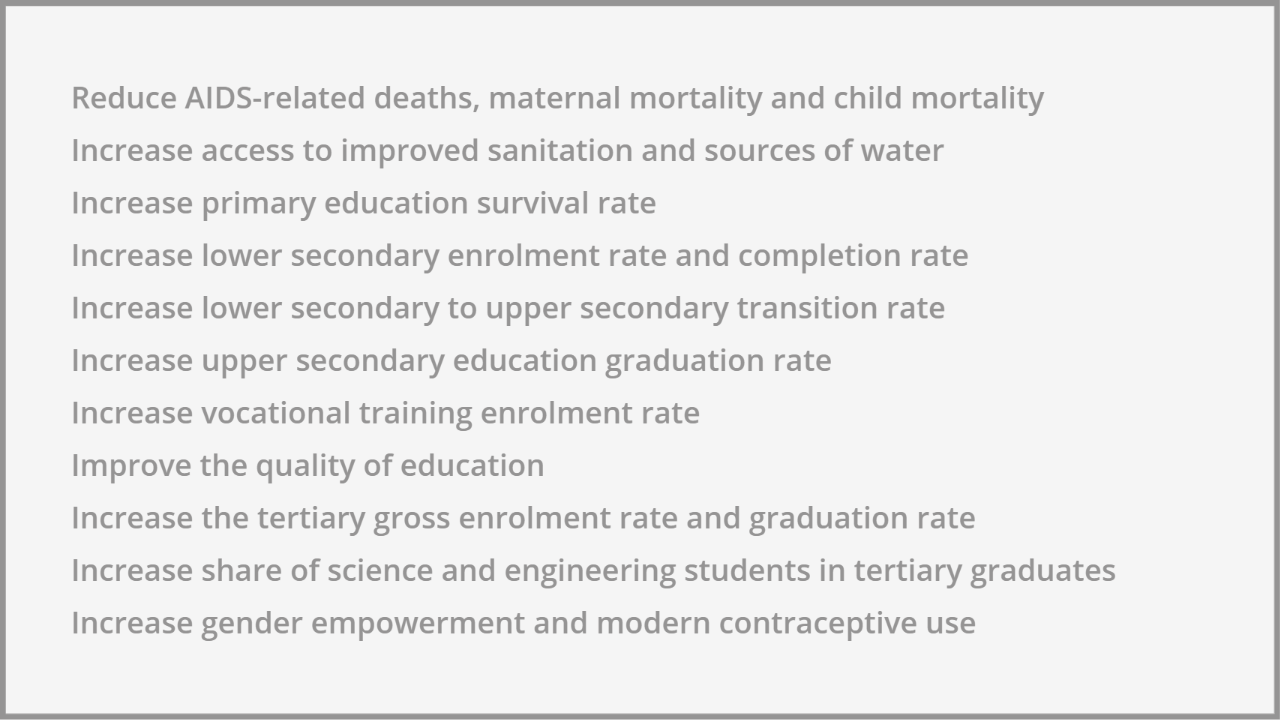
- Chart 44: Summary of the Human Capital Push scenario interventions
- Chart 45: Average GDP growth rates in the Human Capital Push scenario
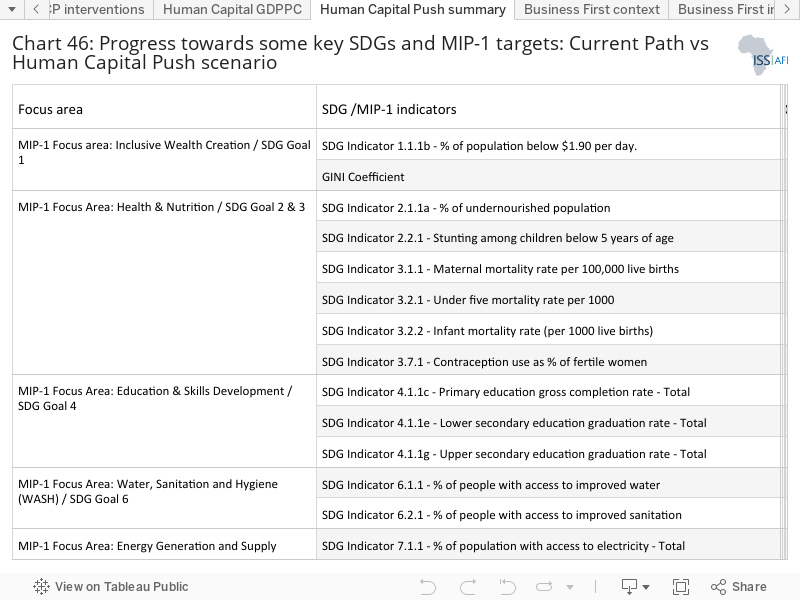
- Chart 46: Progress towards some key SDGs and MIP-1 targets: Current Path vs Human Capital Push scenario
- Chart 47: Share of population and GDP, rural vs urban areas
- Chart 48: Summary of the Human Capital Push scenario interventions
- Chart 49: Average GDP growth rates in the Business First scenario
- Chart 50: Progress towards some key SDGs and MIP-1 targets: Current Path vs Business First scenario
- Chart 51: GDP per capita (PPP) in each scenario
- Chart 52: Extreme poverty at US$1.90 in each scenario
- Chart 53: GDP per capita (PPP) - Combined scenario vs the Current Path
- Chart 54: Extreme poverty at US$1.90 - Combined scenario vs the Current Path
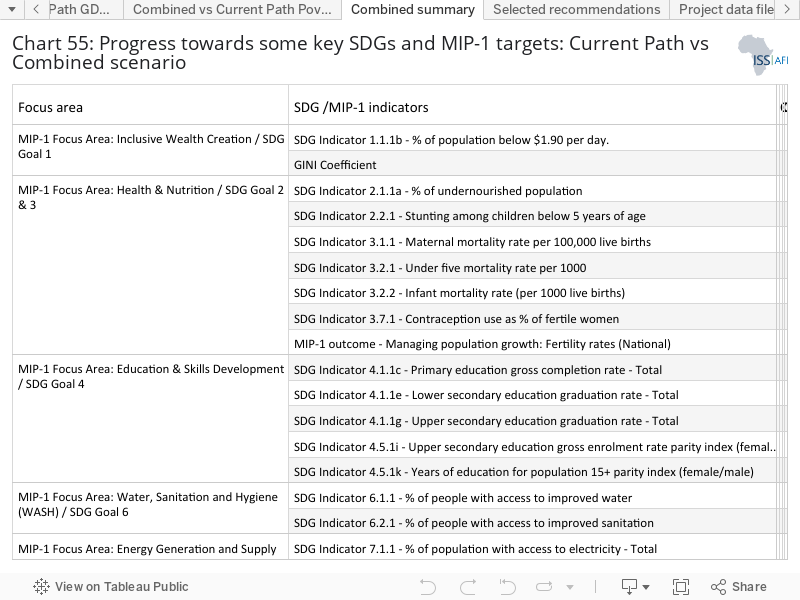
- Chart 55: Progress towards some key SDGs and MIP-1 targets: Current Path vs Combined scenario
- Chart 56: Selected recommendations
- Chart 57: Creation of project data file
-
Chart 58: Agriculture and Rural Development interventions
Chart 58: Agriculture and Rural Development interventions
-
Chart 59: Human Capital Push scenario interventions
Chart 59: Human Capital Push scenario interventions
-
Chart 60: Business First scenario interventions
Chart 60: Business First scenario interventions

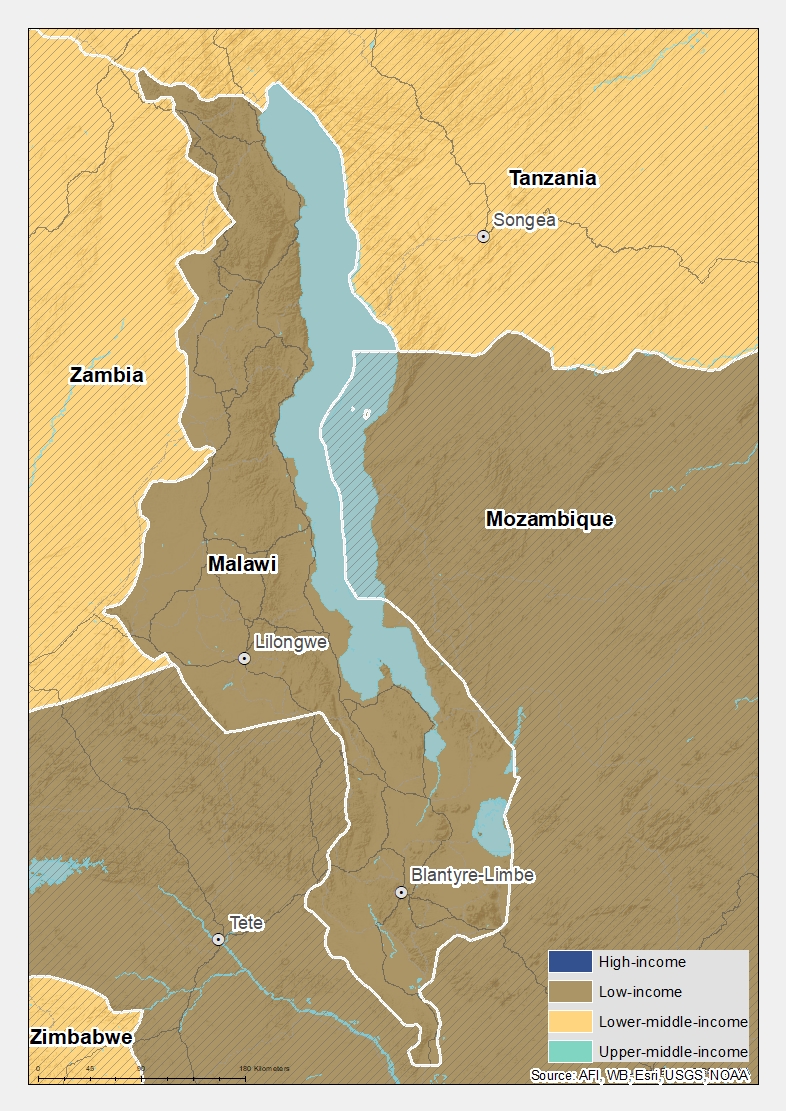
Located in Southern Africa, landlocked Malawi is nestled between Mozambique, Zambia and Tanzania. It is one of the 23 low-income countries in Africa and had an estimated population of 19.1 million in 2020. The country is a member of the Southern African Development Community (SADC) and the Common Market for Eastern and Southern Africa (COMESA).
Malawi is a generally peaceful country and has experienced stable governments since independence in 1964. The one-party rule ended in 1993, and since then, multiparty presidential and parliamentary elections have been held every five years. The new democratic dispensation coincided with the second phase of the structural adjustment programme which saw the liberalisation of markets such as the labour and industrial markets.
The country has achieved improvements in a number of socio-economic indicators, including health, education, and child and maternal mortality. According to the Malawi 2022 Voluntary National Review Report for Sustainable Development Goals (SDGs), Malawi has made significant progress towards goals 2 (zero hunger), 3 (good health and well-being), 4 (quality education), and 6 (clean water and sanitation).[1Malawi 2022 Voluntary national review report for sustainable development goals (SDGs), June 2022]
However, Malawi faces significant development challenges and has made little progress in goal 1 (no poverty) and goal 10 (reduced inequality). In 2019, more than 70% of Malawians lived below the international poverty line of US$1.90 per day.[2Malawi 2022 Voluntary national review report for sustainable development goals (SDGs), June 2022] The gross domestic product (GDP) per capita remains low, averaging US$550 (market exchange rate) over the past decade. In its 2020 report, the United Nations Development Programme (UNDP) classified Malawi as a country with low human development, with a score of 0.483 in the Human Development Index (HDI).[3UNDP, Human Development Report 2020] Malawi ranks 174th globally, a few places below its neighbours Tanzania (at 163) and Zambia (at 146), although it does better than Mozambique (at 181).
Persistent structural factors such as corruption,[4MW Kateta, How corruption derails development in Malawi, Foreign Policy, 21 May 2021] poor infrastructure, weak human capital, policy inconsistency and a poor business environment[5S Bhoojedhur and T Isbell, Almost half of Malawians consider emigration; most-educated are most likely to look overseas, Afrobarometer Dispatch No. 281, 6 March 2019] limit growth and economic diversification. The economy continues to rely heavily on a low-productivity agriculture sector, which contributes about one-quarter of the country's GDP and employs 64% of the labour force.[6 The Malawi 2063 First 10-year Implementation Plan (MIP–1), 2021–2030] This sector is extremely vulnerable to weather shocks, climate change and global economic shocks.
Vision 2020, launched in 2000, had the aim of Malawi becoming a technologically driven middle-income country by the year 2020. However, by 2020, Malawi failed to realise its development aspiration. In January 2021, the government launched a new long-term development blueprint called Malawi 2063 (MW2063). MW2063 builds on the lessons learnt from the challenges that marred the successful implementation of Vision 2020. MW2063 strives to transform Malawi into an inclusive, wealthy and self-reliant industrialised upper middle-income country by the year 2063. Vision 2020 was critiqued[7 W Kumwembe, ‘Vision 2020 lacked focus’, The Times, 2 December 2019] for its lack of mid-term targets to measure progress and was void of specific short-term goals. The operationalisation of MW2063 was therefore phased in 10-year periods and captured in the implementation plan (MIP–1), the first of which runs from 2021 to 2030, and aims to graduate Malawi to a lower middle-income country by 2030 and meet most of the sustainable development goals (SDGs) by the same period.
Recent global geopolitical and economic events as well as a noticeable increase in weather-related disasters have impacted Malawi’s likely development pathway and necessitate a relook at the growth paths and interventions that Malawi needs to prioritise. The COVID-19 pandemic and other natural disasters such as floods and droughts have contributed to soaring fiscal deficits, which have been largely funded by domestic borrowing and have resulted in a high public debt. The December 2021 Debt Sustainability Analysis by the World Bank indicates that Malawi’s external and public debt are both at high risk of debt distress and that the debt is unsustainable. Malawi’s total public debt stock as of end-June 2021 stood at 59% of GDP, up from 27% in 2011.[8 Malawi Annual Public Debt Report 2020/2021, Ministry of Finance] The costly debt service reduces the fiscal space for productive expenditure to materialise the country’s development vision.
Foresight planning and modelling are therefore critical in the implementation process of MIP–1 to ensure that interventions towards realising MW2063 and the medium-term goals (MIP–1) are guided with a careful analysis of the development terrain, with trajectories/scenarios which point to optimal expected outcomes. This foresight modelling therefore assesses whether Malawi is on track to meet key goals of MW2063 on its current development trajectory (Current Path or business-as-usual scenario). Specifically, this report presents the recent past, current state of development and the likely future of Malawi along the Current Path forecast in terms of demographics, education, health, poverty and inequality, economy, infrastructure, agriculture and climate change, and governance. The Current Path is a future without any substantial changes in Malawi’s current policy and implementation path. It does not assume any seismic policy changes or transformative events such as global war, pandemics, cataclysmic climate change or technological shocks.
Malawi’s population has grown significantly from 3.6 million people in 1960 to an estimated 19.1 million in 2021. The country’s population size relative to the geographic size of the country makes it one of the ten most densely populated countries in Africa. Throughout much of the 1970s, Malawi’s annual growth rates were well above the average for African countries, and in the latter half of the 1980s, growth rates in Malawi were among the highest rates globally. In the first half of the 1990s, growth rates plummeted as HIV/AIDS-related deaths coincided with mass repatriation of refugees back to Mozambique after the civil war ended.[9 NSO, Malawi, 2018 Malawi Population and Housing Census] Since 2000, sustained annual high population growth rates have been recorded ranging from lows of 2.4% to highs of 2.9%.
On the Current Path, a future without any substantial changes in Malawi’s current policy and implementation path, Malawi’s population is expected to reach 24.2 million people by 2030, as annual population growth rates decline to 2.3%. By mid-century it's likely that Malawi will be home to 34.3 million people and by 2063 the country is likely to have a population of 38.8 million. Population growth rates are expected to be aligned with the indicators as set out in MW2063 (Chart 2) until at least 2040 after which the Current Path forecast shows a much larger reduction in population growth rates. Even with this sustained reduction in growth rates, the country will see population densities double within the next four decades, undoubtedly placing a significant strain on land use planning and resource management.
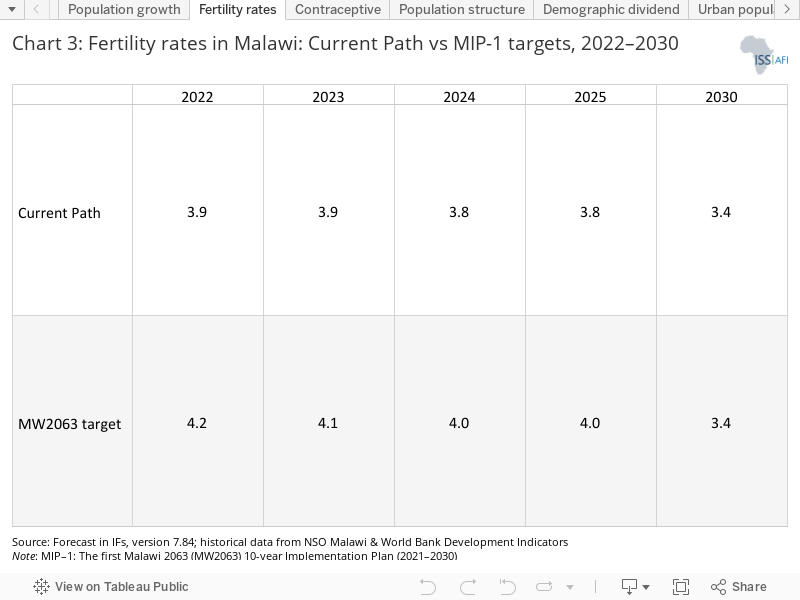
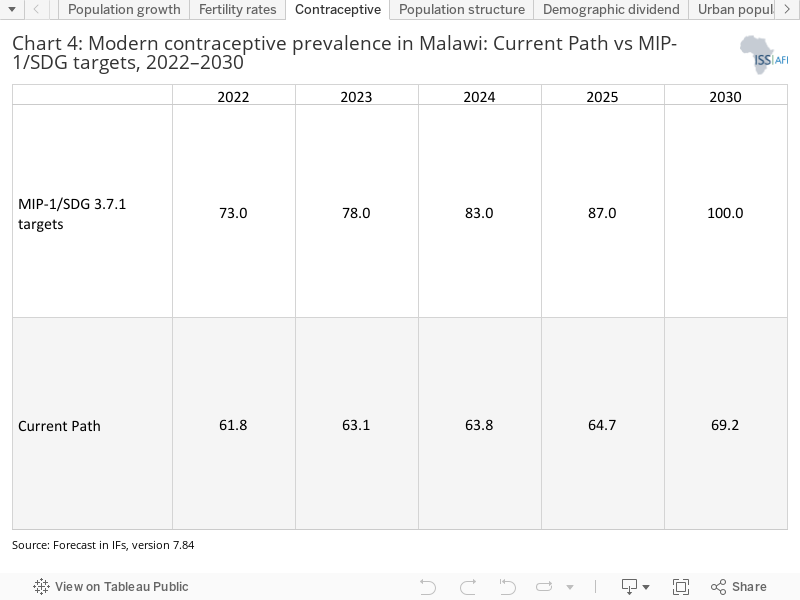
The total fertility rate peaked in 1980 when the country recorded 7.8 births per woman — the third highest in Africa. Since then, the government of Malawi has made significant strides in reducing fertility rates and the decline in fertility rates between 2010 and 2019 was among the three fastest reductions globally.[10National Planning Commission, Cost-benefit analysis of increasing contraceptive use through post-partum counselling and free improved access to contraception in Malawi, Malawi Priorities, National Planning Commission (Malawi), Copenhagen Consensus Center (USA) and African Institute for Development Policy (Malawi), 2021] This decline in part can be attributed to a significant push in providing access to modern contraceptives, with numerous government and donor plans and programmes active within the family planning domain. Significant attention to this sector has led to an estimated 61% prevalence rate of modern contraception use in 2020 among women aged 15 to 49 years. This is the second highest prevalence rate among low-income Africa and is well above the rate of 35% estimated for Africa.[11IFs database]
Despite this promising trend, the current fertility rate of 4.1 births per woman in 2020, while below the average for Africa and its low and lower middle-income countries, remains unfavourably high. The government has reiterated that population growth management remains a critical priority in order to meet the country’s social and economic development goals. This is currently prioritised as a focus area in the first MW2063 10-year Implementation Plan (MIP–1). The targets, as set out in the outcomes indicators, are to improve family planning and access to modern contraceptives to reduce fertility rates further to 3.4 births per woman by 2030.
The Current Path forecast shows that while Malawi is well on track to meet its fertility rate targets (Chart 3), it will fall significantly short of reaching its SDG target on contraceptive use (SDG 3.7.1) (Chart 4). Several studies[12J Forty, SD Rakgoasi, and M Keetile, Patterns and determinants of modern contraceptive use and intention to use contraceptives among Malawian women of reproductive ages (15–49 years), Contracept Reprod Med 6:21, 2021] show that the prevalence rate of contraceptive use is lowest among the younger and poorer population cohorts. Political and community leadership and raising awareness among this population cohort is required to address this challenge and meet the MIP–1 target. Interventions targeting the youth specifically must be mainstreamed within the current policies and programmes.[13B Franklin, R Naik, S Pappa and S Sacher, Accelerating Progress on the Sustainable Development Goals of Malawi: The role of population and family planning, Policy Brief, 2017]
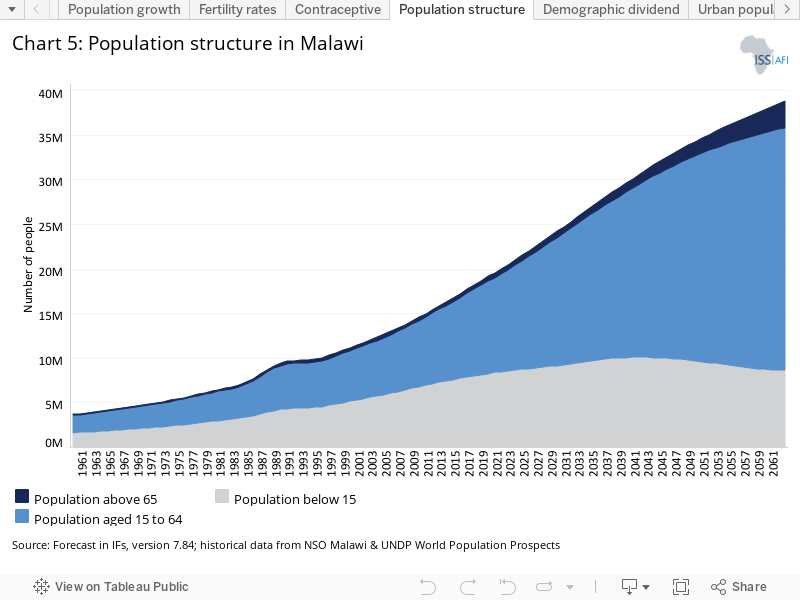
These historical high fertility rates coupled with persistent low life expectancies resulted in Malawi having one of the most youthful age structures in Africa at the turn of the century. The median age in 2000 was 16.4 years, the seventh lowest in Africa, a figure that stagnated for years. The past decade, however, has seen the start of a slow transition in Malawi’s age structures with the median age climbing to 17.8 years by 2020.[14 IFs database. Original data source: UN Department of Economics and Social Affairs] This is on par with the average for low-income African countries, with half of the population below the age of 18. The Current Path forecast shows that the median age in 2030 is likely to be 20.3 years and by 2063 will have improved to 31.6 years, 3.5 years more than the average for low-income Africa. This gradual ageing of the population is most noticeable in the decline in the population below 15 years, with associated growth in the economically active age groups (Chart 5).
In 2020, 43% of the population was below the age of 15 years. This large cohort of children below 15 years of age requires huge investment in education and healthcare infrastructure. With an expected drop in fertility rates, it is forecast that by 2030, 37.8% of the population will be below 15 years, and 22.2% by 2063. The increase in life expectancy is also evident in the growing elderly dependant population group that is expected to increase from 2.6% in 2020 to 2.9% in 2030 and to 7.6% by 2063.
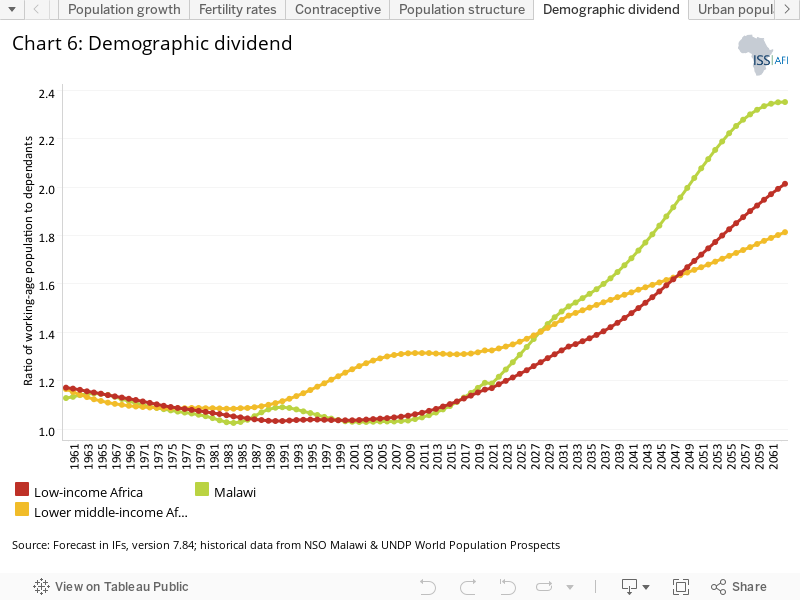
The working-age population cohort (between 15 and 64 years) is expected to increase from 54.4% in 2020 to 59.4% in 2030 and to 70.2% by 2063. This growing workforce could allow Malawi to reach its demographic dividend by 2041 (Chart 6). An increase in the working-age population relative to dependants (children and elderly people) can generate economic growth due to the resultant demographic dividend. Generally, the demographic dividend materialises when a country reaches a ratio of at least 1.7 people of working age for each dependant (children and elderly people).[15 Berlin Institute for Population and Development, Demographic dividend]
When there are fewer dependants to take care of, it frees up resources for investment in both physical and human capital formation, and eventually increases female labour force participation. Studies have shown that about one-third of economic growth during the East Asia economic miracle can be attributed to the large worker bulge and the relatively small number of dependants.[16D Canning, S Raja and AS Yazbeck (eds.), Africa’s demographic transition: Dividend or disaster? Africa Development Forum Series, Washington, DC: World Bank, 2015] However, the growth in the working-age population relative to dependants does not automatically translate into rapid economic growth unless the labour force acquires the needed skills and is absorbed by the labour market. Without sufficient education and employment generation to successfully harness their productive power, the growing labour force (very likely in urban areas) could result in the emergence of civil instability as many people of working age may remain unemployed and in poverty, potentially creating frustration, social tension and conflict.
Malawi needs to sustain its momentum on the reduction in fertility rates and invest in education to empower this future workforce with appropriate skills. Without sufficient employment opportunities and a responsive governance system, Malawi’s large youth bulge could threaten stability. The youth bulge, defined as the ratio of the population between the ages of 15 and 29 to the total adult population, is currently about 51% for Malawi. It will slightly decline to 49% by 2030 and to 32% by 2063 as the population ages. Around 29% of Malawi’s working-age population was estimated as economically inactive in 2019.[17Danish Trade Union Development Agency, Labour Market Profile Malawi – 2022/2023]
Together with population growth and structural demographic changes, Malawi is also expected to see a dramatic shift towards urban areas. Malawi is a predominantly rural country and one of the least urbanised in the world, hence it is at the very early stages of the urban transition. Globally, only Papua New Guinea, Burundi and Niger have higher percentages of populations living in rural areas.
In 1970, 6% of the Malawian population lived in urban spaces. The 1970s and 1980s saw urbanisation increasing rapidly with an average annual rate bordering on 7%. By 1990, almost 12% of the population lived in urban areas, equivalent to just more than one million people. From 1990 to 2020, the annual urbanisation rate slowed down to an average of 3.8% and, in 2020, just over 17% of the population resided in urban areas, accounting for 3.3 million people.
This slower urbanisation trend is the result of pro-rural policies such as the very aggressive integrated rural development plan contained in the 2006 Malawi Growth and Development Strategy.[18Government of Malawi, Malawi growth and development strategy 2006–2011] Malawi’s densely populated rural areas (Chart 7) also reflect an economy dependent on subsistence agriculture that has been very slow to diversify. Prior to the Malawi National Urban Policy (NUP), approved in 2019, there was an absence of urban policies. This resulted in a lack of urban investment and, in turn, growing urban poverty and vast informality. More than 75% of Malawi’s urban populations live in the four major cities of Blantyre, Lilongwe, Mzuzu and Zomba. Pressure to provide basic services and housing within these urban areas is immense and in 2018 nearly 67% of Malawi’s urban populations lived in slums.[19UN Habitat, Housing, slums and informal settlements] MW2063 has set an ambitious target of reducing informality to 50% by 2030 and to 10% by 2063, but achieving this will require a significant effort.
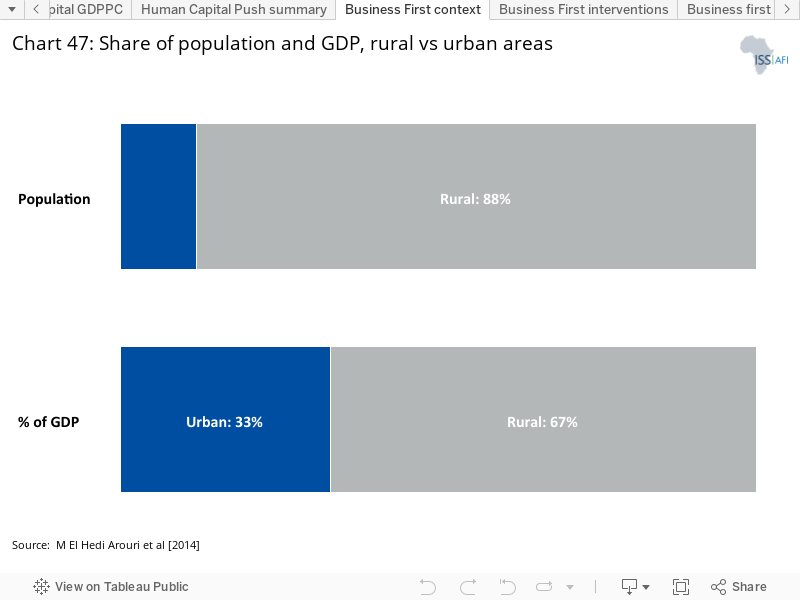
Urbanisation is critical to economic growth and development as it fosters entrepreneurship and increases productivity. Cities in Africa generate between 55% and 60% of the continent’s GDP.[20M El Hedi Arouri et al, Effects of Urbanization on Economic Growth and Human Capital Formation in Africa, PGDA Working Paper, Harvard University, 2014] In 2018, 12% of the Malawian population resided in only the four major urban areas yet was responsible for contributing 33% to the national GDP. When urbanisation is managed sustainably, it reduces poverty and provides several social and economic benefits.
The government of Malawi has recognised the important role that cities will play in getting Malawi to middle-income status. Urban development has gained traction with the government and the need to accelerate urbanisation is supported as pillar 3 in MW2063. The government launched the Malawi Secondary Cities Plan (MSCP)[21Government of Malawi, Malawi Secondary Cities Plan (MSCP), National Planning Commission, Lilongwe, Malawi, 2022] in 2022 — a new spatial master plan that aims to decongest the existing cities through the development of eight additional secondary cities. These catalytic locations aim to be centres of government, industry, agriculture, tourism, and mining activities and investment. The secondary cities are expected to provide economic opportunities, easy commuting and close connectivity to social amenities while playing a vital role in the decongestion of current cities.
On the Current Path, urbanisation rates are expected to continue to increase but at a much lower rate compared to the objectives as set out by the government of Malawi. The Current Path forecast is that the urbanisation rate for Malawi will be 19.9% in 2030, below the government’s desired target of 25%. By 2063, in the Current Path forecast, Malawi’s cities and towns will be home to 35% of the population, significantly below the 60% target of MW2063 (Chart 8). This is very likely the result of the urbanisation lag that followed historical pro-rural policies and underinvestment in urban spaces. While new plans such as the MSCP will support the transition, it will take some time for urbanisation to gain critical momentum.
Urbanisation has gained policy traction in Malawi and the new MSCP envisages a more rapid urban transition, but the historical pro-rural development focus is still engraved in the country’s landscape and land use practices. If the MSCP is successfully implemented and investment in the provision of infrastructure, schools and other efforts continues to be prioritised, this could increase the urbanisation rate above the Current Path forecast.
Accommodating the rural–urban migration and growth within cities in a safe and sustainable manner will be a challenge but managing the transition sustainably will be key to unlocking Malawi’s development future. Expanding infrastructure and education access in urban areas is easier and costs less than expanding it in rural areas. People in urban areas have greater access to technology. For instance, while Internet penetration in Africa is at 16%, in cities that number was about 50%.[22J Manyika et al, Lions Go Digital: The Internet’s Transformative Potential in Africa, McKinsey Global Institute, 2013]
The Human Development Index (HDI) is a useful composite indicator for exploring trends in human development across time and countries. The three pillars of HDI include: health (as measured by life expectancy), education (as measured by mean years of schooling of the adult population and school life expectancy), and a decent standard of living (as measured by gross national income per capita). This section focuses on health and education.
Malawi’s rapid population growth is challenging the country’s ability to meet its key and critical social and economic development goals. While Malawi has made steady progress on increasing life expectancy and mean years of schooling, it has fallen behind in per capita income and remains categorised in the low human development category. Malawi’s score on the HDI increased from 0.34 in 1990 to 0.48 in 2019, which placed the country in 174th position globally out of the 189 countries measured.[23UNDP, Human Development Reports 2020] In SADC, Malawi is only ahead of the Democratic Republic of Congo and Mozambique. On the Current Path, the human development level (measured through the HDI) in Malawi is forecast to improve and remains on par with the targets set out in MW2063 until 2050 (Chart 9). After 2050, improvement in human development in the country will likely be slower than expected in MW2063. This might be explained by inefficiencies in government spending on health and education or the increasing size of the population that eventually reduces public expenditure per capita in education and health. The Malawi authorities should improve spending efficiency in education and health and tackle the country’s high fertility rate.
Health and nutrition
Health is a critical pillar of human development. In MW2063, health and nutrition are two of the key enablers to achieve Malawi’s human capital development objectives towards a healthy population with improved life expectancy, quality, equitable and affordable healthcare, food security and adequate nutrition.[24National Planning Commission, Malawi's Vision 2063: An Inclusively Wealthy and Self-reliant Nation, 2020]
Malawi has invested significantly in its health sector and the country’s spending on the sector measured 4.8% of GDP in 2017,[25 Human Capital Index 2020, Malawi Human Capital Project, 2020] which was above the average for the region and low-income Africa. This investment is reflected in the significant progress that Malawi has made with reductions in infant, child and maternal mortality compared to its peers in Africa, but the country continues to suffer from poor health outcomes. In 2019 Malawi ranked 185th for overall health efficiency among 191 WHO member states,[26A Tandon et al, Measuring Overall Health Systems Performance for 191 Countries, World Health Organisation, GPE Discussion Paper Series, No. 30, 2019] a statistic that reflects the poor state, inequality and ineffectiveness of the sector.
Malawi scored very low in life expectancy and ranked 40th in Africa in 2020. Life expectancy improved from 37.8 years in 1960 to 48.4 years in 1990, but the onset of the HIV/AIDS pandemic in the 1990s impacted the country severely and by the turn of the century life expectancy had fallen to 44.7 years. Life expectancy has slowly recovered since and in 2020 the average Malawian could expect to live to 62.1 years, though this figure is still below the average for low-income Africa at 63.8 years. In the Current Path forecast, life expectancy is likely to reach 66.3 years by 2030 and 73.6 years by 2063. However, Malawi is expected to perform below the MW2063 target throughout the forecast horizon. Malawi authorities, with the support of the development partners, should reduce HIV/AIDS-related death rates through the roll-out of lifesaving antiretrovirals (ARVs) and aggressive information campaigns about the disease. There is also a need to improve access to clean water and sanitation to reduce communicable diseases. Such actions could increase life expectancy.
Chronic food insecurity is a persistent threat to Malawi’s population. A recent food insecurity report[27Malawi IPC Chronic Food Insecurity Report 2022] indicates that in 2021, 33% of Malawians who live in rural areas were classified as moderately to severely food insecure and only 36% of the population faced no or minimal food insecurity. The highest levels of severe food insecurity occur in the southern regions, driven by high poverty rates, the dependency on rain-fed agriculture, recurrent flooding and droughts, low resilience to climate shocks, and subsistence farming practices.[28Malawi IPC Chronic Food Insecurity Report 2022]
Together with food insecurity, the country’s population also battles poor nutrition. Lack of access to a nutritious and diverse diet has contributed to severe malnutrition. In 2018, UNICEF[29UNICEF, Nutrition statistics in Malawi, 2018] estimated that 64% of children below the age of five had some form of anaemia and that 23% of child deaths were related to undernutrition. Likewise, only 61% of infants below five months were exclusively breastfed and 4% of children suffered from acute malnutrition. In 2020, the prevalence of stunting among children under five years of age was just below 40%, while this is a significant drop from the 55% recorded in 2000, it is the seventh highest prevalence rate in Africa.
Malnutrition therefore remains a public health concern in Malawi, especially among women and children, contributing to the high stunting rates among children. This high number is being addressed by the government as part of the MIP–1 implementation plan of MW2063. Within the plan, the government adopted the SDG targets of ending all forms of malnutrition and achieving a reduction in stunting rates among children through the provision of improved nutrition. The Current Path forecast shows that Malawi will likely fall short of achieving this critical SDG target (SDG 2.2.1) and that the stunting rate would likely still be close to 30% by 2030, against a target of 25% (Chart 11). A significant number of Malawian children will therefore continue to be at risk of cognitive and physical limitations, impacting the future productivity and labour force of the country.
Despite the high malnutrition and stunting rates, the government of Malawi has made great strides in reducing infant and child mortality, currently below the average for low-income Africa. The government has achieved this feat through the roll-out of antenatal and delivery care, distribution of insecticide-treated nets, the preventative and curative treatment of common infectious diseases, field vaccinations programmes and the availability of community-based education programmes.[30UNICEF, Malawi making positive strides in saving newborn lives, but more needs to be done, 20 February 2018][31 JM Thornton, Child malnutrition in Malawi, The Borgen Project, 20 June 2015]
In 1990, infant mortality rates stood at 136 deaths per 1 000 live births, and the under-five mortality rate at 232. By 2020, infant mortality had dropped to 37 deaths per 1 000 live births, while the under-five death rate had dropped to 58. Infant mortality rates are nine deaths fewer than the average for low-income Africa, and under-five mortality rates are nearly 15 deaths fewer. While the reduction in infant deaths has shown much progress in the Current Path forecast, it will still not meet the SDG target. On the Current Path, infant deaths would likely be just above 25 deaths per 1 000 live births in 2030, more than double the SDG target of 12. The Current Path forecast shows (Chart 11) that Malawi will only achieve this target in 2050. Likewise, the Current Path forecast also shows that Malawi will not reach its under-five mortality rate targets of 25 deaths by 2030 and will likely only achieve this target by 2044. While the progress in reducing death rates among children, infants and maternal women has been promising, these figures are very high. One in eight Malawian children dies each year from preventable conditions such as malaria, HIV-related diseases and neonatal defects.[32JM Thornton, Child malnutrition in Malawi, The Borgen Project, 20 June 2015]
Malawi’s maternal mortality rates have also dropped significantly from 1 123 deaths per 100 000 live births in 2000 to 396 in 2020, below the average of 435 for low-income African countries. The SDG target for maternal mortality (SDG 3.1.1) is a ratio of fewer than 70 deaths per 100 000 by 2030. In the Current Path forecast (Chart 11), Malawi is estimated to reach a ratio of 275 deaths by 2030. On the Current Path, this target will likely be achieved in 2050.
Malawi has a very high disease burden, as evident in its low life expectancy. The main causes of mortality in Malawi are mostly preventable and treatable. Malaria and HIV/AIDS-related deaths accounted for 19% of deaths in 2020 (Chart 12) and communicable diseases made up a sizable portion of related deaths. A preventable measles outbreak in 2009 affected more than 11 000 people and poor water, sanitation and hygiene (WaSH) and municipal infrastructure has been responsible for severe cholera outbreaks. Cholera alone has been responsible for 63% of all epidemics experienced the past four decades in Malawi.[33Data source: EM-DAT, CRED / UCLouvain, Brussels, Belgium, www.emdat.be (D. Guha-Sapir), Version 2021-08]
Malawi is forecast to experience its epidemiological transition, a point at which death rates from non-communicable diseases exceed that of communicable diseases, in 2027 (Chart 13). It is roughly two years later than the average for low-income countries globally. This has implications for Malawi’s healthcare system which will need to invest in the capacities for dealing with this double burden of disease.
In spite of the progress made, Malawi’s health system still faces many challenges, including limited access to health services, poor management system in healthcare delivery, ineffective spending of funding and weak linkages with traditional medicine.[34 Malawi SDNP, Human resource development and management (social sector development)]Good health is a critical factor in human development and human capital formation. The Malawi authorities should therefore improve the quality of the healthcare system, enhance the quality of health workers’ training, improve the accessibility and affordability of healthcare, and roll out a national health insurance scheme across the entire country. This should go hand in hand with efforts to improve access to safe WaSH facilities to prevent the spread of communicable diseases. Such actions could fast-track attainment of the 2030 targets relative to infant and maternal mortality rates, as well as stunting rates.
Education and skills development
Education is a key pillar of human development and productivity. In the MW2063 vision, education is recognised as a crucial enabler to achieving Malawi's development objectives. Malawi's education system is guided by the 1993 Malawi Constitution in which education is a human right.[35Danish Trade Union Development Agency, Labour Market Profile – Malawi 2022/2023] The country’s formal education system comprises three levels: primary, secondary and higher education. At the end of eight years in primary education, the Malawi Primary School Leaving Certificate of Education (PSLCE) makes learners eligible for four years of secondary education.[36Danish Trade Union Development Agency, Labour Market Profile – Malawi 2022/2023]After obtaining the Malawi School Certificate of Education (MSCE) from secondary education, learners have the option of joining the Teachers Training Colleges, TEVET institutions, agriculture, forestry and natural resources training institutions, health services training, and universities to attain tertiary education.[37Danish Trade Union Development Agency, Labour Market Profile – Malawi 2022/2023] Non-formal education consists of Early Child Development and Adult Education, Out of school Youth and Functional Literacy, and Complementary Basic Education.[38Danish Trade Union Development Agency, Labour Market Profile – Malawi 2022/2023]
The government of Malawi has made efforts to expand access to education. Over the last decade, education expenditure has ranged from 13% to more than 20% of total government expenditure.[39Danish Trade Union Development Agency, Labour Market Profile – Malawi 2022/2023] In the 2020/21 national budget, the education sector got the lion's share, equivalent to 21.6% of the total budget, representing 5.4% of GDP.[40 W Chiuta, Malawi: Education Gets Lion’s Share in Malawi 2020/21 Budget, Nyasa Times, 11 September 2020] This places Malawi above the average of 3.7% for low-income countries in Africa. Education expenditure (% GDP) in Malawi is within the level recommended by the Incheon Declaration on Inclusive Education, which proposes that governments allocate between 4% and 6% of their GDPs to education if they are to achieve the SDG 4.[41UNESCO, What you need to know about the right to education, 2020]
As a result, Malawi has achieved notable improvements in some indicators related to education, especially primary education. The gross primary school enrolment rate has been above 100% since 1994 and stood at 142.5% in 2018 (the last year of available data), well above the average of 113.6% for low-income countries in Africa. This high percentage, however, reflects the continued presence of over-aged learners at the primary level as the net primary school enrolment was 97.4% in 2018. Also, the adult literacy rate (population aged 15 years and older) has increased from 61.3% in 2010 to 76.7% in 2018.[42 National Statistical Office (NSO) Malawi] This is almost 20 percentage points above the average of 56.4% for low-income Africa in 2018. Higher literacy rates improve employment prospects for poor people and provide an opportunity for formal sector employment and to escape extreme poverty. The Current Path shows that the country is progressing and on track to achieve the target of 81% in MW2063 by 2030. The national literacy rate is forecast to be 87.7% on the Current Path by 2030, almost seven percentage points above the MW2063 target of 81% in the same year.
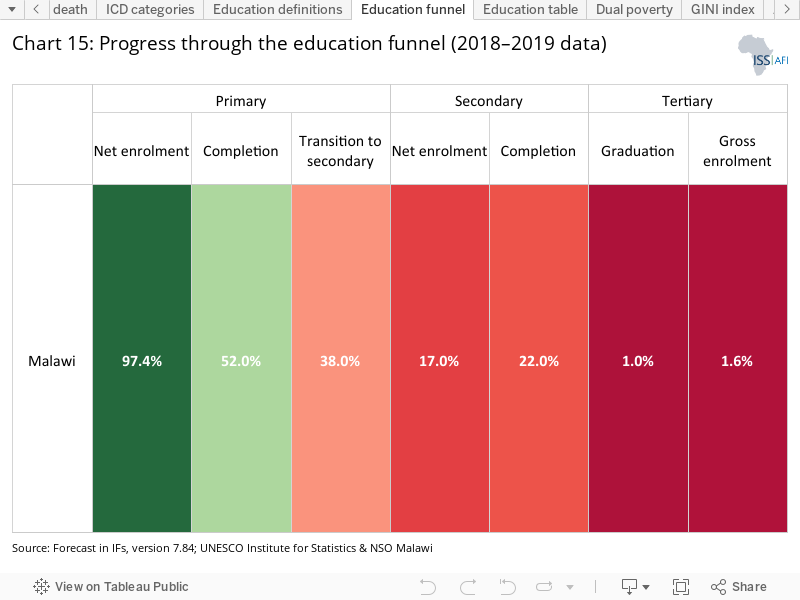
Despite this progress, Malawi still experiences several challenges in its education sector, with negative implications for national development. Chart 15 presents the performance of various education indicators (Box 1) from one level to another for Malawi. The chart is colour-coded to show the country's performance, ranging from good (green) to bad (red). It shows that access to secondary and tertiary education remains a huge challenge in Malawi. While the primary school net enrolment rate remains high and stood at about 97.4% in 2018 (the last year of available data), secondary school net enrolment and completion rates are extremely low at 17% and 22%, respectively. This means that Malawi has among the lowest secondary completion rates of the countries in the East Africa and Southern Africa regions. Malawi's gross enrolment ratio for tertiary education, at about 1.6%, is also one of the lowest in the world, and far below the average for low-income African countries at 6.3%.
The education system can be conceived as a long funnel where completion or attainment of one level gives access to the next. The more learners who enrol and complete primary school, the greater the pool of learners that can proceed to secondary and tertiary levels. Malawi has a very low transition rate from primary to secondary school (38%) (Chart 14), and this bottleneck together with a limited number of secondary schools are some of the key underlying factors of the low educational outcomes for secondary and tertiary levels. Such poor educational outcomes at secondary and tertiary levels impede progress in poverty and inequality reduction. Evidence suggests that children who complete secondary school are more likely to participate in formal and paid employment. For instance, a study in 2009[43E Chirwa and M Matita, The Rates of Return on Education in Malawi, University of Malawi, Chancellor College, 2009] revealed that attaining secondary education in Malawi improved earning potential by 15.4%, compared to 5.1% for primary school education.
The mean years of education for adults — a good indicator of the stock of human capital in a country — is low in Malawi. In 2015 (the last year of available data), the average number of years of schooling for adults aged 15 years and older was 4.6 years, below its neighbours Zambia (7.6 years), Zimbabwe (7.8 years) and Tanzania (6.1 years), however, above Mozambique (3.1 years).[44BarroLee Data Set, Barro-Lee estimates of educational attainment for the population aged 15–64 from 1950 to 2015] When disaggregated by gender, males have, on average, about five years of schooling, whereas females have 4.4 years. This means that most adults in Malawi have barely completed primary education. However, Malawi performs slightly better than the average of 4.1 years for low-income countries in Africa. On the Current Path, the average years of education for adults 15 years and older will likely be 5.9 years by 2030 and 8.4 years by 2063.
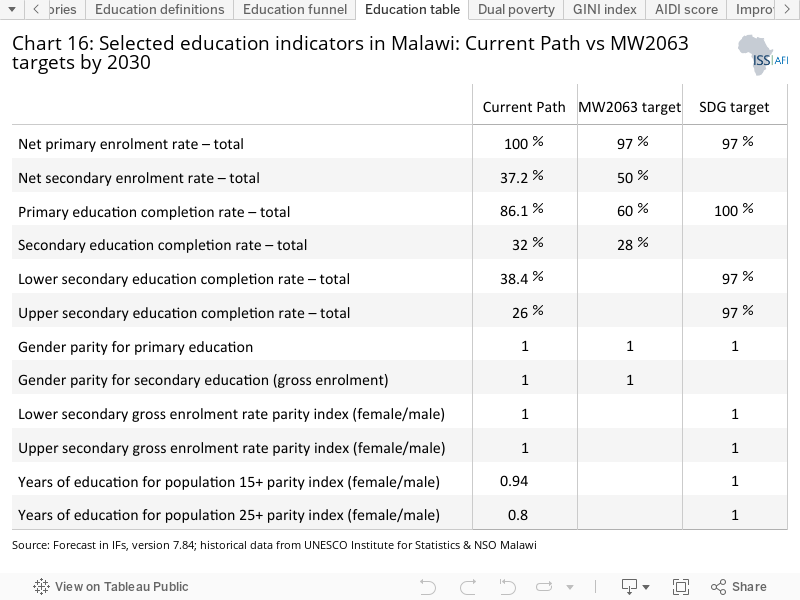
Despite the progress made, women still face challenges to accessing education in Malawi, especially higher education. Malawi has achieved gender parity at primary level, but the gender parity ratio is 94% for secondary enrolment and 60% for tertiary enrolment. In 2021, less than 40% of all students that entered public universities and colleges were women, compared to 60% men, with training courses such as engineering dominated by men.[45PS Hettinger et al, Malawi Economic Monitor: Addressing Macro and Gender Imbalances, World Bank, 1 December 2021] On the Current Path, Malawi will maintain the gender parity at primary enrolment and achieve gender parity for secondary and tertiary enrolment by 2030. However, the country is not on track to achieve many of the other targets in MW2063 (MIP–1) and SDG related to education (Chart 16).
The above analyses refer mainly to the quantity of education. Getting more children into school is essential, but ensuring that they actually acquire the requisite knowledge and skills is even more important. Education quality is low in Malawi and there is a mismatch between the skills offered in schools and what the labour market requires. The quality of education is usually tracked using Harmonized Test Scores, which are averaged across grades and subjects for those tests covering multiple grades and programmes.[46HA Patrinos and N Angrist, A Global Dataset on Education Quality: A Review and Update (2000–2017), World Bank Policy Research Working Paper No. 8592, 2018] According to the 2020 World Bank Human Capital Project report, students in Malawi score 359 on a scale where 625 represents advanced attainment and 300 represents minimum attainment.[47World Bank, Malawi – Human Capital Index 2020, October 2020]
Skills gaps and shortages in Malawi have serious macroeconomic implications. For instance, labour productivity in Malawi is the lowest among its neighbouring countries.[48Danish Trade Union Development Agency, Labour Market Profile – Malawi 2022/2023] While a number of factors enter into short-term growth, the new growth models have shown that, in the long term, economic growth depends primarily on the skills of the people.[49EA Hanushek and L Woessmann, The Economic Impacts of Learning Losses, Paris: Organisation for Economic Co-operation and Development, 2020] On the Current Path, the quality of education in Malawi as measured by test scores is forecast to gradually improve across the forecast horizon. A study in 2020[50EA Hanushek and L Woessmann, The Economic Impacts of Learning Losses, Paris: Organisation for Economic Co-operation and Development, 2020] revealed that skill differences account for three-quarters of cross-country variations in long-term growth. Investing in quality education and skills development training programmes is therefore vital to sustain economic growth in Malawi.
The education systems must be oriented towards producing youth that have both strong foundational skills as well as specific skills for jobs. This will require more investment in science, technology, engineering and mathematics (STEM) education, and high-quality technical and vocational education and training (TVET) programmes. The current TVET system in the country is unable to supply trainees at all qualification levels, leaving firms with inadequate labour supplies. Only 0.5% of the total education expenditure is directed towards TVET.[51Danish Trade Union Development Agency, Labour Market Profile – Malawi 2022/2023] Malawi should put more resources into its TVET and STEM programmes to respond to the demands of the Fourth Industrial Revolution.
The IFs forecasting platform relies on the international measures for extreme poverty. Thus, we use the US$1.90 a day poverty line (2011 purchasing power parity), unless otherwise specified, to remain consistent with international poverty analyses, and to track Malawi's progress towards the achievement of Goal 1 of the SDGs. As such, the poverty rates reported here differ from the poverty rates measured using the national poverty line, which was MWK137 428 per year or MWK376.5 per day as of 2017.[52National Statistical Office, Malawi Poverty Report 2018: Trends in Poverty, 2019, National Statistical Office (NSO), Malawi]
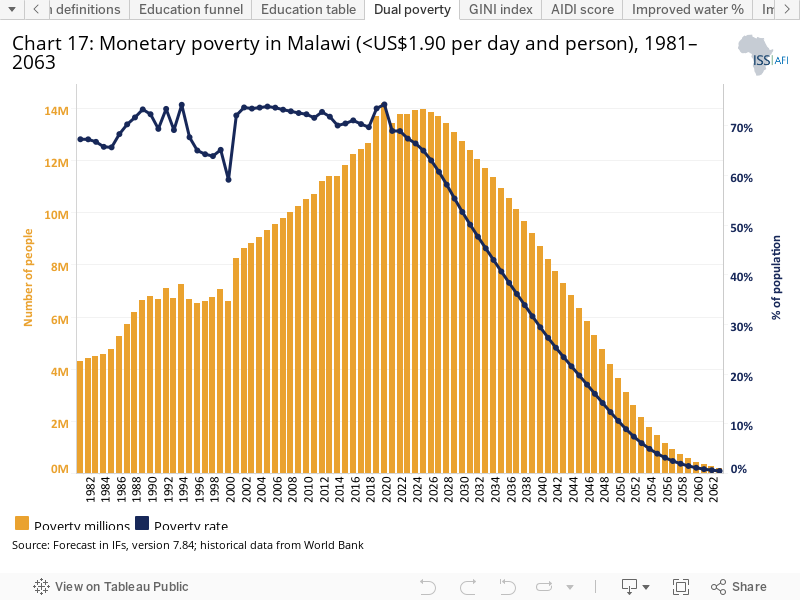
Using the poverty threshold of US$1.90, Malawi had the sixth highest poverty rate in Africa and globally in 2018. Chart 17 shows the past trends in poverty and projections in the Current Path scenario. It reveals that poverty is not a new phenomenon but a long-standing issue in Malawi. Using US$1.90 per day, Malawi experienced its lowest extreme poverty rates between 1996 and 2000, but the poverty rate has never been below 60%, except in 2000 when it declined to 59%. A deep economic contraction of −4.9% in 2001 increased the poverty rate to 72.1%, which slowly declined to 69.7% in 2018. The poverty rate in Malawi jumped to more than 70% in 2020 due to slow growth and increased unemployment caused by the COVID-19 pandemic. Thus, more than half of Malawi's population consistently lives in extreme poverty.
The poverty rate at the national poverty line was estimated to be 51.5% in 2017, compared to 50.7% in 2011.[53National Statistical Office (NSO), Fourth Integrated Household Survey (IHS4), 2018] The ambitious target of the government is to create inclusive wealth to halve it by 2030. Given Malawi’s past performance on poverty reduction, it will require significantly more rapid rates of inclusive economic growth, combined with additional measures such as expanded social transfers (grants) and/or employment schemes, to achieve this target. Over a 20-year period, poverty has declined only by about 14 percentage points from 65.3% in 1997 to 51.5% in 2017 using the national poverty line. Overall, little progress has been made in poverty alleviation in Malawi, and poverty still remains pervasive in the country regardless of the measures used (by national or international standards).
On the Current Path, the poverty rate in Malawi at US$1.90 is forecast to decline gradually to reach 52.6% by 2030, about 18 percentage points above the projected average of 34.5% for low-income Africa in the same year. The number of poor people is projected to peak at 13.9 million in 2025 due to population growth, before steadily declining to 12.7 million by 2030. Goal 1 of the SDGs requires that less than 3% of every country’s population should be living in extreme poverty by 2030. On the Current Path, Malawi will likely achieve this target only in 2057, meaning that on a business-as-usual pathway, the country will miss the SDG target of eliminating extreme poverty by 2030 by a substantial margin.
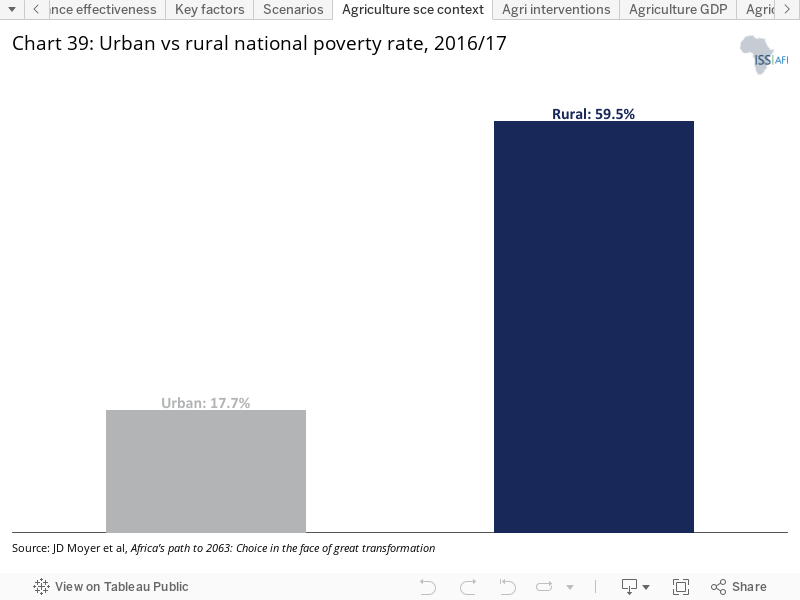
A key feature of Malawian poverty is its rural prevalence: the national poverty rate was 59.5% in rural areas compared to 17.7% in urban areas in 2016/17.[54 National Statistical Office (NSO), Fourth Integrated Household Survey (IHS4), 2018] The IFs platform currently does not disaggregate poverty by an urban–rural division to see how this massive disparity in poverty rate between rural areas and urban areas might evolve across the forecast horizon. But, given the pace of urbanisation and current forecasts for urban population growth, most of Malawi’s poor will likely still live in rural areas for many decades to come.
While urbanisation can drive innovation, productivity and growth and reduce poverty, if not well planned it can also lead to vicious cycles of poverty, inequality and social instability. A study[55M Ravallion, S Chen and P Sangraula, New Evidence on the Urbanization of Global Poverty, Population and Development Review 33:4, 2007, 667–701] found that urbanisation has been associated with falling overall poverty in all the regions of the developing world, except sub-Saharan Africa. This is because urbanisation in sub-Saharan Africa is generally not accompanied by significant economic opportunities, directly for rural–urban migrants and indirectly for people living in rural areas. Structural transformation of the economies, as well as infrastructure and service delivery, has not kept pace with the rate of urbanisation. For instance, over 50% of urban dwellers in sub-Saharan Africa live in slums, and only 40% of the urban population has access to improved sanitation facilities.[56J Barofsky, E Siba and J Grabinsky, Can rapid urbanization in Africa reduce poverty? Causes, opportunities, and policy recommendations, 7 September 2016] In sum, without additional measures, urbanisation is unlikely to reduce overall poverty in Malawi.
Malawi’s structural poverty can be explained by several factors, including low productivity in the agriculture sector, volatile economic growth, rapid population growth, poor human capital, limited access to financial services, recurrent natural shocks, and limited coverage of safety net programmes and targeting challenges.[57 Malawi 2020 Voluntary National Review Report for Sustainable Development Goals (SDGs), 2020] The current high debt burden also may hinder poverty alleviation efforts in Malawi, as it would reduce public investment, income growth and fiscal space for social spending due to the high debt service costs.
The government of Malawi, in collaboration with development partners, should implement policies and programmes that will likely produce inclusive wealth creation and reduce poverty. Such policies may include improving market and road infrastructure, and promoting irrigation to boost agricultural production and income.
The poverty rates discussed above show the share of the population below the poverty line, however they fail to reveal any information about the distribution of income above or below the threshold. Even though it has slightly decreased, the level of income inequality still remains high in Malawi (above the average for low-income Africa) and hinders progress in poverty reduction. The Gini coefficient is a standard measure of the level of inequality. In 2017, the national Gini coefficient was 0.42 compared to 0.45 in 2011.[58National Statistical Office (NSO), Fourth Integrated Household Survey (IHS4), 2018] Often, the implicit assumption in poverty reduction strategies is that poverty reduction will come through growth, i.e. the benefits of more rapid economic growth will trickle down to reduce poverty. However, while economic growth is necessary, it is not sufficient for poverty reduction as levels of inequality also matter. Higher levels of inequality have been shown to undermine the poverty-reducing effect of economic growth.[59AK Fosu, Growth, Inequality and Poverty in Sub-Saharan Africa: Recent Progress in a Global Context, Oxford Development Studies, 43:1, 2015, 44–59; M Ravallion and S Chen, What Can New Survey Data Tell Us about Recent Changes in Poverty and Distribution? World Bank Economic Review, 11:2, 1997, 357–82] This is because an initial maldistribution of physical, human and financial resources make it much harder for poor people to participate in, and therefore gain from, the proceeds of economic growth.
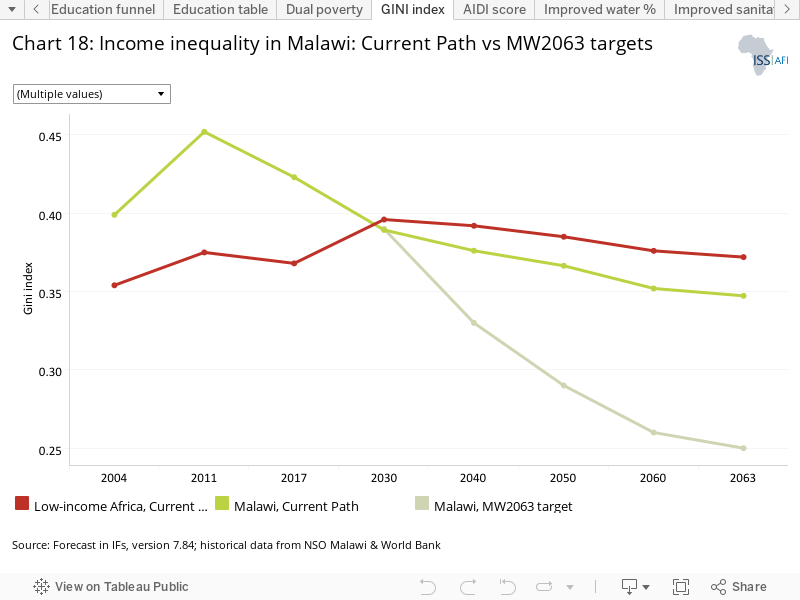
Without tackling inequality, economic growth will have little effect on poverty reduction in Malawi. MW2063 identified inequality as a challenge, and the target is to reach a Gini coefficient (Gini index) of 0.39 by 2030 and of 0.25 by 2063. Chart 18 shows how income inequality might evolve going forward on the Current Path.
On the Current Path, the Gini coefficient for Malawi by 2030 is 0.39, in line with the target of 0.39 set out in MW2063 (Chart 18). However, after 2030 the Current Path forecast shows a much slower reduction in income inequality than expected in MW2063, likely to be about 0.35 by 2063, 39% higher than the 0.25 desired. To achieve the objective of inclusive wealth creation, the government must commit to policies that redistribute the benefits of economic growth to all. To this end, Malawi will need to tackle corruption, scale up social safety nets and address the targeting challenges, employment creation and gender equality, among others. Promoting gender equality is a central development agenda in Malawi, but progress has been slow. Gender gaps across several economic dimensions persist in the country. In 2021, Malawi poorly ranked 115th out of 156 countries on the Global Gender Gap Index.[60World Economic Forum, Global Gender Gap Report 2021, March 2021] Closing the huge gender gap in agricultural productivity could contribute to inclusive wealth creation by lifting more than 238 000 people out of poverty and increasing the country’s total GDP by 1.85%.[61PS Hettinger et al, Malawi Economic Monitor: Addressing Macro and Gender Imbalances, World Bank, 1 December 2021]
The IFs model focuses on basic infrastructure such as water and sanitation, energy/electricity, roads and information and communication technology (ICT). Infrastructure development has widespread benefits to productivity and human well-being and has many direct linkages to poverty and inequality reduction.[62A Brenneman and M Kerf, Infrastructure and Poverty Linkages: A Literature Review, World Bank, 2002] MW2063 identifies economic infrastructure such as energy, ICT, roads, railway, water and airports as key enablers to the inclusive wealth creation agenda.
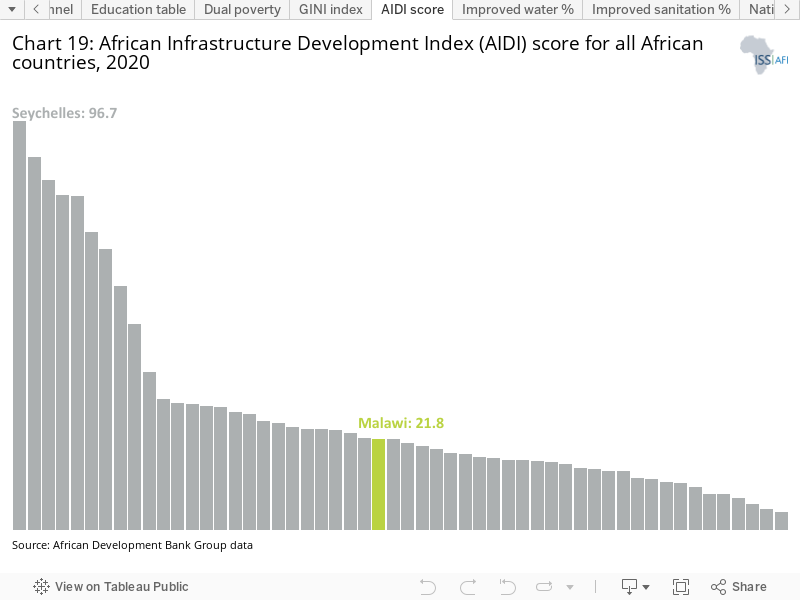
Infrastructure is generally poor in Malawi, and the fact that most Malawians reside in rural locations complicates the provision of infrastructure since it is usually much more cost-effective and easier to provide infrastructure to people in urban areas than in remote rural settings. In 2020, Malawi ranked 26th out of 54 African countries on the African Infrastructure Development Index (AIDI), with a score of 21.8 out of 100.[63African Development Bank Group, Economic brief – The Africa Infrastructure Development Index (AIDI) 2020, 17 September 2020] The AIDI is developed by the African Development Bank, and is based on four major components: water and sanitation, energy/electricity, transport and ICT. Each is briefly discussed below.
Water and sanitation
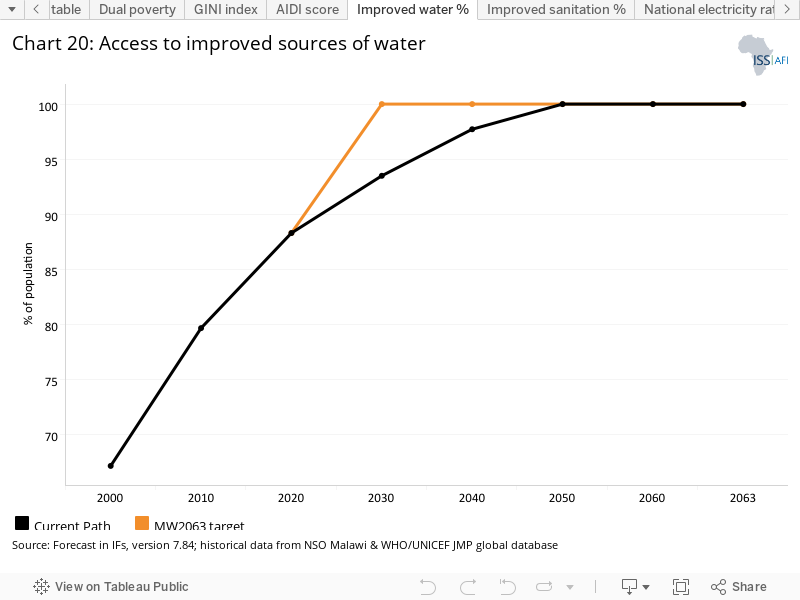
Access to improved water and sanitation infrastructure is critical to preventing deaths and illnesses from preventable communicable diseases, thus directly improving human well-being and leading to many indirect socio-economic benefits. Chart 20 shows the trends in access to improved water sources in Malawi. In 2000, 67% of the population had access to improved water sources; it increased to 88.3% in 2020, however about two million people still lack access to safe water.
Access to improved sources of drinking water is skewed towards urban areas. According to the Malawi Integrated Household Survey (2020), 97.1% of the population living in urban areas have access to improved sources of drinking water compared to 86.5% in rural areas. Most of the population (64.5%) access safe drinking water through boreholes, 17.8% have access to piped water into a yard/plot/communal standpipe, and only 2.4% have access to piped water into their dwelling.[64National Statistical Office (NSO), Integrated Household Survey 2020, 2020]
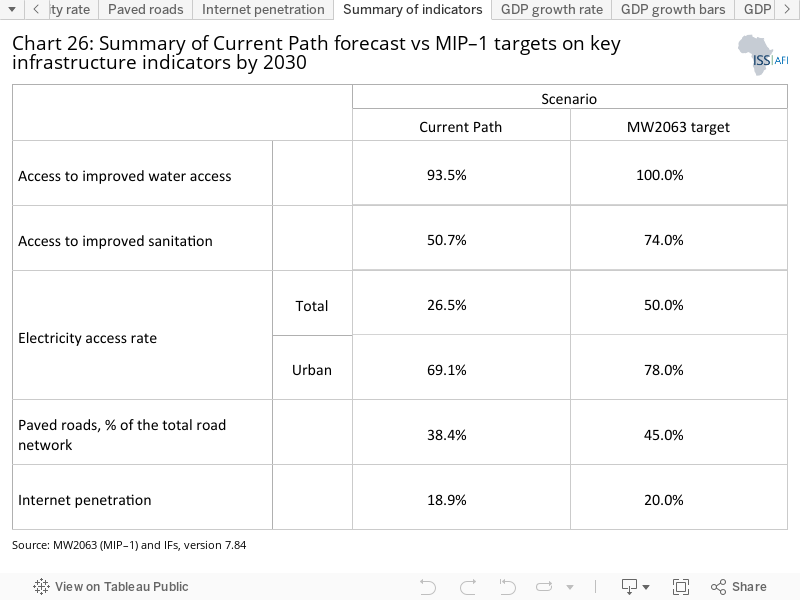
On the Current Path, the access rate of improved sources of water is forecast to be 93.5% by 2030, an improvement of 4.9 percentage points between 2020 and 2030. The target in MW2063 is 100% by 2030; however, in the Current Path forecast universal access (100%) is reached only in 2050 (Chart 20). The large portion of the rural population, compounded by the rapid population growth, might explain this slow growth in clean water access.
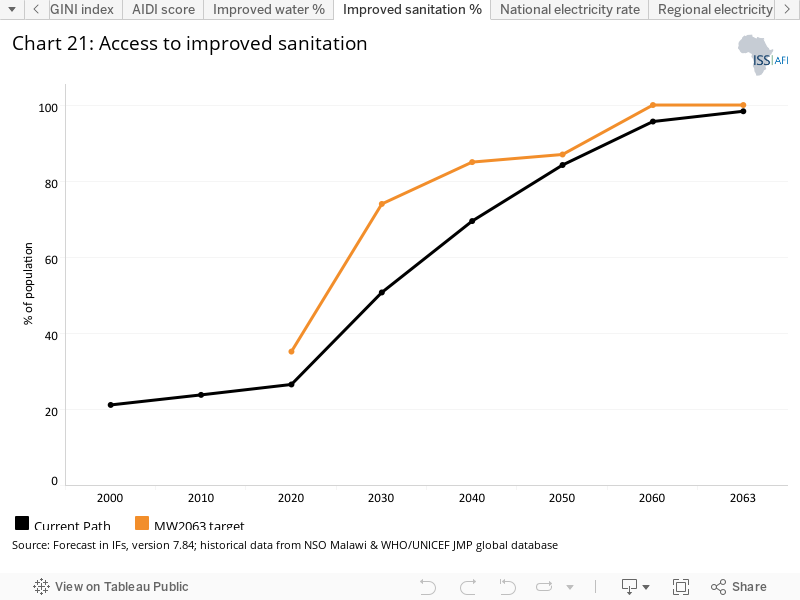
Access to improved sanitation rate in Malawi increased modestly from 21.2% in 2000 to 35.2% in 2020, compared to 21.8% for the average for low-income Africa and 29.4% for the average for Malawi's global low-income peers (Chart 21). In rural Malawi, only 29% of the population has access to improved toilet facilities compared to 65.5% in the urban areas.[65National Statistical Office (NSO), Integrated Household Survey 2020, 2020] Poor sanitation practices commonly increase the communicable diseases burden, which leads to more infant and child deaths.
The Current Path forecast is that access to improved sanitation in Malawi will continue to improve to reach 50.7% of the population by 2030, below the Malawi government target of 65%. After 2040, the gap between the Current Path forecast for access to improved sanitation and the targets in MW2063 will significantly narrow. Overall the sector of water and sanitation in Malawi has experienced significant achievements. However, the sector is beset with a number of challenges ranging from vandalism of water infrastructure, ageing infrastructure and funding shortages to dwindling sources of water. To achieve the goal of safe water and sanitation for all, a number of projects aimed at extending, upgrading and rehabilitating rural gravity water supply systems but also development and rehabilitation of boreholes across the country are being implemented. These projects include the Sustainable Rural Water Project and the Malawi Drought and Resilience and Recovery Project.[66Government of Malawi, Malawi Annual Economic Report 2021, Ministry of Finance, Economic Planning and Development and Public Sector Reforms, 2021]
Energy/electricity
Malawi is fortunate to have a range of energy sources such as hydro, fossil fuels, biomass, solar and wind, among others. However, energy shortage is one of the country's major problems and limits its socio-economic and industrial development.
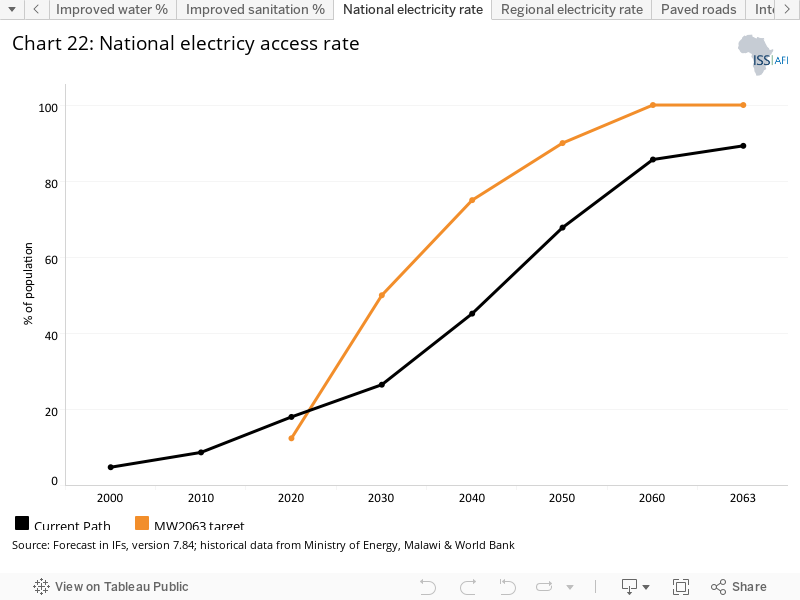
Malawi has the lowest national electricity access rate in SADC and one of the lowest in the world. In 2020, only 18% of the country's total population had access to electricity, compared to 34% for the average for low-income Africa and 42% for the average for its global low-income peers. And for those connected to grid power, supply remains largely unreliable. Malawi’s power generation is heavily dependent on weather conditions as about 98% of electricity is generated by hydroelectric power stations. Thus, low water levels during drought periods and silting during the rainy season disrupt electricity generation. This overreliance on hydropower for energy provision further increases the country’s vulnerability to climate changes.
On the Current Path, the national electricity access rate in Malawi does show improvements, reaching 26.5% of Malawi's population by 2030, but will remain far below the government's target of 50% by 2030. With a projected national electricity access rate of 89.3% by 2063, Malawi remains below the targets captured in MW2063 across the forecast horizon (Chart 22). The Malawi government should prioritise decentralised mini- and off-grid schemes, using renewable energy to improve the electrification rate.
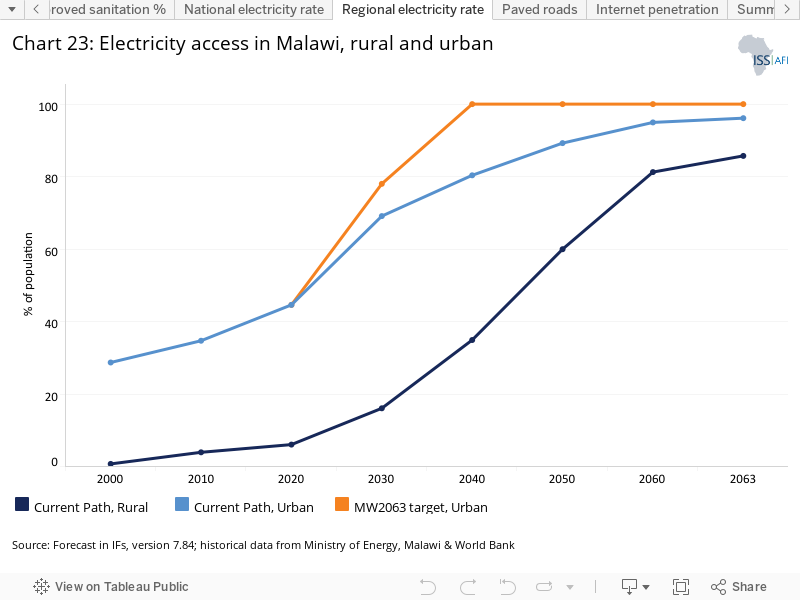
Like other infrastructure types, electricity access has a strong rural–urban dimension in Malawi. In 2019, 45.5% of the population in urban areas had access to electricity, while only 5% of the population in rural areas had access. The lack of equity between the rich and the poor is also stark, with the poorest 20% reporting 1% access to electricity and the wealthiest 20% reporting 31%.[67M Kojima et al, Who Uses Electricity in Sub-Saharan Africa – Findings from Household Surveys, Policy Research Working Paper No. 7789, Washington, D.C.: World Bank, 2016]
On the Current Path, access to electricity in urban areas is forecast to be 69% by 2030, nine percentage points below the target of 78% in MW2063. In rural Malawi, many households rely on biomass (firewood and charcoal), which accounts for 89% of the energy used in the country.[68Malawi Growth and Development Strategy (MGDS) III] Biomass contributes to environmental degradation such as deforestation. Also, the use of wood and charcoal leads to indoor air pollution, which causes respiratory-related illnesses. Moreover, in rural areas, the time-consuming task of gathering firewood is borne by women and girls, who are then diverted from education that could eventually have improved their productivity and lives.
The Current Path forecast is that the electricity access rate in rural Malawi will increase by about 10 percentage points from 6% in 2020 to 16.1% by 2030. Going forward, the gap between rural and urban electricity access rates will narrow (Chart 23). This forecast aligns with the Malawi government's effort to enhance electricity access in rural areas. The Ministry of Energy is implementing the Malawi Rural Electrification Programme (MAREP) to increase access to electricity for rural and peri-urban communities to transform rural economies and to reduce poverty among the rural population.[69Government of Malawi, Malawi Annual Economic Report 2021, Ministry of Finance, Economic Planning and Development and Public Sector Reforms, 2021]
On the Current Path, the gap between total energy production and demand is forecast to widen due to economic and population growth. The Current Path forecast is that the proportion of energy production to energy demand will be 61.5% by 2030 — below the Malawi government target of 100% in the same year.
Energy is the lifeblood of every modern economy. The availability of reliable electricity access is essential to companies’ decisions to adopt new technology. Hence, reliable, affordable and sustainable energy will be crucial in achieving the MW2063 development targets. The government of Malawi recognises the importance of energy in socio-economic development and is already making reforms in the power sector to address the energy deficit. The reforms have led to the entry of independent power producers (IPPs) for new generation capacity. A number of potential developers (more than 30) have been in contact with the government of Malawi to develop independent power projects. Most of the interested IPPs focus on solar PV, while some coal, heavy fuel oil (HFO) and small hydropower projects are also among the candidates.[70Privacy Shield Framework, Malawi – Energy]
Roads/transport
Good transport infrastructure is crucial for economic growth and development as it cuts across all the sectors of a country's economy. Roads improve accessibility to and mobility of goods, services and people, with positive effects on internal and external market integration, employment and productivity in rural and urban areas.[71S Asher and P Novosad, Rural Roads and Local Economic Development, American Economic Review, 110:3, 2020, 797–823]
Malawi has a multi-modal but underdeveloped transportation system consisting of road, rail, air and inland water transport. The country has a road network of 15 415 km, comprising main (21.7%), secondary (20.2%), tertiary (26.7%), district (22.7%) and urban (8.7%) roads.[72Ministry of Transport and Public Works, Malawi National Transport Master Plan, 2017] Road transport remains the major mode of transportation in the country, accounting for more than 70% of the internal freight traffic and over 90% of international freight traffic, mainly due to the inadequacy of other forms of transportation and the country being landlocked.[73Ministry of Transport and Public Works, Malawi National Transport Master Plan, 2017]
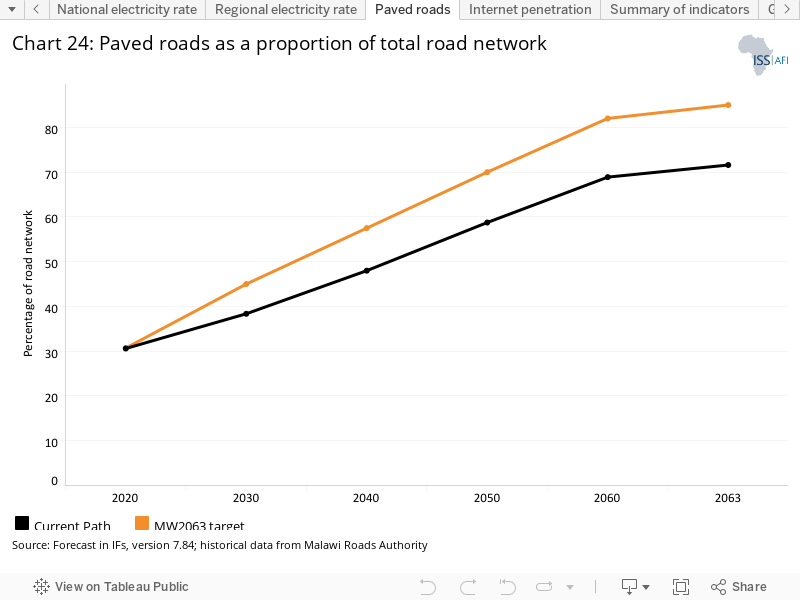
In 2020, about 30% of Malawi's road network was paved, compared to the average of 17.5% for low-income countries in Africa. According to the IFs forecast, 38.4% of Malawi's total road network will be paved by 2030, 6.6 percentage points below the target of 45% in the same year in MW2063. Across the forecast horizon, paved roads as a proportion of the total road network remain below the targets captured in MW2063 (Chart 24).
Malawi’s rural road network plays a vital role in the country’s economy, especially given the large rural population and their agricultural dependency. The Rural Access Index (RAI)[74ReCAP, Rural Access Index (RAI)] was measured at 63% in 2019, meaning that 37% of the rural population does not have access within 2 km to an all-season road. This makes it especially difficult for these communities to partake in economic activities.
The road condition surveys of 2011, 2014 and 2017 revealed deterioration in the condition of the road network in Malawi, mainly due to inadequate financing for rehabilitation and maintenance activities. For instance, the target for the 2020/21 financial year was to rehabilitate 5 km of the paved road network, but only 1 km was rehabilitated by 31 December 2020 (mid-year 2020/21) due to funding limitations.[75Government of Malawi, Malawi Annual Economic Report 2021, Ministry of Finance, Economic Planning and Development and Public Sector Reforms, 2021] Poor road conditions imply higher transport costs that reduce the competitiveness of Malawi's exports. Malawi authorities need to enhance transport infrastructure to reduce transport costs and to increase the competitiveness of Malawi's produce in domestic, regional and global markets. MW2063 identifies transport infrastructure development as key to reducing transport costs, which is in line with the National Transport Master Plan (NTMP).
The NTMP provides an opportunity for transport infrastructure development if it is implemented. It aims to provide strategies and a range of projects for urban transport designed to reduce costs and move towards high capacity mass transit in the main cities. The plan fosters a shift from road transport to rail for imports and exports along the major corridors and looks forward to meeting the transport needs of a changed economy in which growth sectors such as mining, oil and tourism will be fostered through improved transport links by implementing a major programme of rural roads upgrading. In addition, the NTMP takes into account the risk that climate change poses to transport infrastructure and services and includes proposals for both mitigation and adaptation measures.[76Ministry of Transport and Public Works, Malawi National Transport Master Plan, 2017]
Information and communication technology
Information and communication technology (ICT) is another critical enabler to achieving Malawi's development objectives. Efforts to expand access to broadband and ICT services could provide a new avenue for economic diversification, reduce distance barriers, improve efficiency in public service delivery and improve productivity with a positive effect on growth and poverty reduction.
Malawi has made progress in expanding digital infrastructure coverage. As of 2020, 83%, 82% and 65% of Malawi's population were covered by 2G, 3G and 4G mobile networks, respectively.[77National Statistical Office (NSO), 2019 National Household Survey on Access and Usage of ICT Services in Malawi, August 2020] Yet high Internet prices, the high cost of smart devices, low electricity access and a shortage of digitally skilled labour, among other reasons, hamper the uptake of ICT services in Malawi.[78World Bank, Malawi Economic Monitor: Investing in Digital Transformation, 23 June 2021] There are currently two mobile networks in the country: Airtel Malawi and TMN. The lack of market competition and an unfavourable tax regime for the ICT sector has resulted in some of Africa's highest prices for telecom services in Malawi.[79BuddeComm, Malawi Telecoms Market Report, June 2022]
Mobile cellular subscriptions are low in Malawi compared to the average for its income peers. Mobile phone subscriptions stood at about 42 per 100 people in 2017, below the average of 49.5 for low-income Africa and far below SADC's average of 74. The Current Path forecast is that mobile phone subscriptions in Malawi will stand at 88 per 100 people by 2030, which is above the Malawi government target of 80 in the same year.
In 2017, mobile broadband subscriptions per 100 people in Malawi stood at 25, compared to an average of 13 for low-income Africa and 26 for SADC. IFs estimated the subscription rate per 100 people at 37 in 2019, in line with the data from Malawi authorities. By 2030, mobile broadband subscriptions per 100 people are projected to reach 88, which is well above the Malawi government target of 60 in the same year. Fixed broadband provides faster Internet access speeds with more secure connections and is important for the high value-add service sector. However, fixed broadband penetration in Malawi is strikingly low, with a subscription rate of 0.05 per 100 people, below the SADC average of 1.3 and 0.2 for low-income countries in Africa. On the Current Path, fixed broadband subscriptions are forecast to be 13 per 100 people by 2030.
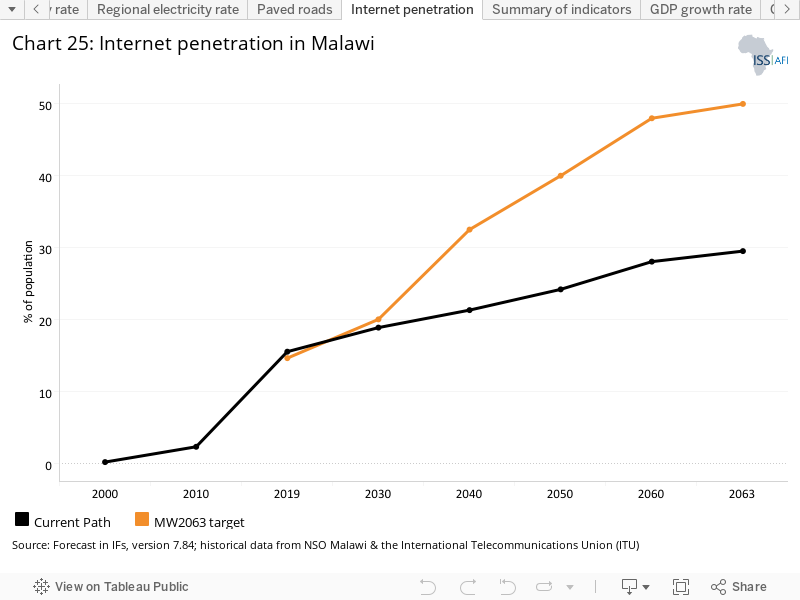
According to the 2019 National Survey on ICT Access and Usage, only 14.6% of Malawians use the Internet and connectivity is unpredictable. Malawi lags behind its immediate neighbours such as Tanzania (20%) and Zambia (19%), and is almost on par with Mozambique (15%). Internet connections are mostly via mobile networks. The Current Path forecast is that mobile broadband will continue to be the most common and popular way people in Malawi access the Internet. Internet penetration in Malawi will increase to about 19% by 2030, one percentage point below the expected 20% in the same year in the MW2063 development plan (Chart 25).
The gap between the Current Path forecast and the expected targets is projected to widen after 2030 probably due to the increasing size of the population relative to the ICT infrastructure, as well as poverty. To increase Internet penetration and achieve the target set in MW2063, efforts should be made to expand the provision of LTE infrastructure (wireless broadband communication for mobile devices) in poorer areas, accelerate electricity access, and reduce high Internet prices and the high cost of smartphones.
Enhancing ICT infrastructure and access to ICT services in Malawi will diversify and strengthen economic growth, increase government revenue, and lead to more job creation and innovation. Studies have shown that an additional 10% increase in mobile broadband penetration in Malawi could increase the GDP by US$189 million and tax revenue by US$33 million annually.[80World Bank, Malawi Economic Monitor: Investing in Digital Transformation, 23 June 2021] To this effect, the government of Malawi has developed several strategies, including the adoption of a national broadband and cyber security strategy in 2019. The Digital Economy Strategy 2021–2026 aims to support the growing ICT sector that provides goods and services which spur economic growth and create employment opportunities.
Agriculture is the backbone of Malawi’s small economy but the sector consists of subsistence, rain-fed agriculture, which limits its growth potential and increases its vulnerability to weather shocks. Malawi has experienced slow economic growth over the last decade due to a number of economic, political and climate-related shocks. Economic growth in 2020 was strongly affected by the COVID-19 pandemic, falling to 0.8%, four percentage points below the pre-pandemic projections of 4.8%, and the lowest registered growth rate since the 2001 recession. In 2021, favourable weather and agricultural input subsidies contributed to increases in the maize harvest and tobacco production. As a result, the economic growth rose to 3.9% from 0.8% in 2020.
The Russian–Ukraine war and the associated high energy and food prices may subdue economic growth in 2022. Chart 27 shows that Malawi's economic growth rates have been more volatile than the average for its income peers. Driven by the agriculture sector's performance, economic growth in Malawi remains consistently vulnerable to unfavourable weather conditions, tropical storms and external shocks. Since 2000, 42 weather-related disasters have occurred in Malawi,[81 N McCarthy et al, Recurrent Climatic Shocks and Humanitarian Aid: Impacts on Livelihood Outcomes in Malawi, Policy Research Working Paper No. 9666, 2021] and the country was the worst hit by the unprecedented drought that ravaged Southern Africa between 2015 and 2016.[82N McCarthy et al, Recurrent Climatic Shocks and Humanitarian Aid: Impacts on Livelihood Outcomes in Malawi, Policy Research Working Paper No. 9666, 2021]
In addition to climate-related shocks, sustained economic growth in Malawi is also at risk from macroeconomic instability. As of end-June 2021, total public debt represented 59% of GDP, up from 48% in June 2020. External debt accounts for 31% of GDP and 28% of GDP for domestic debt. External debt grew by 14% between June 2020 and June 2021, lower than the 42% increase in domestic debt.[83Ministry of Finance, Annual Public Debt Report 2020/2021, Debt and Aid Management Division, Malawi] Increasing domestic borrowing raises domestic interest rates, reduces fiscal space for investment and crowds out private investment.
Amid a drop in foreign exchange earnings caused by the COVID-19 pandemic, increasing import bills due to disruptions in supply chains, and rising commodity prices partly blamed on the war in Ukraine, the Malawian currency (kwacha) was devalued by 25% by the Reserve Bank of Malawi in May 2022.[84Agence France Presse, Malawi steeply devalues currency to shore up forex reserves, 26 May 2022] Exchange rate depreciation should increase export competitiveness and help to gradually reduce the high trade deficit, but it will also increase imported inflation, and render it more expensive to pay back debts out of local-currency revenues.
Forecasting economic growth
The economics model of the IFs forecasting platform draws on both the classical tradition of focus on economic growth with great attention to the newer work on endogenous growth theory and the neoclassical perspective of general equilibrium approach.[85 For a detailed description of the production function in International Futures mode, see International Futures (IFs)] The supply side of the economic model is based on the Cobb–Douglas production function and uses labour, capital and multifactor/total factor productivity as the primary drivers of economic growth. Multifactor or total factor productivity in the model is determined by human capital (education and health), social capital (governance effectiveness, corruption and economic freedom), physical capital (infrastructure) and knowledge capital (research and development). Each of these four categories contributes positively or negatively to economic growth.
Looking across the main determinants of multifactor/total factor productivity, physical capital (infrastructure) is the most significant constraint on productivity growth in Malawi. This is due to the underperformance of the country on traditional infrastructure indicators, especially electricity and transportation. Across the forecast horizon, physical capital remains the biggest drag on productivity growth in the country. Studies have shown that productivity accounts for half of the differences in GDP per capita across countries.[86The World Bank, The World Bank Productivity Project] It is therefore essential to address these binding constraints on productivity.
The Current Path forecast shows positive economic growth rates in Malawi. However, the projected average economic growth rate between 2022 and 2030 is about 5%, one percentage point below the target set out in MW2063. After 2030, the growth forecast on the Current Path is one to two percentage points above the targets in MW2063 (Chart 28). Across the forecast horizon, the maximum economic growth rate in Malawi is 8.3%, up to 0.4 percentage points above the average for low-income Africa. As a result of these expected positive growth rates, Malawi's GDP (2017 constant US$) will substantially increase by about 62.8%, from US$12.01 billion in 2020 to US$19.56 billion in 2030. The size of the economy is forecast to be US$235.3 billion by 2063.
In 2019, Malawi had the 36th largest GDP in Africa. However, it ranked 48th out of Africa's 54 countries in terms of GDP per capita. On the Current Path, Malawi's real GDP per capita (2017 purchasing power parity) is projected to increase only by 31.5%, from US$1 248 in 2020 to US$1 641.5 in 2030 and to US$8 030 by 2063. As for the real GDP per capita (market exchange rate), it increases by 29% from US$628 in 2020 to US$810 in 2030 and to US$6 071 by 2063. The projected increase in Malawi's GDP per capita between 2020 and 2030 remains modest compared to the projected 62% rise in GDP over the same period. High population growth means economic growth rates translate into smaller per capita income increases.
On the Current Path, Malawi's GDP per capita will likely continue to stay below the projected average for its income peers and show convergence only in 2060 (Chart 29). One of the plausible explanations for this convergence might be the projected low fertility rate in Malawi from 2060. The country is forecast to have one of the lowest fertility rates (1.9 births per woman) among its income peers in 2060. Slow population growth means economic growth translates into higher per capita income, which eventually closes the gap with the average for low-income countries, all other things being equal.
The goal of MW2063 is to graduate Malawi to a lower middle-income country by 2030 and to an upper middle-income country by 2063. The World Bank uses income classification based on gross national income (GNI) per capita. GNI per capita is not forecast in the IFs model which uses GDP per capita measured in purchasing power parity (PPP) and at market exchange rates (MER). However, the net foreign factor income (NFFI), which is the difference between a nation’s GNI and GDP, is generally not substantial in most countries. For instance, in 2019, the GNI per capita and the GDP per capita for Malawi were almost the same at about US$600. If this trend continues over the next 10 years, the GNI per capita for Malawi could be about US$810 by 2030 which is below the current lower middle-income threshold of US$1 086 defined by the World Bank. Thus, Malawi will likely not achieve lower middle-income status by 2030.
To check whether Malawi is on track to achieve upper middle-income status by 2063, we relied on some studies in the literature that have attempted to determine income thresholds based on GDP per capita (PPP) that match as much as possible that of the World Bank income classification using GNI per capita. The upper middle-income threshold defined in the literature based on GDP per capita (1990 PPP) is between US$7 250 and US$11 750.[87J Felipe, Tracking the Middle-Income Trap: What is It, who is in It, and Why? ADB Economics Working Paper Series No. 306, 2012] This threshold is constant over time as the World Bank's thresholds based on GNI per capita are inflation adjusted and, therefore, remain constant in real terms over time. Using 2017 US$ (PPP), this threshold would be between US$13 050 and US$21 150.
Thus, Malawi would achieve upper-middle-income status by 2063 if its projected GDP per capita (2017 PPP) is above US$13 050. On the Current Path, Malawi's projected GDP per capita (2017 PPP) dollar[88One could also use income thresholds converted to 2011 US$ (PPP), and the result is the same: Malawi is not on track to achieve lower-middle income status by 2030.] is US$8 030 by 2063. The country is therefore not likely to achieve lower middle-income and upper middle-income levels on the Current Path by 2030 and 2063, respectively. On the Current Path, Malawi will likely achieve lower middle-income status from 2047 and remain in that income group by 2063.
The projected average annual growth rate of GDP per capita for Malawi over the period 2022 to 2030 is only 2.7%. This will not be enough to propel Malawi to lower middle-income status by 2030. By way of comparison, the real GDP per capita of Ethiopia, Africa’s best performer, rose by an average annual rate of about 8% from 2004 to 2014. Malawi can replicate this success provided appropriate policies are implemented. The country’s ability to achieve robust and sustainable growth will depend to a large extent on developing a thriving private sector, investment in skills development and infrastructure, and an increase in agricultural productivity. The challenging business environment constrains growth opportunities for small-sized companies and foreign direct investment inflows.
Share of economic sector in Malawi’s GDP
Chart 30 shows the structure of Malawi's GDP according to IFs classification of sectors. The production function in the IFs model is embedded in a six-sector model of the economy featuring agriculture, materials, energy, manufacturing, services, and information and communication technology (ICT). The projected economic patterns show signs of positive structural change, with the share of agriculture in GDP falling and that of more productive sectors like manufacturing and services increasing.
In 2020, the service sector accounted for more than 50% of Malawi's GDP. Efforts to improve productivity in the service sector will have positive spillover effects on the other sectors of the economy and foster economic diversification as many services are major inputs to production across economic sectors. The agriculture sector makes the second most significant contribution to Malawi's GDP at about 23%, while the manufacturing sector ranks third to the service and agriculture sectors with a contribution of about 12%. The share of the ICT sector is estimated at 3.3%, while the energy and materials (mining) sectors contributed about 3% and 1%, respectively.
The share of the manufacturing sector in GDP in Malawi has been shrinking after reaching a peak of 19% in 1992, implying that the country has been deindustrialising while still poor. The manufacturing sector will account for about 16.5% of GDP by 2030, nearly four percentage points above the target of 12.6% in MW2063. The manufacturing sector in Malawi consists of industries such as textiles, clothing and footwear, and agricultural crops produce processing (e.g. tobacco, tea, coffee, sugar, soya, groundnut products and macadamia nuts). In addition to poor infrastructure, the sector faces a very high tax burden which makes local products less competitive.[89C Mangazi, Manufacturing share shrinking, The Times Group, 12 March 2021]
Although the agriculture sector contributes about a quarter of Malawi's GDP, it is crucial for economic growth in the country due to its linkages with the other sectors of the economy, by providing inputs for the manufacturing sector and determining the income levels of the majority of the labour force which drive demand in the services and manufacturing sectors.
On the Current Path, IFs forecasts that the service sector will continue to have the largest share in GDP, 60% by 2030 and 66% by 2063. This is above the targets of 46.6% and 31% in 2030 and 2063 respectively in MW2063. The share of the agriculture sector in GDP declines faster than what is expected in MW2063. It is forecast to be about 16% by 2030 and 2.3% by 2063 against 27.8% and 8% in 2030 and 2063, respectively, in MW2063. Strengthening the digital economy is also an important avenue for Malawi to diversify its economy and boost growth to achieve its development objectives. The ICT sector is forecast to account for 3.4% of GDP by 2030 and will probably become the third largest contributor to GDP from 2050, after the service and manufacturing sectors.
The COVID-19 pandemic has further demonstrated the importance of building resilience through diversification. There is a need to enhance the manufacturing industry with strong backward and forward linkages with the agriculture, mining and service sectors to achieve sustained growth, reduce poverty and diversify the sources of income and foreign exchange earnings. In MW2063, industrialisation is recognised as central to achieving inclusive wealth creation and self-reliance. Industrialisation will transform the economy from being predominantly consuming and importing to predominantly producing and exporting.
International trade and foreign direct investment
Like many African countries, Malawi mainly exports primary products and imports manufactured goods. Little progress has been made in the diversification of Malawian exports. The country's trade export pattern continues to depend on agricultural products, with tobacco, tea and sugar being the major commodities exported. In 2020, tobacco accounted for over 51% of Malawi's total export. Sugar and coffee exports claimed second and third positions with 10% and 11% share of total exports, respectively, implying that three agricultural products represented over 70% of Malawi's total exports.[90Government of Malawi, Malawi Annual Economic Report 2021, Ministry of Finance, Economic Planning and Development and Public Sector Reforms, 2021] This commodity dependence leaves Malawi vulnerable to global commodity price shocks, creates volatility in government revenue and foreign exchange reserves, and undermines inclusive growth and the country's development prospects.
As for imports, fuel had been Malawi's main import product. As of June 2020, it accounted for 32% of total imports value, down from 40% in 2019. Fuel and other products such as telecommunication gadgets, pharmaceutical products, mechanical appliances, vehicles, animal and vegetable fats, second-hand clothing items, and plastics account for 60% of Malawi's import basket.[91Government of Malawi, Malawi Annual Economic Report 2021, Ministry of Finance, Economic Planning and Development and Public Sector Reforms, 2021] The country's trade balance is structurally in deficit. Unfortunately, looking into the future, the picture is not likely to improve. On the Current Path, the trade deficit is projected to reach about 37% of GDP by 2030, up from around 17% in 2020.
The successful implementation of the National Export Strategy II (NES II), which focuses on promoting manufacturing exports, will likely turn around this forecast. The ratification of the African Continental Free Trade Area (AfCFTA) also offers hope for improving Malawi's trade balance. Malawi has already secured US$371 million worth of export deals within the AfCFTA with Angola, Botswana, South Africa, South Sudan and Côte d’Ivoire to supply various commodities such as maize, beans and rice.[92N Tena, Malawi $1billion energy deal to boost economy, ESI Africa, 18 November 2021] Boosting exports under the AfCFTA will, however, require careful identification and support to subsectors in which Malawi has a comparative advantage and the design of a business strategy to engage regional value chains. Open trade policy without a strategic assessment of its impacts can undermine the domestic industries.
Turning to foreign direct investment (FDI), Malawi offers investment opportunities in agriculture and minerals, agro-processing, manufacturing and tourism. However, the country has received little FDI, especially at the end of the latter decade. According to UNCTAD's 2021 World Investment Report, FDI inflows decreased from US$822 million in 2019 to US$98 million in 2020 due to the global economic crisis triggered by the COVID-19 pandemic.[93UNCTAD, World Investment Report 2021, United Nations, 2021] On the Current Path, net FDI inflows to Malawi are forecast to increase but will probably not reach the level that could make it a game changer in the country. By 2030, the net FDI inflows into Malawi will likely be equivalent to 4.27% of GDP, slightly below the projected average of 4.7% for low-income countries in Africa.
Malawi's landlocked geographical location and the inadequate condition of its infrastructure hamper FDI inflows. The business climate is also poor due to a lack of a skilled workforce, high transportation costs, an unreliable supply of electricity and time-consuming administrative procedures. In the World Bank's 2020 Doing Business Report, Malawi ranked 109th globally for the ease of doing business, slightly improving from its position of 111th in 2019.[94World Bank Group, Doing Business 2020, 2020] FDI can contribute to economic and export diversification. Malawi authorities should create a business-enabling environment to place Malawi among the most preferred investment destinations in Africa. Regulations that ease bureaucratic processes and improvement in infrastructure will attract settlements of foreign companies.
Informal economy
The informal economy comprises activities that have market value and would add to tax revenue and GDP if they were recorded. Countries with high informality have a whole host of development challenges such as low revenue mobilisation. Economic growth tends to be below potential in countries with high levels of informality.[95C Deléchat and L Medina, What is the informal economy? Finance & Development, IMF, December 2020]
The informal sector is, however, the lifeblood of the growing population of young Malawians. In the absence of formal sector opportunities, around 89% of total employment was estimated to be in the informal sector in Malawi.[96National Statistical Office (NSO), Malawi Labour Force Survey 2013, April 2014] This is in line with other sub-Saharan African countries where informal employment accounts for between 85% and 95% of total employment. The share of employed persons in informal employment is 91% in rural areas and about 69% in urban areas.[97National Statistical Office (NSO), Malawi Labour Force Survey 2013, April 2014] As of 2018, the size of the informal sector in Malawi was equivalent to 37% of GDP. On the Current Path the level of informality is forecast to decline to 34% of GDP by 2030 and to 23.6% of GDP by 2063. Addressing informality is essential to promote inclusive wealth creation in Malawi. However, systematic attacks on the sector motivated by the view that it generally operates illegally and evades taxes will be counterproductive. The process should be gradual as the informal sector is currently millions of people's only viable income source. Improving access to quality education, job creation and financial inclusion are some policies to tackle informality.
The agriculture sector is the backbone of the Malawian economy. In 2020, the sector contributed 23%[98National Planning Commission, Malawi's Vision 2063: An Inclusively Wealthy and Self-reliant Nation, 2020] to the country’s GDP, employing nearly 80%[99National Planning Commission, Malawi's Vision 2063: An Inclusively Wealthy and Self-reliant Nation, 2020] of the population, and was the main source of export earnings. Of the total agricultural land, almost 90% is cultivated by rain-fed farming, with only 4% under irrigation.[100 S Tione, Land markets and agricultural household decisions nexus in Malawi, PhD thesis, Norwegian University of Life Sciences School of Economic and Business, Ås, Norway, 2020] The sector continues to receive much-needed attention as the government has long recognised the fundamental role thereof and investment in this sector has been well guided by several successive and progressive development plans and policies.
The sector has, however, been slow to diversify its export offerings, and it is plagued by low productivity, insufficient in-country processing capacity, high storage, processing and transportation costs, low irrigation penetration, and inadequately managed supply chains.[101The Malawi Priorities Project, Cost-benefit analysis of interventions to encourage agricultural exports in Malawi – Technical Reports, 2021] Farmers have been slow on the uptake of modern technologies and small, fragmented land parcels have stifled the growth potential of the sector and contributed to poor land management, deforestation and environmental degradation. These challenges have been recognised and the sector’s fundamental role in getting Malawi to inclusive wealth creation and self-reliance is well embedded as a pillar in MW2063. MW2063 rightly places emphasis on transforming the sector to be more productive and to build on existing efforts for commercialisation.[102National Planning Commission, Malawi's Vision 2063: An Inclusively Wealthy and Self-reliant Nation, 2020]
The Farm Input Subsidy Program (FISP) introduced in 2005 has helped to increase fertiliser consumption in the country from 28 kg per hectare to about 45 kg per hectare compared to a low sub-Saharan Africa average of about 7 kg per hectare.[103World Bank, Malawi Economic Monitor: Charting a New Course, June 2019] As a result, the average agricultural yields in Malawi have increased substantially from 3.2 metric tons per hectare in 2005 to about 7.8 metric tons per hectare in 2019.
Malawi currently has the highest average crop yields per hectare in low-income Africa and even performs above the average for lower middle-income Africa. However, it still remains far below African top performers such as Mauritius (55 tons per hectare), Eswatini (42 tons per hectare), and Djibouti and Egypt (26 tons per hectare). While no average yield targets have been set in MW2063, Malawi is well on its way to sustaining this increase in yields. On the Current Path (Chart 33) the country is likely to reach an average crop yield of 10 metric tons per hectare by 2030 and 20 metric tons per hectare by 2063. Despite this improvement in crop yields in recent years, food insecurity continues to be at a high level. The number of Malawians facing high-level, acute food insecurity stood at an estimated 1.7 million in September 2020 (nearly 9% of the population).[104World Bank, The World Bank in Malawi]
The vast majority of Malawi’s 15.8 million rural dwellers are subsistence farmers that rely on rain-fed agriculture, making the country extremely vulnerable to rainfall variability. Cycles of drought and flooding have ravaged the country causing widespread devastation and famine. These weather-related events have disrupted food systems and impacted food security on several occasions in Malawi’s history. The past four decades alone have seen eight devastating droughts, 39 recorded flooding events and three destructive cyclones.[105EM-DAT Public] Flooding regularly causes farmers to be cut-off from their markets and the lack of access to irrigation makes it impossible for farmers to survive droughts and erratic rainfall.
Weather disasters have culminated in more than 32 million people[106EM-DAT Public] needing emergency assistance. The most recent droughts of the 2015/16 El Niño system required one of the largest emergency relief assistance programmes in the country’s history, directly affecting 6.7 million people. The 2012 droughts resulted in widespread food shortages and affected 1.9 million Malawians, while the torrential rains of the 2019 cyclone Idai affected 975 000 people. The country was ranked as the fifth most affected country by climate hazards in 2019 in the Germanwatch Global Climate Risk Index 2021[107D Eckstein, V Künzel and L Schäfer, Global Climate Risk Index 2021, Germanwatch] report. This year alone the country has already been affected by two cyclones with cyclone Ana estimated to have impacted 110 000 Malawians.
The frequency and the intensity of these weather disasters have significantly increased over time. Since 2000, 42 weather-related disasters have occurred in Malawi, while the preceding two decades only recorded 12.[108EM-DAT Public] The upward trend in recorded economic and agricultural losses can directly be attributed to a shifting climate, growing vulnerabilities within rural communities and the slow adaptation of the sector to these extreme events. As the impacts of climate change unfold over the next couple of decades, this will undoubtedly be one of the greatest threats that this sector will have to deal with.
Current adaptation policies, allocated finances, and programmes within the agriculture sector are inadequate to tackle this immense growing threat. Malawi, as one of the world's least developed countries, lacks the resources to finance and implement climate adaptation measures.[109A Mbiyozo and A le Roux, Climate finance isn’t reaching Southern Africa’s most vulnerable, 2 November 2021] The country was ranked 163rd on the Notre Dame Global Adaptation Initiative (ND-GAIN) Index in 2019, which measures the level to which a country is both vulnerable to climate change and ready to improve resilience. Malawi’s ranking has been declining since 2009, when it was ranked 149th in the world. The country is the 25th most vulnerable country in the world to climate change but only ranks 160th for readiness.[110ND-GAIN Country Index, Malawi] Current adaptation policies and actions have been criticised[111MK Joshua et al, Climate Change in Semi-arid Malawi: Perceptions, Adaptation Strategies and Water Governance, Journal of Disaster Risk Studies, 8:3, 2016, 255] for their irrelevance and generalisation, and the country receives disproportionately little climate finance to address this growing threat.[112A Mbiyozo and A le Roux, Climate finance isn’t reaching Southern Africa’s most vulnerable, 2 November 2021] Each of the players in the agriculture sector needs to mainstream climate adaptation into all its policies, plans and projects, and climate finance needs to be mobilised to address this growing imminent threat.
In 1990, 25.3% of Malawi’s 9.4 million hectares of land area was used for crop production. This figure has dramatically grown to 40.4% in 2020. Much of the growth has been at the expense of forests, and in these three decades forest land has contracted from 3.5 million hectare to 2.3 million hectares.[113 IFs database. Data source: FAO] Poor land use management has also contributed to severe land degradation and economic losses. For instance, it is estimated that the annual cost of land degradation due to poor land use and land cover change during the 2001 to 2009 period was about U$244 million (in constant 2007 US$).[114OK Kirui, Economics of Land Degradation and Improvement in Tanzania and Malawi, in E Nkonya, A Mirzabev and J von Braun (eds.), Economics of Land Degradation and Improvement – A Global Assessment for Sustainable Development, Cham: Springer, 2016] The country has set several targets to reverse and minimise land degradation. The vast majority of cultivated land is occupied by subsistence farmers growing maize with limited cultivation of pulses, groundnuts, sweet potatoes, cassava, potatoes and mangos for domestic consumption. Farm sizes for the poorest Malawians averages below 1 hectare, severely limiting production.[115IPC Integrated Food Security Phase Classification, Malawi IPC Chronic Food Insecurity Report, May 2022]
As available land is shrinking, the focus should be on productivity to increase food security, exports and income levels and reduce poverty. Despite its small land area, the Netherlands has become the second largest agricultural exporter globally after the US. Malawi could follow this example by investing in climate-smart technologies and productivity-enhancing farming methods, as well as improving the efficiency of the Affordable Inputs Programme (AIP) so that it does not disproportionately benefit richer agricultural households than the poor.
In 2020, 27.7 million metric tons of crops were produced (Chart 35), a significant increase from the 5 million metric tons produced in 1990. In the Current Path forecast, crop production is forecast to increase to 34.4 million metric tons by 2030 and to an estimated 78 million metric tons by 2063. In the Current Path forecast, agricultural crop demand is set to increase from 27.4 million metric tons in 2020 to about 36.6 million metric tons by 2030 and to 67.2 million metric tons by 2063. The Current Path forecast for 2030 paints a picture of a growing demand for foodstuff that will be unmet through local production. Food price fluctuations on imports and climate shocks can severely impact the country's food security. The longer time horizon shows that crop production will exceed domestic demand and by 2050 onwards the country could become self-reliant to meet the crop demands of its people, and potentially boast a vibrant export market.
The agricultural export market will, however, need to be more diversified. Malawi is well known for its tobacco exports, which remain the main agricultural export commodity, and in 2020 the country ranked as the fifth largest exporter thereof in the world.[116OEC, Raw tobacco in Malawi] However, farmers have slowly started shifting away from tobacco production. In 2004 it was estimated that 16% of crop farms produced tobacco, the figure has dropped to 5% in 2019 with much of it occurring on larger commercial farms. Recent diversification efforts have resulted in farmers growing other cash crops for exports including sugar, tea, legumes and cotton,[117National Statistical Office (NSO), Malawi in Figures 2020 Edition] but the extent of these remains small. Despite this diversification, the sector performs below the desired production and productivity levels and a drastic shift from ‘low productivity and subsistence-oriented agriculture to a highly productive, diversified and commercialized agriculture system with manufacturing linkages’[118Government of Malawi, Malawi Annual Economic Report 2021, Ministry of Finance, Economic Planning and Development and Public Sector Reforms, 2021] are needed.
Good governance is paramount in the development process. Improvement in governance measures can accelerate poverty reduction and boost macroeconomic outcomes. In 2022, a study[119M Newiak, A Segura-Ubiergo and A Aziz Wane (eds.), Good Governance in Sub-Saharan Africa: Opportunities and Lessons, Washington, D.C.: International Monetary Fund, 2022] found that the governance dividend for the average sub-Saharan African country would be two to three times larger than the rest of the world. The study further reveals that poor governance and higher corruption are associated with lower growth, worsened fiscal performance, higher inflation and lower levels of development in sub-Saharan Africa.
According to the 2020 Ibrahim Index of African Governance (IIAG) report,[120Mo Ibrahim Foundation, 2020 Ibrahim Index of African Governance (IIAG) Report, 2020] Malawi's overall governance declined by 1.3 points over the last decade (2010–2019). With a score of 51.5 out of 100, Malawi ranked 23rd of 54 African countries. Malawi has improved its score in ‘the rule of law and justice’ sub-category. The landmark ruling by the High Court that annulled the fraudulent 2019 presidential election is a demonstration of an increase in Malawi judiciary's independence. The country, however, regressed in the ‘anti-corruption’ sub-category, with its score declining by 6.5 points over the period (2010–2019).
Corruption is a significant factor that disrupts the country's efforts to enhance social and economic development. A considerable number of resources both from government and development partners meant for development projects are diverted or mismanaged. Malawi has recently experienced a number of corruption scandals involving high-level civil servants, senior politicians and senior military officers. According to the UN, Malawi lost about US$500 billion to corruption in 2019 alone.[121D Mmana, Corruption costs Malawi K412.5 billion, The Times Group, 18 November 2021] As a result, donors have scaled back their aid programmes and suspended budget support, compromising government development activities and the availability of basic public services as Malawi relies heavily on international aid as a source of public finance; development partners were contributing 40% of the country's budget.[122Malawi Growth and Development Strategy (MGDS) III] Corruption, therefore, undermines government capacity and governance effectiveness.
Chart 36 shows how the governance effectiveness (public services delivery, policy formulation and implementation performance) in Malawi has evolved over time and how it might evolve going forward. In IFs, the governance effectiveness index by the World Bank is rescaled to run from 0 to 5 (with higher values corresponding to better outcomes) instead of from −2.5 to 2.5. Shown in Chart 36, governance effectiveness in Malawi steadily declined over the last decade but remained above the average for its peers. In 2020, the governance effectiveness score for Malawi was 1.7 out of 5. On the Current Path, it is forecast to improve and stay above the average for its peer income group in Africa across the forecast horizon, but it will likely remain below Rwanda, which is the only low-income country among the top governance performers in sub-Saharan Africa.
Botswana, Rwanda and Seychelles, which are three of the stronger sub-Saharan African governance performers, share common characteristics with all three countries experiencing a relatively strong economic performance, comparable with higher growth than the median emerging sub-Saharan African countries from 2009 to 2019.[123M Newiak, A Segura-Ubiergo and A Aziz Wane (eds.), Good Governance in Sub-Saharan Africa: Opportunities and Lessons, Washington, D.C.: International Monetary Fund, 2022] Accountable, transparent and effective governance and institutions that ensure integrity in the management of public resources and affairs will therefore be critical in Malawi's journey to lower middle-income status by 2030 and upper middle-income level by 2063, as captured in MW2063.
Fighting corruption is not an easy task, but with a strong will, significant progress can be made. For instance, Rwanda's low corruption perception is attributable to several factors, such as political will, awareness campaigns and strict enforcement of laws. The government of Malawi has shown a commitment to fighting corruption, evident in its national budget allocation towards the Anti-Corruption Bureau (ACB) to counteract and investigate corrupt behaviour. In the 2020/21 national budget, the ACB obtained the entire budget requested.[124BTI Transformation Index, Malawi Country Report 2022] Consequently, in 2021, Malawi ranked 110th globally with a score of 35 out of 100 on the Corruption Perception Index by Transparency International, a significant leap from its position of 129th with a score of 30 out of 100 in the previous year.[125Transparency International, Corruption Perception Index, 2021] The Current Path forecast is that Malawi’s corruption score on the Transparency International Corruption Perception Index will continue to improve (i.e. less corruption) across the forecast horizon. MW2063 recognises effective and efficient governance systems as key to an inclusively wealthy and self-reliant nation.
The Current Path analysis has revealed that Malawi faces significant development challenges. The country has, however, made progress in recent years and is forecast to improve its economic and human development outcomes going forward. However, the improvement is not fast enough, and the country is not on track to achieve many of the SDG and MIP–1 targets by 2030. In addition, the country will fall short of many of the targets set out in MW2063. Corruption, population growth, infrastructure and human capital bottlenecks, and limited economic diversification are some of the key factors impeding Malawian development progress. Without additional intervention, Malawi will likely not achieve its targets to become a lower middle-income country by 2030 and upper middle-income country by 2063. Rigorous and targeted policy interventions across development sectors need to be undertaken to improve the country’s current development trajectory. What can be done to improve the current development trajectory of Malawi? The following section builds on the Current Path analysis by designing scenarios and simulating their impacts towards the MIP–1 and MW2063 goals and targets.
This section builds on the Current Path analysis, which revealed that Malawi has made progress in recent years but that it still faces significant development challenges. On its current trajectory, Malawi is forecast to improve its economic and human development outcomes but it will miss many of the development objectives as set out in MW2063.
In the scenario section, we model a series of ambitious interventions and combine them in three aggressive scenarios to overcome Malawi’s development challenges. They will require significant political will, public support and technical prowess in execution. Achieving middle-income status will require progress on many fronts over many years.
Development is a long-term, integrated and complicated process. Malawi needs long-term commitment to a series of mutually reinforcing policies and interventions that will interact to create a virtuous upward circle of accelerating development.
The first scenario, Agriculture and Rural Development, represents a series of policies to boost agriculture productivity and commercialisation, and rural development. A second scenario, Human Capital Push, emphasises improvement in human capital formation in Malawi. Finally, we present a Business First scenario that prioritises economic diversification/industrialisation. We then compare the outcomes of the three scenarios and combine them in a single, Combined scenario. The scenarios are analysed for their ability to propel the country towards reaching Malawi’s goals and objectives as set out in the MIP-1 and MW2063.
Policy interventions in each scenario have been identified based on existing academic literature and the pillars and enablers of MW2063. The MW2063 pillars are (i) agriculture productivity and commercialisation; (ii) industrialisation; and (iii) urbanisation. There are seven groups of enablers: (i) mindset change; (ii) effective governance systems and institutions; (iii) enhanced public sector performance; (iv) private sector dynamism; (v) human capital development; (vi) economic infrastructure; and (vii) environmental sustainability.
Context
The Agriculture and Rural Development scenario mainly focuses on Pillar 1 of MW2063, which consists of enhancing agricultural production and productivity to realise the vision of inclusive wealth creation and self-reliance.
More than 80% of the Malawi population resides in rural areas and the vast majority of these rural dwellers are subsistence farmers who rely on rainfed agriculture. In addition, poverty in Malawi is predominantly rural. The national poverty rate was 59.5% in rural areas compared to 17.7% in urban areas in 2016/17.[126JD Moyer et al, Africa’s path to 2063: Choice in the face of great transformation, Denver and Midrand: Frederick S. Pardee Center for International Futures and NEPAD Planning and Coordinating Agency, 2018; DK Bohl et al, Development Trends Report for Southern Africa, Denver: USAID, 2017; DK Bohl et al, Development Trends Report for South Africa, Denver: USAID, 2017]Enhancing agricultural and rural development could significantly contribute to inclusive wealth creation and progress towards the attainment of the SDG targets.
Scenario interventions
In this scenario, we proceed on the premise that the Malawi government prioritises improvements in agriculture productivity, which can be done by adopting modern and climate-smart agriculture technologies, improved seedlings, and increased fertiliser and pesticide use. The scenario increases average crop yields from 7.7 tons per hectare in 2019 to 16.5 tons per hectare by 2030, compared to 10.1 tons on the Current Path and 31.8 tons by 2063. The Current Path forecast for 2063 is 20 tons per hectare. This is similar to levels achieved by Djibouti and Eswatini in 1999. Malawi already achieved significant improvements between 2005 and 2012, where it increased average crop yields by 78%. In this scenario, average crop yields in Malawi increase by 77% over the period 2023 to 2030.
Likewise, land under irrigation and groundwater extraction are increased to mitigate rainfall variability; for example, prolonged droughts and seasons of insufficient and erratic rainfall. To this end, we apply an intervention to increase land area under irrigation from an estimated 70 000 hectares in 2019 to 96 000 hectares by 2030, compared to 70 000 hectares in the 2030 Current Path forecast — a 35% increase over the period 2023 to 2030. By 2063, the scenario would result in 151 000 hectares land under irrigation compared to 72 000 in the Current Path forecast for that year. The Gambia increased irrigation with similar levels in the early 1990s, where, between 1991 and 1999, the land area equipped for irrigation increased by 28.6%.
The subsistence farming practices in rural areas place a significant strain on land resources, and the increased land degradation and deforestation observed threaten agricultural productivity and sustainability. This scenario assumes an ecosystem-based approach that focuses on sustainable land management practices and ecosystem restoration and protection by increasing forest protection to protect rural communities against floods, soil erosion and other negative impacts of climate change. We apply an intervention that emulates a reduction in the deforestation rate through environmental conservation and protection. The result is an increase in forest land by 0.4 million hectares by 2063 to restore forest land to 2011 observed values. Cabo Verde and Kenya have had success in preserving and restoration of forest land.
The Agriculture and Rural Development scenario reduces post-harvest losses to increase food availability. This can be done through improved storage and refrigeration facilities. It reduces agricultural loss rate at production and from producer to consumer, and brings agricultural production losses down from 9.3% in the Current Path in 2063 to 8.5%. Agricultural loss and waste (as share of production) are reduced to 20% by 2030, compared to 30% in the Current Path forecast. Agricultural loss and waste are reduced to 14% by 2063 compared to the 21% in the Current Path. Eighteen other African countries are already achieving the level of Malawi by 2063.
The scenario also increases access to rural roads to reduce transportation time and cost and facilitate agricultural commercialisation. The intervention increases rural accessibility to all-weather roads from an estimated 47.4% in 2019 to 61.9% by 2030, compared to 49.4% in the Current Path forecast and to 80% by 2063. Currently, 25 African countries have already reached levels above 60% access.
Given the large rural population, investing in rural access roads will promote positive economic impacts such as improved rural incomes, increased agricultural productivity and increased participation in the economy. Additional mobility and connectivity for rural population groups will also promote positive social impacts such as reducing poverty, reducing the exceptionally high maternal mortality rate and improving paediatric health by means of easier access to healthcare facilities.[127AfCAP, Climate Adaptation: Risk Management and Resilience Optimisation for Vulnerable Road Access in Africa, February 2019]
The Agriculture and Rural Development scenario also increases rural access to electricity, and this can also be achieved through non-traditional ways like mini-grid and off-grid solutions using renewable energy sources such as wind and solar. Promoting rural electrification can also increase income through new opportunities for work, especially in non-farm activities, and increase productivity.
In 2019, electricity access in rural areas was 5%, and it is set to improve to 16.1% in 2030 and to 85.7% by 2063 in the Current Path forecast. Our intervention improves the access rate to 35.6% by 2030 (comparable to Ethiopia in 2019) and to 95.5% by 2063. Between 2011 and 2018, electricity access in rural areas increased by 241.4% in Ethiopia, albeit from a very low base. In this scenario, electricity access in rural areas in Malawi increases by 300% between 2023 and 2030, from a very low base (5%).
While the scenario increases agriculture exports, it focuses on establishing food security by increasing food access. Calories per capita is used as a proxy for improvements in domestic food access to ensure improvements in food security instead of exports only. To this end, the interventions increase calories per capita, a proxy for food access, from 2 600 in 2019 to 3 132 by 2030 versus 2 793 on the Current Path, and 3 500 by 2063 versus 3 250 on the Current Path. These levels are already being achieved by countries such as Tunisia, Morocco, Algeria, Egypt, Libya and Mauritius. Between 2010 and 2017, calories per capita in Ethiopia increased by 12.3%. In this scenario, calories per capita increases by 15% over the period 2023 to 2030 in Malawi.
Empirical studies have shown that increases in grants and revenue allocation are among the key factors that contribute to the development of rural communities.[128OS Ogunleye, Determinants of rural development in Edo State, Nigeria: An overview, African Research Review, 4:1, 2010, 298–308] The scenario, therefore, assumes that the government of Malawi, with the support of its development partners, implements a broad social protection scheme (social welfare transfers) to build the resilience of the poor and those in vulnerable situations and to reduce their exposure and vulnerability to weather-related extreme events and other economic shocks. Finally, governance effectiveness is enhanced in this scenario to simulate an improved capacity for basic services delivery and better and well-targeted safety nets and agricultural subsidy programmes. For instance, a recent analysis of the Integrated Household Surveys (IHS) shows that the current agricultural subsidy programme instead of benefiting the poor disproportionately benefits richer agricultural households.[129The World Bank, Malawi economic monitor, 2019] Therefore, we increased Malawi’s governance effectiveness score as measured by the World Bank from 1.7 out 5 in 2019 to 3 out of 5 by 2030 and to 3.8 by 2063. The Current Path forecast is 2.02 in 2030 and 3.01 in 2063.
Finally, we increase government social welfare transfers from 0.8% of GDP in 2019 to 3.3% of GDP by 2030 and to 3.1% by 2063. The Current Path in 2030 is 2.4% of GDP; that is to say that the scenario improves transfers by 0.9 percentage points of GDP above the Current Path forecast in 2030.
Impact
The materialisation of the Agriculture and Rural Development scenario would enhance wealth creation. In the scenario, Malawi records an average annual GDP growth rate of 6.5% between 2022 and 2030, 1.5 percentage points above the Current Path forecast of 5%, 0.5 percentage point above the MW2063 (MIP-1) target over the same period (see Chart 41).
Growth rates in the scenario remain above the Current Path forecast until 2060 before slightly declining below the Current Path. This is because economic growth tends to slow as economies mature and countries get richer. The size of the Malawian economy is, by 2063, significantly larger in the scenario than the Current Path forecast. The GDP per capita, or the average income (PPP at 2017 constant US$), climbs to US$1 782 by 2030 and to US$10 198 by 2063, US$140 above the Current Path forecast in 2030, and US$2 168 above the Current Path in 2063
Due to the large socio-economic dependency on the agriculture sector, this scenario achieves rapid gains and contributes to inclusive wealth creation. The poverty rate at US$1.90 drops to 45.7% by 2030, 6.9 percentage points below the Current Path forecast of 52.6% in the same year. This results in 1.7 million fewer people living in extreme poverty in 2030, relative to the Current Path. Due to continuous inclusive wealth creation, the SDG of extreme poverty rate of less than 3% is achieved in 2043, a decade earlier than the Current Path forecast. Income inequality as measured by the Gini coefficient declines to 0.37 by 2030 below the MIP-1 target of 0.39.
The implementation of the Agriculture and Rural Development scenario could boost agricultural commercialisation and food security, in line with the fundamental Pillar 1 of MW2063. The agricultural export is forecast to be 5.7 million metric tons by 2030 and 52.7 million metric tons by 2063, then about 41.5 million metric tons larger than the Current Path forecast. Malnourishment in the population is halved by 2030 compared to the Current Path and the country becomes a net exporter of agricultural produce. In sum, in this scenario, Malawi will produce enough food for its domestic needs and provide a surplus for import substitution and exports.
Chart 42 displays the impact of the Agriculture and Rural Development scenario on meeting some of the key MIP-1 and SDG targets. Overall, the findings show that a development pathway driven by agriculture production and commercialisation could improve human and economic development in Malawi. However, the improvement will likely not be fast enough to help Malawi achieve most of the SDG targets by 2030 and will not succeed in graduating the country to lower middle-income status by 2030 and to upper middle-income level by 2063.
Context
This scenario model’s Enabler 4 (private sector dynamism) of MW2063, given the importance of human capital in the development process. Human capital formation through education, skills and health of the population is one of the key enablers for the acceleration of the broad-based growth and development of a country. It is key for inclusive wealth creation as it improves the job and income prospects of the poor segment of society.
Malawi has invested significantly in its health sector with spending measuring 4.8% of GDP in 2017,[130World Bank, Malawi human capital project, 2020] but the country continues to suffer from poor health outcomes. In 2019, Malawi ranked 185th for overall health efficiency among 191 WHO member states,[131A Tandon, CJL Murray, JA Lauer and DB Evans, Measuring Overall Health Systems Performance for 191 Countries, World Health Organisation, GPE Discussion Paper Series: No. 30, 2019] a statistic that reflects the poor state, inequality and ineffectiveness of the sector. Also, Malawi scores very low in life expectancy and ranked 40th in Africa. Malawi also continues to experience challenges in its education sector. Secondary school net enrolment and completion rates are extremely low at 17% and 22%, respectively, in 2018, and Malawi's gross enrolment ratio for tertiary education at about 1.6% is one of the lowest in the world. Better prioritisation and targeted interventions on key issue areas could bolster Malawi's potential to improve its human capital stock.
Interventions
In line with MW2063, this scenario emphasises human capital development. It assumes reforms are undertaken to improve efficiency in the health and education systems. According to Nobel Prize winner in economics Robert Lucas and former World Bank chief economist Paul Romer, economic development depends above all on a country's ability to value its human capital.[132J Morisset, What’s behind poor education outcomes in Côte d’Ivoire?, 2017] For these reasons, the scenario reduces HIV/AIDS-related death rates by 41% between 2023 and 2030, in line with the strides made by Guinea Bissau that reduced AIDS-related deaths by 30% from 2010 to 2017. This can be achieved through the roll-out of lifesaving antiretrovirals (ARVs) and aggressive information campaigns about the disease. Such action could increase life expectancy and promote good health to ensure greater productivity of affected Malawians.
In order to reduce the high communicable disease burden, the scenario prioritises investments in water, sanitation and hygiene (WaSH) infrastructure. In this scenario, access to clean water reaches 97% by 2030, compared to the Current Path forecast of 93.5%. Sanitation provision is also prioritised such that 67.5% of Malawians have access to improved sanitation by 2030, compared to 51% projected in the Current Path forecast. This increase of 72% from 2023 to 2030 would not be unique to low-income countries as Mozambique achieved a 93% increase between 2000 and 2007.
The scenario addresses the high maternal mortality ratio by ensuring that all women and girls have access to quality and timely health services, particularly antenatal and postnatal care. We apply an intervention that reduces maternal mortality by 57% relative to the Current Path over the period 2023 to 2030, bringing down the death rate by more than 100 deaths (per 100 000 live births) by 2030 compared to the Current Path. Rwanda achieved similar reduction levels between 2003 and 2010, reducing the maternal mortality ratio by 57%. Reducing the high child mortality rates is also addressed in this scenario and a 42% reduction over the next eight years is implemented. The Malawian government achieved similar reduction levels between 2009 and 2016 working together with community-based organisations. Continuing the aggressive roll-out of antenatal and delivery care, distribution of insecticide-treated nets, field vaccinations programmes and making community-based education programmes freely available will support the reduction of infant mortality rates.
Regarding education-specific interventions, the scenario increases primary education survival rates to increase the pool of students to transition and enrol in secondary school. In this scenario, the primary education survival rate increases from 63.8% in 2020 to 91% by 2030, which is comparable to Morocco in 2009. This is above the 75.2% forecast on the Current Path in 2030. This improvement can be achieved by addressing the low transition rates directly through better quality primary education and through investment in more secondary schools.
The scenario improves enrolment and graduation rates at lower secondary and upper secondary levels to increase the number of learners potentially proceeding to tertiary level. The lower secondary enrolment rate is increased to 75% by 2030 (on par with Democratic Republic of Congo), 11.6% percentage points above the Current Path forecast at 63.4%. The lower secondary completion rate improves from 38.4% in the Current Path forecast to 53% by 2030 (on par with Sierra Leone) and to 100% by 2060. The transition rate from lower secondary to upper secondary increases to 96% by 2030, on par with levels achieved in Mozambique. This is a substantial increase above the 76.4% forecast on the Current Path in the same year. Malawi achieves a 100% transition rate by 2040, up from 70.5% in 2019. The upper secondary education graduation rate is increased to 34% by 2030, on par with Liberia. This is a 7.8% percentage point increase from 26.2% forecast in the Current Path in 2030. Also, the portion of science, technology, engineering and mathematics (STEM) students and the share of students in technical and vocational education and training (TVET) increase to bolster adequate labour supplies and respond to the demands of the Fourth Industrial Revolution. Thus, the enrolment rate in vocational training increases to 20% by 2030. Mozambique managed a 45% increase between 2009 and 2016.
The scenario increases Malawi’s Harmonized Test Scores at primary and secondary education levels as a proxy for improvement in education quality. The Harmonized Test Scores are averaged across grades and subjects for those tests covering multiple grades and programmes. The scenario assumes a 10% improvement in the quality of education for both primary and secondary education. This is in line with achievements made by Chad that improved primary test score rates by 13% between 1995 to 2005 and Burundi that improved secondary test scores by 10% between 2015 and 2019. Quality and relevant education is crucial for economic development. Countries such as South Korea and Malaysia have succeeded in transitioning to emerging market status thanks in part to their investments in building some of the best education systems in the world.
In line with the priority targets as set out in MIP-1, the Human Capital Push scenario reduces fertility rates by increasing access to and ensuring the uptake of modern contraceptives. The scenario assumes an aggressive uptake of modern contraceptive use such that 99.8% of women have access by 2030, in comparison to 69.2% achieved in the Current Path forecast. This can be achieved by improving family planning, campaigning to raise awareness and increasing the uptake of modern contraceptives especially among the younger and poorer population cohorts. High fertility rates can constrain human capital formation by straining poor families’ budgets and reducing available resources to feed, educate and provide healthcare to children. A decline in the below 15-years dependency age group helps governments and parents to invest more in each child in terms of education and health with positive effects on human capital formation.
Finally, the scenario improves gender empowerment to improve women's reproductive and education rights, and promotes gender parity and inclusiveness in human capital development.
Impact
If the Human Capital Push scenario is to materialise, it would lead to an average growth rate of 5.3% between 2022 and 2030, compared to 5% on the Current Path over the same period (Chart 45). The GDP per capita (PPP and 2017 constant US$) in this scenario increases to US$1 685 by 2030, US$44 above the Current Path forecast. The GDP per capita gets to US$9 247 by 2063, US$1 217 more than the Current Path forecast.
Investment in human capital has a long lead time. As a result, Malawi’s US$1.90 poverty rate declines to 50.6% by 2030, only two percentage points below the Current Path forecast of 52.6% in the same year, but its impacts increase over time. The Human Capital Push scenario lifts an additional 809 000 people out of extreme poverty in 2030, relative to the Current Path. The SDG of eliminating extreme poverty is achieved in 2053 in this scenario, four years earlier than the Current Path forecast.
Fertility rates are brought down to 2.3 births per woman by 2030, compared to 3.4 on the Current Path, reducing the population in 2030 to 23.5 million people instead of 24.2 million on the Current Path. The impact is that in 2063 the population will be 35 million people compared to 38.8 million in the Current Path forecast. The annual population growth rate is 1.6% in 2030, 0.5 percentage points below the MIP-1 target of 2.1%. This decline in the fertility rate could help Malawi reap its demographic dividend earlier than the Current Path forecast with significant positive effects. The minimum ratio of 1.7 working people to each dependant (children and elderly people) required for the materialisation of the demographic dividend is achieved in 2033, eight years earlier than in the Current Path forecast.
This scenario improves well-being quality as the life expectancy is one year above the Current Path forecast of 66.3 years in 2030. However, it is below the MIP-1 target of 71.9 years for the same year, reflecting Malawi's score on the Human Development Index forecast to be 0.52 by 2030, above the MIP-1 target of 0.48.
In this scenario, Malawi achieves the SDG targets relative to primary education completion and contraceptive use and gets closer to achieving some SDG goals by 2030 (see Chart 46). The maternal mortality target of fewer than 70 deaths per 100 000 live births will likely be achieved in 2043, a decade earlier than in the Current Path forecast. The target on infant mortality rate to 12 deaths per 1 000 live births is likely to be achieved in 2040, also a decade earlier than under the Current Path.
Better human capital is an important catalyst for the acceleration of the broad-based growth and development of the country, but the benefits from investment take time to materialise, as reflected in the scenario outcomes presented in this section. Investment in human capital affects labour productivity with a long time lag, so it takes more than 15 years until output surpasses a programme that invests mainly in infrastructure.[133African Development Bank, African Economic Outlook 2021] Thus, a development pathway driven mainly by investments in human capital will improve human and economic development in Malawi but will likely not be enough to achieve most of the SDG targets and to graduate Malawi to lower middle-income status by 2030.
Context
Economic growth in Malawi is mainly driven by the dynamism of the agriculture sector. The COVID-19 pandemic has further demonstrated the importance of building resilience through diversification. There is a need to enhance the manufacturing industry with strong backward and forward linkages with the agriculture, mining and service sectors to achieve sustained growth, reduce poverty and diversify the sources of income and foreign exchange earnings in Malawi. Also, urbanisation is critical to economic growth and development as it fosters entrepreneurship and increases productivity. Cities in Africa generate between 55% and 60% of the continent’s GDP.[134M El Hedi Arouri et al, Effects of Urbanization on Economic Growth and Human Capital Formation in Africa, PGDA Working Paper, Harvard University, 2014] In 2018, 12% of the Malawian population resided in only the four major urban areas yet these were responsible for contributing 33% to the national GDP. When urbanisation is managed sustainably, it reduces poverty and provides several social and economic benefits. The Business First scenario, therefore, prioritises economic diversification and industrialisation. This scenario models pillars 2 and 3 of MW2063. Pillar 2 of MW2063 focuses on industrialisation to transform the Malawi economy, and Pillar 3 consists of an urbanisation push.
Scenario interventions
A thriving private sector is crucial to enhance economic transformation and industrialisation and to achieve robust growth. However, the business environment in Malawi is very challenging. In the World Bank's 2020 Doing Business report, Malawi ranked 109th of out a 190 countries globally for the ease of doing business. Simplifying administrative procedures and formalities (reducing red tape) makes it easier for firms, specifically small- and medium-sized enterprises (SMEs) to do business, to test new ideas and to grow. Therefore, this scenario proceeds on the premise that Malawi authorities undertake business environment reforms aimed at reducing business costs and risks through improved business regulations, and providing more economic freedom and transparency.
In the Business First scenario, the score for regulatory quality as measured by the World Bank reaches 1.99 (out of 5) by 2030 (similar to Rwanda in 2008) and 3.17 by 2063. Between 2012 and 2019, regulatory quality in Ethiopia improved by 20%. In this scenario, the score for regulatory quality in Malawi increases by 10% between 2023 and 2030. We increase the score for economic freedom as measured by the Fraser Institute by 14% between 2023 and 2030. Rwanda improved its score for economic freedom by about 23% between 2000 and 2007. In the Fraser Institute’s Economic Freedom Index, Malawi reaches a score of 4.7 (out of 10) by 2030, comparable to the level of Rwanda in 2014 (Current Path in 2030 = 3.1). The scenario also focuses on increasing government transparency by curbing corruption and improving the country’s Corruption Perception Index. In Transparency International’s Corruption Perception Index, Malawi reaches a score of 4.7 (out of 10) by 2030, slightly below Rwanda. The Current Path forecast in 2030 is 3.1 out of 10.
In addition to an efficient bureaucracy and macroeconomic stability, reliable energy access and good infrastructure also matter for growth and economic diversification. The historically unstable macroeconomic environment and infrastructure deficit of Malawi undermine private sector development. Thus, this scenario proceeds on the premise that the government undertakes fiscal consolidation measures to reduce fiscal deficit and to improve macroeconomic stability. The scenario also assumes that the government of Malawi continues its efforts to broaden the tax base and enhance tax revenue collection. Increased government revenue could help the government to reduce its fiscal deficit and improve macroeconomic stability. The intervention increases government revenue by 73% between 2023 and 2030. Between 2014 and 2016, government revenue in Rwanda increased by 24.5%.
Underpinning a vibrant business environment is the provision of reliable and sufficient energy, information and communication technology (ICT) and transport infrastructure. The scenario therefore builds on the assumption that the government increases access to energy for all communities and addresses the vast electricity inequality between urban and rural areas. In this scenario, the costs of investing in renewables are reduced such that renewables using mini- and off-grid solutions would become viable options for communities and businesses and make up 26.5% of the total energy mix of the country by 2030. National electricity access is improved from 18% in 2020 to 34.6% by 2030 and to 91.3% by 2063. The scenario also prioritises a reduction in electricity transmission losses and reduces losses by 28% between 2023 and 2030. In the late 1990s, Angola achieved a reduction rate in transmission losses by 49% over five years.
Access to roads in good condition reduces transaction costs, enhances productivity and facilitates connectivity. The scenario therefore improves transport infrastructure by increasing the paved road length to 41.8% of the total network by 2030. This is a 3.4% percentage point improvement above the Current Path trajectory. Affordable and reliable broadband connectivity can also lead to the expansion of mobile banking services and increased access to finance, which is cited as one of the top constraints to business in the country. The scenario therefore expands broadband connectivity by increasing mobile broadband adoption to reach 107.5 subscriptions per 100 people by 2030, an increase of 19.2 subscriptions from the projected 88.3 subscriptions in the Current Path forecast. Fixed broadband subscriptions are also prioritised and reach 15 subscriptions per 100 people by 2030 — a slight increase from the projected 13 subscriptions in the Current Path forecast.
The Business First scenario also simulates improvements in domestic and foreign direct investment in the Malawian economy by an improved business environment that attracts more investors. Foreign direct investment (FDI) is not a panacea for development but can contribute to changing the future of Malawi as it brings much needed capital and technologies. In this scenario, FDI flows to Malawi reach 4.3% of GDP by 2030 (similar to Togo in 2005). The Current Path forecast in 2030 is 3.3% of GDP. We also increased domestic investment in all the sectors of the economy. Domestic investment as a share of GDP in Malawi is lower than in countries such as Uganda, Ethiopia and Mozambique. Investment in the manufacturing sector, for instance, is expected to increase to 5.5% of GDP by 2030, whereas the Current Path forecast in 2030 is 3.7% of GDP.
The Business First scenario also improves export diversification by increasing manufacturing and mining exports in line with MW2063. The mining sector remains an area of potential economic diversification through which Malawi could increase its exports. The scenario increases government spending on research and development (R&D) activities, which is particularly low in Malawi, to support the country’s move up the agro-processing ladder. This scenario assumes that mining exports will increase by 60% by 2030, and manufacturing exports will increase by 5% to reach 20% of GDP by 2030. This is a 2.4% percentage point increase above the Current Path forecast by 2030. Also, government spending on R&D activities doubles to 0.07% of GDP by 2030 (the Current Path forecast in 2030 is 0.035% of GDP).
The government of Malawi, through its secondary cities plan, has recognised the important role that urbanisation will play in getting Malawi to middle-income status, and the need to accelerate urbanisation is well supported as Pillar 3 in MW2063. The scenario assumes therefore that the government implements the Malawi Secondary Cities Plan (MSCP) with rigour and urgency and increases the urbanisation rate from the expected 19.9% in the Current Path forecast to 25% by 2030.
Impact
If the Business First scenario materialises, the average growth rate between 2022 and 2030 reaches 7%, two percentage points above the Current Path forecast, and one percentage point above the MIP-1 target (see Chart 49). The GDP per capita (PPP and 2017 constant US$) is US$1 827 by 2030, US$185 above the Current Path forecast. The share of the manufacturing sector in GDP is 17.4% by 2030, above the MIP-1 target of 12.6%. These imply that the Business First scenario has the potential to enhance industrialisation and lead to more wealth creation
The poverty rate at US$1.90 remains high at 54.4% by 2030, 2.2 percentage points above the Current Path forecast of 52.6%. This translates to 42 000 more poor people than the Current Path forecast in 2030. The reason for the initial increase in extreme poverty is because economic transformation/industrialisation is funded by an initial crunch in consumption that slows the progress towards attaining the SDG targets in the first few years, especially those related to human development (Chart 50). Investment aimed at developing non-resources sectors such as manufacturing take time, often decades, to yield expected results. This is typically associated with short- to medium-term costs relating to poverty or consumption. For instance, in the scenario, household consumption will represent 66.7% of GDP by 2030 compared to 78.7% on the Current Path. However, in the long term, the Business First scenario generates inclusive wealth creation. The average growth rate between 2030 and 2040 is 10.2% compared with 7.3% on the Current Path. This inclusive wealth creation lifts an additional 2.4 million people out of poverty compared to the Current Path forecast in 2040.
Overall, the findings show that the materialisation of the Business First scenario could generate high inclusive growth rates in the long term and improve human and economic development in Malawi. However, alone, the scenario is unlikely to help Malawi achieve most of the SDG targets by 2030, and the country is unlikely to graduate to lower middle-income status by 2030 and to upper middle-income level by 2063. This scenario alone could graduate Malawi to lower middle-income status by 2034, but it will miss the upper middle-income threshold by a small margin by 2063.
All the scenarios contribute to wealth creation as GDP per capita increases in each scenario relative to the Current Path, shown in Chart 51. The Business First scenario has the biggest impact on GDP per capita by 2030 and by 2063 but falls behind in achieving human capital targets. The GDP per capita (PPP and 2017 constant US$) is US$1 827 in 2030, and US$12 524 in 2063. The Agriculture and Rural Development scenario has the second biggest impact on GDP per capita by 2030 and by 2063 and has the biggest impact on inclusive wealth creation in the short to medium term. The GDP per capita is US$1 782 by 2030 and US$10 198 by 2063, US$140 above the Current Path forecast in 2030, and US$2 168 above the Current Path in 2063. The GDP per capita in the Human Capital Push scenario improves marginally (US$43.5) above the Current Path in 2030 but many of the critical human capital targets are significantly improved. However, in 2063 it gets to US$9 247, which is US$1 217 above the Current Path forecast. The effect of investment in human capital on wealth creation appears in the long term. Overall, none of the individual scenarios is likely to graduate Malawi to lower middle-income status by 2030 and to upper middle-income level by 2063.
Chart 52 shows that all the scenarios lead to inclusive wealth creation as the poverty rate in each scenario is lower than the Current Path forecast. However, between 2023 and 2050, the Agriculture and Rural Development scenario leads to more inclusive wealth creation as it has the lowest number of people living in poverty. It is followed by the Human Capital scenario, which is the closest to achieving the SDG targets relative to human development.
In the initial 10 years of intervention, the number of extremely poor people in the Business First scenario is slightly above the Current Path (see Chart 52). This is because resources and investments are diverted to more capital and knowledge-intensive sectors, which lead to an initial crunch in consumption. Growth-enhancing structural transformation is one of the key mechanisms through which developing countries can accelerate economic growth. However, early development economists, such as Simon Kuznets, find that structural transformation can increase consumption inequality. If the Business First scenario were to materialise, Malawi could experience increased consumption inequality over the first 10 years. However, in the long term, these efforts stimulate more rapid inclusive wealth creation. For instance, the poverty rate by 2045 in the scenario is 9.8% compared to 19.7% on the Current Path. This translates to 3.2 million fewer poor people than the Current Path forecast. In the long term (from 2060), the Business First scenario has the lowest number of extremely poor people surviving under US$1.90 per day.
The three scenarios have significant synergy and complementarity between them. For instance, human capital development is a key enabler for industrialisation and economic diversification. Increasing agricultural production and commercialisation can also pave the way for manufacturing through agro-processing, and improving access to broadband connectivity and the associated digitalisation can help connect small agricultural producers to large vendors. A Combined scenario could therefore be the best option to achieve most of Malawi's development objectives as set out in MW2063. The Combined scenario comprises all the MW2063 pillars: agriculture productivity and commercialisation, urbanisation, and industrialisation, and the enablers: effective governance systems and institutions, enhanced public sector performance, private sector dynamism, human capital development, economic infrastructure, and environmental sustainability.
Chart 53 shows the impact of the optimistic Combined scenario on GDP per capita compared to the Current Path. The materialisation of the Combined scenario would lead to an average growth rate of 8.5% between 2022 and 2030, 3.5 percentage points above the Current Path over the same period. This rate is high but not unprecedented in low-income African countries. Ethiopia achieved an average growth rate of 10.6% from 2005 to 2014, and Rwanda achieved an average growth rate of 8.3% from 2004 to 2012. Malawi achieved an annual average growth rate of 7.2% over the period 1971 to 1978, largely enabled by its agricultural exports. The scenario represents a coordinated push across the MW2063 pillars and would enable Malawi to achieve many of its targets and goals (MIP-1, SDG and MW2063). This scenario is therefore aggressive but possible for Malawi even though the monetary cost to shoulder would undoubtedly be high. Funding would require international donor assistance, foreign investors and efforts to enhance domestic revenue mobilisation combined with effective implementation.
In the Combined scenario, GDP per capita (PPP) is US$2 029 by 2030 (US$387 higher than the Current Path forecast) and US$17 669 by 2063 (US$9 639 more than the Current Path forecast). If the optimistic Combined scenario were to materialise, Malawi could graduate to lower middle-income status by 2032[135The World Bank uses income classification based on GNI per capita which is not forecast in the IFs model. However, the GNI per capita has been on par with the GDP per capita (market exchange rate) in recent years in Malawi. Also, over the last 10 years, the nominal value of the World Bank income thresholds for lower-middle income status has increased by about 5%. Assuming that these trends continue over the next decade, the threshold for lower middle-income status would increase from its current level of US$1 086 to US$1 140 by 2032 while the GNI per capita for Malawi would likely be about US$1 221 in the same year.] and achieve upper middle-income status in 2058.
The Combined scenario leads to more inclusive wealth creation, especially in the long term. The poverty rate is 44.5% by 2030, eight percentage points below the Current Path forecast. It reaches 6.5% in 2040 compared to 29.4% on the Current Path. Malawi eventually achieves the elimination of extreme poverty (defined as the rate below 3% of the population) in 2043, 14 years earlier than the Current Path forecast.
Chart 55 displays the impact of the Combined scenario on meeting some of the key SDG and MIP-1 targets.
Risks
The forecasts presented in these reports are subject to an array of risks. First, export disruptions by Ukraine or Russia could again interrupt global grain supplies which will further increase food prices. Second, additional increases in energy prices or a global recession next year could reduce exports and result in a sharp decline in commodity prices with a negative effect on growth. Third, adverse weather patterns can reduce yields and undermine growth and food security. To some extent, the IFs forecasts capture the impact of some recent shocks, reflected in the use of averages from recent years. In addition, it is possible to model the impact of these shocks in IFs if and when they occu
The aim of the study is to undertake foresight modelling to ensure that interventions towards realising the MW2063 and the MIP-1 medium-term goals are guided by a careful analysis of the development terrain to optimise expected outcomes. The Current Path analysis assessed whether Malawi is on track to meet key goals of MW2063 on its current development trajectory. The Current Path analysis revealed that Malawi has made progress in recent years but still faces significant development challenges. Poor governance, rapid population growth, infrastructure and human capital bottlenecks, and limited economic diversification are some of the key factors impeding Malawian development progress. Malawi is forecast to improve its economic and human development outcomes but it will miss most of its critical targets.
The scenario section simulated ambitious but realistic policy interventions across different sectors under the MIP-1 and MW2063 pillars and enablers that could help Malawi materialise its goals. Three development scenarios were modelled. The first scenario (Agriculture and Rural Development) focuses mainly on agriculture development and resilience building of those in vulnerable situations to reduce their exposure and vulnerability to climate-related extremes and other economic, social and environmental shocks and disasters. The second scenario (Human Capital Push) improves human capital formation and advances the demographic transition. The third scenario (Business First) pushes for economic diversification and industrialisation. The findings show that not one of these scenarios is a panacea to achieve MW2063.
As these scenarios have significant synergy and complementarity, a Combined scenario assumes an integrated development push across sectors. This is a scenario where Malawi’s authorities make a coordinated push across the MW2063 pillars, and the country achieves middle-income status by 2032 and upper middle-income status in 2058. Progress on each pillar will depend on the quality of governance and institutions. Weak governance leads to public financial mismanagement, macroeconomic instability and poor policy implementation.
The starting point is to improve governance transparency and effectiveness. Corruption impacts a country’s ability to deliver relevant services, economic growth and sustainable economic development. Malawi authorities should continue their efforts to tackle corruption by:
- Initiating awareness campaigns, digitising exchanges between government, citizens and business, as well as bringing to justice and punishing those who engage in corrupt practices. Rwanda has moved from a high level of corruption to one of the lowest in sub-Saharan Africa through strong political will, a shift of cultural views on the morality of corrupt practices, prevention and sanction.[136World Bank, Rwanda's Anti-Corruption Experience: Actions, Accomplishments, and Lessons, Report No: ACS29873, 2020]
- Capitalising on the power of new technologies to improve the public financial management system that reduces opportunities for theft of public resources and increases the risk of detection.
- Including independent investigative journalism in their anti-corruption tool kit. Investigative journalists can mitigate corruption by reporting on financing, procurement and project execution.
- Improving domestic revenue mobilisation to sustain public investment and to improve macroeconomic stability. Digitisation can help boost domestic revenue mobilisation by enhancing tax efficiency. The introduction of e-filing in Kenya and e-invoicing in São Tomé and Príncipe, for instance, have allowed authorities to expand the tax base to the informal sector and boosted revenue collection efficiency.[137International Monetary Fund (IMF), Navigating a long pandemic, Regional Economic Outlook: Sub-Saharan Africa, Washington, DC: IMF, April 2021]
Malawi has made progress in improving agriculture productivity but much more needs to be done. With the exceptions of countries heavily endowed with minerals, no economy in history has successfully transitioned from being ‘poor and agricultural’ to ‘non-poor and industrial’ by exclusively promoting industrial sector growth while paying little or no attention to agriculture.[138 X Diao, P Hazell and J Thurlow, The role of agriculture in African development, World Development, 38:10, 2010, 1375–1383]
To boost agricultural productivity and commercialisation, Malawi authorities should:
- Invest in productivity enhancing technologies and facilitate access to high-yield, disease- and drought-resistant seedlings, fertiliser and credit guarantees for farmers and support R&D activities in building resilience and agricultural productivity.
- Improve the efficiency of the agricultural subsidy programme. A recent analysis of the Integrated Household Surveys (IHS) shows that the current programme instead of benefiting the poor disproportionately benefits richer agricultural households.[139World Bank, Malawi economic monitor, 2019] A poorly targeted agriculture subsidy programme not only increases inequality but also weighs on national budgets.
- Use subsidies for seeds and conduct awareness campaigns to incentivise crop diversification away from maize.
- Protect agricultural production and commercialisation from weather events by investing in climate-resilient infrastructure. For instance, solar power that facilitates irrigation and temperature control for food storage could be adopted. In Ghana, for instance, solar-powered cold storage run by a private firm is used to help smallholder farmers preserve their perishable crops from five to 21 days and there is a mobile application that connects farmers to food aggregators to help reduce post-harvest losses. In return, farmers pay a daily fee of US$0.3 per 20 kg crate stored or pay weekly.[140AkoFresh, About AkoFresh] This kind of green cold storage can be adopted in Malawi and will drive private investment to the sector.
- Adopt an ecosystem-based approach that focuses on ecosystem restoration and protection (for example, forest protection, wetland restoration, catchment and soil rehabilitation) to protect rural communities against floods and other negative impacts of climate change and land degradation. Nature-based solutions such as catchment rehabilitation have proven effective in preventing flood damage by minimising run-off in periods of excessive rainfall.
- Improve rural transport network with reliable and all-weather rural road access to facilitate agricultural commercialisation. According to a study by Dorward et al in 2009, poor road connectivity to markets in Malawi motivates farmers to continually produce solely for their households’ consumption as they are unsure whether they can sell the crop in the market.[141A Dorward, J Kydd, C Poulton and D Bezemer, Coordination risk and cost impacts on economic development in poor rural areas, The Journal of Development Studies, 45:7, 2009, 1093–1112] Given Malawi’s large rural population, investing in rural access roads will promote positive economic impacts such as improved rural incomes, increased agricultural productivity and increased participation in the economy. Additional mobility and connectivity for rural population groups will also promote positive social impacts such as reducing poverty, reducing the exceptionally high maternal mortality rate and improving paediatric health.
- Provide agricultural extension services to train farmers on profitable crop production, crop rotation, irrigation techniques and marketing.
- Avoid the recurrent ad hoc imposition of export bans to encourage domestic and foreign investment in the agriculture sector. Clearing uncertainties on the imposition or lifting of export bans will encourage private capital flows to the sector.
In addition to increasing agricultural productivity, Malawi needs to expand economic diversification and industrialisation for inclusive wealth creation. To foster economic diversification and industrialisation, Malawi authorities should:
- Undertake reforms in the business environment aimed at reducing business costs and risks by improving the quality of business regulation. Simplifying administrative procedures and formalities makes it easier for firms, specifically small- and medium-sized enterprises (SMEs) to do business, to test new ideas and to grow. Malawi can learn from Rwanda to create a business enabling environment that will support structural transformation and increase productivity. With intensive efforts to improve its regulatory quality to create incentives for doing business, Rwanda has become the second-best place to do business in sub-Saharan Africa.[142T Bernatzki, M Busse and R Hoekstra, Promoting Rwanda’s business environment: Impact of reforms and drivers of change, Development Policy Review, 40:2, 2022, e12578] Today, Rwanda, is one of the few countries in which the costs and time for starting a business (four days) is negligible.[143T Bernatzki, M Busse and R Hoekstra, Promoting Rwanda’s business environment: Impact of reforms and drivers of change, Development Policy Review, 40:2, 2022, e12578]
- Encourage citizens to build an entrepreneurial mindset to shift labour from the large informal sector to businesses in the formal economy.
- Empower the Malawi Investment and Trade Centre to actively work to attract manufacturing FDI for value creation and encourage FDI-local firms’ linkages for technology diffusion. In Ethiopia, FDI quadrupled from 2011 to 2017, with about 80% going into the manufacturing sector.[144The Economist, The violence in Ethiopia imperils an impressive record growth, 20 November 2021] The zero-tariff privilege with the US under the African Growth and Opportunity Act (AGOA) could be used to lure foreign investors to invest in Malawi to export to the US. This will help Malawi to diversify and sophisticate its exports.
- Address infrastructure deficits which undermine private sector development in the country. A reliable electricity supply can be provided through mini-grid and off-grid solutions using renewable energy and improving the performance of Electricity Supply Corporation of Malawi (ESCOM). Further, improve the transport system by implementing the Malawi National Transport Master Plan; improve broadband connectivity by expanding the provision of LTE infrastructure (wireless broadband communication for mobile devices) in poorer areas; accelerate electricity access and reduce high Internet prices; and lower tax on smartphones to reduce their costs. Affordable and reliable broadband connectivity can also lead to the expansion of mobile banking services and increase access to finance, which is cited as one of the top constraints to business in the country.
- Invest in human capital and skills development. Availability of skilled labour at a reasonable cost and in abundant supply should be one of the key drivers for FDI attraction and industrialisation in Malawi in the foreseeable future. To this end, the quality of education, health, and water and sanitation services needs to be improved. The education curriculum needs to be reviewed in collaboration with the private sector and industrialists to match it with the needs of the labour market. Untrained teachers in primary and secondary schools should be properly trained or removed from the education system. Particular attention should be given to TVET and STEM courses to address the skills gap in the economy.
- Continue the roll-out of modern contraceptives by focusing on the underserved, younger, more rural population groups where contraceptives awareness raising campaigns and uptake remains low.
- Increase urbanisation sustainably to accelerate economic growth and structural change. Rapid, unplanned urbanisation can lead to the mushrooming of informal settlements and place enormous pressure on bulk services. The implementation of the MSCP should therefore be accompanied by meticulous land use planning and a detailed land use management system.
In sum, a dedicated implementation of these policies centred around the three pillars of MW2063 could help Malawi achieve its development objectives.
Annex: Current Path analysis
Download to pdfGrowth rate adjustments
The growth rate for 2021 and forecast for 2022 were adjusted using the data provided by the Malawi authorities.
|
IFs series |
Updated years |
Source used for update |
|
Education, primary, completion rate (graduation ratio), gross, female |
2015–2019 |
NSO Malawi |
|
Education, primary, completion rate (graduation ratio), gross, male |
2015–2019 |
NSO Malawi |
|
Education, primary, completion rate (graduation ratio), gross, total |
2015–2019 |
NSO Malawi |
|
Education, secondary, lower, gross enrolment rate all programmes, female |
2019 |
UNESCO (http://data.uis.unesco.org/) |
|
Education, secondary, lower, gross enrolment rate all programmes, male |
2019 |
UNESCO (http://data.uis.unesco.org/) |
|
Education, secondary, lower, gross enrolment rate, total |
2019 |
UNESCO (http://data.uis.unesco.org/) |
|
Education, secondary, upper, gross enrolment rate all programmes, female |
2019 |
UNESCO (http://data.uis.unesco.org/) |
|
Education, secondary, upper, gross enrolment rate all programmes, male |
2019 |
UNESCO (http://data.uis.unesco.org/) |
|
Education, secondary, upper, gross enrolment rate all programmes, total |
2019 |
UNESCO (http://data.uis.unesco.org/) |
|
Production of cereals |
2017–2020 |
FAO (http://www.fao.org/faostat) |
|
Meat, total + (total) production in tonnes |
2017–2020 |
FAO (http://www.fao.org/faostat) |
|
Adult population (15 and over) with secondary (or more) education, female % |
2015 |
Barro & Lee (https://barrolee.github.io/BarroLeeDataSet/BLv3.html) |
|
Adult population (15 and over) with secondary (or more) education, male % |
2015 |
Barro & Lee (https://barrolee.github.io/BarroLeeDataSet/BLv3.html) |
|
Adult population (15 and over) with secondary (or more) education, total % |
2015 |
Barro & Lee (https://barrolee.github.io/BarroLeeDataSet/BLv3.html) |
|
Population below poverty line of US$1.90 per day PPP (2011) |
2019–2020 |
World Bank Macro Poverty data (https://www.worldbank.org/en/publication/macro-poverty-outlook/mpo_ssa) |
|
Central government debt as % of GDP |
2012–2020 |
World Economic outlook, IMF |
|
Roads, total network, kilometres |
2015–2020 |
Malawi Transport Ministry |
|
Roads, total network, kilometres |
2015 |
Malawi Transport Ministry |
|
Value added in manufacturing as per cent of GDP |
2020–2022 |
Malawi economic report (https://www.finance.gov.mw/index.php/our-documents/annual-economic-reports) |
|
Access to electric energy national percentage |
2020 |
Malawi Ministry of Energy |
|
Value added in agriculture as per cent of GDP |
2020–2022 |
Malawi economic report (https://www.finance.gov.mw/index.php/our-documents/annual-economic-reports) |
|
Informal % of GDP |
2009-2018 |
World Bank |
|
Number of households in millions |
2018 |
NSO Malawi (http://www.nsomalawi.mw/images/stories/data_on_line/general/yearbook/2020_Malawi_Statistical_Yearbook.pdf) |
|
Literacy rate total |
2018 |
NSO Malawi |
|
Literacy rate female |
2018 |
NSO Malawi |
|
Literacy rate male |
2018 |
NSO Malawi |
|
Nett enrolment rate total |
2016–2019 |
NSO Malawi |
|
Nett enrolment rate male |
2016–2019 |
NSO Malawi |
|
Nett enrolment rate female |
2016–2019 |
NSO Malawi |
|
Maternal mortality |
2005, 2010, 2016 |
NSO, MDHS Report, 2016 |
|
Infant mortality |
2010–2016 |
NSO, MDHS Report, 2017 |
Annex: Scenario interventions, benchmarking and justifications
Download to pdfAgriculture and Rural Development scenario
The following tables outline the components of each strategic intervention scenario, including the magnitude of change implemented in IFs and the benchmark (the historical or global context that suggests the reasonableness of its magnitude). The interventions within each scenario commence in 2023 and present a subsequent eight-year push to 2030, with the improvements maintained to 2063 (unless indicated otherwise).
|
Interventions and parameters |
Intervention in IFs |
Benchmark/justification/notes |
|
Increase crop yields (ylm) |
Interpolate from 1 to 1.6 by 2030 and interpolate to 1.5 by 2035 and hold |
Between 2005 and 2012, Malawi increased average crop yields by 78%. In this scenario, average crop yields in Malawi increase by 77% over the period 2023 to 2030. |
|
Reduce loss rate of agriculture production (aglossprodm) |
Interpolate from 1 to 0.7 by 2030 and hold |
To reduce agricultural production loss at the point of production. This intervention puts Malawi on a par with the projected average for low-income countries globally by 2030. |
|
Reduce agriculture loss from producer to consumer (aglosstransm) |
Interpolate from 1 to 0.7 by 2030 and hold |
This intervention reduces agricultural loss from producer to consumer. |
|
Increase land area equipped for irrigation (Landirareaequipm) |
Interpolate from 1 to 1.2 by 2030, and interpolate to 1.1 by 2063 |
To mitigate the harmful effects of droughts and insufficient rainfall on agricultural production. Between 1991 and 1999, land area equipped for irrigation increased by 28.6% in The Gambia. In this scenario, irrigated land area increases by 35% over the period 2023 to 2030. |
|
Increase water withdrawal (ground) (waterwithdrawalm) |
Interpolate from 1 to 1.05 by 2030 and interpolate to 1 by 2063 |
To meet irrigation water requirements. Agriculture is the sector with by far the largest consumptive water use and water withdrawal in Malawi. |
|
Increase food access/calories per capita (clpcm) (total) |
Interpolate from 1.1 by 2030 and hold at 1.1 to 2040, and interpolate to 1.05 by 2063 |
To ensure that domestic food demand is satisfied before export. Between 2010 and 2017, calories per capita in Ethiopia increased by 12.3%. In this scenario, calories per capita increase by 15% over the period 2023 to 2030. |
|
Increase forest protection (forestm) |
Interpolate from 1 to 1.02 by 2063 |
Halt deforestation through environmental conservation and protection. Increase forest land by 0.4 million hectares between 2030 and 2063 to restore forest land to 2011 observed values. |
|
Access to rural roads (infraroadraitrgtyr) |
Initial condition set at 95 in 2017 |
Increase rural accessibility to all-weather roads. This intervention put the access rate to 80% by 2063. It is projected to be 68.7% by 2063 on the Current Path. In this scenario, the rural population with access to an all-weather road increases by 14% over the period 2023 to 2030. |
|
Improve government effectiveness (goveffectm) |
Interpolate from 1 to 1.45 by 2030 and hold at 1.45 to 2035, and interpolate to 1.2 by 2063 |
Between 2002 and 2009, Rwanda increased its government effectiveness score by about 48%. In this scenario, between 2023 and 2030, governance effectiveness score in Malawi increases by 52% (on par with Rwanda). |
|
Increase access to electricity (rural) |
Interpolate from 1 to 1.15 by 2030 and interpolate to 1.01 by 2063 |
Between 2011 and 2018, electricity access in rural areas increased by 241.4% in Ethiopia, albeit from a very low base. In this scenario, electricity access in rural areas in Malawi increases by 300% between 2023 and 2030, from a very low base (5%). |
|
Increase social welfare transfers to the poorest and most vulnerable people (unskilled) (govhhtrnwelm) |
Interpolate from 1 to 1.2 by 2030 and interpolate to 1.1 by 2063 |
In this scenario, government social welfare transfers reach 3.3% of GDP by 2030 (on par with Rwanda). |
Human Capital Push scenario
|
Interventions and parameters |
Adjustment in IFs |
Benchmark/justification/notes |
|
Reduce AIDS-related death rate as per cent of infection rate (aidsdratem) |
Interpolate from 1 to 0.8 by 2030 and hold |
From 2010 to 2017, Guinea Bissau reduced AIDS-related deaths by 30%. In this scenario, Malawi achieves 41% reduction in AIDS-related deaths between 2023 and 2030. |
|
Reduce maternal mortality ratio (matmortratiom) |
Interpolate from 1 to 0.6 by 2030 and hold |
Rwanda reduced the maternal mortality ratio by 57% from 2003 to 2010. In this scenario, Malawi achieves 53% reduction in maternal mortality in this scenario between 2023 and 2030. |
|
Reduce under five mortality (hlmortcdchldm) |
Reduce from 1 to 0.7 by 2030 and hold |
Between 2009 and 2016, Malawi reduced child mortality by 42%. In this scenario, Malawi achieves 42% reduction in child deaths between 2023 and 2030. |
|
Improve access to improved sanitation (sanitationm) |
Interpolate from 1 to 1.65 by 2030 and hold |
Between 2000 and 2007, Mozambique increased access to improved sanitation by 93%, albeit from a low base. In this scenario, Malawi achieves 72% improvement from 2023 and 2030. |
|
Reduces severe acute malnutrition prevalence (SAM) (malnchpsamm) |
Interpolate from 1 to 0.7 by 2030 and hold |
Between 2010 and 2017, Malawi achieved a 24% reduction in total cases. Malawi achieves a 22% reduction in SAM total cases 2023 and 2030. |
|
Improve access to improved sources of water (pipe) (Watsafem) |
Interpolate from 1 to 1.2 by 2030 and hold |
Ethiopia increased access by about 29% between 2013 and 2020. In this scenario, Malawi achieves 42% increase between 2023 and 2030, reaching 45% by 2030. |
|
Improve access to improved sources of water (Watsafem) (otherimproved) |
Interpolate from 1 to 1.35 by 2030 and hold |
Ethiopia increased access by about 21% between 2010 and 2014, and Mozambique increased by 20%. |
|
Increase primary education survival rate (total) (edprisurm) |
Interpolate from 1 to 1.25 by 2030 |
Between 2005 and 2012, Malawi increased primary education survival by about 72%. Between 2023 and 2030, Malawi achieves an increase of 30%. |
|
Improve lower secondary enrolment rate (total) (edseclowrenrm) |
Interpolate from 1 to 1.5 by 2030 and hold |
Between 2006 and 2013, Madagascar increased its gross lower secondary enrolment by 51.5%. In this scenario, between 2023 and 2030 Malawi increases by 24% (similar to the period 2006 to 2013 for Malawi). |
|
Increase lower secondary graduation (total) (edseclowrgram) |
Interpolate from 1 to 1.5 by 2030 and hold |
Guinea increased its lower secondary completion rate by 32% between 2015 and 2019. In this scenario, Malawi achieves a 46% increase between 2023 and 2030. |
|
Improve transition rate from lower secondary to upper secondary education (edsecupprtranm) |
Interpolate from 1 to 1.3 by 2030 and hold |
Between 2003 and 2011, Mozambique increased its transition rate from lower secondary to upper secondary enrolment by 36.12%. In this scenario, Malawi achieves a 29% increase between 2023 and 2030. |
|
Increase upper secondary graduation (total) (edsecupprgram) |
Interpolate from 1 to 1.5 by 2030 and hold |
Uganda increased its upper secondary education graduation rate by about 29% between 2015 and 2019. Malawi achieves a 71% increase between 2023 and 2030 taking the per cent of upper secondary graduation to 34% by 2030. |
|
Increase vocational and technical training (edsecupprvocadd) |
Interpolate to 20 by 2030 and hold |
Between 2009 and 2016, enrolment in vocational training increased by 45.1% in Mozambique. |
|
Improve quality of primary education (edqualpriallm) |
Interpolate from 1 to 1.1 by 2030 and hold |
Chad improved its test score by 13% between 1995 and 2005. In this scenario, Malawi improves its primary education quality by 11% between 2023 and 2030. |
|
Improve quality of secondary education (edqualsecallm) |
Interpolate from 1 to 1.1 by 2030 and hold |
Burundi’s score increased by about 10% between 2015 and 2019. In this scenario, Malawi improves its secondary education quality by 10% between 2023 and 2030. |
|
Improve tertiary enrolment rate (male) (edterintm) |
Interpolate from 1 to 1.35 by 2030 and hold |
Between 2014 and 2018, male gross tertiary enrolment increased by 30% in Togo. In this scenario, Malawi achieves a 52% increase between 2004 and 2011, and a 302% increase between 2023 and 2030 from a very low base. Malawi is below Togo by 2030, reaching 16% by 2030. |
|
Improve tertiary enrolment rate (female) (edterintm) |
Interpolate from 1 to 1.3 by 2030 and hold |
Between 2014 and 2018, female gross tertiary enrolment increased by 59.4% in Togo. In this scenario, Malawi achieves a 287% increase between 2023 and 2030, reaching 16% by 2030. |
|
Improve tertiary graduation (total) (edtergradm) |
Interpolate from 1 to 1.7 by 2030 and hold |
Between 2003 and 2010, tertiary graduation rate more than doubled (100%) in Ethiopia, albeit from a low base. Malawi's tertiary education outcome is one of the lowest in the world. In this scenario, Malawi achieves a 180% increase between 2023 and 2030 from a very low base (on par with Burkina Faso by 2030). |
|
Increase share of science and engineering students in tertiary graduates (edterscienshradd) |
Interpolate to 5 by 2030, and hold |
The share of science and engineering students in tertiary graduates in Algeria increased by 39.7% between 2009 and 2016. In this scenario, Malawi achieves a 29% increase between 2023 and 2030. |
|
Increase modern contraceptive use (contrusm) |
Interpolate from 1 to 1.4 by 2030, and interpolate to 1 by 2040 |
Between 2000 and 2005, modern contraceptive use rate doubled (100%) in Ethiopia, from a low base. In this scenario, modern contraceptive use increases by 50% between 2023 and 2030 in Malawi. |
|
Improve gender empowerment (gemm) |
Interpolate from 1 to 1.2 by 2030 and hold |
El Salvador improved its gender empowerment score by nearly 20% between 2001 and 2008. In this scenario, Malawi's score on the gender empowerment index increases by 21% between 2023 and 2030. |
Business First scenario
|
Interventions and parameters |
Adjustment in IFs |
Benchmark/justification/notes |
|
Improve governance transparency (govcorruptm) |
Interpolate from 1 to 1.5 by 2030 and interpolate to 1.25 by 2063 |
Between 2008 and 2015, Rwanda increased its score by 80%. In this scenario, Malawi’s score increases by 43% between 2023 and 2030 (on par with Rwanda). |
|
Increase government revenue (fiscal consolidation measure) (govrevm) |
Interpolate from 1 to 1.2 by 2030 and interpolate to 1.1 by 2063 |
Between 2014 and 2016, government revenue in Rwanda increased by 24.5%. In this scenario, Malawi government revenue increases by 73% between 2023 and 2030. |
|
Reduce government expenditure (other) (fiscal consolidation measure) (gdsm) |
Interpolate from 1 to 0.7 by 2030 and hold |
Used as a proxy for reduction in operational and administrative budget allocation. |
|
Improve economic freedom (econfreem) |
Interpolate from 1 to 1.15 by 2030 and hold at 1.15 to 2035 and interpolate to 1.1 by 2063 |
Rwanda improved its score for economic freedom by about 23% between 2000 and 2007. In this scenario, Malawi improves its score by 14% between 2023 and 2030 (on par with Rwanda). |
|
Improve business regulation/ business environment (govbusregindm) |
Interpolate from 1 to 0.8 by 2030 and hold |
Between 2012 and 2019, regulatory quality in Ethiopia improved by 20%. The score for regulatory quality in Malawi increases by about 10% between 2023 and 2030. |
|
Reduce capital cost to output ratio in energy (qem – Q) (OthRenew) |
Interpolate from 1 to 0.8 by 2030 and hold |
To reduce the cost of investing in renewables to provide greater energy access. |
|
Accelerate urbanisation rate (pop in urban areas) |
Initial condition set at 3.75 in 2017 |
To emulate the MIP-1 target of 25% by 2030. |
|
Increase access to electricity (urban) (infraelecaccm) |
Interpolate from 1 to 1.12 by 2030 and hold |
Between 2012 and 2019, The Gambia increased electricity access by about 18% in urban areas. In this scenario, electricity access in urban areas (per cent of urban population) increases by 29% between 2023 and 2030, and reaches 80.1% by 2030 in line with MIP-1 target. |
|
Increase access to fixed broadband (Ictbroadm) |
Interpolate from 1 to 1.2 by 2030 and hold |
From a very low base, access to fixed broadband in Mali increased by more than 100% between 2009 and 2016. In this scenario, fixed broadband per 100 people increases by 553% over the period 2023 to 2030, from a very low base of 1.4 subscriptions per 100 people in 2019, reaching 15 subscriptions per 100 people by 2030. |
|
Access to mobile broadband (Ictbroadmobilm) |
Interpolate from 1 to 1.3 by 2030 and hold |
From a low base, mobile broadband Internet subscriptions per 100 people in Malawi increased by more than 100% between 2010 and 2017. In this scenario, mobile broadband per 100 people increases by 50% over the period 2023 to 2030. |
|
Increase R&D spending gdsm (R&D) |
Interpolate from 1 to 1.9 by 2030 and hold |
To improve knowledge capital which is a drag on productivity in Malawi. R&D spending is very low in Malawi. In this scenario, Government spending on R&D (% of GDP) reach 0.067% of GDP by 2030 |
|
Increase roads paved, length (infraroadpavedpcntm) |
Interpolate from 1 to 1.075 by 2030 and hold |
From 1990 to 1997, Eritrea increased its paved roads length by 26.5%. In this scenario, paved roads length in Malawi increases by 25% between 2023 and 2030. |
|
Increase domestic investment in the economy (all sectors) (invm) |
Interpolate from 1 to 1.2 by 2030 and hold at 1.2 to 2040 and interpolate to 1.1 by 2063 |
Historical benchmarking is not available for this indicator. Domestic investment as a share of GDP in Malawi is lower than in countries such as Uganda, Ethiopia and Mozambique. |
|
Increase foreign direct investment flows to Malawi (xfdifinm) |
Interpolate from 1 to 1.3 by 2030 and hold |
FDI flows to Ethiopia (as per cent of GDP) increased by 60% between 1997 and 2004. In this scenario, FDI flows to Malawi (as per cent of GDP) increase by 61% between 2023 and 2030. |
|
Increase female labour participation rate (female) (labparm) |
Interpolate from 1.1 by 2030 and hold |
This intervention puts Malawi on par with Madagascar, Rwanda and Ethiopia by 2030. Between 2023 and 2030, female labour participation rate increases by 10%. |
|
Reduce electricity transmission and distribution loss (infraelectranlossm) |
Interpolate from 1 to 0.7 by 2030 and hold |
Between 1994 and 1999, Angola reduced electricity transmission losses by nearly 49% (before the year 2000, Angola was a low-income country). In this scenario, electricity transmission losses decrease by 28% between 2023 and 2030. |
|
Increase mining (materials) export (xsm) |
Interpolate from 1 to 1.2 by 2030 and hold |
Between 2023 and 2030, material exports increase by 60%, albeit from a very low base. |
|
Increase manufacturing export (xsm) |
Interpolate from 1 to 1.1 by 2030 and hold at 1.1 to 2040 and interpolate to 1.05 by 2063 |
Between 2023 and 2030, manufacturing exports increase by 5% to reach 20% of GDP (value by sector export) by 2030. |
Endnotes
Malawi 2022 Voluntary national review report for sustainable development goals (SDGs), June 2022
Malawi 2022 Voluntary national review report for sustainable development goals (SDGs), June 2022
MW Kateta, How corruption derails development in Malawi, Foreign Policy, 21 May 2021
S Bhoojedhur and T Isbell, Almost half of Malawians consider emigration; most-educated are most likely to look overseas, Afrobarometer Dispatch No. 281, 6 March 2019
The Malawi 2063 First 10-year Implementation Plan (MIP–1), 2021–2030
W Kumwembe, ‘Vision 2020 lacked focus’, The Times, 2 December 2019
Malawi Annual Public Debt Report 2020/2021, Ministry of Finance
NSO, Malawi, 2018 Malawi Population and Housing Census
National Planning Commission, Cost-benefit analysis of increasing contraceptive use through post-partum counselling and free improved access to contraception in Malawi, Malawi Priorities, National Planning Commission (Malawi), Copenhagen Consensus Center (USA) and African Institute for Development Policy (Malawi), 2021
IFs database
J Forty, SD Rakgoasi, and M Keetile, Patterns and determinants of modern contraceptive use and intention to use contraceptives among Malawian women of reproductive ages (15–49 years), Contracept Reprod Med 6:21, 2021
B Franklin, R Naik, S Pappa and S Sacher, Accelerating Progress on the Sustainable Development Goals of Malawi: The role of population and family planning, Policy Brief, 2017
IFs database. Original data source: UN Department of Economics and Social Affairs
Berlin Institute for Population and Development, Demographic dividend
D Canning, S Raja and AS Yazbeck (eds.), Africa’s demographic transition: Dividend or disaster? Africa Development Forum Series, Washington, DC: World Bank, 2015
Danish Trade Union Development Agency, Labour Market Profile Malawi – 2022/2023
Government of Malawi, Malawi growth and development strategy 2006–2011
UN Habitat, Housing, slums and informal settlements
M El Hedi Arouri et al, Effects of Urbanization on Economic Growth and Human Capital Formation in Africa, PGDA Working Paper, Harvard University, 2014
Government of Malawi, Malawi Secondary Cities Plan (MSCP), National Planning Commission, Lilongwe, Malawi, 2022
J Manyika et al, Lions Go Digital: The Internet’s Transformative Potential in Africa, McKinsey Global Institute, 2013
National Planning Commission, Malawi's Vision 2063: An Inclusively Wealthy and Self-reliant Nation, 2020
Human Capital Index 2020, Malawi Human Capital Project, 2020
A Tandon et al, Measuring Overall Health Systems Performance for 191 Countries, World Health Organisation, GPE Discussion Paper Series, No. 30, 2019
UNICEF, Nutrition statistics in Malawi, 2018
UNICEF, Malawi making positive strides in saving newborn lives, but more needs to be done, 20 February 2018
JM Thornton, Child malnutrition in Malawi, The Borgen Project, 20 June 2015
JM Thornton, Child malnutrition in Malawi, The Borgen Project, 20 June 2015
Data source: EM-DAT, CRED / UCLouvain, Brussels, Belgium, www.emdat.be (D. Guha-Sapir), Version 2021-08
Malawi SDNP, Human resource development and management (social sector development)
Danish Trade Union Development Agency, Labour Market Profile – Malawi 2022/2023
Danish Trade Union Development Agency, Labour Market Profile – Malawi 2022/2023
Danish Trade Union Development Agency, Labour Market Profile – Malawi 2022/2023
Danish Trade Union Development Agency, Labour Market Profile – Malawi 2022/2023
Danish Trade Union Development Agency, Labour Market Profile – Malawi 2022/2023
W Chiuta, Malawi: Education Gets Lion’s Share in Malawi 2020/21 Budget, Nyasa Times, 11 September 2020
UNESCO, What you need to know about the right to education, 2020
National Statistical Office (NSO) Malawi
E Chirwa and M Matita, The Rates of Return on Education in Malawi, University of Malawi, Chancellor College, 2009
BarroLee Data Set, Barro-Lee estimates of educational attainment for the population aged 15–64 from 1950 to 2015
PS Hettinger et al, Malawi Economic Monitor: Addressing Macro and Gender Imbalances, World Bank, 1 December 2021
HA Patrinos and N Angrist, A Global Dataset on Education Quality: A Review and Update (2000–2017), World Bank Policy Research Working Paper No. 8592, 2018
World Bank, Malawi – Human Capital Index 2020, October 2020
Danish Trade Union Development Agency, Labour Market Profile – Malawi 2022/2023
EA Hanushek and L Woessmann, The Economic Impacts of Learning Losses, Paris: Organisation for Economic Co-operation and Development, 2020
EA Hanushek and L Woessmann, The Economic Impacts of Learning Losses, Paris: Organisation for Economic Co-operation and Development, 2020
Danish Trade Union Development Agency, Labour Market Profile – Malawi 2022/2023
National Statistical Office, Malawi Poverty Report 2018: Trends in Poverty, 2019, National Statistical Office (NSO), Malawi
National Statistical Office (NSO), Fourth Integrated Household Survey (IHS4), 2018
National Statistical Office (NSO), Fourth Integrated Household Survey (IHS4), 2018
M Ravallion, S Chen and P Sangraula, New Evidence on the Urbanization of Global Poverty, Population and Development Review 33:4, 2007, 667–701
J Barofsky, E Siba and J Grabinsky, Can rapid urbanization in Africa reduce poverty? Causes, opportunities, and policy recommendations, 7 September 2016
Malawi 2020 Voluntary National Review Report for Sustainable Development Goals (SDGs), 2020
National Statistical Office (NSO), Fourth Integrated Household Survey (IHS4), 2018
AK Fosu, Growth, Inequality and Poverty in Sub-Saharan Africa: Recent Progress in a Global Context, Oxford Development Studies, 43:1, 2015, 44–59; M Ravallion and S Chen, What Can New Survey Data Tell Us about Recent Changes in Poverty and Distribution? World Bank Economic Review, 11:2, 1997, 357–82
World Economic Forum, Global Gender Gap Report 2021, March 2021
PS Hettinger et al, Malawi Economic Monitor: Addressing Macro and Gender Imbalances, World Bank, 1 December 2021
A Brenneman and M Kerf, Infrastructure and Poverty Linkages: A Literature Review, World Bank, 2002
African Development Bank Group, Economic brief – The Africa Infrastructure Development Index (AIDI) 2020, 17 September 2020
National Statistical Office (NSO), Integrated Household Survey 2020, 2020
National Statistical Office (NSO), Integrated Household Survey 2020, 2020
Government of Malawi, Malawi Annual Economic Report 2021, Ministry of Finance, Economic Planning and Development and Public Sector Reforms, 2021
M Kojima et al, Who Uses Electricity in Sub-Saharan Africa – Findings from Household Surveys, Policy Research Working Paper No. 7789, Washington, D.C.: World Bank, 2016
Malawi Growth and Development Strategy (MGDS) III
Government of Malawi, Malawi Annual Economic Report 2021, Ministry of Finance, Economic Planning and Development and Public Sector Reforms, 2021
Privacy Shield Framework, Malawi – Energy
S Asher and P Novosad, Rural Roads and Local Economic Development, American Economic Review, 110:3, 2020, 797–823
Ministry of Transport and Public Works, Malawi National Transport Master Plan, 2017
Ministry of Transport and Public Works, Malawi National Transport Master Plan, 2017
ReCAP, Rural Access Index (RAI)
Government of Malawi, Malawi Annual Economic Report 2021, Ministry of Finance, Economic Planning and Development and Public Sector Reforms, 2021
Ministry of Transport and Public Works, Malawi National Transport Master Plan, 2017
National Statistical Office (NSO), 2019 National Household Survey on Access and Usage of ICT Services in Malawi, August 2020
World Bank, Malawi Economic Monitor: Investing in Digital Transformation, 23 June 2021
BuddeComm, Malawi Telecoms Market Report, June 2022
World Bank, Malawi Economic Monitor: Investing in Digital Transformation, 23 June 2021
N McCarthy et al, Recurrent Climatic Shocks and Humanitarian Aid: Impacts on Livelihood Outcomes in Malawi, Policy Research Working Paper No. 9666, 2021
N McCarthy et al, Recurrent Climatic Shocks and Humanitarian Aid: Impacts on Livelihood Outcomes in Malawi, Policy Research Working Paper No. 9666, 2021
Ministry of Finance, Annual Public Debt Report 2020/2021, Debt and Aid Management Division, Malawi
Agence France Presse, Malawi steeply devalues currency to shore up forex reserves, 26 May 2022
For a detailed description of the production function in International Futures mode, see International Futures (IFs)
The World Bank, The World Bank Productivity Project
J Felipe, Tracking the Middle-Income Trap: What is It, who is in It, and Why? ADB Economics Working Paper Series No. 306, 2012
One could also use income thresholds converted to 2011 US$ (PPP), and the result is the same: Malawi is not on track to achieve lower-middle income status by 2030.
C Mangazi, Manufacturing share shrinking, The Times Group, 12 March 2021
Government of Malawi, Malawi Annual Economic Report 2021, Ministry of Finance, Economic Planning and Development and Public Sector Reforms, 2021
Government of Malawi, Malawi Annual Economic Report 2021, Ministry of Finance, Economic Planning and Development and Public Sector Reforms, 2021
N Tena, Malawi $1billion energy deal to boost economy, ESI Africa, 18 November 2021
UNCTAD, World Investment Report 2021, United Nations, 2021
World Bank Group, Doing Business 2020, 2020
C Deléchat and L Medina, What is the informal economy? Finance & Development, IMF, December 2020
National Statistical Office (NSO), Malawi Labour Force Survey 2013, April 2014
National Statistical Office (NSO), Malawi Labour Force Survey 2013, April 2014
National Planning Commission, Malawi's Vision 2063: An Inclusively Wealthy and Self-reliant Nation, 2020
National Planning Commission, Malawi's Vision 2063: An Inclusively Wealthy and Self-reliant Nation, 2020
S Tione, Land markets and agricultural household decisions nexus in Malawi, PhD thesis, Norwegian University of Life Sciences School of Economic and Business, Ås, Norway, 2020
The Malawi Priorities Project, Cost-benefit analysis of interventions to encourage agricultural exports in Malawi – Technical Reports, 2021
National Planning Commission, Malawi's Vision 2063: An Inclusively Wealthy and Self-reliant Nation, 2020
World Bank, Malawi Economic Monitor: Charting a New Course, June 2019
World Bank, The World Bank in Malawi
D Eckstein, V Künzel and L Schäfer, Global Climate Risk Index 2021, Germanwatch
A Mbiyozo and A le Roux, Climate finance isn’t reaching Southern Africa’s most vulnerable, 2 November 2021
ND-GAIN Country Index, Malawi
MK Joshua et al, Climate Change in Semi-arid Malawi: Perceptions, Adaptation Strategies and Water Governance, Journal of Disaster Risk Studies, 8:3, 2016, 255
A Mbiyozo and A le Roux, Climate finance isn’t reaching Southern Africa’s most vulnerable, 2 November 2021
IFs database. Data source: FAO
OK Kirui, Economics of Land Degradation and Improvement in Tanzania and Malawi, in E Nkonya, A Mirzabev and J von Braun (eds.), Economics of Land Degradation and Improvement – A Global Assessment for Sustainable Development, Cham: Springer, 2016
IPC Integrated Food Security Phase Classification, Malawi IPC Chronic Food Insecurity Report, May 2022
National Statistical Office (NSO), Malawi in Figures 2020 Edition
Government of Malawi, Malawi Annual Economic Report 2021, Ministry of Finance, Economic Planning and Development and Public Sector Reforms, 2021
M Newiak, A Segura-Ubiergo and A Aziz Wane (eds.), Good Governance in Sub-Saharan Africa: Opportunities and Lessons, Washington, D.C.: International Monetary Fund, 2022
Mo Ibrahim Foundation, 2020 Ibrahim Index of African Governance (IIAG) Report, 2020
D Mmana, Corruption costs Malawi K412.5 billion, The Times Group, 18 November 2021
Malawi Growth and Development Strategy (MGDS) III
M Newiak, A Segura-Ubiergo and A Aziz Wane (eds.), Good Governance in Sub-Saharan Africa: Opportunities and Lessons, Washington, D.C.: International Monetary Fund, 2022
BTI Transformation Index, Malawi Country Report 2022
Transparency International, Corruption Perception Index, 2021
JD Moyer et al, Africa’s path to 2063: Choice in the face of great transformation, Denver and Midrand: Frederick S. Pardee Center for International Futures and NEPAD Planning and Coordinating Agency, 2018; DK Bohl et al, Development Trends Report for Southern Africa, Denver: USAID, 2017; DK Bohl et al, Development Trends Report for South Africa, Denver: USAID, 2017
AfCAP, Climate Adaptation: Risk Management and Resilience Optimisation for Vulnerable Road Access in Africa, February 2019
OS Ogunleye, Determinants of rural development in Edo State, Nigeria: An overview, African Research Review, 4:1, 2010, 298–308
The World Bank, Malawi economic monitor, 2019
World Bank, Malawi human capital project, 2020
A Tandon, CJL Murray, JA Lauer and DB Evans, Measuring Overall Health Systems Performance for 191 Countries, World Health Organisation, GPE Discussion Paper Series: No. 30, 2019
J Morisset, What’s behind poor education outcomes in Côte d’Ivoire?, 2017
African Development Bank, African Economic Outlook 2021
M El Hedi Arouri et al, Effects of Urbanization on Economic Growth and Human Capital Formation in Africa, PGDA Working Paper, Harvard University, 2014
The World Bank uses income classification based on GNI per capita which is not forecast in the IFs model. However, the GNI per capita has been on par with the GDP per capita (market exchange rate) in recent years in Malawi. Also, over the last 10 years, the nominal value of the World Bank income thresholds for lower-middle income status has increased by about 5%. Assuming that these trends continue over the next decade, the threshold for lower middle-income status would increase from its current level of US$1 086 to US$1 140 by 2032 while the GNI per capita for Malawi would likely be about US$1 221 in the same year.
World Bank, Rwanda's Anti-Corruption Experience: Actions, Accomplishments, and Lessons, Report No: ACS29873, 2020
International Monetary Fund (IMF), Navigating a long pandemic, Regional Economic Outlook: Sub-Saharan Africa, Washington, DC: IMF, April 2021
X Diao, P Hazell and J Thurlow, The role of agriculture in African development, World Development, 38:10, 2010, 1375–1383
World Bank, Malawi economic monitor, 2019
AkoFresh, About AkoFresh
A Dorward, J Kydd, C Poulton and D Bezemer, Coordination risk and cost impacts on economic development in poor rural areas, The Journal of Development Studies, 45:7, 2009, 1093–1112
T Bernatzki, M Busse and R Hoekstra, Promoting Rwanda’s business environment: Impact of reforms and drivers of change, Development Policy Review, 40:2, 2022, e12578
T Bernatzki, M Busse and R Hoekstra, Promoting Rwanda’s business environment: Impact of reforms and drivers of change, Development Policy Review, 40:2, 2022, e12578
The Economist, The violence in Ethiopia imperils an impressive record growth, 20 November 2021
Page information
Contact at AFI team is Kouassi Yeboua, Alize le Roux and Jakkie Cilliers
This entry was last updated on 13 December 2023 using IFs v7.84.
Donors and sponsors


Reuse our work
- All visualizations, data, and text produced by African Futures are completely open access under the Creative Commons BY license. You have the permission to use, distribute, and reproduce these in any medium, provided the source and authors are credited.
- The data produced by third parties and made available by African Futures is subject to the license terms from the original third-party authors. We will always indicate the original source of the data in our documentation, so you should always check the license of any such third-party data before use and redistribution.
- All of our charts can be embedded in any site.
Cite this research
Kouassi Yeboua, Alize le Roux and Jakkie Cilliers (2025) Malawi. Published online at futures.issafrica.org. Retrieved from https://futures.issafrica.org/geographic/countries/malawi/ [Online Resource] Updated 13 December 2023.