 Libya
Libya
Feedback welcome
Our aim is to use the best data to inform our analysis. See our Technical page for information on the IFs forecasting platform. We appreciate your help and references for improvements via our feedback form.
The page provides an in-depth analysis of Libya's current and projected future development, examining various sectoral scenarios and their potential impacts on the country's growth. It explores the individual and combined impact of eight sectors, including demographic, economic and infrastructure-related outcomes for Libya to 2043. The analysis offers insights into policy actions that could enhance Libya's developmental trajectory.
Please see the Technical Site for more information about the International Futures (IFs) modelling platform we use to develop the various scenarios.
Executive Summary
This page begins with an introductory assessment of the country’s context, examining current population distribution, social structure, climate and topography.
- Libya is classified as an upper-middle-income country (UMIC) located in North Africa, bordered to the north by the Mediterranean Sea, to the west by Tunisia and Algeria, to the south by Niger and Chad, and to the east by Sudan and Egypt. The country’s Mediterranean coastline extends 1 770 km, making it the longest in Africa’s northern region. Libya’s geography is dominated by vast desert plateaus covering most of the national territory, including the Sahara, with only a narrow coastal plain supporting significant settlement and agriculture. The country experiences a hot, arid climate in the interior, while the coastal strip enjoys a more temperate Mediterranean climate with seasonal rainfall rarely exceeding 400 millimetres Rainfall is highly variable and drought-prone, further constraining agricultural production and water availability.
The introduction is followed by an analysis of Libya’s Current Path prospects, which informs the country’s likely development trajectory to 2043. It is based on current development trends and assumes that no significant shocks would occur in a ‘business-as-usual’ future. The Current Path suggests that:
- Libya’s population will grow from about 7.3 million in 2023 to around 9 million by 2043. Over the same period, fertility will decline, the median age will rise from 28.3 to 35.1 years and the share of people aged 65 years and older will nearly triple, from 5.1% to about 13.8% of the total population.
- Urbanisation will keep rising, with the urban share of the population increasing from 72.2% in 2023 to 76.8% by 2043. This will strain infrastructure and services in the urban cities, requiring significant investment to accommodate growth while safeguarding safety and sustainability.
- Libya’s economy will expand steadily, with GDP rising from US$36.8 billion in 2023 to about US$74.3 billion by 2043, roughly a 102% increase. This growth is relatively high compared to other UMICs, reflecting normalisation of hydrocarbon output, catch-up investment in power and infrastructure and gradual policy improvements that increase capacity.
- Given unemployment rates, the informal economy will remain a relatively small part of the overall economy, with its contribution to GDP declining slightly from 15.4% in 2023 to 14.1% in 2043. This gradual decline likely reflects the continued formalisation of the informal sector.
- Poverty will fall sharply but remain significant. The share of people living below the UMIC poverty line of US$6.85 per day will drop from about 60% in 2023 to around 25% by 2043. This improvement likely reflects steadier growth, gradual job creation and better-targeted social transfers.
- Development challenges will persist, especially high unemployment and underinvestment in healthcare and education. The Current Path underscores the need for sequenced structural reforms and targeted policy measures aligned with Libya’s National Development Plan 2030: accelerating job creation via private-sector and SME growth; strengthening health and education quality and financing; improving public financial management and SOEs; restoring reliability in the power sector; and upgrading digital and logistics infrastructure. Delivering on these priorities would make growth more inclusive and translate into better social outcomes nationwide.
The analysis then compares progress on the Current Path with eight sectoral scenarios: Demographics and Health; Agriculture; Education; Manufacturing; the African Continental Free Trade Area (AfCFTA); Large Infrastructure and Leapfrogging; Financial Flows; and Governance. Each scenario is benchmarked to present an ambitious but reasonable aspiration in that sector.
- The Demographics and Health scenario forecasts significant improvements in health outcomes, with life expectancy increasing to 81.8 years by 2043, compared to 79.9 years on the Current Path. Infant mortality rates decline from 7.2 per 1 000 live births in 2023 to 4 per 1 000 by 2043. This scenario highlights the boost in the economic productivity of the working-age population due to better health and reduced disease burden.
- The Agriculture scenario sees average crop yields increase from 1.2 metric tons per hectare in 2023 to 1.9 metric tons per hectare by 2043, compared to the Current Path of 1.4. As a result, crop production will reach 4.1 million metric tons compared with 3 million metric tons on the Current Path in 2043. Targeted investments in the sector boost its contribution to GDP, reduce import dependence and lift approximately 1500 additional people out of extreme poverty by 2043 compared to the Current Path.
- In the Education scenario, upper-secondary completion rates increase to 73.1% by 2043, compared to 67.6% in the Current Path. In 2023, they stood at 56.2%. Additionally, the scenario includes a 14.7% quality improvement in primary and a 15.1% quality improvement in secondary education. Mean years of education among the 15- to 24-year-old age cohort reach 11.7 years by 2043, contributing to a more skilled and knowledgeable workforce.
- In the Manufacturing scenario, the contribution of manufacturing to GDP increases from 7.4% (US$2.7 billion) in 2023 to 10.7% in 2043, equivalent to US$8.4 billion in 2043. This growth increases the total size of the Libyan economy by about 6.2% to US$68.3 billion in 2043, instead of US$64.3 billion in the Current Path.
- In the African Continental Free Trade Area (AfCFTA) scenario, Libya’s total trade (exports plus imports) as a percentage of GDP will decrease from 74.3% in 2023 to nearly 71% by 2043, compared to 71.2% on the Current Path. Libya's GDP will be 12.2% larger by 2043, amounting to an additional US$9 billion compared to the Current Path. GDP per capita will increase to US$13 300 in the AfCFTA scenario, an improvement of almost 6.1% over the Current Path, highlighting the substantial benefits of enhanced regional and global trade integration.
- The Large Infrastructure and Leapfrogging scenario forecasts significant increases in infrastructure investment and capacity, leading to an economy that is US$1 billion larger by 2043 compared to the Current Path. Additionally, GDP per capita would be US$110 higher and an extra 6 940 people would be lifted out of extreme poverty. The scenario boosts fixed broadband subscriptions to 37.3 per 100 people by 2043, up from the Current Path of 33.1. These improvements translate into stronger growth and better social and environmental outcomes, including a substantial cut in carbon emissions as renewables, especially solar and wind, expand. The shift is underpinned by electricity access rising to 93% and a more diverse, sustainable energy mix by 2043.
- The Financial Flows scenario envisions a significant rise in foreign direct investment (FDI) inflows, reaching 6.3% of GDP by 2043, compared to 4.8% on the Current Path. This increase would boost Libya’s FDI stock to US$70.7 billion, significantly higher than the Current Path of US$55.9 billion. The scenario will result in substantial economic benefits, including an economy that is US$3.1 billion larger by 2043 and an increase in per capita income by US$343 compared to the Current Path. Achieving these elevated FDI levels would require policy certainty, regulatory improvements and enhanced credit ratings, which would accelerate growth and improve living standards for Libyans.
- Libya’s governance problems are long-standing, rooted in decades of personalised rule after 1969, years of post-2011 transitional governments, and repeated splits with rival authorities and disputed elections. In the Governance scenario, Libya’s governance score will improve to 0.62 out of 1 in 2043, compared to the Current Path of 5.5.
In the fourth section, we compare the impact of each of these eight sectoral scenarios with one another and subsequently with a Combined scenario (the integrated effect of all eight scenarios). In our forecasts, we measure progress on various dimensions such as economic size (in market exchange rates), gross domestic product per capita (in purchasing power parity), extreme poverty, carbon emissions, the changes in the structure of the economy, and selected sectoral dimensions such as progress with mean years of education, life expectancy, the Gini coefficient or reductions in mortality rates.
The Combined scenario forecasts:
- A significant 25.7% increase in GDP per capita above the Current Path by 2043. This equates to an additional US$ 3 157 per person, indicating a more prosperous economic outlook for most Libyans. This reflects a more rapid economic recovery following years of stagnation and decline.
- An increase in GDP per capita by US$3 150 above the Current Path to 15 450 by 2043. Among the sectoral scenarios, the AfCFTA scenario shows the largest impact on GDP per capita with an 8.1% increase (US$1 000) above the Current Path by 2043. This is followed by gains in the Governance (4.6%), Manufacturing (4.1%) and Financial Flows (2.8%) scenarios, highlighting the importance of diverse sectoral interventions for broad-based economic development. The Agriculture scenario is the least impactful in terms of GDP per capita, with an increase of US$60 compared with the Current Path in 2043.
- A significant reduction in the poverty rate (using US$6.85) to 13.5% by 2043, down from 60% in 2023. This represents a meaningful decrease of about 1.1 million fewer poor people compared to the Current Path, however, still leaving Libya with a large poverty burden.
- An increase in Libya’s carbon emissions by about 2.3 million tons in 2043, compared to the Current Path of 17.3 million tons. Overall, Libya’s carbon emissions are modest globally, but per capita they are high by African standards, reflecting the economy’s heavy reliance on hydrocarbons.
We end this page with a summarising conclusion offering key recommendations for decision-making. For sustainable and inclusive growth, Libya needs unified, capable institutions, evidence-based policy and a culture of accountability. Practically, that means restoring a single, credible budget and strengthening public financial management and procurement; improving SOEs to crowd in private capital; shifting toward a more diversified, export-oriented economy beyond hydrocarbons while managing oil revenues prudently; and sequencing major investments in human capital (health, education), reliable infrastructure (power, water, ports, roads, digital) and clean energy (solar, wind) in line with its National Development Plan, Vision 2030. Delivering this agenda depends on regulatory predictability and stronger creditworthiness to mobilise both public and private finance.
All charts for Libya Development Futures
- Chart 1: Political map of Libya
- Chart 2: Population structure in the Current Path, 1990–2043
- Chart 3: Population distribution map, 2023
- Chart 4: Urban and rural population in the Current Path, 1990-2043
- Chart 5: GDP (MER) and growth rate in the Current Path, 1990–2043
- Chart 6: Size of the informal economy in the Current Path, 2020-2043
- Chart 7: GDP per capita in Current Path, 1990–2043
- Chart 8: Extreme poverty in the Current Path, 2020–2043
- Chart 9: National Development Plan of Libya
- Chart 10: Relationship between Current Path and scenarios
- Chart 11: Mortality distribution in the Current Path, 2023 and 2043
- Chart 12: Infant mortality rate in Current Path and Demographics and Health scenario, 2020–2043
- Chart 13: Demographic dividend in the Current Path and the Demographics and Health scenario, 2020–2043
- Chart 14: Crop production and demand in the Current Path, 1990-2043
- Chart 15: Import dependence in the Current Path and Agriculture scenario, 2020–2043
- Chart 16: Progress through the education funnel in the Current Path, 2023 and 2043
- Chart 17: Mean years of education in the Current Path and Education scenario, 2020–2043
- Chart 18: Value-add by sector as % of GDP in the Current Path, 2020 and 2043
- Chart 19: Value-add by the manufacturing sector in the Current Path and Manufacturing scenario, 2020–2043
- Chart 20: Exports and imports as % of GDP in the Current Path, 2000-2043
- Chart 21: Trade balance in the Current Path and AfCFTA scenario, 2020–2043
- Chart 22: Electricity access: urban, rural and total in the Current Path, 2000-2043
- Chart 23: Cookstove usage in the Current Path and Large Infra/Leapfrogging scenario, 2020–2043
- Chart 24: Access to mobile and fixed broadband in the Current Path and the Large Infra/Leapfrogging scenario, 2020–2043
- Chart 25: FDI, foreign aid and remittances as % of GDP in the Current Path and in the Financial Flows scenario, 1990-2043
- Chart 26: Government revenue in the Current Path and Financial Flows scenario, 2020–2043
- Chart 27: Government effectiveness score in the Current Path, 2002-2043
- Chart 28: Composite governance index in the Current Path and Governance scenario, 2023 and 2043
- Chart 29: GDP per capita in the Current Path and scenarios, 2020–2043
- Chart 30: Poverty in the Current Path and scenarios, 2020–2043
- Chart 31: GDP (MER) in the Current Path and Combined scenario, 2020–2043
- Chart 32: GDP per capita in the Current Path and the Combined scenario, 2020-2043
- Chart 33: Value added by sector in the Current Path and Combined scenario, 2023 and 2043
- Chart 34: Informal sector in the Current Path and Combined scenario, 2020–2043
- Chart 35: Poverty in the Current Path and Combined scenario, 2023 and 2043
- Chart 36: Life expectancy in the Current Path and Combined scenario, 2020–2043
- Chart 37: Carbon emissions in the Current Path and Combined scenario, 2020–2043
- Chart 38: Energy demand and production by type in the Current Path and Combined scenario, 2020-2043
-
Chart 39: Policy recommendations
Chart 39: Policy recommendations
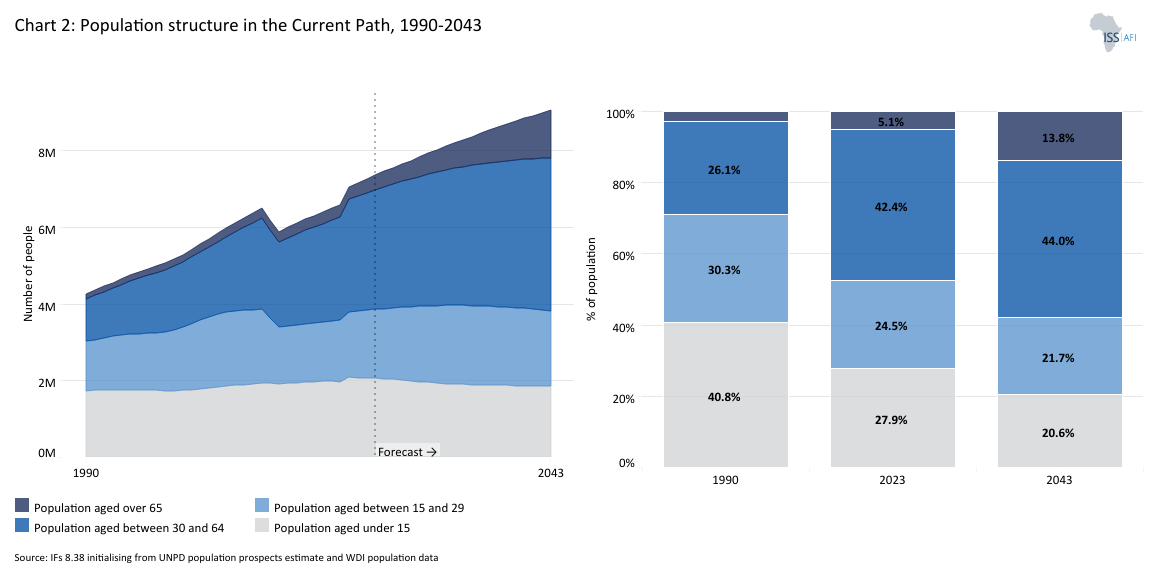
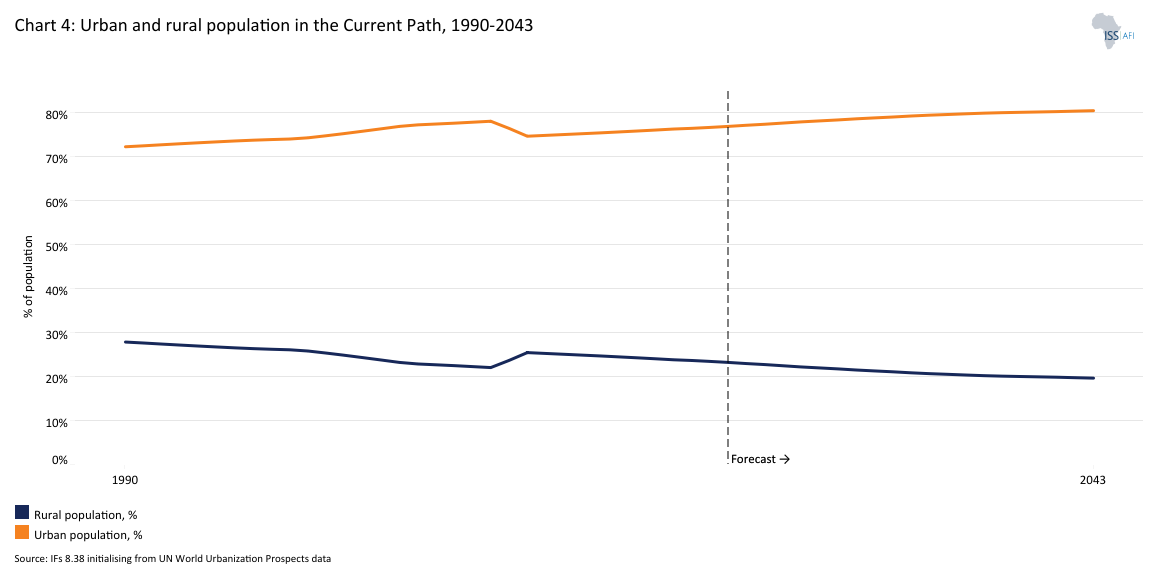
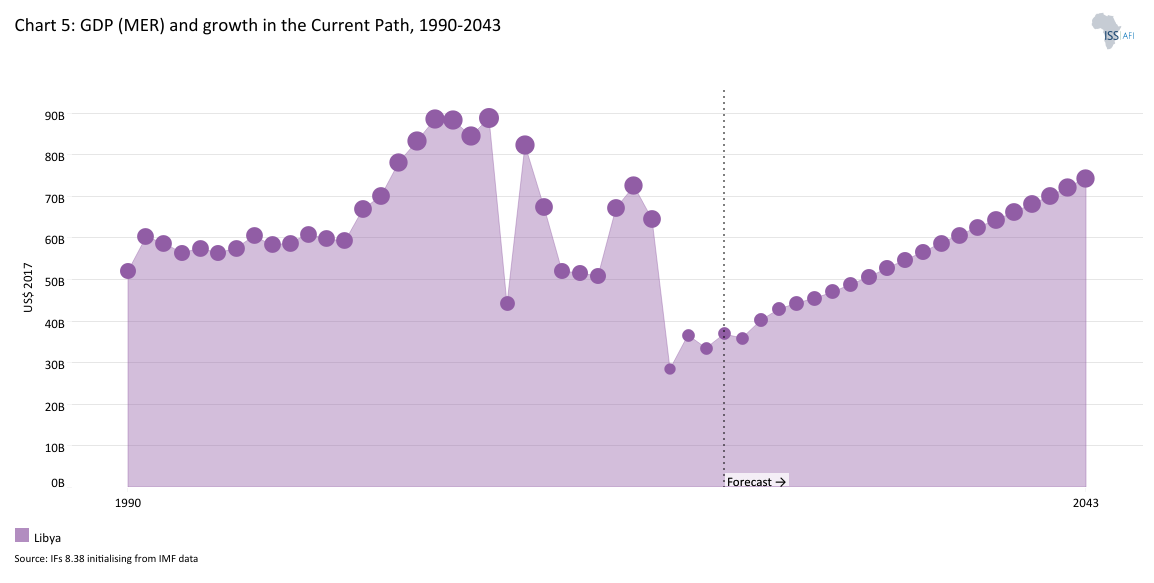
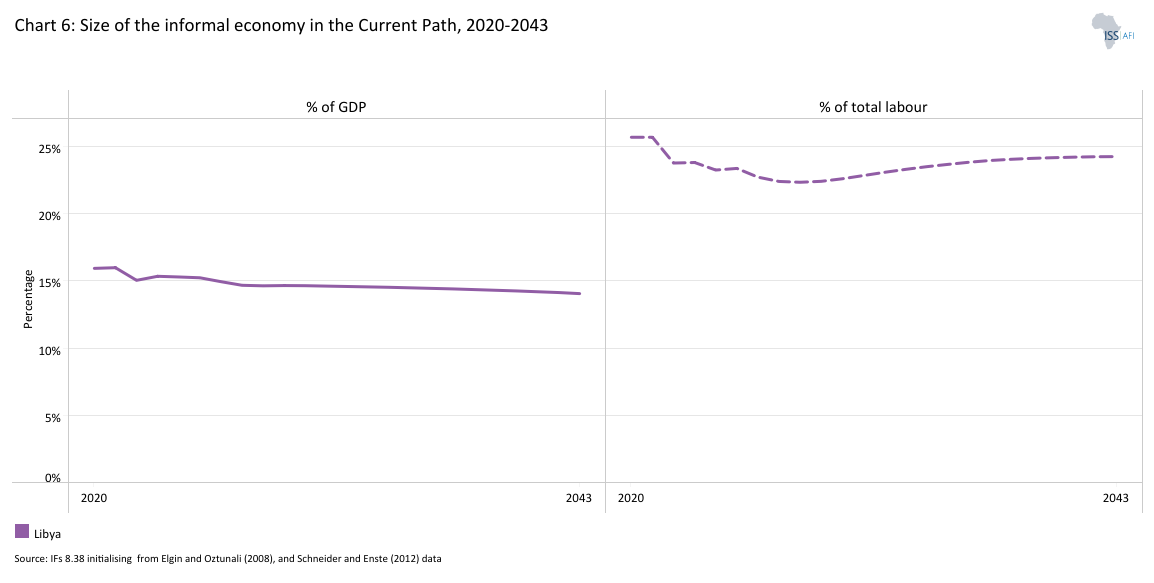
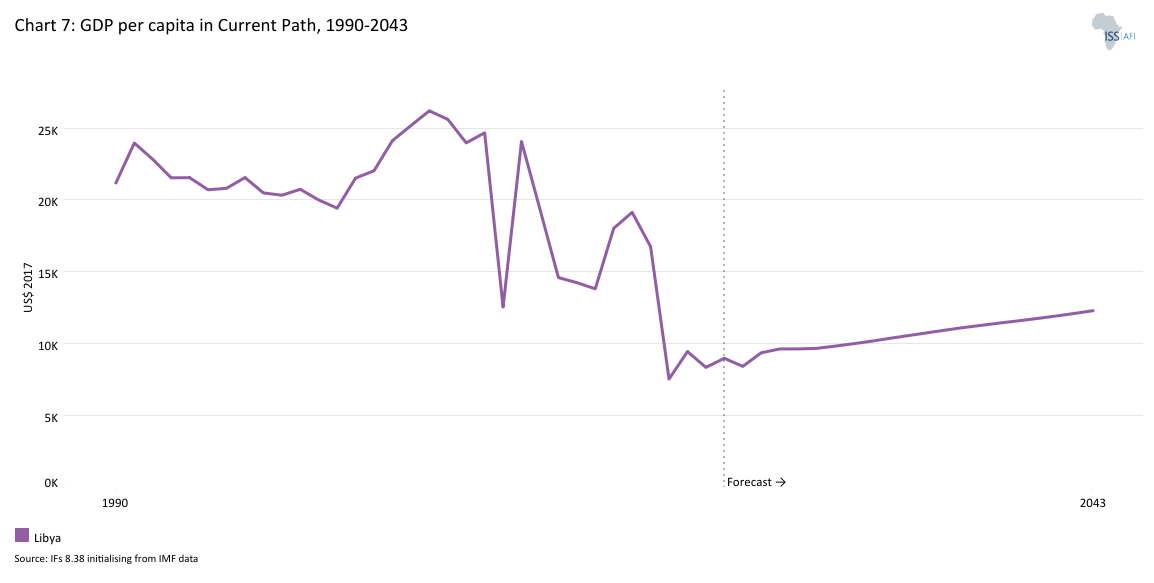
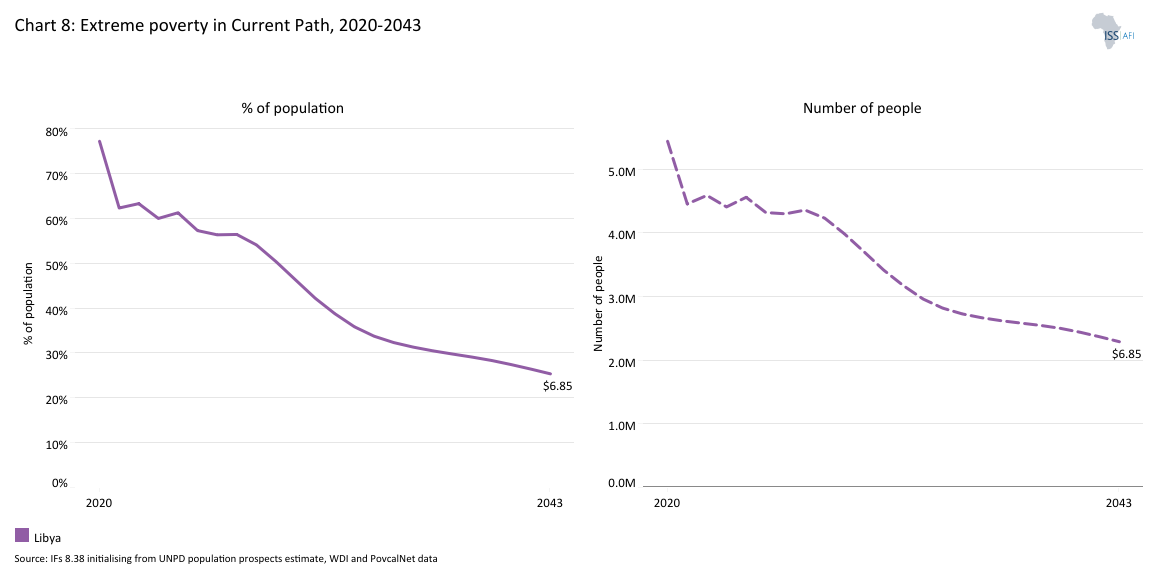
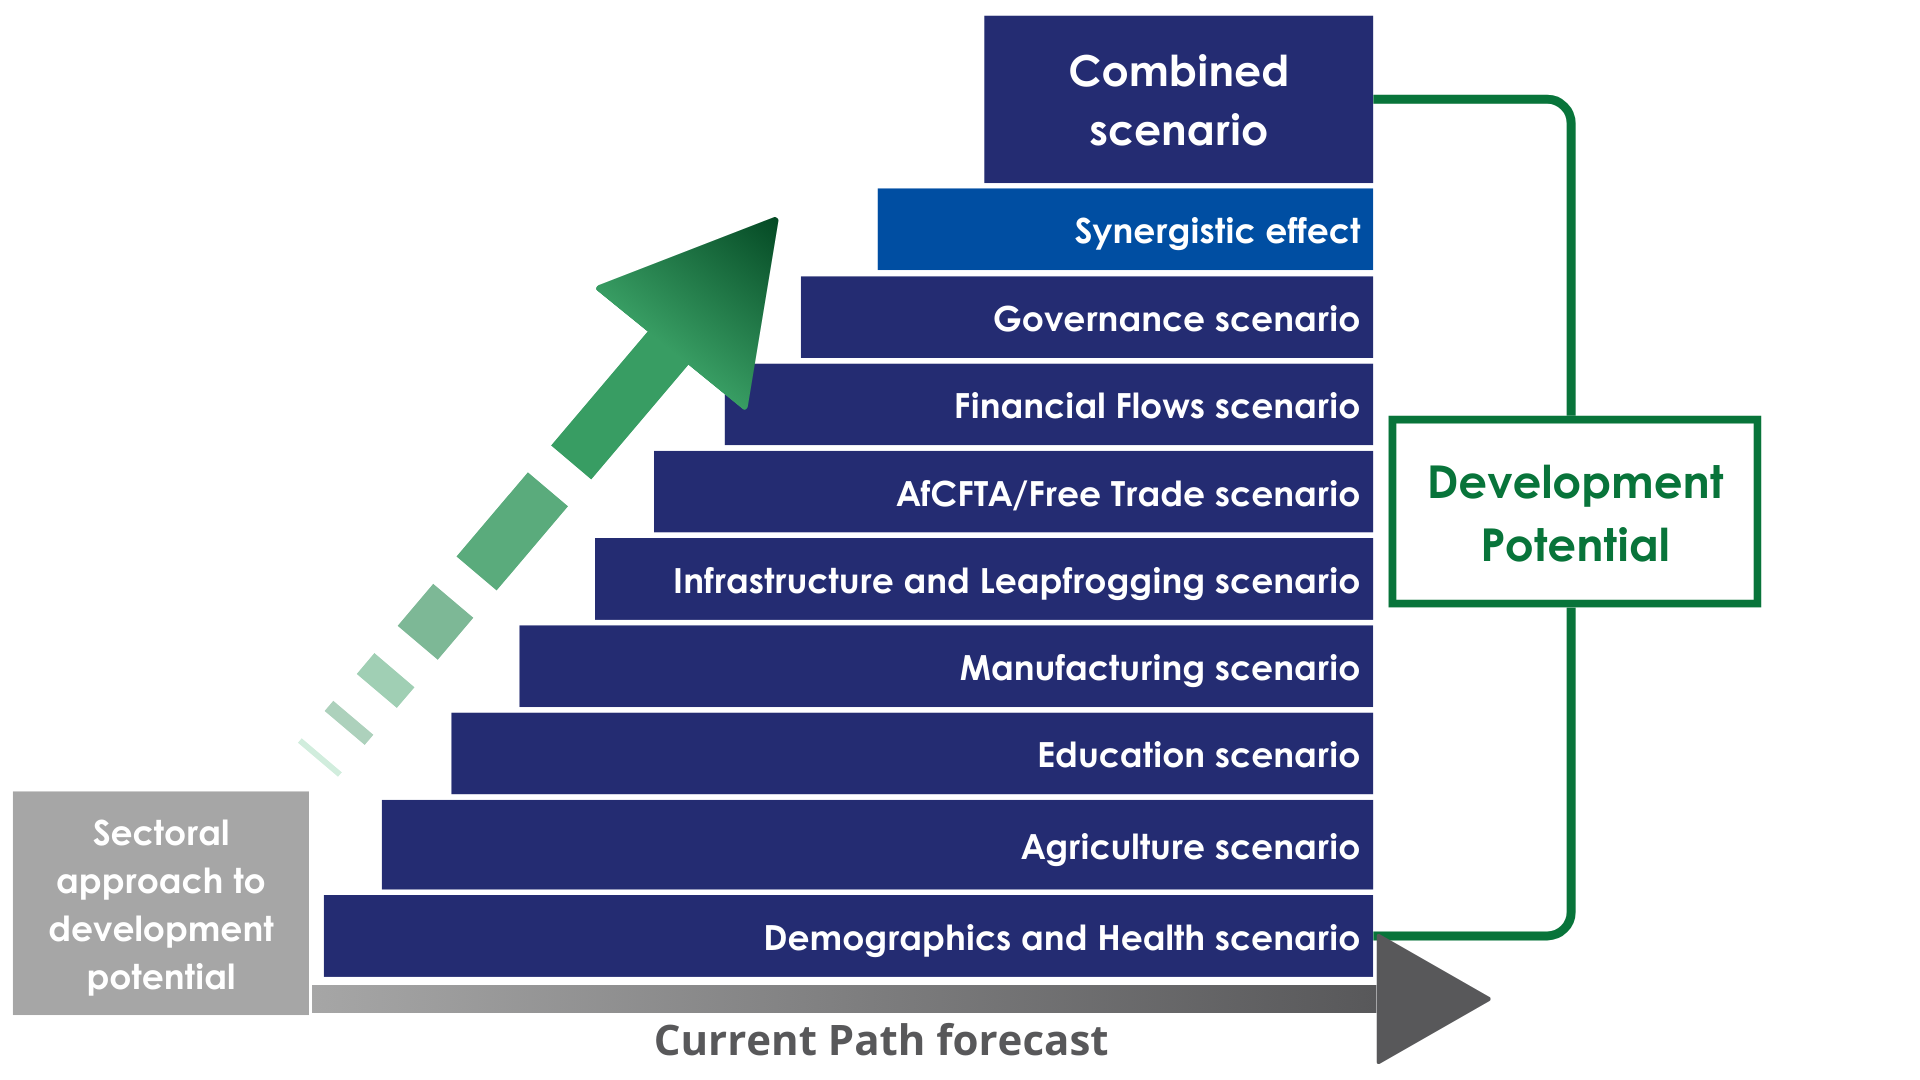

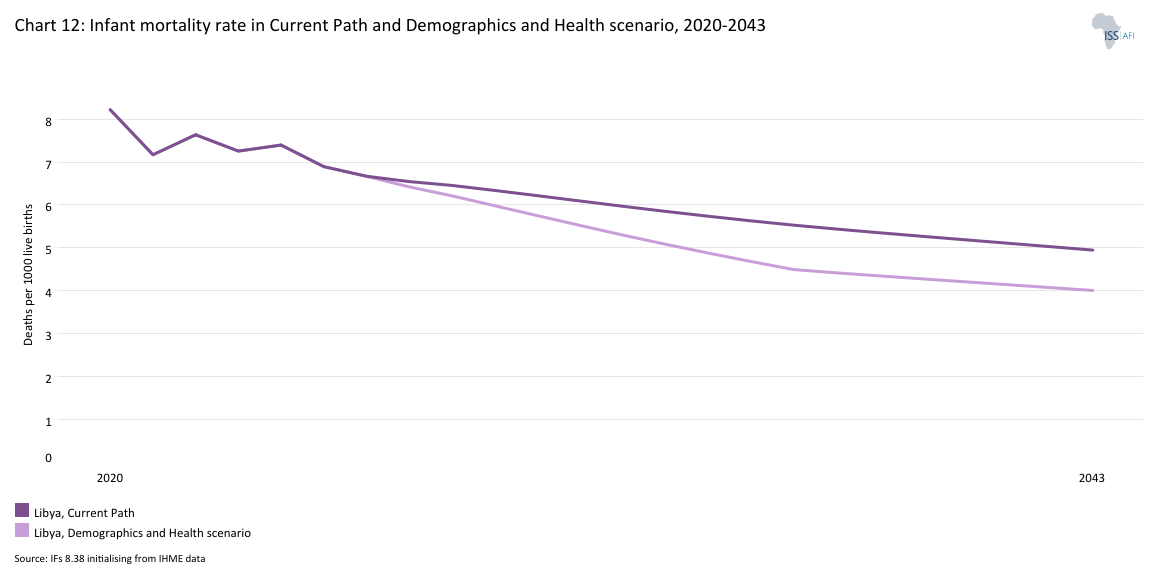
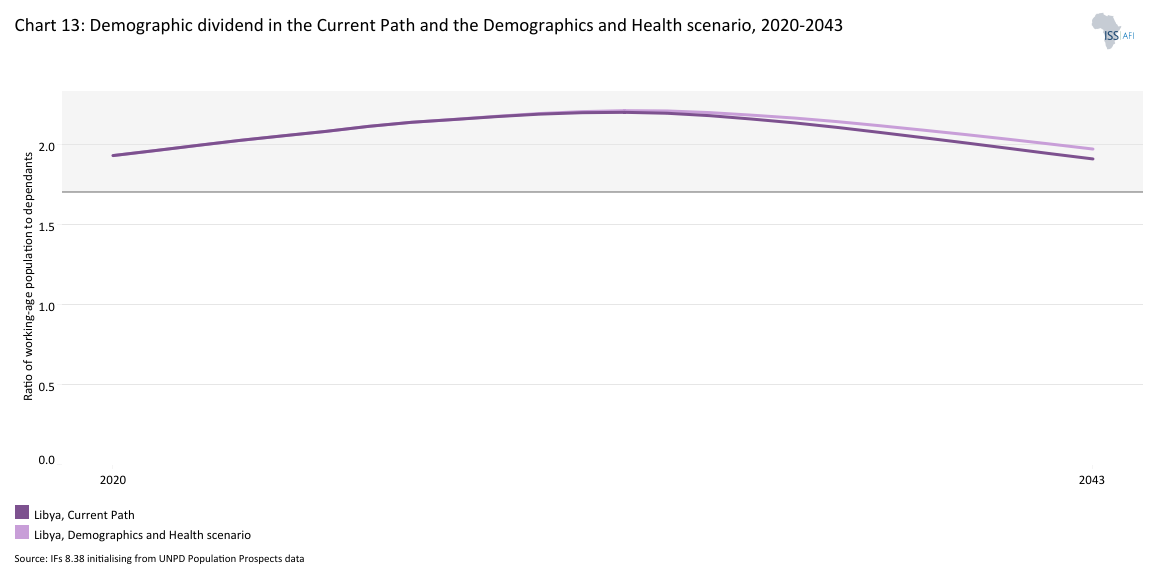
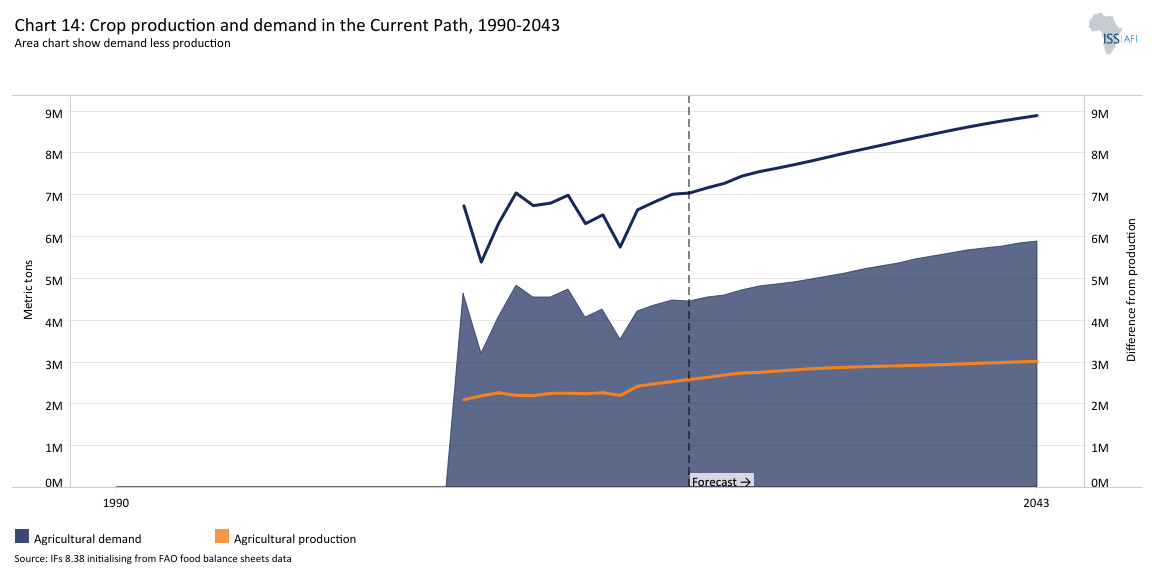
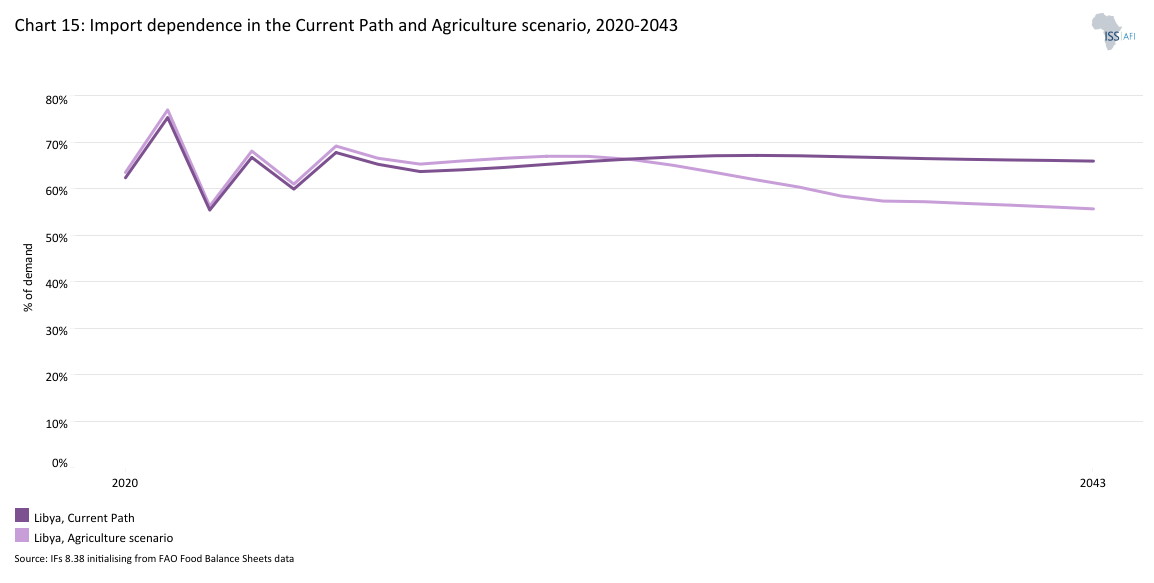
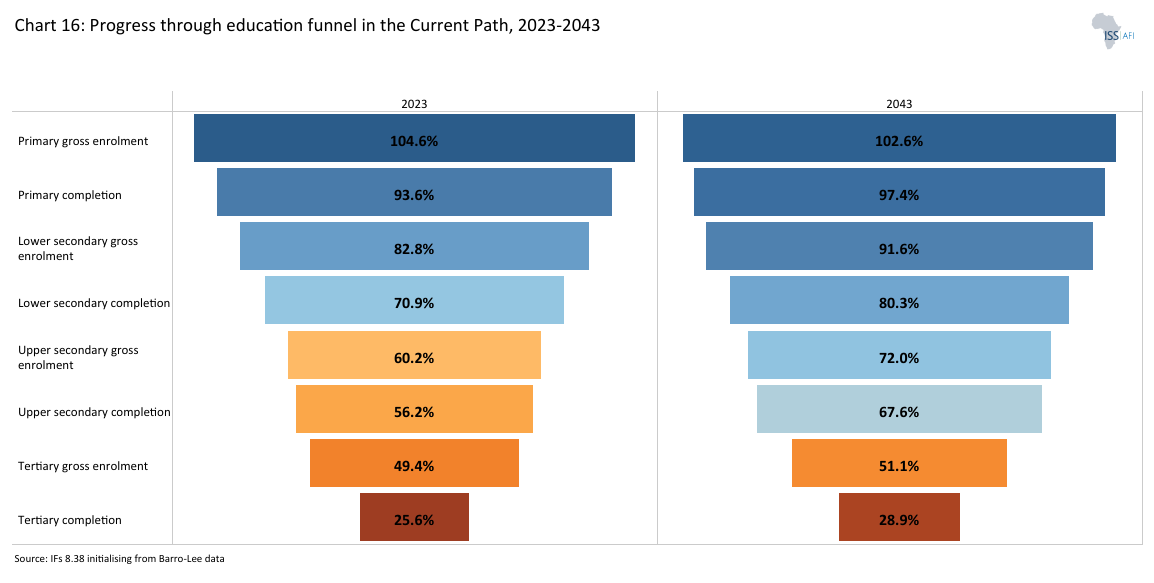
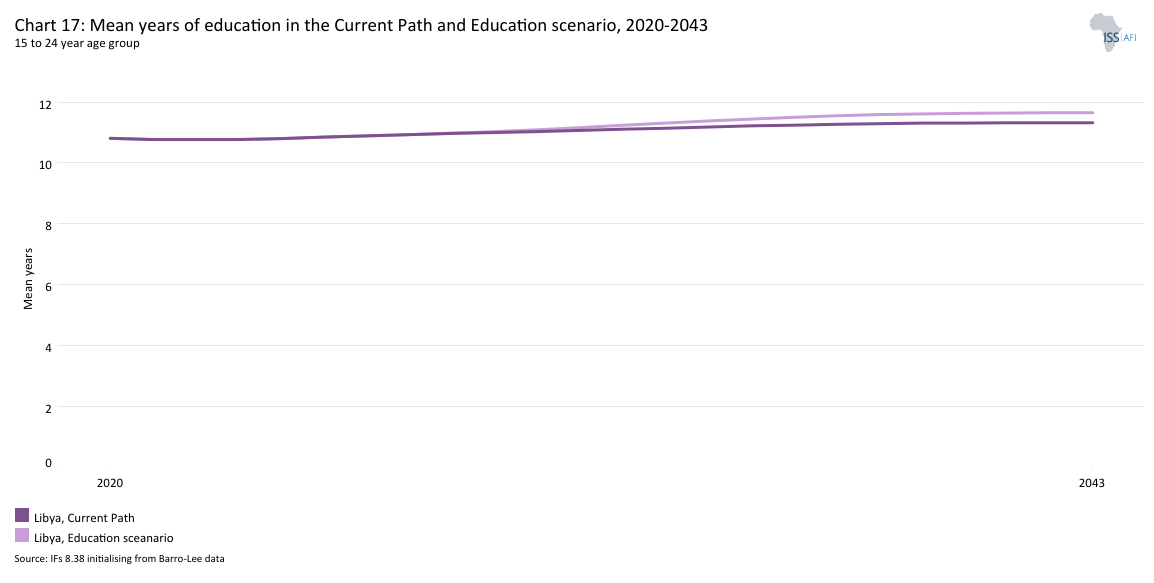
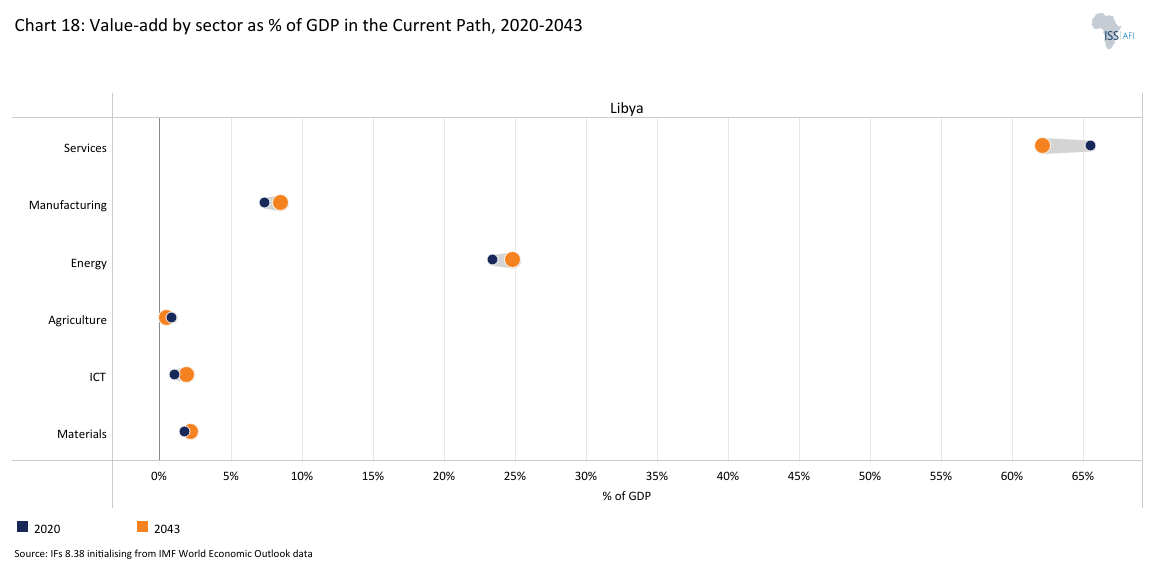
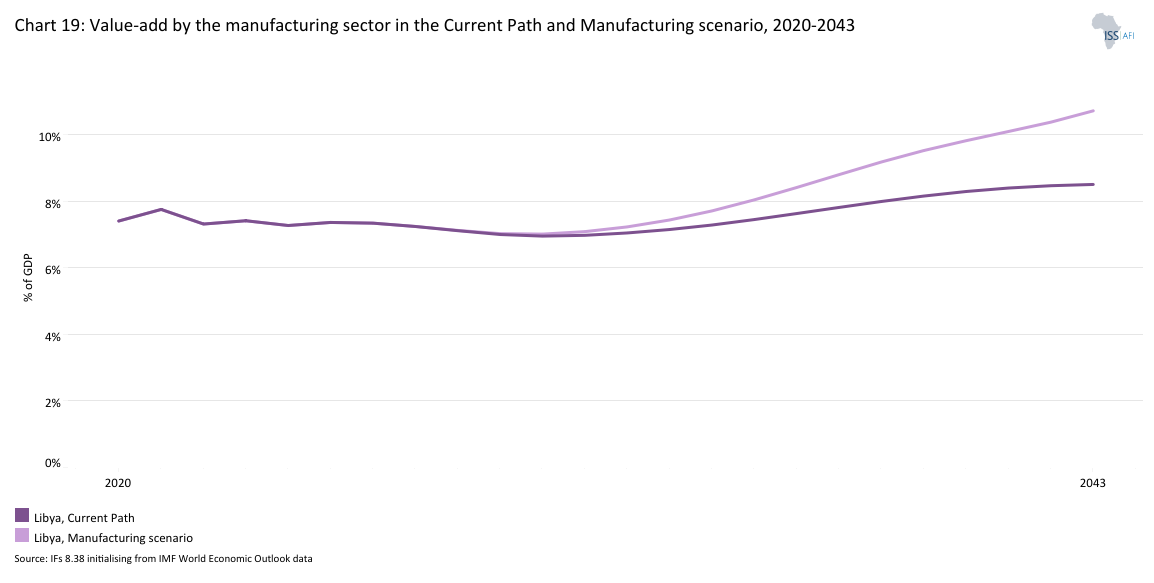
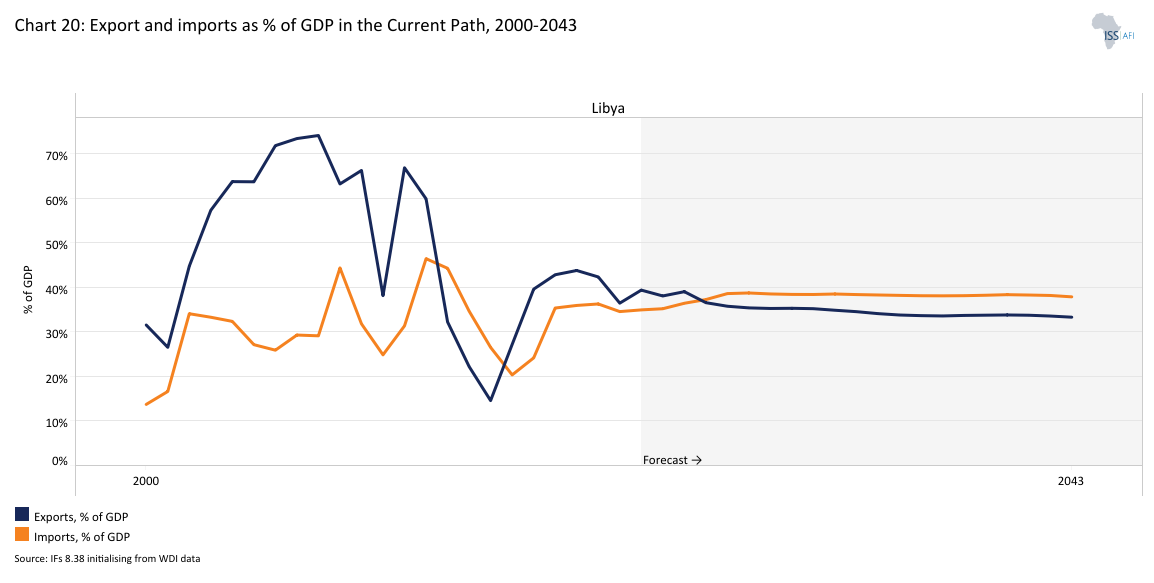
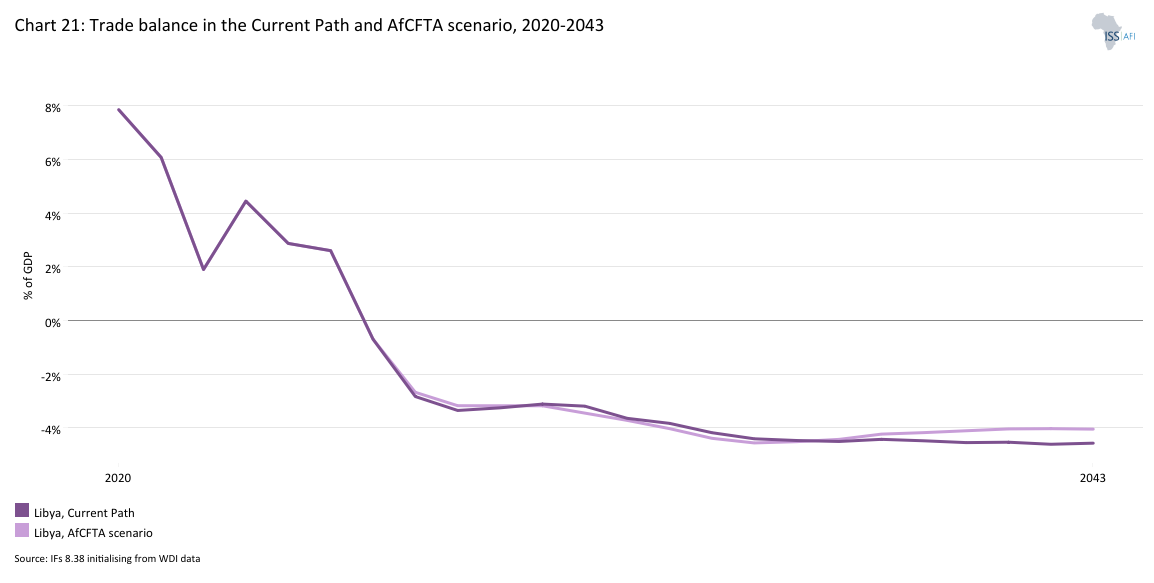
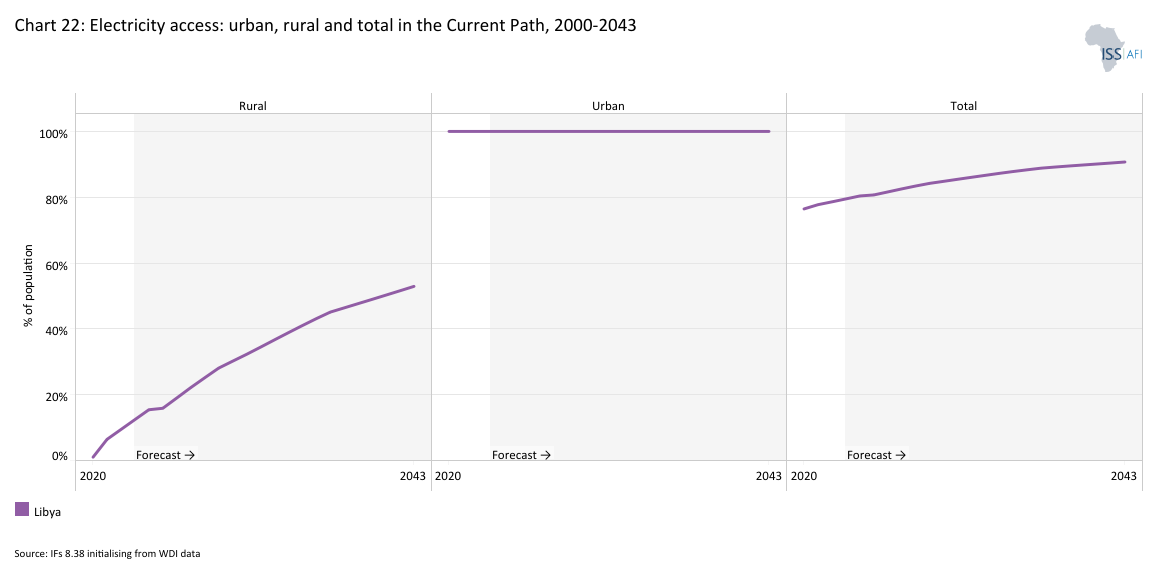
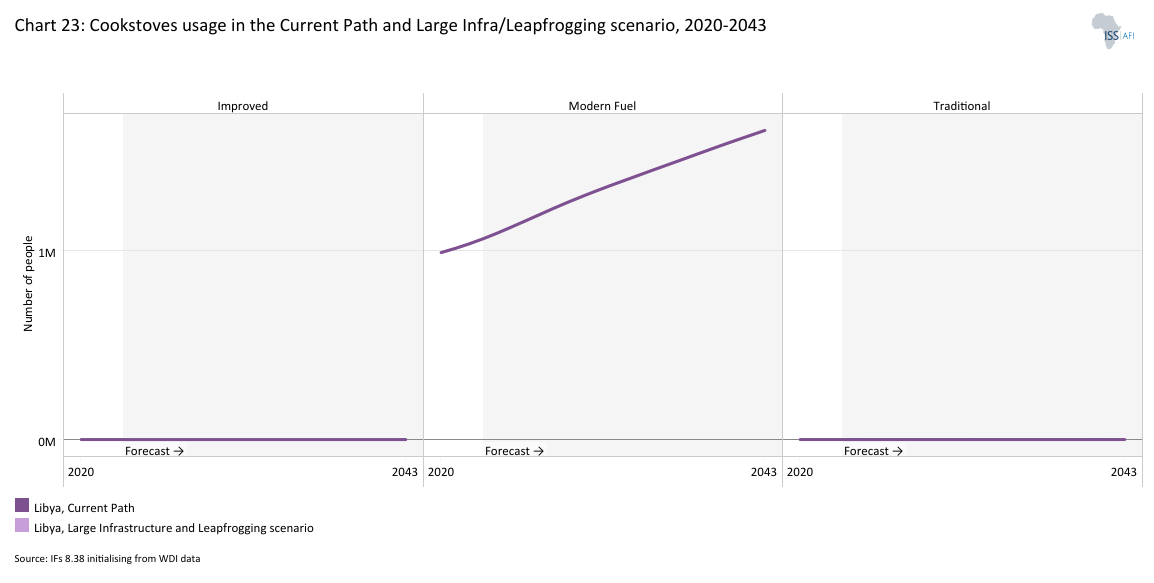
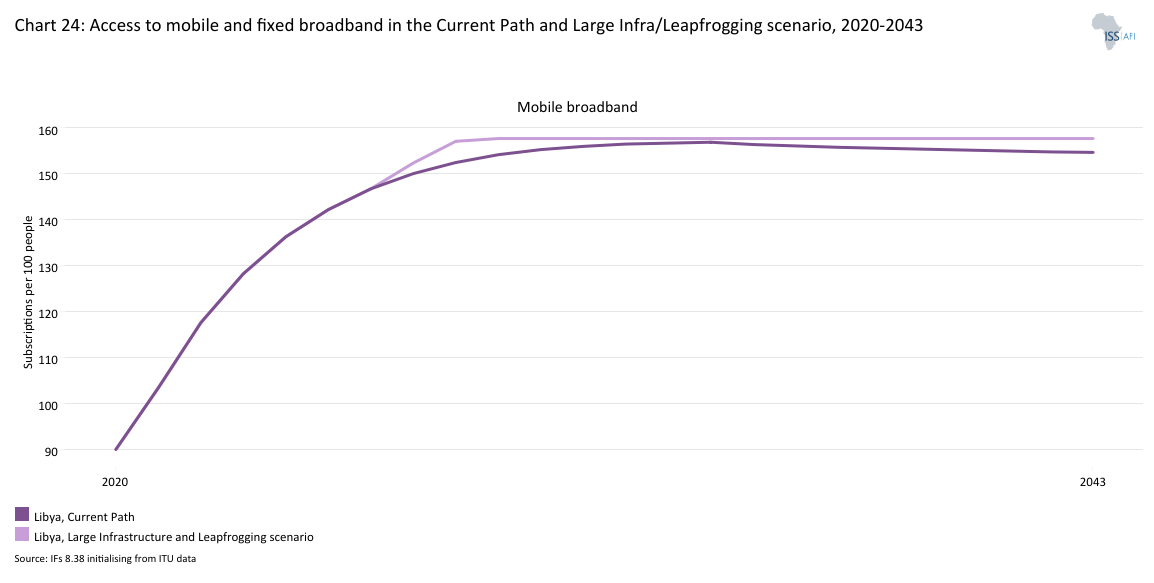
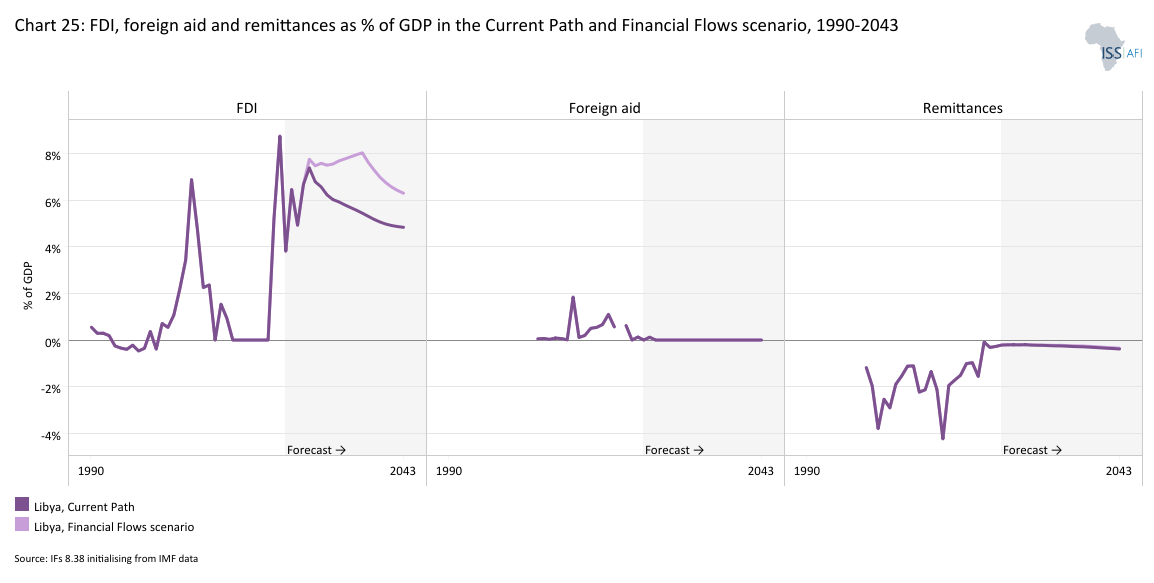
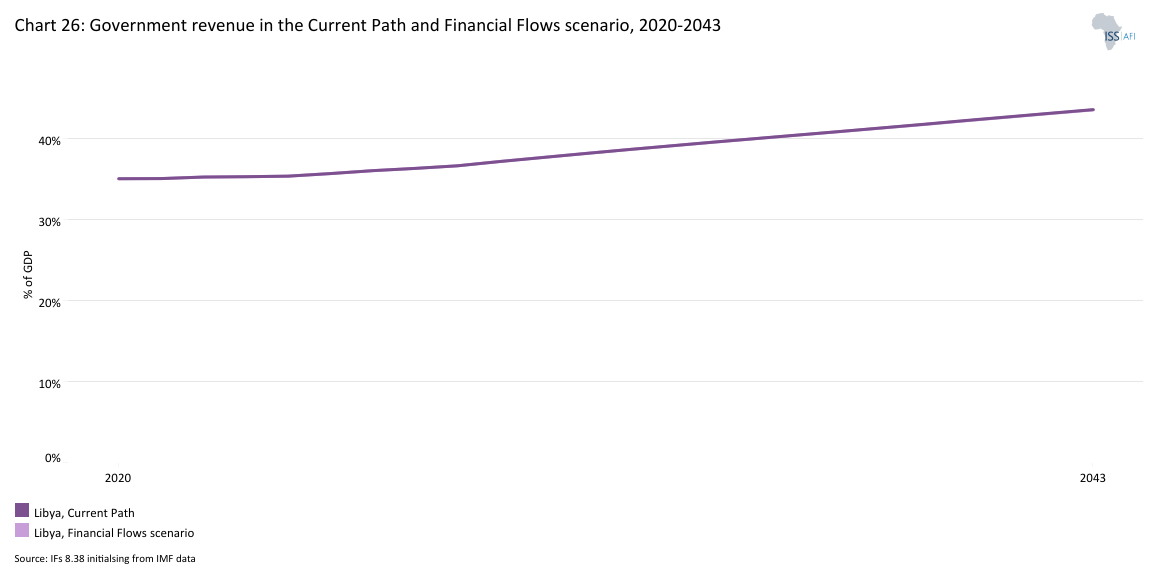
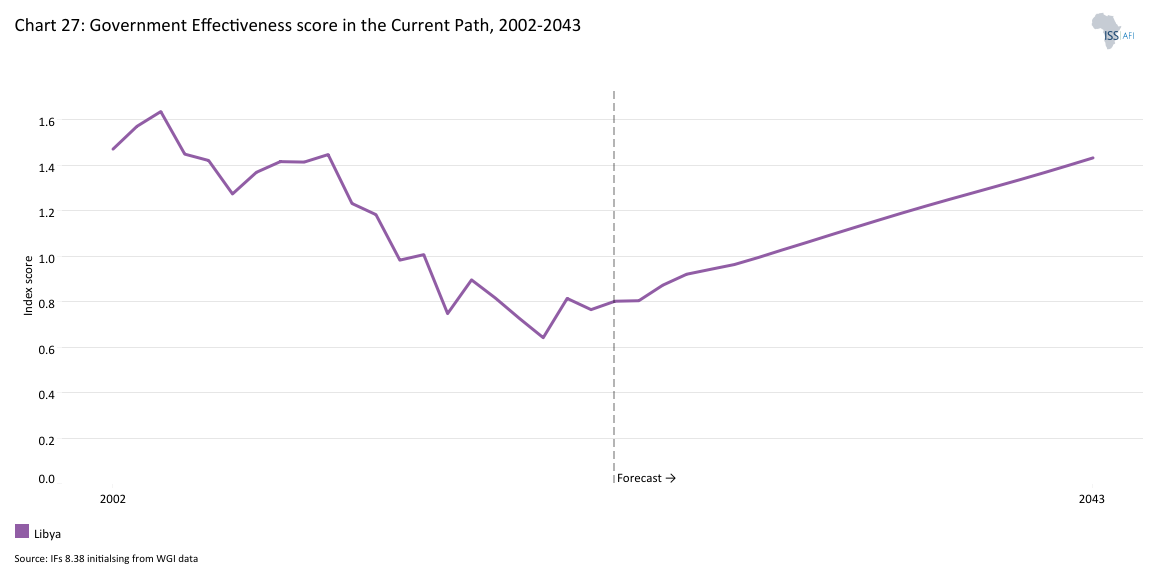
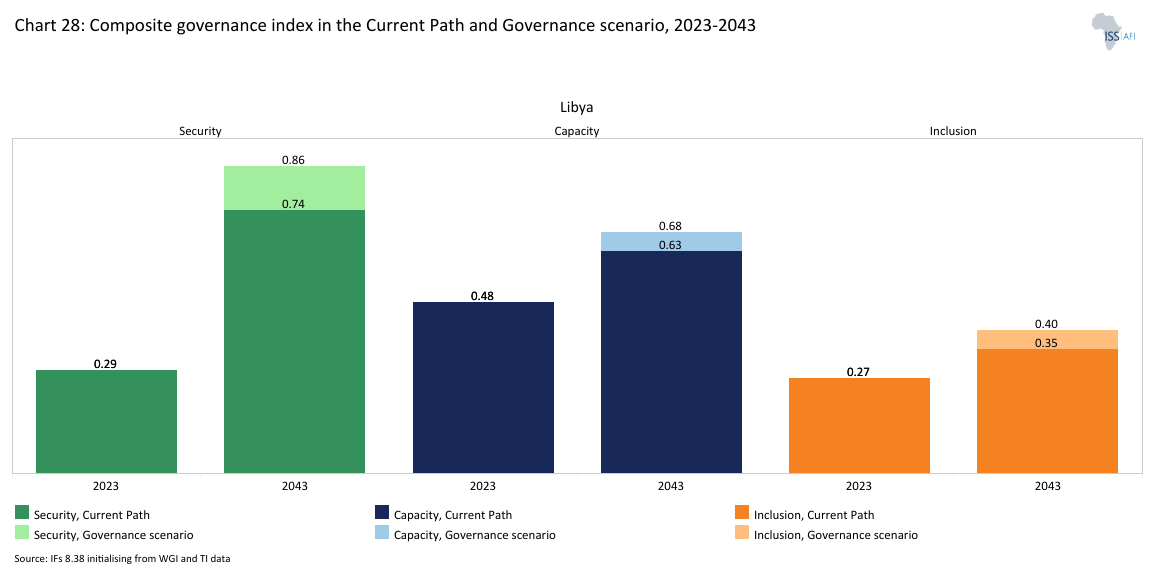
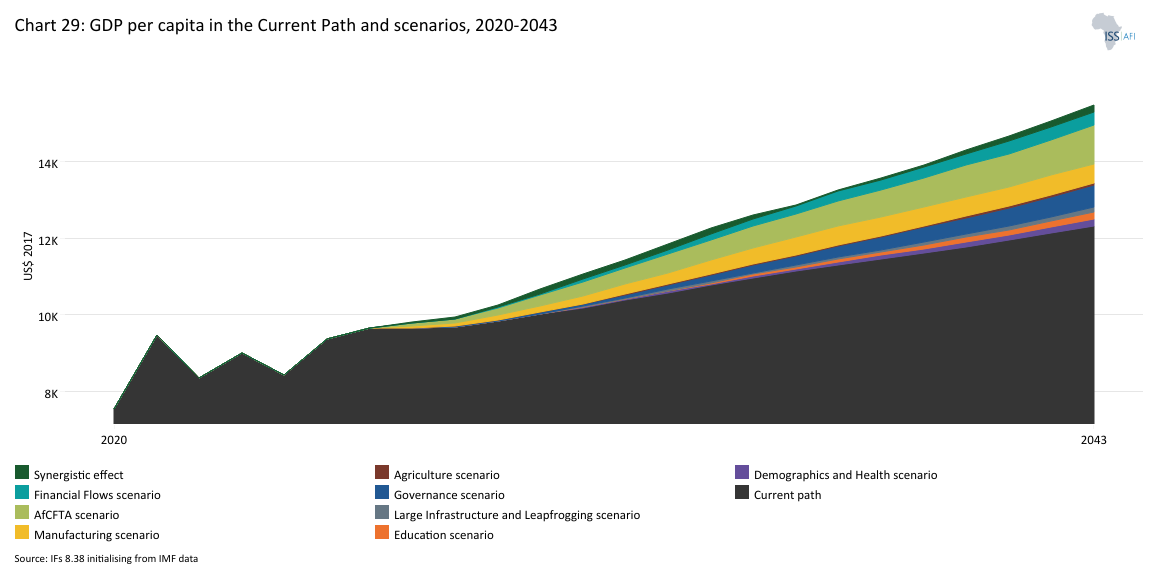
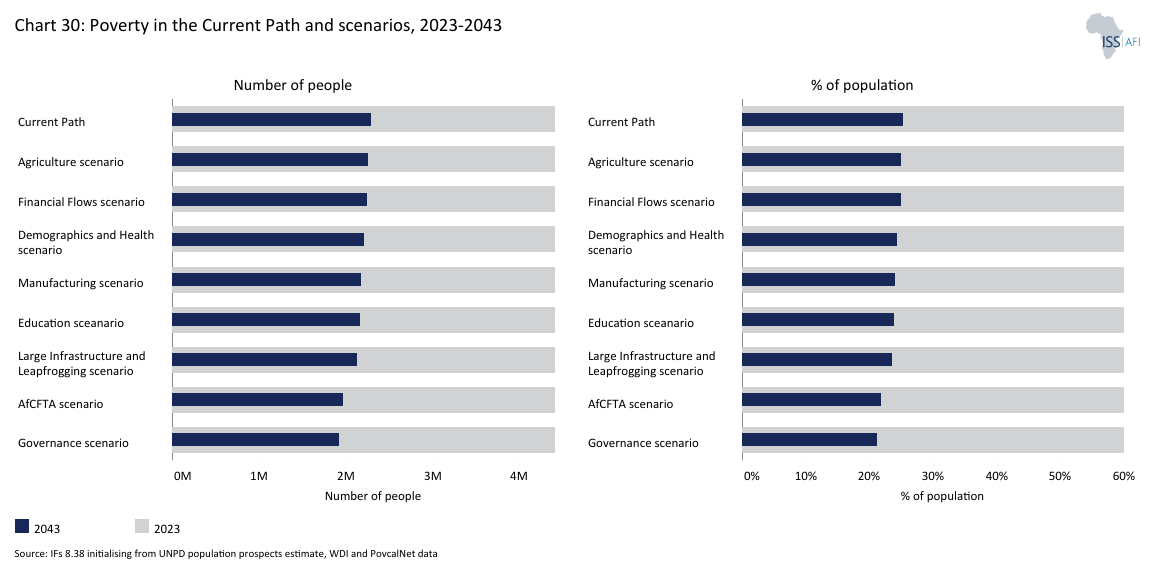
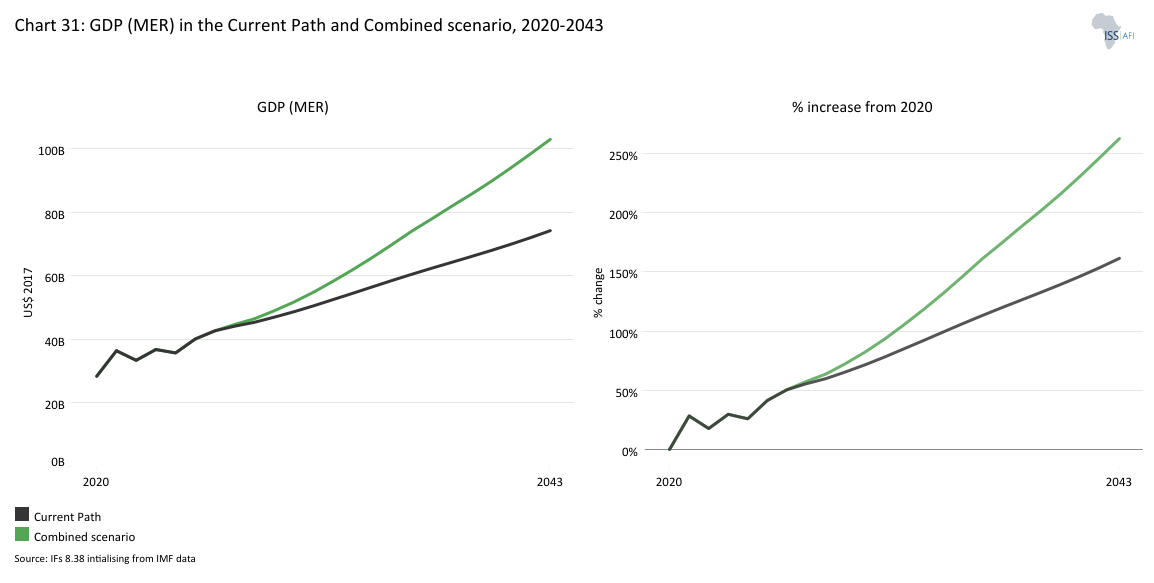
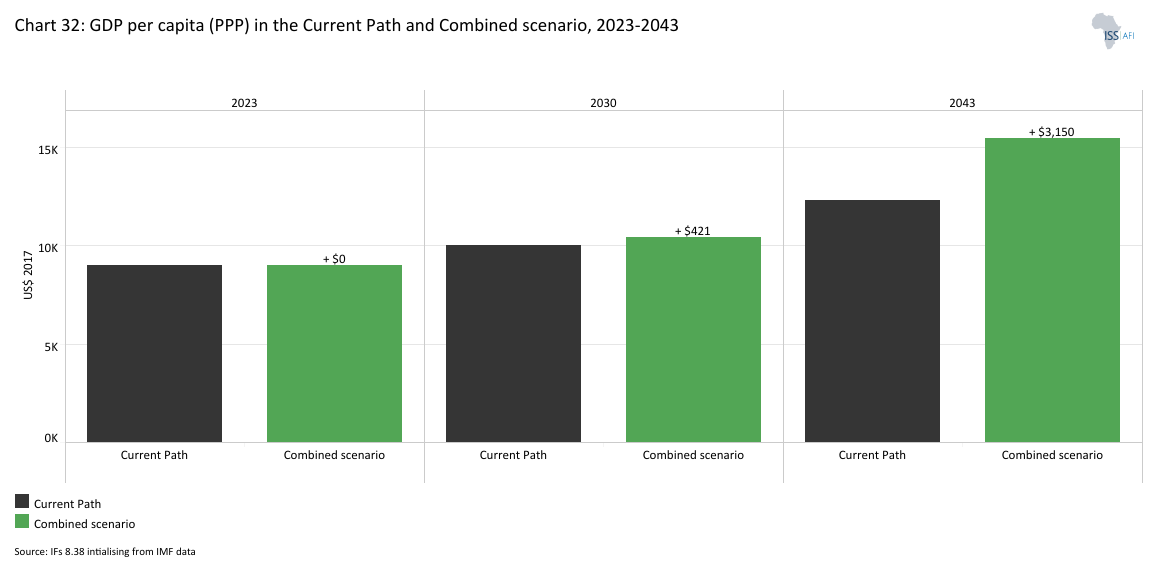
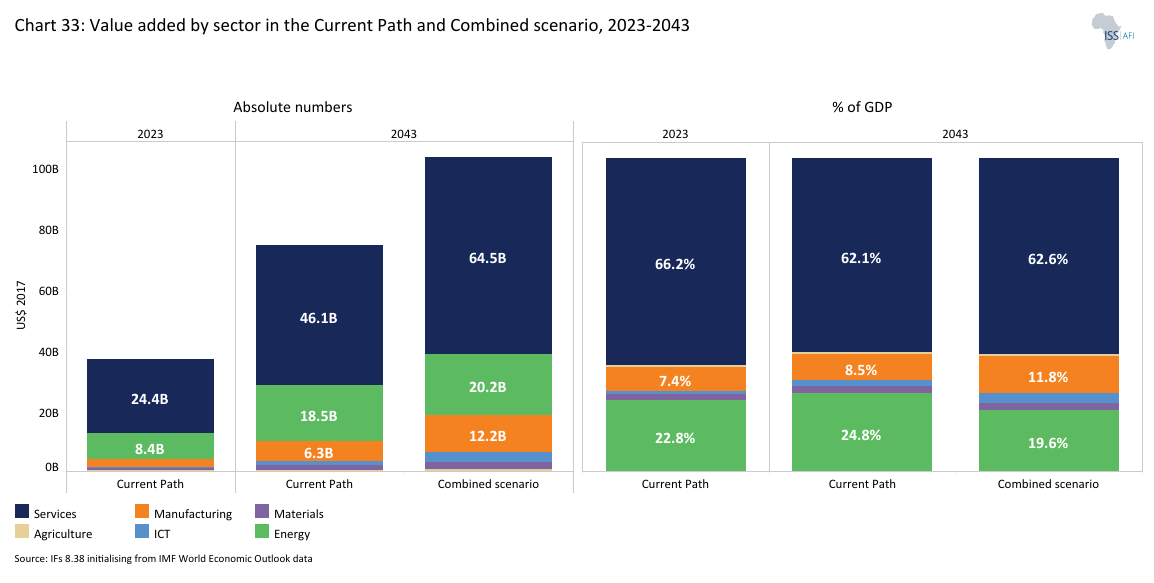
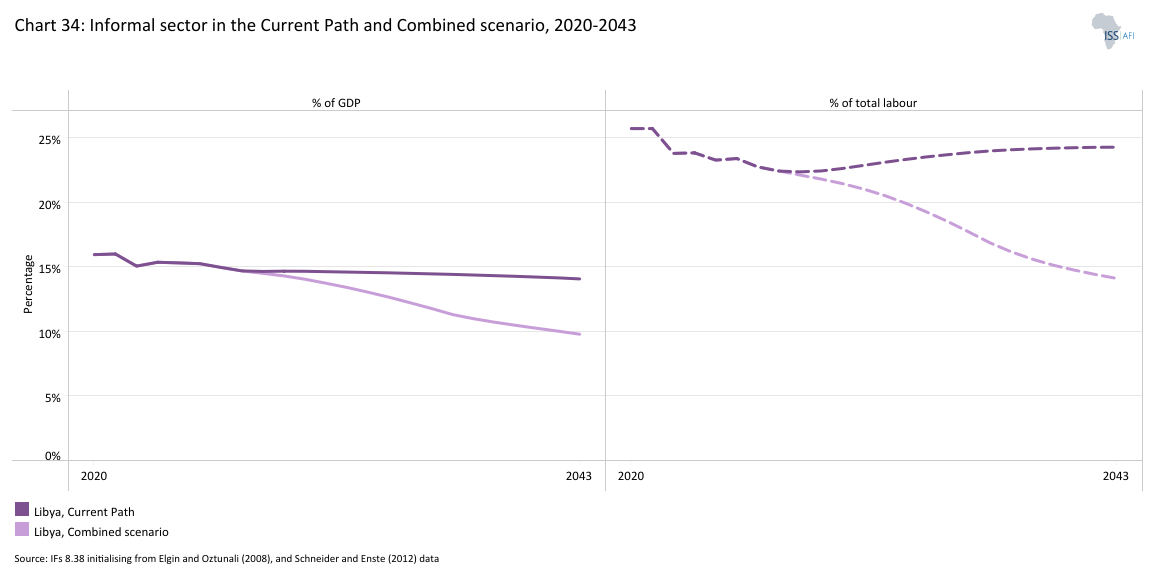
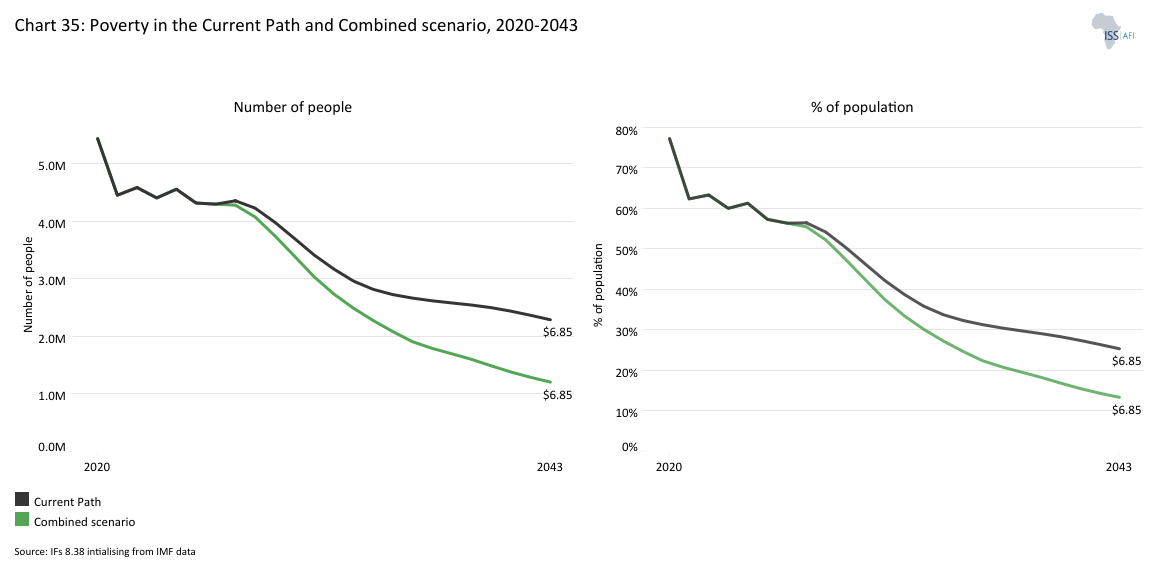
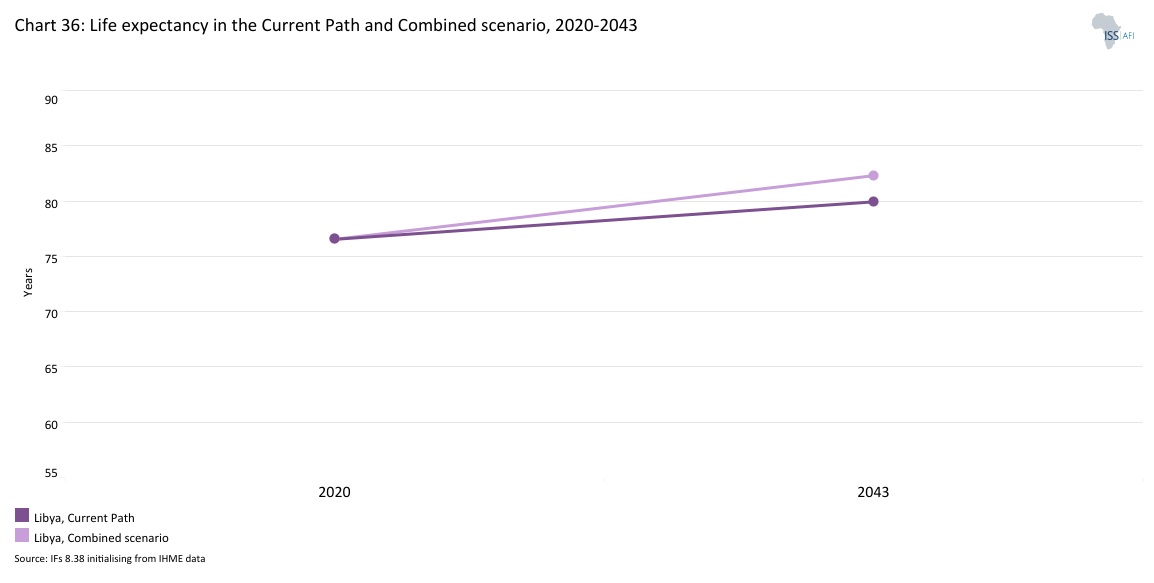
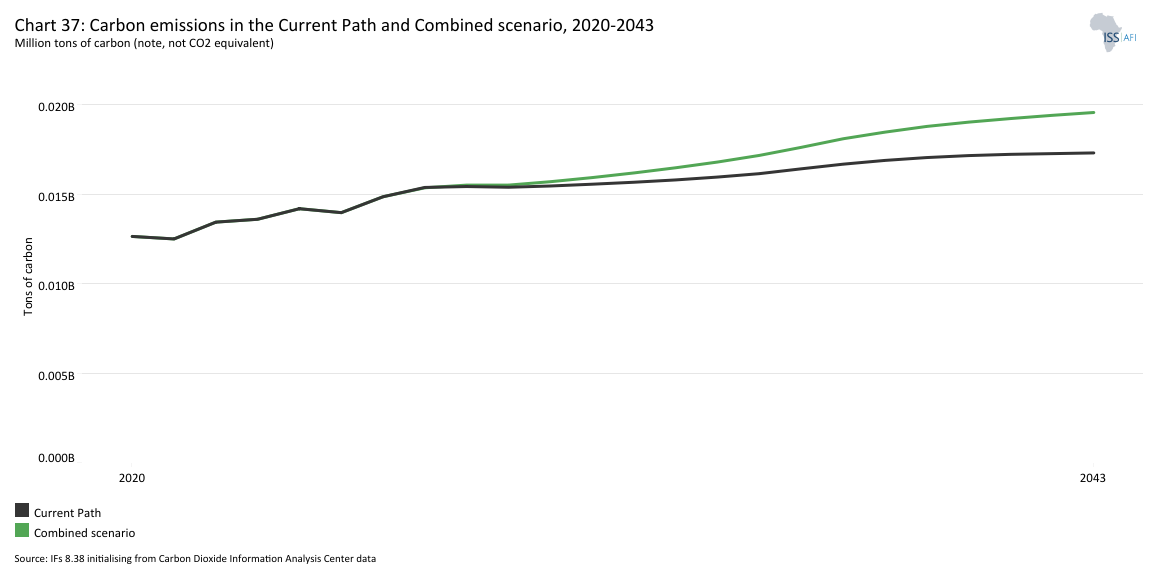
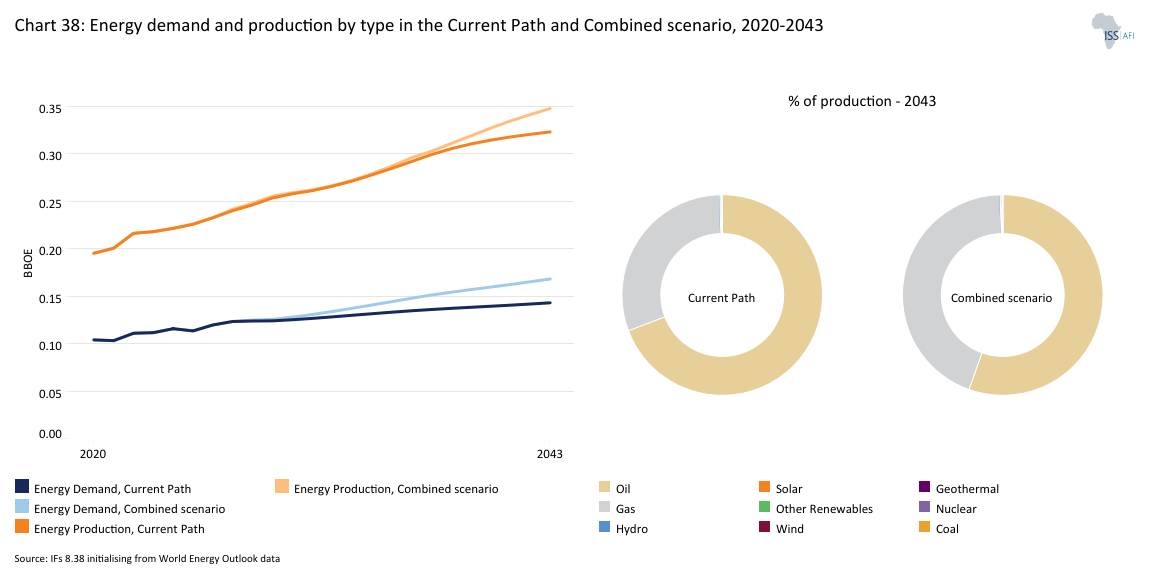
Chart 1 is a political map of Libya.
Libya is classified as an upper-middle-income country (UMIC) located in North Africa, bordered to the north by the Mediterranean Sea, to the west by Tunisia and Algeria, to the south by Niger and Chad, and to the east by Sudan and Egypt.
Libya is the fourth-largest country in Africa (after Algeria, DR Congo and Sudan) and the 17th-largest in the world in terms of land surface, covering an area of approximately 1.76 million km², about 1.2% of the world's land surface. However, despite its vast land area, most of Libya's territory is desert, notably part of the Sahara, with limited arable land mostly located along the Mediterranean coast.
The country’s Mediterranean coastline extends over 1 770 kilometres, making it the longest in Africa’s northern region. Because the Mediterranean Sea directly links Libya to Europe, the country is heavily impacted by the flow of migrants passing through or seeking work to finance their journey to Europe.
Libya’s geography is dominated by vast desert plateaus covering most of the national territory, including the Sahara, with only a narrow coastal plain supporting significant settlement and agriculture. The country experiences a hot, arid climate in the interior, while the coastal strip enjoys a more temperate Mediterranean climate with seasonal rainfall rarely exceeding 400 millimetres annually. Rainfall is highly variable and drought-prone, further constraining agricultural production and water availability.
Libya shares borders with six countries, which positions it as a strategic transit point between North Africa, the Sahel and the Mediterranean region. Its relationships with neighbours are shaped by historical migration, trade and security dynamics. Libya is a member of the African Union (AU), the Arab Maghreb Union (AMU), the Common Market for Eastern and Southern Africa (COMESA) and one of the 12 members of the Organisation of Petroleum Exporting Countries (OPEC). The country holds the largest proven oil reserves in Africa, about 2.8% of the world’s proven crude oil reserves. In 1998, former president Muammar Gaddafi established the Community of Sahel-Saharan States (CEN-SAD) that became the most recent among the eight regional economic communities recognised by the AU, with its secretariat originally located in Tripoli but relocated to N'Djamena, Chad in 2020. CEN-SAD and AMU have faced significant operational and political challenges, including overlapping memberships with other regional economic communities, political instability in member states, limited financial resources and tensions between member states.
Prior to the civil war, Libya exerted considerable regional influence through its oil exports and its role in regional migration and security arrangements, particularly as a route for trans-Saharan migration to Europe, but was also allegedly involved in the internal affairs of neighbours.
The country is administratively divided into 22 districts, known as shabiyat, with Tripoli serving as the capital and the largest city. Benghazi is the second-largest city and an important administrative and economic centre. Over 76% of the population resides in urban areas, particularly along the coastal belt, while the desert interior supports only sparse, largely nomadic populations, such as the Tuareg and Tebu communities. Infrastructure development is concentrated in coastal cities, while the rural interior remains underdeveloped.
The estimated total population in 2023 was about 7.3 million, with a median age of 28.3 years. Approximately 28.1% of residents are under the age of 15, reflecting a youthful demographic profile shaped by historically high fertility rates, although these have begun to decline.
Libya’s political history is marked by Italian colonisation, independence in 1951 under King Idris I, the 1969 military coup led by Muammar Gaddafi and the collapse of the Gaddafi regime during the 2011 uprising. The subsequent decade has been characterised by political fragmentation, recurring civil conflict and a lack of unified national institutions. The country remains in a prolonged transitional phase, with rival administrations competing for legitimacy and intermittent efforts at national reconciliation. Libya’s current governance structure is a contested hybrid system with parallel institutions in the east and west, weak separation of powers and a judiciary facing capacity constraints. Major constitutional moments include the adoption of an interim constitutional declaration in 2011 and ongoing debates over a permanent constitution.
Libya’s economy is heavily dependent on oil, which accounts for over 90% of government revenues and export earnings. The GDP at market exchange rate was estimated at US$36.8 billion in 2023, although output remains volatile due to political instability and recurrent interruptions in oil production.
With a Gross National Income (GNI) per capita of US$7 570 in 2023, Libya has maintained its upper-middle-income country status since the post-1989 World Bank income classification. GDP per capita in 2023 was approximately US$9 988, yet this figure conceals wide disparities between those with access to public-sector salaries in urban areas and those reliant on informal or subsistence activities in rural regions. The informal economy, encompassing unregistered trade, informal transport and agricultural work, is estimated to comprise up to 15.4% of GDP.
The country’s social context is marked by rising poverty and vulnerability, especially among internally displaced people, the unemployed and residents of conflict-affected areas. The collapse of state services and the expansion of the informal sector during the civil war have eroded living standards for many, despite Libya’s substantial oil wealth.
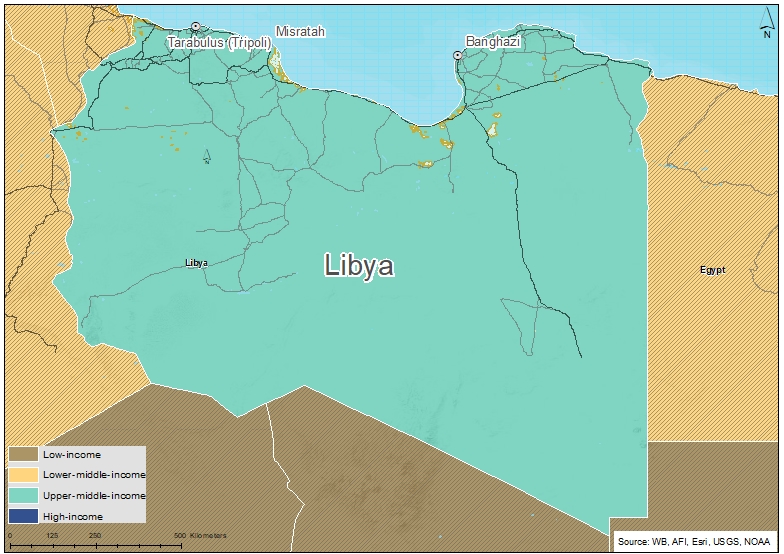
Chart 2 presents the Current Path of the population structure, from 1990 to 2043.
A country's population characteristics play a crucial role in shaping its long-term social, economic and political foundations. Therefore, analysing a nation's demographic profile provides valuable insight into its potential for development.
Libya includes a diverse population made up of various ethnic groups, including Arabs, Berbers (Amazigh), Tuareg, Tebu and smaller communities of sub-Saharan African descent. Amazigh and Arab account for about 97% of the population. Libya has long been a society where tribal affiliation carried greater weight than a unified national identity. Similar to Somalia, a person’s clan or tribal ties have traditionally served as the main source of status, security and access to resources.
Although Arabic is the official language and Libyans share a common religious and cultural foundation rooted in Islam and Arab-Berber traditions, the country remains deeply fragmented. Its various regions and tribes maintain distinct customs, dialects and historical trajectories, which continue to shape social and political life. While these groups have distinct languages, customs and historical experiences, they all share Libyan citizenship and are bound by a common national identity tied to the country's borders, institutions and historical trajectory.
Libya’s population structure reveals a transition from a predominantly youthful society towards a more mature and ageing demographic profile. In 1990, the population was 4.4 million, with 41% under 15 years, 30% aged 15-29, 26% aged 30-65, and less than 3% over 65. In 2023, the total population rose to 7.3 million.
In 2012, Libya experienced a significant population decline of approximately 164 000 people, largely as a direct consequence of the civil war. Rising conflict-related mortality, combined with mass flight across the country’s borders, reshaped the demographic landscape. Thousands of Libyan families, along with large numbers of migrant workers, most of them of working age, sought refuge in neighbouring countries to escape the violence and instability. Historically, Libya has been a key country of destination in North Africa, attracting labour not only from neighbouring countries but also from Western Africa, the Middle East and South Asia. Before 2011, an estimated 2.5 million migrants were employed across key sectors, including services (healthcare, domestic work and retail), industry (construction and light manufacturing), energy (oil production and related services) and agriculture.
The toll of the conflict was severe; an estimated 21 490 persons were killed, 19 700 injured and 435 000 displaced from their homes. These dynamics disproportionately affected young adults, particularly men, removing a vital segment of the labour force at a critical stage of national development. As a result, the population aged 15-29 fell by about 13% in 2012, dropping from around 1.7 million in 2011.
In the years leading up to the 2011 revolution, Libya was home to an estimated 1.4-2.5 millon migrant workers, the majority originating from sub-Saharan Africa, Egypt and Asia. They were employed across key sectors such as oil, construction and services, forming the backbone of much of the country’s labour force. Once the conflict broke out, within just a few months, around 790 000 migrant workers and their families left the country, seeking safety in neighbouring states including Tunisia, Egypt and Niger.
Interestingly, while mortality and displacement weakened the youth and working-age population, the fertility rate rose by about 3.4% between 2011 and 2012. This suggests that, despite the turmoil, Libyan families may have turned to higher fertility, whether as a coping mechanism in uncertain times, a demographic rebound effect or a reflection of displaced households returning to traditional social norms. Libya’s traditional social norms encourage larger families and strong kinship ties.
Libya’s population will reach 9 million in 2043, with the under-15 cohort dropping further to 20.6%. The 15-29-year-old group remains significant at 21.7%, adults aged 30-64 constitute 44%, and the population over 65 increases rapidly to 13.8%. This progression signals a declining youth dependency ratio and a growing elderly cohort.
The demographic transition underway in Libya is typical of upper-middle-income Africa, but the country’s shift is more pronounced. In 2023, Libya’s median age was about 28.3 years, with roughly 28% of the population under 15 and 5.1% over 65, reflecting high fertility in previous decades and a gradual decrease in the total fertility rate.
Urbanisation is a defining feature of Libya’s demographic profile. In 2023, about 77% of the population resided in urban centres, primarily along the Mediterranean coast in Tripoli and Benghazi. The rural population is concentrated in the desert interior among nomadic groups such as the Tuareg and Tebu. The urban concentration intensifies the demand for employment, services and infrastructure among youth and working-age adults. At the same time, it facilitates the delivery of essential services such as water, sanitation, electricity, healthcare and education, since concentrated populations reduce the per-capita cost of infrastructure. However, the rising elderly share signals increasing needs for social protection and healthcare in urban zones.
Libya’s evolving age structure has direct implications for economic and social development. The expansion of the working-age population since 1990, from 54% to 67% in 2023, creates a window for a potential demographic dividend. When the ratio of the working-age population to dependants (children and elderly) is 1.7 to one or higher, countries often experience more rapid growth, known as the demographic dividend, provided the workforce is appropriately skilled and absorbed in the labour market. Libya has clear potential given the positive ratio of its working-age population to dependants. In 2023, Libya’s ratio of working-age population to dependants was estimated at 2:1, meaning there were two individuals of working age for every one dependant.
Additionally, labour market reforms are essential to create a conducive environment for job creation and economic growth. Furthermore, as the working-age population peaks, planning for future healthcare needs becomes increasingly important to ensure that the anticipated rise in chronic diseases associated with ageing does not overwhelm existing systems. On the Current Path, Libya’s ratio will decline slightly to the ratio of 1.9:1 by 2043.
Compared to most African countries, Libya has a small youth bulge at 34% in 2023 - defined as the ratio of the population between 15 and 29 years to the total adult population (15+ years of age). In addition to the requirement for more spending on education, health services and job creation, a large number of young adults can lead to positive political change in a country through youth activism, but they can also carry the seeds for socio-political instability in the absence of economic opportunities. On the Current Path, Libya’s youth bulge will decline to 27.3% by 2043.
Strategic investments in education, economic diversification and healthcare are critical to ensuring that Libya's demographic transition supports sustainable development and enhances overall societal well-being.
Chart 3 presents a population distribution map for 2023.
The civil war profoundly reshaped Libya’s population distribution, both by driving large numbers of people out of the country and by displacing communities within its borders. At the height of the conflict between 2011 and 2020, hundreds of thousands of Libyans were uprooted from their homes, often forced to move multiple times in search of safety. By mid-2020, the number of internally displaced persons (IDPs) peaked at around 425 000. Most of these displacements originated in front-line cities such as Tripoli, Benghazi, Sirte and Misrata - urban centres that bore the brunt of intense fighting, airstrikes and siege conditions. However, following the 2020 ceasefire, a gradual return movement emerged, with many households striving to resettle in their hometowns and reconstruct their lives in the aftermath of war.
In 2023, the country's overall population density stood at approximately 0.04 persons per hectare, while urban areas recorded a significantly higher average density of 23.8 persons per hectare. Libya’s population density remains low compared to other African UMICs. Libya's population distribution is significantly influenced by its geographical and climatic conditions, with approximately 90% of the population concentrated along the Mediterranean coast, a region that accounts for less than 10% of the country’s total land area. This concentration is largely attributed to the more hospitable climate and the availability of resources, contrasting sharply with the sparsely populated interior desert areas that dominate over 90% of the country's geography.
The coastal city of Tripoli is the capital and the largest city of Libya, with a population of over one million people (more than 15% of the total population). Tripoli serves as the nation’s political, economic and cultural centre. Benghazi is the second-largest city with a population of more than 600 000 people. These two coastal cities serve as major population hubs, reflecting not only historical settlement patterns but also the contemporary socio-economic pull factors such as employment opportunities, education and healthcare services that these urban centres provide.
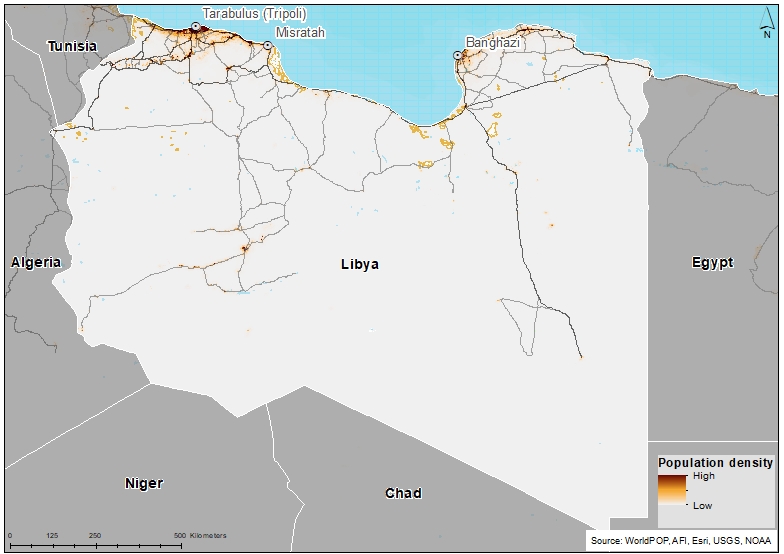
Chart 4 presents the urban and rural population in the Current Path, from 1990 to 2043.
When strategically managed, urbanisation can serve as a powerful engine for economic growth and development. It facilitates the efficient delivery of essential services such as education, healthcare, housing and transportation, while also creating environments that foster innovation, stimulate entrepreneurship and enhance overall productivity. In Libya, the continued expansion of urban cities presents a valuable opportunity to diversify the economy and improve living standards.
However, this potential remains constrained by several persistent challenges that have all been accentuated by the civil war. These include electricity shortages, underdeveloped infrastructure, a mismatch between available skills and labour market demands, cumbersome and inefficient regulatory frameworks, and limited access to financial services for small and medium enterprises. Together, these barriers weaken the economic dynamism of urban areas and contribute to rising unemployment and social inequality.
In 1990, 72.2% of the population lived in urban areas, with 27.8% residing in rural regions. By 2023, the urban share had reached 76.8% and the rural population had declined to 23.2%. This transition is linked to Libya’s oil-driven economic transformation that spurred rural-urban migration, especially toward major coastal cities such as Tripoli and Benghazi. The desert interior, by contrast, supports only scattered rural populations, predominantly among Tuareg and Tebu nomadic groups.
Libya’s urbanisation is among the highest in North Africa. In 2023, the country’s urban population share exceeded the North African average of approximately 52%. Libya’s level is also significantly above the global average of 57%. Compared to other UMICs in Africa, the urban population share in Libya is notably higher than Egypt (43%) and marginally above Algeria (74%). Within the UMIC in Africa group, urbanisation accelerated from 52.1% in 1990 to 69.7% in 2023, and will reach 76.5% by 2043. Libya’s urbanisation trajectory is both earlier and more pronounced than the income group average, which only reached an urban majority in 1988.
The rapid urbanisation process exerts mounting pressure on Libya’s urban infrastructure, housing and public services.
Chart 5 presents GDP in market exchange rates (MER) and growth rate in the Current Path, from 1990 to 2043.
The Libyan economy is heavily dependent on its oil sector, which accounts for an estimated 97% of government revenue and approximately 93% of total export value in 2023. This heavy dependence makes the economy highly vulnerable to internal and external shocks. Ongoing rivalries between the Government of National Unity in Tripoli and eastern-based factions have repeatedly triggered armed blockades, acts of sabotage and closures of vital oil infrastructure.
As a result, oil production, which had exceeded 1.7 million barrels per day prior to the start of the 2011 civil war, has fluctuated wildly, sometimes plummeting to below 100 000 barrels per day. These disruptions create fiscal instability, reduce the state’s ability to fund essential services and undermine public sector salaries, all of which erode public confidence and economic performance.
Efforts to diversify the economy have been limited, and the oil sector's dominance continues to shape Libya's fiscal landscape. Addressing this overreliance remains a critical challenge for the country's long-term economic development.
Libya’s GDP trajectory at market exchange rates, measured in constant 2017 US dollars, demonstrates persistent volatility, shaped by oil dependence and political instability. In 1990, Libya’s GDP was US$52.1 billion. By 2023, GDP had contracted to US$36.8 billion, reflecting a decline of 29.36% since 1990, with the most severe contractions occurring during the 2011 civil conflict and the 2020 crisis linked to renewed fighting and the COVID-19 pandemic. The GDP fell sharply to US$44 billion in 2011, rebounded to US$82.2 billion in 2012, then dropped again as renewed instability and oil production disruptions persisted. By 2043, GDP will reach US$74.3 billion.
In sum, Libya’s GDP path from 1990 to 2043 is defined by conflict-driven contractions, oil-market fluctuations and periods of partial recovery. The country’s unique combination of a young, urbanising population and a highly oil-dependent, informalised economy explains the pronounced gap between its actual GDP growth and the more stable, diversified expansion observed amongst its UMIC peers in Africa.
Chart 6 presents the size of the informal economy as per cent of GDP and per cent of total labour (non-agriculture), from 2020 to 2043. The data in our modelling are largely estimates and therefore may differ from other sources.
The informal sector represents a critical pillar of Libya’s economy, providing income and livelihoods for a large share of the population, particularly among low-income groups and rural communities. In the absence of sufficient formal job opportunities, many Libyans rely on informal activities as their primary source of employment and income security.
A substantial proportion of the labour force is engaged in informal work, with strong concentrations in agriculture, small-scale trade, manufacturing, transport, construction and a wide range of service activities. These sectors often operate outside official regulation and taxation but are essential to household survival, especially in regions where formal employment is scarce or disrupted by conflict and instability.
Often characterised by unregulated and unrecorded activities, the informal sector plays a significant role in many developing countries by providing employment and income to a substantial portion of the population. Beyond its role in job creation, the informal economy functions as a social safety net, absorbing workers excluded from the formal labour market, such as youth, women and those with limited education or skills. While informal enterprises typically suffer from low productivity, limited access to finance and a lack of social protections, they remain indispensable for sustaining livelihoods and maintaining economic resilience in times of crisis.
Libya's reliance on oil, a sector that traditionally offers limited employment opportunities outside formal state-controlled enterprises. Nonetheless, the persistent economic instability and lack of diverse formal employment options likely drive many into informal work, particularly in urban areas and cross-border trade. With the limited formal sector opportunities, most of the workforce in Libya is employed in the low-value-added informal sector. Around 23.8% of the total labour force was in the informal sector in 2023, just about 0.8 percentage points above the average for UMICs in Africa.
The size of Libya’s informal economy was estimated at 15.4% of GDP in 2023, slightly above the average of 15.1% for UMICs in Africa. On the Current Path, the size of the informal sector will decline to 14.1% in 2043, a figure that will be slightly below the estimated average for UMICs in Africa in that year.
Chart 7 presents GDP per capita in the Current Path, from 1990 to 2043, compared with the average for the Africa income group.
With a GNI per capita of US$7 570 and a GDP per capita of US$8 988 (PPP, and constant 2017 US$) in 2023, Libya has maintained its UMIC status. These figures underscore Libya’s sustained relative position within the UMIC category. However, the country’s economic performance has not returned to its pre-conflict peak. In 2010, just prior to the outbreak of civil unrest, Libya’s GDP per capita stood at US$12 800 (PPP). Despite post-2011 recovery efforts, recurring political instability, disruptions in oil production and weakened institutions have hindered sustained economic growth, causing per capita income levels to remain below their historical high. This stagnation highlights the structural challenges facing the Libyan economy and the need for comprehensive reforms to restore long-term prosperity once the war ends.
With a projected modest increase in GDP growth coupled with slower population growth by 2043, Libya’s Current Path shows a slight increase in GDP per capita to US$13 740. While slower population growth can alleviate pressure on public services and employment markets, the limited pace of economic transformation means that gains in per capita income will remain constrained. As a result, Libya’s forecast GDP per capita in 2043 will fall short of the projected African average for UMICs in Africa, which is forecast to reach approximately US$14 480. This disparity underscores the need for deeper structural reforms, economic diversification and improved governance to enhance productivity and ensure that economic growth translates into broad-based improvements in living standards.
Chart 8 presents the rate and numbers of extremely poor people in the Current Path from 2020 to 2043.
Monetary poverty only tells part of the story, however. In addition, the global Multidimensional Poverty Index (MPI) measures acute multidimensional poverty by measuring each person’s overlapping deprivations across 10 indicators in three equally weighted dimensions: health, education and standard of living. The MPI complements the international US$2.15 a day poverty rate by identifying who is multidimensionally poor and also shows the composition of multidimensional poverty. The headcount or incidence of multidimensional poverty is often several percentage points higher than that of monetary poverty. This implies that individuals living above the monetary poverty line may still suffer deprivations in health, education and/or standard of living.[x]
According to the 2024 Global MPI report, approximately 2% of Libya’s population was classified as multidimensionally poor — individuals deprived in multiple overlapping areas such as health, education and living standards. An additional 11.4% of the population was identified as vulnerable to multidimensional poverty, meaning they were on the brink of experiencing acute deprivations.
Using the international extreme poverty threshold of US$2.15 per person per day, around 4.5% of Libyans, or roughly 331 760 individuals, were living in extreme poverty in 2023. Encouragingly, this share will decline significantly to just 0.5%, or approximately 45 350 people, by 2043.
At the US$6.85 per day poverty line, which is more reflective of living costs in UMICs, around 60% of Libyans, equivalent to nearly 4.4 million people, were living below this threshold in 2023. While this rate will decline to 25.3% by 2043, the number of people classified as poor under this definition will still total approximately 2.3 million. These figures reflect the broader socio-economic challenges that persist despite Libya’s upper-middle-income status and highlight the complexity of poverty in Libya. While extreme poverty is expected to decline, a large portion of the population will remain economically vulnerable. This underscores the importance of not only pursuing macroeconomic growth but also implementing inclusive policies that improve education, healthcare, housing and job opportunities, especially for marginalised and rural communities.
Libya’s progress in poverty reduction remains contingent on an end to the civil war, political stability, effective governance and sustained economic growth. The persistence of a sizeable population below the poverty line underscores continued vulnerability to renewed conflict, fiscal shocks and institutional fragility.
Chart 9 depicts the National Development Plan of Libya.
Libya’s path toward recovery and progress is being guided by two major strategic frameworks: the National Development Agency’s (NDA) Vision 2030 and the more expansive National Vision 2044. These initiatives aim to rebuild the nation's infrastructure, diversify its economy and foster sustainable growth after years of conflict.
Libya’s Vision 2030, spearheaded by the National Development Agency (NDA), is more than a policy framework; it is a national compass guiding the country toward shared prosperity, inclusive growth and meaningful global engagement. Since its launch in May 2025, NDA has emphasised that this vision is intended not merely as a set of goals but as a transformational roadmap for rebuilding Libya’s institutions, diversifying its economy and improving citizens’ quality of life. The vision is structured around four major pillars and flagship goals:
- Diversify the economy away from heavy dependence on oil. Focus on sectors including agriculture, industry, logistics, renewable energy, healthcare and education.
- Infrastructure projects:
- Build a strategic road network of about 1 000 km by 2030.
- Modernise water networks.
- Upgrade and expand airports (e.g. Benghazi International Airport, Sirte Gulf International Airport).
- Improve basic services: Investments in sanitation, renewable energy (especially solar), healthcare and education.
- Enhance regional stability and external partnerships: The Vision emphasises Libya’s role in reducing irregular migration pressures and sees foreign investment partnerships (e.g. with the UK) as important for stability and growth.
In sum, Vision 2030 reflects the collective determination of Libya to rise above its past challenges, rebuild its foundations and reimagine its role on the global stage. It seeks to transform national aspirations into tangible outcomes by driving economic diversification, modernising critical infrastructure, expanding access to essential services, strengthening social inclusion and advancing institutional reform. Central to this vision is the recognition that sustainable progress cannot be achieved in isolation; it requires dynamic partnerships within Libya’s regions, across its society, and with the wider international community to ensure that growth is both inclusive and resilient.
The Technical Page explains the eight sectoral scenarios and their relationship to the Current Path and the Combined scenario. Chart 10 summarises the approach.
Chart 11 presents the mortality distribution in the Current Path for 2023 and 2043.
There is a strong correlation between population size and health. A country’s health status significantly affects fertility, mortality, and morbidity rates. Conversely, rapid population growth increases the demand for essential services such as nutrition and healthcare.
For Libya, more than a decade of civil war has left its critical infrastructure severely damaged, with many essential systems on the brink of collapse. Although a ceasefire agreement was reached in 2020, occasional violent clashes continue to disrupt stability. At the peak of the conflict, hundreds of thousands were displaced, while thousands more were killed or injured.
Among the sectors most devastated by the conflict is health care. Medical facilities were frequently targeted by armed groups, forcing numerous hospitals and clinics to close or suspend operations. In fact, according to the World Health Organisation (WHO), Libya recorded the highest number of deaths from attacks on health-care facilities globally in 2019. Years of violence also triggered a mass departure of foreign health professionals, eroding the quality and availability of care. The situation deteriorated further during the COVID-19 pandemic, exposing the severe under-resourcing of Libya’s health system. Today, hospitals and clinics remain in poor condition, and health workers continue to grapple with critical shortages of medicines, equipment and essential supplies.
In 2022, an assessment of 116 primary health-care facilities, conducted jointly by the WHO and the Primary Health Care Institute, revealed widespread shortages of basic medicines—including antibiotics, insulin, and blood pressure treatments—across the majority of facilities.
Despite continued assistance from WHO and other international partners, Libya lacks a centralised health information system to track health indicators, assess service capacity or monitor supply distribution. Political divisions and budgetary deadlock have further hampered progress, with failure to agree on health funding contributing to the sector’s ongoing decline. As a result, many Libyans who can afford it increasingly seek medical treatment abroad to avoid navigating a system that remains chaotic, fragmented and unable to meet even basic needs.
Libya is in an advanced stage of the epidemiological transition, having maintained a dominant noncommunicable diseases (NCD) burden over communicable diseases (CDs) for approximately three decades, with chronic illnesses such as cardiovascular diseases, malignant neoplasms, diabetes and cancer constituting the primary causes of morbidity and mortality.
The growing burden of NCDs poses significant challenges for Libya's healthcare system, requiring substantial investments to build the capacity needed to address this evolving health landscape. In 2023, NCDs accounted for 93.7% (equivalent of 24 150) of total deaths in Libya. Cardiovascular disease remains the leading cause of death in Libya, accounting for 12 060 in 2023, and will rise to 24 270 by 2043, more than doubling the 2023 level. Malignant neoplasms, the second leading cause, accounted for 5 480, with an increase to 10 810 million by 2043. The growth in mortality from these causes is steady and accelerates in the later years.
CDs present a contrasting pattern. Diarrhoeal diseases have declined significantly from 300 deaths in 1990 to 100 in 2023, with this low rate persisting through 2043. HIV/AIDS mortality and malaria deaths remain negligible, with HIV/AIDS deaths at about 100 in 2023.
In 2023, an estimated 76.7% of the population lacked access to safely managed sanitation, and 25.8% lacked access to safely managed water. On the Current Path, 64.4% of the population will likely remain without safely managed sanitation, and 16.3% will remain without safely managed water in 2043.
Maternal mortality has increased from 39 deaths per 100 000 births in 1990 to 63.9 in 2023. However, this rate remains far below the average for both UMICs in Africa and the continent as a whole. The increase in maternal mortality can be attributed to various factors, including prolonged conflict and political fragmentation. On the Current Path, Libya's maternal mortality rate is forecast to remain below the United Nations (UN) 2030 Sustainable Development Goal (SDG) of fewer than 70 deaths per 100 000 live births.
Chart 12 presents the infant mortality rate in the Current Path and in the Demographics and Health scenario, from 2020 to 2043.
The infant mortality rate, defined as the number of deaths of infants under one year of age per 1 000 live births, is a critical indicator of child health and overall population well-being. In Libya, this rate has seen a pronounced and sustained decline over the past six decades. In 1960, Libya’s infant mortality rate stood at 139.4 per 1 000 live births, mirroring high levels observed across the region to just 35 in 1990, marking sustained improvements in child survival outcomes as basic health services expanded and vaccination campaigns reached wider coverage.
From 1990 onwards, the pace of decline moderated but remained steady. By 1996, Libya had already met the UN 2030 SDG target of fewer than 25 deaths per 1 000 live births. In 2023, Libya’s infant mortality rate reached 7.3 per 1 000, which is substantially lower than the average of 24.1 observed in UMICs in Africa in the same year. This difference illustrates Libya’s comparatively advanced progress in reducing infant deaths despite the country’s ongoing social and economic instability.
In the Current Path, infant mortality in Libya will further decline to 4.9 deaths per 1 000 live births by 2043. With the interventions in the Demographics and Health scenario, Libya’s infant mortality rate will decrease to 4 deaths per 1 000 live births in 2043.
Chart 13 presents the demographic dividend in the Current Path and in the Demographics and Health scenario, from 2020 to 2043.
The demographic dividend, which refers to economic growth resulting from changes in a country's population structure, is influenced by factors such as declining fertility rates and improvements in health and education. With fewer dependants (children under 15 and adults 65 and older) to support, families and governments can allocate more resources to savings, education, infrastructure and economic development, driving accelerated growth.
Demographic dividend is attained when the ratio of working-age persons (15-64 years of age) to dependants increases from 1.7:1 and above. However, attaining the demographic dividend does not automatically translate to economic growth. Realising the potential demographic dividend depends on simultaneous policy-driven improvements in employment, governance and basic service provision.
Libya entered a potential window of opportunity in 2001. However, the country has yet to convert this demographic advantage into faster economic growth and higher income levels. In 2023, the ratio had improved to 2:1. Still, the country had experienced a steady decline in GDP per capita for several years, given the political fragmentation and the impact of COVID-19. The Libyan government must ensure that the growing labour force is adequately skilled and effectively integrated into the economy.
Under the Current Path, the ratio will slightly decline to about 1.9:1 in 2043. However, with the implementation of the Demographics and Health scenario, the ratio of the working-age population to dependants will increase slightly, reaching 2:1 in 2043.
Chart 14 presents crop production and demand from 1990 to 2043.
Agriculture plays a small role in Libya’s economy, with its contribution to GDP falling from about 5.2% in 2002 to just 0.7% in 2023, as the country has become increasingly dependent on oil. This shift has made the country heavily reliant on food imports to meet domestic demand. Since these imports are paid for in foreign currency, Libya’s reliance on oil exports to generate foreign exchange becomes even more critical. Such dependence creates vulnerability: when oil revenues fall, the ability to finance food imports weakens, driving up prices and heightening food insecurity. Moreover, a weak or unstable exchange rate further raises the cost of imported goods, placing additional strain on households and worsening the overall cost of living.
Libya’s agriculture sector faces significant challenges, chief among them the scarcity of both arable land and water. Only around 1% of Libya’s land—approximately 1.72 million hectares—is considered arable, and the country’s low annual rainfall results in very modest crop yields.
Because rainfall is insufficient for most crops, irrigation is essential. Yet the sector has historically received limited financial support. In 2023, agriculture accounted for just 11.6% of total national investment, which was valued at US$489 million. However, this allocation met the African Union's Comprehensive Africa Agriculture Development Programme (CAADP) recommendation, which advises member countries to allocate at least 10% of their national budgets to agriculture and rural development and to achieve agricultural growth rates of at least 6% per annum.
The Great Man-Made River (GMMR), launched in the 1980s, is a vast water-supply project that has enabled limited agriculture in Libya’s desert regions. It comprises an extensive network of underground pipes that transport fossil groundwater from deep Saharan aquifers to coastal cities and farmland. While it has been vital for irrigation and urban water needs, the reliance on fossil water, a finite, non-renewable resource, raises serious concerns about the long-term sustainability of the project and the practices it supports. However, of the estimated 470 000 hectares (equivalent to 27.3% of the land considered arable) equipped for irrigation, only about 67.2% is actually irrigated. Enhancing irrigation systems and implementing effective water management strategies are essential to addressing these challenges and boosting agricultural productivity.
Despite these constraints, agriculture still employs roughly 17% of Libya’s workforce, a figure that will decline to around 16% by 2043. However, its reduced economic role has left the country heavily reliant on food imports to meet domestic demand.
Climate change and political instability have deepened the sector’s underlying vulnerabilities. Rising temperatures, prolonged droughts and advancing desertification threaten agricultural productivity, while years of conflict have damaged infrastructure, displaced farmers and hindered policy continuity.
Despite persistent challenges, Libya cultivates a variety of crops, including wheat, barley, olives, dates, citrus, vegetables and other fruits. In 2023, total crop production reached nearly 2.6 million metric tons—enough to meet only about 36.7% of the national demand, estimated at 7 million metric tons. The remaining deficit of around 4.5 million metric tons was imported, leaving the country exposed to global commodity price volatility and potential supply disruptions. Nevertheless, this represents a notable improvement from 2019, when production stood at just 2.2 million metric tons.
In the Current Path, Libya’s crop production will slightly increase to 3 million metric tons in 2043, while the demand will reach about 8.9 million metric tons, resulting in a deficit of around 5.9 million metric tons. This growing shortfall will heighten the country's reliance on imports, with import dependency slightly declining from 68.1% of demand in 2023 to 67.5% in 2043.
Chart 15 presents the import dependence in the Current Path and the Agriculture scenario, from 2020 to 2043.
Libya’s agriculture sector holds untapped potential. Advanced technological innovations, such as desert-based irrigation systems, the adoption of hydroponics, vertical farming and precision agriculture, offer promising pathways to increase yields and reduce environmental pressures. With targeted interventions, stronger policy support and climate adaptation strategies, agriculture could play a pivotal role in ensuring Libya’s food security and reducing its dependence on imports.
The Agriculture scenario forecasts a more gradual, year-on-year reduction in import dependence compared to the Current Path. By 2043, crop yields will rise to 1.9 metric tons per hectare, representing a 34.9% increase compared to the Current Path.
The Agriculture scenario significantly reduces crop import dependency, lowering it to approximately 55.7% of demand in 2043, compared to 67.5% in the Current Path. This represents an 11.8 percentage point reduction compared to the Current Path for that year.
By embracing innovation and fostering a supportive policy environment, Libya could revitalise its farming industry, safeguard water resources and harness agriculture as a driver of sustainable growth.
Chart 16 depicts the progress through the educational system in the Current Path, for 2023 and 2043.
A population with a large proportion of youth demands substantial investment in education to drive economic growth and foster social development. Expanding access to quality education is essential for reducing poverty and managing population growth, particularly when every child has the opportunity to benefit from it.
Like many African nations, Libya’s education system is structured into three main phases: primary, secondary and tertiary education. Basic education, which is mandatory for all students, covers the first nine years of schooling—six years of primary education and six to seven years of secondary education. Secondary education is divided into two distinct cycles. The first is a three-year cycle that completes the compulsory “basic” education period (lower secondary), followed by a three- to four-year “intermediate” cycle (upper secondary). Progression to upper-secondary school requires students to achieve a minimum score of 50% in each subject.
Libyan citizens are entitled to free education at all levels, from primary school to university. Post-graduate studies are not free but subsidised. This policy was first established during Muammar Gaddafi’s rule and is sustained primarily through the country’s oil revenues. The language of instruction is Arabic. That said, the education system faces challenges, including a narrow curriculum, a shortage of qualified teachers, poor existing infrastructure and a strong reliance on rote memorisation over critical thinking. Inadequate infrastructure and the shortage of skilled, ICT-proficient teachers pose significant obstacles to the ongoing reform process.
The country’s population of approximately 7.3 million in 2023 included around 1.8 million students (all levels), over 880 210 of whom studied at the primary level and 308 210 at the tertiary level in the academic year 2023. This figure represents a rise of 92 670 compared to 2020, when enrolment was slightly below 1.7 million students.
Progress through the education system reflects a large drop-off at successive levels. Near-universal primary school entry is followed by a steady narrowing at each subsequent stage, culminating in a much smaller proportion of students completing tertiary education. Primary gross (or total) enrolment rates have remained above 100% for decades, reaching 104.6% in 2023 and projected to drop to 102.6% in 2043. This pattern indicates that almost all eligible children, including some outside the standard age range, are enrolled. This trend is mirrored in the UMICs in Africa, where the average primary enrolment was estimated at 105.2%. Primary net enrolment (i.e., of appropriate age) has also significantly increased to 90.3% in 2023, slightly below the average of 92.7% for UMICs in Africa. Libya's primary net enrolment will further increase to 96.2% by 2043, a figure that is forecast to remain below the average for UMICs in Africa.
The proportion of children completing primary education in Libya, however, trails enrolment figures. In 2023, Libya’s primary school completion rate stood at 93.3%—a strong performance, though slightly below the African UMIC average of 99.9%. The education ‘funnel’ narrows significantly at the transition to lower secondary school, where enrolment drops to 82.8%, nearly 12 percentage points lower than at the primary level. Completion rates highlight further attrition, while more than nine in ten pupils complete primary school, only about seven in ten finish lower secondary. The forecast suggests gradual improvement, with lower-secondary completion expected to reach 80.3% and enrolment 91.6% by 2043. This indicates progress, but also underscores the need to address bottlenecks in the transition from primary to secondary education if Libya is to close the gap with peer countries.
The transition to upper-secondary school represents another sharp narrowing in Libya’s education funnel. In 2023, gross enrolment fell to 71.7%, a notable drop from the lower secondary. However, the majority of those who do enrol tend to persist, with a completion rate of 56.2%, indicating relatively higher retention once students enter this stage. The greatest bottleneck emerges at the tertiary level. Although nearly half of young people (49.4%) were enrolled in higher education in 2023, only a small fraction, 14.7% completed their studies. Projections to 2043 suggest little improvement: enrolment will edge up slightly to 51.1%, while completion may fall marginally to 13.6%. This pattern highlights a critical challenge: Libya is relatively successful at getting students into tertiary education, but far less effective at seeing them through to graduation, undermining the potential returns on investment in higher education.
Chart 17 presents the mean years of education in the Current Path and in the Education scenario, from 2020 to 2043, for the 15 to 24-year age group.
The mean years of schooling among adults aged 15 to 24 serves as a strong measure of a nation’s human capital. In 2023, Libya ranked fifth in Africa, behind Mauritius, Tunisia, Gabon and Botswana, with an average of 10.8 years of education (8.9 years for males and 12.7 years for females). Projections indicate that, in the Current Path, this figure will rise modestly to about 11.3 years by 2043 (9.5 years for males and 13.2 years for females). In the Education scenario, the average will improve slightly more, reaching around 11.7 years (10 years for males and 13.4 years for females) in the same year.
Literacy is a cornerstone of socio-economic advancement, enabling individuals to participate fully in civic life and the modern economy. In Libya, literacy rates have undergone a remarkable transformation, rising from 60.2% in 1984 to 87.2% in 2023. These gains reflect decades of sustained investment in education, particularly during the latter half of the 20th century. Projections in the Education scenario suggest literacy will reach 92.9% by 2043, approximately 0.2 percentage points higher than under the Current Path.
A larger proportion of science and engineering (STEM) graduates can have far-reaching positive economic and social consequences, especially for a country like Libya seeking to diversify its economic capacity. In 2023, Libya had only 19.6% of STEM students among tertiary graduates. On the Current Path, the proportion will increase slightly to 19.8% in 2024. The Education scenario will increase the proportion of STEM students among tertiary graduates in Libya to 24.8% in 2043, five percentage points above the Current Path.
Chart 18 presents the value-add by sector as a share of GDP in the Current Path, for 2023 and 2043.
In Libya, the economic structure is characterised by the overwhelming dominance of the energy sector, with services as a close second contributor. The agriculture sector’s share of GDP has declined continuously, falling from 5.2% in 2002 to just 0.7% in 2023, and will reach 0.5% by 2043. This steady reduction reflects persistent arid climate conditions, limited arable land and severe water scarcity, all of which constrain agricultural productivity.
The materials sector, which includes non-energy extractive and processing industries, maintains a marginal role, accounting for 1.7% of GDP in 2023 and will rise only slightly to 2.2% by 2043. The information and communication technology (ICT) sector remains the smallest, at 1.1% in 2023 and will increase to 1.9% by 2043, indicating gradual digitalisation but insufficient to drive broad-based structural change.
The energy sector, dominated by oil and gas, contributed 22.8% of GDP in 2023 and will increase modestly to 24.9% by 2043. While diversification efforts aim to reduce this dominance, the economy will remain heavily reliant on hydrocarbons. Such dependence exposes Libya to significant vulnerabilities, not only from global oil price volatility but also from the recurring disruptions linked to domestic conflict.
Years of civil war and political instability have led to repeated shutdowns of oil fields and export terminals, damage to critical infrastructure and fluctuating production levels. These disruptions have undermined fiscal stability, weakened investor confidence and constrained the government’s ability to fund essential services and long-term development projects. As a result, Libya’s over-reliance on oil is compounded by conflict-related risks, leaving its economy highly exposed to both external shocks and internal instability.
The services sector, encompassing retail, transport, public administration and finance, accounts for 66.2% of GDP in 2023, remaining the largest single sector by a substantial margin. In the Current Path, the sector share will decline to 62.1% of GDP by 2043. This sector’s share had previously peaked at much higher levels, underscoring recent contractions linked to conflict and interruptions in public service delivery.
Manufacturing’s share of GDP has exhibited a gradual upward trend, rising from 3.1% in 2002 to 7.4% in 2023 and will reach 8.5% in 2043. This moderate expansion is underpinned by incremental investment, modest regulatory reforms and potential spillovers from oil-sector activities.
The NDP’s focus on economic diversification and private-sector development reflects official recognition of the need to expand manufacturing, particularly agro-processing, construction materials and light industry. The plan’s interventions target improved access to finance, streamlined regulations and technical support for small and medium enterprises (SMEs), aiming to shift more economic activity from informal to formal manufacturing. The forecast suggests that the informal sector still accounts for up to 15% of economic output, highlighting the scale of institutional and regulatory barriers to formal sector growth.
Chart 19 presents the contribution of the manufacturing sector to GDP in the Current Path and in the Manufacturing scenario, from 2020 to 2043. The data is in US$ and % of GDP.
Libya’s manufacturing sector has exhibited pronounced volatility over the past two decades, largely mirroring the country’s broader macroeconomic and political instability. In the early 2000s, the sector recorded a brief phase of expansion, with manufacturing value added rising from 3.1% of GDP in 2002 to nearly 6% in 2003. This surge, however, proved unsustainable, as the share fluctuated within a narrow range of 4.6% to 5.1% between 2004 and 2009, reflecting limited industrial deepening and a sector highly exposed to fluctuations in hydrocarbon revenues and state-led expenditure cycles.
The contraction from 4% in 2010 to 2.3% in 2012 coincided with the outbreak of civil conflict and state collapse following the fall of Gaddafi. This downturn underscored the sector’s vulnerability to conflict-driven destruction of productive capital, the deterioration of institutional capacity and the diversion of fiscal resources away from industrial activity toward immediate security and subsistence needs.
During the subsequent period of protracted instability (2012–2019), the sector remained structurally weak. A temporary rebound to 4.6% in 2014 reflected a brief period of relative stability, but by 2019, manufacturing had contracted to 2.9% of GDP, indicating a continued absence of industrial policy focus and the persistence of extreme hydrocarbon dependence.
The most significant shift occurred in the 2020s, when manufacturing’s share of GDP rose from 2.9% in 2019 to 7.4% in 2020, stabilising around 7-8% through 2023. This abrupt increase may point to renewed efforts at economic diversification, potentially supported by reconstruction spending, nascent foreign investment in light industry or statistical reweighting as overall GDP contracted during episodes of oil sector disruption. Whatever the drivers, this period represents the first time in two decades that manufacturing maintained a relatively higher and more stable contribution to output.
In the Current Path, the manufacturing sector's share of Libya's GDP will rise to 8.5% by 2043. However, these figures remain below the expected average of 14.2% for UMICs in Africa. The Manufacturing scenario increases the size of Libya's economy by 10.7% (to US$8.4 billion instead of US$6.3 billion) in 2043.
Chart 20 depicts exports and imports as a percentage of GDP, from 2000 to 2043, in the Current Path and in the AfCFTA scenario.
Libya’s economy has historically been more open to international trade than the average for UMICs in Africa. This pattern is primarily driven by its dependence on hydrocarbons. Crude oil and refined petroleum products dominate its exports, while the country also relies heavily on imports for food, machinery, consumer goods and intermediate inputs. Thus, even though the domestic manufacturing and agricultural base is relatively weak, trade values as a share of GDP remain large.
Libya is not a member of the World Trade Organisation (WTO). The WTO lists it as an observer government with an accession working party created in 2004, but there has been no formal progress. This raises its trade transaction costs, limits predictability and deters non-energy foreign direct investment (FDI). Alongside Syria, Libya is the only partner among the Southern Neighbourhood (Algeria, Egypt, Israel, Jordan, Lebanon, Libya, Morocco, Palestine, Syria and Tunisia) not to have an Association Agreement with the European Union (EU). The EU is Libya’s largest trading partner, accounting for 42.5% of Libya’s total trade in goods. The EU is also the main destination for Libyan exports (75.9% of the total) and the main origin of Libyan imports ( 62.9% of the total). Libya is the EU’s 32nd-largest trading partner and the 23rd-largest importer to the EU.
The country is party to several free trade agreements, including the Great Arab Free Trade (GAFTA), Trade and Investment Framework Agreement (TIFA), Arab Maghreb Union (AMU) and the African Continental Free Trade Area Agreement (AfCFTA). Libya signed the AfCFTA on 21 March 2018 but has not yet ratified it. The AfCFTA represents a major opportunity for African countries, including Libya, to overcome the constraints of narrow domestic markets and boost exports, as tariff and non-tariff barriers are eliminated.
In 1990, Libya's total trade—measured as the sum of exports and imports—accounted for 70.8% of GDP, well above the UMICs’ average of 49.1%. By 2023, Libya’s trade openness had risen to 74.3% of GDP, compared to an average of 58.9% for its peers. Projections indicate a slight decline to 71.2% by 2043, yet this will remain significantly higher than the estimated UMICs’ average of 62.8% of GDP. This strong performance in international trade is due to Libya’s heavy reliance on oil and gas exports, its dependence on imports for goods and services, and the limited scale of its domestic manufacturing sector.
Crude oil, refined petroleum products and natural gas make up the vast majority of Libya’s exports, often exceeding 95% of total export earnings and more than 90% of government fiscal revenues. As these products are in high demand internationally, they push the export-to-GDP ratio upward. However, they are highly vulnerable to fluctuations in global commodity prices. These goods are not only prone to global market volatility but also lack strong economic linkages and technological dynamism.
In 2023, Libya’s exports accounted for about 39.4% of GDP (equivalent to about US$14.5 billion), underscoring its strong reliance on external trade (oil and gas). This dependence stems largely from the underdevelopment of domestic value chains and poses a considerable risk to achieving sustainable economic growth.
The greater an economy’s dependence on primary and resource-based exports, the more exposed it becomes to external shocks like fluctuations in global demand and prices.
One simple way to evaluate whether a country’s exports are concentrated or diversified is to measure the combined share of its top five export products. A higher percentage reflects a highly concentrated export structure, making the economy more vulnerable to price shocks or demand fluctuations in those sectors. A lower percentage points to greater diversification. In 2023, Libya’s top five exports—crude petroleum (88.4%), petroleum gas (3.7%), refined petroleum (2.5%), gold (2.3%) and scrap iron (0.7%)—together represented 97.5% of Libya’s total exports. The primary destinations for Libya’s total exports were Italy (22.5%), Germany (14.6%), Spain (8.7%), France (7.5%) and China (6.2%).
Libya’s top five imported products were refined petroleum (20.4%), broadcasting equipment (4.1%), rolled tobacco (2.8%), cars (2.6%) and jewellery (1.9%). Most of its total imports originated from China (17.4%), Turkey (14.6%), Italy (8.2%), the United Arab Emirates (8.2%) and Egypt (3.8%)
Despite its rich hydrocarbon resources, Libya has limited non-oil industrial capacity and relies heavily on imports of food, manufactured products and capital equipment, which further increases the share of trade in GDP. In 2023, Libya’s imports accounted for about 36% of the country's GDP (equivalent to about US$12.9 billion), creating a trade surplus of about 4.4% of GDP (equivalent to US$1.6 billion).
Chart 21 presents the trade balance in the Current Path and in the AfCFTA scenario, from 2020 to 2043 as a percentage of GDP.
Libya has a positive (surplus) trade balance with the world, largely driven by its strong reliance on oil and gas exports. Hydrocarbons form the backbone of the national economy. This dependence on commodities that are both in high global demand and command relatively high prices, combined with the country’s geographic advantages, ensures that export revenues consistently surpass import costs, resulting in a positive trade balance.
For decades, Libya has generally had positive trade balances. However, the trade surpluses have been declining. In 2007 and 2008, Libya had a trade surplus of over US$39 billion each year. By 2023, however, the surplus had declined to about USS1.6 billion. In the Current Path, Libya's trade balance will reach a deficit of about US$3.4 billion, which will be equivalent to 4.6% of its forecast GDP in 2043.
In the AfCFTA scenario, Libya will record a trade deficit equivalent to nearly 4.1% of its forecast GDP in 2043. This indicates that the AfCFTA will likely reduce Libya's trade deficit compared to the Current Path, as it facilitates relatively higher exports to the continent.
Chart 22 presents the Current Path of access to electricity for urban, rural and the total population from 2000 to 2043.
Libya’s infrastructure has historically benefited from oil revenues, which funded large-scale development projects, especially in the late 20th century. However, decades of underinvestment, combined with the destructive impact of the 2011 uprising and subsequent conflicts, have severely eroded the country’s infrastructure capacity. As a result, the country’s roads, electricity networks, water systems, and telecommunications face severe challenges that hinder economic growth, social progress and economic integration.
As a result, Libya's electricity supply is unreliable, with frequent blackouts—sometimes up to 18 hours per day—caused by generation shortfalls, grid overloads and fuel shortages. Much of Libya’s electricity infrastructure, constructed decades ago, has long gone without significant maintenance and thus suffers from frequent breakdowns and inefficiency. The problem is particularly acute in rural regions where grid connectivity is weak and outages are more frequent. Political instability has also led to targeted sabotage of power plants and transmission lines.
Inadequate infrastructure coverage and low-quality services drive up transaction costs and reduce the returns on capital and labour, discouraging both domestic and foreign investment while limiting economic growth. Insufficient infrastructure also negatively impacts poverty reduction.
In 2024, Libya ranked third among 54 African countries on the African Infrastructure Development Index (AIDI) with a score of 85.8 out of 100, behind only the Seychelles and Egypt. This ranking reflects Libya’s legacy of pre-war investment in key infrastructure sectors, benefiting from comparatively extensive road networks, electricity access, internet connectivity, and water and sanitation services relative to other African countries.
In 2023, electricity access in Libya stood at 79.5% of the total population, marking a sharp decline from the near-universal coverage of 99.8% recorded in 2000. This drop has been felt most acutely in rural areas, where access has plummeted from roughly 99.2% in 2000 to just 12.4% in 2023. By contrast, urban areas have maintained full electricity coverage at 100% throughout the period. The widening gap between urban and rural access underscores significant infrastructure disparities, with rural communities disproportionately affected by years of underinvestment, poor maintenance and conflict-related damage, leaving many dependent on unreliable off-grid solutions such as diesel generators.
Libya’s abundant solar and wind potential offers a significant opportunity to close rural energy gaps, reduce reliance on hydropower and boost economic growth, if supported by political stability, regulatory clarity and sustained investment. The country’s vast desert area receives among the world’s highest levels of solar irradiance, with roughly 3 200 hours of sunshine annually and an average solar radiation of around 6 kWh/m²/day, while its coastal areas benefit from steady winds averaging 6-8 m/s at 40 m elevation.
In the Current Path, the proportion of Libyans with access to the national electricity grid will rise to 90.7% of the total population by 2043, with rural access forecast to reach 52.9%. In the Large Infrastructure and Leapfrogging scenario, electricity access will increase to 93%, a 2.3 percentage points above the Current Path. The key driver of this improvement will be the expansion of renewable energy capacity, particularly solar and wind. At a disaggregated level, rural access will improve to 64.3% of the total rural population, representing an 11.4 percentage increase relative to the Current Path.
Chart 23 presents the number of people using cookstoves in the Current Path and in the Large Infrastructure and Leapfrogging scenario, from 2020 to 2043.
Libya’s cookstove usage patterns are shaped by a predominantly urban population and a relatively young demographic profile, with over 76% living in urban centres and a median age of 28 years. This urban concentration, particularly in cities along the Mediterranean coast, has contributed to higher rates of access to modern energy infrastructure compared to many other North African countries. Traditional cookstoves, which primarily use wood, charcoal and other biofuels, are mainly found in scattered rural settlements and among nomadic groups in the desert interior. The prevalence of traditional cookstoves in Libya is lower than the average for UMICs in Africa, reflecting a greater reliance on modern fuels and electricity in urban households.
However, pockets of the population, particularly among marginalised rural and nomadic communities, continue to depend on traditional stoves, exposing them to risks of indoor air pollution and associated respiratory illnesses. These risks disproportionately affect women and children, who spend more time near household cooking areas. Traditional cookstove use in rural Libya is also linked to environmental challenges such as localised deforestation and soil degradation, as fuelwood gathering places pressure on fragile desert ecosystems.
In 2023, around 100 households in Libya, representing roughly 0.007% of all households, depended on traditional biomass fuels like firewood and animal dung—inefficient cookstoves that present significant health hazards and can cause illness or even death. In the Large Infrastructure and Leapfrogging scenario, the share of households using modern cookstoves is forecast to reach full, universal adoption in 2043.
Chart 24 presents the percentage of the population and number of people with access to mobile and fixed broadband in the Current Path and in the Large Infrastructure and Leapfrogging scenario, from 2020 to 2043. The user can toggle between mobile and fixed broadband.
The adoption of mobile broadband in Libya has accelerated rapidly over the past decade, with subscriptions per 100 people rising from 32.4 in 2015 to 128.2 in 2023, placing it above the average for UMICs in Africa, which stood at 122.3 per 100 in the same year. This expansion reflects Libya’s predominantly urban society, where more than 76% of the population resides in urban centres. By contrast, fixed broadband access remains limited, at 7.9 per 100 people, mirroring the lag observed in other African countries.
Under the Current Path, mobile broadband access in Libya will continue its upward trajectory through the mid-2020s, reaching 142.1 subscriptions per 100 people by 2025. The pace of growth then moderates, with a plateau emerging after 2030 at around 155.1 subscriptions per 100 people. By 2043, the indicator declines slightly to 154.5 per 100, marking a period of market saturation.
In the Large Infrastructure and Leapfrogging scenario, mobile broadband access will reach 157.5, about three subscriptions per 100 people above the Current Path in 2043. Fixed broadband will increase by 4.2 subscriptions per 100 people compared to the Current Path, reaching 37.3 subscriptions per 100 people.
Widespread access to high-speed mobile broadband has potential spillover effects for economic diversification, improved public sector delivery and the formalisation of economic activity. In Libya’s context of urban concentration, a young population and ongoing development challenges, sustained investment in broadband infrastructure under both scenarios is likely to remain a cornerstone of national recovery and growth strategies.
Chart 25 presents the trends in FDI, aid and remittances in the Current Path and in the Financial Flows scenario as a percentage of GDP, from 1990 to 2043.
Although recent global crises—such as the COVID-19 pandemic, climate change and the ongoing Russia-Ukraine war—have affected foreign aid flows, many African countries continue to depend heavily on this support to provide essential services like education and healthcare. Libya, however, is an exception; it has not relied heavily on foreign aid as a source of development finance.
The country’s reliance on foreign aid is minimal. While it occasionally receives humanitarian assistance, particularly in response to emergencies such as natural disasters, these amounts remain modest compared to African averages. Its vast oil wealth has historically provided the government with substantial revenues, reducing the need for external assistance. In 2022, foreign aid represented just 0.1% of Libya’s GDP, well below the North African average of over 1%. As a result, foreign aid serves only as a supplementary resource rather than a foundation of the nation’s economic stability.
While Libya attracts foreign direct investment (FDI) inflows, the annual inflows are relatively modest and generally accrue to the energy sector. In 2023, FDI represented roughly 3.8% of the country’s GDP. Persistent political instability, high levels of corruption and an unfavourable business environment continue to constrain new investment.
In the Current Path, the contribution of FDI inflows to Libya’s GDP will increase to about 4.8% in 2043, which will be about 2.2 percentage points above the average for UMICs in Africa, but 2.3 percentage points below the average for the other African OPEC member countries. In the Financial Flow scenario, the contribution will increase to 6.4% of GDP, representing a 1.5 percentage points increase relative to the Current Path in 2043, a figure that will remain below the average of other African OPEC member countries.
Chart 26 presents government revenue in the Current Path and in the Financial Flows scenario, from 2020 to 2043. The data is in US$ 2017 and % of GDP.
Wagner's law, or the law of increasing state activity, is the observation that public expenditure increases as national income rises. It is reasonable to expect that government revenues will increase as a percentage of GDP in the Financial Flows scenario compared to the Current Path.
Financial inflows play a role in supporting Libya’s government revenues, though their significance depends on the source. Oil and gas exports continue to be the primary driver of fiscal income. Foreign direct investment—largely concentrated in the energy sector—contributes through taxes, royalties and production-sharing agreements, but the yearly amounts remain small compared to oil revenues. Foreign aid has minimal fiscal impact, as most humanitarian funding is channelled outside the state budget. Overall, while certain financial inflows support public revenue, Libya’s fiscal health is overwhelmingly dependent on its oil and gas sector. In the Financial Flows scenario, government revenues increase to 33.7% of GDP by 2043, up from 13% in 2023. This will be 1.3 percentage points of GDP above the Current Path in 2043, equivalent to US$30 million.
Chart 27 presents the Current Path of government effectiveness comparing the country to the average for the African income group, from 2002 to 2043.
Good governance is crucial for economic advancement. Enhanced national security and stability foster a favourable environment for both domestic and foreign investment, allowing governments to implement sustainable development strategies more successfully.
Libya’s governance challenges stem from a volatile political history shaped by military coups, long periods of authoritarian rule, repeated transitions between short-lived administrations and disputed electoral processes. Years of centralised, personality-driven leadership weakened the capacity of state institutions, leaving them unable to function with independence or efficiency. Since the 2011 uprising, the emergence of rival governments and the repeated postponement of national elections have deepened political divisions and obstructed the creation of a stable, unified authority. These conditions have disrupted long-term policy development, sustained institutional weakness, eroded trust among political actors and fostered a climate of uncertainty that continues to undermine effective governance and public confidence in the state.
The 2023 Ibrahim Index of African Governance (IIAG) ranks Libya 46th out of 54 African countries, with an overall governance score of 38.4 out of 100—well below both the continental average of 49.3 and the Northern Africa regional average of 51.8. In the IIAG framework, a score of 100 reflects the full provision of political, social and economic public goods and services expected from a government. The report highlights a notable decline in participation, rights and inclusion, which have fallen from 35.1 in 2015 to 31.4 in 2023.
Other indices related to governance reveal persistent, widespread, and deeply rooted corruption in Libya. Transparency International’s 2024 Corruption Perceptions Index (CPI) ranks the country 173rd out of 180, with a score of 13 out of 100, down from 18 in 2023. In the CPI, lower scores indicate higher levels of corruption, while a score of 100 reflects a corruption-free environment. This entrenched corruption, coupled with limited public administration capacity, centralisation of resources and decision-making in the capital, low revenue generation and the challenges posed by Libya’s vast territory, ethnic diversity and sparsely populated arid lowlands, severely undermines the state’s ability to deliver public services. Additional structural pressures, such as ongoing civil conflict, widespread poverty, rapid population growth and the impacts of climate change, further erode governance capacity.
The World Bank’s Government Effectiveness Index assesses perceptions of the quality of public services, the professionalism and independence of the civil service, the effectiveness of policy formulation and implementation, and the credibility of the government’s commitment to its policies. In 2023, Libya scored 0.8 out of 5, down from 1.6 in 2004. This was well below the average of 2.1 for UMICs and 1.9 for the Northern Africa region. In the Current Path, Libya’s Governance effectiveness score will increase to 1.4 (out of 5) by 2043. The most important policies to improve governance in Libya would be to address institutional rebuilding and economic management, while creating space for inclusive political and social participation.
Chart 28 presents the security, capacity and inclusion index for the Current Path versus the Governance scenario, for 2023 and 2043.
In our modelling framework, governance is conceptualised across three dimensions—security, capacity, and inclusion—representing the traditional stages of state formation. Each governance dimension is scored on a scale from zero (poor) to one (excellent). The security dimension evaluates the likelihood of internal conflict and overall risk levels. The capacity dimension encompasses factors such as government revenue, corruption, regulatory quality, economic freedom, and government effectiveness. Finally, the inclusion dimension assesses the extent of democracy and gender empowerment.
Libya performs relatively poorly on governance inclusion compared to both the average for African UMICs and its North African peers. Its score is on par with Sudan and Congo, which rank among the lowest in Africa. In fact, Libya’s inclusion score stood at 0.27 (out of 1) in 2023, the third lowest on the continent, behind only Sudan and Congo, respectively.
Its governance inclusion score in 2023 lagged significantly behind its scores in other governance dimensions (capacity and security). The score of 0.27 was well below the average of 0.65 for UMICs and 0.35 for the Northern Africa region. The low score highlights deep-rooted challenges in ensuring equal representation, rights and participation for all citizens. Persistent political instability, ongoing civil conflict and the enduring legacy of authoritarian rule have concentrated power within a narrow elite, while repeated election postponements and disputed results continue to hinder democratic participation.
This weak performance is mirrored in broader measures of economic freedom. In 2022, the latest year with available historical data, the Fraser Institute’s Index of Economic Freedom ranked Libya 157th out of 165 countries globally. According to the Index, economic freedom exists when individuals can acquire property without coercion, fraud or theft, and when such property rights are protected from infringement. Within this framework, individuals should be free to use, exchange or transfer their property, provided their actions do not infringe on the identical rights of others.
Security remains one of Libya’s most critical governance challenges, driven by protracted conflict, the proliferation of armed groups and the absence of a unified and effective national security apparatus. The fragmentation of state authority has undermined the rule of law, weakened law enforcement institutions and eroded public trust in the justice system. Libya’s security score was estimated at 0.29 in 2023, also far below the averages of 0.68 and 0.75 for UMICs and the Northern Africa region, respectively. This is a result of more than a decade of persistent instability, armed conflict and weak state control over territory. In the 2023 Global Peace Index (a composite index drawing on a variety of measures), Libya ranked 137 out of 163 countries, with a score of 2.6.
Better governance capacity follows from improvements in government regulatory quality, reduced corruption, increased economic freedom and higher government effectiveness. Libya scored 0.48 on the capacity index in 2023, outperforming its results in the security and inclusion dimensions. This score was slightly higher than the Northern Africa regional average of 0.43, indicating a relatively stronger ability to deliver public services and manage administrative functions compared to some neighbouring states. However, it remained just below the 0.50 average for UMICs in Africa, highlighting that while Libya’s institutional capacity shows some resilience, it still lags behind the performance of its economic peers on the continent.
The government revenue-to-GDP ratio is often used as a proxy measure of a state’s ability to mobilise resources and exercise fiscal capacity. In Libya, this ratio stood at about 18% of GDP in 2023, well below the average for African UMICs and even slightly under the North African regional average. Public service delivery remains constrained by political fragmentation and parallel budgeting, procyclical fiscal expansions (a rapidly rising wage bill and large energy subsidies), weak public financial management and state-owned enterprises (SOEs) and chronic stresses in the electricity sector, all of which amplify corruption risks and unpredictability.
In the Current Path, Libya will make progress in all three governance dimensions: capacity, inclusion and security. As a result, the country’s composite governance index, which is the simple average of these dimensions, will rise from about 0.35 in 2023 to 0.57 by 2043. In the Governance scenario, Libya’s governance score will improve to 0.65 in 2043, representing a 13.2% increase compared to the Current Path; however, below the average forecast for African UMICs, but above the North Africa average. This suggests that enhanced governance strategies could significantly accelerate institutional development, political inclusivity and national stability.
Chart 29 presents GDP per capita in purchasing power parity (PPP) in the Current Path and each of the eight sectoral scenarios, plus the synergistic effect and the Combined scenario. The data is from 2020 with a forecast to 2043.
Libya gets a boost to its GDP per capita in all sectoral scenarios. In other words, all scenarios contribute to GDP per capita growth above the Current Path. However, the AfCFTA scenario has the most significant positive impact on GDP per capita with an increase of about US$1 000 above the Current Path in 2043. This implies that, if the government of Libya promotes deeper regional trade integration, it could generate substantial economic gains. This would mean that Libya has the potential to benefit more than average from the removal of tariff and non-tariff barriers, improved access to continental markets and participation in regional value chains. In effect, AfCFTA offers Libya a chance to diversify beyond oil dependence, enhance competitiveness and stimulate job-creating growth.
To maximise this impact, the Libyan government must prioritise the swift and effective implementation of AfCFTA commitments. This includes harmonising national laws with AfCFTA provisions, reducing customs and logistics bottlenecks and cutting unnecessary regulatory barriers. Trade facilitation measures such as digital customs systems, upgraded ports and efficient border management will be crucial in lowering trade costs.
At the same time, Libya must prepare its businesses to seize new opportunities. Support should be provided for exporters to meet rules of origin requirements, improve product standards and access trade finance. Small and medium enterprises, in particular, will need tailored assistance to integrate into continental supply chains. Focusing on sectors with strong regional demand, such as logistics, ICT services, agriculture and renewable energy, would enable Libya to play to its strengths while diversifying its economy. In parallel, attracting foreign and domestic investment will be essential. The government should strengthen the investment climate through regulatory reforms, predictable tax and licensing regimes, and by opening key sectors to competition. Leveraging digital solutions, such as paperless trade and e-payment systems, will also help integrate Libya more fully into the emerging African digital economy.
The governance scenario generates the second-largest gain in GDP per capita, adding about US$570 above the Current Path. This highlights the economic benefits Libya could achieve by adopting a more progressive tax system, tackling corruption, improving institutional performance and strengthening socio-political stability. Advancing democracy, promoting gender empowerment and expanding targeted social assistance for the poorest households would further support inclusive growth and improved living standards.
Within this framework, social protection is a key driver of this outcome. At the micro level, direct support to vulnerable groups increases household consumption, productivity and employment. At the macro level, social spending supports growth as a countercyclical measure during downturns and a long-term enabler of development by enhancing skills, reducing inequality and building resilience.
Effective governance ensures that public resources are used efficiently to drive development and improve citizen well-being. When governance is strong, public investment attracts private capital by delivering critical infrastructure—such as energy, transport, logistics and communications—necessary for businesses to operate productively.
The third-largest increase in GDP per capita comes from the Manufacturing scenario, which adds about US$510 above the Current Path by 2043. This is followed by the Financial Flows scenario, which raises GDP per capita by roughly US$340 over the same period.
Given the small size of the sector, the Agriculture scenario is the least impactful in terms of GDP per capita, with an increase of US$60 compared with the Current Path in 2043. Even with limited arable land, agriculture can reduce Libya’s extreme dependence on food imports. Improving domestic production even modestly has strategic value. By investing in agro-processing industries, the country can transform raw agricultural products into higher-value goods, stimulating rural development, creating employment opportunities and establishing stronger supply chains that link farmers to domestic and regional markets. Agro-processing not only supports food security but also lays the foundation for broader manufacturing growth.
Libya requires a holistic development strategy to achieve lasting results. Reforms must be coordinated across industries rather than pursued in isolation. A comprehensive policy push—linking agriculture, manufacturing, governance, and security—offers the most effective pathway to inclusive, resilient and sustained economic growth. Such an integrated approach would not only diversify the economy beyond hydrocarbons but also improve livelihoods, reduce inequality and foster long-term stability.
Chart 30 presents poverty in the Current Path and for each scenario, from 2020 to 2043. The user can select the number of extremely poor people or the percentage of the population.
Using the World Bank upper-middle-income monetary poverty line (US$6.85 per person), all the scenario interventions contribute to poverty reduction in Libya; however, the Governance scenario contributes most significantly to reducing the poverty rate by 2043. An important reason for these improvements is that the scenario includes a social transfer component. In the Governance scenario, the poverty rate will decline to 21.2% in 2043, compared to the Current Path of 25.3%, a 4.1 percentage points below the Current Path. This is equivalent to about 370 930 fewer people living in poverty at US$6.85 per day compared to about 2.3 million on the Current Path in 2043. Good governance expressed through effective regulation, transparency and strong control of corruption is essential for ensuring that all citizens, particularly the poor, can participate in and benefit from economic growth. When institutions function well, public resources are managed efficiently, regulatory frameworks are predictable and opportunities are more equitably shared across society. By contrast, corruption erodes this foundation. It reduces the government’s capacity to deliver essential services such as education, healthcare and infrastructure, while distorting the allocation of public spending in favour of narrow interests. The result is that the poorest and most vulnerable are left with fewer opportunities to escape poverty, as they face higher costs, weaker services and limited access to justice and economic opportunities.
Strengthening governance, therefore, has a dual impact: it boosts economic efficiency by reducing waste and uncertainty, and it promotes equity by ensuring that growth translates into broader social benefits. For Libya, this means that reforms aimed at enhancing transparency, building accountable institutions and implementing fair regulatory policies are not just governance improvements; they are also powerful tools for poverty reduction and inclusive development.
The Governance scenario is followed by the AfCFTA and the Large Infrastructure and Leapfrogging scenarios in terms of reductions in poverty. The poverty rate in the AfCFTA scenario will be 21.8%, thus lifting 318 510 people out of extreme poverty, compared to the 25.3% in the Current Path in 2043. The Large Infrastructure and Leapfrogging scenario will lift 165 720 Libyans out of extreme poverty relative to the Current Path in 2043.
Chart 31 presents GDP in the Current Path and in the Combined scenario from 2020 to 2043. The data is in US$2017 and at market exchange rates (MER).
The Combined scenario combines all eight sectoral scenarios, representing an integrated development effort aimed at removing the key constraints to sustained and inclusive growth in Libya. Assuming that the Combined scenario is implemented, Libya could expect a significant improvement in its growth prospects. In this scenario, the average economic growth rate between 2026 and 2043 will be 5.4%, compared with 3.5% on the Current Path over the same period. The size of the economy measured in GDP at the market exchange rate (MER) will be US$28.8 billion larger than the Current Path in 2043, thus a 38.7% growth compared to the Current Path.
Chart 32 presents GDP per capita in purchasing power parity (PPP) in the Current Path and the Combined scenario. The data is from 2020 with a forecast to 2043.
The impact of the Combined scenario on GDP per capita is significantly greater than the sum of the individual thematic scenarios. By 2043, Libya’s GDP per capita will be US$3 150 higher than on the Current Path, demonstrating that a coordinated push across all development sectors could substantially improve the living standards of the Libyan population.
Chart 33 presents the value added by sector in the Current Path and in the Combined scenario, for 2023 and 2043. The data is in US$ 2017 and as a percentage of GDP.
Our modelling provides forecasts in six economic sectors, namely agriculture, energy, materials (including mining), manufactures, services and ICTech.
In 2023, the services sector was the backbone of Libya’s economy, contributing US$24.4 billion in value added (66.2% of GDP). In the Current Path, by 2043, services will nearly double in size to US$46.1 billion; however, a decline in contribution to 62.1%, reflecting faster growth in other sectors. In the Combined scenario, services strengthen slightly, accounting for 62.6% of GDP. This is equivalent to US$64.5 billion, a gain of 0.54 percentage points above the Current Path. This indicates that while services will continue to dominate, diversification will reduce their relative weight in the economy.
The energy sector remains the second-largest contributor. In 2023, it generated US$8.4 billion (22.8% of GDP). Under the Current Path, this more than doubles to US$18.5 billion, equivalent to 24.9% of GDP by 2043. However, in the Combined scenario, its share will drop to 19.6%, a reduction of 5.3 percentage points. This decline underscores the benefits of economic diversification away from heavy dependence on hydrocarbons.
Manufacturing starts from a relatively small base of US$2.7 billion (7.4% of GDP) in 2023. In the Current Path, it grows gradually to US$6.3 billion (8.5% of GDP) by 2043, reflecting modest industrial development. In the Combined scenario, the manufacturing sector share will rise more significantly to 11.8% of GDP in 2043, 3.3 percentage points higher than the Current Path. This shift highlights the potential of industrial policy and investment in value-added production to accelerate economic transformation.
The ICT sector is forecast to be among the fastest-growing. By 2043, its contribution could reach 3.2% of GDP (US$3.3 billion) in the Combined scenario, compared to just 1.9% on the Current Path. This expansion illustrates the importance of digital infrastructure and innovation in building a modern, competitive economy. Similarly, the materials sector will expand to 2.3% of GDP, a 0.12 percentage point increase compared to the Current Path.
Finally, although still small, the agriculture sector will also see modest gains. By 2043, its contribution will increase slightly to 0.5% of GDP in the Combined scenario, a 0.04 percentage points higher than the Current Path. This reflects the limited but important role of agriculture in supporting food security and supplying raw materials for agro-processing industries.
In summary, the Combined scenario points to a more diversified Libyan economy by 2043—less dependent on hydrocarbons, with stronger contributions from manufacturing, ICT and other emerging sectors, while services remain the largest driver of value added. Instead of a 2043 economy at US$74.3 billion, Libya’s economy would be U$103 billion.
Chart 34 presents the size of the informal sector in the Current Path and in the Combined scenario, from 2020 to 2043.
In the Current Path, the contribution of the informal sector to Libya’s economy will decline gradually, falling from its 2023 value of 15.4% to 14.1% of GDP (about US$10.4 billion) by 2043. This trend reflects the slow expansion of formal employment opportunities and a modest shift of economic activity into regulated sectors.
In the Combined scenario, the share of the informal economy falls even further, to 9.8% of GDP (around US$10.1 billion) in 2043. Its reduced share of GDP indicates that sustained, broad-based growth in formal sectors such as manufacturing, services and ICT can absorb a substantial portion of informal activities.
This outcome highlights the transformative potential of coordinated, cross-sectoral reforms. By strengthening governance, creating formal jobs, expanding access to finance and improving infrastructure, Libya can progressively reduce reliance on informal employment. A shrinking informal sector share does not imply fewer livelihoods; rather, it suggests a gradual formalisation of economic activity, with more workers benefiting from social protection, higher productivity and secure, decent jobs.
Chart 35 presents poverty in the Current Path and the Combined scenario, 2020 to 2043.
In the Combined scenario, by 2043, only 13.5% of the population will be living in poverty using U$6.85, compared to 25.3% in the Current Path. This represents nearly 1.1 million fewer people living in poverty compared to the Current Path. Such a reduction highlights the transformative potential of an integrated development strategy that tackles constraints across multiple sectors simultaneously.
By combining reforms in agriculture, education, health and demographics, manufacturing, finance, trade and infrastructure, the Combined scenario not only raises incomes but also ensures that the gains from growth are more broadly shared. The sharp decline in poverty illustrates how coordinated policy action can directly improve household welfare, strengthen resilience and promote greater social stability.
Chart 36 compares life expectancy in the Current Path with the Combined scenario from 2020 to 2043.
Life expectancy at birth is widely recognised as one of the most comprehensive indicators of a population’s overall health and well-being. It reflects not only mortality patterns but also access to healthcare, nutrition, sanitation, education and broader living conditions. As such, it serves as a powerful proxy for the strength of a country’s human capital base.
In Libya, life expectancy is relatively high by regional standards, reflecting improvements in healthcare access, nutrition and living conditions over recent decades. This is a positive foundation for human capital development, as a healthier population is generally able to work longer, remain more productive and contribute more effectively to the economy.
Since 2020, Libya’s life expectancy at birth has improved by about 0.8 years to 77.3 years in 2023 and has remained above the averages for UMICs in Africa since 1963. Life expectancy for males stood at 76 years and 78.7 years in 2023. In the Current Path, life expectancy at birth will further improve to 79.9 years by 2043. In the Combined scenario, the average Libyan could expect to live about 2.4 years longer than in the Current Path to 82.3 years. This relatively strong life expectancy is an asset; it must be complemented by investments in education, job creation and governance reforms to transform longer lives into higher productivity, innovation and inclusive growth. Without these, the relatively high life expectancy advantage may not translate into sustained economic diversification or improved living standards.
A population that lives longer but lacks sufficient opportunities for skill acquisition, formal employment or productive engagement risks underutilising its potential. In such cases, the economic gains of high life expectancy are not fully realised.
Chart 37 compares carbon emissions in the Current Path with the Combined scenario from 2020 to 2043. Note that the data is in million tons of carbon, not CO2 equivalent.
In 2023, Libya released about 13.6 million tons of carbon, and in the Current Path, it will release 17.3 million tons by 2043. Although Libya’s total carbon emissions are modest in global terms, they are relatively high on a per capita basis compared to many African countries, due to the dominance of hydrocarbons in its economy. Like much of Africa, however, Libya faces disproportionate risks from climate change, such as extreme heat, drought and water scarcity, despite its limited overall contribution to global emissions.
The materialisation of the Combined scenario and the associated rapid economic growth in Libya will increase carbon emissions to 19.6 million tons by 2043, about 2.3 million tons above the Current Path in the same year.
Chart 38 compares energy demand and production in the Current Path with the Combined scenario from 2020 to 2043. Production is done in nine types, namely oil, gas, coal, hydro, nuclear, solar, wind, geothermal and other renewables. The data is converted into million barrels of oil equivalent (BOE) to allow for comparisons. Note that energy production could be for domestic use or for export.
In 2023, Libya produced an estimated 217.1 million barrels of oil equivalent (BOE), while domestic consumption stood at just 111.5 million BOE. This resulted in a substantial surplus of 105.6 million BOE, most of which was directed toward export markets. The figures underscore the country’s role as a net energy exporter and highlight the central importance of the hydrocarbon sector to its economy.
Libya’s economic structure is heavily reliant on energy exports, with oil and gas revenues accounting for the overwhelming majority of government income, foreign exchange earnings and investment flows. While this dependence provides fiscal resources, it also exposes the economy to volatility in global energy prices, external demand shocks and the long-term risks of a global energy transition.
In the Current Path, total energy production will continue to outgrow demand so that by 2043, the energy production surplus will be equivalent to 178.8 million BOE. In the Combined scenario, the surplus will decline slightly to 178.2 million BOE. The forecast surplus illustrates both an opportunity and a vulnerability. On one hand, Libya’s abundant hydrocarbon resources continue to be a vital source of revenue and can finance investments in infrastructure and social development. On the other hand, the heavy reliance on a single sector creates structural imbalances, limits diversification and increases susceptibility to boom-and-bust cycles. For Libya to achieve more sustainable and inclusive growth, leveraging its energy wealth to stimulate investment in other sectors will be essential.
Chart 39 summarises the policy recommendations for Libya.
Libya stands at a critical juncture, grappling with political fragmentation, persistent insecurity and an overreliance on oil revenues. Yet, the country also possesses immense potential, underpinned by vast natural resources, a strategic location and a resilient population. To move from fragility to stability and long-term prosperity, Libya must adopt a series of reforms that strengthen institutions, improve governance and diversify the economy, while carefully managing external partnerships.
A first priority is to address the governance deficit that has plagued Libya since the collapse of central authority in 2011. Institutional fragmentation, corruption and the absence of a unified political framework have continued to undermine service delivery and public trust. Tackling these issues requires renewed efforts at national reconciliation and political dialogue to bridge divisions between rival authorities. Beyond elite bargaining, the emphasis must be on building robust institutions that can guarantee stability and continuity, regardless of leadership changes. Judicial reforms, stronger anti-corruption bodies and transparent management of state revenues would provide a foundation for improved rule of law and accountable governance.
Security sector reform remains equally urgent. The proliferation of armed groups has weakened the state’s monopoly on force and left many communities vulnerable. A carefully sequenced programme of disarmament, demobilisation and reintegration (DDR) is essential to reduce militia power and reintegrate fighters into civilian or national security structures. At the same time, Libya must strengthen border management and expand cooperation with neighbouring countries to curb the flow of arms, human trafficking and extremist activity across its porous frontiers. Importantly, peacebuilding should not be limited to top-down processes: empowering local communities to mediate disputes and address root causes of violence will help build grassroots resilience.
Economically, Libya cannot afford to remain dependent on hydrocarbons, even though oil will remain a vital source of national income for years to come. Greater transparency in the management of oil revenues, particularly within the National Oil Corporation and the Central Bank, is crucial to ensure that wealth is equitably distributed and benefits all Libyans. Simultaneously, diversification should be prioritised through investment in agro-processing, renewable energy, infrastructure and service industries. Expanding vocational training and youth employment programs would address Libya’s acute unemployment problem while equipping its young population to drive growth beyond oil.
Decentralisation offers another path to resilience. For too long, power and resources have been concentrated in central institutions that are themselves fragile and contested. Empowering municipalities with both financial autonomy and technical capacity would allow local authorities to deliver education, healthcare and infrastructure more effectively. Decentralisation can also make governance more inclusive, ensuring that policies reflect the needs of diverse communities across the country. Rebuilding human capital by investing in schools, hospitals and training centres must go hand in hand with these efforts.
Finally, Libya’s transition will require constructive and coordinated international support. Too often, external actors have pursued competing agendas that deepen divisions rather than heal them. The United Nations, African Union, European Union and bilateral partners should work toward a common framework aligned with Libya’s priorities. International engagement should also balance short-term humanitarian assistance—vital for displaced persons and flood-affected communities—with longer-term investments in development and institutional resilience. Elections will eventually be necessary to legitimise Libya’s governance structures, but they must be pursued cautiously and only once security and institutional conditions make credible polls feasible.
Page information
Contact at AFI team is Blessing Chipanda
This entry was last updated on 12 June 2026 using IFs v8.38.
Donors and sponsors


Reuse our work
- All visualizations, data, and text produced by African Futures are completely open access under the Creative Commons BY license. You have the permission to use, distribute, and reproduce these in any medium, provided the source and authors are credited.
- The data produced by third parties and made available by African Futures is subject to the license terms from the original third-party authors. We will always indicate the original source of the data in our documentation, so you should always check the license of any such third-party data before use and redistribution.
- All of our charts can be embedded in any site.
Cite this research
Blessing Chipanda (2026) Libya Development Futures. Published online at futures.issafrica.org. Retrieved from https://futures.issafrica.org/geographic/countries/libya/ [Online Resource] Updated 12 June 2026.