 Liberia
Feedback welcome
Our aim is to use the best data to inform our analysis. See our Technical page for information on the IFs forecasting platform. We appreciate your help and references for improvements via our feedback form.
Please note: This country report was developed using African Futures’ previous analytical framework, which organised the assessment across 11 sectoral scenarios. We have since updated and streamlined the analytical architecture to 8 sectoral scenarios. While the two frameworks remain broadly aligned, the current structure improves consistency, comparability and integration across themes and geographic studies. This page will therefore be updated to the current framework in due course. Read more about our analytical framework on the Technical Page.
In this entry, we first describe the Current Path forecast for Liberia as it is expected to unfold to 2043, the end of the third ten-year implementation plan of the African Union’s Agenda 2063 long-term vision for Africa. The Current Path in the International Futures (IFs) forecasting model initialises from country-level data that is drawn from a range of data providers. We prioritise data from national sources.
The Current Path forecast is divided into summaries on demographics, economics, poverty, health/WaSH and climate change/energy. A second section then presents a single positive scenario for potential improvements in stability, demographics, health/WaSH, agriculture, education, manufacturing/transfers, leapfrogging, free trade, financial flows, infrastructure, governance and the impact of various scenarios on carbon emissions. With the individual impact of these sectors and dimensions having been considered, a final section presents the impact of the Combined Agenda 2063 scenario.
We generally review the impact of each scenario and the Combined Agenda 2063 scenario on gross domestic product (GDP) per person and extreme poverty except for Health/WaSH that uses life expectancy and infant mortality.
The information is presented graphically and supported by brief interpretive text.
All US$ numbers are in 2017 values.
Executive Summary
- Current Path forecast
- Liberia is a member of the Community of Sahel-Saharan States (CEN-SAD) as well as the regional and political union of the Economic Community of West African States (ECOWAS). Jump to forecast: Current Path
- Liberia is the 12th most populous country in West Africa, with an estimated population of 4.9 million in 2019, up from 2.1 million in 1990. In the Current Path forecast, the population of Liberia is projected to increase to 8.2 million by 2043, representing an approximate increase of 67.3% within the next 23 years. Jump to Demographics: Current Path
- Liberia’s GDP is estimated to more than triple from 2019, increasing to US$10.8 billion by 2043. This increase in GDP reflects the economic growth expected to occur within the next 22 years when compared to previous years. Jump to Economics: Current Path
- In 2019, over 3.1 million people (62.9% of the population) lived on less than US$1.90 per day; however, by 2043, 2.6 million people (31.9% of the population) will live in extreme poverty. Jump to Poverty: Current Path
- Carbon emissions increased steadily from 1990 to 2019, from 100 000 tons of carbon to 330 000 tons in this time. In the Current Path forecast, carbon emissions are forecast to increase to 1.5 million tons by 2043. Jump to Carbon emissions/Energy: Current Path
- Sectoral scenarios
- In the Stability scenario, Liberia’s score in the government security index is projected to rise from 0.66 to 0.85 in 2043, which is 0.09 points higher than the Current Path forecast for the same year. Jump to Stability scenario
- By 2043, the Demographic scenario will lead to a decline in infant mortality of 18.8 deaths per 1 000 live births — 5.4 fewer deaths per 1 000 live births compared to lower than the Current Path forecast at 24.2 and 2.4 deaths lower than the average for low-income countries in Africa. Jump to Demographic scenario
- Based on the Health/WaSH scenario, life expectancy is estimated to increase to about 72.9 years by 2043, which is an increase of seven months above the Current Path forecast of 72.2 years. Jump to Health/WaSH scenario
- In 2019, the average yield per hectare for crops was 2.9 metric tons per hectare, which was higher than the average of 2.7 metric tons per hectare for low-income countries in Africa. In the Agricultural scenario, the average yield will be 6.9 metric tons per hectare — far above the average of 3.5 metric tons per hectare for low-income countries in Africa. Jump to Agriculture scenario
- By 2043, in the Education scenario, it is expected that the mean years of education will rise to 7.1 years — 0.4 years more than the Current Path estimates and a year more than the average for low-income countries in Africa. Jump to Education scenario
- In 2019, the total welfare transfer to households was US$0.05 billion. This amount is projected to increase to US$1.2 billion by 2043 in the Manufacturing/Transfers scenario, representing an increase of 2300%. Jump to Manufacturing/Transfers scenario
- Based on the Leapfrogging scenario, the number of poor people in 2043 is projected to be 2.4 million, representing 29.4% of the Liberian population. This projection is marginally lower than the 2.6 million poor people estimated in the Current Path forecast in the same year, which suggests that the number of poor people in the Leapfrogging scenario is about 200 000 fewer than in the Current Path forecast in 2043. Jump to Leapfrogging scenario
- The GDP per capita for Liberia is estimated to increase to US$2 773 by 2043 in the Free Trade scenario, which is US$207 more than the projections for the Current Path forecast in 2043. Jump to Free Trade scenario
- In the Financial Flows scenario, foreign direct investment is projected to be around 19.6% of GDP in 2043, up from 13.9% of GDP in 2019, whereas in the Current Path forecast, by 2043, the total foreign direct investment to the country is projected to increase to 17.5% of GDP. Jump to Financial Flows scenario
- By 2043, 67.3% of urban dwellers will have access to electricity in the Current Path forecast compared to 73.1% in the Infrastructure scenario. However, only 25.7% of rural dwellers in the Current Path forecast compared to 49.5% in the Infrastructure scenario will have access to electricity in 2043. Jump to Infrastructure scenario
- In the Governance scenario, Liberia’s GDP per capita is projected to increase to US$2 620 in 2043, which is US$54 more than the estimate in the Current Path forecast but US$1 170 less than the average for low-income countries on the continent in the same year. Jump to Governance scenario
- The intervention with the greatest impact on carbon emissions is the Agriculture scenario, which will lead to an increase in Liberia’s carbon emissions to 1.62 million tons in 2043. Jump to Impact of scenarios on carbon emissions
-
Combined Agenda 2063 scenario
- Liberia’s carbon emissions are projected to increase in all the scenarios with the total emissions projected to be about 1.5 million tons by 2043 in the Current Path forecast. The intervention with the greatest impact on carbon emissions is the Agriculture scenario, which will lead to an increase in Liberia’s carbon emissions to 1.62 million tons of carbon in 2043. Jump to Combined Agenda 2063 scenario
- The scenario with the greatest impact on GDP per capita by 2043 is the Agriculture scenario with a contribution of US$346.60, followed by the Financial Flows scenario with a contribution of US$233.30, and then the Free Trade scenario with a contribution of US$207. Jump to Combined Agenda 2063 scenario
- The estimated GDP (MER) for 2043 in the Combined Agenda 2063 scenario in 2043 will be US$21.6 billion, which is higher than the Current Path estimates of US$10.8 billion. Jump to Combined Agenda 2063 scenario
All charts for Liberia Development Futures
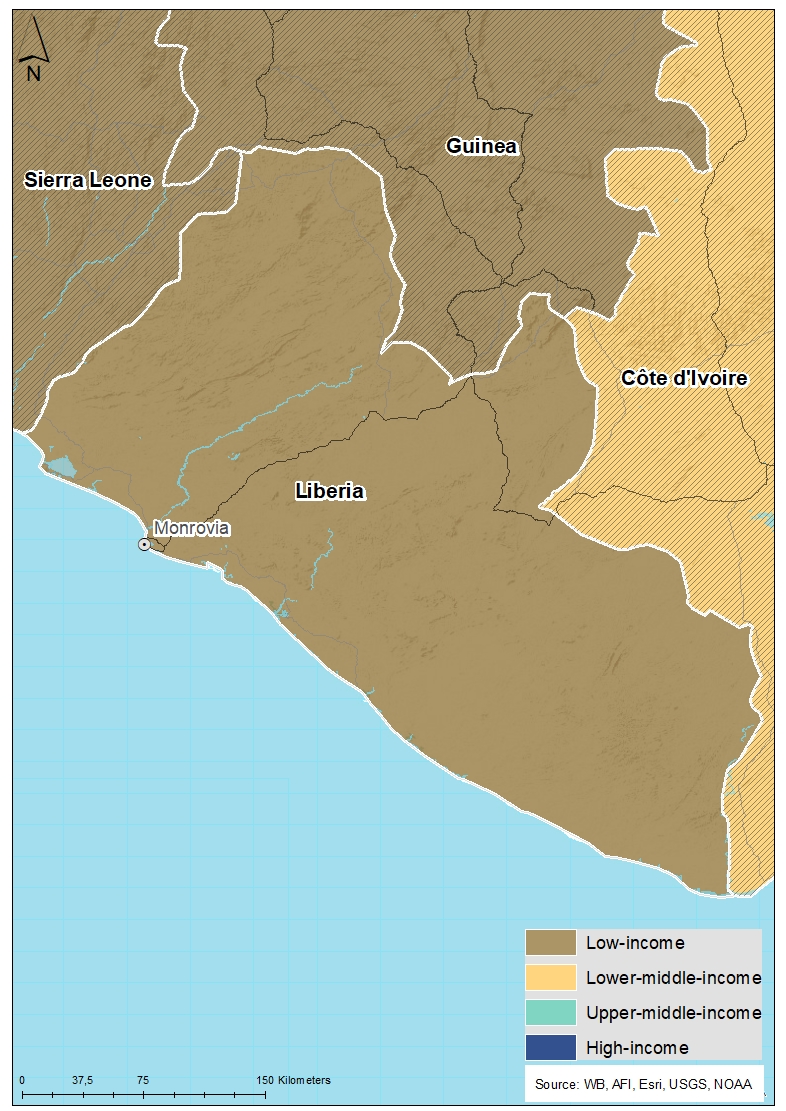
- Chart 1: Political map of Liberia
- Chart 2: Population structure in CP, 1990–2043
- Chart 3: Urban and rural population in CP, 1990–2043
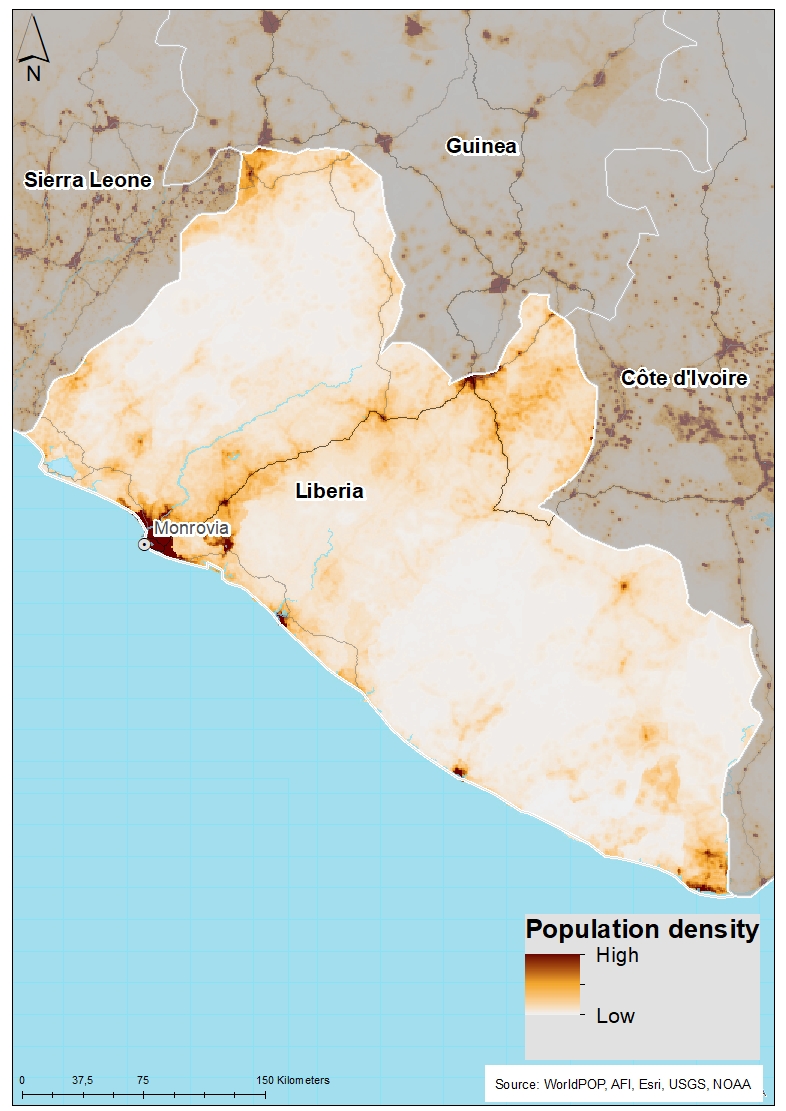
- Chart 4: Population density map for 2019
- Chart 5: GDP in CP, 1990–2043
- Chart 6: GDP per capita in CP, 1990–2043
- Chart 7: Informal sector value in CP, 2015–2043
- Chart 8: Value added by sector in CP, 2015–2043
- Chart 9: Agriculture production/demand in CP, 1990–2043
- Chart 10: Poverty in CP, 2015–2043
- Chart 11: Energy production by type in CP, 1990–2043
- Chart 12: Carbon emissions in CP, 1990–2043
- Chart 13: Governance security in CP and Stability scenario, 2019–2043
- Chart 14: GDP per capita in CP and Stability scenario, 2019–2043
- Chart 15: Poverty in CP and Stability scenario, 2019–2043
- Chart 16: Demographic dividend in CP and Demog scenario, 2019–2043
- Chart 17: Infant mortality in CP and Demog scenario, 2019–2043
- Chart 18: GDP per capita in CP and Demog scenario, 2019–2043
- Chart 19: Poverty in CP and Demog scenario, 2019–2043
- Chart 20: Life expectancy in CP and Health/WaSH scenario, 2019–2043
- Chart 21: Infant mortality in CP and Health/WaSH scenario, 2019–2043
- Chart 22: Yield/hectare in CP and Agric scenario, 2019–2043
- Chart 23: Agriculture imports in CP and Agric scenario, 2019–2043
- Chart 24: GDP per capita in the CP and Agric scenario, 2019–2043
- Chart 25: Poverty in CP and Agric scenario, 2019–2043
- Chart 26: Mean years of education in CP and Educ scenario, 2019–2043
- Chart 27: Education quality in CP and Educ scenario, 2019–2043
- Chart 28: GDP per capita in CP and Educ scenario, 2019–2043
- Chart 29: Poverty in CP and Educ scenario, 2019–2043
- Chart 30: Value added by sector in CP and Manufac/Transfers scenario, 2019–2043
- Chart 31: Gov welfare transfers in CP and Manufac/Transfers scenario, 2019–2043
- Chart 32: GDP per capita in CP and Manufac/Transfers scenario, 2019–2043
- Chart 33: Poverty in CP and Manufac/Transfers scenario, 2019–2043
- Chart 34: Fixed broadband access in CP and Leapfrogging scenario, 2019–2043
- Chart 35: Mobile broadband access in CP and Leapfrogging scenario, 2019–2043
- Chart 36: Electricity access in CP and Leapfrogging scenario, 2019–2043
- Chart 37: GDP per capita in CP and Leapfrogging scenario, 2019–2043
- Chart 38: Poverty in CP and Leapfrogging scenario, 2019–2043
- Chart 39: Trade balance in CP and Free Trade scenario, 2019–2043
- Chart 40: GDP per capita in CP and Free Trade scenario, 2019–2043
- Chart 41: Poverty in CP and Free Trade scenario, 2019–2043
- Chart 42: Foreign aid in CP and Financial Flows scenario, 2019–2043
- Chart 43: Inflow of FDI in CP and Financial Flows scenario, 2019–2043
- Chart 44: Remittances in CP and Financial Flows scenario, 2019–2043
- Chart 45: GDP per capita in CP and Financial Flows scenario, 2019–2043
- Chart 46: Poverty in CP and Financial Flows scenario, 2019–2043
- Chart 47: Electricity access in CP and Infrastructure scenario, 2019–2043
- Chart 48: Rural road access in CP and Infrastructure scenario, 2019–2043
- Chart 49: GDP per capita in CP and Infrastructure scenario, 2019–2043
- Chart 50: Poverty in CP and Infrastructure scenario, 2019–2043
- Chart 51: Gov effectiveness in CP and Governance scenario, 2019–2043
- Chart 52: GDP per capita in CP and Governance scenario, 2019–2043
- Chart 53: Poverty in CP and Governance scenario, 2019–2043
- Chart 54: Carbon emissions in CP and scenarios, 2019–2043
- Chart 55: GDP per capita in CP and scenarios, 2019–2043
- Chart 56: GDP per capita in CP and Combined scenario, 2019–2043
- Chart 57: Poverty in CP and Combined scenario, 2019–2043
- Chart 58: Value added by sector in CP and Combined scenario, 2019–2043
- Chart 59: GDP in CP and Combined scenario, 2019–2043
- Chart 60: Carbon emissions in CP and Combined scenario, 2019–2043


Liberia Development Futures: Current Path
Download to pdfThis page provides an overview of the key characteristics of Liberia along its likely (or Current Path) development trajectory. The Current Path forecast from the International Futures forecasting (IFs) platform is a dynamic scenario that imitates the continuation of current policies and environmental conditions. The Current Path is therefore in congruence with historical patterns and produces a series of dynamic forecasts endogenised in relationships across crucial global systems. We use 2019 as a standard reference year and the forecasts generally extend to 2043 to coincide with the end of the third ten-year implementation plan of the African Union’s Agenda 2063 long-term development vision.
Liberia is a low-income country in Africa, bordered by Sierra Leone to the northwest, Guinea to the north, Ivory Coast to the east, and the Atlantic Ocean to the southwest. Liberia is a member of the Community of Sahel-Saharan States (CEN-SAD) as well as the regional and political union of the Economic Community of West African States (ECOWAS). The capital city is Monrovia, and though English is the official language of the country, there is significant ethnic diversity with over 20 other indigenous languages spoken. Geographically, Liberia covers an area of 111 369 km2 and as of 2021, is estimated to have a population of a little over 5.2 million. In terms of climate, Liberia has an equatorial climate, with high year-round temperatures and generally heavy rainfall from May to October. Between November and March, however, harmattan winds are predominant. Four terrestrial ecoregions lie within Liberia's borders: Guinean montane forests, Western Guinean lowland forests, Guinean forest-savanna mosaic, and Guinean mangroves. Administratively, Liberia is divided into 15 counties, which in turn are subdivided into a total of 90 districts. Although Liberia produces natural rubber, rice, cassava, bananas and palm oil, it is one of the poorest countries in the world and relies heavily on foreign direct investments and foreign aid. Among its mineral deposits, gold, diamonds and iron ore are significant. Timber is also an important export product of the country.
Liberia is the 12th most populous country in West Africa and the 37th most populous in Africa, with an estimated population of 4.9 million in 2019, up from 2.1 million in 1990. This represents an increase of 133% in the country’s population over the past 29 years. In the Current Path forecast, the population of Liberia is projected to increase to 8.1 million by 2043, representing an approximate increase of 65% in the next 23 years. This relatively low increase in the population growth rate can be attributed to the adoption of improved birth control methods such as the use of modern contraceptives. Fertility rates have dropped from seven births per woman in 1985 to 4.4 births in 2019. The percentage of fertile women who use modern contraceptives is projected to increase from 31.3 in 2019 to 52.9 in 2043 in the Current Path forecast. Liberia has a large young sector of the population, with a youth bulge of 46.1% and a median age of 19.2 years in 2019. The youth bulge, defined as the ratio of the population between the ages of 15 and 29 to the total adult population, will remain above 40% across the Current Path forecast horizon. This large youth bulge presents an opportunity for a large labour force and human capital growth as well as youth activism in the country. However, it can equally serve as an existential threat for the country especially if the urgent needs of youth, such as employment opportunities, remain unaddressed, serving as fertile ground for conflict and instability. The Liberian government has made some effort to solve youth unemployment, including the Youth Opportunities Project that has supported over 14 000 young people as of June 2021. These youths are being provided business and life-skills training as well as subsidies to engage in communal farming.
In addition, 40.6% of the population is under the age of 15 years and 27.4% is under the age of 30 years. The relatively large cohort of children under the age of 15 constrains the materialisation of the demographic dividend. With the expected decline in the fertility rate from 4.4 births per woman in 2019 to 3 births in 2043, it is projected that the proportion of people below the age of 15 years will fall to 33% over the next 24 years. This signals the likelihood of a demographic transition, increasing the share of people under the age of 65 years from 28.6% in 2019 to 34.5% in 2043. The average life expectancy in Liberia was 64.7 years in 2019 but is estimated to increase to 72.2 years in 2043. The relatively low life expectancy is mainly due to a high disease burden as a result of communicable and non-communicable diseases. With an expected decline in communicable diseases by 2043, life expectancy is projected to increase within the period. However, rise in non-communicable diseases is predicted to continue undermining the increase in life expectancy.
In 1990, over 55% of the population of Liberia resided in urban areas. The proportion of people residing in rural areas steadily declined from 64.8% in 1980 to 48.2% in 2019, achieving rural–urban parity in 2016. It is projected that by 2043, the percentage of people living in rural areas will decline even further to 39.7% of the population, signifying ongoing urbanisation. The increase in rural–urban migration is attributable to the over-concentration of infrastructure and social services in Monrovia, as the Liberian economy is Monrovia-centric. This has created large inequalities between Monrovia and other parts of the country regarding the provision of social amenities as well as employment and educational opportunities. The rapid rural to urban population growth in the country will put pressure on the existing social amenities and infrastructure in the capital and requires careful planning.
The vast majority of Liberia’s population is sprawled throughout the Greater Monrovia District. Pockets of well-defined urban settlements are located next to the coast, including Greenville, Buchanan and Harper as well as next to the main road corridor leading from the coastal capital of Monrovia to Ganta on the border of Guinea. The country is just over 111 000 km2 with an average density of 0.5 people per hectare. However, the density ranges from 28 people per hectare in densely built up areas to 1 person per hectare in the sparsely populated areas in the south. In the Current Path forecast, population density is likely to increase to 0.8 people per hectare.
The GDP of Liberia doubled over the three decades from 1990 to 2019, growing from US$1.6 billion to US$3.2 billion. The slow growth in GDP within this period can mainly be attributed to the instability due to war in the country. Liberia had two major civil wars within this period: the first civil war from 1989 to 1996, and the second civil war from 1999 to 2003. During the first civil war, the Liberian economy was in recession, recording negative growth rates until 1996 when it started recovering and recording positive growth. This economic growth was interrupted between 2003 and 2004 mainly by a UN embargo placed on Liberia’s timber exports for their support of rebels of the Revolutionary United Front in Sierra Leone, which crippled the Liberian economy. However, after the return to constitutional rule in 2006, the country implemented reforms such as the Poverty Reduction Strategy (PRS), Lift Liberia (2008–2011) and Agenda for Transformation, all aimed at economic recovery and sustained growth. This led to a period of stable growth until the Ebola crisis in 2014, which again had a disastrous impact on the economy. By 2019, a negative growth of the economy was recorded partly due to the weakness of the currency and the external sector. Over the next 22 years, Liberia’s GDP is estimated to more than triple growing to US$10.8 billion by 2043. This increase in GDP reflects the greater economic growth expected to occur within the next 22 years compared to previous years.
Although many of the charts in the sectoral scenarios also include GDP per capita, this overview is an essential point of departure for interpreting the general economic outlook of Liberia.
From 1990 to 1996, the GDP per capita for Liberia declined from US$954 to US$287 before assuming an upward trend. As indicated earlier, the low GDP per capita was mainly as a result of the instability in the country during this period. As of 2019, Liberia’s GDP per capita had increased to US$1 208, constituting a 28.7% increase over the 29-year period; this is US$452 below the average for low-income Africa and more than US$4 000 below the average for Africa. This gap is expected to widen to US$1 224 by 2043. This suggests that Liberia either has a higher population growth rate or slower economic growth compared to the average for low-income country in Africa. The historical increase in GDP per capita reflects the relatively high GDP growth compared to population over the period. With an expected increase in GDP and decline in fertility rates, the GDP per capita will rise over the next 22 years, such that by 2043, the GDP per capita will have more than doubled to US$2 566.
The size of the informal sector in Liberia was equivalent to 39.4% of GDP in 2019. This is expected to decline to 31.4% by 2043, constituting an 8 percentage point decrease over the next 24 years. In 2019, the total number of people employed by the informal economy constituted 60% of the total labour force, but this is expected to decline to 47.7% in 2043. It is therefore not surprising that the level of informality will also decline within the same period. In 2016, the informal sector accounted for 87% of employment in Liberia. This figure is even higher among women, youth and rural dwellers. Informal activities are mainly in the areas of trade including street selling, selling in the marketplaces and other casual labour activities. Most informal workers in the country are poor, living a hand-to-mouth existence. Throughout the period under consideration, the size of the informal sector in Liberia is higher than the average for low-income African countries. This suggests that Liberia has performed relatively poorer in formalising its economy compared to other African countries within its income group.
The IFs platform uses data from the Global Trade and Analysis Project (GTAP) to classify economic activity into six sectors: agriculture, energy, materials (including mining), manufactures, services and information and communications technology (ICT). Most other sources use a threefold distinction between only agriculture, industry and services with the result that data may differ.
The three largest contributors to GDP in Liberia are service, agriculture and materials, respectively. In 2019, the service sector contribution to GDP was about US$1.5 billion, representing 47.3% of GDP. This is not surprising given that the service sector share of total employment in the country increased from 33% in 1991 to 47.2% in 2019. This is expected to increase to US$6.3 billion by 2043, representing 57.9% of GDP, suggesting that the country may still rely quite heavily on the service sector for job creation in coming years. The agricultural sector, which also employs about 42.6% of the total labour force, is currently the second largest contributor to GDP with a share of 33.1%, constituting about US$0.98 billion in 2019. The materials sector is the third most significant contributor to GDP with a share of 9.9%. However, it is expected that the materials sector will overtake the agriculture sector as the second largest contributor to GDP, so that by 2043, the manufacturing sector will contribute 2 percentage points more to GDP than agriculture. While the declining share of the agriculture sector and the increasing share of the service sector is consistent with the economic transformation of the economy, the negligible contribution of the manufacturing sector, which is key to economic transformation and the creation of sustainable decent employment, is a concern.
The data on agricultural production and demand in the IFs forecasting platform initialises from data provided on food balances by the Food and Agriculture Organization (FAO). IFs contains data on numerous types of agriculture but aggregates its forecast into crops, meat and fish, presented in million metric tons. Chart 9 shows agricultural production and demand as a total of all three categories.
The average crop yield for 2019 was 2.9 metric tons per hectare. In 1990, Liberia’s demand for agricultural products outstripped domestic production by 130 000 metric tons, which increased to 560 000 metric tons in 2019. These supply shortfalls can partly be attributed to the declining interest in the agriculture sector reflected in the share of total employment. From 1995 to 2019, the sector’s share of total employment reduced from 57.1% to 46.2%. Although the yield per hectare for crops is expected to increase from 2.9 metric tons per hectare in 2019 to 3.7 metric tons per hectare in 2043, the gap between demand and production will widen. By 2043, demand will outstrip domestic production by about 2.31 million metric tons, representing a 313% gap increase over the period. This raises concerns about food security in the country in the next 22 years.
There are numerous methodologies for and approaches to defining poverty. We measure income poverty and use GDP per capita as a proxy. In 2015, the World Bank adopted the measure of US$1.90 per person per day (in 2011 international prices), also used to measure progress towards the achievement of Sustainable Development Goal 1 of eradicating extreme poverty. To account for extreme poverty in richer countries occurring at slightly higher levels of income than in poor countries, the World Bank introduced three additional poverty lines in 2017:
- US$3.20 for lower middle-income countries
- US$5.50 for upper middle-income countries
- US$22.70 for high-income countries.
As a low-income country, Liberia uses the US$1.90 per day benchmark. The country is the nineth poorest country in Africa and the world. As of 2019, there were still over 3.1 million people, constituting 62.9% of the Liberian population, who lived on less than US$1.90 per day. This number is expected to increase until it peaks in 2029 with 4.8 million poor people (more than 77% of the population) living below the poverty line. Afterwards, there is a downward turn, so that by 2043, there will still be 2.6 million people (31.9% of the population) who live on less than US$1.90 per day. This means that although the proportion of the extremely poor population will reduce by 10.7 percentage points (compared to 2019), the absolute number of poor people in the country will be 700 000 people more than its level in 2019 due to a population growth rate that is outpacing development progress. Throughout the period 2019 to 2043, the proportion of poor people in Liberia is higher than the average for low-income countries in Africa. However, the gap in extreme poverty between Liberia and the projected average for low-income countries in Africa is expected to narrow from 35.8 percentage points in 2025 to 6.7 percentage points in 2043. Poverty is more prevalent in the rural areas of Liberia than in the urban centres albeit a huge problem in Monrovia. It is also more widespread in the hinterland than in the coastal districts.
The IFs platform forecasts six types of energy, namely oil, gas, coal, hydro, nuclear and other renewables. To allow comparisons between different types of energy, the data is converted into billion barrels of oil equivalent (BBOE). The energy contained in a barrel of oil is approximately 5.8 million British thermal units (MBTUs) or 1 700 kilowatt-hours (kWh) of energy.
Gas has been the main energy produced in Liberia, with a total production of 3 million BOE in 2019, constituting about 91% of total energy production. Hydro productions constitute the remaining 9%. Although the civil war destroyed almost all the installed hydroelectric capacity in the country, there is still potential for the development of hydroelectric power in Liberia. It is expected that by 2042, Liberia will switch to the production of other renewable energies such that by 2043, renewable energy will constitute 8% of the total energy production. Total gas production in the country is projected to increase to 11 million BOE in 2043, representing 88% of total energy production. The share of hydro in total energy production will decline to 3.2% in 2043.
Carbon is released in many ways, but the three most important contributors to greenhouse gases are carbon dioxide (CO2), carbon monoxide (CO) and methane (CH4). Since each has a different molecular weight, IFs uses carbon. Many other sites and calculations use CO2 equivalent.
Liberia has significantly low levels of carbon emissions, partly due to low industrial activity. The manufacturing sector in Liberia is virtually non-existent, with almost every manufactured product in the country imported. The share of industry in total employment declined from 12.2% in 1991 to 9.8% in 1996 and increased to 10.2% in 2019. Some factors constraining industrialisation in Liberia include low skilled labour, poor infrastructure and lack of access to credit, among others. Carbon emissions increased steadily from 1990 to 2019, from 100 000 tons of carbon to 330 000 in this period. In the Current Path forecast, carbon emissions are forecast to increase to 1.5 million tons by 2043, the result of the projected increase in industrial activity in coming years.
Sectoral Scenarios for Liberia Development Futures
Download to pdfThe Stability scenario represents reasonable but ambitious reductions in risk of regime instability and lower levels of internal conflict. Stability is generally a prerequisite for other aspects of development and this would encourage inflows of foreign direct investment (FDI) and improve business confidence. Better governance through the accountability that follows substantive democracy is modelled separately.
The intervention is explained here in the thematic part of the website.
In 2019, Liberia’s score on the governance security index was 0.66. This is below the average score of 0.69 for Africa and slightly above the average for low-income Africa at 0.64. Although political parties were legalised in 1984 and civilian rule began two years later, the country’s political unrest and civil wars disallowed stable leadership in the 1990s and early 2000s. Fortunately, in 2003, the ECOWAS-led peace talk agreement in Accra resulted in a National Transitional Government. This power-sharing agreement in 2003 ended fighting and paved the way for democratic elections and governance in 2006. Ellen Johnson Sirleaf was elected president in 2006 and stabilised the country. Since then, the country has enjoyed some political stability. The 2017 elections brought into power the government led by George Weah, although there were allegations of fraud. This was the first time in 73 years that there has been a transfer of power from one democratic government to another. However, there have been periodic protests and demonstrations against the incumbent government mainly due to corruption allegations and economic underperformance. Compared to the average for low-income countries in Africa, Liberia has a high level of governance security. By 2043, it is expected that Liberia’s score will be 0.14 more than the average for low-income countries in Africa. In the Stability scenario, Liberia’s score on the governance security index is projected to rise from 0.66 to 0.85 in 2043, which is 0.09 points higher than the Current Path forecast for the same year.
The GDP per capita of Liberia in 2019 was US$1 208, which was US$4 520 less than the average for low-income countries in Africa. In the Stability scenario, the GDP per capita is projected to increase to US$2 664 by 2043. This will be US$98 more than the Current Path forecast and US$1 126 below the average for low-income countries in Africa. Regime stability and a peaceful environment inspire investor confidence and attract FDI into the country, with a positive effect on economic growth. It is therefore not surprising that the political stability in the country since 2006 is yielding positive results in attracting FDI and leading to growth.
As Liberia is a low-income country, it uses the global benchmark of US$1.90 per day. In 2019, 3.1 million poor people (about 63% of the population) were living on less than US$1.90. The Stability scenario reduces the portion of people living below the poverty line to 29.6% by 2043, which is 2.3 percentage points below the Current Path forecast but 4.4 percentage points above the average for low-income countries in Africa. Likewise, the number of poor people will decline to 2.6 million people in 2043 in the Stability scenario. This means that the materialisation of the Stability scenario could lead to 200 000 fewer poor people than in the Current Path forecast in 2043.
This section presents the impact of a Demographic scenario that aims to hasten and increase the demographic dividend through reasonable but ambitious reductions in the communicable-disease burden for children under five, the maternal mortality ratio and increased access to modern contraception.
The intervention is explained here in the thematic part of the website.
Demographers typically differentiate between a first, second and even a third demographic dividend. We focus here on the contribution of the size of the labour force (between 15 and 64 years of age) relative to dependants (children and the elderly) as part of the first dividend. A window of opportunity opens when the ratio of the working-age population to dependants is equal to or surpasses 1.7.
In 2019, the ratio of the working-age persons to dependants was 1.3:1, meaning that there were 1.3 working-age people for each dependant in the country. This is greater than the average of 1.2 for low-income countries in Africa. Generally, the demographic dividend materialises when the country reaches a minimum ratio of 1.7 working-age persons for each dependant. While in the Current Path forecast the country will not reach its demographic dividend by 2043, in the Demographic scenario, Liberia is expected to reach this minimum ratio by 2040, two years earlier than the average for low-income countries in Africa, and it will continue to improve thereafter. The materialisation of the demographic dividend in the Demographic scenario can be explained by increased access to modern contraceptives which will lead to a decline in fertility rates. In the Demographic scenario, fertility rates are expected to decline to 2.3 births per woman in 2043 compared to three births per woman in the Current Path forecast within the same period. By 2043, 72.6% of fertile women will use modern contraceptives, representing a 41.3 percentage-point increase in 2019 — 19.7 percentage points higher than the Current Path forecast for 2043.
The infant mortality rate is the number of infant deaths per 1 000 live births and is an important marker of the overall quality of the health system in a country.
The infant mortality rate in Liberia in 2019 was 52.5 deaths per 1 000 live births, meaning that for every 1 000 infants that were born, about 53 died. This figure was higher than the average of 48.5 for low-income countries in Africa. The main causes of infant mortality in the country are malaria, diarrhoea and dysentery. By 2043, the Demographic scenario will lead to a decline in infant mortality to 18.8 deaths per 1 000 live births, which is 5.4 fewer deaths per 1 000 live births than in the Current Path forecast at 24.2 and 2.4 deaths lower than the average for low-income countries in Africa.
In 2019, the GDP per capita for Liberia was US$1 208, which was US$452 lower than the average for low-income African countries. By 2043, based on the Demographic scenario, the GDP per capita will increase to US$2 669, which is US$103 more than the projected US$2 566 in the Current Path forecast in the same year. However, this will still be significantly below the US$3 790 average for low-income countries in Africa. The additional increase in GDP per capita as a result of the Demographic scenario can partly be attributed to the reduction in population growth as a result of a further decline in fertility rates emanating from improved access to contraceptives. It can also be attributed to economic growth arising from the materialisation of the demographic dividend.
As noted earlier, the number of people in Liberia living below the poverty line of US$1.90 in 2019 was 3.1 million. Based on the Demographic scenario, this number will rise to 4.8 million people in 2029, after which it will decline to 2.3 million in 2043, which will be about 300 000 fewer people than in the Current Path forecast. Similarly, the proportion of the poor population will be reduced to 29% in the Demographic scenario, which is about 2.9 percentage points lower than in the Current Path forecast but 3.8 percentage points higher than the average for low-income countries in Africa in 2043. The decline in both the number and portion of poor people based on the Demographic scenario reflects the decline in the population size as a result of the use of modern contraceptives that reduce fertility rates. This is because the decrease in the number of children per household increases the per unit expenditure of households and government on every child. Ultimately, this leads to greater investment in education and healthcare with positive implications for human capital formation and poverty reduction.
This section presents reasonable but ambitious improvements in the Health/WaSH scenario, which include reductions in the mortality rate associated with both communicable diseases (e.g. AIDS, diarrhoea, malaria and respiratory infections) and non-communicable diseases (NCDs) (e.g. diabetes), as well as improvements in access to safe water and better sanitation. The acronym WaSH stands for water, sanitation and hygiene.
The intervention is explained here in the thematic part of the website.
An increase in life expectancy can be the result of a reduction in mortality caused by communicable and non-communicable diseases. It can also be achieved through improved sanitation and access to safe water. The life expectancy at birth for the average Liberian was 64.7 years in 2019, which was slightly below the average of 63.8 for low-income countries in Africa. On average, females have a slightly higher life expectancy at birth (65.1 years) than males (64.2 years). Based on the Health/WaSH scenario, life expectancy is estimated to increase to about 72.9 by 2043, which is an increase of seven months above the Current Path forecast of 72.2 and 24 months above the average of 70.9 years for low-income African countries. Females will continue to have a higher life expectancy than males in the period under consideration This increased life expectancy in the country can be attributed to the expected improvement in access to safe water and sanitation (100% of population by 2043), as well as a reduction in mortality from communicable diseases. However, deaths from non-communicable diseases continue to be a problem.]
The infant mortality rate per 1 000 live births in 2019 was 52.5. By 2043, infant mortality per 1 000 live births in the country will be 22.1 in the Health/WaSH scenario, compared to 24.2 in the Current Path forecast. However, the estimate in the Health/WaSH scenario will be higher than the projected average of 21.2 for low-income countries in Africa.
The Agriculture scenario represents reasonable but ambitious increases in yields per hectare (reflecting better management and seed and fertiliser technology), increased land under irrigation and reduced loss and waste. Where appropriate, it includes an increase in calorie consumption, reflecting the prioritisation of food self-sufficiency above food exports as a desirable policy objective.
The intervention is explained here in the thematic part of the website.
The data on yield per hectare (in metric tons) is for crops but does not distinguish between different categories of crops.
In 2019, the average yield per hectare of crops was 2.9 metric tons per hectare, which was higher than the average of 2.7 metric tons per hectare for low-income countries in Africa. In the Current Path forecast, this is projected to increase to 3.7 metric tons per hectare by 2043. In the Agriculture scenario, the average yield will be 6.9 metric tons per hectare — far above the average of 3.5 for low-income countries in Africa. This means that if Liberia is able to adopt modern methods of farming including the use of fertiliser and improved seeds, there will be a resulting increase of an extra 3.3 metric tons per hectare compared to the Current Path forecast in 2043.
In 2019, the net agricultural import was 22.5% of agricultural demand in the country, which was above the average of 7.5% for low-income countries in Africa. Import dependence is a structural problem common in most African economies, and Liberia is no exception to this phenomenon despite its youthful population. For instance, the country imports more than 80% of its rice consumption. In 2016, over 2.2 million Liberians could not meet their basic food needs, of whom almost 68% resided in rural areas. Factors accounting for the underperformance of the agriculture sector in Liberia include poor land ownership structure, inadequate road infrastructure to facilitate movement of goods, lack of access to farming equipment and tools, low application of fertilisers and pesticides and inadequate storage facilities. Other problems in the sector include lack of access to capital and inadequate expertise in the field.
Consequently, the country has always had a net positive import dependence as a per cent of the total demand. The Current Path forecast is that import dependence will grow to 44.9% of the total demand by 2043. The situation is mitigated in the Agriculture scenario such that by 2043, the country’s import as per cent of total agricultural demand will reduce to 13.4%. This balance will also be lower than average for low-income countries by about 18.9 percentage points, suggesting that there is a lot of potential that is yet to be tapped in terms of agriculture production in Liberia.
The Agriculture scenario is expected to lead to an increase in GDP per capita over the years. By 2043, GDP per capita as a result of the Agriculture scenario will increase from US$1 208 in 2019 to US$2 912, constituting about a 141% increase over the period. These estimates are greater than the projections in the Current Path forecast, such that by 2043, the additional gains from GDP per capita as a result of the Agriculture scenario will be US$346. In the Agriculture scenario, Liberia’s GDP per capita will still remain below the average for low-income countries in Africa. Indeed, the gap in GDP per capita between Liberia and its peer group is projected to widen from US$452 in 2019 to US$878 in the Agriculture scenario.
Implementing good agricultural policies that result in increased yield per hectare and reduction in waste appear to have a significant impact on poverty reduction in the country. In the Current Path forecast, 2.6 million people (31.9% of the population) are projected to be extremely poor by 2043. However, in the Agriculture scenario, the number of people living below the poverty line of US$1.90 will be reduced to 1.7 million, constituting 21.3% of the population. This means that 900 000 additional Liberians can be lifted out of extreme poverty by focusing on agricultural growth. This is not surprising since the majority of the rural poor population depends on agriculture as the main source of livelihood. Throughout the period, in the Agriculture scenario, the proportion of people living in extreme poverty in Liberia will be higher than the average for low-income countries in Africa, although the gap eventually closes. By 2043, the poverty rate in Liberia will be 3.9 percentage points below the average for low-income countries in Africa compared to the 15.1 percentage points gap in 2019.
The Education scenario represents reasonable but ambitious improved intake, transition and graduation rates from primary to tertiary levels and better quality of education. It also models substantive progress towards gender parity at all levels, additional vocational training at secondary school level and increases in the share of science and engineering graduates.
The intervention is explained here in the thematic part of the website.
In 2019, Liberia’s mean number of years of education was 5, which was above the average of 4.4 for low-income countries on the continent. This is not surprising given that education in Liberia is compulsory for children between 7 and 16 years old and free at both the primary and secondary levels. In terms of gender, the mean years of education for males was 6, which was 1.9 years more than the female average of 4.1. This means that on average, men were more likely to attain a higher education level than women. This gap in favour of men for mean years of education in Liberia is higher than the average of 1.3 years for low-income countries in Africa. By 2043, in the Education scenario, the mean years of education will rise to 7.1 years — 0.4 years more than the Current Path estimates and a year more than the average for low-income countries in Africa. Also, in the Education scenario, the gender gap for mean years of education will close by 0.8 years by 2043, while the gender gap closes by 0.5 years on average in low-income countries in Africa within the same period.
The average test score for primary learners in Liberia for 2019 was 26.6%, which is below the average of 27.7% for low-income countries in Africa. Educational infrastructure in the country is highly concentrated in the capital Monrovia. Public schools are poorly managed and operated with inadequate educational infrastructure and learning tools, in addition to the many unskilled and unqualified teachers in the public school sector. Private schools are too expensive for poor people to afford, and as such, quality education in Liberia has become a luxury for the rich and elite. To address these challenges, the country developed a strategic policy as part of its Getting to Best Education Sector Plan for 2017–2021.
The Education scenario increases the average test scores for primary learners to 35.8%, compared to the Current Path forecast estimate of 30.4%. Also, in 2043, the Education scenario overtakes the continental average for low-income countries by 5.2 percentage points. In 2019, the average secondary learner test score for Liberia was 37.4%, which was above the average of 35.8% for low-income African countries. This suggests that Liberia performs relatively better at the secondary level than at the primary level. Also, the country’s performance for its secondary learners is better than the average for low-income African countries. By 2043, the average test score for secondary learners is projected to rise to 46.5% in the Education scenario, which is above the Current Path estimates of 38.7% and the average of 37.8% for low-income countries in Africa.
By 2043, the increase in GDP per capita as a result of the Education scenario is estimated to be only US$91 more than the projected US$2 566 in the Current Path forecast. This will still be US$1 133 less than the average of US$3 790 for low-income countries in Africa. Investing in education is a powerful way to improve productivity, growth and the income prospects of the poor. However, it takes time to yield results as it takes more than a decade for a child enrolled today in primary school to make meaningful contributions to the economy.
By 2043, in the Education scenario, there will be 2.4 million more poor people (29.4% of the population). This means that the Education scenario contributes to reducing the number of poor people by 208 000 people in 2043, compared to the Current Path forecast — evidence of the time it takes for education to impact poverty reduction usually because of the length of schooling and the initial lag in employment after school. The proportion of poor people based on the Education scenario in Liberia will be 4.2 percentage points higher than the average for low-income countries in Africa.
The Manufacturing/Transfers scenario represents reasonable but ambitious manufacturing growth through greater investment in the economy, investments in research and development, and promotion of the export of manufactured goods. It is accompanied by an increase in welfare transfers (social grants) to moderate the initial increases in inequality that are typically associated with a manufacturing transition. To this end, the scenario improves tax administration and increases government revenues.
The intervention is explained here in the thematic part of the website.
Chart 30 should be read with Chart 8 that presents a stacked area graph on the contribution to GDP and size, in billion US$, of the Current Path economy for each of the sectors.
Based on the Manufacturing/Transfers scenario, the service sector will be the largest contributor to GDP with an absolute contribution of US$0.51 billion more by 2043 compared to the Current Path forecast. The size of the service sector’s contribution to GDP will increase, reaching 0.52 percentage points in 2043. The materials sector, which is the second largest contributor to Liberia’s GDP, is also projected to contribute an additional US$0.12 billion to GDP by 2043, though its rate of contribution declines from 0.38% in 2039 to 0.1% of GDP based on the Manufacturing/Transfers scenario. Although the third largest contributor to GDP in Liberia is the manufacturing sector, with a contribution of US$0.09 billion, its rate of contribution will overtake the materials sector as the second largest by 2041. It is significant to note that the rate of the contribution of the agriculture sector to GDP based on the difference between the Manufacturing/Transfers scenario and Current Path forecast is expected to worsen from -0.18% in 2030 to -0.70% in 2043. While a decline in the share of agricultural contribution to GDP can be attributed to the structural transformation of the economy, its underperformance is a concern for food security in the country. Likewise is the underperformance of the manufacturing sector which is supposed to create sustainable employment.
The Liberian government’s welfare transfers to households are extremely low. In 2019, total welfare transfer to households were US$0.05 billion. This amount is projected to increase to US$1.2 billion by 2043 in the Manufacturing/Transfers scenario, representing an increase of 2300%. It is more than the US$0.7 billion estimated for 2043 based on the Current Path forecast. This suggests that the Manufacturing/Transfers scenario can lead to an improvement in government welfare transfers by an additional US$0.53 billion compared to the Current Path in 2043.
By 2043, it is estimated that the GDP per capita will rise to US$2 689, which is US$123 more than projections in the Current Path forecast. The GDP per capita for Liberia by 2043 in the Manufacturing/Transfers scenario will however still be below the average of US$3 790 for low-income countries in Africa and significantly below the average of US$7 157 for Africa.
Between 2030 and 2040, the Current Path forecast leads to a quicker reduction in both the absolute number and proportion of poor people in Liberia compared to the Manufacturing/Transfers scenario. However, after 2040, the Manufacturing/Transfers scenario overtakes the Current Path forecast such that by 2043, an estimated 236 000 people can be lifted above the poverty line of US$1.90 per day as a result of the Manufacturing/Transfers scenario. This means that if the country embarks on policies such as investment in the economy, research and development, as well as export promotion, the absolute number of poor people will likely be 236 000 fewer than on the Current Path in 2043. Nonetheless, the proportion of poor people in Liberia based on the Manufacturing/Transfers scenario in 2043 will be about 3.8 percentage points higher than the average for low-income countries in Africa.
The Leapfrogging scenario represents a reasonable but ambitious adoption of and investment in renewable energy technologies, resulting in better access to electricity in urban and rural areas. The scenario includes accelerated access to mobile and fixed broadband and the adoption of modern technology that improves government efficiency and allows for the more rapid formalisation of the informal sector.
The intervention is explained here in the thematic part of the website.
Fixed broadband includes cable modem Internet connections, DSL Internet connections of at least 256 KB/s, fibre and other fixed broadband technology connections (such as satellite broadband Internet, ethernet local area networks, fixed-wireless access, wireless local area networks, WiMAX, etc.).
In 2019, the total number of fixed broadband subscriptions in Liberia was 2.7 per 100 people, which was slightly above the average for low-income countries in Africa at 2.3. In the Current Path forecast, fixed broadband subscriptions are expected to rise to 41.1 per 100 people by 2043. The Leapfrogging scenario will lead to a greater increase in fixed broadband subscriptions as compared to the Current Path forecast, with a difference of almost nine subscriptions per 100 people by 2043. Across the forecast horizon, fixed broadband subscriptions in Liberia are expected to be higher than the average for low-income African countries.
Mobile broadband refers to wireless Internet access delivered through cellular towers to computers and other digital devices.
Liberia had mobile broadband subscriptions of 10.2 per 100 people in 2019 — less than half the average of 22.9 for low-income countries on the continent. Mobile broadband subscriptions in the Leapfrogging scenario are projected to rise quickly above the Current Path forecast although the gap between them closes by 2043. For instance, the difference in mobile broadband subscriptions between the two scenarios will close from 58.7 per 100 people in 2029 to 10.5 subscriptions per 100 people. By 2043, mobile broadband subscriptions in the Leapfrogging scenario will increase to 147.3 per 100 people, greater than the average of 133.9 per 100 for Africa’s low-income countries.
In 2019, 1 million people in Liberia (only 20.9% of the total population) had access to electricity. This is far below the average of 32.2% for low-income countries in Africa. There is also a large rural–urban disparity in terms of access to electricity. Only 6.3% of rural dwellers had access to electricity compared to the 34.7% of urban dwellers in 2019. In the Leapfrogging scenario, it is projected that by 2043, 61.1% of Liberians (constituting almost 5 million people) will have access to electricity. This is higher than the 50.7% (4.1 million people) projected in the Current Path forecast, signifying that the Leapfrogging scenario can provide access to electricity to an additional 850 000 people. This is slightly above the projected average of 60.5% for low-income countries. Also, the disparity in access to electricity based on location will continue such that by 2043, based on the Leapfrogging scenario, 74.7% of all the people in urban centres will have access to electricity. However, in the case of rural dwellers, 40.8% will have access to electricity by 2043. The Leapfrogging scenario also closes the urban-rural gap in terms of access to electricity quicker than the Current Path forecast.
Liberia’s GDP per capita is projected to increase from US$1 208 in 2019 to US$2 718 in 2043 in the Leapfrogging scenario. This represents an increase of US$152 compared to the Current Path forecast in 2043; however, it still falls below the average of US$3 790 for low-income countries in Africa.
In the Leapfrogging scenario, the number of poor people in 2043 is projected to be 2.4 million, representing 29.4% of the population. This projection is marginally lower than the 2.6 million poor people estimated in the Current Path forecast in the same year, which suggests that the number of poor people in the Leapfrogging scenario is about 200 000 fewer than the Current Path forecast in 2043. The number of poor people projected in the Leapfrogging scenario in 2043 is 4.2 percentage points higher than the average for low-income African countries.
The Free Trade scenario represents the impact of the full implementation of the African Continental Free Trade Area (AfCFTA) by 2034 through increases in exports, improved productivity and increased trade and economic freedom.
The intervention is explained here in the thematic part of the website.
The trade balance is the difference between the value of a country's exports and its imports. A country that imports more goods and services than it exports in terms of value has a trade deficit, while a country that exports more goods and services than it imports has a trade surplus.
Liberia, like many African economies, is a net importer of goods and services. In 2019, Liberia’s trade deficit represented 36.3% of GDP. The main imports of the country are fuels, machinery, grains, vehicles, manufactured goods and foods, and chemicals. The economy also depends on the importation of equipment and raw materials. This deficit will improve until it reaches a peak of a 9.2% deficit in the Current Path forecast and an 8.2% deficit in the Free Trade scenario in 2025. Afterwards, Liberia will experience a worsening trade balance in both the Current Path forecast and the Free Trade scenario, although the decline is much quicker in the former. This downward trend will continue until it reaches a deficit of about 33.6% of GDP in the Current Path forecast in 2031 and 31.6% in the Free Trade scenario in 2032. However, by 2043, the projected trade deficit in both the Current Path forecast and Free Trade scenario will be 16.1% of GDP. With the exception of the period between 2023 and 2026, Liberia’s trade deficit as a percentage of GDP is higher than the average for low-income African countries in the forecast period, so that by 2043, Liberia’s trade deficit will be 9.1 percentage points of GDP higher than the average for low-income African countries.
The GDP per capita for Liberia is estimated to increase to US$2 773 by 2043 in the Free Trade scenario, which is US$207 more than the projections of the Current Path in 2043. This suggests that Liberia can take advantage of the AfCFTA to increase trade and productivity equivalent to an extra US$207 increase in GDP per capita compared to the Current Path forecast in 2043. Nonetheless, the average GDP per capita of US$3 790 for low-income African countries is US$1 017 higher than the projected value for Liberia in the Free Trade scenario.
The number and proportion of poor people in Liberia is projected to decrease in the Current Path forecast and in the Free Trade scenario, although the latter leads to a slightly quicker reduction compared to the former. In the Free Trade scenario, by 2043, the number of people living below the poverty line of US$1.90 will be about 2.3 million people, representing 28.7% of the population. This is 3.2 percentage points lower than the Current Path forecast, meaning that the Free Trade scenario has 260 000 fewer poor people than the Current Path forecast by 2043. The proportion of poor people projected in the Free Trade scenario is still higher than the average for low-income countries in Africa.
The Financial Flows scenario represents a reasonable but ambitious increase in worker remittances and aid flows to poor countries, and an increase in the stock of foreign direct investment (FDI) and additional portfolio investment inflows to middle-income countries. We also reduced outward financial flows to emulate a reduction in illicit financial outflows.
The intervention is explained here in the thematic part of the website.
Liberia has been a large beneficiary of foreign aid and relies heavily on foreign and donor assistance for development. The total foreign aid received by Liberia in 2019 was 31.3% of GDP, which was far above the average of 8.6% for low-income countries in Africa. From 2010 to 2017, the country received an average of US$776 million per year in aid. However, aid to the country has begun to decline such that total aid to the country declined from US$359 per capita in 2010 to about US$130 in 2013, although it increased briefly during the Ebola crisis. Although foreign aid to Liberia in absolute terms is projected to rise, foreign aid as a percentage of GDP is expected to decline such that by 2043, the total foreign aid received by the country is projected to be 18.3% of GDP in the Financial Flows forecast and 17.7% of GDP in the Current Path forecast. This suggests that in the Financial Flow scenario, foreign aid as a percentage of GDP is higher than in the Current Path forecast in 2043. These projections are still above the average for a low-income African country which is projected to be about 3.85% of GDP in 2043. The decline in foreign aid is expected given that projected growth and expansion is anticipated to occur in the future, resulting in a higher GDP that automatically disqualifies the country from certain aid packages. It may also be that GDP outgrows foreign aid in the country.
Liberia’s total FDI in 2019 amounted to 13.9% of GDP, which is much higher than the average of 4.3% for low-income African countries. Although many businesses left Liberia during the civil war, taking their capital and expertise along, the current relative stability in the country has resulted in increased FDI of US$86.7 million in 2019. FDI inflows to the country are mainly in the areas of mining, agriculture, forestry (timber) and financial services. Weak regulatory frameworks, corruption and a lack of transparency in awarding contracts are some of the factors constraining FDI inflows to the country. By 2043, it is projected that the total FDI to the country will increase to 17.5% of GDP in the Current Path forecast. In the Financial Flows scenario, FDI is projected to be around 19.6% of GDP in 2043, which is 15 percentage points above the average for low-income countries on the continent.
In 2019, the total value of remittances that Liberia received amounted to US$0.18 billion, which constituted about 5.7% of GDP. This is significantly higher than the average of 1.1% for low-income African countries. Although the absolute value of remittance is projected to increase over the period, remittances as a percentage of GDP will fall. In the Financial Flows scenario, remittance is projected to increase to US$0.37 billion in 2043, representing 3.1% of GDP. Remittances will decline quicker in the Current Path forecast, so that by 2043, the total value of remittances in the country will be about US$0.23 billion, representing 2.1% of GDP. However, this figure will still be below the projected average of 1.3% of GDP for low-income countries in Africa.
Liberia’s GDP per capita is estimated to increase to US$2 799 by 2043 in the Financial Flow scenario. This represents an increase of US$233 over the Current Path projection in the same year. It is also below the average for low-income countries in Africa, which is projected to be US$3 790 by 2043.
Trade openness will reduce poverty in the long term after initially increasing it due to the redistributive effects of trade. Most African countries export primary commodities and low-tech manufacturing products, and therefore a continental free trade agreement (AfCFTA) that reduces tariffs and non-tariff barriers across Africa will increase competition among countries in primary commodities and low-tech manufacturing exports. Countries with inefficient, high-cost manufacturing sectors might be displaced as the AfCFTA is implemented, thereby pushing up poverty rates. In the long term, as the economy adjusts and produces and exports its comparatively advantaged (lower relative cost) goods and services, poverty rates will decline.
In the Financial Flows scenario, the total number of people projected to be living below the poverty line of US$1.90 per day will decline to two million in 2043, representing 25.1% of the total population. This estimate constitutes a reduction of about 600 000 people compared to the Current Path forecast in the same year. It is also slightly below the average of 25.2% of the total population for low-income countries in Africa.
The Infrastructure scenario represents a reasonable but ambitious increase in infrastructure spending across Africa, focusing on basic infrastructure (roads, water, sanitation, electricity access and ICT) in low-income countries and increasing emphasis on advanced infrastructure (such as ports, airports, railway and electricity generation) in higher-income countries.
Note that health and sanitation infrastructure is included as part of the Health/WaSH scenario and that ICT infrastructure and more rapid uptake of renewables are part of the Leapfrogging scenario. The interventions there push directly on outcomes, whereas those modelled in this scenario increase infrastructure spending, indirectly boosting other forms of infrastructure, including that supporting health, sanitation and ICT.
The intervention is explained here in the thematic part of the website.
Access to electricity in Liberia is significantly low. About 1 million people (20.9% of the population) have access to electricity in Liberia. This is expected to increase to 5.2 million in 2043 (63.6% of the population) in the Infrastructure scenario. This increase exceeds the projected value of 4.1 million people (50.7% of the population) in the Current Path forecast and the average of 60.5 for low-income African countries. In terms of rural–urban dichotomy, there will remain a disparity in access to electricity between urban and rural dwellers in both the Current Path forecast and in the Infrastructure scenario. By 2043, it is projected that 67.3% of urban dwellers will have access to electricity in the Current Path forecast, compared to 73.1% in the Infrastructure scenario. However, only 25.7% of rural dwellers in the Current Path forecast compared to 49.5% in the Infrastructure scenario will have access to electricity in 2043.
Indicator 9.1.1 in the Sustainable Development Goals refers to the proportion of the rural population who live within 2 km of an all-season road and is captured in the Rural Access Index.
Accessibility to rural areas is important in spurring the socio-economic development of a country and improving the living standards of rural dwellers. It enables rural dwellers to enjoy amenities from nearby urban areas while allowing urban centres to benefit more easily from the agricultural products supplied by rural areas and allows small-scale farmers to partake and to have access to economic centres and markets. In 2019, 48.9% of all rural dwellers in Liberia resided within 2 km of an all-weather road, which was higher than the average of 43% for low-income African countries. In the Infrastructure scenario, this is expected to rise to 56.5% by 2043, higher than the 53.2% projected in the Current Path forecast and the average of 51% for low-income countries in Africa.
Liberia’s GDP per capita is estimated to rise to US$2 660 by 2043 in the Infrastructure scenario. This is US$94 more than the projection in the Current Path forecast in the same year, but far below the average of US$3 790 for low-income countries in Africa. Improvement in basic infrastructure such as roads, water and electricity access are necessary for achieving economic growth.
By 2043, the proportion of the poor population is expected to decline from 62.9% in 2019 to 29.9% in the Infrastructure scenario; this corresponds to 2.5 million poor people in 2043 who will be living below the poverty line. Comparing this with the projections in the Current Path shows that there will be 150 000 fewer poor people in the Infrastructure scenario than in the Current Path forecast for the same year. This will however be higher than the estimated average of 25.2% for low-income countries in Africa.
The Governance scenario represents a reasonable but ambitious improvement in accountability and reduces corruption, and hence improves the quality of service delivery by government.
The intervention is explained here in the thematic part of the website.
As defined by the World Bank, government effectiveness ‘captures perceptions of the quality of public services, the quality of the civil service and the degree of its independence from political pressures, the quality of policy formulation and implementation, and the credibility of the government’s commitment to such policies’.
Chart 51 presents the impact of the interventions in the Governance scenario on government effectiveness.
In 2019, Liberia obtained a score of 1.1 on the World Bank government effectiveness quality score. This was lower than the average of 1.4 for low-income countries in Africa and lower than the 1.7 for Africa. In both the Current Path forecast and Governance scenario, government effectiveness is estimated to increase over the period, although the increase in the Governance scenario is higher than the increase in the Current Path forecast. The projected score for government effectiveness in the Governance scenario by 2043 is 1.79, which is 0.07 more than the projected score in the Current Path forecast. This remains below the average of 1.89 for low-income countries in Africa.
In the Governance scenario, Liberia’s GDP per capita is projected to increase to US$2 620 in 2043, which is US$54 more than the estimates in the Current Path forecast but US$1 170 less than the average for low-income countries on the continent in the same year. This suggests that good governance in the form of reducing corruption, improving the quality of service delivery and accountability can lead to an additional US$54 in GDP per capita compared with the Current Path in 2043.
The proportion of people living below the poverty line of US$1.90 per day is expected to decline to 30.6% in 2043 in the Governance scenario, which is still higher than the 25.2% average for low-income African countries. It also corresponds to only 100 000 people fewer than the 2.6 million poor people projected in the Current Path forecast for 2043.
This section presents projections for carbon emissions in the Current Path for Liberia and the 11 scenarios. Note that IFs uses carbon equivalents rather than CO2 equivalents.
The total amount of carbon emitted by Liberia in 2019 was 330 000 tons. Liberia’s carbon emissions are projected to increase in all the scenarios with total emissions projected to be about 1.5 million tons by 2043 in the Current Path forecast. The intervention with the greatest impact on carbon emissions is the Agriculture scenario, which will lead to an increase in Liberia’s carbon emissions to 1.62 million tons in 2043. This is followed by the Financial Flows and Free Trade scenarios with projected carbon emissions of 1.57 million and 1.55 million tons respectively by 2043. The intervention with the least impact on carbon emissions is the Demographic scenario which will result in carbon emissions of 1.43 million tons of carbon by 2043.
The Combined Agenda 2063 scenario consists of the combination of all 11 sectoral scenarios presented above, namely the Stability, Demographic, Health/WaSH, Agriculture, Education, Manufacturing/Transfers, Leapfrogging, Free Trade, Financial Flows, Infrastructure and Governance scenarios. The cumulative impact of better education, health, infrastructure, etc. means that countries get an additional benefit in the integrated IFs forecasting platform that we refer to as the synergistic effect. Chart 55 presents the contribution of each of these 12 components to GDP per capita in the Combined Agenda 2063 scenario as a stacked area graph.
The synergistic effect of all the scenarios on GDP per capita is estimated to be about US$278 in 2043. The scenario with the greatest impact on GDP per capita by 2043 is the Agriculture scenario with a contribution of US$346.6, followed by the Financial Flow scenario with a contribution of US$233.3, and then the Free Trade scenario with a contribution of US$207. The Health/WaSH, Governance and Education scenarios are the interventions with the least impact on GDP per capita. This suggests that in the long term, the Agriculture, Financial Flows and Free Trade scenarios have the greatest potential to improve human and economic development in Liberia.
Whereas Chart 55 presents a stacked area graph on the contribution of each scenario to GDP per capita as well as the additional benefit or synergistic effect, Chart 56 presents only the GDP per capita in the Current Path forecast and the Combined Agenda 2063 scenario.
Liberia’s GDP per capita is estimated to increase to US$4 358 in 2043 in the Combined Agenda 2063 scenario. This is US$1 792 more than the projection in the Current Path forecast, meaning that the Combined Agenda 2063 scenario will lead to an additional increase of US$1 792 in GDP per capita in 2043 compared to the Current Path forecast. Liberia’s GDP per capita in the Combined Agenda 2063 scenario will be US$568 more than the average for low-income countries in Africa in 2043. The increase in GDP per capita as a result of the Combined Agenda scenario reflects the intersectoral policy interventions that underpin the scenario which are necessary to ensure economic development in Liberia.
In the Combined Agenda 2063 scenario, the number of poor people will significantly decline such that by 2043, only 368 000 Liberians, representing 4.9% of the population, will be living below the poverty line. This is below the projected average of 25.2% for low-income African countries in the Combined Agenda 2063 scenario, although poverty levels in Liberia were much higher than its African income-peer group in 2019. Thus, compared with the Current Path, an additional 2.2 million Liberians can be lifted out of extreme poverty in the Combined Agenda 2063 scenario. The gigantic impact of the Combined Agenda 2063 scenario on poverty reduction is not surprising given that scenario reflects the summation of policy interventions across all the other scenarios.
See Chart 8 to view the Current Path forecast of the sectoral composition of the economy.
In the Combined Agenda 2063 scenario, the biggest contributors to GDP in the long term are the service, manufacturing and agriculture sectors. The manufacturing sector will overtake agriculture as the second largest contributor to GDP by 2038. By 2043, the service sector will contribute an additional US$6.6 billion (1.8 percentage points) to GDP. Although manufacturing contributes US$2.2 billion, its percentage contribution of 6.7% is the highest in 2043. Agriculture is projected to contribute US$1.2 billion although its contribution corresponds to -0.8% by 2043.
The estimated GDP (MER) for 2043 in the Combined Agenda 2063 scenario in 2043 will be US$21.6 billion, which is higher than the Current Path estimates of US$10.8 billion. This suggests that compared to the Current Path forecast, the size of the economy will more than double in the Combined Agenda 2063 scenario by 2043.
The total amount of carbon emitted by Liberia in 2019 was 330 000 tons. In the Combined Agenda 2063 scenario, the total amount of carbon emitted is projected to rise to 2.1 million tons by 2043. This is higher than the estimates of 1.5 million tons in the Current Path forecast for 2043, meaning that the Combined Agenda 2063 scenario leads to much higher carbon emissions than the Current Path — a result of increased economic activity.
Page information
Contact at AFI team is Enoch Randy Aikins
This entry was last updated on 31 May 2026 using IFs v7.63.
Donors and sponsors


Reuse our work
- All visualizations, data, and text produced by African Futures are completely open access under the Creative Commons BY license. You have the permission to use, distribute, and reproduce these in any medium, provided the source and authors are credited.
- The data produced by third parties and made available by African Futures is subject to the license terms from the original third-party authors. We will always indicate the original source of the data in our documentation, so you should always check the license of any such third-party data before use and redistribution.
- All of our charts can be embedded in any site.
Cite this research
Enoch Randy Aikins (2026) Liberia Development Futures. Published online at futures.issafrica.org. Retrieved from https://futures.issafrica.org/geographic/countries/liberia/ [Online Resource] Updated 31 May 2026.