 Ethiopia
Feedback welcome
Our aim is to use the best data to inform our analysis. See our Technical page for information on the IFs forecasting platform. We appreciate your help and references for improvements via our feedback form.
This report analyses Ethiopia’s current development path and prospects to 2043, the end of the third ten-year implementation period of the African Union’s Agenda 2063. The analysis uses scenario modelling to assess how sectoral interventions could shape Ethiopia’s economic, social and institutional trajectory. It covers eight scenarios: Demographics and Health, Agriculture, Education, Manufacturing, African Continental Free Trade Area (AfCFTA), Large Infrastructure and Leapfrogging, Financial Flows, and Governance. It also assesses the combined effect of these interventions on Ethiopia’s long-term development prospects.
Visit the Technical section for additional information on the International Futures (IFs) modelling platform, which serves as the analytical foundation for this report's scenario simulations.
The link to the Tableau Workbook.
Executive Summary
The report begins with an introductory assessment of Ethiopia’s structural context, including its geography, federal political system, population distribution, social diversity, topography and climate exposure.
- Ethiopia is a large, landlocked country in the Horn of Africa with significant strategic weight. Its development prospects depend heavily on corridor efficiency, regional diplomacy, climate resilience and the state’s ability to manage territorial diversity. The country’s ethnofederal system creates opportunities for representation and inclusion, but also generates enduring tensions around state cohesion, fiscal federalism, intergovernmental coordination and constitutional interpretation. Political stability to 2043 will depend not only on institutional design, but also on whether federal relations become more transparent, rules-based and capable of managing regional tensions.
The introduction is followed by an analysis of Ethiopia’s Current Path, which represents the country’s likely baseline or business-as-usual trajectory to 2043 if current policies and trends continue and no major disruptive shocks occur.
- Ethiopia’s population will continue to grow rapidly, rising from about 135 million in 2025 to approximately 196 million by 2043. The population structure is gradually shifting toward a larger working-age share, creating the conditions for a future demographic dividend, but this dividend will depend on job creation, education, health and gender inclusion.
- Urbanisation will continue from a low base. The urban share of the population will rise from 24% in 2025 to 33.8% by 2043, implying that the rural population will remain large. Ethiopia’s development challenge is therefore not urbanisation instead of rural development, but the simultaneous management of rapid city growth and continued large-scale rural livelihood needs.
- Gross domestic product (GDP) at market exchange rates (MER) will increase from about US$144 billion in 2025 to approximately US$553 billion by 2043 under the Current Path, implying average annual growth of around 7.8% over 2025–2043. This is strong by African standards and would make Ethiopia the fourth-largest economy in Africa by 2043, after Egypt, Nigeria and South Africa, overtaking Algeria. However, it remains below the country’s Ten-Year Development Plan (TYDP) 2021-2030 target of around 10% annual growth, indicating that the Current Path represents robust but not fully transformative growth.
- GDP per capita at purchasing power parity (PPP) will rise from about US$2 896 in 2025 to US$5 674 by 2043. This represents meaningful progress in average living standards, but still falls short of the rapid convergence implied by Ethiopia’s TYDP to become an “African Beacon of Prosperity.”
- The informal economy will remain a major structural constraint. The informal sector’s share of GDP will decline from 29.1% in 2025 to 25.2% by 2043, while informal non-agricultural employment will fall from 53.5% to 46.8%.
- Extreme poverty at the $3.00 line will decrease from 29.3% in 2025 to roughly 6% by 2043, resulting in a reduction in the number of people in extreme poverty from approximately 39.6 million to 11.8 million. However, multidimensional poverty will remain a deeper challenge unless improvements match income gains in education, health, nutrition, WaSH, electricity, housing and social protection.
- Ethiopia’s development strategy is anchored in the TYDP 2021-2030, supported by the Homegrown Economic Reform (HGER) agenda. The strategy seeks to shift Ethiopia from public-investment-led growth toward a more competitive, private-sector-led and export-oriented economy, with stronger industrialisation, macroeconomic stability and structural transformation.
The next section compares Ethiopia’s Current Path with eight sectoral scenarios. Each scenario reflects an ambitious but reasonable improvement in a specific sector, benchmarked against countries with comparable characteristics and development levels.
- The Demographics and Health scenario will improve survival outcomes, accelerate the demographic transition and strengthen the foundations for a future demographic dividend. Infant mortality is forecasted to decline faster than under the Current Path, and Ethiopia will reach the demographic-dividend threshold earlier, by 2040, compared with 2044 under the Current Path. However, these gains depend on sustained improvements in health, WaSH, education and job creation.
- The Agriculture scenario will have major implications for food security and poverty reduction by 2043. Under the Current Path, Ethiopia’s production deficit will widen significantly, but the Agriculture scenario will reverse this trend by raising production above domestic demand and returning the country to self-sufficiency levels last experienced around 1976. This confirms that agricultural transformation remains central to Ethiopia’s long-term development
- The Education scenario will increase the mean years of education for 15–24-year-olds to about 9.3 years by 2043, compared with 8 years under the Current Path. This strengthens the future workforce, but Ethiopia must still address dropout, low secondary completion, weak learning outcomes and limited science, engineering and technical skills.
- The Manufacturing scenario will increase manufacturing value added and strengthen linkages with services, ICT and materials. However, manufacturing’s gains will remain modest relative to Ethiopia’s industrialisation ambitions, indicating that stronger export competitiveness, skills, finance, logistics and firm capabilities will be needed.
- The AfCFTA scenario is forecasted to enhance Ethiopia's external position by 2043. Exports will grow at a faster rate than imports, leading to a trade surplus of approximately 3% of GDP, compared to just 0.9% under the Current Path. This surplus will help alleviate foreign exchange constraints. However, these gains will depend on improvements in productive capacity, quality standards, logistics, and integration within regional value chains.
- The Large Infrastructure and Leapfrogging scenario will significantly enhance access to electricity, clean cooking, and broadband services. By 2043, there will be considerable improvements in rural electricity access, a notable increase in the adoption of modern fuel cookstoves, and a faster expansion of fixed broadband compared to the Current Path. However, challenges related to quality, affordability, and last-mile delivery will still need to be addressed.
- The Financial Flows scenario will significantly increase fiscal space and investment, with government revenue rising to approximately 12.8% of GDP by 2043, about 0.4 percentage points above the Current Path forecast. Notably, the rise in revenue as a share of GDP suggests modest but meaningful improvements in external and domestic financial resources mobilisation, rather than growth alone.
- The Governance scenario will improve Ethiopia’s composite governance index from 0.47 in 2025 to 0.66 by 2043, compared with 0.58 under the Current Path. This would move Ethiopia closer to stronger African governance performers, such as Tunisia. The strongest gains come from security and inclusion, but state capacity remains the weakest dimension, highlighting the need for stronger public administration, accountability, coordination and service delivery.
The scenario comparison section assesses the relative impact of the eight scenarios and then examines the Combined scenario, which captures the integrated effect of all interventions.
- Governance will produce the largest gain in GDP per capita by 2043, followed closely by Education and Agriculture. This shows that Ethiopia’s strongest long-term income gains come from better institutions, higher rural productivity and stronger human capital. Poverty reduction will be strongest under the Education scenario, followed by Agriculture and Governance. This reflects the importance of skills, rural livelihoods and institutional effectiveness in reducing poverty beyond the Current Path.
- Under the Combined scenario, Ethiopia’s GDP at MER will reach approximately US$854 billion by 2043, about US$301 billion above the Current Path. Average annual growth rises to 10.3% over 2025–2043, slightly exceeding the TYDP target of 10%.
- GDP per capita at PPP will rise to about US$8 149 by 2043 under the Combined scenario, approximately US$2 474 above the Current Path. This represents a major improvement in average living standards, though distributional outcomes will depend on whether growth reaches rural areas, young people, women and poorer regions.
- The Combined scenario will produce modest but meaningful structural transformation by 2043. All sectors will expand in absolute terms, with services remaining the largest sector. Agriculture and ICT will record the largest gains in GDP share relative to the Current Path, while manufacturing will grow strongly in absolute terms, but does not dominate the economy’s structure.
- Informality will fall significantly under the Combined scenario by 2043. The informal sector’s contribution to GDP will decline to 20.8%, about 4.3 percentage points below the Current Path, while informal non-agricultural employment will fall to roughly 33%, around 13.7 percentage points below the baseline.
- Extreme poverty will fall to approximately 1.2% by 2043 under the Combined scenario, equivalent to about 2.2 million people. This is 4.8 percentage points below the Current Path and means that an additional 9.6 million people are lifted out of poverty.
- Life expectancy will rise to 75.1 years by 2043 under the Combined scenario, compared with 72 years under the Current Path. This reflects improvements in health services, income, education, nutrition, clean cooking, WaSH, infrastructure and broader living conditions.
- Fossil-fuel carbon dioxide (CO₂) emissions will rise with faster growth, reaching about 180.9 million tons by 2043 under the Combined scenario, roughly 44.6 million tons above the Current Path. However, Ethiopia will remain a very low emitter in per capita and global terms. The policy challenge is to manage the carbon intensity of growth through renewable energy, clean cooking, efficient transport, green industrial policy and climate-smart urban planning.
- Energy production will expand strongly under the Combined scenario, rising to 310.1 million barrels of oil equivalent (BOE) by 2043, with renewables accounting for 92.1% of total production. However, energy demand rises even faster to 861.6 million BOE, making energy efficiency, grid reliability, diversification and demand management central to Ethiopia’s transformation.
Ethiopia’s development trajectory to 2043 is therefore one of substantial opportunity but also significant execution risk. The Current Path points to continued growth, poverty reduction and gradual structural change, but it falls short of the country’s most ambitious transformation goals. The Combined scenario shows that Ethiopia can move much closer to those goals if reforms are implemented together rather than in isolation. The most important lesson is that Ethiopia’s development prospects depend on coordinated transformation: stronger governance, agricultural productivity, human capital, manufacturing competitiveness, regional trade, financial flows and infrastructure must reinforce one another. Without this coordination, Ethiopia can continue to grow rapidly while still facing persistent poverty, informality, regional inequality, foreign exchange constraints and implementation gaps.
All charts for Ethiopia Development Futures
- Chart 1: Political map of Ethiopia
- Chart 2: Population structure in the Current Path, 1990–2043
-
Chart 3: Population distribution map, 2023
Chart 3: Population distribution map, 2023
- Chart 4: Urban and rural population in the Current Path, 1990-2043
- Chart 5: GDP (MER) and its growth rate in the Current Path, 1990–2043
- Chart 6: Size of the informal economy in the Current Path, 2022-2043
- Chart 7: GDP per capita in Current Path, 1990–2043
- Chart 8: Extreme poverty in the Current Path, 2022–2043
- Chart 9: National Development Plan of Ethiopia
- Chart 10: Relationship between Current Path forecast and scenario
- Chart 11: Mortality distribution in the Current Path, 2025 and 2043
- Chart 12: Infant mortality rate in Current Path and Demographics and Health scenario, 2022–2043
- Chart 13: Demographic dividend in the Current Path and the Demographics and Health scenario, 2022–2043
- Chart 14: Crop production and demand in the Current Path, 1990-2043
- Chart 15: Import dependence in the Current Path and Agriculture scenario, 2022–2043
- Chart 16: Progress through the education funnel in the Current Path, 2025 and 2043
- Chart 17: Mean years of education in the Current Path and Education scenario, 2022–2043
- Chart 18: Value-added by sector as % of GDP in the Current Path, 2025 and 2043
- Chart 19: Value-add by the manufacturing sector in the Current Path and Manufacturing scenario, 2022–2043
- Chart 20: Exports and imports as % of GDP in the Current Path, 2000-2043
- Chart 21: Trade balance in the Current Path and AfCFTA scenario, 2022–2043
- Chart 22: Electricity access: urban, rural and total in the Current Path, 2000-2043
- Chart 23: Cookstove usage in the Current Path and Large Infra/Leapfrogging scenario, 2022–2043
- Chart 24: Access to mobile and fixed broadband in the Current Path and the Large Infra/Leapfrogging scenario, 2022–2043
- Chart 25: FDI, foreign aid and remittances as % of GDP in the Current Path and in the Financial Flows scenario, 1990-2043
- Chart 26: Government revenue in the Current Path and Financial Flows scenario, 2020–2043
- Chart 27: Government effectiveness score in the Current Path, 2002-2043
- Chart 28: Composite governance index in the Current Path and Governance scenario, 2025 and 2043
- Chart 29: GDP per capita in the Current Path and scenarios, 2022–2043
- Chart 30: Poverty in the Current Path and Scenarios, 2022–2043
- Chart 31: GDP (MER) in the Current Path and Combined scenario, 2022–2043
- Chart 32: GDP per capita in the Current Path and the Combined scenario, 2022-2043
- Chart 33: Value added by sector in the Current Path and Combined scenario, 2025 and 2043
- Chart 34: Informal sector in the Current Path and Combined scenario, 2022–2043
- Chart 35: Poverty in the Current Path and Combined scenario, 2025 and 2043
- Chart 36: Life expectancy in the Current Path and Combined scenario, 2022–2043
- Chart 37: Carbon emissions in the Current Path and Combined scenario, 2022–2043
- Chart 38: Energy demand and production by type in the Current Path and Combined scenario, 2022-2043
- Chart 39: Policy recommendations
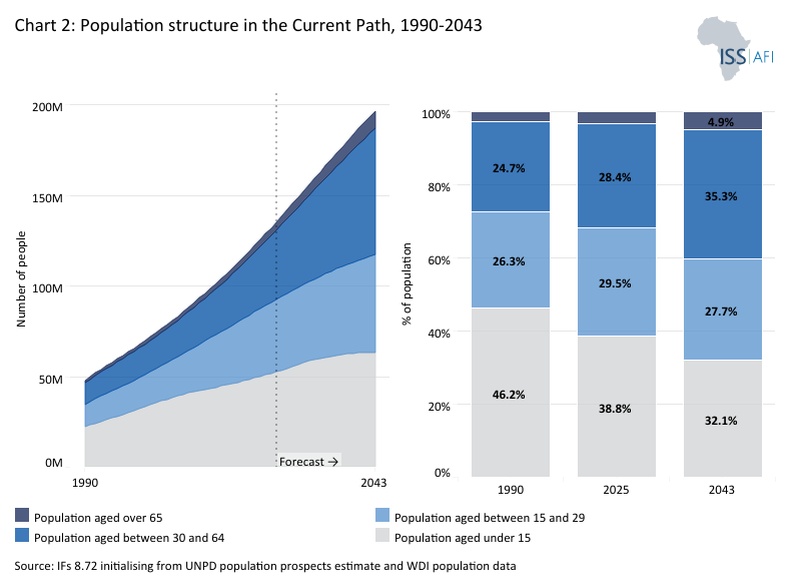
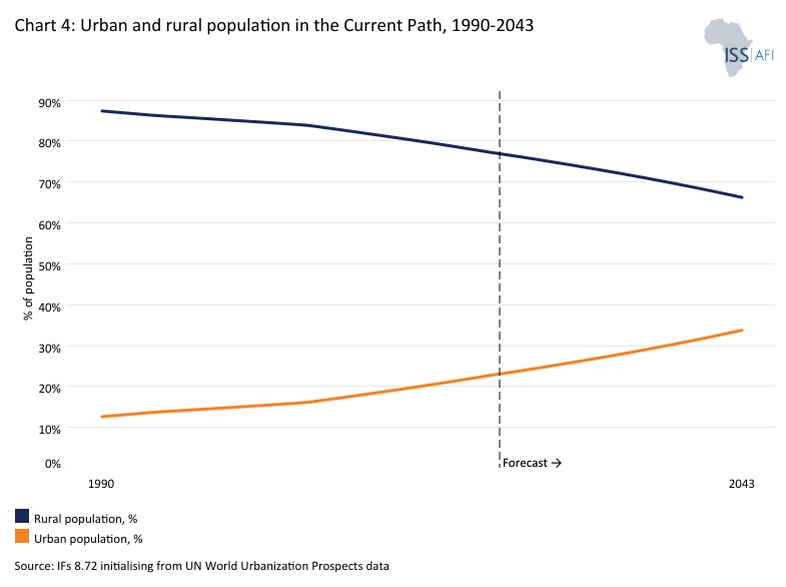
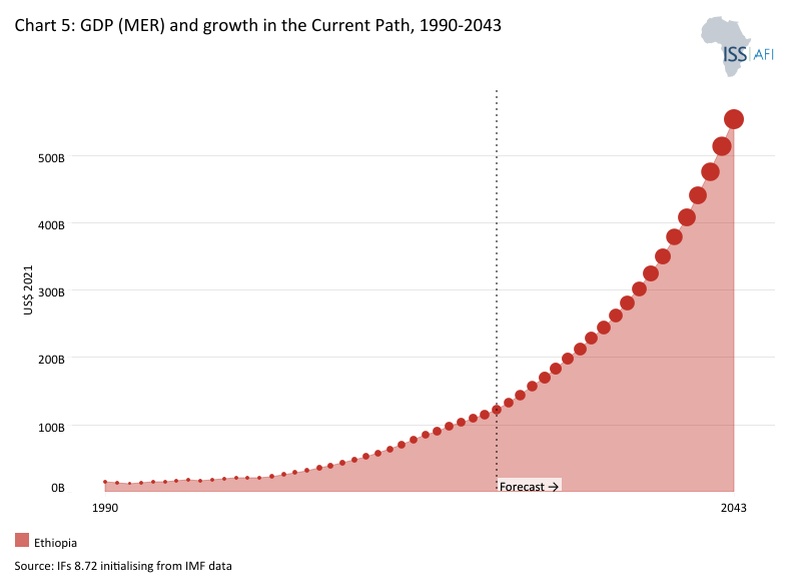
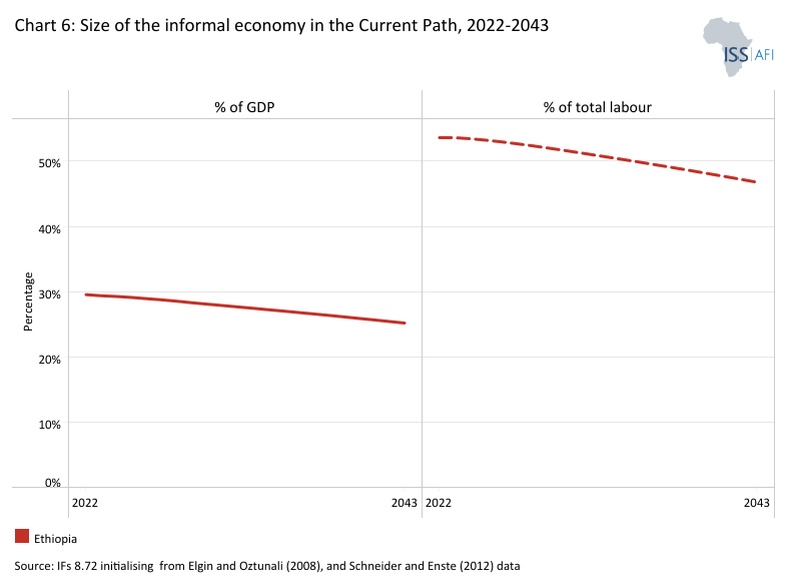
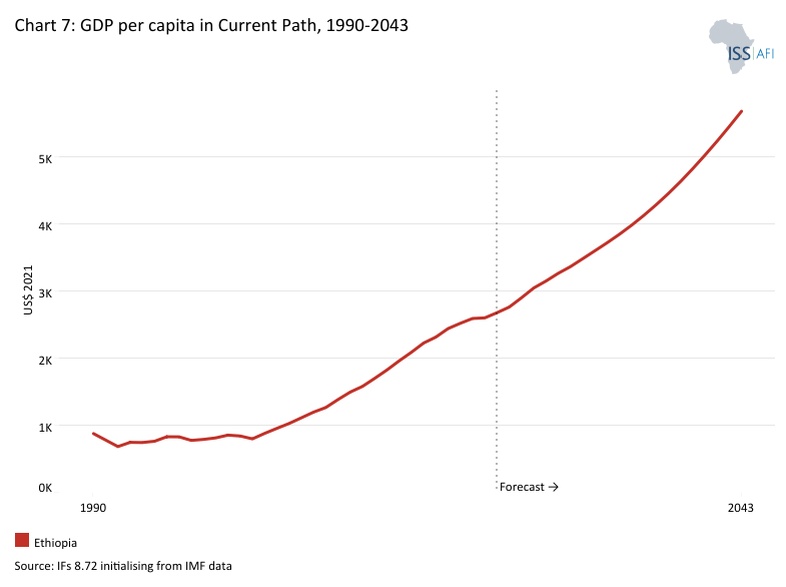
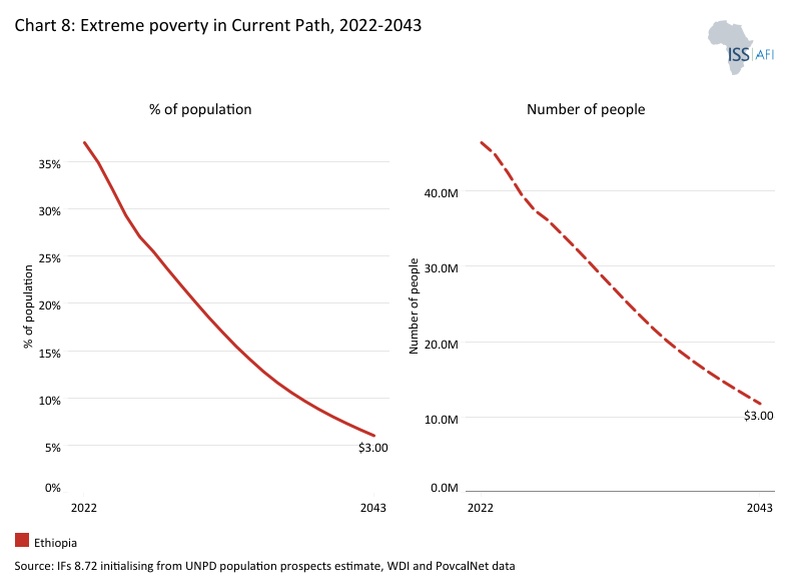
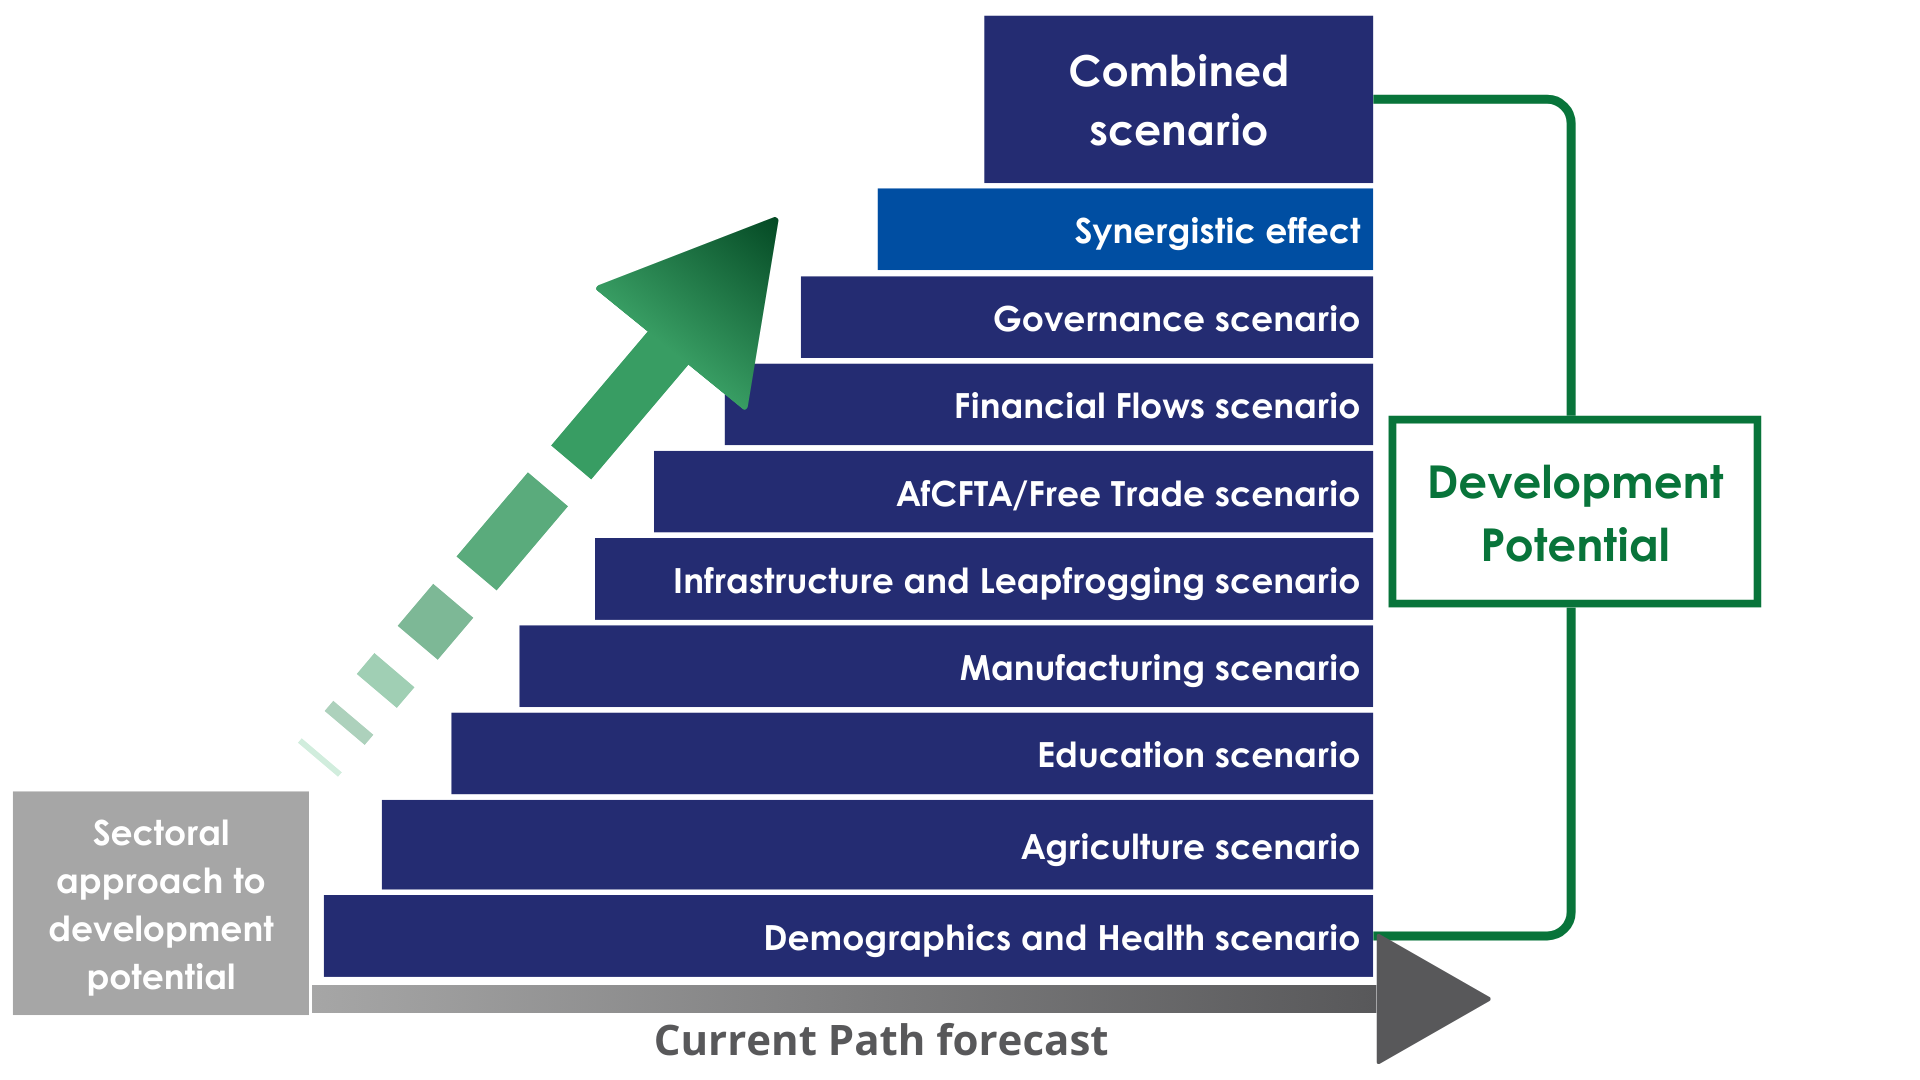
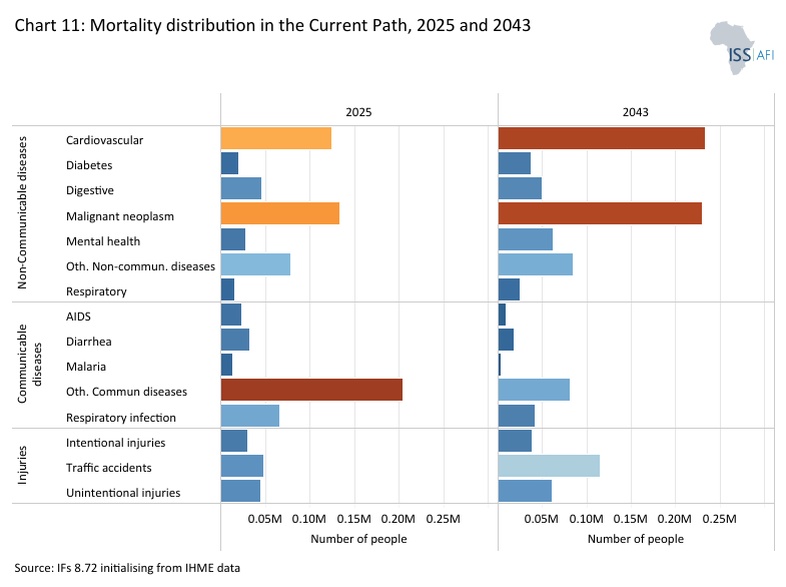
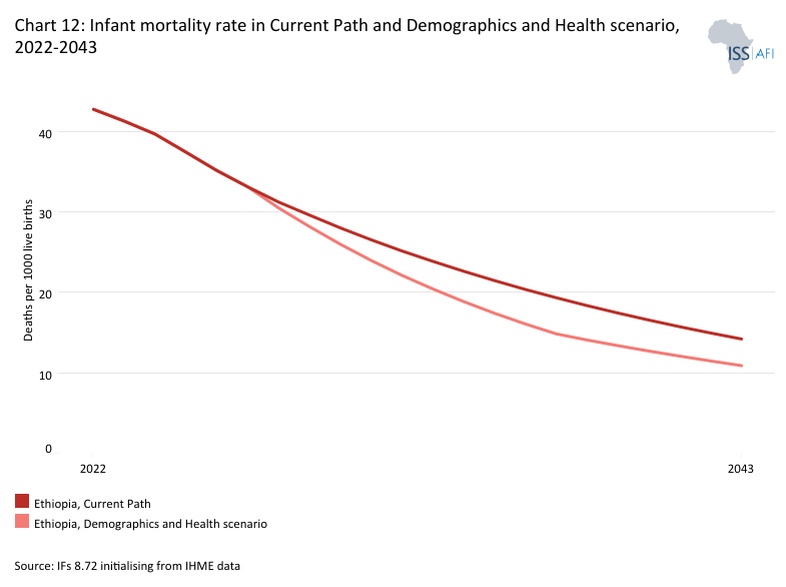
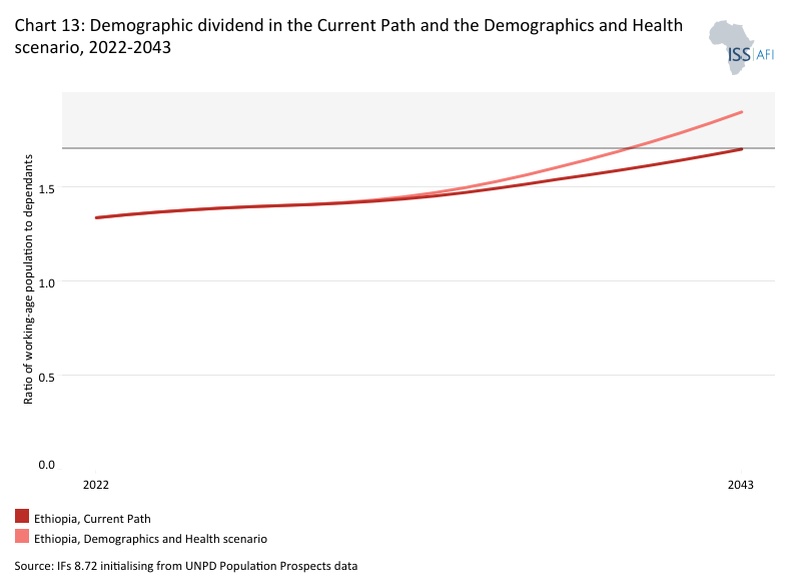
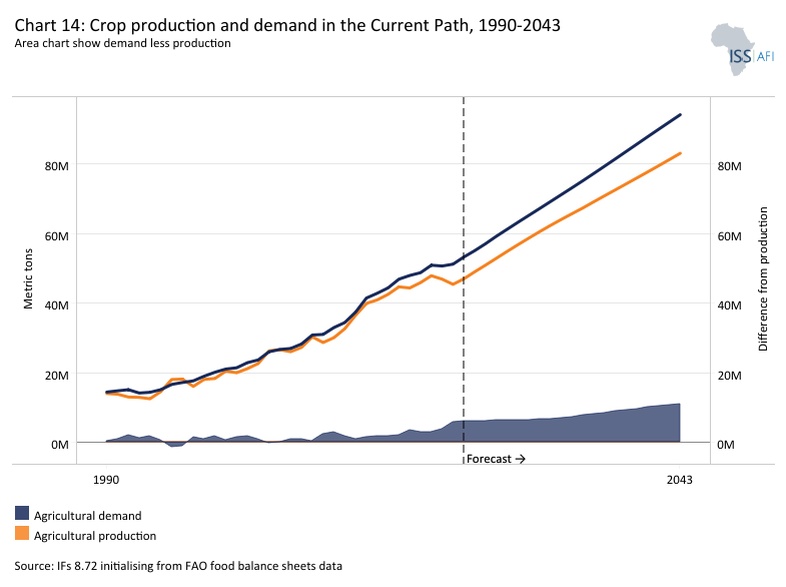
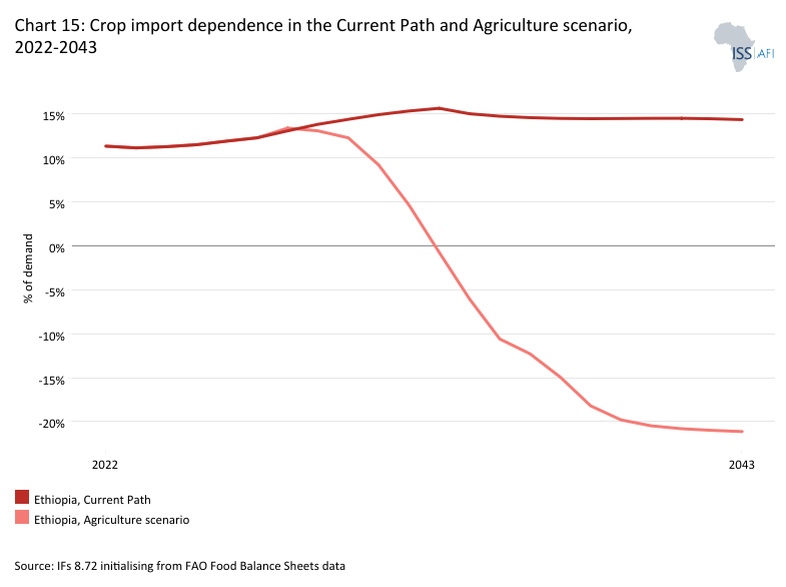
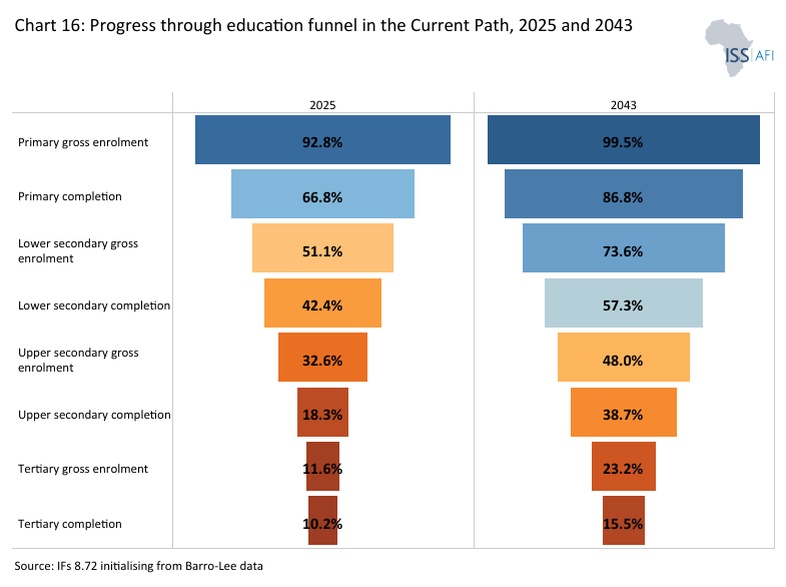
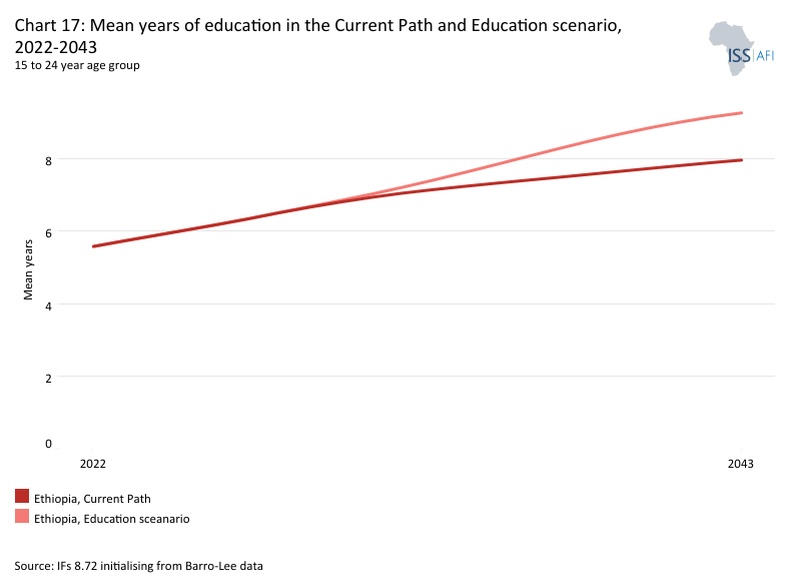
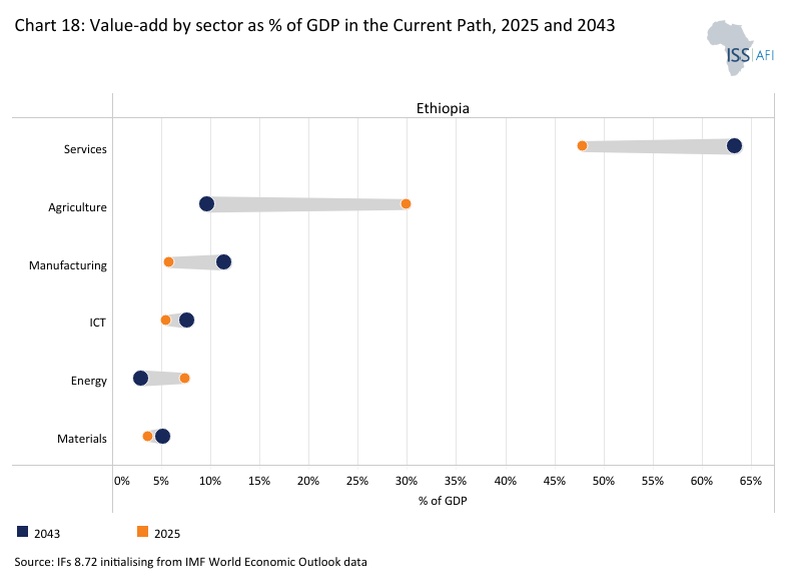
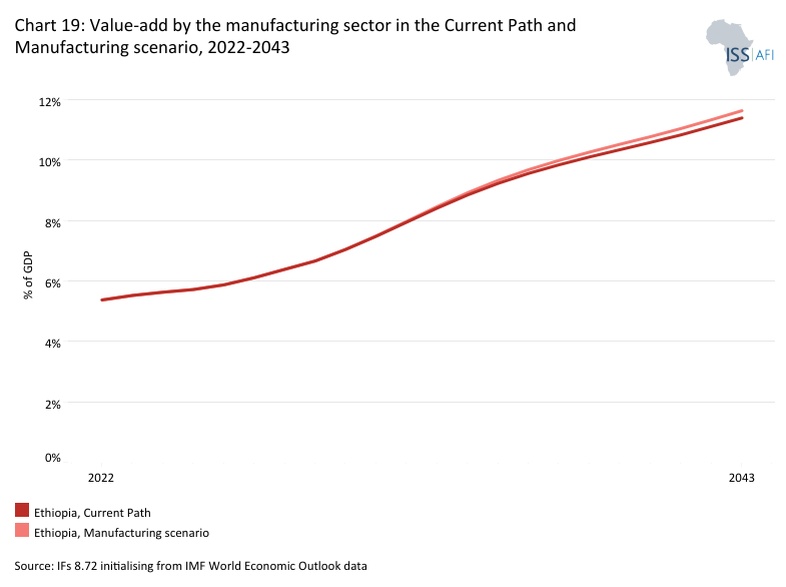
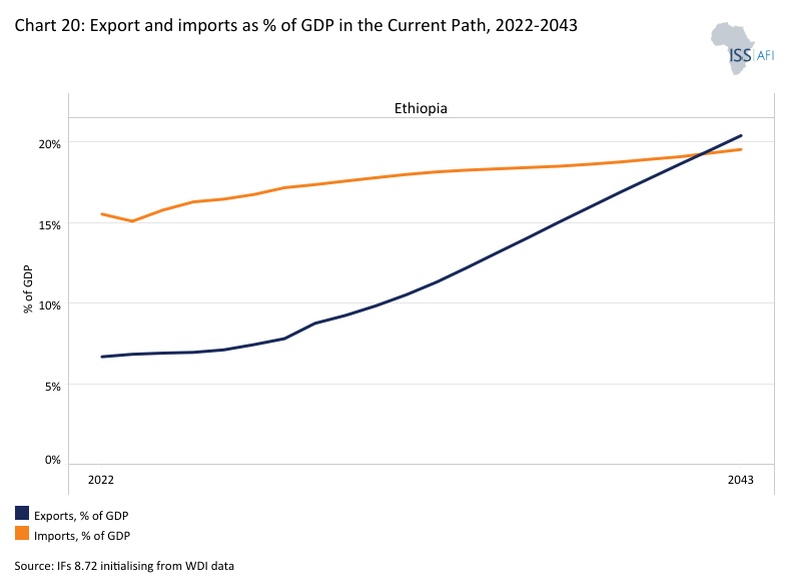
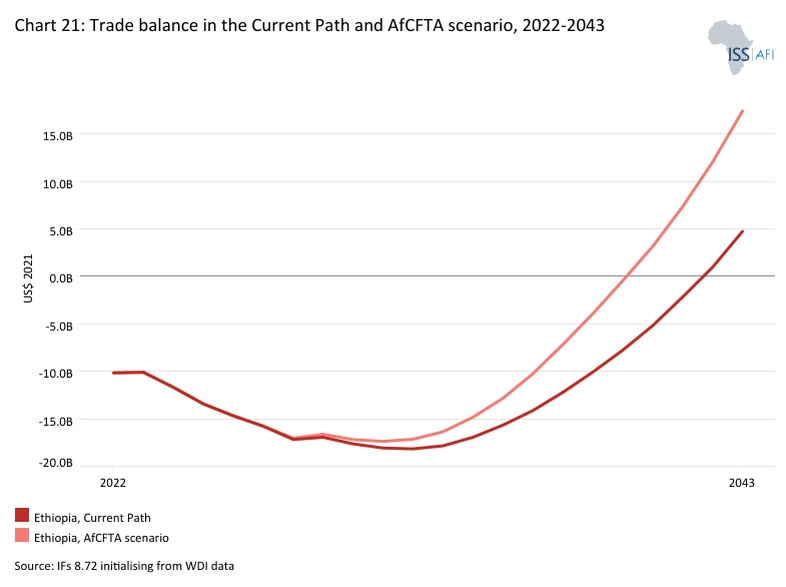
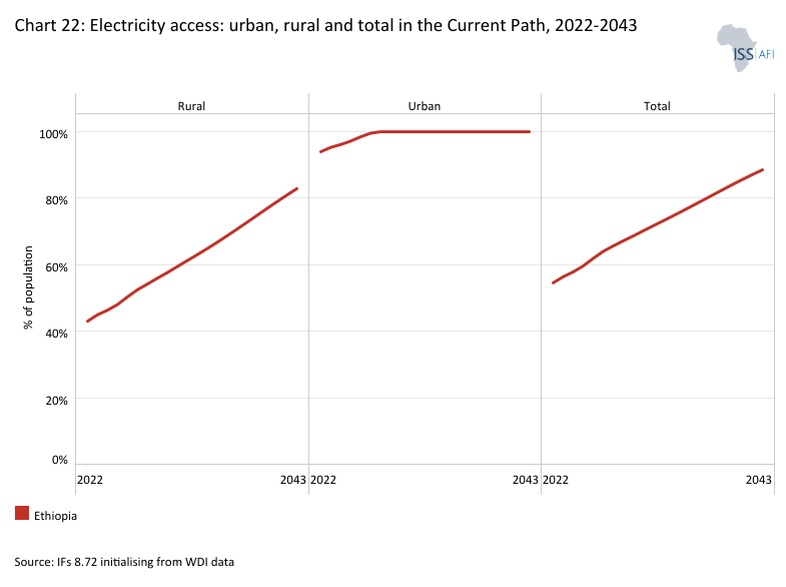
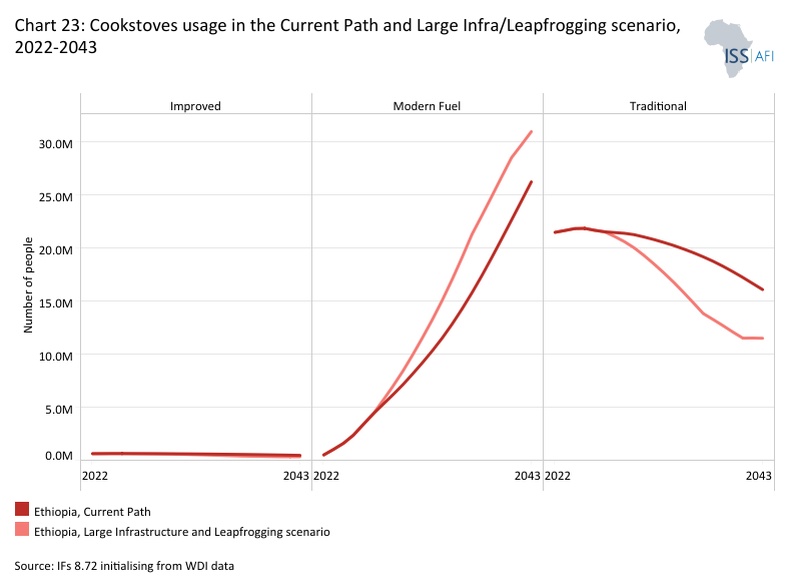
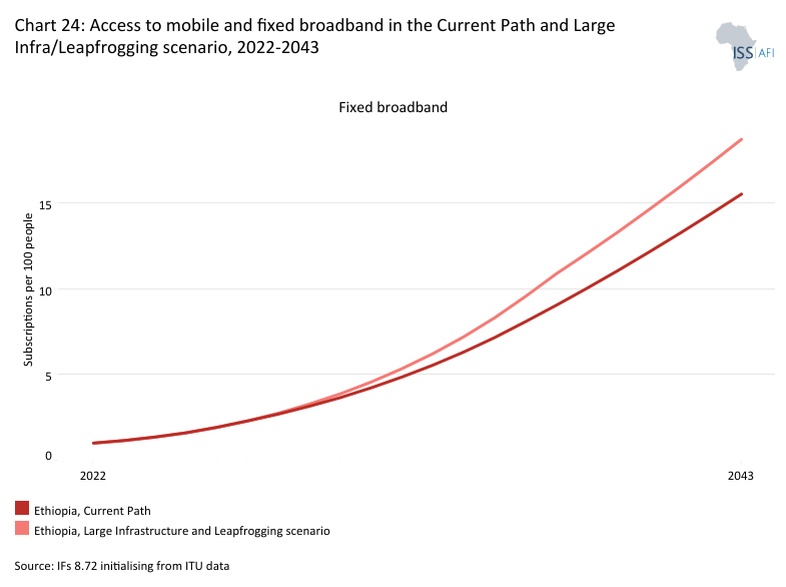
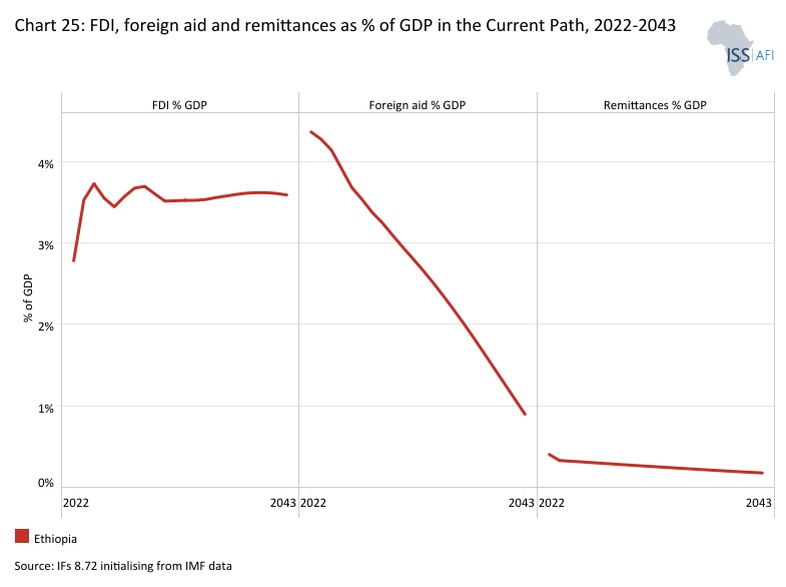
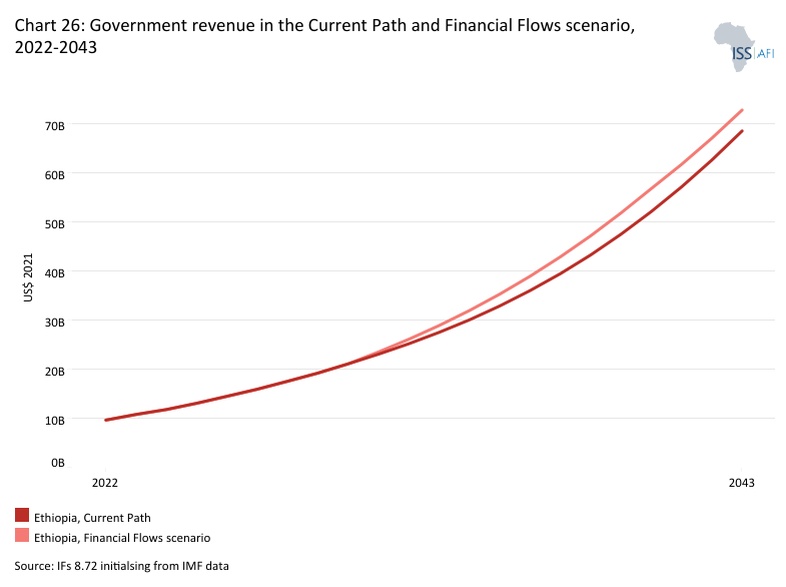
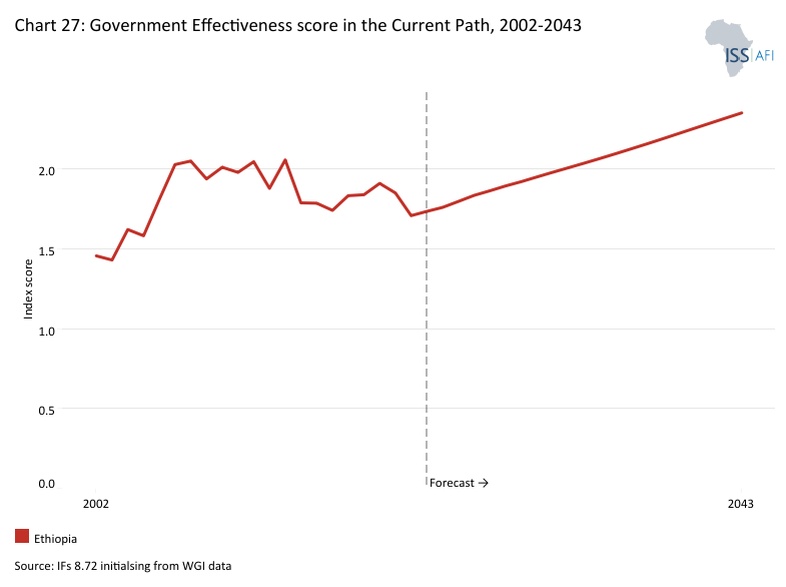
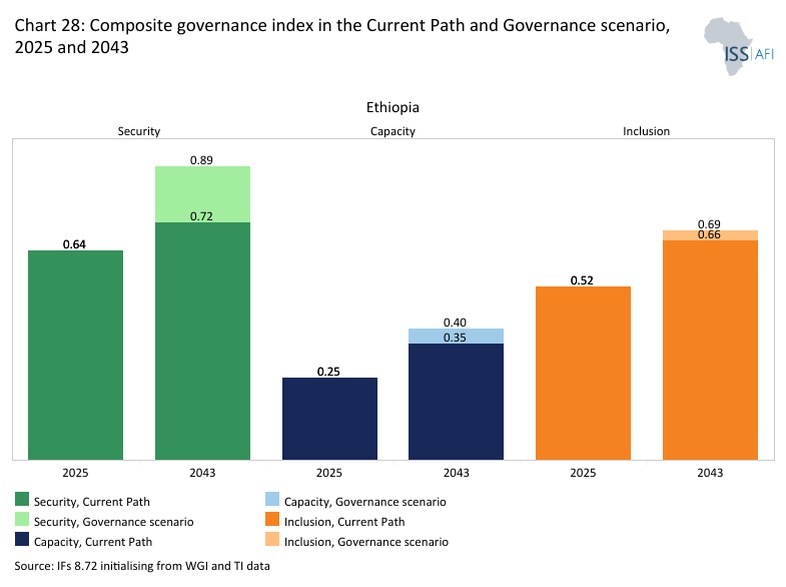
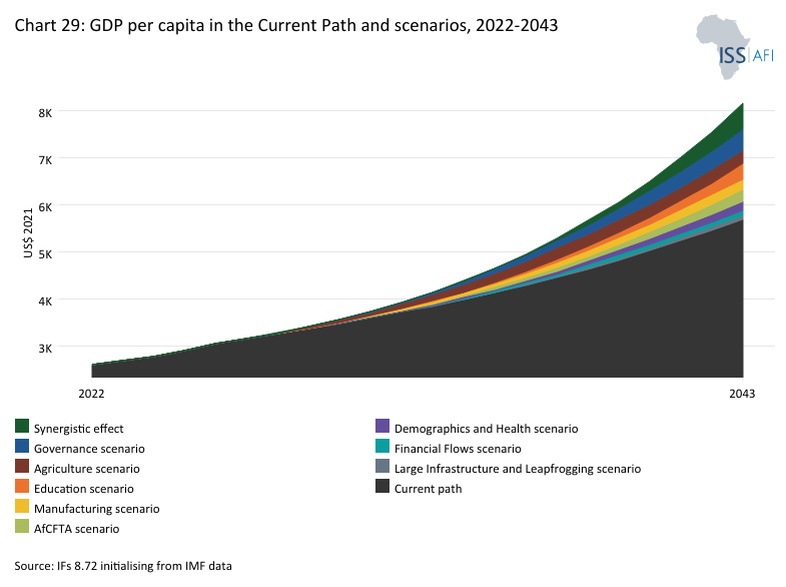
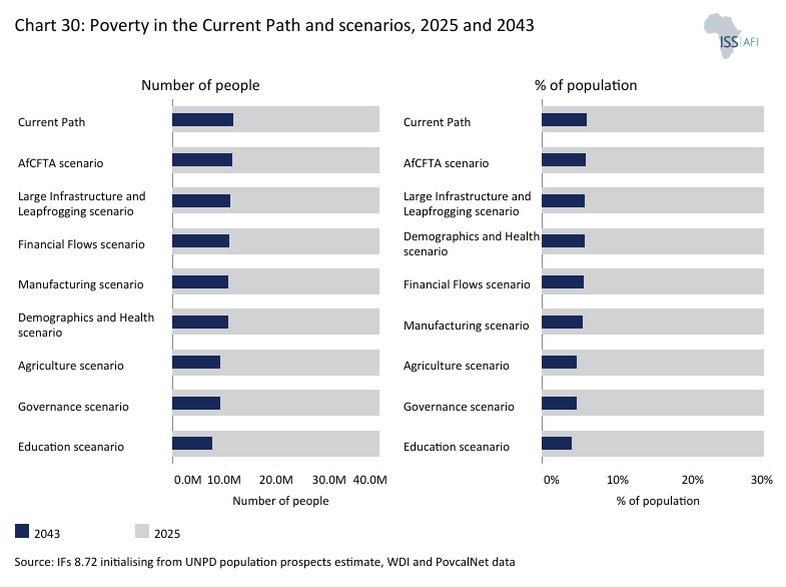
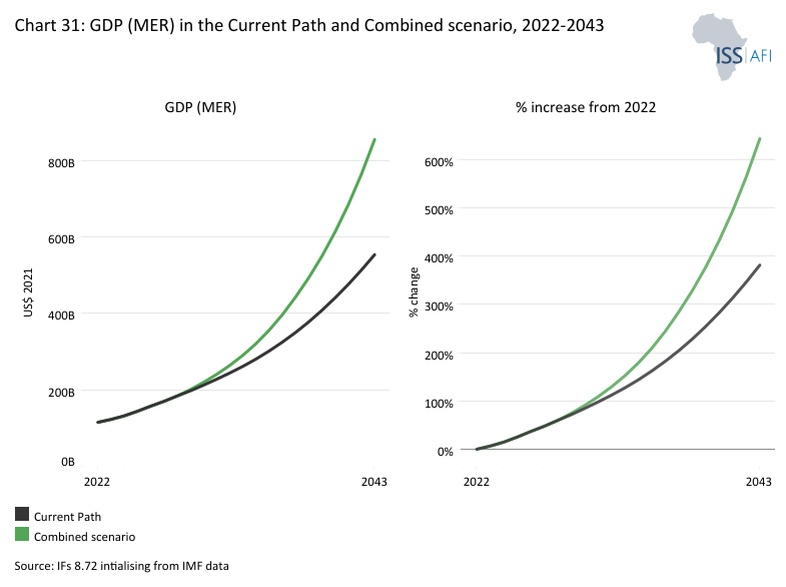
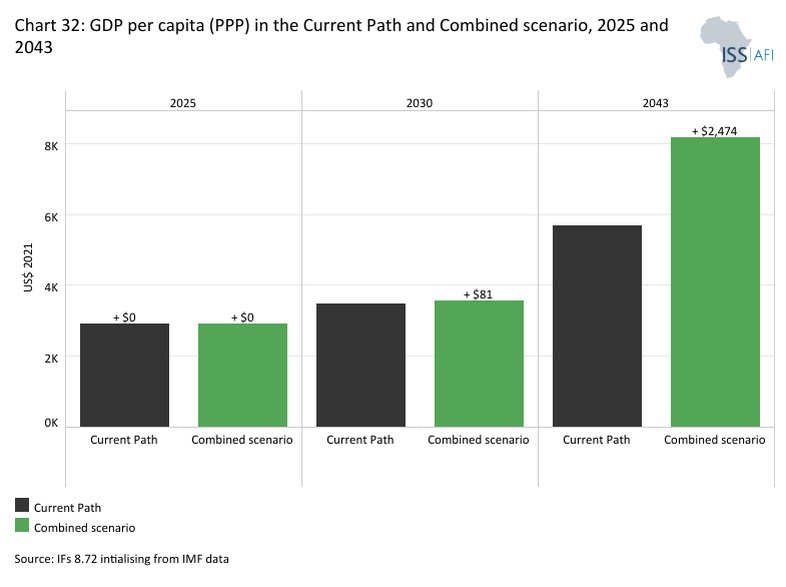
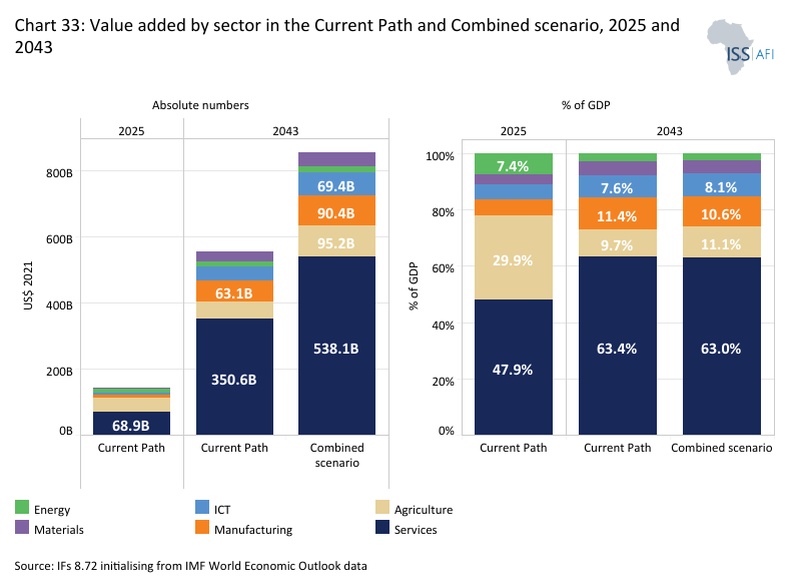
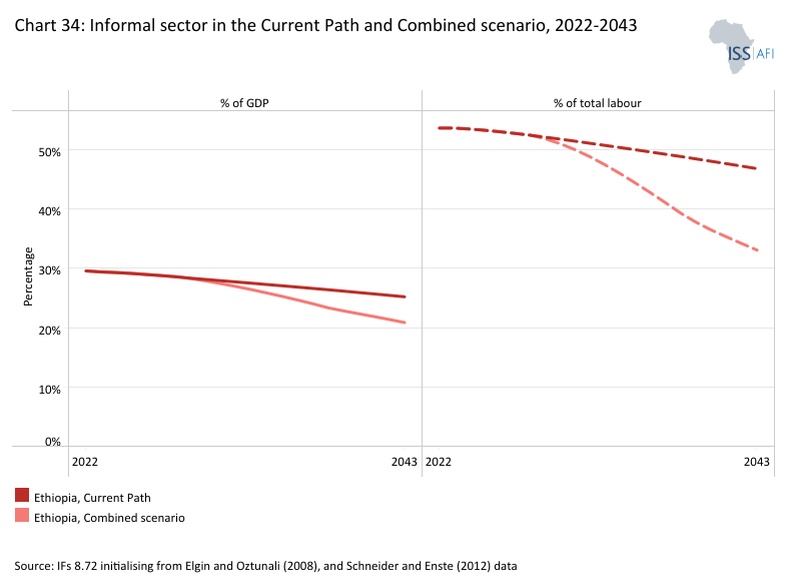
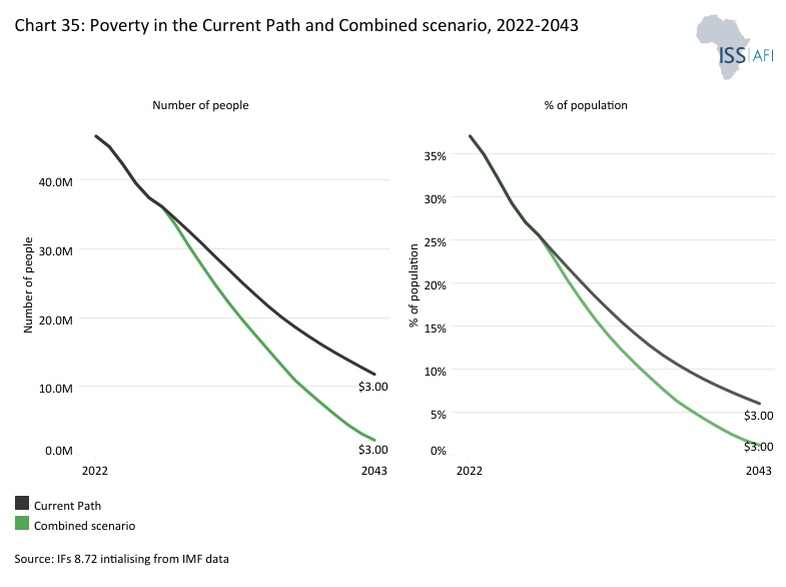
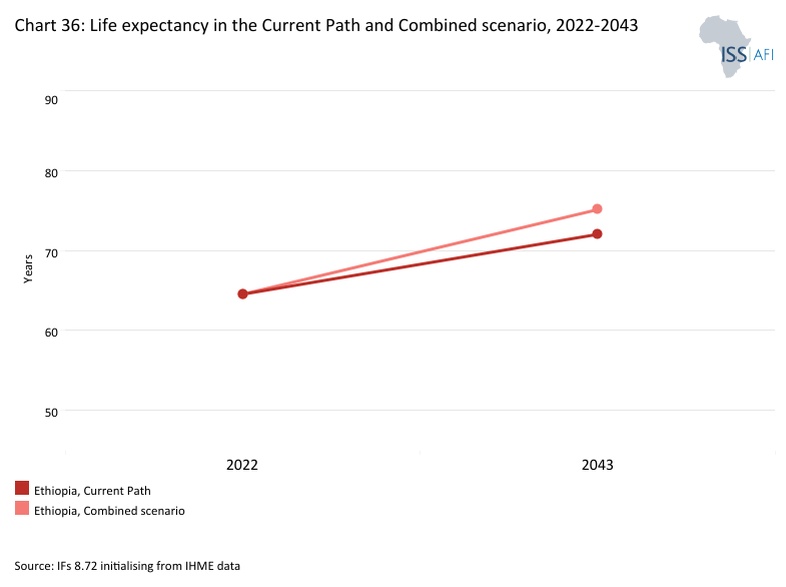
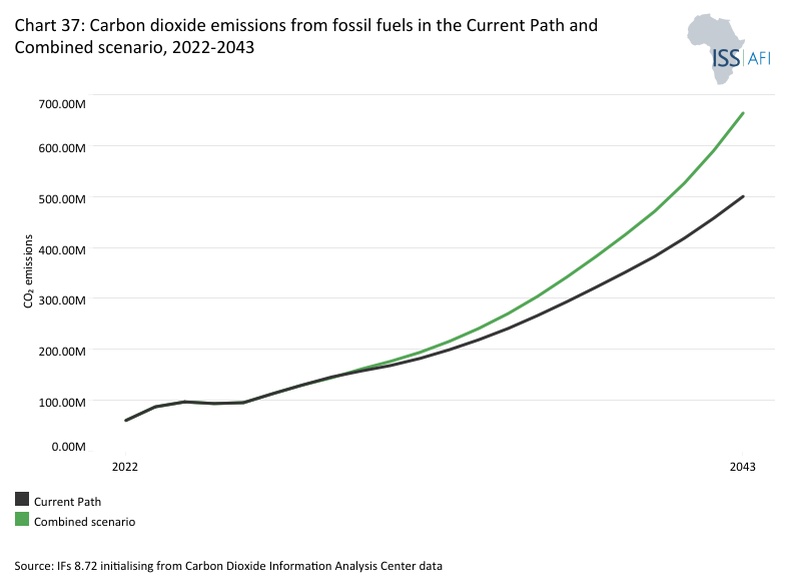
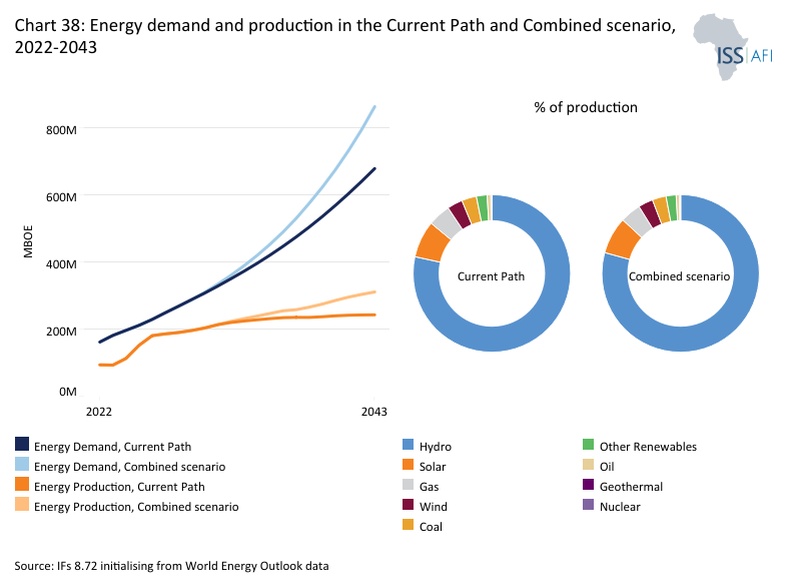

Chart 1 is a political map of Ethiopia.
Ethiopia’s long-term development trajectory to 2043 will be shaped by a set of structural conditions that are as important as macroeconomic policy itself. These include its strategic geographic location in the Horn of Africa, its ethnofederal political system, its highly diverse and still predominantly rural social composition, its sharply varied topography, and its growing exposure to climate and land-related pressures. Together, these factors define the opportunities and constraints within which development policy must operate. Any credible assessment of Ethiopia’s future must therefore begin from the recognition that economic transformation will depend not only on growth-enhancing reforms, but also on how effectively the state manages territorial diversity, infrastructure connectivity, ecological stress and social cohesion.
Ethiopia’s geography gives it both considerable strategic weight and a persistent structural disadvantage. With a land area of about 1.104 million square kilometres (km2), it is one of Africa’s largest states and occupies a pivotal position in the Horn, bordering Eritrea to the north, Djibouti and Somalia to the east, Kenya to the south, South Sudan and Sudan to the west. Although landlocked, Ethiopia sits close to the Red Sea and Gulf of Aden trade system and remains the principal economic and political anchor of the wider Horn of Africa. Addis Ababa is not only the national capital but also a continental diplomatic centre, while Dire Dawa functions as an important commercial gateway on the eastern corridor. Other major urban centres, including Adama, Hawassa, Mekelle and Bahir Dar, reinforce the country’s internal economic geography. In practical terms, Ethiopia’s dependence on external corridors, especially the Addis Ababa–Djibouti corridor, means that logistics performance, dry port efficiency, customs reform and cross-border cooperation will remain central to the country’s development strategy. Geography does not condemn Ethiopia to underdevelopment, but it does mean that competitiveness will depend heavily on transport reliability, corridor diversification and regional diplomacy.
The political context is equally foundational. Ethiopia is widely recognised as Africa’s oldest independent state and has long drawn political legitimacy from its history of resisting colonial domination, particularly after the defeat of Italy at the Battle of Adwa in 1896. Yet contemporary Ethiopia is defined less by that historic continuity than by the institutional architecture established under the 1995 Constitution. The constitution defines the country as a federal and democratic state and establishes a parliamentary federal system with a ceremonial president, an executive prime minister, a House of Peoples’ Representatives and a House of Federation. What distinguishes Ethiopia’s federal system is that it is explicitly organised around ethnolinguistic identity and the constitutional recognition of “nations, nationalities and peoples.” This makes federalism not merely an administrative arrangement, but the core framework through which state authority, political representation and territorial self-rule are negotiated.
This system has created both opportunities for inclusion and enduring tensions around governance and state cohesion. Ethiopia’s current federal structure comprise of twelve regional states and two chartered city administrations. The reconfiguration of the former Southern Nations, Nationalities and Peoples’ Region was completed through the creation of the Sidama, South West Ethiopia Peoples’, South Ethiopia and Central Ethiopia regions. These changes reflect the continued dynamism of Ethiopia’s federal compact, but they also highlight how unsettled aspects of that compact remain. The ongoing work of the Ethiopian National Dialogue Commission points to the fact that questions of representation, constitutional interpretation and intergovernmental relations are still live political issues. Fiscal decentralisation further complicates this picture. Regional governments carry major expenditure responsibilities in core sectors such as health and education, while the federal government retains control over defence and strategic infrastructure. For long-term planning, this means Ethiopia’s political stability will depend not only on constitutional design, but also on whether fiscal federalism becomes more transparent, rules-based and capable of managing tensions across regions.
Ethiopia’s social structure adds another layer of complexity to the development challenge. The country is exceptionally diverse in linguistic, ethnic and religious terms, and that diversity is embedded in both society and the state. More than 80 languages and numerous ethnic communities coexist within the federation, with Oromos and Amharas generally regarded as the largest groups, alongside Somali, Tigrayan, Sidama and many others. Religious diversity is also significant, with Christianity and Islam forming the two major pillars of the country’s social landscape. At the same time, Ethiopia remains predominantly rural, even as urbanisation is accelerating. This matters because the country’s social cleavages are not only ethnic or religious; they are also spatial and economic, reflecting uneven development, land access, youth unemployment, service delivery gaps, displacement and the legacy of conflict. Internal displacement remains especially important because it links insecurity directly to welfare outcomes, labour market vulnerability and local service demand. Looking ahead to 2043, the key issue will be whether urbanisation, education expansion and structural transformation reduce identity-based competition by widening opportunity, or intensify it by deepening already existing inequalities.
Ethiopia’s physical geography reinforces these development pressures. The country has one of the most varied landscapes in Africa, shaped by a high plateau split by the Great Rift Valley and marked by sharp contrasts between cool, densely settled highlands and hot, drier lowlands. The highland systems of Simien and Bale support dense settlement and agricultural production, while the Afar-Danakil depression contains some of the lowest terrain on the continent. This topographic diversity is not just a physical characteristic; it has direct developmental consequences. It influences where people live, what crops are grown, the cost of building infrastructure, patterns of disease exposure and the viability of transport networks. Ethiopia’s hydrology is equally strategic. The country functions as a regional water tower, with major river systems originating within its borders, most notably the Abay/Blue Nile. This gives Ethiopia significant hydropower and irrigation potential, illustrated most clearly by the Grand Ethiopian Renaissance Dam (GERD), which is central to its future energy ambitions and regional electricity strategy.
At the same time, the ecological base that sustains this potential is under growing strain. Deforestation, land degradation and soil erosion continue to undermine agricultural productivity and environmental resilience. This is not a marginal issue. Because such a large share of the population still depends directly or indirectly on land-based livelihoods, ecological degradation has macroeconomic implications through food systems, rural poverty, migration and conflict risk. Ethiopia’s topography will therefore remain both an asset and a constraint: the highlands support population concentration, water systems and hydropower generation, but also raise infrastructure costs, while the lowlands contain pastoral, mineral and strategic potential but are more exposed to climate stress and political fragility.
Climate conditions further intensify these structural pressures. Ethiopia’s climate is highly variable and strongly shaped by elevation. The traditional climatic zones of dega, woina dega and qola capture the way altitude structures temperature, rainfall, livelihoods and settlement patterns. Rainfall varies enormously across the country, from relatively high precipitation in the southwestern highlands to extremely arid conditions in the southeastern and northeastern lowlands. Drought remains the most destructive climate hazard, but flooding, erosion and landslides also impose high economic and social costs. This variability makes climate risk a central development issue rather than a secondary environmental concern.
Looking ahead to 2043, Ethiopia is warming, climate risks are intensifying, and the development consequences will be substantial if adaptation remains uneven. Rising temperatures, water stress, more frequent shocks and expanding urban exposure all threaten to slow poverty reduction and place additional pressure on already stretched institutions. Ethiopia has established an ambitious climate policy framework, including the Climate-Resilient Green Economy (CRGE) strategy, the National Adaptation Plan (NAP), the updated Nationally Determined Contribution (NDC) and the long-term low-emissions strategy (LT-LEDS). The central challenge, however, is no longer policy design but implementation. By 2043, Ethiopia’s resilience will depend less on the existence of these frameworks than on whether they are translated into effective action across agriculture, water management, urban planning, energy systems and subnational governance.
Taken together, these structural features show that Ethiopia’s development future will be shaped by more than economic growth alone. Strategic location gives the country regional leverage, but landlockedness makes connectivity and diplomacy indispensable. Federalism offers a framework for representation, but also demands stronger intergovernmental coordination and more credible fiscal management. Social diversity is a potential source of strength, yet it requires inclusive service delivery and economic transformation to avoid deepening fragmentation. Varied topography and abundant water systems create opportunities in agriculture and energy, but ecological degradation and infrastructure costs limit those gains. Climate change, finally, cuts across all these issues, making resilience a central test of state capacity. Accordingly, the country’s success to 2043 will depend on whether it can convert these structural realities from sources of fragility into foundations for inclusive, territorially balanced and climate-resilient development.
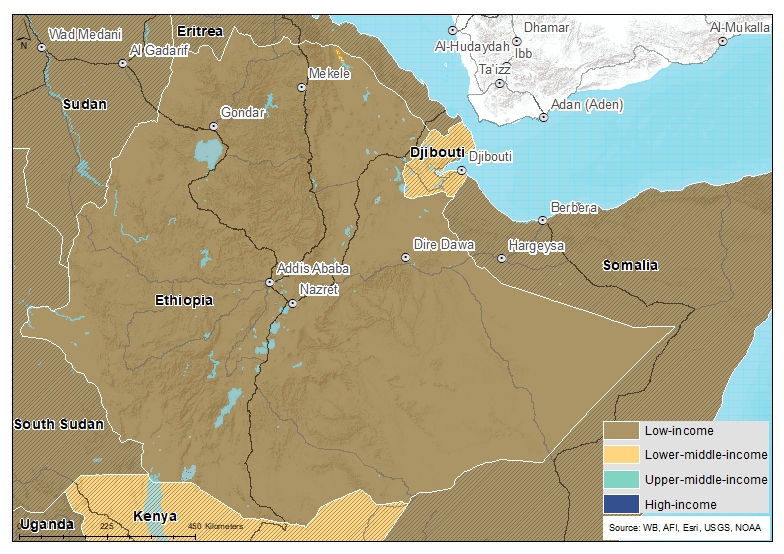
Chart 2 presents the Current Path of the population structure from 1990 to 2043.
Ethiopia’s population has expanded rapidly over the past three decades, rising from about 47.6 million in 1990 to 135 million in 2025, and exceeding 138 million by April 2026, with a median age of roughly 19.3 years. This makes Ethiopia the most populous country in the Horn of Africa and the second most populous in Africa after Nigeria. The Current Path shows a further increase to approximately 196 million people by 2043.
The deeper significance of this trend lies not only in the size of the population but in the gradual change in its age structure. Ethiopia’s population profile is shifting from a strongly child-heavy structure towards a more working-age-dominant one. In 1990, children under the age of 15 accounted for about 46.2% of the population, compared with 38.8% in 2025, and this share will decline further to roughly 32.1% by 2043 under the Current Path. Over the same period, the share of the working-age population rose from 51.1% to 57.9%, and will expand further to roughly 63% by 2043. The elderly population remains comparatively small, but is also increasing gradually, from 2.7% in 1990 to 3.3% in 2025 and a forecasted 4.9% by 2043.
This transition is being driven primarily by declining fertility. Ethiopia’s total fertility rate (TFR) fell from about 7.2 births per woman in 1990 to roughly 3.9 in 2025, and will decline further to 2.7 by 2043 under the Current Path. This trajectory brings the country closer to replacement-level fertility (TFR of 2.1) over the longer term and implies that population growth will gradually slow, even though the absolute number of people will continue rising for decades. Falling fertility narrows the base of the population pyramid, reduces the relative share of dependants, and increases the proportion of working-age people, thereby making the age structure progressively more favourable to growth.
However, fertility decline has been uneven across social groups and regions, which means the demographic transition is neither automatic nor uniform. The 2019 Ethiopia Mini-DHS shows that modern contraceptive use among married women rose from 14% in 2005 to 41% in 2019, but uptake was significantly higher among urban, wealthier and better educated women than among rural, poorer and less educated groups. Regional disparities remain especially pronounced. Contraceptive use was lowest in Somali and Afar, and more recent spatial analyses continue to identify Somali, Afar, parts of Oromia and parts of the former Southern Nations, Nationalities and Peoples (SNNP) area as relatively high-fertility zones. This suggests that future demographic change will depend heavily on whether Ethiopia can sustain gains in female education, reproductive health access, delayed marriage and family planning, particularly in lagging regions.
These age and fertility shifts are already reducing demographic pressure on the working-age population. Ethiopia’s dependency ratio declined from 0.96 in 1990 to 0.73 in 2025 and is forecasted to fall further to 0.59 by 2043 under the Current Path. This means that the number of dependants relative to every 100 working-age people is falling, potentially improving the economic balance between consumers and producers. A dependency ratio approaching 0.50 is often considered favourable at a macroeconomic level because it can support higher savings, stronger domestic demand and a broader tax base. Be that as it may, such a demographic structure does not by itself guarantee faster development. It becomes an asset only when the economy can absorb the expanding labour force into productive employment.
This is why Ethiopia’s demographic outlook should be read as promising but demanding. The Current Path shows that the country will move towards a more economically growth-friendly age structure, but not yet towards an automatic demographic dividend. The full demographic window is likely to open only around 2044, and its eventual benefits will depend on policy choices made well before then. Ethiopia will need to create jobs at scale, especially in labour-absorbing sectors, while also improving foundational and secondary education, expanding opportunities for women and youth, sustaining access to family planning and reproductive health services, and reducing regional inequalities in high-fertility areas. Urban planning will also become increasingly important, because much of the growing working-age population will be concentrated in towns and cities that require housing, transport, services and economic opportunities.
In a nutshell, Ethiopia’s demographic transition is creating a potentially stronger foundation for long-term growth, but the outcome will depend on whether structural change in the economy keeps pace with structural change in the population. The country’s demographic story to 2043 is neither one of inevitable crisis nor one of automatic dividend. It is, rather, a test of whether gradual improvements in population structure can be matched by equally strong progress in job creation, human capital development, territorial inclusion and institutional capacity building.
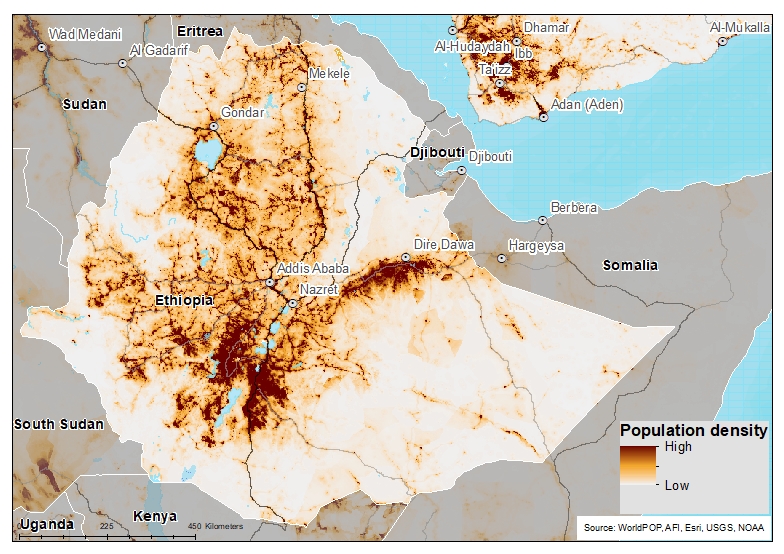
Chart 3 presents a population distribution map for 2025.
Ethiopia’s population is unevenly distributed across the territory, but highly concentrated in ecologically favourable highland zones and along major economic corridors, while vast lowland areas remain sparsely populated. This spatial imbalance has profound implications for infrastructure planning, fiscal transfers, food systems, climate exposure and territorial cohesion to 2043.
Although Ethiopia is one of Africa’s most populous countries, its urban concentration remains relatively modest by international standards. Addis Ababa accounts for approximately 4.8% of the total population, making it the country’s primate city but not overwhelmingly dominant. Other major cities, including Adama, Bahir Dar, Dire Dawa and Shashamane, each account for less than 0.5% of the national population. This reflects Ethiopia’s still predominantly rural demographic structure and a relatively dispersed urban hierarchy. Unlike highly urbanised African nations where a single city may contain 20–30% of the national population, Ethiopia’s settlement pattern remains broadly distributed, though gradually urbanising.
At the national level, population density will increase from approximately 120 people per km² to about 174 people per km² by 2043 under the Current Path. This represents a significant intensification of pressure on land, infrastructure and ecological systems. However, the national average conceals stark regional contrasts that are more relevant for policy design than the aggregate figure itself.
The most densely populated areas are located in the central and northern highlands, particularly in parts of Oromia, Amhara, Sidama and Central Ethiopia regions. These zones combine moderate rainfall, fertile soils, temperate climates and long-established agrarian settlement systems. Historically, state formation, infrastructure networks and market integration were concentrated in these highland belts, reinforcing their demographic centrality. By contrast, large areas of Afar, Somali and Gambella regions remain sparsely populated due to arid or semi-arid climatic conditions, pastoral livelihood systems, lower infrastructure density and, in some cases, historical marginalisation. The result is a sharp highland–lowland demographic divide that shapes nearly every aspect of Ethiopia’s development challenge.
This spatial distribution interacts strongly with livelihood systems. In the highlands, mixed crop–livestock agriculture dominates, supporting high rural densities but also intensifying land fragmentation and soil degradation. In the lowlands, pastoral and agro-pastoral systems require mobility and lower density, making service delivery and infrastructure provision more costly per capita. As population density rises nationally toward 2043, pressures in highland agrarian systems are likely to intensify further unless productivity growth, land restoration and non-farm employment expand rapidly. In lowland regions, demographic growth combined with climate variability may increase competition over water and grazing resources, with implications for conflict risk and displacement.
Urbanisation trends (see Chart 4) add another layer to this spatial dynamic. Although only about a quarter of the population is currently urban, cities are growing rapidly in absolute terms. The Addis Ababa–Adama–Dire Dawa corridor, linking the capital to the Djibouti port route, is emerging as the country’s most economically significant axis. Industrial parks, logistics hubs and transport investments along this corridor reinforce its demographic pull. Secondary cities such as Hawassa, Mekelle and Bahir Dar are also expanding, but their national population shares remain relatively small. This suggests that Ethiopia’s urban transition is occurring through the gradual growth of multiple nodes rather than extreme primacy, which presents both an opportunity and a coordination challenge. Balanced secondary-city development could reduce pressure on Addis Ababa, but only if urban planning, municipal finance and employment creation keep pace with migration.
The forecasted increase in population density magnifies these spatial pressures. In high-density rural zones, rising land scarcity may accelerate rural–urban migration, increase youth underemployment and intensify environmental degradation unless agricultural productivity improves. In peri-urban belts, unmanaged expansion risks informal settlement growth, infrastructure backlogs and heightened flood exposure. In arid and semi-arid lowlands, climate change may further constrain carrying capacity, reinforcing mobility patterns and increasing vulnerability to drought shocks.
From a policy perspective, population distribution is therefore not simply a demographic statistic but a territorial development issue. Infrastructure planning must account for both density and dispersion. High-density corridors require investments in mass transit, housing, water systems and waste management, while low-density pastoral regions require adaptive service-delivery models, including mobile health and education services. Fiscal federalism must reflect the cost differentials associated with settlement patterns; sparsely populated regions face higher per-capita infrastructure costs, while densely populated regions face congestion and land-pressure challenges.
Climate adaptation planning must also be spatially differentiated. Highland zones are vulnerable to soil erosion and land degradation, while lowland areas face drought intensity and water scarcity. Urban areas, particularly those expanding informally, face increasing flood and heat risks. Integrating spatial population data with climate-risk mapping will be essential to prevent future humanitarian and fiscal shocks.
Looking to 2043, Ethiopia’s rising population density will test the country’s ability to align territorial planning with demographic realities. The key strategic questions are whether growth will be channelled into productive, well-serviced urban corridors; whether rural transformation can absorb labour productively rather than simply fragmenting landholdings; and whether historically peripheral lowland regions can be integrated through infrastructure, climate resilience and market access without destabilising pastoral systems.
Chart 4 presents the urban and rural population in the Current Path, from 1990 to 2043.
Ethiopia’s urban transition is real, but it is still unfolding from a very low base. The urban share of the population almost doubled from 12.6% in 1990 to 24% in 2025. The Current Path shows a further increase to 33.8% by 2043, implying that Ethiopia would still be majority rural at the end of the third Agenda 2063 implementation term.
In absolute terms, the Current Path shift will be large enough to be transformational even though it will not make Ethiopia predominantly urban. The urban population will more than double from roughly 32.4 million in 2025 to about 66.3 million by 2043, while the rural population will increase by approximately 29.3 million from roughly 102.6 million to 130 million. The most important policy implication is therefore not ‘urban instead of rural’, but the simultaneous management of very rapid urban growth and continuing large-scale rural demand for land, services and livelihoods.
The Current Path trajectory is consistent with the World Bank’s 2024 Country Climate and Development Report (CCDR), which forecasts Ethiopia’s urban population growth to 83.9 million by 2050, raising the urbanisation rate from about 23% in 2020 to 39% by 2050. The CCDR is useful because it frames urbanisation not as a side trend, but as a central part of structural transformation, climate resilience and territorial development.
The factors driving the trend are more complex than simple rural-to-urban migration. The World Bank’s Ethiopia Urbanisation Review found that, in the earlier phase of urban growth, natural increase was the largest contributor to urban population growth, accounting for around 40% of annual urban growth before 2018, while migration to existing urban centres and statistical reclassification of rural settlements as towns also made major contributions. The same review forecasted that rural-to-urban migration would become the leading driver after 2018, accounting for 41–47% of annual urban population growth through 2032. This helps reconcile two seemingly different narratives: Ethiopia’s urbanisation is increasingly migration-led, but it has also been produced by natural population growth within towns and the formal upgrading of settlements into urban centres.
At the same time, Ethiopia remains predominantly rural because agriculture and land-based livelihoods still anchor the economy and shape household decisions. The CCDR notes that agriculture still employs about 64% of the workforce and accounts for 38% of GDP, which helps explain why urbanisation, though rising, has not yet produced a wholesale shift out of rural livelihoods. The Urbanisation Review also found that rural-to-urban migration in Ethiopia has historically been lower than in many other developing countries, partly because land institutions and insecure transfer arrangements create disincentives for rural households to move permanently to cities. That means Ethiopia’s urban transition is occurring alongside, not instead of, a large rural society whose transformation depends on agricultural productivity, rural non-farm employment and stronger rural-urban linkages.
Urban growth is also highly patterned rather than evenly distributed. UN-Habitat describes Ethiopia as having an unbalanced urban system with one primate city, Addis Ababa, plus a relatively thin layer of medium-sized cities and many small towns. This is most likely why the government’s own Ten-Year Development Plan (TYDP) places such strong emphasis on a “balanced and decentralised system of urbanisation,” the development of small and medium-sized towns, and coordinated infrastructure networks between and within cities and towns. This perspective makes sense because if urban growth continues to be concentrated in Addis Ababa and a few connected corridors, issues such as congestion, land informality, and regional inequality will worsen. However, if growth is more evenly distributed across secondary cities and rural service centres, urbanisation can contribute to a more balanced structural transformation.
Conflict, displacement and climate stress are now major additional drivers of settlement change and must be treated as part of the urbanisation story. The June 2025 Ethiopia refugees and IDPs statistics sheet reported 1.92 million Internally Displaced Persons (IDPs) and 2.81 million IDP returnees, while its historical trend graphic shows IDPs at around 3.3 million in 2024. OCHA’s June 2024 internal displacement overview uses a wider humanitarian estimation approach and places total displacement at about 4.5 million people. The methodological difference matters, but the policy message is the same: displacement is reshaping settlement patterns, placing additional pressure on urban and peri-urban services, and making urban growth more fluid, uneven and vulnerable than a simple demographic trend line suggests.
The quality of urbanisation is therefore at least as important as its pace. The CCDR warns that only 12% of urban parcels are registered and that informal settlements cover an estimated 74% of urban areas, with many settlements encroaching on wetlands, flood-runoff zones and other hazard-prone spaces. It also notes that under a pessimistic climate scenario, capital damages in Addis Ababa from pluvial flooding could double by 2050, while proactive adaptation could reduce additional losses by about 90%. This is a critical policy point for the Current Path. Ethiopia’s urban transition, if unmanaged, can deepen flood exposure, land conflict, exclusion from basic services and costly retrofitting obligations for the government. Urbanisation is not automatically developmental; it becomes developmental when land management, housing supply, utility networks and climate adaptation move ahead of settlement expansion rather than behind it.
The government’s own targets provide a useful benchmark against which to assess the Current Path. In the TYDP, Ethiopia aims to raise the rate of urbanisation from 21.4% in 2020/21 to 35% by 2029/30, reduce urban and rural population growth rates to 4.2% and 1.3% respectively, guide around 4 000 towns and 14 000 rural development centers through integrated urban development plans, increase cadastre and land registration coverage from 3% to 60%, meet 80% of urban housing demand by building more than 4.4 million houses, and require municipal governments to finance at least 60% of their expenditures from own-source revenues. These targets are ambitious but analytically coherent: they recognise that the challenge is not merely to increase the urban share, but to make cities more planned, more productive, more financially viable and more connected to surrounding rural areas.
The core conclusion is that Ethiopia should not treat urbanisation as a demographic inevitability to be accommodated passively. It should treat it as a territorial transformation agenda. That means prioritising secondary-city development and corridor planning instead of excessive concentration in Addis Ababa; accelerating urban land regularisation, registration and serviced-land supply to reduce informality; linking housing policy to jobs, transport and municipal finance rather than stand-alone housing targets; building flood-resilient and climate-aware urban infrastructure before hazard exposure locks in; integrating displacement and return dynamics into urban planning and intergovernmental transfers; and, crucially, continuing to invest in rural productivity and rural service centers because the rural population will still exceed 130 million by 2043 under the Current Path. The indicators that matter most are the urban share of population, the absolute growth of urban residents, serviced land and housing delivery, the share of registered urban parcels, secondary-city job creation, flood exposure in informal settlements, and the extent to which municipal governments can raise and retain own-source revenues.
Chart 5 presents GDP in market exchange rates (MER) and growth rate in the Current Path, from 1990 to 2043.
Ethiopia’s GDP (MER) expanded from US$14 billion in 1990 to US$144 billion in 2025, reflecting an average annual growth rate of 6.7%. This long-run historical picture is one of strong expansion from a low base, but with changing drivers over time. The country’s TYDP notes that, during the two Growth and Transformation Plan (GTP I and GTP II) periods, real GDP grew by an average of 9.2% per year between 2009/10 and 2019/20, while the World Bank and African Development Bank report average annual growth of 10.9% and 10.2% in the 2004-2014 and 2004–2018 periods, respectively. All reports concur that Ethiopia’s growth since 2003 was primarily driven by large public investment in physical and social infrastructure. The performance was impressive by regional standards. However, anecdotal evidence highlights that the growth was uneven. It relied heavily on the construction sector, agriculture, and wholesale and retail trade, while export performance was weak. Additionally, the economy struggled to generate sufficient foreign exchange to meet its investment needs. In terms of policy, Ethiopia was successful in increasing output but only partially managed to transform the production structure.
That distinction matters because it explains both the achievements and the fragilities visible in Ethiopia’s historical growth trajectory. Ethiopia’s TYDP explicitly recognises that past growth did not sufficiently create jobs, deepen structural transformation, strengthen sectoral linkages or ensure that export earnings kept pace with import needs. The same plan frames the Homegrown Economic Reform (HGER) agenda as a transition from public- to private-sector-led growth, with stronger productivity, competitiveness, financial-sector reform and export diversification. In other words, the country’s own planning documents already accept that the old growth model, however impressive in headline GDP terms, had reached its limits. A policy-oriented analysis of the Current Path should therefore focus not only on the level of GDP but on whether the composition of growth is changing in the intended direction.
The growth trajectory’s flattening relative to the most optimistic national ambition is also explained by the shocks of the early 2020s. The World Bank’s latest Ethiopia Macro Poverty Outlook argues that the former state-led investment model relied on an overvalued exchange rate and financial repression, crowded out social spending, and did not raise productivity or job growth sufficiently. It also notes that COVID-19, conflict and drought deepened macroeconomic imbalances and culminated in debt default in late 2023. The African Development Bank similarly reports that growth decelerated to about 6.8% per year during 2020–2024, while in 2023/24 growth recovered to 7.3%, led by industry at 9.2% and agriculture at 7%, with private consumption and investment driving demand. This implies that Ethiopia did not lose its growth potential, but it entered the mid-2020s carrying serious macroeconomic, political and external vulnerabilities.
Recent reforms have improved the near-term outlook, but they do not eliminate the longer-term policy gap. The World Bank forecasts a 2025 growth rate at 9.2%, supported by robust crop harvests, mining, construction and manufacturing, while the IMF states that policy actions under the Extended Credit Facility and the HGER agenda have already delivered better-than-expected results for inflation, export growth and international reserves. The IMF also emphasises that these reforms are intended to correct macroeconomic imbalances, restore debt sustainability and lay the foundation for high, private-sector-led growth. That is important because it suggests that the near-term rebound is not purely cyclical: it is increasingly tied to a deeper macroeconomic reset. But the same IMF and World Bank sources warn that sustaining reform momentum remains essential and that external and domestic risks, including foreign-exchange market distortions, conflict and regional instability, could still slow the transition.
Looking ahead, GDP will reach approximately US$553 billion by 2043 under the Current Path, implying a significantly faster average annual growth rate of 7.8% over the 2025–2043 period. The Current Path, therefore, represents a credible but conservative growth trajectory rather than a transformative one. This trajectory is robust by continental standards and would make Ethiopia overtake Algeria to become the fourth-largest economy in Africa by 2043, after Egypt, Nigeria, and South Africa, respectively. Yet it remains below the country’s TYDP target of 10% by 2030. Precisely, the Current Path forecasts an average growth rate of approximately 7.7% in the 2021-2030 period.
The growth target itself is not only about speed; it is also about composition. The TYDP envisages the share of agriculture in GDP declining from 32.6% to 22% by 2029/30, industry rising from 29% to 35.9%, and manufacturing rising from 6.9% to 17.2%. It also targets an increase in the export-to-GDP ratio to 12.9% and a shift in the structure of exports so that industrial and mining products account for a much larger share by the end of the decade. Those targets make clear that Ethiopia’s benchmark is not simply ‘more GDP’; it is more tradable production, higher productivity, a larger role for private investors, and a stronger foreign-exchange base. The Current Path, by contrast, implies progress but not full delivery on that ambition.
Overall, Chart 5 should be read as evidence that Ethiopia is likely to remain a fast-growing economy over the long run, but one whose baseline trajectory still undershoots its national development goals because structural bottlenecks remain only partially resolved. To move closer to the official target, Ethiopia would need to do five things consistently: sustain peace and reduce conflict-related economic losses; lock in macroeconomic stabilisation and debt treatment; deepen export and foreign-exchange earning capacity; accelerate industrial and manufacturing competitiveness rather than relying mainly on construction and services; and expand the role of domestic and foreign private investment without recreating the imbalances of the earlier state-led model. Without those shifts, growth can remain high in headline terms while still falling short of the country’s ambition to become an “African Beacon of Prosperity.”
Chart 6 presents the size of the informal economy as a percentage of GDP and percentage of total labour (non-agriculture), from 2022 to 2043. The data in our modelling are largely estimates and therefore may differ from other sources.
The informal economy’s share of GDP will fall from 29.1% in 2025 to about 25.2% by 2043, while the informal share of the non-agricultural labour force will decline from 53.2% to 46.8% over the same period. This is a meaningful improvement, but it still implies that by 2043 nearly half of Ethiopia’s non-agricultural workers would remain outside formal employment relationships, tax systems and social protection arrangements.
Informality is not exceptional to Ethiopia; it is the dominant employment reality across the continent. The International Labour Organisation (ILO) estimates that around 83% of employment in Africa is informal, rising to about 85% in sub-Saharan Africa. Urban informality is also pervasive, with roughly 56% to 65% of urban workers in sub-Saharan Africa employed informally, and about half of these workers are self-employed rather than wage-employed. On that basis, Ethiopia’s forecasted decline from 53.2% to 46.8% in informal non-agricultural employment places it below the broader continental and sub-Saharan averages, but not yet in a position that would justify describing the economy as successfully formalised. This implies that Ethiopia is performing somewhat better than the regional average, but the gap mostly reflects the country’s structural transformation potential rather than the resolution of the underlying drivers of informality.
The persistence of informality in Ethiopia reflects a combination of structural and policy factors. First, the economy still has a very large low-productivity base. Agriculture remains a major employer, and many workers moving out of agriculture do not enter high-productivity formal jobs but instead shift into informal urban trade, transport, repair services, domestic work and small-scale manufacturing. Second, the pace of job creation in the formal private sector has lagged behind demographic growth. Ethiopia’s youthful population structure means that millions of young people enter the labour force each year, and when the modern sector cannot absorb them, informality becomes the default outcome rather than a temporary phase. Third, regulatory and administrative barriers continue to matter. Complex business registration procedures, limited access to finance, weak contract enforcement, low trust in state institutions, and the costs of compliance with taxation and licensing requirements all reduce the incentives for micro and small firms to formalise.
Urbanisation is a particularly important part of the story. Ethiopia remains predominantly rural (see Chart 4), but its towns and cities are growing rapidly, and much of this expansion is occurring through informal settlement and informal employment. The same structural pressures that drive urban growth, rural land fragmentation, youth underemployment, displacement and conflict also expand the pool of urban workers who depend on informal activities for survival. In that sense, informality is not only a labour-market issue; it is also a spatial development issue. If secondary cities and major corridors do not generate sufficient formal enterprise growth, urbanisation can deepen rather than reduce informalisation. This is especially relevant for Ethiopia because the World Bank’s CCDR already warns that urban land informality and climate exposure, particularly flood risk, are increasing. In practical terms, an urban economy built on insecure land tenure, weak services and informal enterprise is less productive, less resilient and harder to tax.
Gender and household structure also shape the informal economy. Across Africa, women are disproportionately represented in vulnerable and informal employment, especially in petty trade, home-based production and unpaid family work. Ethiopia is no exception. Formalisation is therefore closely linked to gender policy, including women’s access to finance, education, childcare, safe transport, market infrastructure and legal recognition of enterprises. Without targeted action, aggregate formalisation can advance while leaving women concentrated in the lowest-income segments of the labour market.
The relatively modest Current Path decline also shows that formalisation in Ethiopia is likely to be gradual rather than automatic. Economic growth alone does not eliminate informality. In fact, high-growth economies can sustain large informal sectors if growth is concentrated in capital-intensive sectors, if finance is shallow, or if labour regulation and tax systems remain poorly aligned with the realities of micro and small enterprises. Ethiopia’s past growth pattern, driven heavily by public investment, construction and a narrow set of urban activities, did not generate enough formal, labour-absorbing employment. That is precisely why the TYDP and the HGER agenda place so much emphasis on private-sector-led growth, manufacturing, Micro, Small, and Medium Enterprises (MSMEs) development, digitalisation, export competitiveness and job creation. This shows that Ethiopia’s development strategy increasingly recognises that reducing informality is central to productivity growth, tax mobilisation and social inclusion.
This is also where national targets matter. While Ethiopia does not always state a single headline informality target in the same way it does for GDP growth or industrial expansion, the direction of policy is explicit. The TYDP aims to accelerate structural transformation, raise productivity, expand formal private employment and strengthen domestic revenue mobilisation. The HGER agenda reinforces this through financial-sector reform, better business conditions, more competitive markets and stronger support to private enterprise. Digital public infrastructure also matters here. Measures such as digital ID expansion, tax administration reform, electronic payments and business registration platforms can lower the costs of formalisation and improve state visibility over firms and workers. But formalisation will not succeed if it is pursued only through enforcement. It has to be linked to tangible benefits, access to credit, market access, legal protection, infrastructure, and inclusion in public services and procurement systems.
The larger development stakes are significant. A decline in informal economy would help broaden the tax base, improve productivity and expand the contributory base for social insurance. A decline in informal non-agricultural employment would also imply some improvement in job quality, labour protections and enterprise stability. However, the trend is still far from transformative. By 2043, Ethiopia would remain an economy in which informal activity plays a central role in absorbing labour, especially in urban areas. The policy lesson is that informality should not be treated as a marginal labour issue but as a core development challenge linked to industrial policy, urban planning, fiscal reform, gender inclusion and social protection.
Read in relation to Agenda 2063 and SDG 8, the Current Path is therefore one of partial progress. It moves Ethiopia in the right direction, but not fast enough to achieve the scale of productive and inclusive transformation implied by the continental ambition of decent work, rising productivity and broad-based prosperity. To outperform this path, Ethiopia would need to accelerate labour-intensive manufacturing, expand MSME upgrading, improve urban governance, reduce the cost of compliance for small firms, strengthen women’s economic inclusion, and build a more coherent bridge between informality, taxation and social protection. Without those changes, informality will continue to act as both a safety valve and a drag on structural transformation.
Chart 7 presents GDP per capita in PPP (constant 2021 International $) in the Current Path, from 1990 to 2043, compared with the average for the African income group.
Ethiopia’s GDP per capita trajectory reflects the interaction between economic growth, population expansion and macroeconomic adjustment. The series can be understood in four broad phases: a sharp contraction in the early 1990s, a slow and uneven recovery through the early 2000s, a sustained acceleration after 2003, and a Current Path trajectory of renewed expansion after 2024. GDP per capita declined from about US$874 in 1990 to roughly US$681 in 1992, reflecting political transition, conflict and macroeconomic disruption during the final years of the Derg regime and the early post-transition adjustment period. Recovery through the 1990s and early 2000s was gradual and vulnerable to drought and external shocks, with GDP per capita only returning to around US$796 by 2003.
After 2003, Ethiopia entered a prolonged period of high growth. As noted in Chart 5, real GDP growth averaged roughly 10% annually for the period 2004-2018, supported by large-scale public investment in infrastructure, expansion in agriculture, construction and services, and improvements in basic service delivery. The country moved from being the second poorest in the world by 2000 to the eleventh poorest in 2014. However, because population growth remained high, GDP per capita rose more slowly than aggregate GDP, but still improved steadily, reaching approximately US$2 896 in 2025. This is why Ethiopia can rank among Africa’s largest economies in total size while remaining relatively poor in per capita terms. Under the Current Path, GDP per capita will rise further to about US$5 675 by 2043.
From a regional perspective, Ethiopia’s per capita income remains low despite its strong aggregate growth performance. Sub-Saharan Africa’s average GDP per capita in PPP (constant 2021 US$) reached US$4 963 in 2025 from US$3 778 in 1990. This underscores that Ethiopia is a large economy in aggregate terms, but still a low-income country in per capita terms. Within the Horn of Africa, Ethiopia’s position is mixed. It has a higher per capita income than some fragile neighbours (Eritrea and Somalia) but remains below smaller, more urbanised economies such as Djibouti. The gap reflects differences in population size, economic structure, export composition and exchange rate regimes.
The Current Path forecast of US$5 675 per capita by 2043 implies continued progress in average living standards, but not at the pace envisioned in Ethiopia’s own development strategy. The TYDP frames the national ambition as becoming an “African Beacon of Prosperity” through sustained high growth, structural transformation, industrialisation, export expansion and rising productivity. Read against that ambition, the Current Path represents meaningful progress, but not a full breakthrough. Ethiopia would be substantially richer by 2043 than today, yet still below the level implied by the country’s most ambitious targets for rapid middle-income transition.
The shocks of the early 2020s help explain this more moderate baseline. Conflict, drought, the lingering effects of COVID-19, high inflation, foreign exchange shortages and debt stress all reduced the efficiency with which growth translated into household welfare. These constraints matter directly for PPP-based per capita income as well, even if less immediately than for MER measures, because inflation, weak productivity growth and supply disruptions erode real consumption possibilities. In practical terms, the Current Path assumes that Ethiopia regains macroeconomic stability and continues to grow, but that it does not fully overcome the structural and political constraints that have slowed the pace of transformation.
This is where the reform agenda becomes decisive. The HGER agenda, together with broader macroeconomic adjustment and financial-sector reforms, is designed to stabilise inflation, improve the foreign exchange regime, strengthen domestic revenue mobilisation and create a more enabling environment for private investment. If sustained, these reforms should support stronger growth in GDP per capita by improving both productivity and the efficiency of resource allocation. But reform alone is not enough. Per capita gains will also depend on whether Ethiopia can expand labour-intensive manufacturing, modern services, agro-processing and export-oriented sectors quickly enough to absorb its growing workforce.
Demography is therefore critical to the outlook. Ethiopia’s falling dependency ratio and expanding working-age population create the conditions for faster growth in income per person. But, as noted in an earlier narrative around Chart 2, this dividend is not automatic. If labour markets fail to create productive jobs at scale, much of the working-age population will remain trapped in low-productivity agriculture or informal urban employment, slowing the rise in per capita income. If, however, the economy can generate productive jobs and raise labour productivity, demographic change could become a major force pushing income per person upward more rapidly than in the past.
The policy lesson from Chart 7 is that Ethiopia’s GDP per capita at PPP (constant 2021 International$) has improved markedly since the early 1990s and is forecasted to continue rising through 2043, but the baseline remains one of gradual catch-up rather than rapid convergence. To move beyond this path, Ethiopia will need not just continued growth, but deeper structural transformation, macroeconomic stability, stronger export performance, faster productivity gains and much more effective labour absorption. Without those shifts, the country may continue to grow impressively in aggregate terms while still advancing too slowly in per capita welfare relative to its own stated ambitions.
Chart 8 presents the poverty rate and the number of extremely poor people in the Current Path from 2022 to 2043.
In June 2025, the World Bank updated its international poverty lines to 2021 PPP terms, setting the extreme poverty line at International $3.00 per person per day, alongside higher poverty lines of International $4.20 for lower-middle-income economies and International $8.30 for upper-middle-income economies. Ethiopia remains classified as a low-income economy under the World Bank’s latest income classification and, therefore, the International $3.00-a-day threshold is the most relevant international benchmark for assessing extreme poverty.
Ethiopia’s Current Path suggests a large reduction in extreme poverty over the next two decades. At the $3.00-a-day poverty line (2021 PPP), the poverty rate will fall from 29.3% in 2025 to about 6% by 2043. In absolute terms, the number of people living below this threshold will decline from approximately 39.6 million to 11.8 million. This implies that roughly 27.8 million people would move above the extreme-poverty threshold over the forecast period.
In monetary terms, the Current Path depicts a great improvement and would place Ethiopia on a significantly better trajectory than much of sub-Saharan Africa, where extreme poverty remains both deeper and more persistent. The World Bank’s comparable estimate for sub-Saharan Africa at the same$3.00 poverty line was 45.2% in 2025, far above Ethiopia’s 29.3% in the same period, underlining the scale of the improvement implied by the Current Path.
However, monetary poverty alone does not fully capture deprivation in Ethiopia, where poverty is also expressed through deficits in education, health, nutrition, housing quality, sanitation, electricity and access to basic services. This is why Ethiopia’s monetary poverty trend must be read alongside multidimensional poverty.
The multidimensional lens is particularly important in Ethiopia because a household can rise above an income poverty threshold while remaining deprived in schooling, child nutrition, cooking fuel, drinking water, housing materials or asset ownership. The global Multidimensional Poverty Index (MPI), produced by UNDP and the Oxford Poverty and Human Development Initiative, consistently shows that a large share of Ethiopians experience overlapping deprivations rather than income shortfalls alone. According to the report, “Ethiopia’s population that is multidimensionally poor increased from 68% in 2019 to 72% in 2024, with an additional 18% susceptible to multidimensional poverty”. The country’s multidimensional poverty is especially concentrated in rural areas, among households dependent on low-productivity agriculture, and in regions with weaker service delivery and higher climate exposure. This means that even if the share of people living below $3.00 declines sharply, the pace of reduction in broader deprivation may be slower unless improvements in social services and living standards keep pace with income gains.
The policy importance of this distinction is profound. Monetary poverty tends to respond most directly to economic growth, inflation and labour income. Multidimensional poverty responds more slowly and depends heavily on public policy, especially in education, health, water, sanitation, electricity, housing and social protection. Ethiopia’s poverty trajectory since the 2000s reflects this duality. Strong economic growth helped reduce income poverty, but multidimensional deprivation remained widespread because progress in human development and infrastructure access was uneven across regions and between rural and urban areas. As a result, the Current Path should not be interpreted as meaning that poverty will simply disappear as GDP expands. Rather, it suggests that Ethiopia could make major gains in monetary poverty while still facing a more stubborn challenge in reducing overlapping non-income deprivation.
Rural poverty remains central to the outlook. Most of Ethiopia’s poor still live in rural areas, where livelihoods are highly exposed to rainfall variability, land fragmentation, low agricultural productivity and weak market integration. The World Bank’s CCDR makes clear that drought, land degradation and food price shocks remain major poverty drivers. From a multidimensional perspective, rural poverty is also associated with weak access to quality education, healthcare, safe water, improved sanitation and modern energy. This is why poverty reduction in Ethiopia cannot be achieved by income growth alone. It also requires steady improvements in service delivery, rural infrastructure and resilience to climate shocks.
Urbanisation adds a second layer of complexity. Ethiopia’s urban population is growing rapidly, and while cities offer more opportunities for wage employment and service access, they also produce new forms of multidimensional deprivation through informal housing, insecure tenure, unemployment, poor drainage, overcrowding and weak access to sanitation. The World Bank’s CCDR notes that urban land informality and flood exposure are increasing, which means some households may move out of rural income poverty only to enter urban vulnerability. This is particularly important for young migrants, displaced households and informal workers, whose welfare may improve in some dimensions but deteriorate in others.
Conflict and displacement further complicate both monetary and multidimensional poverty reduction. Internal displacement disrupts livelihoods, education, healthcare access and housing security all at once. A displaced household may lose income, but also school continuity, nutrition, shelter quality and access to water and sanitation. This is one reason why multidimensional poverty is often more sensitive than monetary poverty to conflict conditions. Ethiopia’s Current Path implicitly assumes a gradual easing of these pressures. If displacement remains widespread, both income poverty and multidimensional poverty would likely fall more slowly than projected.
Social protection remains one of the strongest bridges between the two poverty concepts. Ethiopia’s Productive Safety Net Programme (PSNP) has helped reduce income insecurity, protect assets and cushion climate shocks, especially in rural areas. But its broader value lies in the fact that it also helps prevent households from falling into multidimensional deprivation by stabilising food access, protecting children’s welfare and reducing distress coping strategies. To align monetary poverty reduction with multidimensional poverty reduction, Ethiopia will need to strengthen and modernise this system further, including better targeting, more shock responsiveness and stronger integration with nutrition, education, health and livelihoods support.
This is also where Ethiopia’s national development ambitions become relevant. The TYDP does not frame poverty reduction narrowly as an income issue; it links prosperity to structural transformation, human capital, productivity and improved access to services. That broader framing is much closer to multidimensional poverty thinking than to a purely monetary poverty line. Likewise, SDG 1 calls not only for ending extreme poverty, but also for reducing poverty “in all its forms,” while Agenda 2063 emphasises inclusive growth, improved living standards and human well-being. In other words, Ethiopia’s own planning architecture already recognises that poverty reduction must be multidimensional, even when headline monitoring often focuses on monetary measures.
The main policy conclusion is therefore that Ethiopia’s forecasted fall in extreme poverty is credible only if it is accompanied by an equally serious reduction in multidimensional deprivation. A decline from 29.3% in 2025 to 6% by 2043 at the $3.00 line would be a major achievement, but it will not by itself mean that deprivation has been overcome. To make poverty reduction durable and inclusive, Ethiopia must combine macroeconomic stability and job-rich growth with targeted improvements in education, health, nutrition, water, sanitation, housing, electricity and social protection. Without that broader transformation, monetary poverty may fall faster than multidimensional poverty, leaving large numbers of Ethiopians above the income threshold but still deprived of the capabilities and services that define human well-being.
Chart 9 depicts the National Development Plan (NDP).
Ethiopia’s Ten-Year Development Plan (TYDP) 2021–2030 represents a strategic shift from the Growth and Transformation Plans (GTP I and GTP II) model toward a more market-oriented, productivity-driven and structurally transformative development framework. It is both a continuation of Ethiopia’s state-led developmental tradition and a deliberate recalibration toward private-sector leadership, macroeconomic stabilisation and export competitiveness. The Plan is reinforced by the Homegrown Economic Reform (HGER) agenda and subsequent macroeconomic reform measures supported by international financial institutions. Together, these instruments define Ethiopia’s development trajectory through 2030 and shape its positioning toward Agenda 2063’s 2043 milestone.
At its core, the TYDP is built on four interlinked pillars: (1) sustaining rapid, inclusive and resilient growth; (2) ensuring macroeconomic stability and structural transformation; (3) expanding social and human capital development; and (4) strengthening institutions and governance. Unlike the GTP I and II that relied heavily on public investment and state-owned enterprises, the TYDP explicitly recognises the limits of debt-financed, import-intensive growth and calls for a transition to private-sector-led development, export diversification and productivity enhancement. The Plan targets average real GDP growth of around 10% annually over the decade, accompanied by a structural shift in GDP composition, reducing the dominance of low-productivity agriculture and expanding manufacturing, industry and modern services.
The macroeconomic framework of the TYDP is closely linked to the HGER launched in 2019. The HGER addresses foreign exchange shortages, financial repression, fiscal imbalances, debt sustainability, state-owned enterprise reform and market distortions. It aims to correct macroeconomic vulnerabilities while laying the foundation for competitive industrialisation. Key instruments include exchange-rate reforms, financial sector liberalisation, tax policy and administration reform, improved public financial management, and the gradual opening of strategic sectors, for example, telecommunications and logistics, to private and foreign investment. In effect, the TYDP provides the long-term structural vision, while the HGER provides the macro-stabilisation and institutional adjustment mechanism required to achieve it.
Structurally, the Plan prioritises industrialisation, agro-processing, manufacturing expansion, digital transformation, and climate-resilient development. Manufacturing is expected to grow rapidly, supported by industrial parks, logistics corridors, improved power generation and export promotion. Agriculture remains central but is repositioned toward productivity, irrigation expansion, agro-industrial integration and value-chain development. The Plan also integrates Ethiopia’s Climate-Resilient Green Economy (CRGE) strategy, aligning growth with environmental sustainability and low-carbon development. This dual focus on industrial expansion and climate resilience reflects recognition that Ethiopia’s growth model must balance competitiveness with vulnerability to climate shocks.
Institutionally, the TYDP strengthens monitoring and evaluation systems through alignment with national statistical frameworks and results-based performance management. Implementation is decentralised through Ethiopia’s federal system, meaning regional governments play a critical role in delivering outcomes. Fiscal decentralisation and intergovernmental transfers, therefore, become implementation instruments in their own right. Public investment planning, state-owned enterprise reform, digital governance expansion, and enhanced data systems form part of the operational backbone of the Plan.
In continental terms, the TYDP is explicitly aligned with Agenda 2063, particularly its First and Second Ten-Year Implementation Plans (FTYIP and STYIP). Agenda 2063 envisions structural transformation, industrialisation, regional integration, peace and prosperity across Africa. Ethiopia’s emphasis on industrialisation, infrastructure corridors, manufacturing competitiveness, export expansion and human capital development directly supports Agenda 2063’s Aspiration 1 (A prosperous Africa based on inclusive growth and sustainable development). The CRGE strategy aligns with Aspiration 7 (environmentally sustainable and climate-resilient economies). The TYDP’s governance and institutional reform components correspond to Aspiration 3 (good governance, democracy and rule of law). In this sense, Ethiopia’s national plan can be seen as a domesticated implementation instrument for Agenda 2063.
The Plan also aligns with the African Continental Free Trade Area (AfCFTA). Ethiopia ratified the AfCFTA Agreement in 2019, and the TYDP emphasises export diversification, logistics reform, trade facilitation and competitiveness enhancement, preconditions for benefiting from continental market integration. AfCFTA offers Ethiopia access to a market of over 1.5 billion people, but real gains depend on industrial competitiveness, customs efficiency, standards harmonisation and trade finance. The TYDP’s industrial park strategy, logistics reform and financial-sector restructuring are therefore indirectly AfCFTA-enabling instruments. However, Ethiopia’s ability to fully leverage AfCFTA will depend on resolving foreign exchange constraints, strengthening domestic production capacity and integrating regional value chains.
Regionally, Ethiopia’s strategy is closely tied to Intergovernmental Authority on Development (IGAD) frameworks and Horn of Africa integration initiatives. Ethiopia’s development is geographically interdependent with Djibouti (port access), Kenya (LAPSSET corridor linkages), Sudan and South Sudan (trade and energy interconnection), and Somalia (security and economic stabilisation). Infrastructure corridors, cross-border electricity exports (notably through the GERD), and trade integration are central to regional development strategies. The TYDP’s focus on logistics efficiency and corridor diversification, therefore, aligns with IGAD’s regional infrastructure and resilience priorities.
At the global level, the Plan is aligned with the Sustainable Development Goals (SDGs). It directly addresses SDG 1 (No Poverty), SDG 8 (Decent Work and Economic Growth), SDG 9 (Industry, Innovation and Infrastructure), SDG 13 (Climate Action), and SDG 16 (Institutions). Ethiopia’s Voluntary National Reviews (VNR) emphasise that the TYDP serves as the primary vehicle for SDG implementation. The Plan’s results framework is broadly harmonised with SDG indicators, reinforcing coherence between national and global commitments.
Financing remains a critical challenge. The TYDP assumes a combination of domestic resource mobilisation, foreign direct investment (FDI), concessional borrowing, remittances and public-private partnerships. Strengthening tax revenue mobilisation, improving state-owned enterprise efficiency and stabilising debt dynamics are essential to sustaining implementation. Ethiopia’s recent debt restructuring efforts and IMF-supported programmes are therefore part of the enabling macro-financial environment for the Plan.
The key strategic risk lies in implementation capacity and political stability. Ethiopia’s federal structure requires strong coordination between federal and regional governments. Conflict and displacement have previously disrupted investment and service delivery. Without sustained peace, macroeconomic stability and institutional coherence, the Plan’s ambitious growth and transformation targets may remain partially realised.
Overall, Ethiopia’s TYDP represents a structurally ambitious and continentally aligned framework. It integrates macroeconomic reform with industrial strategy, climate resilience, social development and governance reform. It operationalises Agenda 2063 at the national level, positions Ethiopia to benefit from AfCFTA and supports IGAD regional integration objectives. However, its success will ultimately depend on macroeconomic stabilisation, political stability, effective institutional coordination and the pace at which Ethiopia can transition from a state-driven growth model to a competitive, export-oriented and productivity-led economy.
The eight sectoral scenarios as well as their relationship to the Current Path forecast and the Combined scenario are explained in the About Page. Chart 10 summarises the approach.
Chart 11 presents the mortality distribution in the Current Path for 2025 and 2043.
The Demographics and Health scenario envisions ambitious improvements in child and maternal mortality rates, enhanced access to modern contraception, and decreased mortality from communicable diseases (e.g., AIDS, diarrhoea, malaria, respiratory infections) and non-communicable diseases (e.g., diabetes), alongside advancements in safe water access and sanitation. This scenario assumes a swift demographic transition supported by heightened investments in health and water, sanitation, and hygiene (WaSH) infrastructure.
Visit the themes on Demographics and Health/WaSH for more details on the scenario structure and interventions.
Ethiopia is moving through a complex epidemiological transition in which communicable diseases are declining, but they remain a major cause of death, while non-communicable diseases are rising quickly. The pattern is consistent with the broader epidemiological transition observed across many low- and lower-middle-income countries. As fertility falls, life expectancy improves, and the working-age and older populations expand, chronic conditions such as hypertension, cardiovascular disease, cancers, diabetes and chronic respiratory disease become more prominent. However, Ethiopia’s transition is not yet at the point where non-communicable diseases completely dominate the mortality profile.
In the communicable diseases category, “other communicable diseases” will remain the leading cause of death, although the Current Path shows that deaths related to these diseases will fall sharply from about 204 200 in 2025 to 80 620 by 2043. Deaths caused by respiratory infections will also decline from about 65 960 to 42 140 over the same period. This indicates that Ethiopia is making progress against infectious disease burdens, but not quickly enough to eliminate the communicable disease challenge by 2043.
At the same time, in thenon-communicable diseases (NCDs) category, deaths from cardiovascular disease, malignant neoplasms and other non-communicable diseases will rise substantially. Cardiovascular-related deaths will increase from 124 200 in 2025 to 232 900 by 2043, deaths from malignant neoplasms from 133 900 to 229 500, and deaths from other non-communicable diseases from 78 190 to 84 510.
This dual burden mortality structure has important policy implications. The persistence of respiratory and other communicable diseases reflects continued exposure to poverty-related health risks, including unsafe water, poor sanitation, undernutrition, household air pollution, overcrowding, limited access to timely care, and vulnerability to climate shocks and displacement. At the same time, the rise in cardiovascular disease and cancer-related diseases such as malignant neoplasm reflects demographic change, urbanisation, lifestyle shifts and longer survival into older ages. Ethiopia’s health system must therefore continue strengthening prevention and control of communicable diseases while rapidly expanding capacity for chronic disease screening, treatment and long-term care.
The WaSH environment is central to this mortality profile. In 2025, only 16.4% of Ethiopia’s population had access to safely managed water services, with a wide rural–urban gap: 8.7% in rural areas compared with 41.5% in urban areas. By 2043, the Current Path suggests urban access will rise to about 61.1%, but rural access will remain low at 31.6%. This means that unsafe water will continue to contribute to diarrheal disease, undernutrition, child illness and preventable mortality, especially in rural communities. Sanitation is even more problematic. The Current Path shows very low access to safely managed sanitation, with urban and rural access moving from 18.8% and 6.9% in 2025 to just 28.4% and 24.1% by 2043, respectively.
Ethiopia’s policy framework recognises these challenges. The Health Sector Transformation Plan II (HSTP II, 2020/21–2024/25), the Health Extension Programme, and the broader universal health coverage agenda provide the foundation for expanding equitable health services. The One WASH National Programme (OWNP) is also a key instrument for improving water, sanitation and hygiene through coordinated action across health, water, education and local government institutions. These frameworks are aligned with SDG 3 on health, SDG 6 on water and sanitation, and Agenda 2063’s aspiration for healthy and well-nourished citizens. The main challenge is therefore not the absence of policy, but the scale and speed of implementation, particularly in rural, pastoralist, conflict-affected and rapidly urbanising areas.
The strongest policy response is an integrated health and WaSH strategy. Ethiopia should modernise the Health Extension Programme so that it continues to support immunisation, maternal and child health, nutrition and communicable disease prevention, while also expanding into NCD screening, referral and health education. Primary healthcare facilities need stronger capacity to diagnose and manage hypertension, diabetes, cancers and chronic respiratory conditions through reliable medicines, digital follow-up systems and affordable care. At the same time, WaSH investments should be treated as core health investments, with priority given to safely managed rural water, urban sanitation, faecal sludge management, wastewater treatment, hygiene promotion and climate-resilient infrastructure. Clean cooking and reduced household air pollution should also be part of respiratory disease prevention.
Chart 12 presents the infant mortality rate in the Current Path and the Demographics and Health scenario, from 2022 to 2043.
Infant mortality, defined as deaths between birth and 365 days per 1 000 live births, is one of the most sensitive indicators of health and development trajectory. It reflects not only the quality of newborn and maternal healthcare, but also nutrition, immunisation, household income, maternal education, access to clean water and sanitation, and the ability of the health system to reach rural, poor and conflict-affected communities. Chart 12 should therefore be read both as a health-system performance indicator and as a broader measure of social inclusion.
Ethiopia has made sustained progress in reducing infant mortality since the 1960s, with especially strong gains after the 1990s. In 2022, the infant mortality rate stood at about 42.7 deaths per 1 000 live births, almost three times lower than in 1990 and significantly lower than the average for sub-Saharan Africa (51.2 deaths per 1 000 lives). This decline reflects a combination of policy and service-delivery improvements, including the expansion of the Health Extension Programme, increased immunisation coverage, improved maternal and child health services, wider use of antenatal care, better community health outreach, and gradual improvements in nutrition and access to basic services. Ethiopia’s health planning architecture, particularly the Health Sector Transformation Plans, has consistently prioritised maternal, newborn and child health, while the TYDP frames health improvement as part of the country’s human-capital and productivity agenda.
The Current Path shows that Ethiopia will continue making progress, with infant mortality declining from 37.4 deaths per 1 000 live births in 2025 to 14.2 deaths per 1 000 live births by 2043. This would represent a major improvement, but the pace of progress will depend on whether Ethiopia can sustain health-system expansion while addressing the underlying social determinants of infant deaths. Many infant deaths are preventable and are linked to complications around birth, prematurity, infections, poor nutrition, low birthweight, unsafe water, poor sanitation and delayed access to care. Continued progress will therefore require stronger primary healthcare, better referral systems, improved emergency obstetric and newborn care, reliable vaccine delivery, nutrition interventions and stronger WaSH services.
Under the Demographics and Health scenario, Ethiopia will reduce infant mortality further to 10.9 deaths per 1 000 live births by 2043, roughly three fewer infant deaths per 1 000 live births than the Current Path forecast. The difference may appear small numerically, but in a country with Ethiopia’s population size and birth cohort, it would translate into thousands of additional infant lives saved. The scenario implies faster progress in the key drivers of child survival: better maternal health, expanded skilled birth attendance, stronger neonatal care, improved immunisation, wider access to contraception, lower fertility, better nutrition, and improved water and sanitation coverage.
Ethiopia’s progress must also be interpreted against global and continental targets. SDG 3.2 calls for all countries to end preventable deaths of newborns and children under five, with neonatal mortality reduced to at least as low as 12 deaths per 1 000 live births and under-five mortality to at least as low as 25 deaths per 1 000 live births by 2030. While infant mortality is not identical to neonatal mortality, the SDG benchmark provides an important policy signal: Ethiopia’s Current Path continues in the right direction, but the Demographics and Health scenario would bring the country closer to the level of performance expected from a stronger, more inclusive health system. This also aligns with Agenda 2063’s aspiration for healthy and well-nourished citizens and with Ethiopia’s national commitment to universal health coverage.
The main risks to the forecast are inequality, conflict, climate stress and weak WaSH access. Infant mortality tends to be higher among poorer households, rural communities, pastoralist populations and regions with weaker health infrastructure. Conflict and displacement interrupt antenatal care, vaccination, nutrition services and safe delivery, while drought and food insecurity increase the risk of malnutrition and disease. Poor water and sanitation also remain major constraints, especially because diarrhoeal disease and repeated infections weaken infant health. As noted in the previous subsection, safely managed water and sanitation access remains low, particularly in rural Ethiopia, and this will continue to affect child survival unless WaSH investment accelerates.
The policy implication is that reducing infant mortality to the Demographics and Health scenario level will require more than health-sector spending alone. Ethiopia needs an integrated child-survival strategy built around primary healthcare, maternal and newborn care, nutrition, immunisation and WaSH. Priority interventions include improving the quality of antenatal and delivery services, expanding skilled birth attendance, strengthening neonatal intensive and referral care, ensuring reliable vaccine supply, scaling community-based nutrition programmes, expanding access to modern contraception, and improving rural water and sanitation. The Health Extension Programme remains a critical delivery platform, but it needs continued upgrading so that community-level workers are better linked to health facilities, referral systems and digital health records.
Chart 13 presents the demographic dividend in the Current Path and in the Demographics and Health scenario, from 2020 to 2043.
Ethiopia’s demographic dividend outlook should be read as a measure of economic potential, not as a guarantee of faster development. The United Nations Population Fund (UNFPA) defines the demographic dividend as the growth opportunity that emerges when the working-age population becomes large relative to dependants, usually as fertility declines and the age structure shifts. The World Bank’s operational guidance similarly stresses that this window is typically time-bound, often lasting only a few decades (20-30 year period), and that it produces gains only when countries invest early in health, education, jobs, governance and women’s empowerment. In other words, a favourable age structure creates the conditions for faster growth, but policy determines whether the dividend is captured or lost.
The Current Path points to a delayed and fragile demographic opportunity rather than an immediate dividend. The ratio of working-age people to dependants will rise from about 1.4 in 2025 to the threshold of 1.7 by 2043 under the Current Path, implying that Ethiopia will not fully enter the demographic dividend period until the end of the forecast horizon.
However, the shift is still important because it reflects falling fertility, a declining child-dependency burden and a growing share of the population in the labour-force age group. It also implies that, over time, a larger share of Ethiopians would be productive, saving and paying taxes relative to those requiring childhood or old-age support.
The Demographics and Health scenario will improve this outlook. Under this scenario, Ethiopia will reach the demographic dividend threshold in 2040, four years earlier than in the Current Path, and the working-age-to-dependant ratio will rise to 1.9 by 2043. This improvement reflects faster fertility decline, better child survival, expanded reproductive health services, and stronger health outcomes. The difference matters because an earlier and larger demographic window gives Ethiopia more time to benefit from a growing labour force before population ageing begins to exert fiscal and health pressures later in the century. It also means that investments made in the 2020s and 2030s will shape whether the larger working-age cohort becomes a productive asset or a source of social and labour-market pressure.
The main constraint is employment absorption. The World Bank’s Ethiopia Employment and Jobs Study warns that Ethiopia’s labour force is forecasted to grow by about 1.7 million people per year, placing enormous pressure on the economy to create productive jobs. The ILO Youth Country Brief reports that about 19.3% of youth were not in employment, education or training (NEET) in 2021, rising to 27.9% among young women. These figures indicate that Ethiopia’s demographic dividend is constrained not by demography alone, but by the ability of the economy to absorb young people into decent work. If job creation remains concentrated in low-productivity agriculture, informal trade and vulnerable self-employment, the dividend will be muted even if the age structure becomes more favourable.
This is why the demographic dividend must be linked directly to Ethiopia’s structural transformation agenda. The TYDP and the HGER agenda both emphasise private-sector-led growth, industrialisation, productivity, exports and job creation. These priorities are essential because a larger working-age population only raises income per person if workers move into more productive activities. Manufacturing, agro-processing, construction, logistics, digital services and modern urban services will need to absorb a much larger share of youth employment. Without this shift, Ethiopia could experience a ‘demographic burden’ rather than a dividend (more working-age people, but too few productive jobs).
Human capital is the second decisive condition. A demographic dividend depends not only on the number of workers, but on their health, skills and productivity. Ethiopia has made progress in education and health, but learning outcomes, secondary completion, technical skills and health-system quality remain uneven. The Demographics and Health scenario improves the dividend partly because better health and lower fertility change the population structure, but the economic payoff will depend on whether young Ethiopians complete school, acquire market-relevant skills and enter productive employment. Girls’ education is especially important because it is linked to lower fertility, delayed marriage, improved child health and higher female labour-force participation.
Gender inclusion is therefore central to the dividend. Ethiopia cannot capture the full benefit of a larger working-age population if young women remain disproportionately excluded from work, education and training. The much higher female NEET rate indicates that social norms, unpaid care burdens, early marriage, safety concerns, skills gaps and limited access to finance continue to restrict women’s economic participation. Policies that expand childcare, improve girls’ secondary education, strengthen reproductive health services, support women-owned enterprises and improve safe transport would directly raise the effective size and productivity of Ethiopia’s labour force.
Displacement and conflict also shape the demographic outlook. The International Organisation for Migration (IOM) reported around 3.3 million internally displaced persons as of May 2024, and displacement disrupts education, health services, livelihoods and local labour markets. A demographic dividend depends on stable institutions and functioning markets; repeated displacement weakens both. It can trap young people outside school and work, increase urban informality, strain host-community services and reduce the productivity of affected regions. Peacebuilding, reintegration, and service restoration in conflict-affected areas are therefore not separate from the demographic dividend agenda. They are part of it.
The fiscal implications are equally important. A falling dependency ratio can eventually ease pressure on basic education and child health systems, while increasing the tax base if formal employment expands. But during the transition, Ethiopia must still finance large cohorts of children and youth, while also preparing for future ageing and rising non-communicable diseases. The policy challenge is to use the 2020s and 2030s to invest in the systems that convert favourable age structure into growth: quality education, primary healthcare, reproductive health, urban infrastructure, labour-intensive sectors, digital skills and social protection.
Chart 14 presents crop production and demand in the Current Path from 1990 to 2043.
The Agriculture scenario envisions an agricultural revolution that ensures food security through ambitious yet feasible increases in yields per hectare, due to improved management, seed, fertiliser technology, and expanded irrigation. Efforts to reduce food loss and waste are emphasised, with increased calorie consumption as an indicator of self-sufficiency and prioritising it over food exports. Additionally, enhanced forest protection signifies a commitment to sustainable land use practices.
Visit the theme on Agriculture for our conceptualisation and details on the scenario structure and interventions.
Ethiopia’s crop sector has expanded substantially since 1990, but demand is now rising faster than production. Historically, the country maintained a relatively narrow crop production gap. Between 1990 and 2009, crop production more than doubled from 14.1 million metric tons to 30.4 million metric tons, while demand increased from 14.5 million metric tons to 30.9 million metric tons. During this period, the annual crop deficit averaged about 806 000 metric tons, suggesting that although Ethiopia was not fully self-sufficient, the gap between domestic food demand and crop output was still relatively contained.
After 2009, the balance deteriorated. Crop demand increased more quickly than production, reaching 57.1 million metric tons in 2025, compared with production of 51 million metric tons. This widened the crop deficit to about 6.1 million metric tons, up from only 540 000 metric tons in 2009. Under the Current Path, this deficit will nearly double to 11.1 million metric tons by 2043, as demand rises to 94.2 million metric tons while production reaches only 83.1 million metric tons. The trend is therefore not one of stagnation, production continues to rise, but of insufficient production growth relative to demographic expansion, urbanisation, changing diets and rising food demand.
Ethiopia’s population will continue growing rapidly until 2043, while the urban population will also expand. Both trends raise aggregate food demand. Urbanisation changes consumption patterns, increasing demand for processed foods, cereals, oils, fruits, vegetables and animal-based products. At the same time, higher incomes gradually diversify diets, further increasing pressure on domestic production systems. If agricultural productivity does not improve fast enough, Ethiopia will become more dependent on food imports, exposing households and public finances to global price volatility, foreign exchange constraints and regional supply disruptions.
The country’s national planning framework recognises this risk. Ethiopia’s TYDP places agriculture at the centre of structural transformation, food security and industrialisation. The Plan aims to raise agricultural productivity, expand irrigation, improve input use, strengthen agro-processing and increase the sector’s linkages with manufacturing and exports. This is consistent with Agenda 2063, which calls for modern agriculture for increased productivity and production, and with SDG 2, which focuses on ending hunger, improving nutrition and promoting sustainable agriculture. The challenge is implementation: the Current Path suggests that existing policy momentum is not sufficient to close the production-demand gap by 2043.
Irrigation is one of the most important constraints. Ethiopia has an estimated 3.5 million hectares of potential irrigable land, yet only a small share is currently irrigated. The Current Path shows the area actually irrigated will decline from about 803 000 hectares in 2025 to approximately 707 000 hectares by 2043, while land equipped for irrigation will also fall from 893 000 hectares to 785 000 hectares. This is concerning because Ethiopia’s agriculture remains heavily rain-fed and therefore highly exposed to drought, rainfall variability and climate change. Other studies suggest that less than 5% of Ethiopia’s irrigation potential is actually used, partly because of limited water storage, inadequate irrigation infrastructure, weak maintenance, high upfront costs, energy constraints and fragmented institutional coordination.
This irrigation gap is a major reason why production growth remains below potential. Ethiopia is often described as a water tower of the Horn of Africa, but water availability does not automatically translate into agricultural resilience. Without storage, canals, pumps, watershed management, rural roads and affordable energy, water resources cannot be converted into reliable production. The implication is that irrigation expansion should not be treated as a narrow agricultural input, but as a strategic food-security and climate-adaptation priority. Small-scale irrigation, farmer-led irrigation, groundwater management, solar pumping, watershed rehabilitation and large-scale irrigation schemes all have roles to play, but they require stronger coordination between water, agriculture, energy and local government institutions.
Yield performance is another central weakness. Ethiopia has increased crop output over time, but much of this has come from area expansion and labour mobilisation rather than strong yield gains. The comparison with Zambia and Uganda illustrates the point. Before 2008, Ethiopia’s crop yields were broadly comparable with Zambia’s, but by 2022, Zambia’s yields were almost twice as high. Zambia increased yields by about 105% between 2008 and 2022, compared with 28.6% for Ethiopia. Uganda also recovered strongly after a yield drop around 2016, increasing yields by roughly 57% between 2016 and 2022, compared with only 0.4% for Ethiopia over the same period. These comparisons suggest that Ethiopia’s agricultural challenge is not simply land scarcity or climate exposure; it is also a productivity challenge.
Several factors help explain Ethiopia’s relatively weak yield growth. Smallholder farming remains dominant, landholdings are fragmented, and many farmers face limited access to improved seed, fertiliser, mechanisation, irrigation, extension services, storage and rural finance. Soil degradation and erosion reduce productivity, while climate variability increases production risk. Conflict and displacement also disrupt farming systems, input distribution, transport routes and market access. In addition, high fertiliser prices and foreign exchange shortages can limit access to imported inputs. These constraints mean that even where national production rises, output per hectare often remains below potential.
The growing crop deficit also has macroeconomic consequences. Food imports require foreign exchange, which is already a binding constraint in Ethiopia. When the domestic food supply underperforms, inflationary pressure rises, especially food inflation, which disproportionately affects poor households. This links agriculture directly to poverty reduction, macroeconomic stability and social cohesion. A widening crop deficit could therefore undermine gains in extreme poverty reduction, increase vulnerability to global food price shocks and place additional pressure on public spending for humanitarian assistance and food security programmes.
The policy response must therefore focus on productivity rather than production alone. Ethiopia needs to raise yields, reduce post-harvest losses and improve resilience per hectare. Priority interventions include expanding irrigation and water storage, improving seed systems, strengthening fertiliser efficiency, scaling climate-smart agriculture, increasing mechanisation where appropriate, improving extension services, investing in rural roads and cold chains, and strengthening agricultural research. Better land management is also essential, particularly watershed restoration, soil conservation, terracing and sustainable land-use planning. These interventions would help raise production while reducing vulnerability to drought and land degradation.
Agro-processing is equally important. Ethiopia’s agricultural strategy should not be limited to producing more raw crops. Stronger links between farms and agro-industry can improve farmer incomes, reduce losses, create rural non-farm jobs and support industrialisation. This aligns with the TYDP’s emphasis on structural transformation and with the broader objective of shifting labour from low-productivity agriculture into higher-productivity activities. Crop production, agro-processing, logistics and exports should therefore be treated as one integrated food-system agenda.
Chart 15 presents the import dependence in the Current Path and the Agriculture scenario, from 2022 to 2043.
Under the Current Path, total agricultural production will rise from 57.9 million metric tons in 2025 to approximately 103 million metric tons by 2043, but demand will expand from 64.3 million metric tons to 114.3 million metric tons. This means that the production deficit will more than double, from 6.4 million metric tons in 2025 to about 11.3 million metric tons by 2043. In practical terms, Ethiopia would continue producing more food in absolute terms, but not fast enough to keep pace with population growth, urbanisation, changing diets and rising domestic demand. The result is a structurally widening food gap and increasing exposure to food imports.
The Agriculture scenario reverses this trajectory. Under this scenario, total agricultural production will increase much more rapidly, reaching 134.5 million metric tons by 2043. Demand will be broadly similar across the two scenarios, rising to approximately 114 million metric tons under the Agriculture scenario. This means that the difference between the two scenarios is driven almost entirely by stronger production, not lower demand. By 2043, Ethiopia will record a surplus of about 20.5 million metric tons under the Agriculture scenario.
This is a major shift in food-system performance. Import dependency, measured as the share of demand that must be met through net imports, will under the Current Path rise from 10.8% of demand in 2025 to 12.3% by 2043. That would leave Ethiopia increasingly dependent on international food markets, foreign exchange availability and regional trade stability. By contrast, the Agriculture scenario will reduce import dependency to -16.2% by 2043, meaning Ethiopia would become a net surplus producer relative to domestic demand. In historical terms, this would take Ethiopia back to self-sufficiency levels last experienced around 1976, and the 2043 outcome would be close to Zambia’s 2022 self-sufficiency position of about -13.4%.
Under the Current Path, rising import dependency would create three major risks. First, it would increase exposure to global food price volatility, as experienced in the prevailing global commodity and fertiliser shocks caused by the US-Israel-Iran war. Second, it would intensify pressure on Ethiopia’s already constrained foreign exchange position, because food imports would compete with fuel, fertiliser, machinery and intermediate goods. Third, it would weaken poverty reduction, since food inflation disproportionately affects poor households, especially those that spend a high share of income on basic staples. In this sense, agricultural underperformance is not only a food-security issue; it is also a macroeconomic, poverty and social-stability risk.
The Agriculture scenario shows that Ethiopia’s agricultural deficit is not inevitable. The country has significant latent potential in land, water, labour and agro-ecological diversity. Ethiopia’s TYDP identifies agriculture as a foundation for food security, export growth, agro-industrialisation and poverty reduction. The plan prioritises productivity growth, irrigation expansion, mechanisation, improved seed use, fertiliser access, livestock development, agro-processing and stronger market linkages. These priorities are consistent with SDG 2 on ending hunger and promoting sustainable agriculture, Agenda 2063’s goal of modern agriculture for increased productivity, and the Comprehensive Africa Agriculture Development Programme (CAADP) emphasis on agricultural transformation and food security.
The difference between the Current Path and the Agriculture scenario, therefore, depends on whether Ethiopia can shift from extensive to intensive agricultural growth. Historically, production increases have often come from expanding cultivated area and mobilising labour, rather than from sustained yield growth. But this approach is reaching limits because land fragmentation, soil degradation, conflict, climate variability and demographic pressure are increasing. The Agriculture scenario assumes stronger productivity gains per hectare, better water control, lower post-harvest losses and improved input efficiency. These are the areas where policy must focus if Ethiopia is to reduce import dependence.
Irrigation is central to this transition. Ethiopia has a large irrigation potential, but only a small share is currently developed and effectively used. Expanding small-scale and medium-scale irrigation, improving water storage, rehabilitating existing schemes, promoting solar-powered irrigation and strengthening watershed management would reduce dependence on erratic rainfall. This is especially important under climate change, since droughts and rainfall variability are among the main threats to crop production. Irrigation expansion also supports double cropping, higher-value crops and a more reliable supply for agro-processing industries.
Yield improvement is equally important. Ethiopia’s crop yields remain below potential and, in some cases, have grown more slowly than those of regional peers. Closing this gap requires stronger agricultural research, improved seed systems, better fertiliser blending and soil testing, mechanisation services, extension reform and access to rural finance. It also requires reducing post-harvest losses through storage, cold chains, rural roads and market infrastructure. Without these improvements, Ethiopia can continue expanding production but still fail to close the demand gap.
The Agriculture scenario also has implications for industrialisation. A surplus of approximately 20.5 million metric tons by 2043 would not only improve food security but also create opportunities for agro-processing, exports, feed industries, food manufacturing and rural job creation. This is important because Ethiopia’s broader structural transformation agenda depends on stronger linkages between agriculture and industry. Higher agricultural productivity can release labour from low-productivity farming while raising rural incomes and generating demand for manufactured goods and services. In this way, agriculture becomes an engine of transformation rather than a residual subsistence sector.
However, achieving the Agriculture scenario will require managing important risks. Climate shocks could reduce yields and undermine irrigation systems if water resources are not managed sustainably. Conflict and displacement can disrupt planting, harvesting, input distribution and market access. Fertiliser and fuel import constraints can reduce productivity. Weak land governance and tenure insecurity may discourage investment. Institutional fragmentation across agriculture, water, trade, finance and regional governments can also slow implementation. These risks explain why the Current Path remains much less favourable than the Agriculture scenario.
Chart 16 depicts the progress through the educational system in the Current Path, for 2025 and 2043.
The Education scenario represents reasonable but ambitious improvements in intake, transition and graduation rates from primary to tertiary levels and better quality of education at primary and secondary levels. It also models substantive progress towards gender parity at all levels, additional vocational training at the secondary school level, and increases in the share of science and engineering graduates.
Visit the theme on Education for our conceptualisation and details on the scenario structure and interventions.
Chart 16 should be read as a measure of how effectively Ethiopia’s education system moves children and young people from entry into primary school through completion, secondary progression, technical and vocational pathways, and tertiary education. This education funnel matters because Ethiopia’s development strategy depends not only on expanding enrolment, but on producing the skills needed for industrialisation, services growth, digital transformation and job creation.
Ethiopia has made major progress in expanding access to education over the past three decades. Primary education has been the main success story, supported by large public investment, school construction, teacher recruitment, the Education Sector Development Programmes, the Education and Training Roadmap, and the education priorities embedded in the TYDP. The national policy framework is also aligned with SDG 4 and Agenda 2063, which emphasise inclusive, equitable and quality education. Precisely, Goal 2 of the Agenda 2063 aims to achieve “well-educated citizens and skills revolution.” In addition, the Second Ten-Year Implementation Plan (2024-2033) places strong emphasis on universal, free and quality primary and secondary education, improved learning outcomes, and skills formation for Africa’s transformation. For Ethiopia, the key question is therefore no longer only whether children enter school, but whether they survive, transition, graduate and acquire labour-market-relevant skills.
The Current Path shows a mixed picture. Primary net enrolment is close to universal in aggregate terms, but male enrolment remains below full coverage, at about 87.6% in 2025, rising to 97.6% by 2043. This indicates continued progress, but also points to remaining access gaps among hard-to-reach children, including those in rural, pastoralist, poor and conflict-affected communities. The primary survival rate will improve from 75.1% in 2025 to 88% by 2043, showing that more children who enter primary school will remain in the system. However, the fact that survival will still fall short of 100% by 2043 indicates that dropout remains a material problem. In policy terms, Ethiopia has largely solved the first-order challenge of expanding primary entry, but has not yet fully solved the problems of retention, learning quality and equitable completion.
The strongest bottlenecks appear at education levels beyond primary. Transition rates into lower secondary education are relatively high (above 90%) and above 80% to upper secondary. However, graduation rates remain low, below 50% for lower secondary, and even weaker at the upper secondary level. This suggests that many students who enter secondary school do not complete the cycle. The binding constraint is therefore not only access to secondary education, but progression through it. Several factors likely explain this, including household poverty, opportunity costs of schooling, early entry into work, early marriage, distance to secondary schools, poor learning foundations from primary education, conflict-related disruption, and uneven school quality. This is especially important for Ethiopia’s demographic dividend prospects, because a large youth cohort with incomplete secondary education is unlikely to generate the productivity gains needed for rapid structural transformation.
The stagnation in vocational pathways is another concern. The share of upper secondary vocational enrolment remains broadly flat at 41.4% for males and 47.3% for females. On one hand, this indicates that Ethiopia already has a sizeable vocational stream at upper secondary level. On the other hand, stagnation suggests that the system is not dynamically expanding or adapting fast enough to the country’s changing labour-market needs. Ethiopia’s TYDP and HGER agenda both emphasise industrialisation, manufacturing, agro-processing, construction, logistics, ICT and private-sector-led growth. These sectors require mid-level technicians, machine operators, construction specialists, electricians, mechanics, logistics workers, digital technicians and applied science graduates. A stagnant TVET share, therefore, raises concerns about whether the education system is sufficiently aligned with the economic transformation agenda.
The tertiary pipeline also remains narrow. Tertiary intake is low and will rise from roughly 24% for both males and females in 2025 to 30.7% for males and 34.4% for females by 2043. Tertiary graduation will improve only modestly, from 10.2% in 2025 to 15.5% by 2043. This implies that Ethiopia will expand higher education access, but not fast enough to create a broad base of advanced skills by 2043. The science and engineering share of tertiary graduates will increase from 9% in 2025 to 14.3% by 2043, which is a positive direction but still limited relative to the country’s industrial and technological ambitions. For a country aiming to expand manufacturing, energy infrastructure, irrigation, transport networks, digital services and climate-resilient development, a science and engineering graduate share of 14.3% remains relatively low.
The policy implication is that Ethiopia’s education challenge has shifted from mass access to system throughput and relevance. The country needs to ensure that children not only enrol in primary school, but also learn, complete, transition and graduate. Strengthening foundational literacy and numeracy is critical because weak learning at the primary level feeds directly into dropout and poor performance at the secondary level. Expanding secondary school availability, reducing the cost of attendance, improving teacher quality, supporting girls’ retention, and strengthening school feeding and social protection in poor areas would help reduce attrition. Conflict-affected and displaced learners also require specific support, including catch-up programmes, flexible learning, psychosocial services and reintegration into formal schooling.
Skills alignment is equally important. Ethiopia’s education and training system must be linked more directly to industrial policy and labour-market demand. TVET should be strengthened through employer partnerships, apprenticeships, competency-based curricula, better equipment, teacher upgrading and stronger pathways into formal employment. Tertiary education should expand science, technology, engineering, mathematics, agriculture, health and applied technical fields, while improving quality and labour-market relevance. The modest increase in science and engineering graduates under the Current Path is encouraging, but insufficient for the scale of transformation envisioned in the TYDP.
Chart 17 presents the mean years of education in the Current Path and in the Education scenario, from 2022 to 2043, for the 15 to 24-year-old age group.
Mean years of education for the 15–24-year-old cohort is a useful forward-looking human capital indicator because it captures the schooling stock of young people entering the labour market. Unlike adult mean years of schooling, which reflects the accumulated education of the whole population and therefore changes slowly, the 15–24 measure shows how quickly the next generation of workers is becoming more educated. It is therefore directly relevant to Ethiopia’s demographic dividend, labour productivity, industrialisation and long-term growth prospects. The United Nations Educational, Scientific and Cultural Organisation (UNESCO) treats mean years of schooling as a measure of accumulated human capital, and focusing on youth makes it especially useful for assessing whether the education system is producing the skills base required for economic transformation.
Under the Current Path, Ethiopia’s mean years of education for 15–24-year-olds will rise from 6 years in 2025 to 8 years by 2043. This indicates steady improvement, but it also means that by 2043, the average young Ethiopian would still have less than full lower-secondary completion. In practical terms, this would constrain the country’s ability to shift into higher-productivity manufacturing, modern services, agro-processing, digital sectors and technology-intensive activities. A young population with fewer than eight average years of schooling can support basic labour-intensive growth, but it is less likely to sustain rapid productivity gains, innovation or competitiveness in more complex sectors.
The Education scenario will produce a stronger outcome. Mean years of education among 15–24-year-olds will rise to roughly 9.3 years by 2043, about 1.3 years higher than the Current Path forecast. This is a meaningful gain because it brings the average young person close to completion of lower secondary education and closer to the skill threshold needed for technical training, formal employment and further education. The difference between 8 and 9.3 years is not merely statistical, but it represents a materially stronger human capital base, with more young people likely to have better literacy, numeracy, problem-solving capacity and readiness for vocational or tertiary pathways.
This matters because Ethiopia’s development strategy depends heavily on the quality of its labour force. The TYDP aims to accelerate structural transformation through industrialisation, private-sector development, digitalisation, agricultural modernisation and export competitiveness. All these objectives require workers with stronger foundational skills and more years of schooling. Similarly, Agenda 2063 and SDG 4 emphasise quality education, skills development and a skills revolution as foundations for inclusive growth. Ethiopia’s Current Path improves the education stock, but the Education scenario is more consistent with the level of human capital required for the country’s transformation ambitions.
The economic payoff from higher schooling can be substantial. Global evidence from the World Bank shows that each additional year of schooling is associated with higher earnings, with returns often particularly strong in low- and middle-income countries and among women. For Ethiopia, an additional 1.3 years of schooling for the youth cohort by 2043 could significantly improve employability, productivity and household income, especially if learning quality improves at the same time. However, schooling quantity alone is not enough. If additional years in school do not translate into literacy, numeracy, digital skills and technical competence, the productivity gains will be limited. This is why mean years of education must be interpreted together with learning outcomes, completion rates and labour-market relevance.
The Education scenario also has direct implications for the demographic dividend. Ethiopia’s working-age population is expanding, but the dividend will only materialise if the growing youth cohort is healthy, educated and productively employed. Higher mean years of education among 15–24-year-olds strengthens the chances that the expanding labour force can move out of low-productivity agriculture and informal work into more productive sectors. Without such improvements, Ethiopia risks a large but under-skilled workforce, high youth underemployment and continued informality. The Education scenario, therefore, supports not only human development but also macroeconomic transformation.
Gender is an important part of this story. Ethiopia’s education policies have increasingly emphasised girls’ education, retention and transition, reflecting the strong links between female education, lower fertility, child health, labour-force participation and household welfare. Raising mean years of education among young women is especially important because it improves individual earnings potential while also accelerating broader demographic and social gains. Policies that reduce early marriage, improve school safety, expand menstrual hygiene facilities, provide financial support to poor households and improve secondary-school access in rural areas will be essential to sustaining gains in the Education scenario.
The main constraints to achieving the Education scenario are the same bottlenecks visible in the education funnel: dropout before completion, weak learning outcomes, secondary-school access gaps, conflict-related disruption, poverty, and limited technical and vocational pathways. Ethiopia has expanded primary schooling considerably, but the next phase of reform must focus on retention, quality and progression. Strengthening foundational learning in early grades, improving teacher quality, expanding lower and upper secondary schools, supporting disadvantaged learners, and linking education to TVET and labour-market needs will determine whether the country can move closer to the Education scenario.
Chart 18 presents the value-added by sector as a share of GDP in the Current Path, for 2025 and 2043.
In the Manufacturing scenario, reasonable but ambitious growth in manufacturing is envisaged through increased investment in the sector, research and development (R&D), and improved government regulation of businesses. This aims to enhance total factor productivity and labour absorption.
Visit the theme on Manufacturing for our conceptualisation and details on the scenario structure and interventions.
Ethiopia’s sectoral structure between 2025 and 2043 points to a gradual but meaningful process of structural transformation. Under the Current Path, agriculture’s share of GDP will fall sharply from 29.9% in 2025 to 9.7% by 2043, while the energy sector will decline from 7.4% to 2.9%. At the same time, the share of services will rise from roughly 47.9% to 63.4%, manufacturing will double from 5.7% to 11.4%, ICT will increase from 5.5% to 7.6%, and materials will rise from 3.6% to 5.1%. By 2042, manufacturing will surpass agriculture to become the second-largest contributor to GDP. This shift is consistent with Ethiopia’s national ambition (TYDP) to move away from a low-productivity agrarian structure toward a more diversified economy based on industry, services, digitalisation and higher productivity.
The decline in agriculture’s GDP share does not necessarily mean that agriculture is contracting in absolute terms. Rather, it reflects faster growth in other sectors, especially services and manufacturing. This is a normal feature of structural transformation: as productivity rises and economies urbanise, agriculture’s relative contribution to GDP tends to fall, even while agricultural output can continue increasing. For Ethiopia, this shift is particularly important because agriculture still employs a large share of the labour force and remains central to food security, rural incomes and poverty reduction. The policy challenge is therefore to ensure that agriculture’s declining GDP share is accompanied by rising agricultural productivity, stronger agro-processing and more rural non-farm employment, rather than simply reflecting labour moving into low-productivity informal services.
The services sector will remain the dominant part of the economy throughout the forecast period. This reflects the expansion of trade, transport, finance, public administration, education, health, tourism, logistics and other urban services as Ethiopia’s economy becomes larger and more urbanised. Services growth can support productivity if it is linked to logistics, finance, ICT, professional services and trade facilitation. However, if services expansion is dominated by informal retail, low-productivity personal services and public administration, its contribution to structural transformation will be weaker. This distinction matters because Ethiopia’s development strategy does not simply aim for a bigger services sector; it aims for a more productive, private-sector-led economy with stronger links between agriculture, manufacturing and exports.
Manufacturing is the most important sectoral signal in Chart 18. The Current Path shows meaningful improvement, but it will remain modest relative to Ethiopia’s industrialisation ambitions. Ethiopia has long identified manufacturing as a central pillar of transformation. The Growth and Transformation Plans, the Industrial Development Strategy, the industrial parks programme, and the HGER agenda all emphasise manufacturing as a vehicle for export growth, employment creation, technology transfer and productivity upgrading. Priority subsectors have included textiles and garments, leather and leather products, agro-processing, pharmaceuticals, cement, metal and engineering products, and other light manufacturing activities.
The policy logic behind Ethiopia’s manufacturing strategy has been to use relatively low labour costs, public infrastructure investment, industrial parks, energy generation and preferential market access to attract investment and expand exports. Industrial parks such as Hawassa, Bole Lemi, Kombolcha, Mekelle, Dire Dawa and others were designed to provide serviced land, power, customs facilitation and cluster benefits for investors. The government also sought to use manufacturing to absorb labour from agriculture and to create a more export-oriented growth model. However, the results have been mixed. Manufacturing has grown, but not at the speed required to transform the economy. Export performance has remained below expectations, many firms face foreign exchange shortages and logistics constraints, and some industrial parks have struggled with low capacity utilisation, weak domestic linkages and vulnerability to political instability and external shocks. This explains why the Current Path shows manufacturing rising, but not reaching the level implied by Ethiopia’s most ambitious policy targets.
ICT’s forecasted rise from 5.5% to 7.6% of GDP is also important. Ethiopia’s digital sector has been shaped by telecom liberalisation, the entry of private operators, and the expansion of mobile and broadband services, digital ID development, mobile money, e-government and wider digital-economy reforms. ICT can raise productivity across all sectors by reducing transaction costs, improving market access, strengthening digital payments, supporting logistics and expanding access to information. For manufacturing, ICT is particularly relevant for customs systems, supply-chain management, e-commerce, quality control and industrial upgrading. However, the relatively modest rise in ICT’s GDP share suggests that digital transformation under the Current Path remains gradual rather than disruptive.
The materials sector will increase from 3.6% to 5.1% of GDP, reflecting potential growth in construction materials, mining, minerals and related value chains. Ethiopia has opportunities in gold, potash, cement, industrial minerals and construction-linked materials, but the sector remains underdeveloped relative to potential. If better managed, materials could support manufacturing through domestic inputs and construction supply chains. However, resource-sector growth must be governed carefully to avoid environmental degradation, weak local linkages and enclave-style extraction.
The decline in energy’s share does not necessarily imply that the energy sector becomes less important. Rather, other sectors grow faster in value-added terms. Energy remains a critical enabler of Ethiopia’s transformation strategy. Hydropower, including the GERD, electricity exports, grid expansion and renewable energy investment, are central to industrialisation and regional integration. Low-cost and reliable power is one of Ethiopia’s potential competitive advantages, but only if generation is matched by transmission, distribution reliability, industrial connections and financially sustainable utilities.
The key policy message is that Ethiopia’s structural transformation is underway but incomplete. By 2043, manufacturing will become more important, but not dominant; services expand strongly, but their productivity content will determine their development impact; agriculture becomes smaller in GDP terms, but remains central to employment, food security and poverty reduction. Ethiopia’s challenge is to ensure that this sectoral shift produces better jobs, stronger exports and higher productivity rather than simply a movement from rural underemployment to urban informality.
Chart 19 presents the contribution of the manufacturing sector to GDP in the Current Path and in the Manufacturing scenario, from 2022 to 2043. The data is in US$ and % of GDP.
Manufacturing scenario will strengthen Ethiopia’s industrial base, but its impact is best understood as an economy-wide productivity effect rather than a narrow outcome of shift toward manufacturing alone. By 2043, manufacturing will record the largest gain in GDP share relative to the Current Path, increasing by 0.24 percentage points, followed by services at 0.19 percentage points, ICT at 0.08 percentage points and materials at 0.04 percentage points. Agriculture and energy will record lower GDP shares than in the Current Path, by 0.49 and 0.06 percentage points, respectively. This does not mean that these sectors will contract; rather, it means that manufacturing-linked sectors will grow faster and take up a larger share of total output.
The more important message is that the Manufacturing scenario will expand the absolute size of every sector by 2043. Services will record the largest absolute gain, adding US$21.3 billion above the Current Path forecast. Manufacturing will follow with an additional US$5 billion, while ICT will gain US$2.9 billion, materials US$1.8 billion, energy US$0.6 billion and agriculture US$0.2 billion. This pattern highlights a key feature of modern industrialisation that manufacturing does not grow in isolation. As factories expand, they increase demand for logistics, finance, transport, telecommunications, construction inputs, energy, maintenance, packaging, business services and trade facilitation. The large gain in services, therefore, reflects manufacturing’s multiplier effects across the wider economy.
This is particularly important for Ethiopia because the country’s industrial policy has long aimed to use manufacturing as a bridge between agriculture, services and exports. The Manufacturing scenario suggests that stronger industrial performance would not only raise manufacturing output directly, but also deepen linkages with services and ICT. For example, export-oriented manufacturing requires customs systems, port logistics, digital payments, warehousing, standards certification, insurance and working-capital finance. Similarly, agro-processing depends on cold chains, rural transport, quality control, packaging and market information systems. The scenario’s positive impact on ICT and materials is therefore consistent with a more integrated production structure.
The relatively small increase in manufacturing’s GDP share, despite a sizeable absolute gain, is also important. A gain of 0.24 percentage points above the Current Path by 2043 suggests that the Manufacturing scenario improves industrial performance, but does not radically transform Ethiopia’s sectoral composition on its own. This reflects the scale of Ethiopia’s economy by 2043 and the fact that services continue to expand strongly. It also suggests that manufacturing-led transformation will require complementary reforms beyond sector-specific industrial policy. These include macroeconomic stability, reliable foreign exchange access, logistics reform, energy reliability, skills development, finance for firms, export promotion and stronger domestic supplier networks.
The decline in agriculture’s GDP share relative to the Current Path should be interpreted as part of the structural transformation process. Agriculture still grows in absolute terms under the scenario, but other sectors grow faster. This is desirable if agricultural productivity rises and workers gradually move into higher-productivity activities. However, the transition becomes problematic if labour leaves agriculture for low-productivity informal services rather than formal manufacturing and related sectors. The policy goal should therefore be to strengthen agro-processing and rural–urban value chains so that manufacturing expansion supports, rather than bypasses, agricultural transformation.
The Manufacturing scenario aligns closely with Ethiopia’s TYDP, which identifies manufacturing as a core driver of structural transformation, export growth and employment creation. However, the scenario shows that Ethiopia should treat manufacturing as an ecosystem rather than a standalone sector. Industrial parks and factory investments are necessary, but not sufficient. The country needs stronger supplier development programmes, better links between domestic firms and foreign investors, improved TVET and engineering skills, affordable industrial finance, reliable electricity, digital trade facilitation and efficient logistics along export corridors. AfCFTA also matters here: if Ethiopia improves competitiveness, continental market integration can expand demand for manufactured goods and help firms scale beyond the domestic market.
Chart 20 depicts exports and imports as a percentage of GDP, from 2000 to 2043, in the Current Path and in the AfCFTA scenario.
The AfCFTA scenario represents the impact of fully implementing the agreement establishing the African Continental Free Trade Area by 2034. The scenario increases exports in manufacturing, agriculture, services, ICT, materials and energy exports. It also includes improved multifactor productivity growth from trade and reduced tariffs for all sectors.
Visit the theme on AfCFTA for our conceptualisation and details on the scenario structure and interventions.
Ethiopia has historically traded well below its potential relative to the size of its economy, and its export base remains narrow, but the Current Path suggests a gradual improvement in trade openness and a shift from a persistent trade deficit toward a modest surplus by 2043. This matters for the AfCFTA analysis because Ethiopia’s ability to benefit from continental free trade will depend less on formal ratification alone and more on whether it can expand export capacity, diversify products, reduce logistics costs and connect producers to regional value chains.
Ethiopia formally ratified the AfCFTA agreement on 10 April 2019, signalling its commitment to continental market integration. The country officially began its first duty-free exports under the AfCFTA framework on 9 October 2025, sending coffee, pulses, meat and vegetables to Kenya, Somalia and South Africa by land and air. This is an important milestone because it shows a shift from legal commitment to operational participation. However, the scale and composition of Ethiopia’s trade still show that the country is not yet structurally positioned as a major intra-African exporter.
Ethiopia’s current trade remains heavily oriented toward extra-African partners. Major export destinations include China, the United States, Saudi Arabia, Germany and the Netherlands. Major import sources include China, France, India, the United States and the United Kingdom. Its leading exports include coffee, cut flowers, oilseeds, dried legumes and electricity, while major imports include aircraft, gas turbines, computers, packaged medicaments and refined petroleum. This pattern reflects Ethiopia’s current production structure, whereby the country exports mainly primary and semi-primary goods, while importing capital goods, fuel, machinery, pharmaceuticals and technology-intensive products.
This trade structure highlights the central challenge for AfCFTA implementation. Ethiopia has agricultural and energy export potential, but its current export basket is still concentrated in relatively low-complexity products. Coffee, pulses, oilseeds, flowers and livestock-related products are important sources of foreign exchange, but they are not sufficient to drive large-scale structural transformation unless Ethiopia increases processing, branding, logistics reliability and regional market penetration. AfCFTA therefore creates an opportunity, but not an automatic gain. To benefit fully, Ethiopia must move from exporting raw or lightly processed goods toward higher-value agro-processing, light manufacturing, pharmaceuticals, textiles, leather products, electricity trade and tradable services.
The decline in trade openness between 2011 and 2022 is a key signal of the country’s external-sector weakness. Total trade as a share of GDP fell sharply from 48.2% in 2011 to 22.2% in 2022. This decline occurred because trade grew much more slowly than GDP. Imports increased only modestly, from US$15.1 billion to US$17.8 billion, while exports fell from US$8 billion to US$7.7 billion. In other words, Ethiopia’s economy expanded, but its integration into international markets weakened. This is consistent with concerns raised in Ethiopia’s own development planning documents (TYDP): past growth was strong but not sufficiently export-led, and the economy struggled to generate the foreign exchange needed to support investment, industrialisation and imports of capital goods.
The Current Path indicates some recovery in trade integration. Trade openness will increase to 39.9% of GDP by 2043, suggesting that exports and imports will regain importance relative to the economy. More importantly, exports are forecasted to grow faster than imports after 2022. Exports will reach US$112.8 billion by 2043, while imports will reach US$108 billion. This implies a shift from a trade deficit of US$10.2 billion, equivalent to 8.8% of GDP in 2022, to a trade surplus of US$4.7 billion, or 0.9% of GDP, by 2043. If realised, this would mark a major improvement in Ethiopia’s external position.
The forecasted shift toward surplus is important because Ethiopia’s development model has long been constrained by foreign exchange shortages. A persistent trade deficit limits the country’s ability to import machinery, fuel, fertiliser, medicine and intermediate inputs. It also weakens macroeconomic stability and increases reliance on borrowing, aid, remittances and foreign direct investment. A stronger export performance would therefore support not only the trade balance, but also industrialisation, debt sustainability and macroeconomic resilience. This is why trade reform is not a separate agenda from the TYDP; it is central to the plan’s goals of structural transformation and private-sector-led growth.
AfCFTA can support this transition in several ways. First, it can expand Ethiopia’s market access beyond its domestic population and traditional extra-African partners. Second, it can reduce tariff and non-tariff barriers on regional exports, especially for agro-processed goods, manufactured products and services. Third, it can encourage regional value chains, for example, in food processing, textiles and apparel, leather, pharmaceuticals, energy and logistics. Fourth, it can improve incentives for firms to scale production because the accessible market becomes continental rather than national. However, these gains depend on domestic readiness. Ethiopia must improve standards certification, customs efficiency, transport corridors, trade finance, export logistics and regulatory predictability.
Transport and corridor policy will be decisive. As a landlocked country, Ethiopia’s export competitiveness depends heavily on logistics costs, customs procedures and access to ports. The Addis Ababa–Djibouti corridor remains the main maritime route, but diversification through Kenya, Somalia, Sudan and Somaliland-linked corridors could improve resilience and bargaining power. AfCFTA gains will be limited if Ethiopian firms face high inland transport costs, delays at borders, limited cold-chain capacity and weak cargo consolidation systems. Trade facilitation is therefore as important as tariff reduction.
Chart 21 presents the trade balance in the Current Path and in the AfCFTA scenario, from 2022 to 2043, as a percentage of GDP.
Under the Current Path scenario, Ethiopia is forecasted to transition from a significant trade deficit around 2041 to a trade surplus of 0.9% of GDP by 2043. The AfCFTA scenario will enhance this outcome even further, leading to a trade surplus of approximately 3% of GDP, which is approximately US$17.4 billion, by 2043. This represents an increase of 2.1 percentage points of GDP compared to the Current Path forecast and a rise of about US$12.67 billion in absolute terms.
The main driver is export expansion. Under the AfCFTA scenario, Ethiopia’s exports will reach US$144.6 billion by 2043, which is US$31.8 billion above the Current Path. Imports will reach US$127.1 billion, which is US$19.1 billion above the Current Path. Imports increase because a more open and faster-growing economy requires more intermediate inputs, capital goods, fuel, technology, pharmaceuticals and consumption goods.
The increase in trade openness is also significant. Under the AfCFTA scenario, Ethiopia’s total trade will rise to 46.2% of GDP by 2043, almost returning to the level observed in 2011 and standing about 6.3 percentage points above the Current Path. This suggests that AfCFTA helps reverse the long decline in trade openness that characterised the 2011–2022 period, when Ethiopia’s economy grew faster than its trade sector and export performance weakened. A recovery in trade openness is not automatically positive if it reflects import dependence alone, but in this scenario, it is beneficial because it is driven by stronger export performance and a healthier trade balance.
The AfCFTA scenario, therefore, directly addresses one of Ethiopia’s most persistent macroeconomic constraints, which is foreign exchange scarcity. Ethiopia’s past development model depended heavily on imported capital goods, fuel, fertiliser and industrial inputs, while exports remained narrow and insufficient. This created recurring foreign exchange shortages, constrained manufacturing firms, delayed imports of essential inputs and contributed to macroeconomic instability. A trade surplus of 3% of GDP by 2043 would help ease these pressures by increasing foreign exchange earnings and reducing the need to finance imports through borrowing, aid or reserve depletion.
The main policy message is that AfCFTA can help Ethiopia move from a structurally import-constrained economy toward a more export-capable and regionally integrated one, but only if the country strengthens productive capacity, logistics, standards, trade finance and manufacturing competitiveness.
Chart 22 presents the Current Path of access to electricity for urban, rural and the total population from 2000 to 2043.
The Large Infrastructure and Leapfrogging scenario involves ambitious investments in road and renewable energy infrastructure, improved electricity access and accelerated broadband connectivity. It emphasises adopting modern technologies to enhance government efficiency and incorporates significant investments in major infrastructure projects like rail, ports, and airports (other infra) while highlighting the positive impacts of renewables and ICT.
Visit the themes on Large Infrastructure and Leapfrogging for our conceptualisation and details on the scenario structure and interventions.
Ethiopia has made substantial progress in expanding electricity access since 2000, but access remains spatially uneven and rural electrification is still the central challenge. Total electricity access increased from 12.7% in 2000 to 59.6% in 2025, reflecting major investment in generation, transmission and distribution infrastructure. However, this improvement has been driven primarily by urban electrification, which rose from 76.2% to 97.2% over the same period. Rural access increased much faster in relative terms, from only 1.7% in 2000 to 48% in 2025. The Current Path forecast a rise in total access to 88.6% by 2043, with urban areas reaching universal access by 2028, while rural access will reach 82.9% by 2043.
This trajectory reflects Ethiopia’s long-standing emphasis on expanding electricity as a foundation for growth, service delivery and poverty reduction. Successive development plans, including the Growth and Transformation Plans and the TYDP, place energy infrastructure at the centre of national transformation. Ethiopia invested heavily in hydropower generation, grid expansion and regional power interconnection, with major projects such as the GERD intended to strengthen domestic supply and support electricity exports. The National Electrification Program (NEP) is especially important because it explicitly combines grid and off-grid solutions to achieve universal access, recognising that grid extension alone is too slow and costly for dispersed rural settlements.
The increase in rural access to 48% in 2025 reflects several factors. First, grid expansion has reached more towns, market centres and rural growth nodes. Second, off-grid and mini-grid solutions have become more important, particularly for remote communities where connection to the national grid is expensive. Third, donor-supported programmes and public investment have supported distribution expansion, last-mile connections and renewable energy systems. Fourth, falling costs of solar technologies have improved the viability of decentralised electrification. These factors explain why rural access has improved, but the gap with urban areas remains large.
The Current Path suggests that rural electrification will continue improving, reaching 82.9% by 2043. This would be a major development gain, but it still leaves about one-fifth of the rural population without electricity access. The remaining access gap is likely to be the hardest and most expensive to close because it will be concentrated in remote, low-density, pastoralist, conflict-affected and infrastructure-poor areas. These communities often face high connection costs, weak road access, low household purchasing power and limited commercial viability for private providers. As Ethiopia approaches higher access levels, the policy challenge will shift from expanding access in easier-to-reach areas to reaching the last-mile population.
Electricity access has strong development implications. In rural areas, electricity can improve education through lighting and digital access, strengthen health facilities through refrigeration and medical equipment, support irrigation and agro-processing, reduce reliance on biomass, and create opportunities for small enterprises. It is also critical for Ethiopia’s broader structural transformation agenda. Manufacturing, ICT, cold chains, mechanised agriculture, water pumping and service-sector expansion all depend on reliable and affordable power. For this reason, electrification should not be assessed only as a household access indicator; it is also an enabling condition for productivity growth and territorial inclusion.
However, access is only one part of the electricity challenge. Reliability, affordability and quality of supply matter just as much. A household or firm connected to the grid may still face frequent outages, low voltage, high connection costs or unaffordable tariffs. For manufacturing and agro-processing, unreliable power raises production costs and reduces competitiveness. For rural households, connection without affordability may limit actual use. Ethiopia’s energy policy must therefore move beyond connection numbers to focus on service quality, utility performance, cost recovery, targeted subsidies and productive use of electricity.
The forecasted achievement of universal urban access by 2028 is plausible given already high urban coverage, but urban electricity demand will continue rising with population growth, industrial activity and digitalisation. This will require investment in distribution networks, grid reliability and urban energy planning. Rural electrification, by contrast, requires a mixed model: grid extension where economically viable, mini-grids for clustered settlements, and stand-alone solar systems for dispersed households. Productive-use planning should be built into rural electrification so that electricity supports income generation, not only household lighting.
The policy framework is broadly aligned with Ethiopia’s development goals. The NEP targets universal access through grid and off-grid pathways. The TYDP links energy expansion to industrialisation, agricultural transformation, social service delivery and export potential. The Climate-Resilient Green Economy (CRGE) strategy supports renewable energy and low-carbon development, while SDG 7 calls for affordable, reliable, sustainable and modern energy for all. Agenda 2063 also emphasises modern infrastructure and inclusive growth. The challenge is therefore not policy intent, but implementation capacity, financing, utility sustainability and conflict-sensitive delivery.
The strongest policy priority is to accelerate rural electrification while ensuring that access translates into development outcomes. This requires scaling mini-grids and solar home systems, reducing connection costs for poor households, strengthening rural distribution networks, improving the financial position of the electricity utility, and linking electrification to agriculture, small enterprises, health facilities and schools. In fragile and remote areas, electrification should be coordinated with roads, water services, digital infrastructure and local economic development. Otherwise, access gains may remain shallow and fail to generate productivity improvements.
Chart 23 presents the number of people using cookstoves in the Current Path and in the Large Infrastructure and Leapfrogging scenario, from 2022 to 2043.
Ethiopia will make major progress in clean cooking by 2043 under the Large Infrastructure and Leapfrogging scenario, but traditional biomass use will remain a significant challenge. Modern fuel cookstove adoption will rise from only 2.2% of households in 2022, equivalent to about 0.5 million people, to approximately 72.4% by 2043, or 30.9 million people, under the Large Infrastructure and Leapfrogging scenario. This is about 11 percentage points higher than the Current Path forecast of roughly 61.3%, equivalent to 26.2 million people. In absolute terms, the scenario will bring around 4.7 million additional people onto modern fuel cookstoves by 2043 compared with the Current Path.
This improvement is significant because Ethiopia’s clean cooking challenge is one of the largest energy-access and public-health issues in the country. In 2022, traditional cookstove use still accounted for 95.1% of households, or about 21.5 million people, while improved cookstoves accounted for only 2.7%, or roughly 0.62 million people. Under the Large Infrastructure and Leapfrogging scenario, traditional cookstove use will fall sharply to 26.9% by 2043, equivalent to 11.5 million people, compared with 37.6%, or 16.1 million people, under the Current Path. Improved cookstove use will also decline to 0.8% under the scenario, compared with 1.1% under the Current Path, because households increasingly shift directly from traditional biomass to modern fuels rather than remaining in intermediate technologies.
Traditional biomass cooking is closely associated with household air pollution, respiratory infections, chronic respiratory disease, eye disease, burns, and time poverty, especially for women and girls who often bear the burden of fuelwood collection and cooking. It also contributes to local deforestation, land degradation and pressure on biomass resources. In the earlier mortality analysis (Chart 11), respiratory infections remained Ethiopia’s leading cause of death under the Current Path. Clean cooking is therefore not only an energy issue; it is also a health, gender, climate and productivity intervention.
The Large Infrastructure and Leapfrogging scenario will improve cookstove outcomes because it assumes faster expansion of modern energy systems, stronger infrastructure delivery and wider adoption of technologies that reduce dependence on traditional biomass. This aligns with Ethiopia’s broader energy-access agenda, including the NEP, the TYDP, and the CRGE strategy, all of which emphasise modern energy, renewable power and inclusive infrastructure. It is also consistent with SDG 7, which calls for access to affordable, reliable, sustainable and modern energy for all, and with Agenda 2063’s emphasis on improved living standards and environmentally sustainable development.
However, the clean cooking transition will not be automatic. Even under the Large Infrastructure and Leapfrogging scenario, 11.5 million people will still rely on traditional cookstoves by 2043. This remaining burden is likely to be concentrated in rural, poorer, remote and pastoralist communities where modern fuels are expensive, electricity access is unreliable, supply chains are weak, and household incomes are low. For these households, the main barriers are not only technology availability, but affordability, fuel distribution, cultural cooking preferences, appliance durability, maintenance, and the reliability of electricity or LPG supply.
The decline of improved cookstoves also requires careful interpretation. Improved biomass cookstoves can reduce fuel use and emissions compared with traditional stoves, but they do not deliver the same health and climate benefits as genuinely clean fuels such as electricity, LPG, biogas or ethanol. The forecasted decline in improved cookstove use suggests that the model assumes leapfrogging toward modern fuels rather than gradual movement through improved biomass technologies. This is desirable where electricity and clean fuels are affordable and reliable. But in areas where modern fuels are unlikely to reach quickly, improved cookstoves may still play an important transitional role in reducing fuel demand and exposure to smoke.
Ethiopia’s clean cooking agenda must therefore be differentiated by geography and income. Urban and peri-urban households may transition faster through electricity, LPG, ethanol or other modern fuels if distribution systems and affordability improve. Rural households may require a mixed approach, including electric cooking where grid or mini-grid reliability is strong, biogas in livestock-rich areas, improved biomass stoves as an interim measure, and targeted subsidies for poor households. Clean cooking should also be linked to rural electrification, forest restoration, women’s economic empowerment, and health-sector prevention strategies.
The fiscal and institutional challenge is also significant. Clean cooking requires coordinated action across energy, health, environment, gender, finance and local government institutions. It also requires private-sector participation in appliance distribution, after-sales service, fuel supply chains and consumer finance. Without affordable financing models, poorer households may remain locked into traditional biomass even when modern technologies are technically available. Pay-as-you-go systems, results-based financing, targeted subsidies and carbon finance could help close this affordability gap.
Chart 24 presents the percentage of the population and number of people with access to mobile and fixed broadband in the Current Path and in the Large Infrastructure and Leapfrogging scenario, from 2022 to 2043. The user can toggle between mobile and fixed broadband.
Ethiopia’s digital-access challenge is shifting from basic mobile connectivity toward fixed broadband depth, quality and affordability. Under the Large Infrastructure and Leapfrogging scenario, fixed broadband subscriptions will increase from only one subscription per 100 people in 2022 to 18.7 subscriptions per 100 people by 2043. This is 3.2 subscriptions per 100 people higher than the Current Path forecast of 15.5 subscriptions per 100 people. The improvement is meaningful, but it also shows that fixed broadband remains Ethiopia’s weaker digital-infrastructure frontier. Even by 2043, fixed broadband penetration will remain far below mobile broadband penetration, suggesting that households, firms, schools, hospitals and public institutions will continue to rely heavily on mobile networks unless fibre, last-mile infrastructure and affordability improve substantially.
The contrast, mobile broadband subscriptions show almost no difference between the Large Infrastructure and Leapfrogging scenario and the Current Path by 2043. Subscriptions will reach approximately 142.30 per 100 people under the scenario, close to the estimated demand of 142 per 100 people under the Current Path. This indicates that the mobile market is approaching saturation in subscription terms. The main policy issue for mobile broadband is therefore no longer only expanding the number of subscriptions, but improving network quality, affordability, coverage depth, data speeds, reliability and meaningful use. High subscription numbers can coexist with poor service quality, multiple SIM ownership, limited rural coverage, high data costs and low digital skills.
Ethiopia’s telecom sector has changed significantly in recent years. For a long period, the sector was dominated by the state-owned Ethio Telecom, which limited competition and slowed innovation relative to more liberalised African markets. The government’s telecom liberalisation agenda, including the entry of Safaricom Ethiopia and reforms under the HGER agenda, has begun to change this structure. These reforms are central to Ethiopia’s digital transformation because competition can improve service quality, reduce prices, expand investment and accelerate mobile money, digital payments and digital services. However, the benefits depend on regulatory consistency, infrastructure sharing, spectrum policy, rural coverage obligations and continued investment in backbone networks.
Fixed broadband expansion is particularly important for structural transformation. Mobile broadband is sufficient for basic connectivity, communication and many digital financial services, but fixed broadband is more important for high-capacity uses, including firms, industrial parks, business-process outsourcing, universities, hospitals, research institutions, e-government systems, cloud services, digital trade, and technology-enabled services. Ethiopia’s ambition to expand manufacturing, ICT, logistics, financial services and digital public administration will require more reliable high-speed broadband than mobile networks alone can provide. In this sense, the increase to 18.7 fixed broadband subscriptions per 100 people under the Large Infrastructure and Leapfrogging scenario is significant, but still modest relative to the country’s long-term digital-economy ambitions.
The fixed broadband gain under the Large Infrastructure and Leapfrogging scenario reflects the expected effects of stronger infrastructure investment and technology adoption. Expanding fibre backbone networks, improving metropolitan fibre, connecting schools and health facilities, supporting data centres, strengthening international bandwidth links and promoting last-mile access are all necessary to deepen broadband penetration. Ethiopia’s digital 2025 and 2030 strategies already recognise digital transformation as a national development priority, with emphasis on digital infrastructure, digital government, digital economy, digital skills and enabling systems. The Large Infrastructure and Leapfrogging scenario is therefore consistent with national policy, but the forecast suggests that implementation must accelerate if Ethiopia is to close the gap with more digitally advanced African economies.
The urban–rural divide will remain a central issue. Fixed broadband access is likely to be concentrated in Addis Ababa and larger cities unless policy deliberately supports secondary towns, industrial corridors and public institutions outside the capital. Rural areas may depend more heavily on mobile broadband, wireless broadband, satellite connectivity and community networks. This matters for inclusion because digital access increasingly affects education, health, finance, market information, agricultural extension, job search and public-service delivery. If digital infrastructure remains spatially concentrated, it could reinforce existing regional and urban–rural inequalities.
Affordability is another key constraint. Broadband access is not meaningful if devices, data and subscriptions are too expensive for households and small firms. Ethiopia’s low per capita income means that even when networks are available, usage may remain limited by cost. Policy should therefore focus on reducing wholesale and retail data costs, encouraging competition, lowering device costs, expanding public Wi-Fi and connecting schools, libraries, health centres and local government offices. Digital inclusion also requires skills: people need the ability to use digital services productively, not only to be covered by a network.
In sum, for mobile broadband, Ethiopia should shift from subscription expansion to service quality, affordability, rural coverage and productive use. For fixed broadband, the priority is deeper infrastructure investment, fibre expansion, last-mile connectivity, public-institution connections and business uptake. Telecom liberalisation and private investment should be complemented by strong regulation, infrastructure sharing, cybersecurity, consumer protection and universal service mechanisms. Digital infrastructure should also be linked to Ethiopia’s broader transformation agenda: industrial parks, logistics corridors, schools, hospitals, agricultural markets and public administration should be priority connection points.
Chart 25 presents the trends in FDI, aid and remittances in the Current Path and in the Financial Flows scenario as a percentage of GDP, from 1990 to 2043.
The Financial Flows scenario represents a reasonable but ambitious increase in inward flows of worker remittances, aid to poor countries and an increase in the stock of foreign direct investment (FDI) and additional portfolio investment inflows. We reduce outward financial flows to emulate a reduction in illicit financial outflows.
Visit the theme on Financial Flows for our conceptualisation and details on the scenario structure and interventions.
Aid, remittances and FDI all provide foreign exchange, but they play different roles. Aid supports social sectors, humanitarian needs and rural development; remittances support household consumption and resilience; FDI can bring capital, technology, management skills, export links and jobs. Under the Financial Flows scenario, Ethiopia receives more of all three than under the Current Path, but the strongest development impact will come from shifting the composition of flows away from dependency-oriented finance toward investment, productivity and export-generating finance.
Aid remains important, even as Ethiopia’s relative aid dependency declines. Net aid receipts will increase from US$5.6 billion in 2025 to US$6.8 billion by 2043 under the Financial Flows scenario, about US$1.8 billion above the Current Path forecast of US$5 billion. However, because Ethiopia’s economy grows faster than aid, net aid as a share of GDP will fall from 3.9% in 2025 to 1.2% by 2043, compared with a faster decline to 0.9% under the Current Path. This points to a healthier long-term trajectory whereby Ethiopia still receives more aid in absolute terms, but the economy becomes less dependent on aid relative to GDP.
This matters because Ethiopia still has major financing needs in health, food security, rural livelihoods, education, climate adaptation, humanitarian response and conflict-affected regions. Recent aid cuts by Development Assistance Committee members and associates have placed additional pressure on African countries with large development and humanitarian needs, and Ethiopia is among the countries most exposed because of its population size, displacement burden, food insecurity risks and health-sector needs. The policy implication is not that Ethiopia should remain aid-dependent, but that it should renegotiate and strengthen its development partnerships around priority sectors where aid has high social returns, for instance, primary healthcare, nutrition, vaccines, WaSH, rural income-generating agriculture, climate resilience and recovery in conflict-affected areas.
Remittances are another important but underdeveloped source of foreign exchange. Net remittances increased from about US$5 million in 1990, equivalent to 0.04% of GDP, to a peak of about US$2 billion in 2014, or 3.23% of GDP, before falling sharply to around US$392 million in 2017, or 0.48% of GDP. They recovered only slightly to US$428 million in 2025, equivalent to 0.31% of GDP. Under the Current Path, remittances will rise to US$880 million by 2043, but decline further in relative terms to 0.18% of GDP. Under the Financial Flows scenario, they will reach US$1.9 billion, or 0.35% of GDP, by 2043.
The Financial Flows scenario indicates that remittances to Ethiopia are forecasted to return to their 2014 peak in absolute terms. However, this also suggests that Ethiopia has significant unrealised potential for diaspora financing. Despite having a large diaspora, the country faces several challenges that limit remittance mobilisation. These include exchange-rate distortions, reliance on informal transfer channels, political mistrust, high transaction costs, low levels of financial inclusion, and a lack of investment options for the diaspora.
To unlock this potential, policies should focus on building trust and improving the financial landscape. Strategies could include reducing transfer costs, expanding digital remittance options, strengthening mobile money systems, offering credible diaspora bonds, and providing appealing savings and investment products. Confidence in the system must increase, as the diaspora is more likely to use formal channels when exchange-rate policies, financial regulations, and political relations are stable and predictable. By doing so, remittances could transition from merely supporting households to becoming a vital source of development finance.
FDI is the most strategically important flow in Chart 25 because of its potential to raise productivity and exports, but Ethiopia’s record has been uneven. Historically, FDI inflows were very low, contributing less than 0.1% of GDP until the mid-1990s. They reached about US$42 million in 1996, or 0.25% of GDP, and rose to US$1.2 billion in 2004, equivalent to 5.4% of GDP. A stronger upward phase occurred between 2012 and 2016, when inflows increased from US$335 million to US$4.3 billion, rising from 0.64% to 5.58% of GDP. This period coincided with Ethiopia’s state-led infrastructure push, industrial parks strategy, manufacturing drive and investor interest in low-cost labour, energy and access to export markets. FDI later fell to US$3.2 billion in 2022, or 2.78% of GDP, before rising again to US$5.1 billion in 2025, or 3.91% of GDP.
The Current Path forecast FDI inflows rising to US$19.9 billion by 2043, although their share of GDP declines slightly to 3.59%. Under the Financial Flows scenario, FDI will reach US$24.6 billion, or 4.33% of GDP, by 2043. This is a stronger outcome and is more consistent with the TYDP’s aim to position Ethiopia as a regional and continental economic hub, supported by a diversified, competitive and private-sector-led economy. However, even this scenario assumes that Ethiopia can overcome the structural reasons why FDI has historically remained below potential.
Ethiopia’s historically low and volatile FDI performance reflects a combination of structural, policy and risk-related constraints. For many years, the state dominated key sectors such as telecommunications, finance, logistics, energy and transport, limiting the range of attractive opportunities for foreign investors. Chronic foreign exchange shortages made it difficult for firms to import inputs, repatriate profits and operate at full capacity, while macroeconomic instability, high inflation, exchange-rate misalignment, debt distress and the 2023 sovereign default weakened investor confidence. Political instability, conflict and insecurity further raised risk perceptions, while Ethiopia’s landlocked geography and high logistics costs reduced export competitiveness. At the firm level, weak domestic supplier networks, limited access to finance, skills gaps and low technology adoption constrained local linkages and reduced the developmental impact of FDI. These challenges were compounded by regulatory uncertainty, licensing delays, customs bottlenecks, uneven policy implementation and restrictions in selected sectors, making Ethiopia’s large market and industrial potential less attractive than it might otherwise be.
The overall policy message is that Ethiopia cannot rely on one flow alone. It needs strategic aid diplomacy, diaspora-finance mobilisation and deep investment-climate reform. The biggest opportunity lies in FDI, but unlocking it requires addressing the structural constraints that have historically held investors back: foreign exchange shortages, restricted sectors, political risk, logistics costs, weak domestic linkages and regulatory uncertainty. Additionally, aid, remittances and FDI need to be managed as complementary flows to domestic resource mobilisation.
Chart 26 presents government revenue in the Current Path and in the Financial Flows scenario, from 2020 to 2043. The data is in US$ 2021 and % of GDP.
Under the Current Path, government revenue will rise from US$13 billion in 2025 to US$68.5 billion by 2043. As a share of GDP, this represents an increase from 9.1% to 12.38%. Under the Financial Flows scenario, government revenue will reach US$72.8 billion, or 12.8% of GDP, by 2043. This is US$4.3 billion, or 0.42 percentage points of GDP, above the Current Path.
This trajectory is consistent with Wagner’s law, which argues that as economies grow, industrialise and become more complex, the role and size of the public sector tend to expand. Economic development raises demand for infrastructure, education, health, social protection, urban services, regulation, security, environmental management and administrative capacity. For Ethiopia, this relationship is especially relevant because the country is forecasted to become more urbanised, more industrialised, more service-oriented and more digitally connected by 2043. A larger and more complex economy will require a stronger state, but a stronger state will also require a broader and more efficient revenue base.
The forecasted increase in revenue, therefore, reflects more than simple GDP growth. It also points to the expected effects of improved tax administration, formalisation, stronger trade and investment flows, digitalisation of revenue systems, and a gradual expansion of the taxable economy. Under the Financial Flows scenario, higher FDI, stronger remittances, improved aid flows and faster economic activity will help widen the revenue base. More investment and trade can increase corporate income taxes, payroll taxes, VAT, customs revenue and other domestic receipts. If financial flows support formal-sector growth rather than only consumption or enclave investment, their fiscal impact becomes stronger.
However, Ethiopia’s revenue-to-GDP ratio will remain low even by 2043. A rise to 12.8% of GDP under the Financial Flows scenario is an improvement, but it still leaves Ethiopia below the revenue levels typically needed to finance ambitious development goals without excessive reliance on borrowing or aid. This matters because Ethiopia’s development agenda is fiscally demanding. The country needs to fund infrastructure, health, education, social protection, agricultural transformation, climate adaptation, conflict recovery, urban services and industrial policy. If revenue mobilisation remains weak, the government may face difficult trade-offs between capital investment, social spending and debt sustainability.
The policy challenge is therefore to convert economic growth into fiscal capacity. Wagner’s law suggests that public expenditure needs will rise as Ethiopia develops, but revenue does not automatically rise at the same pace unless institutions can capture part of the expanding economic base. Ethiopia’s historically low revenue performance reflects several constraints: a large informal economy, widespread subsistence agriculture, limited tax compliance, narrow corporate and personal income tax bases, weak property taxation, tax exemptions, administrative capacity gaps, and limited capacity to tax fast-growing service and digital activities. These constraints mean that rapid GDP growth does not necessarily translate into proportionate revenue growth.
The Financial Flows scenario offers a stronger outcome because it assumes better mobilisation of external and domestic resources. But the additional US$4.3 billion in revenue by 2043 should be interpreted as the result of improved economic structure and policy effort, not as an automatic by-product of higher financial inflows. FDI can raise revenue if investors are integrated into the domestic economy, generate profits, employ workers, export competitively and comply with tax obligations. Remittances can contribute indirectly through consumption, housing, savings and small-business formation, but only if flows move through formal channels. Aid can strengthen revenue mobilisation by financing public financial management, digital tax systems and institutional capacity, but it should not substitute for domestic revenue effort.
The strongest revenue gains are likely to come from improving tax collection mechanisms and broadening the tax base through formalisation rather than simply raising tax rates. This includes reducing informality, improving VAT compliance, expanding digital tax administration, strengthening customs systems, rationalising tax exemptions, improving taxpayer registration, and developing property and land-based taxation in urban areas. As services, ICT and manufacturing expand, tax policy will also need to adapt to new forms of economic activity. Better coordination between federal and regional governments will be important, particularly because Ethiopia’s federal structure shapes how revenue is collected, shared and spent.
The link between revenue and legitimacy is also important. Higher revenue mobilisation is more sustainable when citizens and firms see improvements in public services, infrastructure and accountability. Wagner’s law implies that citizens demand more public goods as incomes rise, but willingness to pay taxes depends on the perceived quality of government delivery. Strengthening public financial management, reducing leakage, improving procurement, and ensuring visible improvements in schools, clinics, roads, electricity, water and security will be central to building a stronger fiscal contract.
Overall, Chart 26 shows that Ethiopia’s fiscal capacity improves under the Financial Flows scenario, but not enough to remove the revenue constraint. This confirms that stronger financial flows can support domestic revenue mobilisation, but the deeper message is institutional. Ethiopia’s transformation will require a state capable of financing the growing public demands that accompany development. In line with Wagner’s law, as Ethiopia’s economy expands, the need for public investment and services will rise; the country’s challenge is to ensure that revenue mobilisation rises fast enough to meet those needs without undermining growth, equity or debt sustainability.
Chart 27 presents the Current Path of government effectiveness, comparing the country to the average for the African income group, from 2002 to 2043.
The World Bank’s Government Effectiveness Index captures perceptions of the quality of public services, the competence and independence of the civil service, the quality of policy formulation and implementation, and the credibility of government commitments. The index ranges from −2.5 (weak effectiveness) to +2.5 (strong effectiveness), providing a useful benchmark for assessing state capacity and institutional performance.
In the governance context, government effectiveness is particularly important because Ethiopia’s development ambitions depend heavily on the state’s ability to implement complex reforms across infrastructure, industrialisation, social services, fiscal management, security, climate resilience and private-sector development. Strong policy documents are necessary, but their impact ultimately depends on whether public institutions can coordinate, finance and execute them effectively.
Historically, Ethiopia’s progress has been gradual and uneven. Between 1996 and 2024, the country’s average government effectiveness score stood at −0.75, indicating persistent institutional constraints. The score reached a minimum of −1.44 in 2003, before improving to −0.42 in 2012. This improvement reflected stronger public investment management, expanding state capacity, large-scale infrastructure delivery and a more coordinated development planning system during the high-growth period. However, the gains were not fully sustained. By 2024, Ethiopia’s score stood at −0.65, ranking the country 143rd globally and 23rd in Africa. This suggests that, despite some progress, the quality of public administration and policy implementation remains below the level required for rapid and inclusive transformation.
The Current Path forecasts continued improvement in government effectiveness, reaching −0.2 by 2043, equivalent to a score of about 2.4 in the model’s transformed scale. This is a meaningful gain and would imply stronger administrative capability, better service delivery and improved policy execution. However, the forecasted score still indicates that Ethiopia would remain some distance from the continent’s stronger governance performers.
The comparison with Rwanda is instructive. Rwanda, which ranks among the top African countries on government effectiveness, improved its score substantially between 2005 and 2015 through sustained reforms focused on public-sector performance, accountability, service delivery, digital administration and results-based implementation. The lesson for Ethiopia is that improvement is possible, but it requires sustained reform depth rather than incremental administrative adjustments.
Ethiopia’s governance challenge is particularly complex because of the country’s size, federal structure, political diversity, conflict pressures and uneven regional capacity. Effective government in Ethiopia depends not only on the strength of central institutions, but also on coordination between federal, regional and local governments. Many of the country’s development priorities, including education, health, rural roads, agricultural extension, water services, revenue mobilisation and local security, require implementation at the subnational level. Weak coordination or uneven capacity across regions can therefore dilute national policy commitments and produce unequal development outcomes.
The forecasted improvement to 2043 will depend on several reinforcing reforms. First, Ethiopia needs stronger public-sector performance management, including clearer targets, better monitoring systems, merit-based appointments and accountability for delivery. Second, fiscal and public financial management reforms are essential to ensure that resources are allocated efficiently and spent transparently. Third, digital governance can improve service delivery, tax administration, procurement, civil registration and citizen access to public services. Fourth, the civil service must be strengthened through training, retention, incentives and professionalisation. Fifth, policy coordination must improve across ministries and between levels of government, especially in cross-cutting areas such as industrialisation, climate adaptation, urbanisation and private-sector reform.
Accountability is equally important. Government effectiveness is not only about administrative efficiency; it also depends on trust, legitimacy and responsiveness. Citizens and firms are more likely to comply with regulations, pay taxes and support reforms when public institutions are predictable, transparent and responsive. Strengthening audit institutions, procurement systems, anti-corruption mechanisms, grievance channels and parliamentary oversight would help improve both the quality and credibility of public administration. This is especially important for Ethiopia as it seeks to attract investment, mobilise domestic revenue and implement large infrastructure projects.
The governance score also has direct implications for other scenarios in the report. Improvements in education, health, manufacturing, AfCFTA gains, financial flows and infrastructure all depend on government effectiveness. Weak implementation capacity can reduce the returns from public investment, delay reforms, weaken investor confidence, constrain service delivery and increase policy uncertainty. Conversely, stronger government effectiveness can amplify gains across sectors by improving coordination, reducing transaction costs, increasing investor confidence and ensuring that national strategies translate into measurable outcomes.
The central policy message is that institutional capability is a development multiplier: without stronger implementation, accountability and coordination, Ethiopia’s ambitious strategies in infrastructure, industrialisation, service delivery and private-sector development will not fully translate into inclusive outcomes.
Chart 28 presents the security, capacity and inclusion index for the Current Path versus the Governance scenario, for 2025 and 2043.
This scenario assumes better governance: stability, capacity and inclusion. It measures a state’s progress using the average of these three indices. To this end, it includes an index (0 to 1) for each dimension, with higher scores indicating improved outcomes. participation rates, particularly among females, where appropriate.
Furthermore, the scenario includes increased welfare transfers to unskilled workers, funded by taxes on skilled workers. These two amounts should roughly balance each other out in US dollar terms. In the context of high poverty levels and inequality, social transfers have proven to be the most effective short- to medium-term measures for alleviating both issues.
Visit the theme on Governance for a full conceptualisation and details on the scenario structure and interventions.
According to the Ibrahim Index of African Governance (IIAG), Ethiopia scored 48.4 out of 100 in overall governance in 2023, an improvement of 2.5 points since 2014, ranking 29th out of 54 African countries. This placed Ethiopia slightly below the African average of 49.3, but above the Eastern Africa regional average of 46.8. The country’s recent gains have been driven mainly by improvements in participation, rights and inclusion, foundations for economic opportunity, and human development. However, these have been partly offset by deterioration in security and the rule of law, reflecting the impact of conflict, insecurity and institutional stress.
Under the Governance scenario, Ethiopia’s composite governance index will improve from 0.47 in 2025 to 0.66 by 2043, compared with 0.58 under the Current Path. This means the Governance scenario delivers an additional 0.08 points by 2043, representing a significant acceleration in institutional performance. It would move Ethiopia closer to stronger African governance performers, such as Tunisia, which is forecasted to reach 0.68 by 2043 (under the Current Path), from 0.64 in 2025. This comparison is useful because it shows that Ethiopia’s governance gap is not impossible to close, but doing so requires sustained reforms across security, inclusion and state capacity.
The largest gains under the Governance scenario will come from the security cluster, which will rise from 0.64 in 2025 to 0.89 by 2043, compared with 0.72 under the Current Path. This is the most important driver of the improved composite score. Stronger security performance would imply progress in stability, rule of law, conflict management, protection of citizens, territorial administration and institutional authority. This is critical because insecurity has been one of the main constraints on development in recent years, affecting investment, service delivery, humanitarian access, displacement, transport corridors and public trust. Without improvements in security and rule of law, gains in other sectors such as education, health, agriculture, infrastructure and manufacturing will remain fragile.
The second major area of improvement is inclusion, which will increase from 0.52 in 2025 to 0.69 by 2043 under the Governance scenario, compared with 0.66 under the Current Path. This points to gradual progress in participation, rights, representation and social equity. In Ethiopia, inclusion is especially important because of the country’s federal structure, ethnic diversity, regional inequalities and history of political contestation. Improved inclusion would strengthen social cohesion and legitimacy, while reducing the risk that development gains are unevenly distributed across regions, groups or communities. It would also support the broader objectives of Agenda 2063 and SDG 16, which emphasise inclusive institutions, peace, justice and accountable governance.
Capacity remains the weakest governance dimension. It will improve from 0.25 in 2025 to 0.39 by 2043 under the Governance scenario, compared with 0.35 under the Current Path. Although this represents progress, the low level of the score shows that state capability will remain Ethiopia’s most binding governance constraint. Capacity refers to the ability of institutions to design policy, coordinate across government, manage public resources, deliver services, regulate markets and implement reforms effectively. This is especially important for Ethiopia because its development agenda is highly implementation-intensive: infrastructure expansion, industrialisation, digital transformation, domestic revenue mobilisation, AfCFTA integration and climate adaptation all require strong institutions.
The contrast between strong gains in security and weaker gains in capacity is instructive. Ethiopia can make faster improvements in stability and inclusion if reforms reduce conflict, strengthen the rule of law and widen participation. However, governance transformation will remain incomplete if administrative capacity does not improve at the same pace. A more peaceful and inclusive political environment creates the conditions for development, but state capacity determines whether policies are actually implemented and whether citizens experience better services, infrastructure and economic opportunities.
The policy implication is that Ethiopia’s governance agenda must be broad but sequenced carefully. Restoring and sustaining security is essential because instability undermines every other development objective. Deepening inclusion is equally important because durable peace requires political legitimacy, representation and trust. But the long-term constraint is institutional capability. Ethiopia needs sustained investment in public administration, civil-service professionalisation, digital government, public financial management, procurement reform, monitoring and evaluation, and intergovernmental coordination. Stronger accountability mechanisms are also needed to ensure that improved capacity translates into better outcomes rather than simply larger bureaucratic systems.
Chart 29 presents GDP per capita in purchasing power parity (PPP) in the Current Path and each of the eight sectoral scenarios. The data is from 2022 with a forecast to 2043.
As shown earlier in Chart 7, Ethiopia’s GDP per capita at PPP will increase from US$2 896 in 2025 to about US$5 675 by 2043 under the Current Path. This represents substantial improvement in average income, but it still leaves Ethiopia below the income levels needed to achieve broad-based prosperity. The scenario comparison, therefore, helps identify which policy areas have the greatest potential to accelerate improvements in living standards.
The Governance scenario will produce the largest gain, raising GDP per capita by about US$456 above the Current Path forecast by 2043. This is an important result because governance is a cross-cutting enabler. Better governance improves the effectiveness of public investment, strengthens service delivery, reduces policy uncertainty, supports private-sector confidence, improves security and enhances coordination across institutions. In Ethiopia’s case, stronger governance would also help address several constraints that cut across the economy: conflict risk, weak implementation capacity, public financial management gaps, regulatory uncertainty and uneven subnational delivery. The result suggests that improving institutions is not a ‘soft’ reform area; it is one of the strongest levers for raising long-term income.
The Education scenario will produce the second-largest gain, at about US$323 above the Current Path by 2043. This underscores the importance of human capital in converting Ethiopia’s demographic potential into productivity growth. Higher mean years of education, better progression through the education funnel and stronger skills formation improve labour productivity, employability and the capacity of workers to move into manufacturing, services, ICT and higher-value agriculture. The result also reinforces the earlier findings (Charts 16-17) that Ethiopia’s education challenge is no longer only about enrolment, but about survival, completion, learning quality and labour-market relevance. Education gains take time to materialise, but by 2043, they will become a major driver of higher income.
The third-largest gain will come from the Agriculture scenario, which will add about US$287 above the Current Path forecast by 2043. This reflects agriculture’s central role in Ethiopia’s economy, employment structure, food security and rural livelihoods. Even as agriculture’s share of GDP declines over time, productivity improvements in the sector still have large economy-wide effects because many Ethiopians depend directly or indirectly on farming. Higher agricultural productivity can reduce food imports, improve rural incomes, lower poverty, ease food inflation, expand agro-processing and strengthen domestic demand. The strong GDP per capita gain from the Agriculture scenario confirms that Ethiopia’s transformation cannot bypass agriculture; it must begin with a more productive, climate-resilient and commercially connected rural economy.
The next group of scenarios will produce moderate but still meaningful gains. The AfCFTA scenario will add about US$243 above the Current Path by 2043, reflecting the benefits of deeper trade integration, stronger exports and improved regional market access. The Manufacturing scenario will add about US$221, showing that industrial upgrading can raise income, but that its impact depends on whether manufacturing expansion is large enough, export-oriented enough and linked to domestic suppliers. The Demographics and Health scenario will add about US$202, reflecting gains from lower mortality, better health outcomes and a more favourable age structure. These scenarios are complementary: better trade opportunities and stronger manufacturing will deliver larger income gains if Ethiopia also has healthier, better-educated workers and stronger institutions.
The Financial Flows scenario will add about US$106, while the Large Infrastructure and Leapfrogging scenario will add about US$92, the smallest gain among the scenarios. This does not mean that finance or infrastructure are unimportant. Rather, it suggests that their direct impact on GDP per capita is more limited unless they translate into productivity, jobs, investment, exports and service delivery. For example, higher FDI raises income more strongly when the investment is export-oriented and linked to domestic firms. Similarly, broadband, electricity and clean cooking have wide social and productivity benefits, but their growth impact depends on complementary reforms in skills, enterprise development, governance and market access.
The ranking in Chart 29 indicates that Ethiopia’s largest income gains come from reforms that improve the foundations of productivity: governance, agriculture and education. These are not isolated sectors; they reinforce each other. Better governance improves agricultural policy delivery and education-system performance. A more productive agricultural sector raises rural incomes and food security, supporting human capital formation. A better-educated workforce enables manufacturing, services, ICT and trade to expand more productively. The strongest development strategy is therefore not to choose one scenario, but to sequence and combine reforms in ways that create cumulative gains.
Chart 30 presents poverty in the Current Path and for each scenario, from 2022 to 2043. The user can select the number of extremely poor people or the percentage of the population.
Under the Current Path, poverty (at $3.00 poverty line for low-income countries) in Ethiopia will decline substantially from 29.3% in 2025, equivalent to about 39.6 million people, to 6% by 2043, or roughly 11.8 million people. This is a major reduction and reflects the expected effects of continued economic growth, rising GDP per capita, demographic transition, urbanisation, improvements in education and gradual structural change. However, the fact that more than 11 million people will remain in extreme poverty by 2043 under the Current Path shows that growth alone is not sufficient to eliminate poverty.
The Education scenario will deliver the largest poverty reduction, lowering poverty to 3.9% by 2043, equivalent to about 7.63 million people. This is the strongest result because education directly improves human capital, employability, productivity and lifetime earnings. It also has strong intergenerational effects: better-educated parents are more likely to invest in children’s health and schooling, delay early marriage, adopt improved technologies, and participate in more productive labour markets. In Ethiopia’s case, where many young people still exit the education system before completing secondary school, improvements in learning, retention, completion and skills formation can have large poverty-reducing effects over time.
The Governance scenario will produce the second-largest reduction, reducing poverty to 4.64%, or about 9.1 million people, by 2043. Governance reduces poverty through several channels. Better institutions improve the delivery of education, health, water, infrastructure and social protection. Stronger security and rule of law reduce displacement and protect livelihoods. Better public financial management improves the effectiveness of public spending, while regulatory predictability supports private investment and job creation. In this regard, governance is not only an institutional outcome; it is a poverty-reduction tool because it determines whether policies reach people effectively.
The Agriculture scenario will follow closely, lowering poverty to 4.68%, or about 9.2 million people, by 2043. This reflects agriculture’s central role in Ethiopia’s poverty profile. Most poor households will remain linked to rural livelihoods, either directly through farming or indirectly through food prices and rural labour markets. Higher agricultural productivity can raise farm incomes, reduce food insecurity, lower food inflation, expand agro-processing and stimulate rural non-farm employment. The strong poverty effect of the Agriculture scenario confirms that Ethiopia’s poverty reduction strategy cannot rely only on urban industrialisation; it must also raise productivity and resilience in the rural economy.
The remaining scenarios will also reduce poverty below the Current Path, but by smaller margins. The Manufacturing scenario will lower poverty to 5.46%, or about 10.7 million people, by 2043, mainly through job creation, productivity gains and stronger linkages with services and suppliers. The Financial Flows scenario will reduce poverty to 5.53%, or about 10.9 million people, reflecting the benefits of higher aid, remittances and FDI, although the poverty effect depends on whether these flows reach households and support productive sectors. The Health and Demographics scenario will lower poverty to 5.62%, or about 10.7 million people, through better health, lower dependency burdens and improved labour-force participation. The Large Infrastructure and Leapfrogging scenario will reduce poverty to 5.68%, or about 11.1 million people, through gains in electricity access, clean cooking, broadband and infrastructure-enabled productivity. The AfCFTA scenario has the smallest poverty effect, reducing poverty to 5.81%, or about 11.4 million people, because trade gains take time to reach poor households unless they are linked to labour-intensive exports, rural producers, small firms and employment creation.
The scenarios that most directly affect people’s productive capacity and livelihoods, education, agriculture and governance, have the largest poverty-reduction effects. Scenarios that operate more indirectly through trade, finance, infrastructure or industrial expansion still matter, but their poverty impact depends on transmission mechanisms. For example, AfCFTA can reduce poverty more strongly if small farmers, agro-processors and labour-intensive manufacturers are integrated into regional value chains. Infrastructure can reduce poverty more strongly if electricity, broadband and roads support rural enterprises, schools, clinics and local markets. Financial flows can have larger poverty effects if aid is targeted to health and rural livelihoods, remittances move through formal productive channels, and FDI creates decent jobs.
Chart 31 presents GDP in the Current Path and in the Combined scenario from 2022 to 2043. The data is in US$ 2021 and at market exchange rates (MER).
The Combined scenario combines all eight sectoral scenarios: Governance, Demographics and Health, Education, Large Infrastructure and Leapfrogging, Agriculture, Manufacturing, AfCFTA and Financial Flows. The Combined scenario effectively represents a coordinated reform pathway rather than a simple aggregation of interventions.
As shown earlier in Chart 5, Ethiopia’s GDP at MER is forecasted to reach about US$553.3 billion by 2043 under the Current Path. This implies an average annual growth rate of about 7.8% between 2025 and 2043, which is strong by regional and global standards. However, it remains below Ethiopia’s more ambitious national transformation objectives, particularly the TYDP, which targets an average annual growth rate of around 10% between 2021 and 2030.
Under the Combined scenario, GDP will rise much faster, reaching US$854.3 billion by 2043. This is approximately US$301 billion above the Current Path forecast, representing a substantially larger and more diversified economy. The Combined scenario implies an average annual growth rate of about 10.3% over 2025–2043, which slightly exceeds the TYDP’s 10% target. This is important because it suggests that Ethiopia’s national growth ambition is not entirely out of reach, but it requires simultaneous progress across multiple policy fronts rather than isolated sectoral reforms.
The strength of the Combined scenario comes from cumulative and reinforcing effects. Governance improvements raise implementation capacity, reduce uncertainty and strengthen investor confidence. Agricultural productivity improves food security, rural incomes and agro-processing potential. Education and health gains raise labour productivity and support the demographic dividend. Manufacturing and AfCFTA deepen structural transformation, exports and regional market integration. Financial flows increase access to foreign exchange, investment and development finance, while infrastructure and leapfrogging improve electricity access, digital connectivity and clean energy adoption. Taken together, these reforms create a stronger growth platform than any individual scenario can deliver alone.
The gain of US$301 billion by 2043 represents the economic value of coordination. Ethiopia’s development constraints are interdependent. Manufacturing cannot expand without reliable power, foreign exchange, skills, logistics and governance. Agricultural transformation depends on infrastructure, finance, climate resilience and market access. AfCFTA gains require productive capacity and trade facilitation. Education and health gains matter most when the economy can absorb young people into productive employment. The Combined scenario captures this interaction by showing that reforms generate larger gains when implemented as a package.
The 10.3% growth trajectory is ambitious but also demanding. Ethiopia has previously recorded periods of rapid growth, especially during the public-investment-led expansion of the 2000s and 2010s. However, sustaining growth close to 10% over nearly two decades would require a more resilient and private-sector-led model than in the past. The earlier growth model delivered major infrastructure and social gains, but it also generated foreign exchange shortages, debt pressures, limited export diversification and insufficient private-sector dynamism. The Combined scenario, therefore, implies not just faster growth, but better-quality growth: more export-oriented, more productive, more inclusive and less vulnerable to macroeconomic stress.
The policy conditions behind this outcome are substantially challenging. Ethiopia would need to maintain macroeconomic stability, resolve debt pressures, improve security, deepen financial-sector reform, attract quality FDI, expand exports, improve public-sector effectiveness and strengthen domestic revenue mobilisation. It would also need to ensure that growth is not concentrated only in Addis Ababa or a few urban corridors, but spreads through rural productivity, secondary cities, industrial parks, logistics networks and regional trade links. Without this spatial and sectoral inclusiveness, high GDP growth may not translate fully into poverty reduction, jobs and improved living standards.
Chart 32 presents GDP per capita in purchasing power parity (PPP) in the Current Path and the Combined scenario. The data is from 2022 with a forecast to 2043.
Under the Combined scenario, Ethiopia’s GDP per capita at PPP will rise to approximately US$8 149 by 2043, compared with about US$5 675 under the Current Path. This represents an additional US$2 474 per person by 2043 and implies that average income would be almost three times its 2025 level. The size of this gain is significant because it shows how much Ethiopia could improve household welfare if reforms across key sectors are implemented together.
The importance of the Combined scenario is that it raises income through several channels at once. Higher agricultural productivity supports rural incomes and food security. Better education and health improve labour productivity. Stronger governance increases implementation capacity and investor confidence. Manufacturing and AfCFTA expand production and market access. Financial flows ease investment and foreign exchange constraints, while infrastructure and digital connectivity improve access to services and economic opportunities. The result is a broader and more durable increase in income than would be achieved through isolated reforms.
A GDP per capita level of US$8 149 by 2043 would not mean that Ethiopia has eliminated poverty or inequality, but it would represent a major shift in the country’s development position. Higher average income would expand household purchasing power, increase demand for better housing, education, health, transport, energy and digital services, and create a larger domestic market for firms. It would also strengthen the fiscal base, allowing the government to mobilise more revenue for public investment and social services, provided that growth is accompanied by stronger tax administration and formalisation.
The difference between the Combined scenario and the Current Path also highlights the cost of partial reform. Under the Combined scenario, coordinated reforms will lift GDP per capita by more than 40% above the Current Path forecast by 2043. This suggests that Ethiopia’s long-term welfare gains depend not only on maintaining growth, but on changing the quality of growth: making it more productive, inclusive, export-oriented, and skills-based and institutionally supported.
However, the welfare impact of higher GDP per capita will depend on distribution. If growth is concentrated in a few urban centres or capital-intensive sectors, many households may see only limited gains. To translate the Combined scenario into broad-based improvements in living standards, Ethiopia would need to ensure that rural communities, women, young people, displaced populations and poorer regions are integrated into the growth process. This requires investment in rural productivity, secondary cities, labour-intensive manufacturing, social protection, education quality, health access and basic infrastructure.
Chart 33 presents the value added by sector in the Current Path and in the Combined scenario, from 2025 to 2043. The data is in US$ 2017 and as a percentage of GDP.
Our modelling provides forecasts in six economic sectors, namely agriculture, energy, materials (including mining), manufacturing, services and ICTech.
The Combined scenario will produce a much larger Ethiopian economy by 2043, but only a modest shift in sectoral composition relative to the Current Path. This is important because structural transformation is not only about whether all sectors grow, but whether the economy moves toward higher-productivity activities, stronger intersectoral linkages and more diversified sources of value added. Under the Combined scenario, all sectors will expand in absolute terms, but the overall structure will remain heavily anchored in services.
In share-of-GDP terms, agriculture will record the largest relative gain, increasing by 1.47 percentage points above the Current Path forecast for 2043. This suggests that the Combined scenario strengthens agriculture more than the baseline, likely through productivity gains, improved food-system performance, rural infrastructure, better market access and stronger agro-processing linkages. This is significant because agriculture remains central to employment, poverty reduction, food security and rural incomes, even as its long-term GDP share declines. A stronger agricultural sector in the Combined scenario, therefore, supports a more inclusive form of transformation, rather than one driven only by urban services.
ICT will record the second-largest gain, rising 0.56 percentage points above the Current Path. This is also important for structural transformation because ICT is an enabling sector. Its contribution goes beyond its direct share of GDP: digital infrastructure, mobile money, broadband, e-government, data systems and digital platforms can raise productivity across agriculture, manufacturing, trade, finance, logistics and public services. The ICT gain therefore points to the role of leapfrogging technologies in supporting a more modern and connected economy.
By contrast, several sectors will record lower shares of GDP than under the Current Path by 2043. Services will decline by 0.38 percentage points, materials by 0.36, energy by 0.48, and manufacturing by 0.82. These declines should not be misread as sectoral contraction. They reflect compositional effects in a much larger economy, where agriculture and ICT will grow slightly faster in relative terms.
The decline in manufacturing’s share is particularly important to interpret carefully. Manufacturing will still expand strongly in absolute value, but its share will be lower than in the Current Path by 2043 because other sectors and GDP will grow even faster under the Combined scenario. This suggests that Ethiopia’s transformation in the Combined scenario is broad-based rather than narrowly manufacturing-led.
The absolute changes confirm this. By 2043, the services sector will remain the largest and fastest-growing in terms of value added, with an increase of approximately US$187.5 billion compared to the Current Path. Agriculture is forecasted to grow by an additional US$41.7 billion, followed by ICT at US$27.6 billion, manufacturing at US$27.3 billion, materials at US$12.3 billion, and energy at US$4.6 billion. The significant growth in the services sector indicates that Ethiopia's future economy will predominantly be service-oriented. This aligns with global development trends; however, the quality of service growth will be crucial in determining whether this transformation is productive or merely absorptive.
The main policy issue concerns the nature of service expansion. If the growth of services is primarily driven by informal trade, low-productivity personal services, and public administration, its development impact will be limited. However, if it is fueled by logistics, finance, ICT-enabled services, education, health, tourism, professional services, and trade-related activities, it can become a powerful engine for productivity and job creation. In this respect, Ethiopia's structural transformation will rely not only on increasing manufacturing but also on upgrading the service economy and enhancing its connections with agriculture, industry, and trade.
The Combined scenario also shows why agriculture will remain a strategic sector. Although structural transformation usually involves a declining agricultural share over time, Ethiopia’s large rural population means that agricultural productivity gains will remain essential for poverty reduction and inclusive growth. The additional US$41.7 billion in agricultural value added indicates that a more productive rural economy can coexist with broader economic diversification. If linked to agro-processing, cold chains, logistics, exports and urban food markets, agriculture can support both rural incomes and industrial development.
Manufacturing’s absolute gain of US$27.3 billion will remain important, even though its GDP share will be lower than under the Current Path. This indicates that industrial expansion still contributes to the Combined scenario, but it does not dominate the structural shift. Ethiopia will therefore need to ensure that manufacturing growth is more export-oriented, labour-absorbing and connected to domestic suppliers. Without stronger industrial linkages, the economy risks becoming larger but still insufficiently diversified in terms of productive employment and exports.
Overall, Chart 33 suggests that the Combined scenario delivers strong economy-wide expansion and modest structural transformation. Services will remain the backbone of Ethiopia’s economy, agriculture and ICT will gain relative importance, and manufacturing will grow substantially in absolute terms despite a lower GDP share. The central policy message is that Ethiopia’s transformation by 2043 is likely to be broad-based rather than sectorally concentrated. To make it developmentally meaningful, Ethiopia must raise productivity within sectors and deepen linkages between them: agriculture with agro-processing, manufacturing with domestic suppliers, ICT with firms and public services, and services with trade, logistics and finance.
Chart 34 presents the size of the informal sector in the Current Path and the Combined scenario, from 2022 to 2043.
The informal sector’s contribution to GDP will fall to 20.8% by 2043, which is about 4.3 percentage points lower than the Current Path forecast. At the same time, informal employment in the non-agricultural labour force will decline to 33%, approximately 13.7 percentage points below the Current Path. This indicates that the Combined scenario does more than raise economic output; it also changes the structure and quality of employment.
The decline in informal GDP suggests that a larger share of Ethiopia’s economic activity would shift into more formal, regulated and taxable sectors. This is important because high informality limits productivity, weakens labour protection, reduces tax revenue, constrains access to finance and makes it harder for firms to grow. Informal firms often operate at a small scale, use limited technology, have weak links to formal value chains and face barriers to credit, training and markets. A reduction to 20.8% of GDP, therefore, implies a more organised and productive economy, with stronger potential for domestic revenue mobilisation and private-sector development.
The larger improvement will be seen in employment. Reducing informal non-agricultural employment to 33% by 2043 would represent a major shift in the labour market. This matters because Ethiopia’s structural transformation challenge is not only to move workers out of agriculture, but to ensure that they enter more productive and better-protected forms of work. Without formal job creation, urbanisation and sectoral change can simply move people from rural underemployment into urban informality. The Combined scenario suggests a stronger outcome, where manufacturing, services, ICT, infrastructure, trade, financial flows and better governance jointly create more formal employment opportunities.
The result reflects the interaction of several reforms. Better education will improve workers’ skills and employability. Stronger governance will reduce regulatory uncertainty, improve business conditions and encourage firms to register and expand. Manufacturing and AfCFTA will create opportunities for formal wage employment and supplier development. Financial flows will improve access to investment, working capital and foreign exchange. Infrastructure and digital connectivity will reduce the cost of doing business, while agriculture-led growth will support rural incomes and agro-processing. Together, these reforms will make formalisation more attractive and feasible for both firms and workers.
However, the persistence of informality even under the Combined scenario shows that formalisation will remain a long-term challenge. A GDP share of 20.8% and non-agricultural informal employment of 33% are improvements, but they still point to a sizeable informal economy by 2043. This is likely to be concentrated among microenterprises, own-account workers, casual labourers, women, young people, migrants and workers in low-productivity urban services. Formalisation, therefore, cannot rely only on enforcement. It must also reduce the costs and risks of becoming formal.
The policy priority should be to make formality beneficial rather than punitive. Ethiopia can support this by simplifying business registration, reducing compliance costs for micro and small enterprises, expanding digital tax and licensing systems, improving access to finance, strengthening social protection for informal workers, and linking small firms to public procurement, industrial parks and larger value chains. Labour-market policies should also support apprenticeships, skills certification, job matching and entrepreneurship, especially for young people and women.
Chart 35 presents poverty in the Current Path and the Combined scenario, 2025 to 2043.
At the $3.00 poverty line for low-income countries, the poverty rate will fall to approximately 1.2%, equivalent to about 2.2 million people. This is 4.8 percentage points lower than the Current Path forecast and means that an additional 9.6 million people would be lifted out of poverty by 2043. The result is significant because it suggests that extreme poverty could become a relatively residual condition if Ethiopia implements a coordinated package of reforms across governance, agriculture, education, health, trade, manufacturing, infrastructure and financial flows.
The strength of the Combined scenario comes from the fact that poverty is reduced through several channels at once. Higher agricultural productivity raises rural incomes and improves food security. Better education and health increase employability and labour productivity. Stronger governance improves service delivery, security and implementation capacity. Manufacturing, AfCFTA and financial flows support investment, exports and job creation, while infrastructure and digital connectivity improve access to services and economic opportunities. This combination matters because poverty in Ethiopia is multidimensional; it is linked not only to low income, but also to weak access to education, health, land productivity, markets, electricity, clean cooking, finance and secure livelihoods.
The scenario will also improve inequality outcomes. The Gini coefficient will decline to 0.3 by 2043 under the Combined scenario, compared with an increase to 0.32 under the Current Path. Although the change appears small, it is important because rapid growth can sometimes widen inequality if gains are concentrated in urban areas, capital-intensive sectors or better-connected regions. The Combined scenario instead suggests a more inclusive growth pattern, where rural productivity, human capital, infrastructure access and better governance help spread the benefits of growth more widely.
This inclusive effect is crucial for Ethiopia. A larger economy does not automatically reduce poverty unless poor households are connected to the sources of growth. The Combined scenario performs strongly because it includes reforms that directly affect poor and vulnerable groups: rural households benefit from agricultural transformation; young people benefit from better education and skills; informal workers benefit from formalisation and job creation; and remote communities benefit from infrastructure and service expansion. In this sense, the poverty impact is not simply the result of faster GDP growth, but of broader participation in that growth.
However, reducing extreme poverty to 1.2% by 2043 would still require deliberate policy effort. The remaining 3.05 million people are likely to be among the hardest to reach: households in conflict-affected areas, displaced populations, pastoralist communities, people with disabilities, remote rural households, female-headed households and those facing overlapping deprivations. Reaching them will require targeted social protection, rural livelihoods programmes, health and nutrition interventions, education support, climate adaptation and conflict-sensitive service delivery.
Chart 36 compares life expectancy in the Current Path with the Combined scenario from 2022 to 2043.
Under the Current Path, life expectancy will rise from 65.9 years in 2025 to 72 years by 2043. Under the Combined scenario, it will increase further to 75.1 years, adding 3.1 years above the Current Path. This is a major gain because life expectancy summarises the combined effects of health services, nutrition, income, education, sanitation, security, maternal and child health, disease prevention and broader living conditions.
The improvement under the Combined scenario reflects the cumulative effect of reforms across sectors. Better health services reduce preventable deaths, especially among infants, children and mothers. Improved education supports healthier behaviour, later fertility, better nutrition and stronger use of health services. Higher household incomes reduce vulnerability to food insecurity and improve access to care. Expanded electricity, clean cooking, water and sanitation reduce exposure to respiratory and communicable diseases. Stronger governance improves service delivery, security and public-health coordination, while agricultural gains support nutrition and rural livelihoods. Life expectancy, therefore, rises not because of health-sector interventions alone, but because the broader determinants of health improve together.
The forecasted outcome is strong in comparative terms. World Bank estimates put global life expectancy at about 73 years in 2024, compared with 63 years for Sub-Saharan Africa and around 65 years for Eastern and Southern Africa. Ethiopia’s 75.1 years by 2043 under the Combined scenario would therefore place the country well above today’s African peer-group averages and above the current global average. This would represent a significant shift in Ethiopia’s human development profile.
However, the gain should not be interpreted as automatic. Ethiopia still faces a double burden of disease: communicable diseases, respiratory infections, maternal and child health risks, undernutrition and WaSH-related illnesses remain important, while non-communicable diseases such as cardiovascular disease, cancers and diabetes are rising as the population ages and urbanises. Sustaining life expectancy gains will therefore require a health system that can both finish the unfinished agenda of infectious disease and child survival, while also preparing for chronic disease prevention, screening, treatment and long-term care.
The policy implication is that Ethiopia must continue strengthening primary healthcare while investing in the broader social determinants of health. This includes maternal and newborn care, immunisation, nutrition, WaSH, clean cooking, rural health extension, affordable essential medicines, NCD screening, emergency care and health financing. It also requires conflict-sensitive service delivery so that displaced and insecure communities are not left behind. Without inclusive access, national life expectancy gains could mask large regional, rural–urban and income-based inequalities.
Chart 37 compares carbon dioxide (CO2) emissions from fossil fuels (billion tons of carbon) in the Current Path with the Combined scenario from 2022 to 2043.
Ethiopia’s emissions will rise under the Combined scenario, but from a very low base. In 2025, fossil-fuel CO₂ emissions stood at about 25.5 million tons of carbon, equivalent to roughly 0.2 tons per person. This is far below the global average of about 5 tons per person and also below the African average of around 0.99 tons per person. Ethiopia’s direct contribution to global fossil-fuel emissions is therefore negligible, despite its large population.
Under the Combined scenario, fossil-fuel CO₂ emissions will rise to about 180.9 million tons by 2043, roughly 44.6 million tons higher than the Current Path forecast. This increase mainly reflects the scale of economic expansion in the Combined scenario. Faster GDP growth, industrialisation, urbanisation, transport demand, construction, manufacturing activity and higher household energy use all raise demand for fossil-fuel-based energy and transport services. The rise in emissions should therefore be interpreted as a by-product of accelerated development rather than evidence that Ethiopia is shifting toward a highly carbon-intensive growth model.
Even so, the increase matters. Ethiopia’s development strategy is strongly linked to low-carbon ambitions through the Climate-Resilient Green Economy (CRGE) strategy, renewable electricity generation, hydropower expansion, clean cooking, reforestation and climate adaptation. The Combined scenario suggests that rapid transformation can improve incomes, reduce poverty and raise life expectancy, but it can also increase emissions if energy, transport, industry and urban systems are not managed carefully. The challenge is therefore to sustain growth while reducing the carbon intensity of that growth.
The key policy issue is not whether Ethiopia should grow more slowly to limit emissions. Ethiopia has very low historical per capita emissions, major development needs and a strong equity claim to expand energy access, infrastructure and industry. The priority is instead to ensure that new growth is as clean and efficient as possible. This means expanding renewable electricity, improving grid reliability, electrifying transport where feasible, promoting energy efficiency in industry, supporting clean cooking, improving public transport, and encouraging climate-smart urban planning.
The rise in emissions also reinforces the importance of productive energy use. If higher emissions are associated with manufacturing, agro-processing, logistics, electricity access and formal job creation, the development return is stronger. If emissions rise mainly through inefficient transport, diesel generation, poorly planned urban expansion and low-productivity fuel use, the outcome is less desirable. Ethiopia’s policy task is therefore to channel energy growth into productive sectors while avoiding avoidable fossil-fuel lock-in.
Chart 38 compares energy demand and production in the Current Path with the Combined scenario from 2022 to 2043. Production is done in nine types, namely oil, gas, coal, hydro, nuclear, solar, wind, geothermal and other renewables. The data is converted into billion barrels of oil equivalent (BBOE) to allow for comparisons. Note that energy production could be for domestic use or for export.
Total energy production is forecasted to rise from approximately 151 million barrels of oil equivalent (BOE) in 2025 to about 310 million BOE by 2043 under the Combined scenario. This represents an increase of roughly 68 million BOE compared to the Current Path forecast. The majority of this increase will come from renewable sources. Approximately 82% of the additional production, or 56 million BOE, will be generated from hydropower; around 8%, or 5 million BOE, will come from solar; and a 3%, or 2 million BOE, will be generated from wind.
This production profile is consistent with Ethiopia’s long-standing low-carbon energy strategy. The country has large hydropower potential, growing wind and solar opportunities, and a policy framework that emphasises renewable energy as a foundation for industrialisation, electrification and climate-resilient development. Under the Combined scenario, the renewable share of total energy production will increase from 34.5% in 2025 to 92.1% by 2043, slightly above the Current Path forecast of 91.5%. This indicates that Ethiopia’s accelerated growth can still be supported by a predominantly renewable production base, provided investment in generation, transmission and distribution keeps pace.
Hydropower remains the backbone of the energy expansion. This reflects Ethiopia’s comparative advantage in large-scale renewable electricity and the strategic role of projects such as the GERD and other hydropower developments. However, the increasing contribution of wind and solar is also important because it diversifies the renewable energy mix. A system that relies too heavily on hydropower can be vulnerable to drought, rainfall variability and climate shocks. Expanding wind and solar would therefore strengthen resilience, especially if paired with grid upgrades, storage, regional power trade and better demand management.
The main challenge is that demand will grow even faster than production. Under the Combined scenario, energy demand will rise from about 211 million BOE in 2025 to 862 million BOE by 2043, compared with 677 million BOE under the Current Path. This surge reflects faster economic growth, industrialisation, urbanisation, population expansion, electrification, digitalisation and higher household consumption. As Ethiopia becomes richer and more productive, energy use rises across factories, transport systems, households, farms, service industries, data infrastructure and public services.
Even though production increases strongly, the gap between demand and domestic production remains large. This implies that Ethiopia will need to manage the balance through a combination of domestic generation expansion, energy imports, efficiency improvements, fuel substitution and demand-side management. Without careful planning, rapid demand growth could increase import dependence, strain foreign exchange, raise energy costs and create bottlenecks for industry and households.
The policy priority is therefore not only to produce more energy, but to use energy more efficiently and productively. Industrial energy efficiency, efficient transport systems, electrified public transport, clean cooking, modern grid management, appliance standards and better urban planning can reduce unnecessary demand growth. At the same time, expanding electricity access must be linked to productive use in agriculture, manufacturing, services and digital sectors so that rising energy consumption translates into higher incomes and jobs.
The Combined scenario also has important climate implications. As shown in the emissions analysis, faster growth raises fossil-fuel CO₂ emissions, but Chart 38 suggests that Ethiopia can still anchor its energy transition in renewables. The challenge will be to prevent rising energy demand, especially from transport, construction and industry, from increasing reliance on imported petroleum and inefficient fossil-fuel use. This requires stronger investment in renewable power, grid reliability, regional power interconnections, electric mobility, clean cooking, and climate-resilient energy infrastructure.
Chart 39: Summarises the policy recommendations for Ethiopia
The analysis shows that Ethiopia’s long-term prospects will depend less on a single sectoral intervention than on coordinated reform across governance, agriculture, human capital, industrialisation, trade, financial flows and infrastructure. The Combined scenario demonstrates that this integrated approach could raise GDP to US$854.3 billion by 2043, lift GDP per capita to about US$8 149, reduce extreme poverty to 1.2%, reduce informal non-agricultural employment to 33%, and improve life expectancy to 75.1 years. Achieving these gains will require deliberate policy action, stronger implementation capacity and sustained political commitment.
Strengthening governance and state capacity is central to this agenda. Governance produces the largest gain in GDP per capita among the individual scenarios by 2043 and remains a key cross-cutting enabler of development. Ethiopia should improve public-sector performance, intergovernmental coordination, fiscal transparency, accountability, digital governance and conflict-sensitive service delivery, since progress in education, health, agriculture, infrastructure and investment depends on effective implementation across federal, regional and local institutions.
Agricultural transformation is equally important for food security, poverty reduction and rural livelihoods. Even as agriculture’s share of GDP declines over time, Ethiopia should raise yields, expand irrigation, improve seed and fertiliser systems, scale climate-smart agriculture, reduce post-harvest losses and strengthen agro-processing. The Agriculture scenario shows that Ethiopia can reverse its widening agricultural deficit and return to self-sufficiency levels last experienced around 1976, but this requires a shift from extensive production growth to productivity-led transformation.
Human capital development will determine whether Ethiopia’s demographic transition becomes a dividend. Young people need to be educated, skilled, healthy and productively employed. Education reforms should focus on retention, secondary completion, learning quality, TVET, science and engineering, and stronger links between skills and labour-market demand. Health policy should strengthen primary healthcare, maternal and child health, nutrition, reproductive health, clean water, sanitation and disease prevention, because these investments support welfare, productivity, poverty reduction and long-term growth.
Economic diversification should focus on raising productivity across manufacturing, ICT, agro-processing and tradable services. Ethiopia’s economy will remain services-led, but structural transformation requires stronger export-oriented manufacturing, better industrial park performance, domestic supplier development, logistics reform, access to finance, reliable energy and skills upgrading. ICT should be treated as an economy-wide productivity enabler through fixed broadband, digital public infrastructure, mobile money, e-government and affordable connectivity.
Regional integration should be translated into export growth. AfCFTA gives Ethiopia access to larger markets, but market access alone will not be sufficient. Ethiopia must improve standards, customs efficiency, trade finance, cold chains, transport corridors, logistics reliability and firm competitiveness. The most promising opportunities lie in agro-processing, textiles, leather, pharmaceuticals, electricity, light manufacturing and tradable services, making AfCFTA a platform for export diversification and regional value-chain development.
Financial flows should be mobilised in ways that support productivity and resilience. Aid should be targeted to sectors with high social returns, including health, food security, rural livelihoods, humanitarian response and climate resilience. Remittances should be channelled through formal systems, lower transfer costs, diaspora investment instruments and stronger macroeconomic credibility. FDI should support productivity, exports, technology transfer, domestic linkages and decent jobs. At the same time, Ethiopia should strengthen domestic revenue mobilisation by broadening the tax base, reducing informality, improving VAT and customs administration, and building a stronger fiscal contract.
Infrastructure expansion must be aligned with energy security and climate resilience. Ethiopia should accelerate rural electrification, clean cooking, fixed broadband, transport connectivity and renewable energy, while improving reliability, affordability and last-mile delivery. The Combined scenario shows that renewable energy will dominate production by 2043, but energy demand rises even faster, making grid investment, energy efficiency, diversified renewables, clean cooking, public transport and climate-smart urban planning essential.
Inclusive growth and formalisation are necessary to ensure that transformation reaches poor, rural, displaced and marginalised communities. Ethiopia should support MSME upgrading, simplify business registration, expand access to finance, connect small firms to value chains, strengthen women’s economic inclusion and extend social protection to informal workers. Reducing informality is central to productivity, tax mobilisation and job quality.
Overall, Ethiopia’s path to 2043 is not simply about faster GDP growth, but about coordinated, inclusive and productivity-enhancing transformation. The strongest gains will come when capable institutions, productive agriculture, skilled and healthy people, competitive firms, regional trade, reliable infrastructure and better financial systems reinforce one another. Ethiopia can move well beyond the Current Path, but only if reform implementation is integrated, sequenced and sustained.
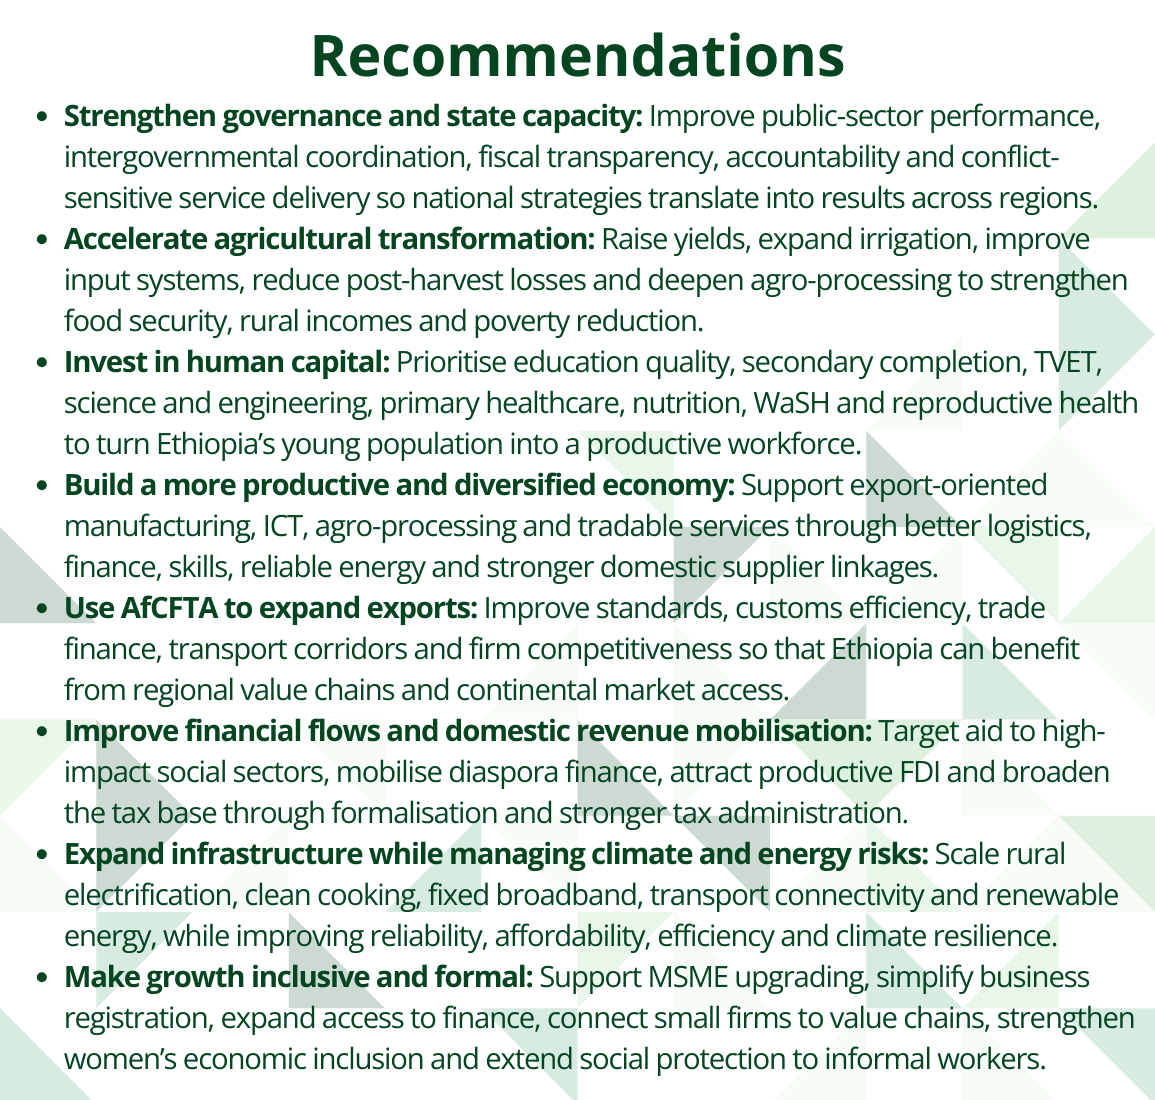
Page information
Contact at AFI team is Marvellous Ngundu
This entry was last updated on 1 September 2026 using IFs v8.72.
Donors and sponsors



Reuse our work
- All visualizations, data, and text produced by African Futures are completely open access under the Creative Commons BY license. You have the permission to use, distribute, and reproduce these in any medium, provided the source and authors are credited.
- The data produced by third parties and made available by African Futures is subject to the license terms from the original third-party authors. We will always indicate the original source of the data in our documentation, so you should always check the license of any such third-party data before use and redistribution.
- All of our charts can be embedded in any site.
Cite this research
Marvellous Ngundu (2026) Ethiopia Development Futures. Published online at futures.issafrica.org. Retrieved from https://futures.issafrica.org/geographic/countries/ethiopia/ [Online Resource] Updated 1 September 2026.