 Sub-Saharan Africa
Feedback welcome
Our aim is to use the best data to inform our analysis. See our Technical page for information on the IFs forecasting platform. We appreciate your help and references for improvements via our feedback form.
Please note: This regional report was developed using African Futures’ previous analytical framework, which organised the assessment across 11 sectoral scenarios. We have since updated and streamlined the analytical architecture to 8 sectoral scenarios. While the two frameworks remain broadly aligned, the current structure improves consistency, comparability and integration across themes and geographic studies. This page will therefore be updated to the current framework in due course. Read more about our analytical framework on the Technical Page.
In this entry, we first describe the Current Path forecast for sub-Saharan Africa as it is expected to unfold to 2043, the end of the third ten-year implementation plan of the African Union’s Agenda 2063 long-term vision for Africa. The Current Path in the International Futures (IFs) forecasting model initialises from country-level data that is drawn from a range of data providers. We prioritise data from national sources.
The Current Path forecast is divided into summaries on demographics, economics, poverty, health/WaSH and climate change/energy. A second section then presents a single positive scenario for potential improvements in stability, demographics, health/WaSH, agriculture, education, manufacturing/transfers, leapfrogging, free trade, financial flows, infrastructure, governance and the impact of various scenarios on carbon emissions. With the individual impact of these sectors and dimensions having been considered, a final section presents the impact of the Combined Agenda 2063 scenario.
We generally review the impact of each scenario and the Combined Agenda 2063 scenario on gross domestic product (GDP) per person and extreme poverty except for Health/WaSH that uses life expectancy and infant mortality.
The information is presented graphically and supported by brief interpretive text.
All US$ numbers are in 2017 values.
Executive Summary
Current Path forecast
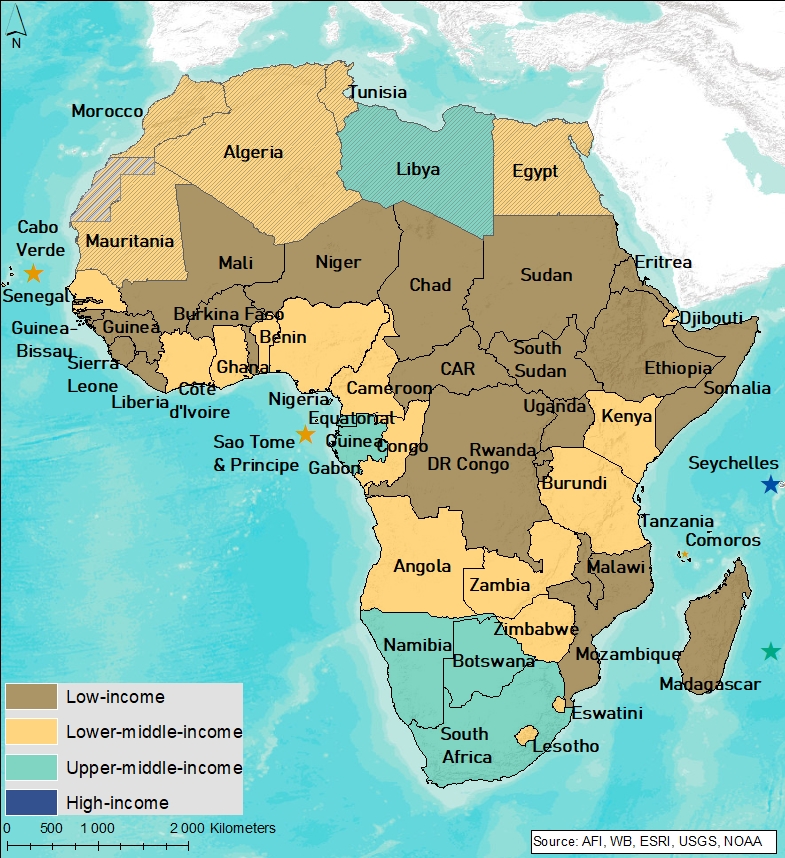
- Sub-Saharan Africa is geographically the area of the African continent that lies south of the Sahara Desert. It includes 48 countries of which 23 are low-income, 18 are lower middle-income, six are upper middle-income, and one is high-income, and excludes only the North African countries of Algeria, Egypt, Libya, Djibouti, Morocco, and Tunisia. Jump to forecast: Current Path
- Sub-Saharan Africa had a population of 1.109 billion people in 2019. Due to high fertility rates, the population is projected to grow by 78.2% to 1.976 billion in 2043. The youthful population under 15 years of age is very large and life expectancy in sub-Saharan Africa will grow to 73 years in 2043 with large variations between countries in the Current Path forecast. In 2019, life expectancy was highest in Mauritius (75 years) and lowest in Lesotho (51 years). Jump to Demographics: Current Path
- By 2043, sub-Saharan Africa will experience a rapid increase in the size of its economy to US$11.847 trillion and GDP per capita will reach US$5 996. Jump to Economics: Current Path
- The rate of poverty varies greatly across countries and regions: while in South Sudan, Burundi, CAR, Madagascar and the DR Congo, 7 in 10 people live in extreme poverty (at US$1.90 per day) in 2019, in Seychelles and Mauritius less than 1 in 100 lives in extreme poverty. Jump to Poverty: Current Path
- Sub-Saharan African countries emitted 256 million tons of carbon in 2019 — an amount that will almost triple to 650 million tons by 2043 in the Current Path forecast. In 2019, South Africa was the largest emitter at 132 million tons of carbon, followed by Nigeria at 39 million tons; the smallest emitter, São Tomé and Príncipe, only emitted 3 306 tons of carbon in 2019. Jump to Carbon emission/Energy: Current Path
Sectoral scenarios
- In the Stability scenario, the number of people in extreme poverty will decrease from 452.6 million people in 2019 to about 435.6 million people by 2043. Jump to Stability scenario
- The Demographic scenario could see sub-Saharan Africa reach its demographic dividend by 2043, eight years earlier than in the Current Path forecast. Jump to Demographic scenario
- Life expectancy will increase from 64.2 years in 2019 to 72.1 years by 2043 in the Health/WaSH scenario. Jump to Health/WaSH scenario
- The Agriculture scenario has the potential to reduce the net agricultural import dependency to 4.8% in 2043 from 7.8% in 2019; however, it is projected that sub-Saharan Africa will continue to be a net agricultural importer. Jump to Agriculture scenario
- The Education scenario will raise average GDP per capita to US$6 181 by 2043. Jump to Education scenario
- The Manufacturing/Transfers scenario will result in a 2.64 percentage point reduction in extreme poverty rates compared to the Current Path scenario, resulting in 52.6 million fewer people living in poverty by 2043. Jump to Manufacturing/Transfers scenario
- The Leapfrogging scenario has the potential to drastically improve electricity access from 44.8% in 2019 to 81.7% by 2043, 12.5 percentage points above the Current Path forecast. Jump to Leapfrogging scenario
- In the Free Trade scenario, GDP per capita is expected to increase to US$6 656 by 2043, compared to US$5 980 in the Current Path forecast. Jump to Free Trade scenario
- Foreign direct investment (FDI) inflows increase from 2024 onwards and represent 4.4% of GDP by 2043 in the Financial Flows scenario compared to the Current Path forecast at 3.9% of GDP in the same time period. Jump to Financial Flows scenario
- The Infrastructure scenario will positively influence rural accessibility, and by 2043 it is projected that 58% of the rural population will have access to an all-weather road compared to 56% in the Current Path scenario. Jump to Infrastructure scenario
- In the Governance scenario, the number of extremely poor people will reduce to 446.2 million people by 2043. Jump to Governance scenario
- In 2019, South Africa was the largest carbon emitter in sub-Saharan Africa, followed by Nigeria. Looking to 2043, Free Trade scenario is the most carbon-intensive scenario for sub-Saharan Africa, contributing 711 million tons of carbon. Jump to Carbon emissions/Energy: Current Path
Combined Agenda 2063 scenario
- By 2043, carbon emissions in sub-Saharan Africa will increase by an additional 221 million tons in the Combined Agenda 2063 scenario compared to the Current Path forecast, and the region will see a significant growth in GDP per capita, reaching US$9 798 per capita. Extreme poverty decreases drastically to 7.3% by 2043, compared to the Current Path forecast of 40.8%. Sub-Saharan Africa will experience significant economic growth reaching a GDP (MER) of US$12 295.2 billion by 2043. Jump to Combined Agenda 2063 scenario
All charts for Sub-Saharan Africa Development Futures
- Chart 1: Political map of Sub-Saharan Africa
- Chart 2: Population structure in CP, 1990–2043
- Chart 3: Urban and rural population in CP, 1990–2043
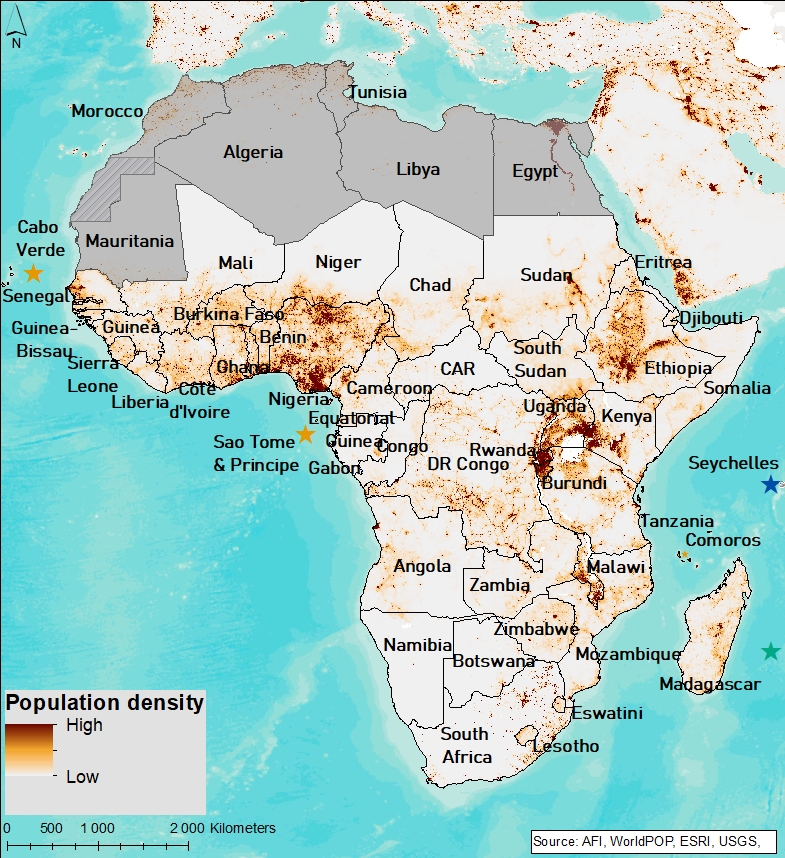
- Chart 4: Population density map for 2019
- Chart 5: GDP in CP, 1990–2043
- Chart 6: GDP per capita in CP, 1990–2043
- Chart 7: Informal sector value in CP, 2015–2043
- Chart 8: Value added by sector in CP, 2017–2043
- Chart 9: Agriculture production/demand in CP, 1990–2043
- Chart 10: Poverty in CP, 2017–2043
- Chart 11: Energy production by type in CP, 1990–2043
- Chart 12: Carbon emissions in CP, 1990–2043
- Chart 13: Governance security in CP and Stability scenario, 2019–2043
- Chart 14: GDP per capita in CP and Stability scenario, 2019–2043
- Chart 15: Poverty in CP and Stability scenario, 2019–2043
- Chart 16: Demographic dividend in CP and Demog scenario, 2019–2043
- Chart 17: Infant mortality in CP and Demog scenario, 2019–2043
- Chart 18: GDP per capita in CP and Demog scenario, 2019–2043
- Chart 19: Poverty in CP and Demog scenario, 2019–2043
- Chart 20: Life expectancy in CP and Health/WaSH scenario, 2019–2043
- Chart 21: Infant mortality in CP and Health/WaSH scenario, 2019–2043
- Chart 22: Yield/hectare in CP and Agric scenario, 2019–2043
- Chart 23: Agriculture imports in CP and Agric scenario, 2019–2043
- Chart 24: GDP per capita in the CP and Agric scenario, 2019–2043
- Chart 25: Poverty in CP and Agric scenario, 2019–2043
- Chart 26: Mean years of education in CP and Educ scenario, 2019–2043
- Chart 27: Education quality in CP and Educ scenario, 2019–2043
- Chart 28: GDP per capita in CP and Educ scenario, 2019–2043
- Chart 29: Poverty in CP and Educ scenario, 2019–2043
- Chart 30: Value added by sector in CP and Manufac/Transfers scenario, 2019–2043
- Chart 31: Gov welfare transfers in CP and Manufac/Transfers scenario, 2019–2043
- Chart 32: GDP per capita in CP and Manufac/Transfers scenario, 2019–2043
- Chart 33: Poverty in CP and Manufac/Transfers scenario, 2019–2043
- Chart 34: Fixed broadband access in CP and Leapfrogging scenario, 2019–2043
- Chart 35: Mobile broadband access in CP and Leapfrogging scenario, 2019–2043
- Chart 36: Electricity access in CP and Leapfrogging scenario, 2019–2043
- Chart 37: GDP per capita in CP and Leapfrogging scenario, 2019–2043
- Chart 38: Poverty in CP and Leapfrogging scenario, 2019–2043
- Chart 39: Trade balance in CP and Free Trade scenario, 2019–2043
- Chart 40: GDP per capita in CP and Free Trade scenario, 2019–2043
- Chart 41: Poverty in CP and Free Trade scenario, 2019–2043
- Chart 42: Foreign aid in CP and Financial Flows scenario, 2019–2043
- Chart 43: Inflow of FDI in CP and Financial Flows scenario, 2019–2043
- Chart 44: Remittances in CP and Financial Flows scenario, 2019–2043
- Chart 45: GDP per capita in CP and Financial Flows scenario, 2019–2043
- Chart 46: Poverty in CP and Financial Flows scenario, 2019–2043
- Chart 47: Electricity access in CP and Infrastructure scenario, 2019–2043
- Chart 48: Rural road access in CP and Infrastructure scenario, 2019–2043
- Chart 49: GDP per capita in CP and Infrastructure scenario, 2019–2043
- Chart 50: Poverty in CP and Infrastructure scenario, 2019–2043
- Chart 51: Gov effectiveness in CP and Governance scenario, 2019–2043
- Chart 52: GDP per capita in CP and Governance scenario, 2019–2043
- Chart 53: Poverty in CP and Governance scenario, 2019–2043
- Chart 54: Carbon emissions in CP and scenarios, 2019–2043
- Chart 55: GDP per capita in CP and scenarios, 2019–2043
- Chart 56: GDP per capita in CP and Combined scenario, 2019–2043
- Chart 57: Poverty in CP and Combined scenario, 2019–2043
- Chart 58: Value added by sector in CP and Combined scenario, 2019–2043
- Chart 59: GDP in CP and Combined scenario, 2019–2043
- Chart 60: Carbon emissions in CP and Combined scenario, 2019–2043


Sub-Saharan Africa Development Futures: Current Path
Download to pdfThis page provides an overview of the key characteristics of sub-Saharan Africa along its likely (or Current Path) development trajectory. The Current Path forecast from the International Futures forecasting (IFs) platform is a dynamic scenario that imitates the continuation of current policies and environmental conditions. The Current Path is therefore in congruence with historical patterns and produces a series of dynamic forecasts endogenised in relationships across crucial global systems. We use 2019 as a standard reference year and the forecasts generally extend to 2043 to coincide with the end of the third ten-year implementation plan of the African Union’s Agenda 2063 long-term development vision.
Sub-Saharan Africa is geographically the area of the African continent that lies south of the Sahara Desert. It consists of 48 countries of 23 low-income countries, 18 lower middle-income countries, six upper middle-income countries, and one high-income economy (the island state of Seychelles).
Within the regions used in this report, sub-Saharan Africa includes Southern, West, Central and East Africa, and excludes North Africa. Most of the subcontinent lies within the tropical climate, with 70% between the Tropic of Cancer and Tropic of Capricorn. Average temperatures are around 18 °C year round, except in the cooler upland zones and temperate Southern tip.
Seven of the eight regional economic organisations recognised by the African Union (AU) have members in sub-Saharan Africa: Economic Community of West African States (ECOWAS), Economic Community of Central African States (ECCAS), Common Market for Eastern and Southern Africa (COMESA), Community of Sahel-Saharan States (CEN-SAD), East African Community (EAC), Southern African Development Community (SADC), and Intergovernmental Authority on Development (IGAD). Membership to these organisations is not mutually exclusive and some states have multiple memberships.
Sub-Saharan Africa had a population of 1.106 billion people in 2019 — a 117.77% increase from 1990. In the Current Path forecast, it will further grow by 77.38% to 1.962 billion in 2043. The most populous countries in 2019 were Nigeria (203.8 million), Ethiopia (112.1 million), the Democratic Republic of the Congo (DR Congo) (86.9 million), South Africa (58.3 million) and Tanzania (58.1 million). The region has a young population. The cohort under 15 years of age is large at 43% and the under 30 cohort is at 28%. The median age in sub-Saharan Africa was 18.74 in 2019 and is expected to rise to 22.82 years in 2043 due to falling fertility rates and better healthcare.
As the fertility rate declines to 3.3 births per fertile woman, the under 15 group will decline to 34.8% while the elderly population (65 years and older) will grow by 1.5 percentage points to 57 million people in 2043, increasing the average life expectancy to 71.3 years.
Sub-Saharan Africa is predominantly rural with more than half the population of 31 out of its 48 countries living in rural areas, representing an average urbanisation rate of only 40.4 % in 2019. By 2043, 50.5% of sub-Saharan Africa’s population will live in urban areas and only 22 countries in the region will still be predominantly rural. At that point, the number of people living in urban areas will have more than doubled from 449 million in 2019 to 998 million.
The rapid increase in the urban population size is due to the natural population growth of existing urban settlements, reclassification of rural settlements to urban settlements and rural–urban migration. In contrast to other regions, the main drivers of rural–urban migration are dissatisfaction with public services in rural areas, changing weather patterns, land pressures, natural disasters and conflict.
In 2019, one-quarter of sub-Saharan Africa’s population lived in Nigeria and Ethiopia combined. Population density is highest in Mauritius at 6 259 people per hectare, Rwanda (at 5 113) and Comoros (at 4 602) and lowest in Mauritania at 44 people per hectare, Botswana (41) and Namibia (31).
The combined GDP of sub-Saharan Africa has nearly tripled from US$777.2 billion in 1990 to US$2 162.6 billion in 2019. The largest economies in 2019 were Nigeria (US$50.7 billion) and South Africa (US$503.69 billion), collectively constituting 49% of the GDP of sub-Saharan Africa. By 2043, their contribution will drop to 40% due to rapid economic growth in the size of the economies of Ethiopia, Angola, Tanzania, Uganda and Kenya. The three countries that will experience the most rapid economic growth by 2043 are Malawi, Ethiopia and Guinea Bissau, while Mauritius, South Africa and Seychelles, all coming off a much higher base, will grow the slowest.
Rapid economic growth in sub-Saharan Africa has been driven by large private and public investments. The past decade has seen an increasing number of Chinese infrastructure investments across the region which have helped spur economic growth significantly. In the Current Path forecast, GDP of the region will increase to US$6 760.2 billion in 2043.
The combined GDP of sub-Saharan Africa has nearly tripled from US$777.2 billion in 1990 to US$2 207.3 billion in 2019. The largest economies in 2019 were Nigeria (US$560.7 billion) and South Africa (US$503.7 billion), collectively constituting 49% of the GDP of sub-Saharan Africa. By 2043, their contribution will drop to 43% due to rapid economic growth in the size of the economies of Ethiopia, Angola, Tanzania, Uganda and Kenya. The three countries that will experience the most rapid economic growth by 2043 are Malawi, Ethiopia and Guinea Bissau, while Mauritius, South Africa and Seychelles, all coming off a much higher base, will grow the slowest.
Rapid economic growth in sub-Saharan Africa has been driven by large private and public investments. The past decade has seen an increasing number of Chinese infrastructure investments across the region which have helped spur economic growth significantly. In the Current Path forecast, GDP of the region will increase to US$6 221.7 billion in 2043.
Although many of the charts in the sectoral scenarios also include GDP per capita, this overview is an essential point of departure for interpreting the general economic outlook of sub-Saharan Africa.
Despite GDP nearly tripling between 1990 and 2019, GDP per capita has only grown by 31% due to rapid population growth. At US$3 897 in 2019, sub-Saharan Africa’s average GDP per capita was two-thirds of Africa’s average per capita GDP in 2019, when the GDP per capita ranged from US$30 673 in Seychelles to US$711 in Burundi.
The sustained growth in GDP per capita in sub-Saharan Africa was fuelled by both productivity growth as more and better infrastructure was built, and increased commodity exports. In the Current Path forecast, the average GDP per capita will grow by 45% from 2019 to US$5 671 in 2043.
Estimates on the contribution of the informal sector to GDP in 2019 range from 52.8% in Zimbabwe to 8.6% in Mauritius with the average level of informality of sub-Saharan Africa at 28.5%. By 2043, the informal sector will decline to 26.7% and reach a low of 3.9% in Mauritius, while in Tanzania it is expected to decline to 35.8%, respectively, while the average of the informal sector in sub-Saharan Africa will decline to 26.85%. In the same vein, the size of the labour force in the informal sector stood at 60% in 2019 and will only marginally decline to 54% in 2043.
The IFs platform uses data from the Global Trade and Analysis Project (GTAP) to classify economic activity into six sectors: agriculture, energy, materials (including mining), manufacturing, service and information and communication technologies (ICT). Most other sources use a threefold distinction between only agriculture, industry and services with the result that data may differ.
Generally, the service sector dominates in sub-Saharan Africa; it accounted for 54.9% (US$1 213.2 billion) of GDP in 2019 and will increase to 59.8% in 2043 (US$3 724.5). The economies with the largest service sectors in the region are Seychelles (76%), São Tomé and Príncipe (71%), and Mauritius (70%), while the least service-oriented economies are the resource-rich countries of the DR Congo (30%) and South Sudan (31%). Compared to South Asia, sub-Saharan Africa has a greater share of services at 6.5 and 5.5 percentage points higher in 2019 and 2043, respectively, as a result of its relatively low level of industrialisation.
In the Current Path forecast, the manufacturing sector overtakes the agriculture sector in its contribution to GDP from 2025. By 2043, agriculture contributes 6.3% to GDP and manufacturing 20.06%. The contribution from manufacturing to GDP is largest in Eswatini (35%), Côte d’Ivoire (25.9%) and Gabon (25%), while the share of manufacturing in Rwanda, Liberia and South Sudan is less than 5%. Then most agrarian economies are Chad and Sierra Leone with more than 40% of the GDP from the agriculture sector, unlike South Africa, Mauritius, Seychelles, Botswana with <5% from agriculture.
Materials share of GDP will increase marginally from 3.1% in 2019 to 4.3% in 2043, while manufacturing will increase by 0.9 percentage points from 2019 to 2043. The ICT sector will increase to 3.9% from 2.8% during the same period. All sectors will increase their share of GDP between 2019 and 2043 except agriculture which will shrink from 17% to 7.3%, respectively.
The data on agricultural production and demand in the IFs forecasting platform initialises from data provided on food balances by the Food and Agriculture Organization (FAO). IFs contains data on numerous types of agriculture but aggregates its forecast into crops, meat and fish, presented in million metric tons. Chart 9 shows agricultural production and demand as a total of all three categories.
In 2019, total agricultural demand exceeded production by 70.3 million metric tons — a gap that is expected to increase to 572 million metric tons by 2043. The sub-Saharan Africa region will, therefore, become increasingly food insecure, not only because of poor domestic production but also because of changes in dietary preferences.
Excess crop demand forms the greatest component of total excess food demand despite crops constituting 93% and 87% of total food production in 2019 and 2043, respectively. The greatest crop producers in 2019 were Nigeria (212.8 million metric tons), Ethiopia (57.1 million metric tons), the DR Congo (51.5 million metric tons) and Tanzania (51.2 million metric tons). Nigeria, Uganda and South Africa produce the greatest amounts of fish; the greatest meat producers are South Africa, Kenya and Ethiopia.
There are numerous methodologies for and approaches to defining poverty. We measure income poverty and use GDP per capita as a proxy. In 2015, the World Bank adopted the measure of US$1.90 per person per day (in 2011 international prices), also used to measure progress towards the achievement of Sustainable Development Goal (SDG) 1 of eradicating extreme poverty. To account for extreme poverty in richer countries occurring at slightly higher levels of income than in poor countries, the World Bank introduced three additional poverty lines in 2017:
- US$3.20 for lower middle-income countries
- US$5.50 for upper middle-income countries
- US$22.70 for high-income countries.
In 2019, nearly all (99.5%) of Africa’s extremely poor people live in sub-Saharan Africa, with 31 percentage points more poverty compared to South Asia. Because of its high rates of population growth and relatively slow economic growth, the number of extremely poor people (at US$1.90 per day) in the region will decrease from 441.9 million in 2019 to 395.2 million in 2043, although the poverty rate will decline significantly from 40.9% in 2019 to 23.7% in 2043. In 2019, the countries with the highest prevalence of poverty (at US$1.90 per day) in the region were Equatorial Guinea (83.2%), South Sudan (79.4%), Burundi (76.7%) and Central Africa Republic (73.9%), while those with the lowest poverty rates were Mauritius (1%) and Seychelles (1.3%).
Poverty will continue to be a problem in sub-Saharan Africa as a result of a host of issues including poor governance, weak institutional development, rapid population growth and high inequality in some quarters. With high inequality, as in South Africa, even sustained high rates of economic growth will only slowly translate into a reduction in poverty. The dynamics of high population growth and unemployment have played into the worsening of extreme poverty in Africa.
The IFs platform forecasts six types of energy, namely oil, gas, coal, hydro, nuclear and other renewables. To allow comparisons between different types of energy, the data is converted into billion barrels of oil equivalent (BBOE). The energy contained in a barrel of oil is approximately 5.8 million British thermal units (MBTUs) or 1 700 kilowatt-hours (kWh) of energy.
Energy production in sub-Saharan Africa will increase by 3.483 billion BBOE from 2019 to 2043. In 2019, the largest type of energy produced was oil (52.98%), followed by coal (27.01%) and gas (13.53%). Hydro and other renewable energy sources combined only contributed 6.48%.
Energy production in sub-Saharan Africa will shift away from traditional sources of energy (oil and coal) towards renewable energy such as hydro, wind and solar.
The largest oil producers are Nigeria (0.844 BBOE), Angola (0.648 BBOE) and South Sudan (0.106BBOE), while Nigeria (0.416 BBOE), Mozambique (0.035 BBOE) and Tanzania (0.03 BBOE). The traditional producers of coal are South Africa (1.046 BBOE), Mozambique (0.32 BBOE) and Zimbabwe (0.032 BBOE). Hydroelectricity producers are mainly Ethiopia (0.085 BBOA), Zambia (0.022 BBOE), the Republic of the Congo (0.013 BBOE) and Ghana (0.01 BBOE).
Carbon is released in many ways, but the three most important contributors to greenhouse gases are carbon dioxide (CO2), carbon monoxide (CO) and methane (CH4). Since each has a different molecular weight, IFs uses carbon. Many other sites and calculations use CO2 equivalent.
Carbon emissions will steadily increase in sub-Saharan Africa from 246 million metric tons in 2019 to 606 million tons in 2043 — more than 146% increase — due to rising economic activity and the surge in non-renewable energy production.
The largest emitters in the region are South Africa (132.1 million tons of carbon) — owing to its relatively high level of industrialisation — and the major oil producers Nigeria (39.3 million tons of carbon), Angola (12 million tons of carbon) and Sudan (6.5 million tons of carbon). By 2043, Nigeria will become the greatest emitter of carbon emissions in the region, overtaking South Africa. Due to the relatively low level of economic activity and industrialisation, sub-Saharan Africa contributed only 2.6% of world’s emission in 2019, which will increase to 6.2% in 2043.
Sectoral Scenarios for Sub-Saharan Africa Development Futures
Download to pdfThe Stability scenario represents reasonable but ambitious reductions in risk of regime instability and lower levels of internal conflict. Stability is generally a prerequisite for other aspects of development and this would encourage inflows of foreign direct investment (FDI) and improve business confidence. Better governance through the accountability that follows substantive democracy is modelled separately. The intervention is explained here in the thematic part of the website.
In 2019, the sub-Saharan African countries with the highest score on the governance security index were Mauritius, Seychelles and Cape Verde, while the countries that had the lowest score were Central African Republic (CAR), South Sudan, the DR Congo and Somalia, each with a score below 0.6. In the Current Path forecast, sub-Saharan Africa will improve its average score on the index from 0.67 in 2019 to 0.74 in 2043. The government security index in South Sudan, Sudan and CAR was below 0.6 in 2019.
In the Stability scenario, where interstate and internal conflicts in sub-Saharan Africa are reduced, the average governance security index will improve by 14% to 0.93 in 2043. The five countries that gain the most are CAR, South Sudan, Sudan, the DR Congo and Somalia. Seychelles, already very stable, gains the least.
The average GDP per capita will increase from US$3 897 in 2019 to US$5 671 in 2043 in the Current Path forecast as a result of productivity growth and more natural resources. Compared to the Current Path forecast for Africa in 2043, sub-Saharan Africa’s average GDP per capita in the Stability scenario will be US$5 987. South Sudan will increase its GDP per capita most (by 10%), while Seychelles only gains a 1% increase in GDP per capita.
In the Current Path forecast, the number of poor people will increase from 441.9 million in 2019 to 395.2 million in 2043, representing a 17.2 percentage points reduction in poverty rate between 2019 and 2043. In the Stability scenario, the number of poor people will reduce by 37.8 million more compared to the Current Path forecast in 2043, while the poverty rate will decline by 1.6 percentage points more. In 2019, the poverty rate in sub-Saharan Africa is 6.1% lower than in Africa. In the Stability scenario, this will decline 2.8% in 2043.
This section presents the impact of a Demographic scenario that aims to hasten and increase the demographic dividend through reasonable but ambitious reductions in the communicable-disease burden for children under five, the maternal mortality ratio and increased access to modern contraception.
The intervention is explained here in the thematic part of the website.
Demographers typically differentiate between a first, second and even a third demographic dividend. We focus here on the contribution of the size of the labour force (between 15 and 64 years of age) relative to dependants (children and the elderly) as part of the first dividend. A window of opportunity opens when the ratio of the working-age population to dependants is equal to or surpasses 1.7.
In 2019, the ratio of working-age persons to dependants for sub-Saharan Africa was only 1.2. In the Current Path forecast, the region only enters the demographic dividend in 2051, given the population momentum and its high fertility rates. In the Demographic scenario, sub-Saharan Africa gets to a ratio of 1.7 working-age persons to every dependant by 2043. Only eight countries in sub-Saharan Africa had entered a potential demographic dividend in 2019, namely Mauritius, Seychelles, Tunisia, Libya, Cabo Verde, Djibouti, Morocco and South Africa; this number increases to 13 countries in 2043. In the Demographic scenario, however, the number increases to 33 countries in 2043.
The infant mortality rate is the number of infant deaths per 1 000 live births and is an important marker of the overall quality of the health system in a country.
The average rate of infant mortality for sub-Saharan Africa in 2019 was 49.3 deaths per 1 000 live births, ranging from 81 deaths in CAR to 9.8 in Seychelles. CAR, South Sudan and Chad all had rates above 70 deaths per 1 000 live births in 2019. In the Current Path forecast, rates decline to 28.3 deaths per 1 000 live births by 2043, ranging from 44.5 in Chad and 41.1 in Nigeria to 8.7 in Mauritius and 5.4 in Seychelles. In the Demographic scenario, the sub-Saharan Africa rate declines to 22.8 in 2043. In the Demographic scenario, countries with the highest infant mortality rates will be Chad (at 35.7), Nigeria (at 32.6) and South Sudan (at 30.6).
By 2043, the Demographic scenario will increase average GDP per capita by US$190 compared to the Current Path forecast. The countries that gain the most percentage increase in GDP per capita by 2043 in the Demographic scenario are Malawi, Zimbabwe and Madagascar, while countries such as Botswana, Mauritius and Seychelles gain little since they are already in positive dividend territory.
Compared to the Current Path forecast, the Demographic scenario will reduce extreme poverty in the sub-Saharan Africa by 37,9 million people in 2043. Using the US$1.90 poverty line, the Demographic scenario will reduce extreme poverty in the subcontinent by 15 percentage points in 2043 compared to the Current Path forecast for that year, resulting in a poverty rate of 19.79%. Madagascar (−4.5 million), Nigeria (−5.9 million) and the DR Congo (−8.2 million) will experience the largest decline in numbers of extremely poor people by 2043.
This section presents reasonable but ambitious improvements in the Health/WaSH scenario, which include reductions in the mortality rate associated with both communicable diseases (e.g. AIDS, diarrhoea, malaria and respiratory infections) and non-communicable diseases (NCDs) (e.g. diabetes), as well as improvements in access to safe water and better sanitation. The acronym WaSH stands for water, sanitation and hygiene.
The intervention is explained here in the thematic part of the website.
In the Current Path forecast, life expectancy in sub-Saharan Africa will rise from 64.2 years in 2019 to 71.3 years in 2043, with some variations between countries. In 2019, life expectancy was highest in Mauritius (75.2 years), Seychelles (74.6 years), Cape Verde (74.2 years), and São Tomé and Príncipe (71.2 years); and lowest in Somalia (58.5 years) and CAR and Lesotho (51years). The world average in 2019 was 73.2 years, which will increase to 76.6 in 2043, implying that sub-Saharan Africa is slowly catching up. Whereas the gap between the global average and the average for sub-Saharan Africa was 9 years in 2019, by 2043 it will decline to 5.3 years.
Women tend to live longer than men. Whereas the average life expectancy for women globally was around 5 years longer than men in 2019, the difference in sub-Saharan Africa was only 3.4 years in 2019, slowly increasing to 4.1 years in 2043.
In the Health/WaSH scenario, sub-Saharan Africa will, on average, record an increase of less than a year (0.77) compared to the Current Path forecast in 2043, but with large country to country variations. Because of the rapid decline in deaths from AIDS, Lesotho will, by 2043, experience an increase of 2.2 years in life expectancy, followed by South Africa (1.8 years) and Nigeria (1.4 years). Senegal, Comoros and The Gambia will, on the other hand, experience the least improvement.
This section presents reasonable but ambitious improvements in the Health/WaSH scenario, which include reductions in the mortality rate associated with both communicable diseases (e.g. AIDS, diarrhoea, malaria and respiratory infections) and non-communicable diseases (NCDs) (e.g. diabetes), as well as improvements in access to safe water and better sanitation. The acronym WaSH stands for water, sanitation and hygiene.
The intervention is explained <here> in the thematic part of the website.
In the Current Path forecast, life expectancy in sub-Saharan Africa will rise from 64.2 years in 2019 to 71.3 years in 2043, with some variations between countries. In 2019, life expectancy was highest in Mauritius (75.2 years), Seychelles (74.6 years), Cape Verde (74.2 years), and São Tomé and Príncipe (71.2 years); and lowest in Somalia (58.5 years) and CAR and Lesotho (51years). The world average in 2019 was 73.2 years, which will increase to 76.6 in 2043, implying that sub-Saharan Africa is slowly catching up. Whereas the gap between the global average and the average for sub-Saharan Africa was 9 years in 2019, by 2043 it will decline to 5.3 years.
Women tend to live longer than men. Whereas the average life expectancy for women globally was around 5 years longer than men in 2019, the difference in sub-Saharan Africa was only 3.4 years in 2019, slowly increasing to 4.1 years in 2043.
In the Health/WaSH scenario, sub-Saharan Africa will, on average, record an increase of less than a year (0.77) compared to the Current Path forecast in 2043, but with large country to country variations. Because of the rapid decline in deaths from AIDS, Lesotho will, by 2043, experience an increase of 2.2 years in life expectancy, followed by South Africa (1.8 years) and Nigeria (1.4 years). Senegal, Comoros and The Gambia will, on the other hand, experience the least improvement.
The Agriculture scenario represents reasonable but ambitious increases in yields per hectare (reflecting better management and seed and fertiliser technology), increased land under irrigation and reduced loss and waste. Where appropriate, it includes an increase in calorie consumption, reflecting the prioritisation of food self-sufficiency above food exports as a desirable policy objective.
The intervention is explained here in the thematic part of the website.
The data on yield per hectare (in metric tons) is for crops but does not distinguish between different categories of crops.
In 2019, the average crop yield in sub-Saharan Africa was 3.7 metric tons, slightly below the average for Africa which was 3.9 tons per hectare. In the Current Path forecast, the yield for sub-Saharan Africa improves to 5.0 tons by 2043 and to 8.3 tons in the Agriculture scenario — a difference of almost 66%. In 2043, yield per hectare is forecast to be largest for Mauritius (57.79), Swaziland (44.64) and Rwanda (10.59) in the Current Path. Due to low rainfall, poor agri-tech adoption rate and poor soil conditions, Niger (1.033 million tons), Mauritania (1.273 million tons) and The Gambia (1.579 million tons) have the least yield in the Current Path forecast for 2043.
In the Current Path forecast, the contribution of agriculture to the GDP of sub-Saharan Africa declines from 14.5% in 2019 to 6.3% in 2043. In the Agriculture scenario, agriculture would still contribute almost 10.1% to GDP by 2043, and the sub-Saharan Africa region will produce 665.9 million metric tons more crops by 2043 compared to the Current Path forecast. The import dependence of sub-Saharan Africa is set to be reduced to 4.83% of demand by 2043 instead of the Current Path forecast of 34.58%. The subcontinent would therefore import US$401.9 billion less agricultural produce in 2043 than on the Current Path forecast.
Agriculture is a key sector in African economies. GDP per capita is forecasted to increase more rapidly in the Agriculture scenario than in the Current Path forecast; and in 2043, the region’s average GDP per capita is projected to increase by US$ 235 in the Agriculture scenario compared to the Current Path. However, in the Agriculture scenario, sub-Saharan Africa’s GDP per capita will fall short of the average world GDP per capita by almost US$16 559.
In the Current Path forecast, the number of poor people will decrease from 441.9 million people in 2019 to 395.2 million in 2043. In the Agriculture scenario, the number of poor people is forecasted to reduce to 316.2 million people in 2043, lifting 79 million people out of extreme poverty in 2043.
In the Current Path forecast, the proportion of the population in poverty is forecast to decline between 2019 and 2043, but at a slower rate than in the Agriculture scenario, where sub-Saharan Africa will reduce its poverty rate by 5.48 percentage points in 2043 compared to the Current Path forecast.
The Education scenario represents reasonable but ambitious improved intake, transition and graduation rates from primary to tertiary levels and better quality of education. It also models substantive progress towards gender parity at all levels, additional vocational training at secondary school level and increases in the share of science and engineering graduates.
The intervention is explained here in the thematic part of the website.
The mean years of adult education will increase from 6.2 in 2019 to 7.4 years in 2043 in the Current Path for sub-Saharan Africa. The increase in mean years of education is more rapid in the Education scenario, leading to an extra 7.2 months of adult education in the Education scenario compared to the Current Path in 2043. There is gender education inequality in sub-Saharan Africa in favour of male adults, who attain 8.4 months more education compared to the average female adult in the Current Path in 2043.
Quality education nurtures sound human capital and long-term economic growth of a country. The Education scenario will see modest improvement in education quality of secondary learners of 6.3 and 5.2 additional points for primary learners compared to the Current Path forecast in 2043. Average test scores are higher among the secondary learners than primary learners in the Education scenario. The average test scores for primary and secondary learners in the Education scenario in 2043 are lower than the average world test scores in Current Path in 2043. This means that the actualisation of the Education scenario will fall short of bringing sub-Saharan Africa on par with world average test scores in 2043.
The GDP per capita for sub-Saharan Africa will increase from US$3 897 in 2019 to US$5 671 in 2043 in the Current Path. In the Education scenario in 2043, GDP per capita will improve by US$188 compared to the Current Path forecast. Despite the improvement in the Education scenario, the average sub-Saharan African country’s GDP per capita is below the average in the Current Path forecast for the world at US$16 652 in 2043.
By 2043, the Education scenario will lift 42.7 million people out of extreme poverty compared to the Current Path GDP per capita. Meanwhile, in 2043 the Education scenario will reduce the poverty rate in sub-Saharan Africa by 1.9% percentage points compared to the Current Path. In the Education scenario, the poverty rate will fall to 21.8%, which is still more than three times the world average poverty rate of 6% in 2043.
The Manufacturing/Transfers scenario represents reasonable but ambitious manufacturing growth through greater investment in the economy, investments in research and development, and promotion of the export of manufactured goods. It is accompanied by an increase in welfare transfers (social grants) to moderate the initial increases in inequality that are typically associated with a manufacturing transition. To this end, the scenario improves tax administration and increases government revenues.
The intervention is explained here in the thematic part of the website.
Chart 30 should be read with Chart 8 that presents a stacked area graph on the contribution to GDP and size, in billion US$, of the Current Path economy for each of the sectors.
In the Manufacturing/Transfers scenario, the service sector will add the largest contribution to the economy of sub-Saharan Africa of US$407.1 billion compared to the Current Path — a 0.27 percentage point difference. In the distant second is the manufacturing sector which will add US$177.6 billion, or 0.51 percentage points, more to the economy in the Manufacturing/Transfers scenario compared to the Current Path forecast in 2043. The ICT sector will contribute US$46.98 million, or 0.06 percentage points, more to the economy in the Manufacturing/Transfers scenario compared to the Current Path forecast in 2043.
In the Current Path, the average government welfare transfers to households in sub-Saharan Africa will rise from US$82.8 billion in 2019 to US$277.8 billion in 2043. In the Manufacturing/Transfers scenario, these government welfare transfers will rise to US$416.3 billion by 2043, an increase of US$138.5 billion compared to the Current Path.
In 2019, the GDP per capita in sub-Saharan Africa was US$3 897, which was lower than the world average GDP per capita of US$17 734. In the Current Path, sub-Saharan Africa will increase its GDP per capita to US$5 671 in 2043. The GDP per capita in the Current Path is US$384 less than in the Manufacturing/Transfer scenario in 2043 due to greater investment, the promotion of manufacturing exports and better tax administration.
The Manufacturing/Transfers scenario will reduce the number of poor people to 376 million (21%) by 2043, down from 441.9 million in 2019. This scenario will result in a 4.86 percentage points reduction of extreme poverty compared to the Current Path forecast in 2043, which constitutes 65.9 million people being lifted out of extreme poverty.
The Leapfrogging scenario represents a reasonable but ambitious adoption of and investment in renewable energy technologies, resulting in better access to electricity in urban and rural areas. The scenario includes accelerated access to mobile and fixed broadband and the adoption of modern technology that improves government efficiency and allows for the more rapid formalisation of the informal sector.
The intervention is explained here in the thematic part of the website.
Fixed broadband includes cable modem Internet connections, DSL Internet connections of at least 256 KB/s, fibre and other fixed broadband technology connections (such as satellite broadband Internet, ethernet local area networks, fixed-wireless access, wireless local area networks, WiMAX, etc.).
Sub-Saharan Africa will increase its fixed broadband subscriptions by 24.6 per 100 people in the Current Path forecast from 2019 to 2043. In the Leapfrogging scenario, fixed broadband subscriptions increase to 45.3 per 100 people by 2043, representing 20.7 per 100 more subscriptions than in the Current Path forecast. In 2043, broadband subscriptions are projected to be greater in sub-Saharan Africa in the Leapfrogging scenario than the average for the world (40.4 per 100 people).
Mobile broadband refers to wireless Internet access delivered through cellular towers to computers and other digital devices.
Access to mobile broadband will increase more quickly than for fixed broadband, reaching saturation levels. In 2019, 30.1 out of every 100 persons in sub-Saharan Africa had a mobile broadband subscription. In the Current Path forecast, that ratio will increase to 92.9 by 2031 and in the Leapfrogging scenario it will reach 100 by 2028. Within IFs, broadband saturation is set at 150 subscriptions per 100 people. The Leapfrogging scenario will fall short of the broadband saturation point of 150 by 7.4 persons per 100 subscriptions in 2043.
In 2019, 503.3 million people in sub-Saharan Africa had access to electricity. In the Current Path forecast, that number will increase to 794.7 million people by 2030 and to 1 359.8 million by 2043. In the Leapfrogging scenario, 87.9 million more people will have access in 2030 and 248.2 million more in 2043.
In the Leapfrogging scenario, 12.7 percentage points more people in sub-Saharan Africa will be connected to electricity grids compared to the Current Path forecast. The SDG target for 2030 (Indicator 7.1.1) is 98% electricity access, and in the Leapfrogging scenario only Seychelles is projected to meet this target, while Comoros, Mauritius and Gabon will meet the target in 2033, 2036 and 2041, respectively.
Average urban electrification rates in sub-Saharan Africa were 76.4% in 2019 and are forecast to improve to 80% in 2030 and to 87.4% in the Current Path forecast. In the Leapfrogging scenario, urban electricity access improves to 92.9% in 2043. In 2019, the average rate of electricity access in sub-Saharan Africa was 7.7 percentage points below the African average — a gap that shrinks towards 2043.
Rural electricity access improves from 25.6% in 2019 to 41.1 % in 2030 (compared to 33.3% on the Current Path forecast) and to 70% in 2043 (compared to 50.7% on the Current Path) in the Leapfrogging scenario.
In 2019, GDP per capita was at US$3 897 and is forecast to increase to US$5 671 by 2043 in the Current Path forecast. In the Leapfrogging scenario, GDP per capita will increase by US$466 to US$6 137 in 2043 compared to the Current Path forecast. In the Leapfrogging scenario, GDP per capita in sub-Saharan Africa will be short of US$1 020 compared to the Current Path forecast for Africa in 2043.
In the Leapfrogging scenario, sub-Saharan Africa will experience a decline in the number of poor people by 18.9 million in 2030 and by 55.4 million by 2043. In 2019, 40.9% of the population of sub-Saharan Africa were living below US$1.90 per person per day, a number that will decline to 35.3% in 2030 and to 23.7% in 2043. In the Leapfrogging scenario, the rate will be 34.2% in 2030 and 21.1% in 2043 more.
The Free Trade scenario represents the impact of the full implementation of the African Continental Free Trade Area (AfCFTA) by 2034 through increases in exports, improved productivity and increased trade and economic freedom.
The intervention is explained here in the thematic part of the website.
The trade balance is the difference between the value of a country's exports and its imports. A country that imports more goods and services than it exports in terms of value has a trade deficit, while a country that exports more goods and services than it imports has a trade surplus.
In 2019, sub-Saharan Africa had a negative trade balance of −3.9% of GDP, which is expected to deteriorate to −9.4% by 2029 before it improves. The impact of the Free Trade scenario is to reduce this negative trade balance until around 2033. By 2043, the sub-Saharan Africa group would be exporting to the value of US$1 469 billion instead of US$1 475 billion in the Current Path and importing US$1 965 billion instead of US$1 857 billion.
The GDP per capita for sub-Saharan Africa was US$3 897 in 2019 and is set to increase to US$5 671 in the Current Path forecast. In the Free Trade scenario, it will increase by more than US$510 to US$6 181 in 2043. The countries that gain the most from the Free Trade scenario (percentage increase in GDP per capita by 2043) will be Malawi (20.43% improvement), Rwanda (9.06%) and Madagascar (16.26%). Gabon, Mauritius and Equatorial Guinea gain the least.
In the Current Path forecast, rates of extreme poverty (using US$1.90) in sub-Saharan Africa are set to decline from 40.9% in 2019 to 35.3% in 2030 and to 23.7% in 2043. In the Free Trade scenario, rates of extreme poverty start to decline from 2035 to 19.6% in 2043 — a difference of 4.03 percentage points.
In 2019, 441.9 million people were considered to be living on less than US$1.90 per person per day in sub-Saharan Africa. In the Current Path forecast, it will increase to 475 million in 2030 and decrease to 395.2 million in 2043. In the Free Trade scenario, extreme poverty in 2030 will decline to 478.2 million in 2043. The countries that gain the most in the decline in extreme poverty will be Tanzania (−5.8 million people), Nigeria (−12.1 million) and the DR Congo (−22 million).
The Financial Flows scenario represents a reasonable but ambitious increase in worker remittances and aid flows to poor countries, and an increase in the stock of foreign direct investment (FDI) and additional portfolio investment inflows to middle-income countries. We also reduced outward financial flows to emulate a reduction in illicit financial outflows.
The intervention is explained here in the thematic part of the website.
Most aid goes to low-income countries. In 2019, the sub-Saharan Africa group received US$65.81 billion net aid which will increase to US$89.39 billion in 2030 and to US$8104.54 in 2043 in the Current Path forecast. However, as a per cent of GDP, aid reduces from 2.9% of GDP to 2.7% in 2030 and to 1.7% in 2043 since the increases in aid do not keep up with the expansion of sub-Saharan African countries’ economies. As a result, in the Financial Flows scenario, aid constitutes 2.9% of GDP by 2030 and 1.8% by 2043. In 2030, sub-Saharan Africa will receive US$90 billion more aid in the Financial Flows scenario than in the Current Path forecast and US$37 billion more in 2043. By 2043 the region would, cumulatively, have received US$5.55 billion more aid in the Financial Flows scenario compared to the Current Path forecast. The increase is, however, not evenly distributed among countries. The upper middle-income countries of Gabon and Equatorial Guinea receive very little aid.
FDI typically goes to middle- and high-income countries rather than to low-income countries. In 2019, sub-Saharan Africa received FDI inflows equivalent to 2.7% of GDP that increased to 3.3 % by 2030 and to 3.9% in 2043. In the Financial Flows scenario, however, FDI inflows increase to 3.9% of GDP in 2030 and to 4.4% in 2043. As a per cent of GDP, the inflows of FDI are most significant in Seychelles, Liberia, Mozambique and São Tomé and Príncipe.
The amount of remittance to sub-Saharan Africa is set to increase to US$72.56 billion in 2043 in the Current Path forecast, up from just US$23.55 billion in 2019. In the Financial Flows scenarios, remittance flows will increase to US$86.66 billion — US$14.1 billion more than the value in 2043 in the Current Path forecast. This improvement in remittance receipt is represented by a 0.19 percentage point increase compared to the 2043 Current Path forecast of 1.17%. Perhaps unsurprising, Nigeria will experience the largest increase in remittances, with an additional US$9.65 billion in 2043. Some countries, particularly South Africa, Mauritius and Angola see their annual remittance outflows increase.
In 2019, the GDP per capita of sub-Saharan Africa was US$3 897, which was lower than the average GDP per capita for the world. In the Current Path forecast, sub-Saharan Africa will increase its GDP per capita to US$5 671 — US$16 674 lower than the world average GDP per capita in 2043. In the Financial Flows scenario, GDP per capita increases to US$5 775 in 2043, mainly due to remittances and aid flows to Africa. In 2043, Seychelles will benefit the most from the Financial Flows scenario by increasing its GDP per capita by US$28 381 above the Current Path forecast, followed by Mauritius at US$24 064, while Central African Republic (CAR) and Burundi will benefit the least at US$-4 088 and US$-4 404, respectively.
Trade openness will reduce poverty in the long term after initially increasing it due to the redistributive effects of trade. Most African countries export primary commodities and low-tech manufacturing products, and therefore a continental free trade agreement (AfCFTA) that reduces tariffs and non-tariff barriers across Africa will increase competition among countries in primary commodities and low-tech manufacturing exports. Countries with inefficient, high-cost manufacturing sectors might be displaced as the AfCFTA is implemented, thereby pushing up poverty rates. In the long term, as the economy adjusts and produces and exports its comparatively advantaged (lower relative cost) goods and services, poverty rates will decline.
While the poverty rate reduces from 40.9% to 23.7% in sub-Saharan Africa, the number of poor people will decrease from 441.9 million to 395.2 million. In the Financial Flows scenarios, the poverty rate declines marginally (1%) more than the Current Path amounting to 21.6 million fewer people in poverty by 2043. The poverty reduction as a result of free trade is due to an increase in productivity, trade and economic freedom. Despite the significant gains in the Free Trade scenario, poverty rates will remain higher in sub-Saharan Africa compared to the average of the rest of the world. Within the region, the Free Trade scenario will benefit the DR Congo the most by reducing poverty by 12.7 percentage points compared to the Current Path forecast in 2043, followed by Madagascar at 11.7 percentage points, whereas Mauritius (−0.01) and Burundi (−9.3) will see an increase in poverty above the Current Path forecast.
The Infrastructure scenario represents a reasonable but ambitious increase in infrastructure spending across Africa, focusing on basic infrastructure (roads, water, sanitation, electricity access and ICT) in low-income countries and increasing emphasis on advanced infrastructure (such as ports, airports, railway and electricity generation) in higher-income countries.
Note that health and sanitation infrastructure is included as part of the Health/WaSH scenario and that ICT infrastructure and more rapid uptake of renewables are part of the Leapfrogging scenario. The interventions there push directly on outcomes, whereas those modelled in this scenario increase infrastructure spending, indirectly boosting other forms of infrastructure, including those supporting health, sanitation and ICT.
The intervention is explained here in the thematic part of the website.
By 2043, 856.5 million more people will have access to electricity in the Current Path forecast, and this number is set to increase to 923 million people in the Infrastructure scenarios in 2043. The proportion of the population that will have access to electricity will increase from 45.5% to 69.1 %in the Current Path forecast in 2043. In the Infrastructure scenario, sub-Saharan Africa will add an additional 3.3 percentage points more to electricity grids compared to the Current Path in 2043.
Indicator 9.1.1 in the Sustainable Development Goals refers to the proportion of the rural population who live within 2 km of an all-season road and is captured in the Rural Access Index.
The proportion of all-season road access in sub-Saharan Africa is set to increase from 53.8% to 59.5% from 2019 to 2043 in the Current Path. In the Infrastructure scenario, 1.6 percentage points more of the rural population will have access to all-season roads compared to the 2043 Current Path value. Within the region, the effect of the Infrastructure scenario is greatest in the Republic of the Congo, where it adds an additional 6.4 percentage points of rural population that live within 2 km of an all-season road compared to the Current Path forecast in 2043. Equatorial Guinea and Seychelles will already have 100% rural access by 2043 in the Current Path forecast.
In 2019, the GDP per capita in sub-Saharan Africa was US$3 897, which was lower than the world average GDP per capita of US$17 734. In the Current Path forecast, sub-Saharan Africa will increase its GDP per capita to US$5 671, lower than the world average GDP per capita of US$22 323 in 2043. In the Infrastructure scenario, GDP per capita increases to US$5 773 in 2043, adding US$102 to the Current Path value.
In the Current Path forecast, the poverty rate (at the US$1.90 poverty line) in sub-Saharan Africa is set to reduce from 40.9% to 23.7% from 2019 to 2043. Because of the rapidly increasing population of the region, the number of poor people will however decrease from 441.9 million to 395.2 million people. In the Infrastructure scenario, the poverty rate will decline marginally (2.02%) amounting to 8 million fewer people living in extreme poverty compared to the Current Path in 2043. Despite the significant gains in the Infrastructure scenario due to more trade and higher productivity, poverty rates will remain higher in sub-Saharan Africa compared to the average rate of poverty in the rest of Africa by 2043. The Infrastructure scenario will result in a 3.2 percentage point reduction in extreme poverty (at the US$1.90 poverty line) in Zambia and Madagascar above the Current Path forecast, while in Equatorial Guinea the effect is a trivial 0.01 percentage points.
The Governance scenario represents a reasonable but ambitious improvement in accountability and reduces corruption, and hence improves the quality of service delivery by government.
The intervention is explained here in the thematic part of the website.
As defined by the World Bank, government effectiveness ‘captures perceptions of the quality of public services, the quality of the civil service and the degree of its independence from political pressures, the quality of policy formulation and implementation, and the credibility of the government’s commitment to such policies’.
Chart 51 presents the impact of the interventions in the Governance scenario on government effectiveness.
In the Governance scenario, government effectiveness will improve by 5% in the region in 2043. However, an average sub-Saharan African country's government will still be less effective compared to the average score of the world (2.9) in 2043. Coming from a very low base, South Sudan gains most in this scenario, while Seychelles, Cape Verde and Mauritius make negligible gains since government effectiveness in these countries is already high.
In 2019, the GDP per capita in sub-Saharan Africa was US$3 897, which was lower than the world average GDP per capita of US$7 048. In the Current Path forecast, sub-Saharan Africa will increase its GDP per capita to US$5 980 in 2043. In the Governance scenario, GDP per capita will increase to US$6 145 in 2043 due to reduced corruption and more efficient service delivery across Africa. Angola, Eswatini, Equatorial Guinea and Namibia all increase GDP per capita by more than US$300 per person. However, CAR, Liberia, Burundi and Somalia gain least.
While the poverty rate reduces from 40.9% to 23.7%, the number of poor people in sub-Saharan Africa is set to increase from 441.9 million to 395.2 million people between 2019 and 2043. As in the Financial Flows scenario, the poverty rate declines marginally (1.01%) more than the Current Path to 22.7% in 2043 in the Governance scenario. This amounts to 20.8 million fewer people in poverty compared to the Current Path forecast in 2043.
This section presents projections for carbon emissions in the Current Path for sub-Saharan Africa and the 11 scenarios. Note that IFs uses carbon equivalents rather than CO2 equivalents.
In 2019, the sub-Saharan Africa region released only 246 million tons of carbon and on the Current Path forecast will release 606 million tons of carbon in 2043, the result of sustained economic and population growth in all the states in the region. In 2019, the largest emitters in the region were South Africa at 132.09 million tons, followed by Nigeria at 39.31 million tons, while Comoros and São Tomé and Príncipe emitted the least.
The Free Trade scenario is the most carbon-intensive scenario for sub-Saharan Africa, contributing 649 million tons of carbon; while in the Demographic scenario, carbon emissions in 2043 will be below the Current Path forecast (at 599 million tons).
The Combined Agenda 2063 scenario consists of the combination of all 11 sectoral scenarios presented above, namely the Stability, Demographic, Health/WaSH, Agriculture, Education, Manufacturing/Transfers, Leapfrogging, Free Trade, Financial Flows, Infrastructure and Governance scenarios. The cumulative impact of better education, health, infrastructure, etc. means that countries get an additional benefit in the integrated IFs forecasting platform that we refer to as the synergistic effect. Chart 55 presents the contribution of each of these 12 components to GDP per capita in the Combined Agenda 2063 scenario as a stacked area graph.
In 2019, average GDP per capita in sub-Saharan Africa was US$3 948. In the Current Path forecast, this will increase to US$5 980 in 2043. In the Combined Agenda 2063 scenario, GDP per capita will increase to US$9 798 in 2043, which is 58% more than the Current Path forecast for that year.
By 2033, the end of the second ten-year implementation plan of Agenda 2063, the Agriculture scenario provides the largest increase in GDP per capita of sub-Saharan Africa, followed by Leapfrogging, Manufacturing/Transfers and Free Trade scenarios. By 2043, the Free Trade scenario provides the largest increase in GDP per capita, followed by the Leapfrogging, Manufacturing/Transfers and Agriculture scenarios
Whereas Chart 55 presents a stacked area graph on the contribution of each scenario to GDP per capita as well as the additional benefit or synergistic effect, Chart 56 presents only the GDP per capita in the Current Path forecast and the Combined Agenda 2063 scenario.
In 2019 the GDP per capita of sub-Saharan Africa was US$3 948 and will increase to US$5 980 in 2043. In the Combined Agenda 2063 scenario, GDP per capita will increase to US$9 798 in 2043, however, this is half of world average GDP per capita in the Current Path. In 2043, the Combined Agenda 2063 scenario will benefit Eswatini the most by adding US$8 432 to its GDP per capita above the Current Path forecast, followed by Namibia which adds US$8 297; and at the same time Burundi, which benefit the least, will add less than US$1 000 to its GDP per capita above the Current Path forecast in that year.
The poverty rate (at US $1.90 poverty line) in sub-Saharan Africa will reduce from 40.80% to 23.62%, and the number of poor people will reduce from 452.6 million to 466.6 million people between 2019 and 2043 respectively. In the Combined Agenda 2063 scenario, the extreme poverty rate is forecast to decline significantly to 7.3%, lower than the Current Path average world poverty rate in 2043. This will amount to 299.3 million fewer people in poverty compared to the Current Path in 2043. Extreme poverty (at US$1.90) will be significantly reduced by 2043 in the Combined Agenda 2063 as much as 50 percentage points below the Current Path forecast in Madagascar and 40 percentage points in Burundi. In Mauritius, where the extreme poverty at US$1.90 rate is already low, the Combined Agenda 2063 scenario will only reduce poverty by 0.021 percentage points below the Current Path forecast in 2043.
See Chart 8 to view the Current Path forecast of the sectoral composition of the economy.
In sub-Saharan Africa, only the service and ICT sectors made a positive percentage point difference of 4.1 and 0.58, respectively, while all other sectors made a negative percentage point difference, the least being manufacturing of −2 percentage point. In terms of the value of contribution, services’ contribution to GDP will increase in the Combined Agenda 2063 scenario by US$3 693 billion followed by manufacturing with US$905.8 billion; the smallest increase to GDP is in the energy sector with US$57.1 billion.
In the Current Path forecast, sub-Saharan Africa’s economy is expected to grow from US$2 162.6 billion to US$6 760.2 billion in 2043. Moreover, in the Combined Agenda 2063 scenario, the economy of sub-Saharan Africa will increase to US$12 295.2 billion, nearly double the Current Path value. The GDP of sub-Saharan Africa by 2043 in the Combined Agenda 2063, amounts to 141% and 81% of the Current Path forecast and Agenda 2063 scenario value for Africa, respectively.
In the Combined Agenda 2063 scenario, sub-Saharan Africa will release 892 million tons of carbon in 2043 compared to 650 million tons in the Current Path forecast. In 2019, sub-Saharan Africa released only 256 million tons of carbon, with South Africa (132 million), Nigeria (39 million tons) and Angola (12 million tons) the largest emitters. South Africa alone contributed more than half of sub-Saharan Africa’s carbon emissions in 2019. Nigeria will be the greatest emitter in 2043 followed by South Africa and then Angola in the Current Path forecast.
Page information
Contact at AFI team is Mustapha Jobarteh
This entry was last updated on 28 May 2026 using IFs7.63.
Donors and sponsors


Reuse our work
- All visualizations, data, and text produced by African Futures are completely open access under the Creative Commons BY license. You have the permission to use, distribute, and reproduce these in any medium, provided the source and authors are credited.
- The data produced by third parties and made available by African Futures is subject to the license terms from the original third-party authors. We will always indicate the original source of the data in our documentation, so you should always check the license of any such third-party data before use and redistribution.
- All of our charts can be embedded in any site.
Cite this research
Mustapha Jobarteh (2026) Sub-Saharan Africa Development Futures. Published online at futures.issafrica.org. Retrieved from https://futures.issafrica.org/geographic/regions/sub-saharan-africa/ [Online Resource] Updated 28 May 2026.