 IGAD
IGAD
Feedback welcome
Our aim is to use the best data to inform our analysis. See our Technical page for information on the IFs forecasting platform. We appreciate your help and references for improvements via our feedback form.
Please note: This regional report was developed using African Futures’ previous analytical framework, which organised the assessment across 11 sectoral scenarios. We have since updated and streamlined the analytical architecture to 8 sectoral scenarios. While the two frameworks remain broadly aligned, the current structure improves consistency, comparability and integration across themes and geographic studies. This page will therefore be updated to the current framework in due course. Read more about our analytical framework on the Technical Page.
In this entry, we first describe the Current Path forecast for the Intergovernmental Authority on Development (IGAD) as it is expected to unfold to 2043, the end of the third ten-year implementation plan of the African Union’s Agenda 2063 long-term vision for Africa. The Current Path in the International Futures (IFs) forecasting model initialises from country-level data that is drawn from a range of data providers. We prioritise data from national sources.
The Current Path forecast is divided into summaries on demographics, economics, poverty, health/WaSH and climate change/energy. A second section then presents a single positive scenario for potential improvements in stability, demographics, health/WaSH, agriculture, education, manufacturing/transfers, leapfrogging, free trade, financial flows, infrastructure, governance and the impact of various scenarios on carbon emissions. With the individual impact of these sectors and dimensions having been considered, a final section presents the impact of the Combined Agenda 2063 scenario.
We generally review the impact of each scenario and the Combined Agenda 2063 scenario on gross domestic product (GDP) per person and extreme poverty except for Health/WaSH that uses life expectancy and infant mortality.
The information is presented graphically and supported by brief interpretive text.
All US$ numbers are in 2017 values.
Executive Summary
- Current Path forecast
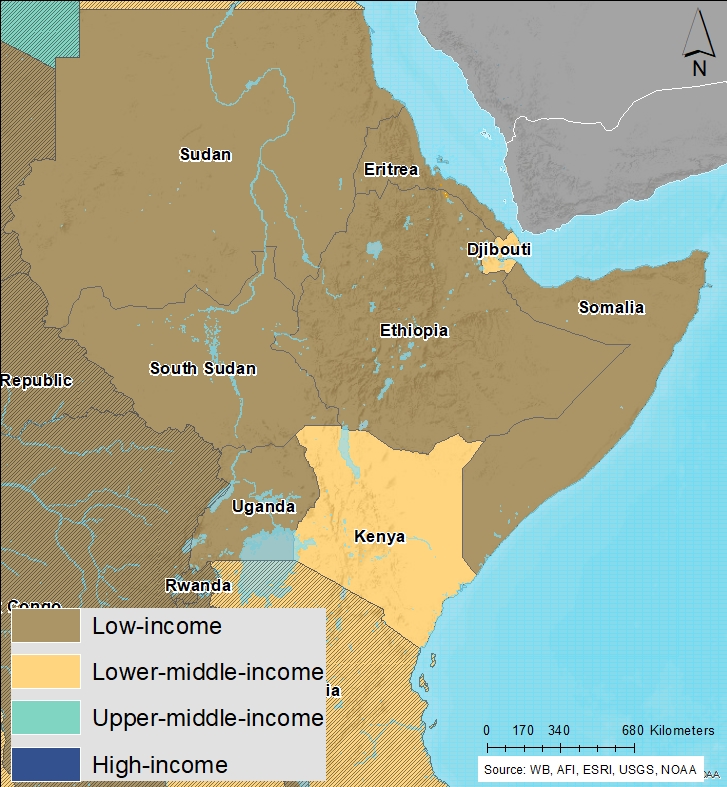
- The Intergovernmental Authority on Development (IGAD) trade bloc was formed in 1996. Six of the eight members, Ethiopia, Eritrea, Kenya, Somalia, Sudan and Uganda, are classified as low-income countries, while Djibouti and Kenya are classified as lower middle-income countries. Jump to forecast: Current Path
- IGAD’s total population size was 281.7 million in 2019, and it will increase to 483.7 million people by 2043. The composition of IGAD’s population will become more mature from 2019 to 2043: whereas 59% of the population were aged above 15 years in 2019, 67% will fall in this age bracket by 2043. Jump to Demographics: Current Path
- The size of IGAD’s economy was US$274.7 billion in 2019, and over the forecast horizon the regional economic community (REC) will see a marked increase in the scale of its economic activity as its GDP rises by 381.3% to reach US$1 322.2 billion. Jump to Economics: Current Path
- In 2019, 88 million people, constituting 31% of IGAD’s total population, were classified as extremely poor, but by 2043 the poverty rate will decreased to 8.3% and the poor population will be reduced to 40 million people. Jump to Poverty: Current Path
- IGAD produced 16 million tons of carbon in 2019, and by 2043 it will emit 62 million tons of carbon, an increase of 288% compared to 2019. Jump to Carbon emissions/Energy: Current Path
- Sectoral scenarios
- IGAD’s governance security index score rises from 0.66 in 2019 to 0.84 in 2043 in the Stability scenario — a 15% improvement compared to the Current Path forecast for 2043. Jump to Stability scenario
- IGAD will attain its demographic dividend in 2038 in the Demographic scenario, reaching a ratio of 1.96 working-age persons to each dependent compared to the Current Path forecast of 1.67 in 2043. Jump to Demographic scenario
- IGAD’s infant mortality rate is projected to be 16.2 deaths per 1 000 live births by 2043 in the Health/WaSH scenario, 1.6 deaths lower than the Current Path forecast and 25.5 deaths lower than in 2019. The REC’s infant mortality rate will be 9.4 deaths below Africa’s Current Path forecast average in 2043, an increase from the gap of 5.1 in 2019. Jump to Health/WaSH scenario
- The Agriculture scenario has a significant impact on IGAD’s GDP per capita: in 2043, GDP per capita will be US$309, or 5.8%, higher than the Current Path forecast for the same year. As a result, average incomes will rise from US$2 406 in 2019 to US$5 622 by 2043, an increase of 134%. Jump to Agriculture scenario
- The 2019 average of IGAD’s mean years of adult education was 5 years, improving to 6.7 years by 2043 in the Current Path forecast and to 7.1 years in the Education scenario. Jump to Education scenario
- Transfers to unskilled workers totalled US$11.6 billion in 2019 in the region, and in the Manufacturing/Transfers scenario, IGAD will see a 53% increase in these welfare transfers compared to the Current Path forecast for 2043, reaching US$271.4 billion. Jump to Manufacturing/Transfers scenario
- In 2019, Africa’s total electricity access stood at 53.2% of the total population, 6.4 percentage points higher than IGAD’s average for the same year. In the Leapfrogging scenario, the region’s average rate of access reaches 91.5% by 2043, 18.8 percentage points higher than Africa’s Current Path forecast. Jump to Leapfrogging scenario
- IGAD’s GDP per capita is projected to rise considerably in the Free Trade scenario, the most of all the 11 scenarios discussed: by 2043, the REC’s GDP per capita will be US$5 974, an increase of US$661 above the Current Path forecast. Jump to Free Trade scenario
- IGAD’s average dependence on foreign aid in 2019 (5.1% of GDP) was above Africa’s average of 2.4% of GDP. In the Financial Flows scenario, IGAD’s aid inflows will decline to 1.8% in 2043. Jump to Financial Flows scenario
- IGAD’s Rural Access Index score was 50.6% in 2019, and the Infrastructure scenario helps to boost this figure to 62.7% by 2043 — 2.8 percentage points higher than the Current Path forecast. The REC’s score will place it 3.6 percentage points above Africa’s Current Path forecast average score by 2043. Jump to Infrastructure scenario
- In 2019, the REC only scored 1.3 out of 5, 1.5 points below the average for the world without Africa. The Governance scenario helps IGAD to improve, raising the REC’s score to 2 by 2043 — 1.1 points below that of the world without Africa. Jump to Governance scenario
- The Free Trade scenario increases the REC’s carbon emissions the most by 2043, with an increase of 10 million tons of carbon, while the Leapfrogging scenario decreases IGAD’s carbon emissions by 13 million tons of carbon but increases the REC’s GDP the most above the Current Path forecast for 2043. Jump to Impact of scenarios on carbon emissions
- Combined Agenda 2063 scenario Jump to Combined Agenda 2063 scenario
- The combined effect of implementing all 11 scenarios’ interventions is impressive, potentially raising IGAD’s GDP per capita by US$3 416 compared to the Current Path forecast for 2043 — an increase of 64.3%.
- The Combined Agenda 2063 scenario envisages a remarkable decrease in IGAD’s poverty rate and the size of its poor population as the REC’s poverty rate will drop by 6.6 percentage points compared to the Current Path forecast for 2043 — this decline means that IGAD could eliminate poverty by 2041.
- The Combined Agenda 2063 scenario builds on the Current Path trend as the economy will be 78.3% larger by 2043 in the scenario compared to the Current Path forecast, an increase of US$1 035.5 billion. The remarkable growth envisaged by the scenario means the REC’s GDP will equate to US$2 357.7 billion by 2043.
All charts for IGAD Development Futures
- Chart 1: Political map of IGAD
- Chart 2: Population structure in CP, 1990–2043
- Chart 3: Urban and rural population in CP, 1990–2043
-
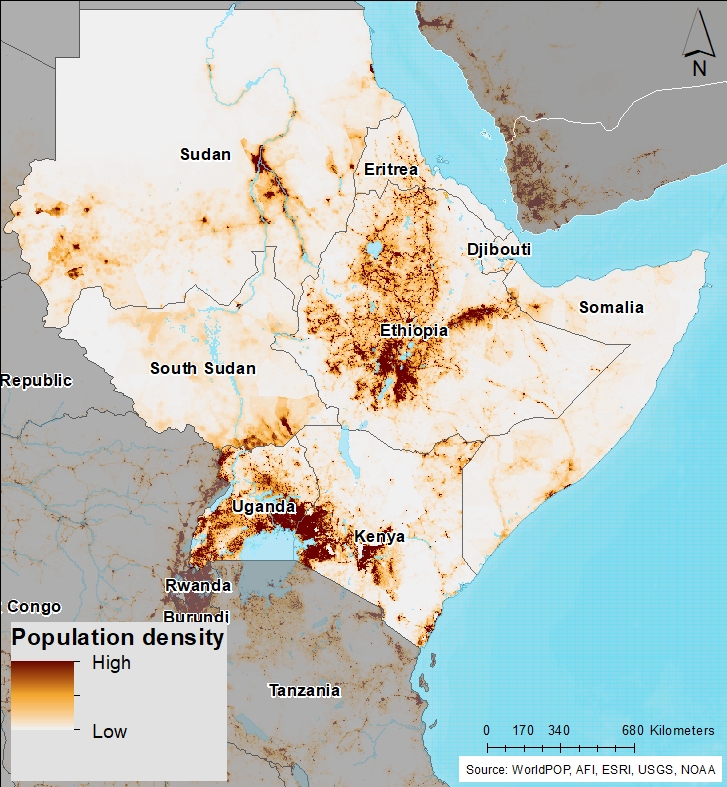
Chart 4: Population density for 2019
Chart 4: Population density for 2019
 Source: African Futures
 - Chart 5: GDP in CP, 1990–2043
- Chart 6: GDP per capita in CP, 1990–2043
- Chart 7: Informal sector value in CP, 2015–2043
- Chart 8: Value added by sector in CP, 2015–2043
- Chart 9: Agriculture production/demand in CP, 1990–2043
- Chart 10: Poverty in CP, 2015–2043
- Chart 11: Energy production by type in CP, 1990–2043
- Chart 12: Carbon emissions in CP, 1990–2043
- Chart 13: Governance security in CP and Stability scenario, 2019–2043
- Chart 14: GDP per capita in CP and Stability scenario, 2019–2043
- Chart 15: Poverty in CP and Stability scenario, 2019–2043
- Chart 16: Demographic dividend in CP and Demog scenario, 2019–2043
- Chart 17: Infant mortality in CP and Demog scenario, 2019–2043
- Chart 18: GDP per capita in CP and Demog scenario, 2019–2043
- Chart 19: Poverty in CP and Demog scenario, 2019–2043
- Chart 20: Life expectancy in CP and Health/WaSH scenario, 2019–2043
- Chart 21: Infant mortality in CP and Health/WaSH scenario, 2019–2043
- Chart 22: Yield/hectare in CP and Agric scenario, 2019–2043
- Chart 23: Agriculture imports in CP and Agric scenario, 2019–2043
- Chart 24: GDP per capita in the CP and Agric scenario, 2019–2043
- Chart 25: Poverty in CP and Agric scenario, 2019–2043
- Chart 26: Mean years of education in CP and Educ scenario, 2019–2043
- Chart 27: Education quality in CP and Educ scenario, 2019–2043
- Chart 28: GDP per capita in CP and Educ scenario, 2019–2043
- Chart 29: Poverty in CP and Educ scenario, 2019–2043
- Chart 30: Value added by sector in CP and Manufac/Transfers scenario, 2019–2043
- Chart 31: Gov welfare transfers in CP and Manufac/Transfers scenario, 2019–2043
- Chart 32: GDP per capita in CP and Manufac/Transfers scenario, 2019–2043
- Chart 33: Poverty in CP and Manufac/Transfers scenario, 2019–2043
- Chart 34: Fixed broadband access in CP and Leapfrogging scenario, 2019–2043
- Chart 35: Mobile broadband access in CP and Leapfrogging scenario, 2019–2043
- Chart 36: Electricity access in CP and Leapfrogging scenario, 2019–2043
- Chart 37: GDP per capita in CP and Leapfrogging scenario, 2019–2043
- Chart 38: Poverty in CP and Leapfrogging scenario, 2019–2043
- Chart 39: Trade balance in CP and Free Trade scenario, 2019–2043
- Chart 40: GDP per capita in CP and Free Trade scenario, 2019–2043
- Chart 41: Poverty in CP and Free Trade scenario, 2019–2043
- Chart 42: Foreign aid in CP and Financial Flows scenario, 2019–2043
- Chart 43: Inflow of FDI in CP and Financial Flows scenario, 2019–2043
- Chart 44: Remittances in CP and Financial Flows scenario, 2019–2043
- Chart 45: GDP per capita in CP and Financial Flows scenario, 2019–2043
- Chart 46: Poverty in CP and Financial Flows scenario, 2019–2043
- Chart 47: Electricity access in CP and Infrastructure scenario, 2019–2043
- Chart 48: Rural road access in CP and Infrastructure scenario, 2019–2043
- Chart 49: GDP per capita in CP and Infrastructure scenario, 2019–2043
- Chart 50: Poverty in CP and Infrastructure scenario, 2019–2043
- Chart 51: Gov effectiveness in CP and Governance scenario, 2019–2043
- Chart 52: GDP per capita in CP and Governance scenario, 2019–2043
- Chart 53: Poverty in CP and Governance scenario, 2019–2043
- Chart 54: Carbon emissions in CP and scenarios, 2019–2043
- Chart 55: GDP per capita in CP and scenarios, 2019–2043
- Chart 56: GDP per capita in CP and Combined scenario, 2019–2043
- Chart 57: Poverty in CP and Combined scenario, 2019–2043
- Chart 58: Value added by sector in CP and Combined scenario, 2019–2043
- Chart 59: GDP in CP and Combined scenario, 2019–2043
- Chart 60: Carbon emissions in CP and Combined scenario, 2019–2043


This page provides an overview of the key characteristics of IGAD along its likely (or Current Path) development trajectory. The Current Path forecast from the International Futures forecasting (IFs) platform is a dynamic scenario that imitates the continuation of current policies and environmental conditions. The Current Path is therefore in congruence with historical patterns and produces a series of dynamic forecasts endogenised in relationships across crucial global systems. We use 2019 as a standard reference year and the forecasts generally extend to 2043 to coincide with the end of the third ten-year implementation plan of the African Union’s Agenda 2063 long-term development vision.
The Intergovernmental Authority on Development (IGAD) trade bloc was formed in 1996 and replaced the previously formed Intergovernmental Authority on Drought and Development (IGADD) formed in 1986. The original members of IGAD were Djibouti, Ethiopia, Kenya, Somalia, Sudan and Uganda, with Eritrea joining in 1993 and South Sudan joining IGAD in 2011. IGAD consists of eight member states, all located in East Africa, with six members, Ethiopia, Eritrea, Somalia, Sudan, South Sudan and Uganda classified as low-income countries, while Djibouti and Kenya are classified as lower middle-income countries. IGAD faces the same problem as all regional economic communities (RECs) in Africa, namely overlapping membership of member states, which dilutes autonomy and hampers effective intra-REC trade. In December 2025 Eritrea delivered a Note Verbale to the IGAD Secretariate noting its decision to withdraw from the organisation. Eritrea had previously self suspended its participation for nearly two decades before formally rejoining in 2023 but did not participate in IGAD meetings, programmes or activities.
IGAD’s total population size of 124.7 million in 1990, more than doubled to reach 281.7 million by 2019, with annual population growth rate staying above 2.6% across this period. The rate of growth will gradually decline to 2043, as the REC’s total population size rises to 483.7 million people with the growth rates dipping below 2% from 2039. Ethiopia had the largest population size in 2019 constituting about 40% of IGAD’s population, and will see rapid growth to 2043, while other members such as Kenya, Uganda and Sudan will grow at a slower rate. Indeed, the Ethiopian populace totalled 112.2 million people in 2019 and will grow to 192.2 million by 2043, an increase of 80 million people. The next biggest increase will come from Uganda at 39.9 million, followed by Sudan at 32.6 million and Kenya at 31.2 million. Uganda will see the largest percentage increase, 91.2%, of these four countries. The other four members, Djibouti, Eritrea, Somalia and South Sudan, only accounted for 12.5% of the REC’s total population in 2019, with their share dropping below 10% by 2043.
The composition of IGAD’s population will become more mature from 2019 to 2043: whereas 59% of the population were aged above 15 years in 2019, 67% will fall in this age bracket by 2043. Specifically, 63% of the population will be aged between 15 and 64 years by 2043, meaning the ratio of working-age individuals to dependants (at 2.2 to 1) will exceed the minimum ratio for a demographic dividend which will be favourable for increased development in the REC. Ethiopia’s population structure is important to consider, as the country will constitute almost 40% of IGAD’s total population. The country will also see its population mature and increase the number of people falling in the working-age bracket by 2043. People aged below 15 years will constitute less than a third of Ethiopia’s population by 2043. Djibouti’s population will have matured considerably by 2043, with 9% of the population aged 65 and older, while only 22% will be 15 years or younger.
Urbanisation encourages development due to economies of scale in service delivery and proximity to more productive activities. IGAD’s population has been steadily urbanising since 1990, when only 17.2% of the population was living in urban areas. In 2019, 26.3% of IGAD’s population lived in urban centres, below the average of 42.8% for Africa. By 2043, this will have risen to 36.6% by which time it will still be below Africa’s average of 51.8%. The large rural population in the region means that authorities must focus on promoting local economic development to provide sustainable livelihoods for the large rural population.
Among IGAD’s member countries, only Djibouti had more urban inhabitants, 78.2% of the population, than rural inhabitants in 2019, and by 2043 Somalia will join Djibouti to be the only countries in the region to have more than half of their populations living in urban areas. South Sudan will continue to have the largest rural population over the forecast horizon reaching 73.6% in 2043 as its urban population will only grow by 6.1 percentage points. Ethiopia will see the largest growth in its urban population, which will increase by 12.1 percentage points to 33.1% by 2043.
The average population density for IGAD in 2019 was 0.58 persons per hectare, higher than Africa’s average of 0.45 persons per hectare in the same year. This will still be the case by 2043, as Africa’ population density rises to 0.76 while the RECs will be 0.99 people per hectare. Uganda had the highest population density in 2019 at 2.19 persons per hectare, followed by Ethiopia’s 1.12 persons per hectare. Uganda’s density is expected to almost double to 4.18 by 2043. The lowest density is in South Sudan, also the country with the highest ratio of rural to urban dwellers, with a rate of 0.16 persons per hectare in 2019. South Sudan’s population density will only marginally rise to 0.21 by 2043.
The size of IGAD’s economy was US$274.7 billion in 2019, which was comparable to the size of the Algerian economy and only about 9% of Africa’s economy. The REC will however see a marked increase in the scale of its economic activity over the forecast horizon: GDP will rise by 381.3% from 2019 to 2043, reaching US$1 322.2 billion. After recovering from the impact of the COVID-19 pandemic, annual growth will not drop below 6% and will equal or exceed 8% from 2035 to 2043.
The remarkable growth will be driven by Ethiopia’s rapid expansion: in 2019, the country’s GDP was US$70.6 billion and it will grow to US$588.6 billion by 2043, an increase of 733%. This growth translates to Ethiopia increasing its share of IGAD’s total GDP from 26% in 2019 to 44.7%. After Ethiopia, Uganda will perform well, having the fourth biggest economy by 2043 at US$249.9 billion, surpassing both Kenya and Sudan in the process. The other three economies, Eritrea, Somalia and South Sudan, are all small and will constitute only 3.2% of total GDP by 2043. All three will however more than double the size of their economies by 2043, with Eritrea seeing the largest increase of 317.5%.
Although many of the charts in the sectoral scenarios also include GDP per capita, this overview is an essential point of departure for interpreting the general economic outlook of IGAD.
The region’s GDP per capita of US$2 406 in 2019 represented 45.5% of Africa’s average of US$5 289. IGAD will however see a remarkable period of growth from 2019 to 2043 as its GDP per capita rises by 120.8% to US$5 313. Africa’s average GDP per capita will only rise by 35.3% in that time, reaching US$7 157 by 2043 meaning IGAD’s GDP per capita will constitute 74.2% of Africa’s average.
The IGAD member with the highest GDP per capita in 2019 was Sudan, followed by Djibouti, Kenya, Ethiopia, Uganda, Eritrea, South Sudan and lastly Somalia. The trajectories of these eight countries differ considerably: Ethiopia and Uganda will grow rapidly, with average incomes increasing by more than 100% over the forecast horizon. Djibouti will experience robust growth, with its GDP per capita rising by 77% to be the highest among the member countries by 2043. Kenya’s and Sudan’s GDPs per capita will grow by 64.9% and 37.7%, respectively. Somalia, however, will continue to be ranked last and despite growth of 76.7% will have a GDP per capita of US$1 502 by 2043, the second lowest in Africa.
Decreasing informality will positively affect development through increases in productivity and government revenue. The value of IGAD’s informal sector was below Africa’s average in 2019 and will gradually fall from 24.1% of GDP in 2019 to 22.4% in 2043.
Somalia’s informal sector equated to 40.5% of GDP in 2019, the highest among IGAD’s members. Alongside Eritrea, the country will also see the largest decrease in its informal sector’s value, with a fall of 6 percentage points. Sudan sees the smallest decrease but will continue to have the smallest informal sector by value in 2043 at 12.9%.
The IFs platform uses data from the Global Trade and Analysis Project (GTAP) to classify economic activity into six sectors: agriculture, energy, materials (including mining), manufacturing, services and information and communication technologies (ICT). Most other sources use a threefold distinction between only agriculture, industry and services with the result that data may differ.
The sector which added the most value to IGAD’s combined economy in 2019 was the service sector at 50.2% of GDP (US$137.6 billion), followed by the agriculture sector at 27.9% (US$76.6 billion) and the manufacturing sector at 11.9% (US$32.7 billion). The other three sectors combined added less than 10%. By 2043, the structure of the economy is expected to have changed: agriculture’s contribution to GDP will have decreased to 9.1%, equivalent to US$120.8 billion, while manufacturing will add 17.9%, translating into US$237.0 billion, and ICT will add 7.2%, equivalent to US$94.7 billion. Services will however continue to dominate and by 2043 will constitute 61.2% of GDP, equivalent to US$808.8 billion. Although these changes point towards a maturing of the economy and a shift towards higher value added activities in the ICT and service sector, the nature of services offered must be considered. Compared to the manufacturing sector, the service sector in low-income countries is characterised by activities which are less labour intensive and therefore do not lead to job creation. As such, reliance on the service sector to the neglect of the manufacturing and agriculture sectors can result in joblessness and non-inclusive growth which can worsen unemployment and food insecurity in the region.
The trend towards a larger service sector is primarily driven by South Sudan, whose dependence on energy exports is replaced by a rapidly expanding service sector. In 2019, the energy sector’s contribution equated to 54.2% of GDP, while services added 31.8%. By 2043, the service sector will however have far outstripped the contribution of energy exports, as services add 64.3% of total value added, while energy accounts for only 25.1%.
Eritrea is the only country where services add less value in 2043 than in 2019, although the sector’s contribution will still be 63.7% of GDP by 2043. Ethiopia, IGAD’s largest economy, will see its agriculture sector add 7.7% of total value added in 2043, a significant decrease from 33.6% in 2019. The country will also see a large increase in the contribution of services, 15.7 percentage points, but encouragingly manufacturing will also see an increase of 5.9 percentage points and ICT will rise to 8.4% by 2043. Djibouti will continue to rely heavily on its service sector, which added 77.9% of total value in 2019 and will contribute 75.7% of total GDP by 2043.
The data on agricultural production and demand in the IFs forecasting platform initialises from data provided on food balances by the Food and Agriculture Organization (FAO). IFs contains data on numerous types of agriculture but aggregates its forecast into crops, meat and fish, presented in million metric tons. Chart 9 shows agricultural production and demand as a total of all three categories.
The projected trajectory for IGAD’s agricultural production and demand in the Current Path forecast show a situation of increasing import dependence, with an excess demand of 14 million metric tons for domestic production in 2019, growing to 96.6 million metric tons in 2043. To meet the increasing demand, food imports must increase which will result in the REC being more food insecure and more susceptible to fluctuations or shocks in international food prices. Avoiding this situation will require an agricultural revolution in the region.
Djibouti had the highest level of dependence in 2019, with a shortfall of 1.8 million tons, but by 2043 several countries will have surpassed the small coastal country. As their populations expand rapidly, Ethiopia, Kenya, Sudan and Uganda will experience rapid increases in demand, outgrowing domestic production, with Uganda facing the most severe shortage of 28 million tons by 2043. South Sudan had a surplus in 2019 but by 2043 will have a shortfall of 0.5 million tons.
There are numerous methodologies for and approaches to defining poverty. We measure income poverty and use GDP per capita as a proxy. In 2015, the World Bank adopted the measure of US$1.90 per person per day (in 2011 international prices), also used to measure progress towards the achievement of Sustainable Development Goal (SDG) 1 of eradicating extreme poverty. To account for extreme poverty in richer countries occurring at slightly higher levels of income than in poor countries, the World Bank introduced three additional poverty lines in 2017:
- US$3.20 for lower middle-income countries
- US$5.50 for upper middle-income countries
- US$22.70 for high-income countries.
IGAD will see robust progress in reducing the percentage of its population living below the US$1.90 per day poverty line over the forecast horizon. In 2019, 88 million people, constituting 31% of the total population, were classified as extremely poor but by 2043 the poverty rate will have decreased to 8.3% and the poor population will have shrunk to 40 million people. The REC is thus already on its way towards eliminating extreme poverty and the scenarios act as accelerators for this positive trend.
The decrease is mainly driven by the REC’s most populous country, Ethiopia, which will see the size of its poor population fall from 32.9 million people in 2019 to 5.9 million by 2043. This translates into an extreme poverty rate reduction from 29.4% in 2019 to 3.1% in 2043. Sudan, which had the lowest extreme poverty rate in the region at 11.9% in 2019, will make progress by reducing it to 4.2% by 2043. Uganda and Kenya will also see significant reductions to 7.6% and 10.7%, respectively. However, Somalia and South Sudan will continue to struggle. Somalia’s poor population will in fact grow slightly from 10 million to 10.4 million, although the poverty rate will fall to 37.5% from 66% in 2019. South Sudan’s poverty rate was very high in 2019 at 79.4% and despite a decrease of 29.4 percentage points, half of the country’s population will still be poor by 2043.
The IFs platform forecasts six types of energy, namely oil, gas, coal, hydro, nuclear and other renewables. To allow comparisons between different types of energy, the data is converted into billion barrels of oil equivalent (BBOE). The energy contained in a barrel of oil is approximately 5.8 million British thermal units (MBTUs) or 1 700 kilowatt-hours (kWh) of energy.
IGAD predominantly generated energy through oil in 2019, followed by hydro and other renewables. Oil production constituted 48% of the total energy produced in 2019, while hydro energy accounted for 27% and other renewables 16%. The dependence on oil will rapidly decline, such that by 2043 renewable sources will account for 83% of total energy produced and oil’s share will have shrunk to 14%.
South Sudan and Sudan together produced almost all the oil in the region accounting for over 99% of the total oil produced in 2019. This will remain the case throughout the forecast period. Ethiopia is the major source of hydro production in the region, increasing its share of total hydro production from 84% in 2019 to about 89% in 2043. The production of other renewable energy types mainly comes from Kenya, whose output represents 87% of all other renewable energies produced in the region. However, by 2043, Ethiopia will surpass Kenya as the leading producer of other renewable energies in the region, contributing about 57.6% of total renewable production compared to 5.4% in 2019. By then, Kenya’s contribution to renewable energy will have dropped to 24.4%.
Carbon is released in many ways, but the three most important contributors to greenhouse gases are carbon dioxide (CO2), carbon monoxide (CO) and methane (CH4). Since each has a different molecular weight, IFs uses carbon. Many other sites and calculations use CO2 equivalent.
IGAD produced 4 million tons of carbon in 1990 and emissions grew slowly over the next 29 years to reach 16 million tons of carbon by 2019, constituting just 4% of total emissions in Africa. The REC is, however, projected to see a marked increase as economic activity ramps up significantly over the forecast horizon, as detailed in Chart 5. By 2043, IGAD will emit 62 million tons of carbon — an increase of 288% compared to 2019, by which time its emissions will equate to 6.6% of total emissions from Africa.
Three countries, Uganda, Kenya, Sudan, drive this increase: Uganda’s emissions will grow by 732%, to reach 23.3 million tons by 2043, while Kenya and Sudan will see more modest increases of 179% and 161% but still be the second and third highest emitters by 2043. Ethiopia follows a curious trajectory, as the country will lead the REC’s emissions until 2038, before it drops to fourth place by 2043. The country will still see an increase of 129% from 2019 to 2043, but this will be a significant fall from an increase of 676% from 2019 to 2038.
Sectoral Scenarios for IGAD Development Futures
Download to pdfThe Stability scenario represents reasonable but ambitious reductions in risk of regime instability and lower levels of internal conflict. Stability is generally a prerequisite for other aspects of development and this would encourage inflows of foreign direct investment (FDI) and improve business confidence. Better governance through the accountability that follows substantive democracy is modelled separately.
The intervention is explained here in the thematic part of the website.
IGAD’s index score will rise from 0.66 in 2019 to 0.84 in 2043 in the Stability scenario — a 15% improvement compared to the Current Path forecast for 2043 and about 14% higher than the Current Path average for Africa.
The country that is projected to see the largest improvement in its governance security index score in the Stability scenario is Somalia at 26%, which is understandable given the years of upheaval it has experienced. This is followed by Sudan and South Sudan, who will both see an improvement of 22% by 2043 in the scenario, compared to the Current Path forecast. Kenya will continue to have the highest score by 2043 in the scenario, reaching 0.88 on the index as opposed to 0.81 in the Current Path forecast.
IGAD’s GDP per capita will more than double in the Current Path forecast, rising from US$2 406 in 2019 to US$5 313 by 2043. The Stability scenario serves to add to this momentum, increasing average incomes by an additional 4.3%, equivalent to US$231, in 2043 compared to the Current Path forecast for that year. The REC will, however, continue to lag behind the average GDP per capita for Africa; the continent will reach US$7 157 by 2043 in the Current Path forecast.
The member which will benefit most from the Stability scenario is South Sudan, which will see an increase of 10.3% in 2043 compared to the Current Path level of US$2 478. Somalia will also see a sizable increase of 7.8%, but will only reach US$1 620 by 2043 in the Stability scenario, which highlights the low level the country is coming from in 2019.
The poverty rate for IGAD, measured at US$1.90, rose sharply between 2019 and 2021, from 31.2% to 35%, due to the COVID-19 pandemic, but is projected to decline to 7.4% by 2043, 0.9 percentage points lower than in the Current Path forecast. This small reduction equals a sizable decrease of 4.3 million people being extremely poor. The REC widens the gap to Africa’s Current Path forecast, average poverty rate from 3.6 percentage points in 2019 to 13.5 percentage points by 2043.
Somalia is the country which will see the largest decrease in its poverty rate among IGAD’s members, with the poverty rate declining from 37.5% in the Current Path forecast to 30.4% in the Stability scenario by 2043. South Sudan will see a remarkable decrease from 2019 to 2043 in the Stability scenario, as its poverty rate falls from 79.4% to 46.3%, a decline of 33.1 percentage points. Ethiopia will eliminate extreme poverty at the US$1.90 poverty line in the Stability scenario, reaching 2.6% by 2043.
This section presents the impact of a Demographic scenario that aims to hasten and increase the demographic dividend through reasonable but ambitious reductions in the communicable-disease burden for children under five, the maternal mortality ratio and increased access to modern contraception.
The intervention is explained here in the thematic part of the website.
Demographers typically differentiate between a first, second and even a third demographic dividend. We focus here on the contribution of the size of the labour force (between 15 and 64 years of age) relative to dependants (children and the elderly) as part of the first dividend. A window of opportunity opens when the ratio of the working-age population to dependants is equal to or surpasses 1.7.
In 2019, the average ratio of the working-age population to dependants for the REC was 1.25 to 1 meaning that on average, for every dependant there were about 1.3 persons of working age. IGAD will reach the minimum ratio for a demographic dividend by 2038 in the Demographic scenario and the REC is projected to reach 1.96 by 2043. The combination of reduced infant mortality and total fertility and increased life expectancy accounts for the demographic dividend in the scenario. On the Current Path, IGAD will not achieve this minimum ratio even by 2043, when the ratio will be 1.67 to 1. The projected ratio of working-age people to dependants for IGAD in 2043 for the Current Path and Demographic scenario will be above the Current Path average of 1.58 to 1 for Africa in the same year.
Djibouti is the only member who will experience a demographic dividend throughout the forecast horizon, in both the Current Path forecast and the Demographic scenario. Five other members, Eritrea, Ethiopia, Kenya, Sudan and Uganda, will enter a period of demographic dividend within the forecast horizon, with the Demographic scenario increasing their ratios above the Current Path forecast and accelerating the process. By 2043, Kenya will have the highest ratio in the Demographic scenario, at 2.4, which is 0.4 higher than in the Current Path forecast. Both Somalia and South Sudan will not enter a period of demographic dividend by 2043, with Somalia’s ratio being particularly low at 1.4 in the Demographic scenario.
The infant mortality rate is the number of infant deaths per 1 000 live births and is an important marker of the overall quality of the health system in a country.
IGAD’s infant mortality rate of 41.7 deaths per 1 000 live births in 2019 was 5.1 deaths lower than Africa’s average. It will drop significantly to 14.4 deaths by 2043 in the Demographic scenario, 3.4 deaths fewer than in the Current Path forecast and 11.2 deaths below the Current Path average for Africa.
Somalia and South Sudan both had very high infant mortality rates in 2019 at 67 and 78.2 deaths per 1 000 live births, respectively, but both will see a rapid decrease in their rates in the Demographic scenario. By 2043, Somalia’s rate will have decreased by 46.2 deaths and South Sudan’s by 47.7 in the scenario, resulting in the former scoring below Africa’s Current Path forecast average and the latter closing the gap from 31.4 to 5 deaths per 1 000 live births. In fact, all of IGAD’s members except South Sudan will have infant mortality rate that is below Africa’s Current Path forecast average of 25.6 deaths per 1 000 live births, with the lowest rate coming from Ethiopia at 8.2 in 2043.
IGAD is projected to see robust growth in its GDP per capita over the forecast horizon, as average incomes rise from US$2 406 in 2019 to US$5 313 by 2043 in the Current Path forecast. The Demographic scenario builds on this progress and adds an additional US$212 in 2043 to the Current Path forecast, reaching US$5 525. This is still 29.5% below the Current Path forecast for Africa in 2043 of US$7 157, although IGAD will have closed the gap to US$1 632, a sizable reduction from a gap of US$2 883 in 2019.
Uganda will see the largest percentage increase of 5% between the Current Path forecast and Demographic scenario for 2043, reaching US$5 087. The scenario has relatively small impact on GDP per capita, as it mainly lays the foundation for increased growth outside the forecast horizon through the reduction of population sizes and the consequent speeding up of IGAD’s members reaching their period of demographic dividend.
Poverty in IGAD was at a troublesome level in 2019, at 31.2%, but the rate will fall appreciably over the forecast horizon and reach 7.5% by 2043 in the Demographic scenario, 0.8 percentage points lower than in the Current Path forecast. Combined with the decrease in population size brought about by the Demographic scenario means this small reduction will lead to 5.7 million fewer people being extremely poor in 2043. The gap to Africa’s Current Path forecast average poverty rate will widen from 3.6 percentage points in 2019 to 13.4 percentage points by 2043.
The Demographic scenario does not significantly reduce poverty for IGAD’s members, with the largest reduction in poverty projected for Somalia at 2 percentage points by 2043 in the Demographic scenario compared to the Current Path forecast. Due to the scenario’s dampening effect on population growth, the reduction in the number of people who are extremely poor is more impressive, with Uganda and Ethiopia both expected to see decreases in excess of a million people, and Kenya in excess of 2 million people, compared to the 2043 Current Path forecast.
This section presents reasonable but ambitious improvements in the Health/WaSH scenario, which include reductions in the mortality rate associated with both communicable diseases (e.g. AIDS, diarrhoea, malaria and respiratory infections) and non-communicable diseases (NCDs) (e.g. diabetes), as well as improvements in access to safe water and better sanitation. The acronym WaSH stands for water, sanitation and hygiene.
The intervention is explained here in the thematic part of the website.
IGAD’s average total life expectancy was 65.9 years in 2019 — only 0.1 years above the average for Africa. In the Health/WaSH scenario, IGAD will see a 0.4 year improvement in life expectancy compared to its Current Path forecast, reaching 72.7 years by 2043. On average, females (67.4 years) live longer than males (64.3 years) by an additional 3.1 years. Female life expectancy will reach 74.7 years by 2043 in the scenario, while male life expectancy will rise to 70.8.
Sudan had the highest life expectancy in 2019 at 68.9 years, but will be overtaken by Kenya in the forecast horizon, where life expectancy will rise to 75.5 years in the Health/WaSH scenario by 2043. South Sudan will see the largest increase in the scenario, raising its life expectancy from 58.8 in 2019, the second lowest among IGAD’s members, to 67.2 by 2043.
IGAD’s infant mortality rate is projected to be 16.2 deaths per 1 000 live births by 2043 in the Health/WaSH scenario, 1.6 deaths lower than the Current Path forecast and 25.5 deaths lower than in 2019. The REC’s infant mortality rate will be 9.4 deaths below Africa’s Current Path forecast average in 2043, an increase from the gap of 5.1 in 2019.
As discussed in Chart 17, South Sudan and Somalia were the members struggling most with infant mortality in 2019, and similarly to the Demographic scenario, these two countries will see the largest reductions in their infant mortality rates in the Health/WaSH scenario. Somalia’s rate will fall to 25.1 deaths per 1 000 live births, 2 below the Current Path forecast for 2043, while South Sudan’s rate will decrease to 33.5, 7.2 below the Current Path forecast. The scenario enables all of IGAD’s members, except South Sudan, to widen the gap to Africa’s Current Path forecast average of 25.6.
The Agriculture scenario represents reasonable but ambitious increases in yields per hectare (reflecting better management and seed and fertiliser technology), increased land under irrigation and reduced loss and waste. Where appropriate, it includes an increase in calorie consumption, reflecting the prioritisation of food self-sufficiency above food exports as a desirable policy objective.
The intervention is explained here in the thematic part of the website.
The data on yield per hectare (in metric tons) is for crops but does not distinguish between different categories of crops.
At 2.8 tons per hectare, IGAD’s crop yields were lower than the average for Africa: in 2019, the gap was 1.1 tons per hectare, but in the Agriculture scenario, the REC will produce 1.2 tons per hectare more than Africa’s Current Path forecast by 2043. IGAD’s yield per hectare is projected to rise considerably to 6 tons per hectare in 2043, 2.4 tons higher than in the Current Path forecast.
Djibouti is an outlier among IGAD’s members: the country had the highest yield per hectare in 2019, 28.6 tons per hectare, and will see rapid increases to reach 41.4 by 2043 in the Agriculture scenario. The discrepancy is due to Djibouti having the smallest surface area, least amount of irrigated land and land used for crop production. The next highest yield per hectare by 2043 in the scenario will be seen in South Sudan at 9.2 tons per hectare, double the country’s Current Path forecast. Sudan will continue to have the lowest yield in the scenario, despite an increase of 1.3 tons per hectare compared to the Current Path forecast for 2043.
IGAD’s food security situation mirrored that of Africa as a whole in 2019. The REC’s average agricultural imports as a percentage of agricultural demand was 10.1% in 2019 — 0.8 percentage points below Africa’s average. The situation is projected to improve considerably in the Agriculture scenario and by 2043 IGAD will export 6% of its agricultural demand, a 31.9 percentage point improvement on the Current Path forecast. At this point, it also represents a 40.5 percentage point improvement compared to Africa’s Current Path average (which will import 34.5% of its agriculture demand) in 2043. It means that if IGAD embarks on an agricultural revolution through the use of improved technology and reduction in post-harvest losses, it will not only achieve food security but will also be able to export food to other regions.
There is a large discrepancy between IGAD’s members and their level of import dependence. In 2019, Djibouti’s agricultural imports constituted 97.1% of agricultural demand, while South Sudan was a net exporter equivalent to 5.9% of agricultural demand. The Current Path forecast for most countries sees their dependency grow, but in the Agriculture scenario some countries will overturn their dependency to become net exporters, such as Ethiopia and South Sudan, with the latter seeing a 63.9 percentage point decrease to export equivalent of 61.4% of its agricultural demand by 2043. Somalia will still see an increase in its import dependency despite the Agriculture scenario, reaching a rate of 54.4% by 2043.
The Agriculture scenario has a significant impact on IGAD’s GDP per capita. In 2043, GDP per capita will be 5.8%, or US$309, higher than the Current Path forecast for the same year. As a result, average incomes will rise from US$2 406 in 2019 to US$5 622 by 2043, an increase of 134%. The scenario will aid the REC in closing the gap to Africa’s average GDP per capita; in 2043, Africa’s average GDP on the Current Path will be 1.3 times higher than IGAD’s, compared to the 2.3 times more in 2019.
Agriculture remains an important sector for most of IGAD’s members, with large increases in GDP per capita for most countries in the Agriculture scenario. Sudan will see a 10% rise in its GDP per capita by 2043 compared to the Current Path forecast, reaching a GDP per capita of US$6 517. Ethiopia, however, will not see a significant increase compared to the Current Path forecast, due to the country’s already considerable rise in the Current Path forecast. Its average income will rise from US$2 063 in 2019 to US$5 888 by 2043 in the Current Path forecast, with the Agriculture scenario only adding 1.6% to the Current Path forecast for 2043.
The Agriculture scenario will significantly reduce IGAD’s poverty rate: from 31.2% in 2019, the rate will fall to 6.3% by 2043, 2 percentage points below the Current Path forecast, translating to 9.6 million fewer poor people. The gap to Africa’s average poverty rate in the Current Path forecast will widen further to 14.6 percentage points by 2043 from 3.6 percentage points in 2019.
The Agriculture scenario has an impressive impact on Sudan’s poverty situation, reducing the number of people who are considered extremely poor by 3.5 million people by 2043 compared to the Current Path forecast. Somalia will see the largest percentage point decrease, of 4.7 by 2043, followed by Sudan at 4.5 percentage points, compared to the Current Path forecast.
The Education scenario represents reasonable but ambitious improved intake, transition and graduation rates from primary to tertiary levels and better quality of education. It also models substantive progress towards gender parity at all levels, additional vocational training at secondary school level and increases in the share of science and engineering graduates.
The intervention is explained here in the thematic part of the website.
The 2019 average of IGAD’s mean years of adult education was 5 years, improving to 6.7 years by 2043 in the Current Path forecast and 7.1 years in the Education scenario. The REC’s average was 1.2 years below Africa’s average in 2019 but encouragingly the gap to Africa’s Current Path forecast is expected to narrow to 0.5 years in the Education scenario.
Kenya will reach the highest level of educational attainment by 2043 in the scenario as mean years of education amount to 8.5 years, 0.3 higher than in the Current Path forecast. Conversely, South Sudan will make good progress compared to 2019 but remain far below Africa’s average, attaining 5.7 mean years of education by 2043. Somalia will benefit most from the scenario, seeing an increase of 1.1 years by 2043 compared to the Current Path forecast.
The scenario increases both male and female learners’ mean years of education above the Current Path forecast, but there is a large disparity between the two groups, with male mean years of education 1.2 years higher in 2019. In 2043, the gap will be reduced to 0.8 years in the Education scenario. The gap will be the biggest in Somalia, at 2.1 years in 2043, while in Sudan, the gap will be reduced to 0.1, thereby nearly reaching gender parity.
The average test scores for learners at primary and secondary level serve as a proxy for education quality. IGAD’s primary level score was 28.4 in 2019, 3 below Africa’s average, with its secondary level score 8.9 points higher at 37.3, 1.8 below Africa’s average. The Education scenario boosts these scores considerably. Primary level score will reach 36.6 in 2043, 5.1 points, or 16.2%, above the Current Path forecast, while the secondary level score reaches 46.5 by 2043, 7.2, or 18.4%, higher than the Current Path forecast.
Uganda will see the largest increase in their primary level score compared to the Current Path forecast, with its scoring rising by 6.5 points by 2043. The quality of Somalia’s secondary education will increase the most of all IGAD’s members, rising by 9.2 points by 2043, also resulting in the country having the highest score of 52.2. South Sudan, Eritrea and Ethiopia will still be below Africa’s Current Path forecast average primary level score by 2043, but all of IGAD’s members will surpass Africa’s Current Path forecast average for secondary education in the scenario.
The Education scenario will have a marginal effect on IGAD’s GDP per capita. In 2043, GDP per capita will only be US$171, or 3.2%, higher than the Current Path forecast. Average incomes will thus have risen from US$2 406 in 2019 to US$5 484 by 2043. The scenario will help the REC to close the gap to Africa’s average GDP per capita; in 2043 the gap will be US$1 673 in the Education scenario, a significant decrease from US$2 883 in 2019. While education is important for human capital formation of a country towards achieving economic growth, it takes time for it to impact growth and development.
The Education scenario’s interventions are projected to bear fruit towards the end of the forecast horizon, with IGAD’s members seeing rises in GDP per capita from 2028 onwards and the increase gaining momentum to 2043. Eritrea will see the largest increase from its Current Path forecast for 2043, with a rise of 4.1% in the Education scenario. All of IGAD’s other members see a similar level of improvement, and Djibouti sees the smallest increase of 2.6% in 2043.
IGAD’s poverty rate, measured at US$1.90, rose sharply from 2019, at 31.2%, to 2021, at 35%, as a result of the COVID-19 pandemic, but in the Education scenario the rate is projected to decline to 7.2% by 2043, 1.1 percentage points lower than in the Current Path forecast. This fall in the poverty rate equals a sizable decrease of 6.4 million people by 2043 compared to the Current Path. The REC also widens the gap to Africa’s Current Path forecast such that by 2043, the extreme poverty rate in IGAD will be 13.6 percentage points below Africa’s average compared to the 3.6 percentage points in 2019.
The Education scenario has a limited effect on poverty for IGAD’s members, with the largest percentage point decrease by 2043 coming from Somalia and Djibouti at 2.2 percentage points compared to the Current Path forecast. Ethiopia will eliminate extreme poverty by 2043 as the poverty rate decreases below the 3% in 2042 in the Education scenario. In absolute terms, Uganda, Sudan, Ethiopia and Kenya will all see their poor population decrease by more than a million people by 2043 compared to the Current Path forecast.
The Manufacturing/Transfers scenario represents reasonable but ambitious manufacturing growth through greater investment in the economy, investments in research and development, and promotion of the export of manufactured goods. It is accompanied by an increase in welfare transfers (social grants) to moderate the initial increases in inequality that are typically associated with a manufacturing transition. To this end, the scenario improves tax administration and increases government revenues.
The intervention is explained here in the thematic part of the website.
Chart 30 should be read with Chart 8 that presents a stacked area graph on the contribution to GDP and size, in billion US$, of the Current Path economy for each of the sectors.
The contribution of IGAD’s service sector to GDP will increase by 0.2 percentage points by 2043 in the scenario compared to the Current Path forecast, a rise which translates to an additional US$65.5 billion. The manufacturing sector’s contribution also increases, rising by 0.4 percentage points above the Current Path and adding an additional US$24.4 billion worth of value by 2043. The share of the agriculture sector’s contribution to GDP will be 0.6 percentage points below the Current Path forecast, equivalent to an additional US$1.1 billion. The ICT sector will also contribute an additional US$7.8 billion to GDP in the scenario by 2043, comparable to 0.03 percentage points above the Current Path forecast. The relative increase in the value of services reflects the continent wide trend of rapid growth in the service sector, with manufacturing struggling to keep up.
Individually, this trend will be seen most clearly in Somalia, where services will add 2 percentage points more value as a percentage of GDP by 2043 in the scenario, while manufactures drop by 0.5 percentage points, despite the interventions of the Manufacturing/Transfers scenario. Uganda conversely will see its manufacturing sector add 0.7 percentage points more value than in the Current Path forecast for 2043, while services’ contribution declines by 0.2 percentage points. Ethiopia will be the main driving force behind IGAD’s growth in services, with the country’s service sector adding US$22.8 billion more value by 2043 than in the Current Path forecast. Kenya makes the second largest additional contribution at US$11.6 billion.
The Manufacturing/Transfers scenario increases government welfare transfers to unskilled workers to alleviate the effects of increased poverty caused by the initial investment in manufacturing. Unskilled workers are used as a proxy for the poor, and welfare transfers to these citizens should help to dampen the effects of increased inequality often associated with a manufacturing-led growth path. IGAD’s transfers to unskilled workers totalled US$11.6 billion in 2019, and in the Current Path this will rise to US$66.6 billion by 2043. In the Manufacturing/Transfers scenario, IGAD will see a 53% increase in these welfare transfers compared to the Current Path forecast, reaching US$271.4 billion by 2043.
Kenya’s transfers to unskilled workers amounted to 10.1% of GDP in 2019, the highest among IGAD’s members, but in the Manufacturing/Transfers scenario, Uganda will surpass this mark to reach 13.2% of GDP worth of transfers by 2043. The rise in transfers in the scenario for Uganda translates to an 83% increase, while Kenya’s transfers increase by 42.5%. Uganda’s rise in transfers will be needed, as the manufacturing sector’s role in the economy is expected to grow in the scenario, as shown in Chart 30.
IGAD’s GDP per capita will more than double on the Current Path forecast, rising from US$2 406 in 2019 to US$5 313 by 2043. The Manufacturing/Transfers scenario adds to this robust growth, increasing average incomes by an additional 4.9%, or US$262, in 2043 compared to the Current Path forecast. The REC’s GDP per capita will however still be 28.4% below the average GDP per capita for Africa; the continent will reach US$7 157 by 2043 in the Current Path forecast.
The Manufacturing/Transfers scenario has the largest impact on Uganda’s GDP per capita, reinforcing the Current Path forecast trend of the manufacturing and service sectors adding more value as the agriculture sector’s contribution decreases. By 2043, Uganda’s GDP per capita will be 9.8% higher in the Manufacturing/Transfers scenario than in the Current Path forecast, at US$5 321. In contrast, the scenario has limited impact on the structure of South Sudan’s economy, and as such only increases the country’s GDP per capita by 1.8% in 2043 compared to the Current Path forecast.
The Manufacturing/Transfers scenario will reduce IGAD’s poverty rate substantially: from 31.2% in 2019, the rate will fall to 6.3% by 2043, 2 percentage points below the Current Path forecast, an identical reduction to the Agriculture scenario. The gap to Africa’s average poverty rate in the Current Path forecast will also widen further, so that by 2043, the extreme poverty rate in IGAD will be 14.6 percentage points below Africa’s average compared to the 3.6 percentage points in 2019. The decline in the poverty rate translates to 9.4 million fewer poor people in this scenario than in the Current Path forecast.
Increased manufacturing activity and a rise in welfare transfers to the poor will succeed in combating poverty in Somalia, where the poverty rate will decrease the most of all IGAD’s members. The country will see a 6.2 percentage point decrease in the scenario compared to the Current Path forecast by 2043, while 1.7 million fewer people will live in extreme poverty. The largest decrease in absolute terms will come from Kenya however, where 3.6 million fewer people will live below US$3.20 per day, the poverty line for lower middle-income countries, by 2043 in the scenario compared to the Current Path forecast.
The Leapfrogging scenario represents a reasonable but ambitious adoption of and investment in renewable energy technologies, resulting in better access to electricity in urban and rural areas. The scenario includes accelerated access to mobile and fixed broadband and the adoption of modern technology that improves government efficiency and allows for the more rapid formalisation of the informal sector.
The intervention is explained here in the thematic part of the website.
Fixed broadband includes cable modem Internet connections, DSL Internet connections of at least 256 KB/s, fibre and other fixed broadband technology connections (such as satellite broadband Internet, ethernet local area networks, fixed-wireless access, wireless local area networks, WiMAX, etc.).
In 2019, IGAD’s fixed broadband subscriptions was 2.2 per 100 people, 40.9% below the average of 3.1 subscriptions per 100 people for Africa. IGAD’s fixed broadband subscriptions will increase to 47.3 per 100 people by 2043 in the Leapfrogging scenario, 18.5 subscriptions per 100 people more than in the Current Path forecast for the same year. The related benefits of increased Internet access are multiple and varied, leading to increased communication and information transfer and prompting higher levels of innovation.
The range of values between IGAD’s members was small in 2019: the highest rate of subscriptions was Somalia’s at 2.7 per 100 people, while the lowest was South Sudan’s at 1.2. The differences between members will increase in the Leapfrogging scenario, as Uganda, Somalia and Ethiopia reach IFs’ saturation point of 50 subscriptions per 100 people, while South Sudan, which had the lowest rate among IGAD members in 2019, will see an increase of 20.8 subscriptions to reach 39.1 subscriptions per 100 people by 2043.
Mobile broadband refers to wireless Internet access delivered through cellular towers to computers and other digital devices.
The benefits of Internet access are more easily attained through the use of cellphones, which are more cost-effective than fixed-line Internet solutions. Africa generally has leveraged cellphone technology to circumvent the costly implementation of fixed-line infrastructure. Within IFs, subscription rates of 150 per 100 people is considered saturation level.
IGAD is projected to see a remarkable rise in mobile subscriptions, reaching 143.4 subscriptions by 2043 in the Leapfrogging scenario, 450% higher than the 2019 level of 26 subscriptions and 3.4% higher than the Current Path forecast in 2043. The REC’s performance will put it above Africa’s average of 141.8 subscriptions per 100 people by 2043.
Improvements differ markedly between countries, with Eritrea trailing other countries in both the Current Path forecast and in the Leapfrogging scenario, while Somalia and Ethiopia will see dramatic rises in subscriptions to reach saturation levels of 150 subscriptions per 100 people as early as 2037. Indeed, Eritrea will only reach 89.5 subscriptions per 100 people in the scenario by 2043, while South Sudan, which had the same number of subscriptions as Eritrea in 2019, will reach 113.9 subscriptions.
Increased access to electricity enables households to use cleaner cooking methods, electrical lighting for studying and serves as a prerequisite for Internet access, a critical building block for development. Access to electricity is also an important input for firms especially those in the manufacturing value chain. In 2019, Africa’s total electricity access stood at 53.2% of the total population, 6.4 percentage points higher than IGAD’s average for the same year. In the Leapfrogging scenario, IGAD’s average rate of access will reach 91.5% by 2043, 18.8 percentage points higher than Africa’s Current Path forecast. Urban access, at 90.6%, will also be higher than Africa’s average of 85.9% by 2043 while rural access will far outpace the continental average of 59.2% as the REC’s average reaches 91.3% in the Leapfrogging scenario.
Uganda stands to benefit the most from the Leapfrogging scenario, with its total electricity access increasing by 21.5 percentage points above the Current Path forecast to reach 92.4% in 2043. Kenya will see the smallest increase at 7.1 percentage points by 2043 but will reach the second highest rate at 95.2%. Ethiopia is the only member of IGAD which will reach 100% total electricity access by 2043 in the Leapfrogging scenario, while South Sudan will continue to struggle at a rate of 34.9%. Rural access will increase the most in Eritrea and the least in Kenya, at 27.1 and 8.8 percentage points, respectively. Urban access is projected to increase the most in Somalia, with a rise of 9.8% by 2043.
The Leapfrogging scenario will substantially improve IGAD’s GDP per capita over the forecast horizon, as average incomes rise to US$5 690 in 2043, equivalent to 7.1% more than in the Current Path forecast for the same year. The scenario has the second biggest impact on GDP per capita, behind only the Free Trade scenario. The magnitude of growth it engenders without increasing carbon emissions to the extent other scenarios do, such as the Free Trade and Manufacturing/Transfers scenarios makes it less costly for the environment. The estimated GDP per capita in this scenario will be 25.8% lower than Africa’s average on the Current Path in 2043.
The country that will benefit most from the Leapfrogging scenario is Uganda, as average incomes increase by 13% in 2043 compared to the Current Path forecast. Somalia will also see encouraging progress as its GDP per capita increases by 12.4% in 2043, which is much needed given the low base of US$850 that the country comes from in 2019. Despite this positive trajectory, Somalia will still have the second lowest GDP per capita in Africa by 2043, above only Burundi.
The Leapfrogging scenario noticeably improves IGAD’s GDP per capita and also meaningfully reduces the REC’s poverty rate: by 2043, the poverty rate will be 1.4 percentage points below the Current Path forecast, and 14 percentage points beneath Africa’s Current Path forecast average of 20.9%.
In the Leapfrogging scenario, Somalia will see the largest drop in its poverty rate among IGAD’s members, with a 5.3 percentage point decrease by 2043 compared to the Current Path forecast. The country will reach a poverty rate of 32.2% in 2043, a significant drop from 66% in 2019. South Sudan had the highest poverty rate in 2019 at 79.4%, and it will see a 31 percentage point decrease over the forecast horizon, reaching a poverty rate of 48.4% by 2043 in the Leapfrogging scenario, 1.9 percentage points lower than the Current Path forecast. Kenya will see a reduction of 1.9 million people in the size of its poor population.
The Free Trade scenario represents the impact of the full implementation of the African Continental Free Trade Area (AfCFTA) by 2034 through increases in exports, improved productivity and increased trade and economic freedom.
The intervention is explained here in the thematic part of the website.
The trade balance is the difference between the value of a country's exports and its imports. A country that imports more goods and services than it exports in terms of value has a trade deficit, while a country that exports more goods and services than it imports has a trade surplus.
In 2019, IGAD’s trade balance as percentage of GDP was a deficit of 11.3%, which was 5.2 percentage points above Africa’s average of 5.9% in 2019. Between 2024 and 2039, the Free Trade scenario improves the trade balance quicker than the Current Path forecast peaking at a deficit of 4.4% of GDP in 2035 before worsening again. By 2043, the region’s trade deficit in the Free Trade scenario is projected to be 7.9% of GDP, slightly higher than the 6.3% deficit projected in the Current Path forecast. Despite this improvement, IGAD’s trade deficit in both this scenario and the Current Path will be higher than the Current Path average of 3.3% for Africa by 2043. The REC’s imports, as a percentage of GDP, will rise by 7 percentage points to 32.8% by 2043 in the Free Trade scenario, but exports will also increase by 12.1 percentage points in that time and be 8.7 percentage points higher than in the Current Path forecast. The REC’s exports of manufactured goods are low, 3.8% of GDP in 2019, but will increase to 8.6% by 2043 in the scenario, 3.1 percentage points higher than in the Current Path forecast.
South Sudan is the only country which will see a sizable deterioration in its trade deficit, from 15.4% in 2019 to 30% by 2043 in the Free Trade scenario. Somalia will also see a decline, but the other six members will experience a rise over the forecast horizon. All of IGAD’s members will see their total trade as a percentage of GDP increase, the largest coming from Kenya at 20.9 percentage points by 2043, while South Sudan’s increase of 3.4 percentage points is the lowest. Somalia will see the largest increase in manufacturing exports among IGAD’s members, while Djibouti’s exports of services will rise by 16.3 percentage points in the scenario by 2043, the most of all IGAD’s members.
IGAD’s GDP per capita is projected to rise considerably in the Free Trade scenario, the most of all the 11 scenarios discussed: by 2043, the REC’s GDP per capita will be US$5 974, an increase of additional US$661, or 12.4%, above the Current Path forecast. The magnitude of the increase means that IGAD starts to noticeably close the gap to Africa’s Current Path forecast for 2043. In 2019, IGAD’s GDP per capita was equal to just 45.5% of Africa’s average; by 2043, it will rise to 83.5% of Africa’s average.
Uganda will once again see the largest increase in its average incomes by 2043, with a rise of 14.8% compared to the Current Path forecast, reaching a GDP per capita US$5 563. Somalia, South Sudan and Djibouti are the only members with increases below 10%, with South Sudan’s increase of 5.9% particularly low and concerning given the potential for growth that free trade holds. South Sudan will have the seventh smallest percentage increase of all African countries in 2043 comparable to the growth characteristics of wealthier African countries such as Algeria, Egypt and Seychelles.
Trade openness will reduce poverty in the long term after initially increasing it due to the redistributive effects of trade. Most African countries export primary commodities and low-tech manufacturing products, and therefore a continental free trade agreement (AfCFTA) that reduces tariffs and non-tariff barriers across Africa will increase competition among countries in primary commodities and low-tech manufacturing exports. Countries with inefficient, high-cost manufacturing sectors might be displaced as the AfCFTA is implemented, thereby pushing up poverty rates. In the long term, as the economy adjusts and produces and exports its comparatively advantaged (lower relative cost) goods and services, poverty rates will decline.
IGAD is expected to make robust progress in combating poverty in the Current Path forecast, reducing its poverty rate from 31.2% in 2019 to 8.3% by 2043. The Free Trade scenario improves this trend such that the extreme poverty rate in this scenario will be 1.6 percentage points lower compared to the Current Path forecast by 2043. The projected extreme poverty rate in this scenario will also be 14.3 percentage points below Africa’s Current Path average in 2043.
Kenya will benefit most from the Free Trade scenario interventions, seeing a decrease of 3.5 million people in the size of its poor population by 2043. Sudan will also see a significant decline in absolute terms with 2.6 million less people being poor by 2043. Somalia, coming from a very high base, sees a 4.6 percentage points reduction in its poverty rate compared to the Current Path forecast by 2043, while 1.3 million fewer people will be poor.
The Financial Flows scenario represents a reasonable but ambitious increase in worker remittances and aid flows to poor countries, and an increase in the stock of foreign direct investment (FDI) and additional portfolio investment inflows to middle-income countries. We also reduced outward financial flows to emulate a reduction in illicit financial outflows.
The intervention is explained here in the thematic part of the website.
IGAD is the second highest recipient of aid among the RECs in Africa. Its average dependence on foreign aid in 2019 (5.1% of GDP) was above Africa’s average of 2.4% of GDP. In the Financial Flows scenario, IGAD’s aid inflows will decline to 1.8% in 2043, 0.11 percentage points above the Current Path forecast. The REC’s downward trajectory mirrors the decline of Africa’s average, which will reach 1.2% in 2043 in the Current Path forecast.
In absolute terms, aid to IGAD will, however, increase both in the Current Path forecast and the Financial Flows scenario. The REC received US$14 billion of foreign aid in 2019, and by 2043 it will receive US$24.4 billion aid in the Financial Flows scenario compared to US$22.3 billion in the Current Path forecast.
South Sudan is much more dependent on foreign aid than any of IGAD’s other seven members: in 2019, the country received foreign aid amounting to 19.6% of GDP, while the next highest was Uganda at 7.1%. This dependency will decrease to 13.1% by 2043 in the scenario, 1.5 percentage points higher than in the Current Path forecast. In absolute terms, however, US$310 million more in foreign aid will flow to South Sudan in the scenario by 2043, compared to the Current Path forecast. Uganda will see the largest increase in absolute terms, at US$921.1 million by 2043. Eritrea’s emphasis on self-reliance means the country has almost entirely resisted offers of foreign aid, leading to foreign aid as a percentage of GDP amounting to 0.2% in 2019. The measure will thus continue to stay 0% across the forecast horizon.
FDI serves as an effective means through which African countries can finance their economic development and increase participation in the global economy. IGAD’s level of FDI inflows, 2.8% of GDP, was the same as Africa’s average in 2019 and will continue to mirror Africa’s Current Path forecast average by 2043 in the Financial Flows scenario at 3.8% of GDP.
Djibouti received the most FDI as a percentage of GDP among IGAD’s members in 2019, 9.2%, which was double the next highest, Uganda, of 4.6% of GDP. The lowest was South Sudan, which only received FDI of 0.2% of GDP in 2019. The latter’s percentage of FDI will hardly increase in this scenario, reaching 0.8 by 2043, while Djibouti’s will decline slightly to 7.3%. The other six members will all see marginal gains.
In absolute terms, Uganda and Ethiopia will see FDI increase by more than US$4 billion in the scenario by 2043 compared to the Current Path forecast. Ethiopia’s foreign aid will total US$22.5 billion by 2043, while South Sudan will only receive US$136 million, highlighting the large discrepancy between IGAD’s members.
African economies and populations are generally growing quite rapidly and thus remittance inflows, as a percentage of GDP, are expected to decrease across Africa to 2043, although not in absolute terms. In the Financial Flows scenario, remittances will increase from US$5.4 billion (2% of GDP) to US$42 billion (3.1% of GDP) by 2043, compared to 2.9% and US$37.6 billion in the Current Path forecast.
The impact of the Financial Flows scenario on remittances differs from country to country given the size of migrant flows and historical trends, among others. Ethiopia, for example, will see a sharp rise in the absolute value of its remittances: remittance flows will grow from US$1.7 billion in 2019 to US$19.7 billion by 2043 in the scenario, reaching 3.3% of GDP. Uganda and Kenya will see their remittances increase substantially over the forecast horizon, while the rest of IGAD’s members will see their flows decline or rise only marginally. South Sudan will see the most dramatic decrease, as remittances falls from 10.1% of GDP in 2019 to -3.4% by 2043, equalling −US$0.6 billion in the scenario. The country will thus become a net sender of remittances.
The effect each scenario has on average income differs markedly, and the Financial Flows scenario has only a marginal effect on IGAD's GDP per capita. The scenario aims to increase foreign aid flows to lower-income countries, boosting government revenues and enabling countries to combat poverty and to implement long-term development plans. It raises the REC’s GDP per capita to US$5 397 by 2043, but this will equate to an increase above the Current Path forecast of only US$84 or 1.6%. The projected GDP per capita in 2043 will also be 32.6% lower than the Current Path average for Africa in 2043.
No member country of IGAD will see an increase above 3%, with the largest rise coming from Uganda at 2.7% in 2043 compared to the Current Path forecast. The effects of the increases in aid will however not be felt during the forecast horizon, with more tangible benefits materialising later.
By 2043, IGAD’s poverty rate in the Financial Flows scenario will be 0.6 percentage points lower than the Current Path forecast at 7.7%, translating to 2.7 million fewer poor people than in the Current Path forecast. The extreme poverty rate in the region will also be 13.2 percentage points lower than Africa’s Current Path average by 2043, a gap which will have widened considerably from 3.6 percentage points in 2019.
The IGAD member that will see the largest decrease in poverty rate will be South Sudan at 2.8 percentage points by 2043. The scenario has a limited effect on poverty reduction and to effectively combat the problem, its interventions must be implemented alongside those detailed in other scenarios.
The Infrastructure scenario represents a reasonable but ambitious increase in infrastructure spending across Africa, focusing on basic infrastructure (roads, water, sanitation, electricity access and ICT) in low-income countries and increasing emphasis on advanced infrastructure (such as ports, airports, railway and electricity generation) in higher-income countries.
Note that health and sanitation infrastructure is included as part of the Health/WaSH scenario and that ICT infrastructure and more rapid uptake of renewables are part of the Leapfrogging scenario. The interventions there push directly on outcomes, whereas those modelled in this scenario increase infrastructure spending, indirectly boosting other forms of infrastructure, including those supporting health, sanitation and ICT.
The intervention is explained here in the thematic part of the website.
The benefits of electricity access are plentiful, as highlighted in Chart 36, but it remains a major stumbling block for Africa’s development, especially in rural areas. In 2019, Africa’s total electricity access stood at 53.2% of the total population, while rural access was only 39.3%. IGAD’s total electricity access was 6.4 percentage points lower than Africa’s average for 2019, but in the Infrastructure scenario, IGAD’s rate will reach 80.1% by 2043, 7.4 percentage points higher than Africa’s Current Path forecast.
Kenya will reach the highest total rate of electricity access in the Infrastructure scenario by 2043 at 90.9%, while South Sudan will remain as the IGAD member with the lowest rate at 41.3%, although it will see the largest increase compared to the Current Path forecast of 20.7 percentage points. Compared to its 2019 level, Uganda will experience the largest increase by 2043 of 43.4 percentage points, followed by Ethiopia at 39.5 percentage points.
Indicator 9.1.1 in the Sustainable Development Goals refers to the proportion of the rural population who live within 2 km of an all-season road and is captured in the Rural Access Index.
The Rural Access Index reflects urban–rural connectivity and the ease with which rural populations can access the benefits of larger markets and better services. IGAD’s Rural Access Index score was 50.6% in 2019, below the 53% average for Africa in the same year. The Infrastructure scenario helps to boost this figure to 62.7% by 2043, 2.8 percentage points higher than the Current Path forecast. The REC’s score will place it 3.6 percentage points above Africa’s Current Path forecast average score by 2043.
Three of IGAD’s members, Sudan, Djibouti and Kenya, scored above Africa’s average of 53% in 2019, the highest score being Sudan’s at 68.5%. The lowest score was Uganda’s, with only 34.5% of its rural population having access to an all-weather road in 2019. By 2043, Ethiopia and Eritrea will also score above Africa’s Current Path forecast average of 59.1%, while South Sudan will see its gap to Africa grow 1.4 percentage points to 4.3 percentage points. Both Uganda and Somalia will have access rates below 50% by 2043.
The Infrastructure scenario lays the foundation for future economic growth, and the scenario only appreciably increases GDP per capita towards the end of the forecast horizon. As such, the scenario increases IGAD’s GDP per capita: by 2043, average incomes are projected to be US$189, or 3.6%, higher than in the Current Path forecast, reaching US$5 502. The projected GDP per capita in this scenario will however be 30.1% below the Current Path average for Africa.
South Sudan will experience the largest increase in GDP per capita by 2043 compared to the Current Path forecast, seeing a 6.2% increase in the Infrastructure scenario. In contrast, Kenya will see an increase of only 1.4% by 2043. All of IGAD’s members will continue to lag behind Africa’s average GDP per capita of US$7 157, except Djibouti, whose average income reaches US$7 274 by 2043.
Increased investment on infrastructure will have the second smallest impact on poverty reduction of all 11 scenarios, only behind the Health/WaSH scenario. IGAD’s poverty rate will only decline by half a percentage point by 2043 compared to the Current Path forecast, although the rate will fall from 31.2% in 2019 to 7.7% by 2043.
At country level, no country will see a reduction larger than 2 percentage points and only Uganda’s poor population will shrink by more than a million people. The scenario aims to lay the foundation for increased development in the long term, not to combat poverty in the short to medium term, which explains the limited effect it has on poverty reduction.
The Governance scenario represents a reasonable but ambitious improvement in accountability and reduces corruption, and hence improves the quality of service delivery by government.
The intervention is explained here in the thematic part of the website.
As defined by the World Bank, government effectiveness ‘captures perceptions of the quality of public services, the quality of the civil service and the degree of its independence from political pressures, the quality of policy formulation and implementation, and the credibility of the government’s commitment to such policies’.
Chart 51 presents the impact of the interventions in the Governance scenario on government effectiveness.
Corruption in Africa is endemic, and it slows growth and development, deters potential investors and hampers effective service delivery. Increasing governments’ abilities to responsibly serve their citizens is crucial for poverty alleviation on the continent. The average score for IGAD in the World Bank’s government effectiveness index highlights the problem. In 2019, the REC only scored 1.3 out of 5 in the index, 0.4 points below Africa’s average. The Governance scenario helps IGAD to improve but still only manages to raise the REC’s score to 2 by 2043, 8.7% above the Current Path but 11% below Africa’s Current Path forecast average.
Kenya, Uganda and Ethiopia all had scores above Africa’s score of 1.7 in 2019, while Djibouti will join these three countries by 2043 in the Governance scenario. Somalia and South Sudan were among the worst performing countries in Africa, ranked 53rd and 54th, respectively, on the continent in 2019, and by 2043 both will still occupy these spots. South Sudan in particular will continue to struggle, only scoring 0.6 in the scenario by 2043.
The GDP per capita for IGAD is expected to only marginally increase in the Governance scenario compared to the Current Path forecast: by 2043, the REC’s GDP per capita is projected to reach US$5 479 in the scenario, US$166, or 3.1%, higher than the Current Path forecast. The small rise means IGAD only somewhat decreases the gap to Africa’s average GDP per capita in the Current Path forecast.
The impact of the scenario on IGAD’s members is fairly homogeneous, with the largest increase being 3.9% for Eritrea and the smallest increase being 2.2% for Kenya, compared to the Current Path forecast for 2043. More effective governance in the form of reduced corruption, adherence to rule of law, etc., creates an enabling environment for the government to implement long-term development plans and attract foreign investment into the country. The benefits of more efficient bureaucracy will be fully felt over a long period, beyond the forecast horizon.
Improved governance holds various long-term benefits for development and results in decreases in poverty but over the forecast horizon the Governance scenario does little to combat IGAD’s poverty. The REC will experience a small decrease in its poverty rate of 0.6 percentage points by 2043 compared to the Current Path forecast, which translates to a reduction of 2.8 million poor people.
No individual member country will see a decrease larger than 1.8 percentage points by 2043 compared to the Current Path forecast, a mark attained by Djibouti. Sudan will see a reduction in the size of its poor population of 840 000 people, the biggest decrease in absolute terms among IGAD’s members by 2043
This section presents projections for carbon emissions in the Current Path for IGAD and the 11 scenarios. Note that IFs uses carbon equivalents rather than CO2 equivalents.
The increased economic activity each scenario envisages means IGAD produces more carbon emissions than in the Current Path, except in the Demographic and Leapfrogging scenarios, where a smaller population size and more sustainable methods of electricity generation result in emissions decreasing. The Free Trade scenario increases the REC’s carbon emissions the most relative to the Current Path forecast by 2043, with an increase of 10 million tons of carbon, followed by a three-way tie between the Manufacturing/Transfers, Stability and Infrastructure scenarios. The Leapfrogging scenario highlights the merits of pursuing growth in a sustainable manner, as the scenario decreases IGAD’s carbon emissions by 13 million tons of carbon but increases the REC’s GDP the most above the Current Path forecast for 2043.
Two members will not produce the most carbon in the Free Trade scenario by 2043 — Somalia and South Sudan, the latter produces 0.1 million tons more carbon in the Stability scenario than in the Free Trade scenario, while the former produces 0.3 million tons of carbon more in the Leapfrogging scenario. All the other members will see their emissions rise the most in the Free Trade scenario, with Ethiopia seeing the largest increase at 3.3 million tons of carbon by 2043.
The Combined Agenda 2063 scenario consists of the combination of all 11 sectoral scenarios presented above, namely the Stability, Demographic, Health/WaSH, Agriculture, Education, Manufacturing/Transfers, Leapfrogging, Free Trade, Financial Flows, Infrastructure and Governance scenarios. The cumulative impact of better education, health, infrastructure, etc. means that countries get an additional benefit in the integrated IFs forecasting platform that we refer to as the synergistic effect. Chart 55 presents the contribution of each of these 12 components to GDP per capita in the Combined Agenda 2063 scenario as a stacked area graph.
The Free Trade scenario will increase IGAD’s GDP per capita the most in 2043 compared to the Current Path forecast, followed by the Leapfrogging and Agriculture scenarios. A higher volume of regional trade will raise average incomes by an additional US$662 by 2043, while the sustainable development espoused by the Leapfrogging scenario increases GDP per capita by US$377. The Agriculture scenario has the most impact in the early parts of the forecast horizon but is overtaken by the Free Trade scenario in 2038 as the African Continental Free Trade Area (AfCFTA) starts to take effect.
Six out of IGAD’s eight members will also benefit most from the Free Trade scenario’s interventions, while Somalia will gain more from the Leapfrogging scenario and South Sudan will see a bigger increase in the Stability scenario. Encouragingly, the shift towards more productive jobs encouraged by the Manufacturing/Transfers scenario ranks second for Djibouti and third for Eritrea, Kenya and Uganda, increasing the latter’s GDP per capita by US$475 in 2043 compared to the Current Path forecast.
Whereas Chart 55 presents a stacked area graph on the contribution of each scenario to GDP per capita as well as the additional benefit or synergistic effect, Chart 56 presents only the GDP per capita in the Current Path forecast and the Combined Agenda 2063 scenario.
The combined effect of implementing all 11 scenario’s interventions is impressive, potentially raising IGAD’s GDP per capita by an additional US$3 416, equivalent to 64.3%, compared to the Current Path forecast to reach US$8 729 by 2043. An increase of that magnitude will raise the REC’s GDP per capita 22% above Africa’s projected average of US$7 157 in the Current Path forecast.
The average Ugandan is expected to be much better off in the Combined Agenda 2063 scenario by 2043 compared to the Current Path forecast as average incomes will rise by an additional 99%, or US$4 791, reaching US$9 637. In the process, Uganda will overtake Djibouti as the country with the highest GDP per capita among IGAD’s members, while Somalia will remain the member with the lowest GDP per capita at US$2 497 in 2043. The combined effect of the Combined Agenda 2063 scenario’s interventions will still put Somalia US$4 660 below Africa’s Current Path forecast average of US$7 157 for 2043.
The Combined Agenda 2063 scenario envisages a remarkable decrease in IGAD’s extreme poverty rate and the size of its poor population, highlighting the potential benefits of broad, integrated reforms across multiple sectors. The REC’s poverty rate will drop by 6.6 percentage points compared to the Current Path forecast for 2043, a decline which means IGAD will eliminate poverty by 2041. This is comparable to 32.5 million fewer poor people living below the US$1.90 per day poverty line by 2043 when contrasting the scenario with the Current Path forecast.
Three of IGAD’s members will follow suit and eliminate poverty by 2043 in the Combined Agenda 2063 scenario: Ethiopia, Eritrea and Uganda. The countries most hampered by poverty, Somalia, South Sudan and Sudan, will all see significant reductions in their poverty rates, with decreases of 30, 22.6 and 15.5 percentage points, respectively. South Sudan in particular will experience a radical transformation, as its poverty rate falls from 79.4% in 2019 to 27.7% by 2043.
See Chart 8 to view the Current Path forecast of the sectoral composition of the economy.
IGAD’s service sector will expand rapidly in the Combined Agenda 2063 scenario: by 2043, the sector will add 5.8 percentage points more as a percentage of GDP, equivalent to an additional US$769.5 billion compared to the Current Path forecast, reaching a value of US$1 578 billion by 2043. In contrast, the manufacturing sector’s contribution to total GDP will decline by 4.2 percentage points by 2043, although its absolute value will increase by an extra US$86.2 billion compared to the Current Path forecast. The growth of the service sector will be remarkable: its contribution will rise from 50.2% in 2019 to 66.9% in 2043, while manufacturing will only grow by 1.8 percentage points over that time in the Combined Agenda 2063 scenario. The agriculture and ICT sectors will also contribute an additional US$71.3 billion and US$82.6 billion to GDP, respectively, in the scenario. ICT’s contribution to GDP will correspond to 0.4 percentage points above the Current Path forecast while agriculture’s contribution will be a percentage point below the Current Path forecast.
The one member who will experience a different trajectory is South Sudan, as explained in Chart 8. The contribution of services does increase, by 6 percentage points in 2043, but the sector with value added as a percentage of GDP the most is the energy sector — its contribution will be 10.5 percentage points less by 2043 in the scenario compared to the Current Path forecast. The other countries will all see their manufacturing sector grow in absolute terms but its contribution as a total of GDP fall. Eritrea will see the largest decrease of 11.3 percentage points by 2043, followed by Sudan and Ethiopia. The Combined Agenda 2063 scenario’s interventions push all of IGAD’s members value added from manufacturing, as a percentage of GDP, below Africa’s Current Path forecast for 2043 of 22.3%.
Chart 5 shows IGAD’s Current Path forecast for GDP and highlights the significant growth the REC will experience from 2019 to 2043. The Combined Agenda 2063 scenario builds on this trend significantly, as the economy will be 78.3% larger by 2043 in the scenario compared to the Current Path forecast, an increase of US$1 035.5 billion. The remarkable growth envisaged by the scenario means the REC’s GDP will equate to US$2 357.7 billion by 2043, an incredible increase in excess of 700% from 2019.
Three countries, Uganda, Somalia and Eritrea, will see their GDP double by 2043 in the scenario compared to the Current Path forecast, with Uganda seeing the largest rise of 111.8%. In absolute terms, Ethiopia will experience the largest increase, of US$370.8 billion by 2043, which equates to a rise of 63%. The Ethiopian economy will however constitute a slightly smaller percentage of IGAD’s total GDP by 2043, at 40.9% compared to 44.7% in the Current Path forecast. Both Uganda and Kenya will see their shares grow marginally, by 3.4 and 0.3 percentage points respectively.
The consequence of increased economic activity and prosperity envisaged, as projected in the Combined Agenda 2063 scenario, will inevitably lead to an increase in carbon emissions, but IGAD’s projected increases are imminently manageable. By 2043, carbon emissions are expected to be 68 million metric tons of carbon, only 6 million tons more than in the Current Path forecast. Although the increase is relatively small, 9.7%, attention should still be given to ways to combat rising emissions as development occurs.
Ethiopia will have the largest increase in carbon emissions by 2043 compared to the Current Path forecast, as emissions increase by 96%. This is predictable given the economic growth the country is likely to experience in the Combined Agenda 2063 scenario, as detailed in Chart 59. The largest increase in absolute terms however will come from Uganda, which will produce 12.6 million tons more carbon by 2043 than in the Current Path forecast. IGAD’s members will account for 6.4% of Africa’s total emissions by 2043, with Uganda having the largest share at 2.9% in the Combined Agenda 2063 scenario.
Page information
Contact at AFI team is Du Toit McLachlan
This entry was last updated on 28 May 2026 using IFs v7.63.
Donors and sponsors


Reuse our work
- All visualizations, data, and text produced by African Futures are completely open access under the Creative Commons BY license. You have the permission to use, distribute, and reproduce these in any medium, provided the source and authors are credited.
- The data produced by third parties and made available by African Futures is subject to the license terms from the original third-party authors. We will always indicate the original source of the data in our documentation, so you should always check the license of any such third-party data before use and redistribution.
- All of our charts can be embedded in any site.
Cite this research
Du Toit McLachlan (2026) IGAD Development Futures. Published online at futures.issafrica.org. Retrieved from https://futures.issafrica.org/geographic/recs/igad/ [Online Resource] Updated 28 May 2026.