 ECCAS
ECCAS
Feedback welcome
Our aim is to use the best data to inform our analysis. See our Technical page for information on the IFs forecasting platform. We appreciate your help and references for improvements via our feedback form.
This page explores the establishment, growth and projections for the Economic Community of Central African States (ECCAS), founded on 18 October 1983 by signing in Libreville of its Constitutive Treaty. ECCAS consists of 11 countries and is one of the eight Regional Economic Communities (RECs) recognised by the African Union.
The assessment discusses the region's demographics, economic sectors and various development scenarios with a forecast horizon to 2043. The analysis also highlights the importance of governance and infrastructure improvements for economic and social development. It further addresses challenges such as energy demand and poverty, suggesting that strategic initiatives across all sectors could greatly benefit the region's prosperity and stability. It emphasises the potential impacts of these scenarios on GDP, GDP per capita, life expectancy, education, industrialisation, poverty reduction, inequality and carbon emissions.
For more information about the International Futures modelling platform that we use for the development of the various scenarios, please see About this Site.
Summary
We begin this page with an introductory assessment of the region’s context by looking at current population distribution, social structure, climate and topography.
- According to the 2024 World Bank country income group classification, ECCAS is composed of 5 low-income countries, 4 lower-middle-income countries and only 2 upper-middle-income countries.
This section is followed by an analysis of the Current Path for ECCAS which informs the region’s likely current development trajectory to 2043. It is based on current geopolitical trends and assumes that no major shocks would occur in a ‘business-as-usual’ future.
- The total population of ECCAS increased from 84.6 million people in 1990 to 231.1 million in 2023 and is expected to grow to 404.5 million by 2043.
- The combined GDP of ECCAS has nearly tripled from US$89 billion in 1990 to US$235.6 billion in 2023. It will reach US$757.4 billion by 2043.
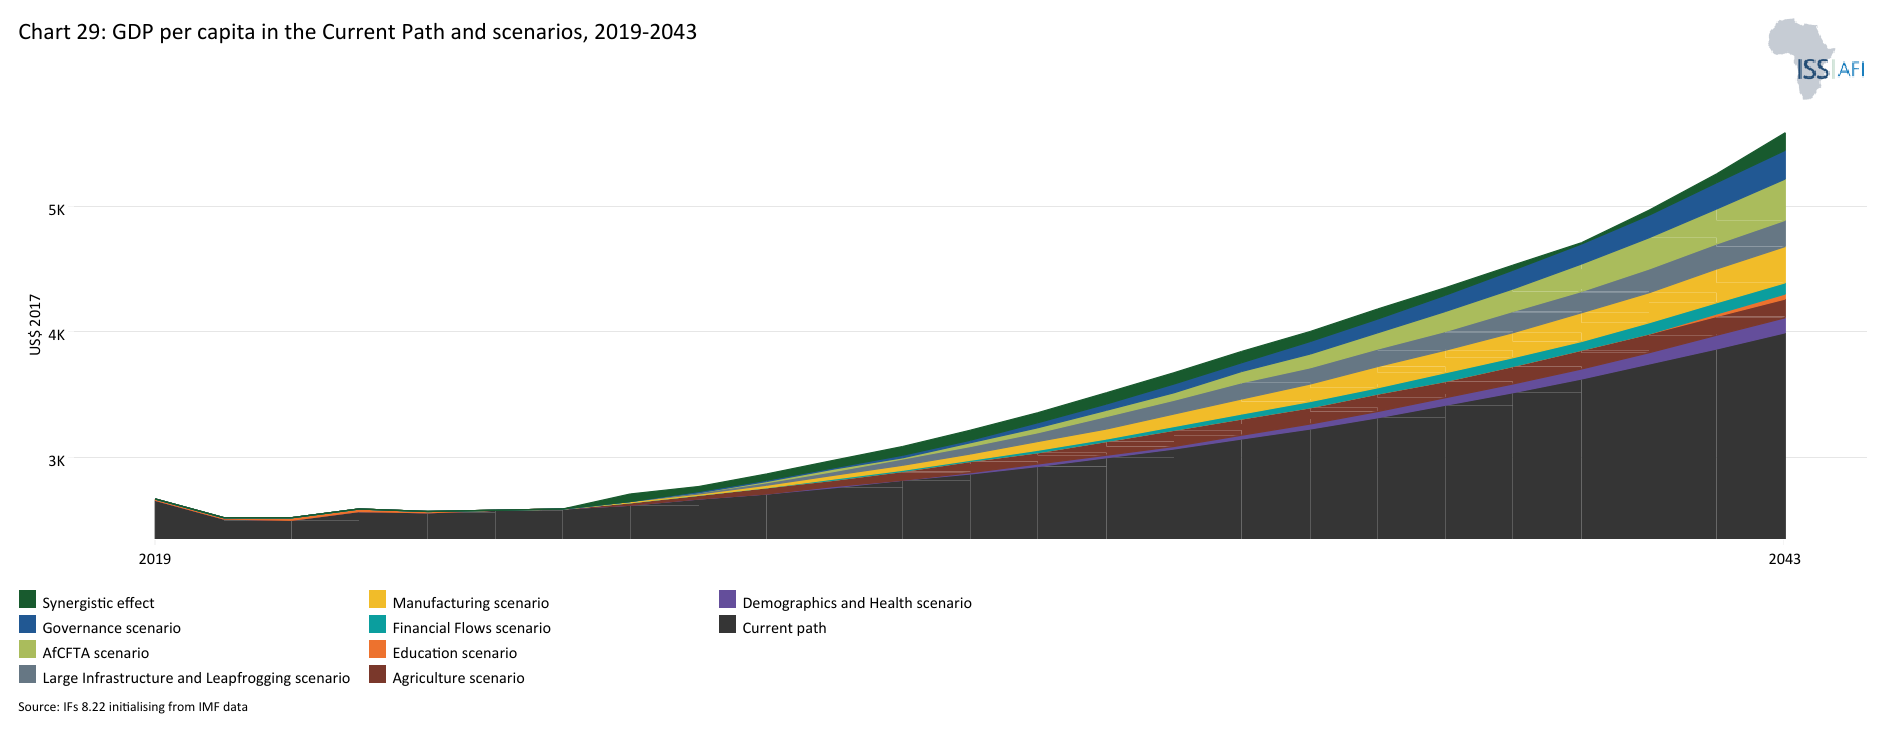
- The average GDP per capita decreased from US$2 896 in 1990, to US$2 568 in 2023, compared to Africa’s average of US$4 798. By 2043, the average GDP per capita of ECCAS will be US$3 992, below Africa’s average of US$6 208.
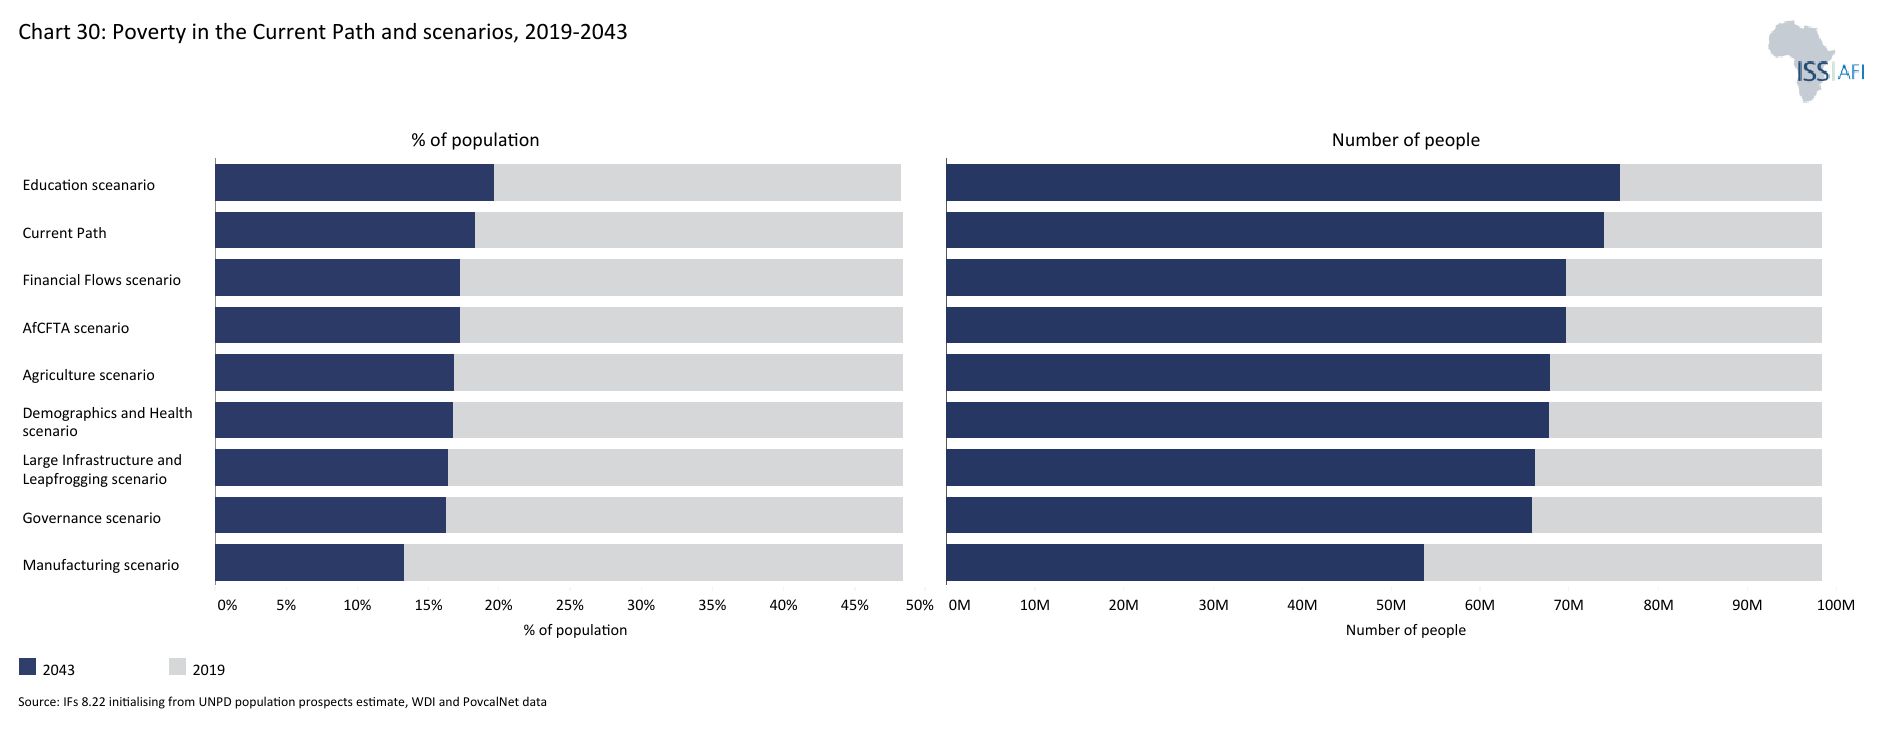
- In 2023, approximately 107.6 million people, or 46.6% of the total ECCAS population, lived below the poverty line of US$2.15. This figure will decline to 73.9 million by 2043, representing 18% of the total population.
- ECCAS’s development agenda is guided by a focus on six key integration priorities—Peace and Security, Economic Integration, Physical Connectivity, Sustainable Development, Social Welfare, and Institutional Reform—aimed at fostering a peaceful, secure and a stable Central Africa through regional cooperation and collective self-reliance.
The next section compares progress on the Current Path with eight sectoral scenarios. These are Demographics and Health; Agriculture; Education; Manufacturing; the African Continental Free Trade Area (AfCFTA); Large Infrastructure and Leapfrogging; Financial Flows; and Governance. Each scenario is benchmarked to present an ambitious but reasonable aspiration in that sector.
- The Demographics and Health scenario projects a dramatic decline in infant mortality, from 41 deaths per 1 000 live births in 2023 to 15.9 by 2043, exceeding the Current Path by 6.8 deaths. However, despite this progress, ECCAS will miss the potential demographic window of opportunity, with the working-age population to dependent ratio reaching only 1.51:1 by 2043, falling short of the 1.7:1 threshold.
- ECCAS's agricultural import dependence, which stood at 8.8% in 2023, will decrease significantly under the Agriculture scenario, reaching 8.2% by 2043. This marks a substantial improvement compared to the Current Path of 25.9%, demonstrating the region's growing self-sufficiency in agricultural production.
- In 2023, the average adult aged 15-24 in ECCAS had completed 6.6 years of education, falling short of Africa's average of 7.1 years. Under the Education scenario, this figure will rise to 8.5 years by 2043, surpassing the Current Path of 8.1 years.
- ECCAS demonstrates significant progress in industrialisation under the Manufacturing scenario. By 2043, the manufacturing sector's contribution to GDP will increase to 24.5%, surpassing the African average and solidifying ECCAS's position as the region with the highest manufacturing value-added share among all RECs.
- The AfCFTA scenario paints a promising picture for ECCAS trade. While the region currently enjoys a trade surplus, AfCFTA is projected to transform ECCAS into a net exporter by 2043, with the trade balance reaching 100% of GDP, compared to the 78.8% under the Current Path.
- In the Large Infrastructure and Leapfrogging scenario, ECCAS's progress in energy access is significant. Electrification rates will increase from 34.2% in 2023 to 62.9% by 2043, while clean cooking adoption will rise from 15.9% to 22.7% during the same period. These improvements surpass the Current Path.
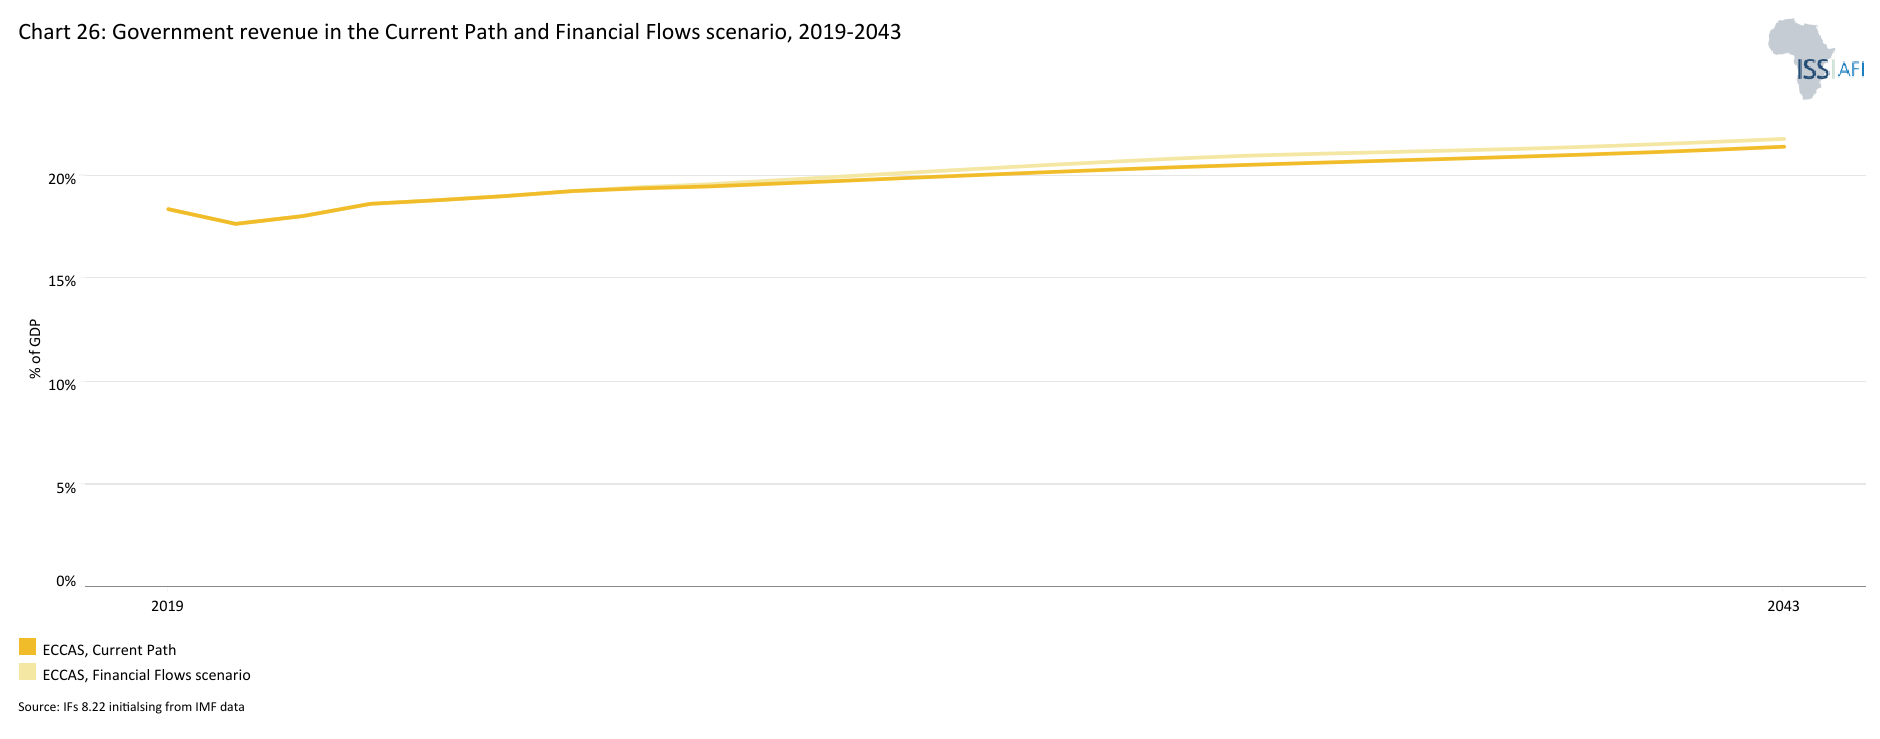
- The Financial Flows scenario projects a significant increase in FDI inflows to ECCAS. This boost in foreign investment will drive government revenue, which will reach US$170.6 billion by 2043, representing a 21.8% share of GDP, surpassing the Current Path by US$380 million.
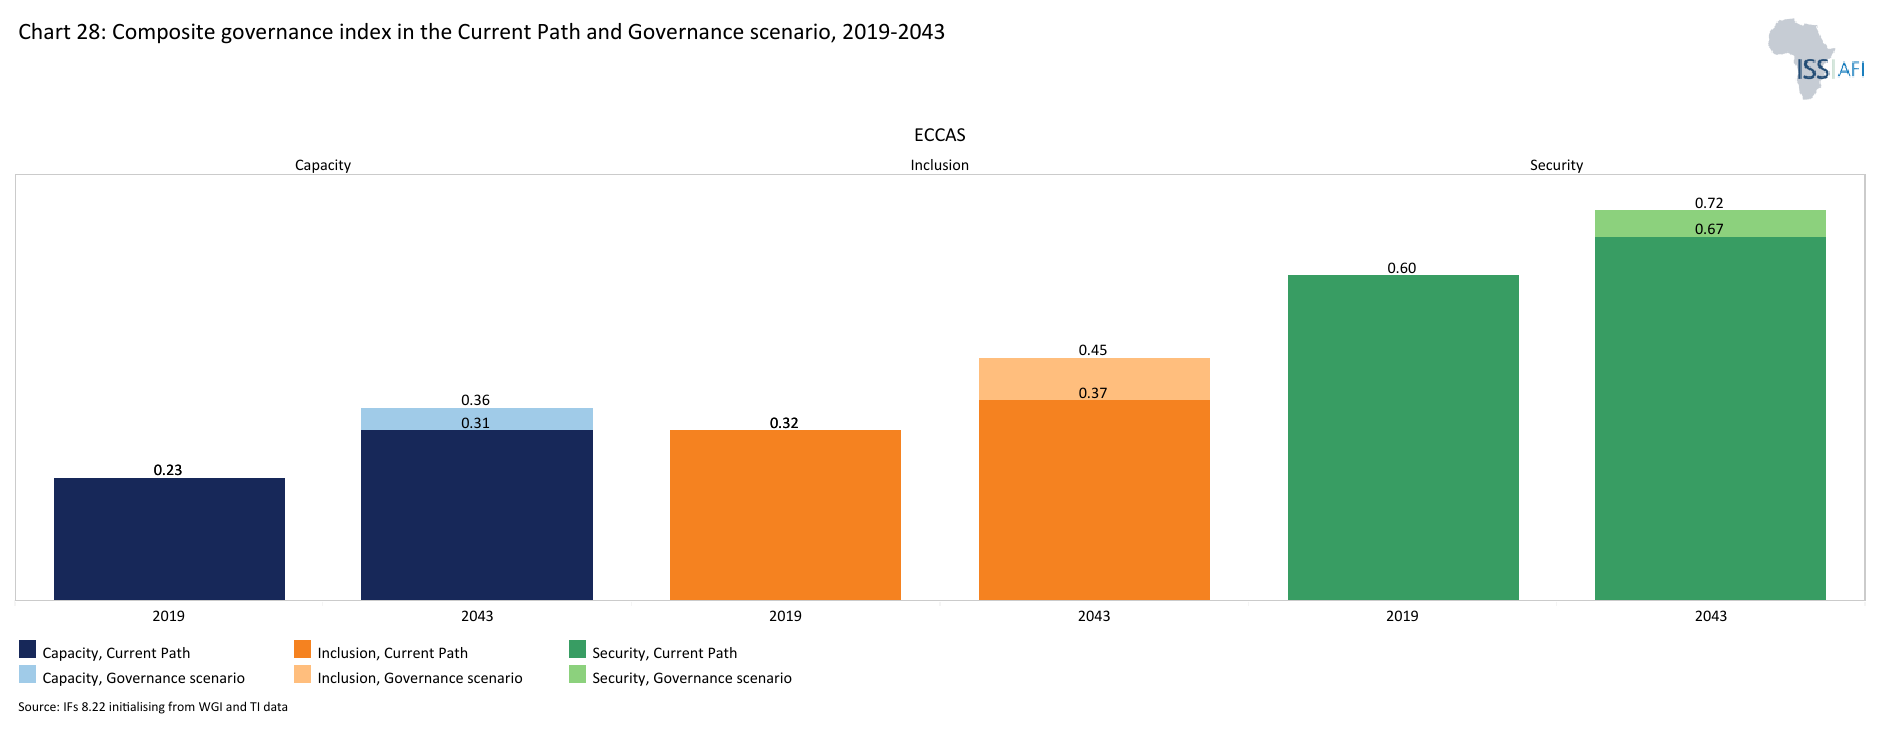
- In the Governance scenario, by 2043, the region will score significantly higher on the Governance Security Index compared to the Current Path, with a 17% improvement in government effectiveness, a 20% improvement in capacity and a 21% improvement in inclusion.
In the third section, we compare the impact of each of these eight sectoral scenarios with one another and subsequently with a Combined scenario (the integrated effect of all eight scenarios). In our forecasts, we measure progress on various dimensions such as economic size (in market exchange rates), gross domestic product per capita (in purchasing power parity), extreme poverty, carbon emissions, the changes in the structure of the economy, and selected sectoral dimensions such as progress with mean years of education, life expectancy, the Gini coefficient or reductions in mortality rates.
- By 2043, the AfCFTA scenario will have the greatest impact on GDP per capita, followed by the Manufacturing and Governance scenarios.
- The Manufacturing scenario will be the most impactful in reducing poverty, followed by the Education and Governance scenarios.
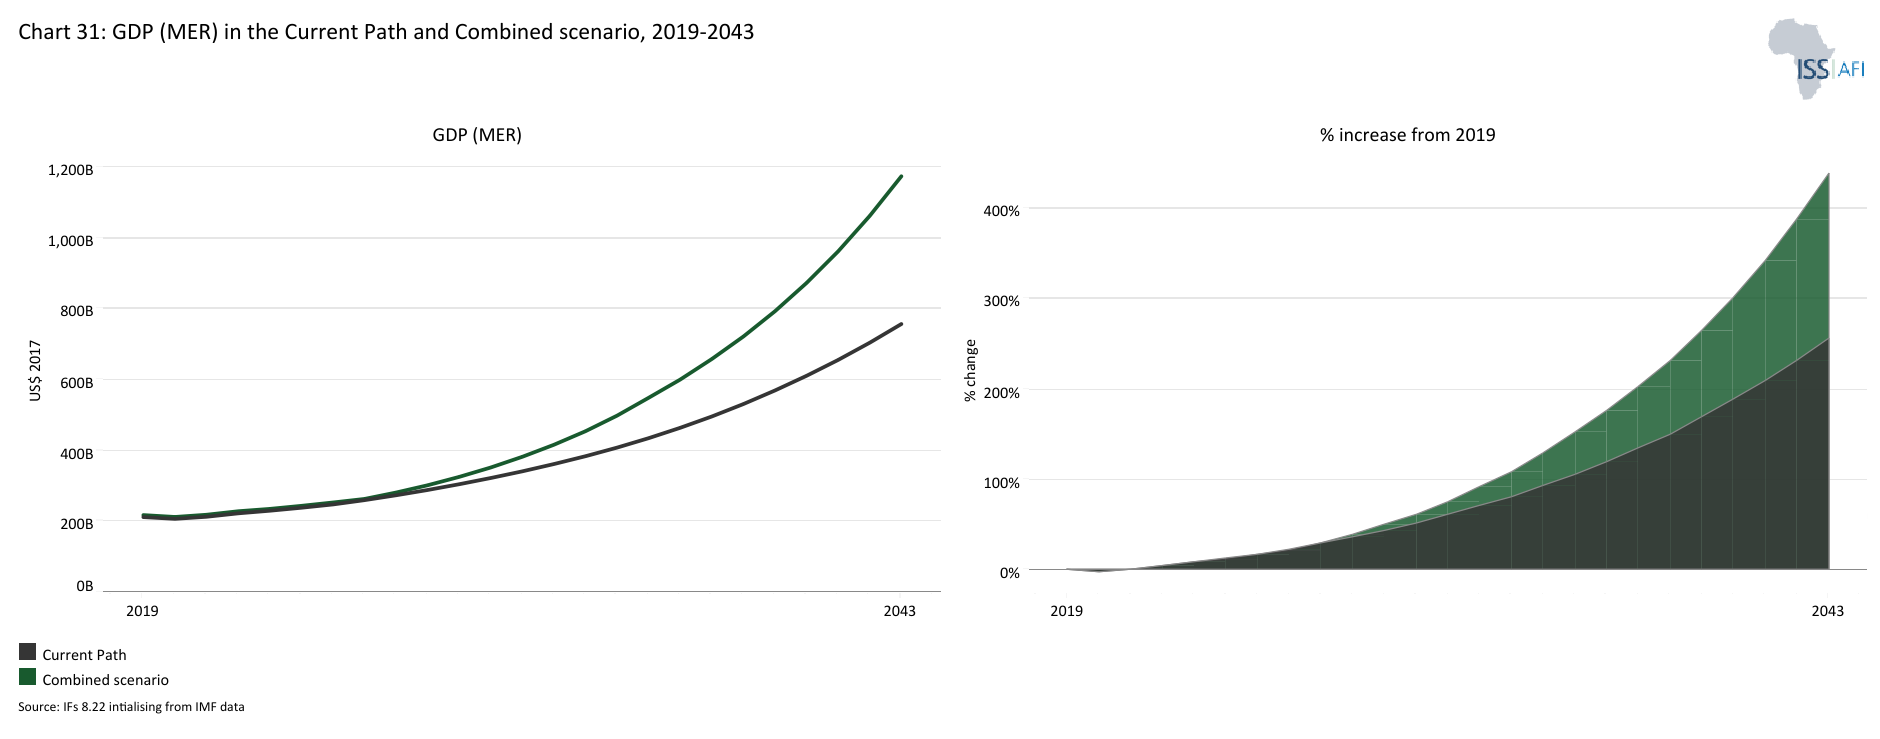
- ECCAS’s GDP will increase to US$1.2 trillion under the Combined scenario.
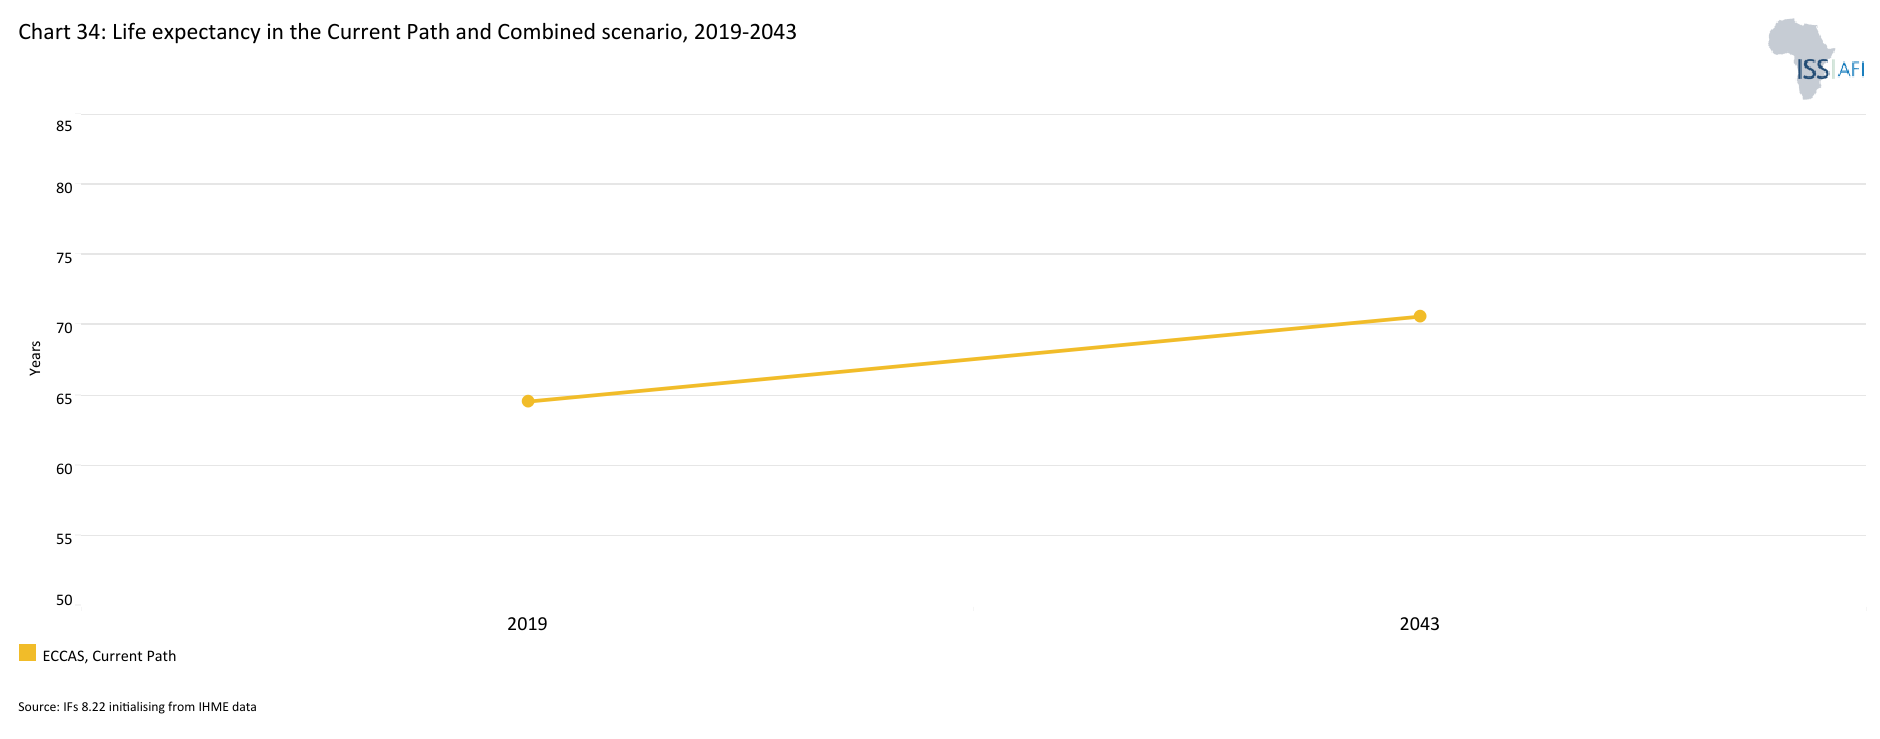
- The average life expectancy will reach 72.2 years by 2043, compared to 70.6 years in the Current Path.
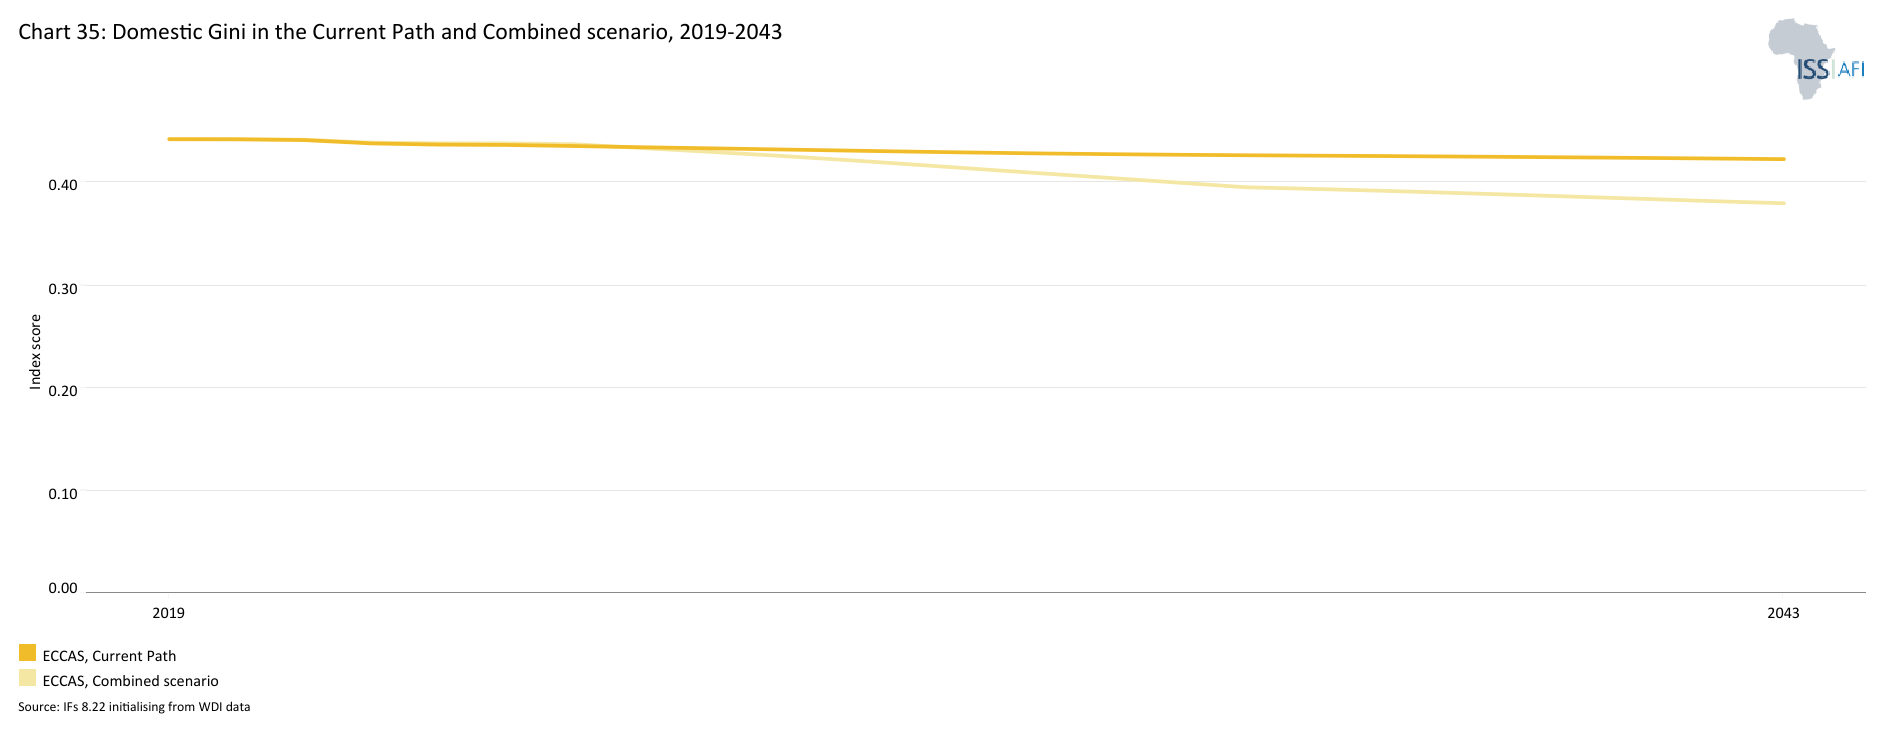
- The Gini coefficient will decrease to 0.38 by 2043 compared to 0.42 in the Current Path.
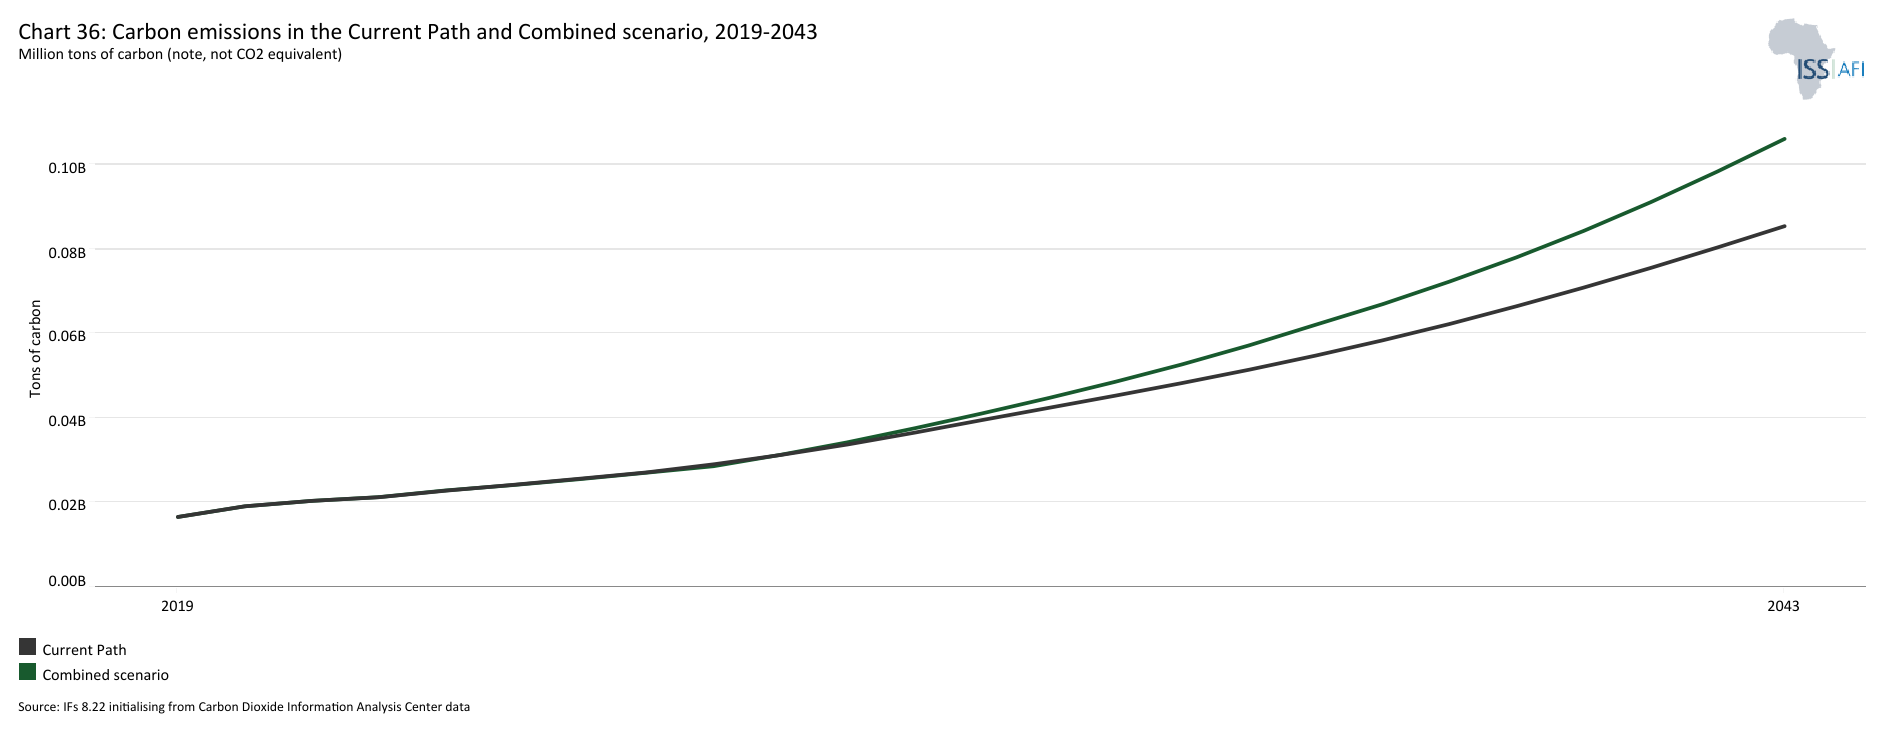
- Total carbon emissions will reach 110 million tons by 2043 in the Combined scenario. This is 29.4% above the Current Path.
We end this page with a summarising conclusion offering key recommendations for decision-making.
ECCAS faces significant challenges, including persistent political instability, ongoing conflicts and a lack of economic diversification. The region's dependence on natural resources, particularly oil and minerals, has made it vulnerable to global price fluctuations. Moreover, climate change is exacerbating existing challenges, such as deforestation and desertification. To overcome these obstacles, ECCAS must prioritise peace and security, promote sustainable development and strengthen regional cooperation. This requires targeted investments in infrastructure, education and healthcare, as well as effective governance and institutional reforms.
All charts for ECCAS
- Chart 1: Political map of ECCAS
- Chart 2: Population structure in Current Path, 2019–2043
- Chart 3: Population distribution map, 2023
- Chart 4: Rural and urban population 1990 – 2043 in Current Path
- Chart 5: Stacked area chart of GDP in MER and growth in the Current Path, 1990–2043
- Chart 6: Size of the informal economy as per cent of GDP and per cent of total labour (non-agriculture), 2019-2043
- Chart 7: GDP per capita in Current Path, 1990–2043
- Chart 8: Extreme poverty in Current Path as per cent of population and numbers, 2019–2043
- Chart 9: Regional Development Plan of ECCAS
- Chart 10: Relationship between Current Path and scenarios
- Chart 11: Mortality distribution in 2023
- Chart 12: Infant mortality rate in Current Path and Demographics and Health scenario, 2019–2043
- Chart 13: Demographic dividend in the Current Path forecast and the Demographics and Health scenario, 2019–2043
- Chart 14: Crop production and demand, 1990-2043
- Chart 15: Import dependence in the Current Path and Agriculture scenario, 2019–2043
- Chart 16: Progress through the educational funnel in the country compared to income group (2023 and 2043)
- Chart 17: Mean years of education in Current Path and Education scenario, 2019–2043
- Chart 18: Current Path manufacturing, share of GDP, compared to Africa, 2019 to 2043
- Chart 19: Value-add of the manufacturing sector in Current Path and Manufacturing scenario, 2019–2023
- Chart 20: Exports and imports as a percent of GDP, 1990 to 2043
- Chart 21: Trade balance in Current Path and AfCFTA scenario, 2019–2043
- Chart 22: Current Path access to electricity: urban, rural and total, 1990 to 2043
- Chart 23: Cookstove usage in Current Path and Large Infra/Leapfrogging scenario, 2019–2043
- Chart 24: Access to mobile and fixed broadband in Current Path and Large Infra/Leapfrogging scenario, 2019–2043
- Chart 25: Trends in FDI, aid and remittances as a % of GDP, 1990 to 2043
- Chart 26: Government revenue in Current Path and Financial Flows scenario, 2019–2043
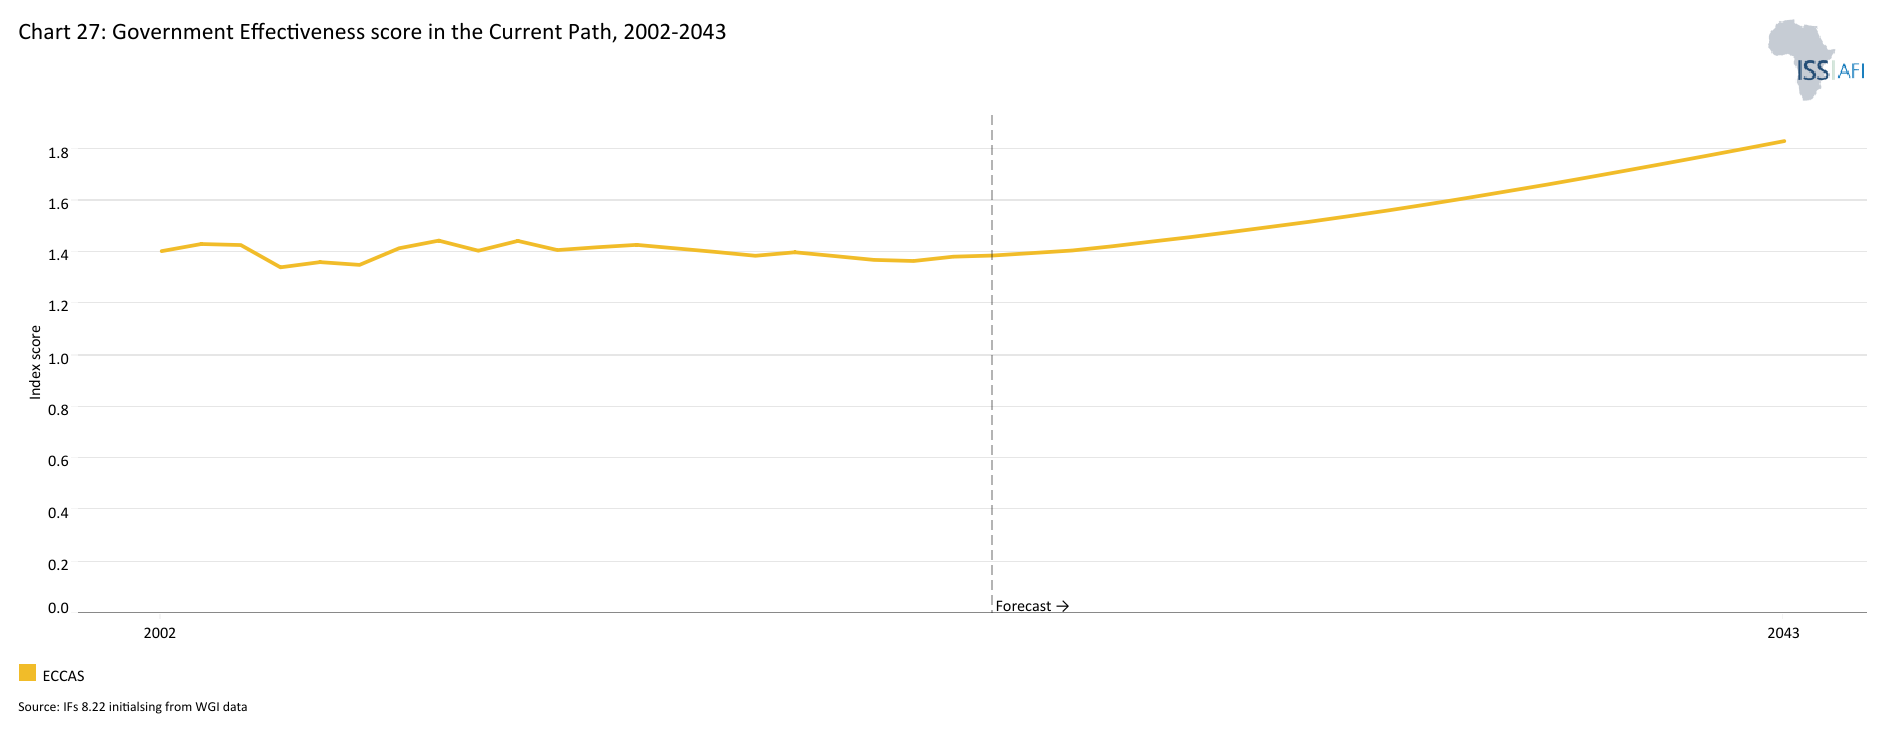
- Chart 27: Current Path of government effectiveness, 1990 to 2043
- Chart 28: Composite governance index in Current Path vs Governance scenario, 2019–2043
- Chart 29: GDP per capita in Current Path and sectoral scenarios, 2019–2043
- Chart 30: Poverty in Current Path and sectoral scenarios, 2019–2043
- Chart 31: GDP (MER) in Current Path and Combined scenario, 2019–2043
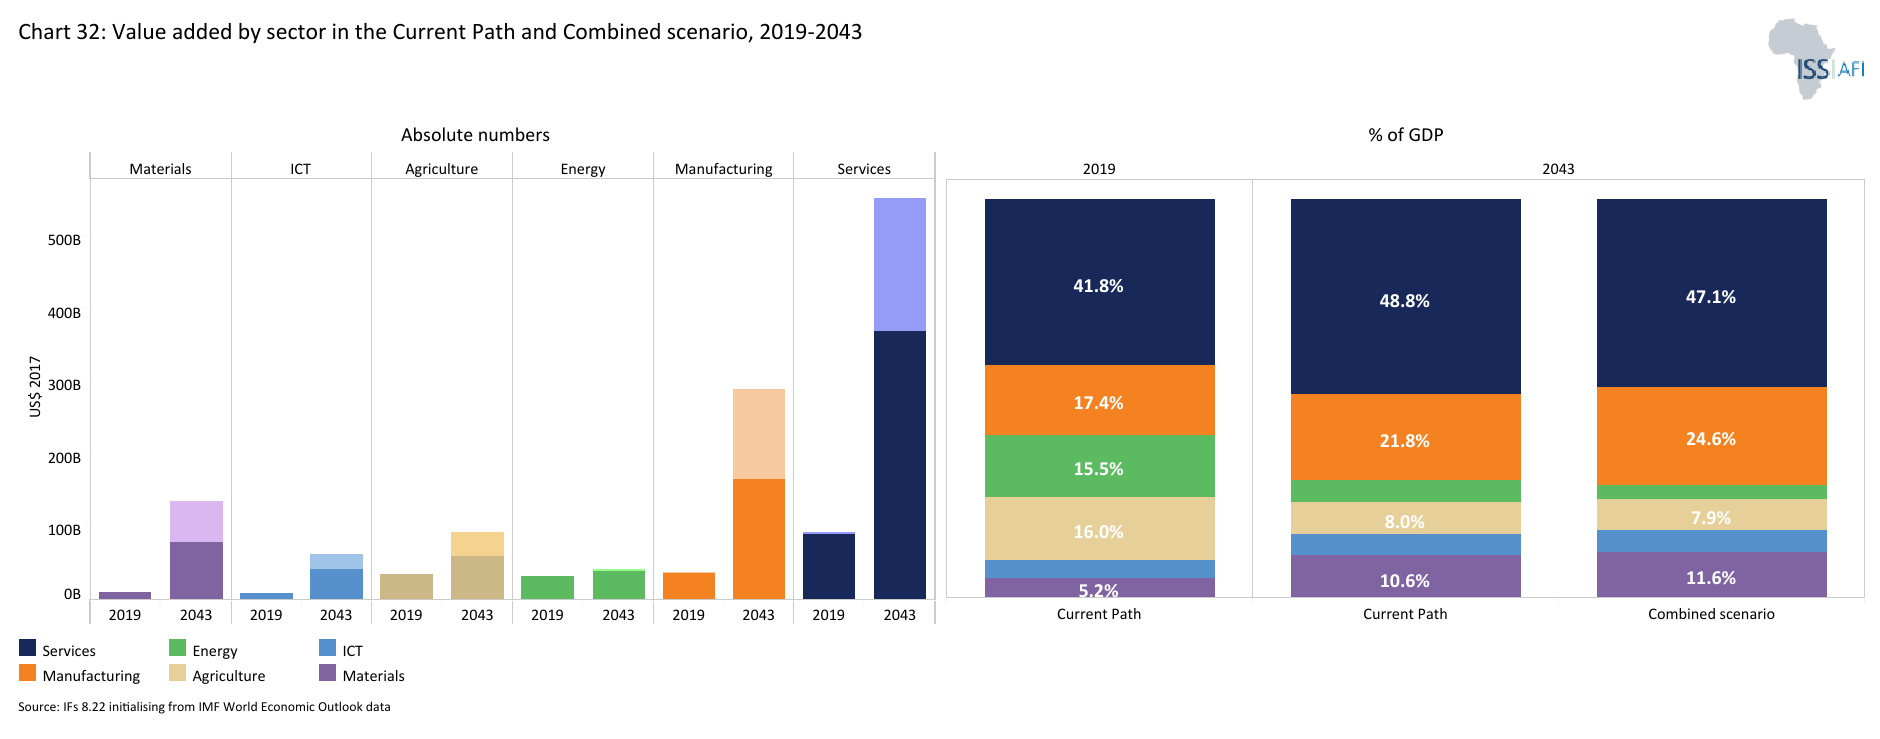
- Chart 32: Value added by sector in Current Path and Combined scenario, 2019–2043
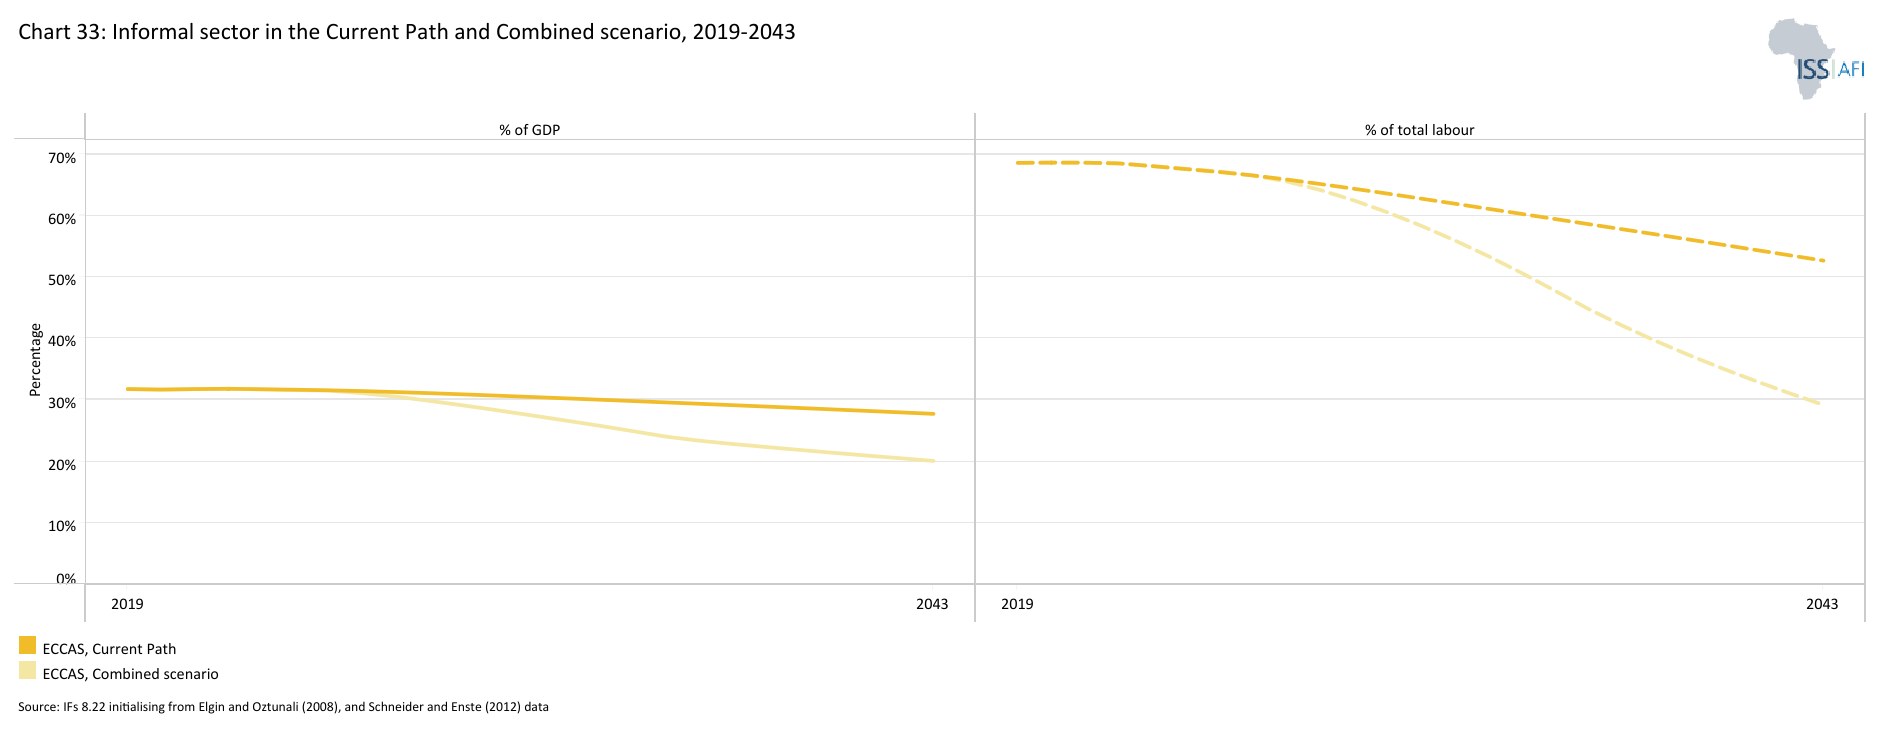
- Chart 33: Informal sector as % of total economy in Current Path and Combined scenario, 2019–2043
- Chart 34: Life expectancy in Current Path and Combined scenario, 2019–2043
- Chart 35: Domestic Gini in Current Path and the Combined Agenda 2063 scenario, 2019–2043
- Chart 36: Carbon emissions in Current Path and in Combined Agenda 2063 scenario, 2019–2043
- Chart 37: Energy production by type in Current Path forecast and Combined Agenda 2063 scenario, 2019-2043
- Chart 38: Policy recommendations
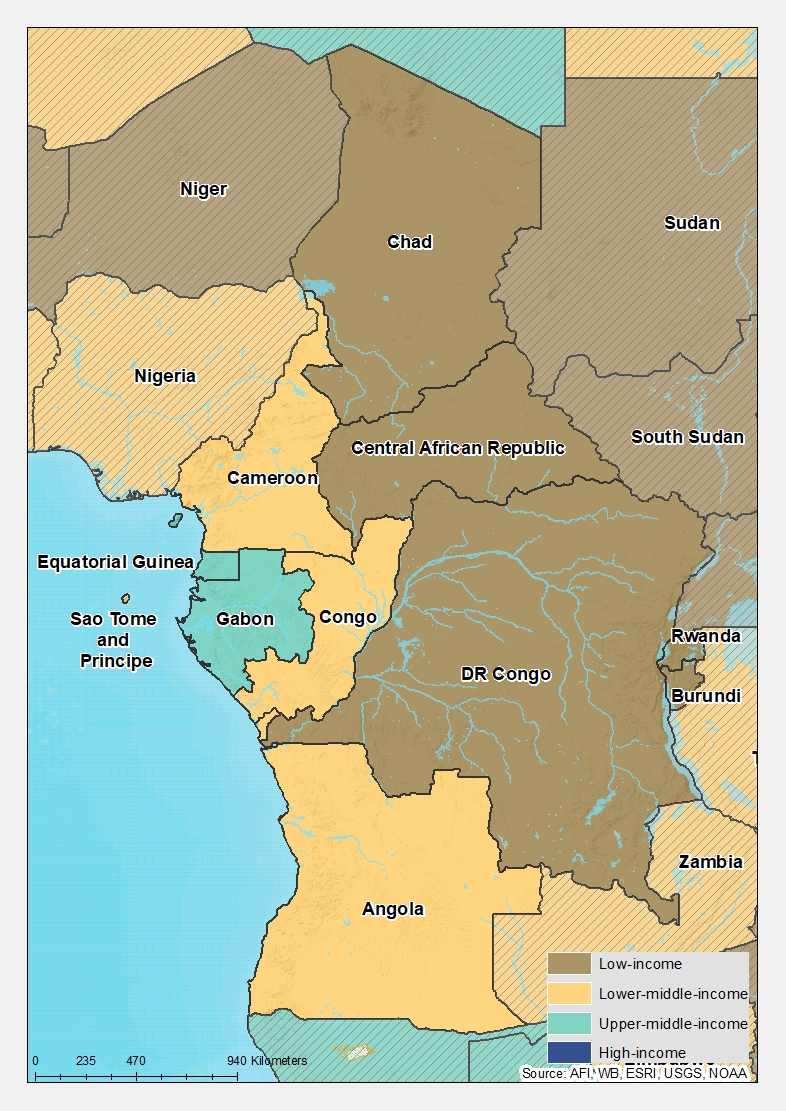
Chart 1 is a political map of ECCAS.
The Economic Community of Central African States (ECCAS) was established on 18 October 1983 by the UDEAC members and the members of the Economic Community of the Great Lakes States (CEPGL), as well as São Tomé and Príncipe through the signing in Libreville of its Constitutive Treaty. It was then revised and adopted on December 18, 2019 and entered into force on December 28, 2019.
ECCAS has 11 member states (see Chart 1), namely Angola, Burundi, Cameroon, the Central African Republic (CAR), Chad, the Democratic Republic of the Congo (DR Congo), the Republic of the Congo, Equatorial Guinea, Gabon, Rwanda and São Tomé and Príncipe. Angola remained an observer until 1999 when it became a full member. Rwanda withdrew in 2007 and rejoined in 2013.
According to its Treaty, the Community aims to “promote cooperation and strengthening of regional integration in Central Africa in all areas of political, security, economic, monetary, financial, social, cultural, scientific and technical activity with a view to achieve collective self-reliance, to raise the standard of living of the people, to increase and maintain economic stability, to strengthen and preserve the close peaceful relations between its Member States and to contribute to the progress and development of the African continent”.
ECCAS was inactive from 1992 to 1997 due to non-payment of membership fees and conflict in the Great Lakes region, with Rwanda on the opposite side of Angola. The decision to revive ECCAS in 1998 was a significant commitment from its member states to revitalise the organisation and address the region's conflict-prone nature. The Libreville Conference not only marked the resumption of ECCAS's activities but also involved a comprehensive reform. The organisation's mandate was expanded to include security concerns, in addition to its original economic focus, enabling it to actively promote peace and security in the region
The Community is one of the eight Regional Economic Communities (RECs) recognised by the African Union. However, it generally suffers from low levels of regional integration and limited coordination. A number of ECCAS member states also belong to other RECs. In terms of currency, Angola uses the Kwanza, Burundi uses the Burundian Franc, and Cameroon, Chad, the Central African Republic, the Republic of Congo, Gabon and Equatorial Guinea all use the CFA Franc. The Democratic Republic of Congo uses the Congolese Franc, Rwanda uses the Rwandan Franc, and São Tomé and Príncipe uses the Dobra. This variety of currencies across the region complicates trade and economic cooperation, requiring constant currency conversions and adjustments in financial transactions.
The World Bank classifies Gabon and Equatorial Guinea as nominally upper-middle-income countries. Still, the extreme levels of poverty, poor governance and corruption mean that these categorisations do not reflect the reality of most of their populations. Angola, Cameroon, the Republic of the Congo, and São Tomé and Príncipe are all considered lower-middle-income countries. The ECCAS countries classified as low-income are Burundi, CAR, Chad, DR Congo and Rwanda.
Chart 2 presents the Current Path of the population structure, from 2019 to 2043.
The total population of ECCAS has increased from 84.6 million people in 1990 to 231.1 million in 2023 and will grow to 404.5 million by 2043. DR Congo, with a population of 103.3 million people in 2023, is the most populous member state, accounting for 45% of the region’s total population. Angola follows with 36.8 million people (16%), and Cameroon with 28.8 million people (12%). At the end of the spectrum, Equatorial Guinea (1.8 million) and São Tomé and Príncipe (229 000) have the smallest populations, each constituting less than 1% of the total population.
Average 2023 fertility rates in the DR Congo (6 children) and Rwanda (3.7 children) were coming down more rapidly than for other countries in the Community. Chad and Angola have the highest fertility rates across the forecast horizon. By 2043, these will remain high at 3.6 and 4.8 children per woman, respectively. However, by 2038, Burundi will surpass Angola, becoming the country with the second-highest fertility rate in ECCAS after Chad.
In 2023, the median age for the Community was 17.4 years, ranging from 22.7 years in Gabon to 16.2 years in the Central African Republic. By 2043, the overall median age will rise to 20.3 years. ECCAS, therefore, has an exceptionally young population, with 48.5% of its adult population in the age group 15 to 29 years of age in 2023, which is typically considered to constitute its youth bulge. Even by 2043, 46.3% of its adult population will still be in this bulge, implying considerable momentum towards social turbulence without very rapid expansion of services and opportunities. Because only 52.4% of its population was in the general working-age bracket (15 to 64 years of age) in 2023, ECCAS will likely only benefit from a demographic dividend during the second half of the century if governments provide appropriate education, jobs and healthcare. The large proportion of youth poses immediate challenges by placing a heavy demand on education and job creation, while the growing elderly population will increase the need for social services and pensions. However, if the young population is well educated and gainfully employed, they can boost economic productivity, providing the resources needed to support an aging population in the long term. Therefore, effective planning for both age groups is crucial for sustainable long-term development.
The 2023 average life expectancy for the ECCAS group was 65.5 years, significantly lower than the African average of 66.4 years. In the region, São Tomé and Príncipe had the highest life expectancy at 72.1 years, while the Central African Republic had the lowest at 53.9 years. By 2043, the average life expectancy in ECCAS will increase to 70.6 years, with the gap between males and females widening from 4.6 years in 2023 to 5 years in 2043. By then, São Tomé and Príncipe will maintain the highest life expectancy at 75.5 years, while the Central African Republic will continue to have the lowest at 60.5 years.
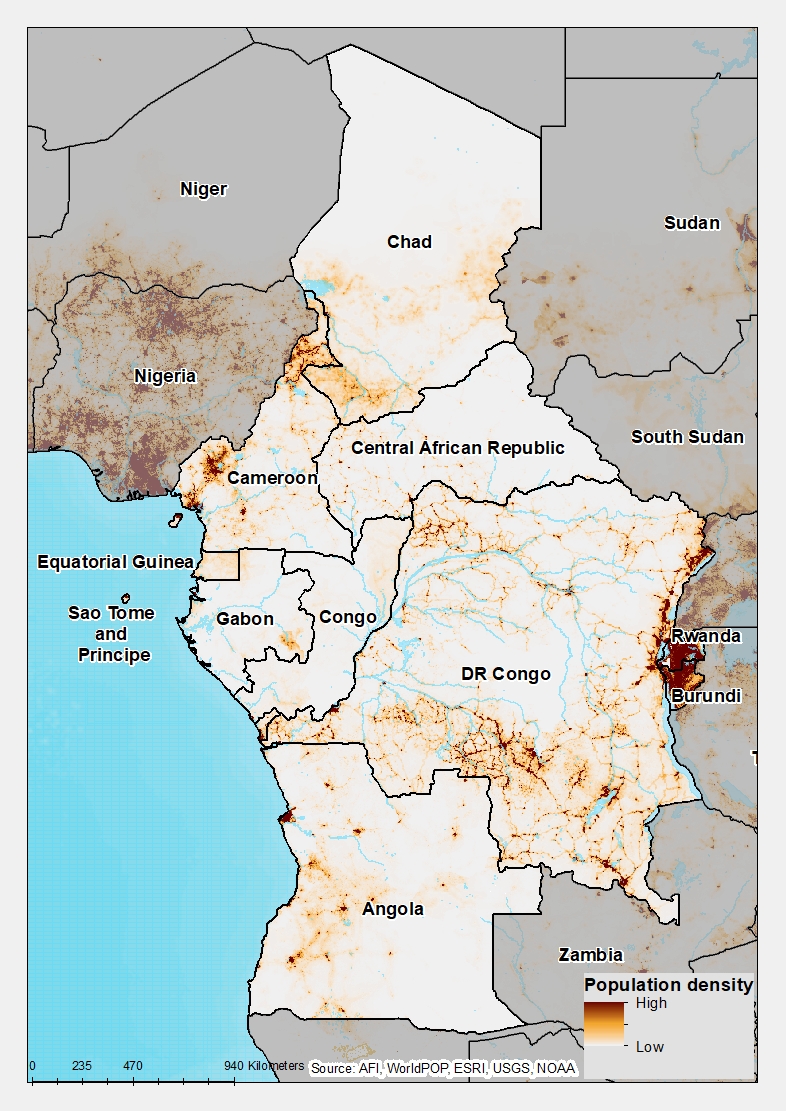
Chart 3 presents a population density map.
The population of ECCAS is settled on a total land area of 6.67 million km2, accounting for 20.4% of Africa's land area. The REC's population density was 0.35 people per hectare in 2023, below the average for Africa of 0.50 people per hectare. Compared to most other RECs, such as the East African Community (EAC) and the Economic Community of West African States (ECOWAS), ECCAS has a relatively low average population density.
Intraregional migration dominates in West and Central Africa, with over 11 million international migrants residing within the subregion. Among ECCAS member states, DR Congo and the Central African Republic are major sources of refugees and asylum-seekers. In 2022, DR Congo was the origin of over 900 000 refugees, making it the second-largest source on the continent, while the Central African Republic accounted for more than 748 000 refugees. DR Congo also experienced significant internal displacement of over 4 million people, largely due to conflict and violence, consistent with trends in sub-Saharan Africa.
Rwanda, Burundi and São Tomé and Príncipe have the greatest population densities, at 5.7, 5.2, and 2.4 people per hectare. The countries with the lowest population densities in the region are the Central African Republic (0.09 people per hectare), Gabon (0.1 people per hectare) and Chad (0.15 people per hectare).
The population of Central Africa is unevenly distributed across the region. Densely populated areas include the Congo Basin, the world’s second-largest tropical rainforest, which benefits from fertile soil and abundant rainfall, making it ideal for agriculture. Coastal regions such as Cameroon, Equatorial Guinea and Gabon also have high population densities, driven by economic activities like fishing, trade and oil extraction. Similarly, the regions along the Congo and Ubangi rivers support high population densities due to the availability of water for irrigation and transportation. In contrast, sparsely populated areas like northern Chad, characterised by arid and semi-arid conditions, and the northern Central African Republic, with its harsh climate and limited economic opportunities, face significant challenges for agriculture and development.
Chart 4 presents the proportion of the population living in urban and rural areas between 1990 and 2043.
ECCAS remains predominantly rural, with an average of 52.4% of the population living in rural areas in 2023. However, urbanisation rates vary significantly among member states. Gabon has the highest urbanisation rate in Africa, with over 90% of its population living in urban areas as of 2019, while Burundi has one of the lowest, with only 13% of its population residing in urban areas. Even by 2043, only 20.9% of Burundi's population will be urban.
On average, the Community will become predominantly urban in 2030, with 50.6% of the population to live in urban areas. It will continue to experience urbanisation but at a slower rate compared to other RECs. By 2043, 222 million people, or 55% of the population, will live in urban areas compared to 182 million in rural areas. To address the challenges that come with rapid urbanisation, ECCAS member states will likely face issues such as overcrowding, inadequate infrastructure and the rise of informal settlements. As urban populations grow, many cities may struggle to provide essential services like housing, clean water, sanitation and public transportation. Overcrowding can lead to strained healthcare systems, increased pollution and greater pressure on employment opportunities. Informal settlements, often lacking basic amenities and legal protections, may expand, further exacerbating social inequalities and hindering sustainable development across the region. Addressing these challenges will require comprehensive urban planning and targeted investments in infrastructure.
Chart 5 presents a stacked area graph that includes each country in the ECCAS economy from 1990 to 2043, including the associated growth rate.
The region’s GDP structure is largely shaped by the dominance of the oil sector as six of the eleven ECCAS member states (Angola, Cameroon, Congo, Gabon, Equatorial Guinea and Chad) are major oil exporters, while DR Congo produces a smaller quantity of oil. As of 2023, the region’s proven oil reserves were estimated at 31.3 billion barrels, accounting for 28% of Africa’s total reserves. Agriculture is another key sector in the ECCAS region, with vast agro-ecological potential for a wide range of crops, including cocoa, coffee, cotton and palm oil. It plays an important role in the economies of many member states, serving as a cornerstone for both food security and rural development.
The combined GDP of ECCAS has nearly tripled from US$89 billion in 1990 to US$235.6 billion in 2023. It is projected to reach US$757.4 billion by 2043. In 2023, ECCAS accounted for 8.8% of Africa’s economy, and by 2043, it is expected to constitute 11.6%, driven primarily by rapid growth in Angola and, to a lesser extent, in DR Congo, as their youthful populations contribute to expanding economies.
ECCAS is largely dominated by Angola, which contributes approximately 30.9% of the Community's GDP, followed by DR Congo and Cameroon, each accounting for about 18–22%. By 2043, DR Congo's share will rise significantly from 22.7% in 2023 to 33%, surpassing Angola as the largest contributor. The next group of countries, including Gabon, Equatorial Guinea, the Republic of the Congo and Chad, each contribute around 5–7% to the ECCAS economy. In contrast, the economies of Burundi, the Central African Republic, and São Tomé and Príncipe are much smaller, each making up 1% or less of the Community's total GDP.
In 2023, Angola had the largest economy in ECCAS, with a GDP of US$71.4 billion, followed by DR Congo at US$52.5 billion and Cameroon at US$43.3 billion. By 2043, DR Congo's economy will grow to US$253.8 billion, surpassing Angola, which will reach US$211.6 billion, while Cameroon is anticipated to expand to US$117.6 billion.
Chart 6 presents the size of the informal economy as a per cent of GDP and in absolute terms, as well as the per cent of total non-agriculture labour involved in the informal economy, from 2019 to 2043.
In 2023, estimates of the informal sector's contribution to GDP varied significantly, with DR Congo at 42% and Equatorial Guinea at 13%. By 2043, these figures will decrease to 34% and 11%, respectively.
With this, the informal sector contributes the largest portion of GDP in DR Congo and the smallest in Equatorial Guinea, though the latter's data may be inaccurate due to skewed income distribution. As the largest economy in ECCAS, Angola also had the biggest informal sector, valued at US$21.4 billion in 2023.
In 2023, the overall informal sector in ECCAS represented 31.7% of GDP (approximately US$100 billion), which was about five percentage points higher than the average for Africa (26.2%). This underscores the significant reliance of a large portion of the population on this sector for survival. By 2043, the GDP share of the informal sector will decline modestly to 27.8%, amounting to approximately US$210.6 billion.
However, the contribution of the informal sector to GDP does not correspond with the proportion of the total labour force engaged in it. On average, 68.6% of the labor force in ECCAS was employed in the informal sector, with the highest rates observed in DR Congo at 84%, followed by the Central African Republic at 82% and Burundi at approximately 73%. These figures reflect the elevated levels of extreme poverty in these nations. Additionally, high unemployment and underemployment have severely impacted young people in the region, with many unable to reach their full productive potential. As a result, many are forced into the informal sector, where incomes are low and irregular, working conditions are poor, and a lack of social protection prevails. This crisis, which has reached unprecedented levels, is driven by both demand and supply factors, including the collapse of the formal economy, low agricultural productivity, a decline in foreign investment and ongoing insecurity.
Conversely, the lowest proportions of labour in the informal sector were recorded in Equatorial Guinea at 19%, followed by Cameroon at 41% and São Tomé and Príncipee at 48.7%. By 2043, the share of the labour force employed in the informal sector in ECCAS will decline to 53.8.%. The Central African Republic will have the highest informal employment rate at 75%%, followed closely by Burundi at 63%, while Equatorial Guinea will have the lowest rate at 12.8%.
Chart 7 depicts GDP per capita in the Current Path from 1990 to 2043.
In 2023, the average GDP per capita for ECCAS was US$2 568, just 54% of the African average, highlighting the Community’s widespread poverty and low development levels. Due to their large oil reserves and smaller populations, Equatorial Guinea and Gabon had significantly higher GDP per capita than other ECCAS countries. In 2023, Equatorial Guinea's GDP per capita was US$13 200 and Gabon's was US$13 700, whereas the averages for DR Congo, the Central African Republic and Burundi were much lower at US$1 142, US$843 and US$735, respectively. Based on these revenues, the World Bank classifies Equatorial Guinea and Gabon as upper-middle-income countries but the associated data for these two countries needs to be treated with care. Much of their population lives in extreme poverty with large disparities in income between a small elite and the general population. The wealth generated from oil has not been equitably distributed, leaving the majority without access to its benefits.
In 2023, although Angola had the largest economy in ECCAS, its GDP per capita (US$5 777) was only 42% of Gabon's (US$13 700) primarily due to its overreliance on oil, significant income inequality and rapid population growth. Furthermore, Gabon's average was approximately US$500 higher than that of Equatorial Guinea. Countries that produce oil and gas generally perform better than those without such resources. However, these nations are significantly impacted by fluctuations in global oil prices. For example, when oil prices rise, these countries may experience an overvaluation of their currencies, which can make it difficult to compete in international markets and diversify economies. For instance, Equatorial Guinea's GDP per capita has halved over the past decade, a phenomenon often referred to as the 'natural resource curse,' where countries rich in natural resources experience slower economic growth compared to those with fewer or no resources.
Each country has pursued distinct strategies for managing its oil reserves. Angola has implemented reforms to transition control from Sonangol to the ANPG, though declining revenues remain a challenge. Equatorial Guinea has focused on increasing local content, as evidenced by the recent transfer of ExxonMobil's, a US-based energy giant, assets to GEPetrol, the country’s national oil company. Gabon, aiming for diversification, seeks to attract investment, strengthen its regulatory environment and reduce its reliance on oil. It is worth noting that of the three, Gabon has the highest GDP per capita, underscoring the importance of diversification as one of the critical strategies in turning the resource curse into a blessing.
In 2023, ECCAS member state Burundi recorded the lowest GDP per capita in Africa at US$718, closely followed by another member state, the Central African Republic at US$843, which had figures even lower than Somalia's GDP per capita of US$1 484. DR Congo ranked third-lowest in average GDP per capita across the continent. By 2043, the Central African Republic will have the continent's lowest GDP per capita at US$1 090, followed by Burundi (US$1 221) and Chad (US$1 702). Equatorial Guinea and Gabon will rank 6th and 8th, respectively, with GDP per capita of US$16 760 and US$15 420.
Chart 8 presents the Current Path for extreme poverty as per cent and total numbers of the population, from 2019 to 2043.
In 2015, the World Bank adopted US$1.90 per person per day (in 2011 prices using GNI), also used to measure progress towards achieving Sustainable Development Goal (SDG) 1 of eradicating extreme poverty.
In 2022, the World Bank updated the poverty lines to 2017 constant dollar values as follows:
- The previous US$1.90 extreme poverty line is now set at US$2.15, also for use with low-income countries.
- US$3.20 for lower-middle-income countries, now US$3.65 in 2017 values.
- US$5.50 for upper-middle-income countries, now US$6.85 in 2017 values.
- US$22.70 for high-income countries. The Bank has not yet announced the new poverty line in 2017 US$ prices for high-income countries.
Monetary poverty only tells part of the story, however. In addition, the global Multidimensional Poverty Index (MPI) measures acute multidimensional poverty by measuring each person’s overlapping deprivations across 10 indicators in three equally weighted dimensions: health, education and standard of living. The MPI complements the international $2.15 a day poverty rate by identifying who is multidimensionally poor and also shows the composition of multidimensional poverty. The headcount or incidence of multidimensional poverty is often several percentage points higher than that of monetary poverty. This implies that individuals living above the monetary poverty line may still suffer deprivations in health, education and/or standard of living.[x]
According to the 2016 Multidimensional Poverty Assessment, about 10.8% of people considered multidimensionally poor in sub-Saharan Africa are living in Central Africa.
In 2023, approximately 107.6 million people, or 46.6% of the total ECCAS population, lived below the poverty line of US$2.15. This figure is set to decline to 73.9 million by 2043, representing 18% of the total population.
Poverty levels vary significantly among member countries. Burundi has the highest extreme poverty rate in the region, with 71.9% of its citizens living below the poverty line. It is followed by the Central African Republic, where 65% of citizens live in poverty, DR Congo with 62.9%, and the Republic of the Congo with 50%. These countries lag behind due to a variety of factors such as political instability, conflict, lack of infrastructure, limited access to education and healthcare, and dependence on natural resources. Gabon has the lowest poverty rate in the region at 1.7%, followed by Equatorial Guinea and São Tomé and Príncipe, with poverty rates of 8.5% and 17.5%, respectively. While the poverty forecasts for Equatorial Guinea and Gabon may not be entirely reliable, it is important to note that the World Bank classifies these two countries as upper-middle-income due to their oil and gas revenues. Despite this classification, their general development profiles are comparable to lower-middle-income or low-income countries.
By 2043, the Central African Republic will have the highest extreme poverty rate, with 65.3% living below the poverty line, followed by Burundi with 38.4% and Chad with 24.7%.
Chart 9 shows the Regional Development Plan.
ECCAS has undergone institutional reforms, elevating its main executive body to the status of a Commission in December 2019. The institution's vision is to foster a peaceful, secure, and stable region through sustainable development, good governance, improved living conditions, freedom, and justice.
The Community aims to foster cooperation and regional integration among its member states in Central Africa. Its objectives encompass political, security, economic, monetary, financial, social, cultural, scientific and technical spheres, striving for collective self-reliance, improved living standards, economic stability, peaceful relations and contributions to African development.
To achieve these goals, it has prioritised six key areas for integration:
- Peace and Security
- Economic Integration
- Physical Connectivity
- Sustainable Development
- Social Welfare
- Institutional Reform
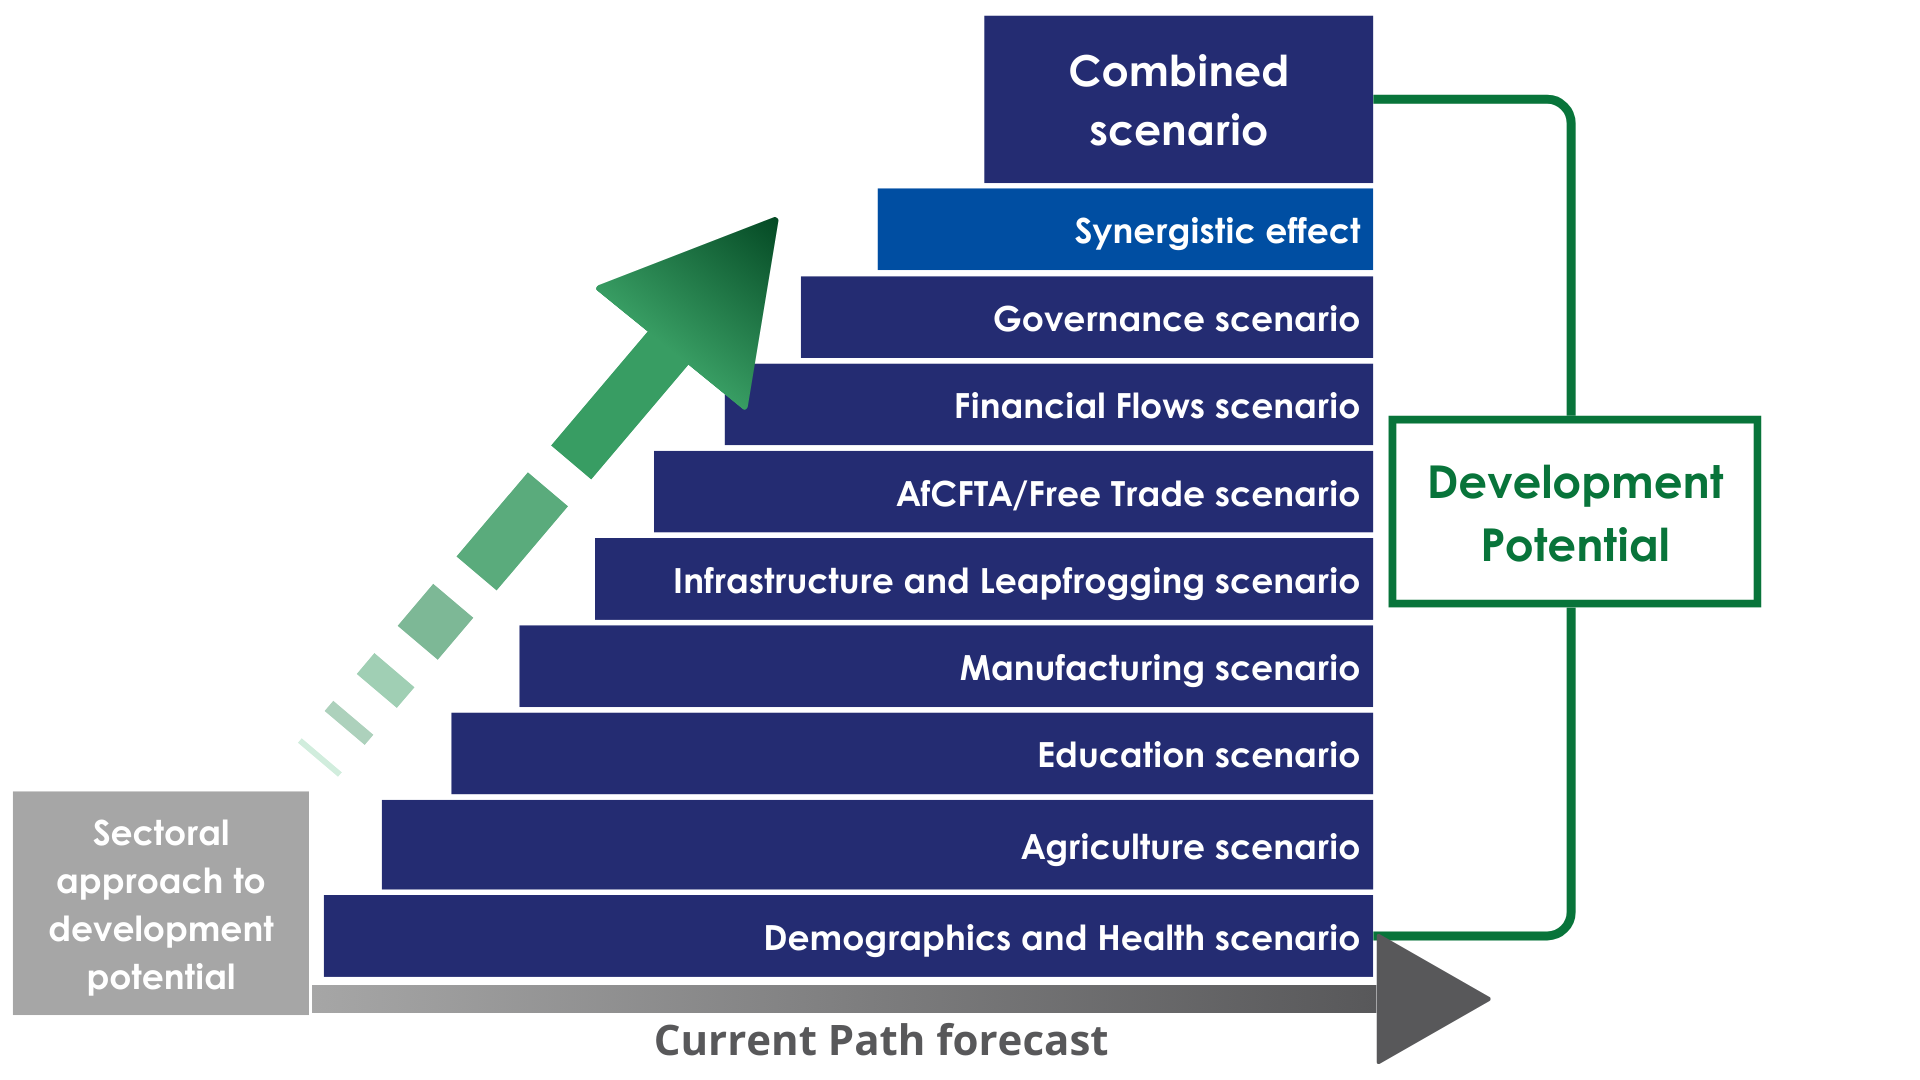
The eight sectoral scenarios as well as their relationship to the Current Path and the Combined scenario are explained in the About Page. Chart 10 summarises the approach.
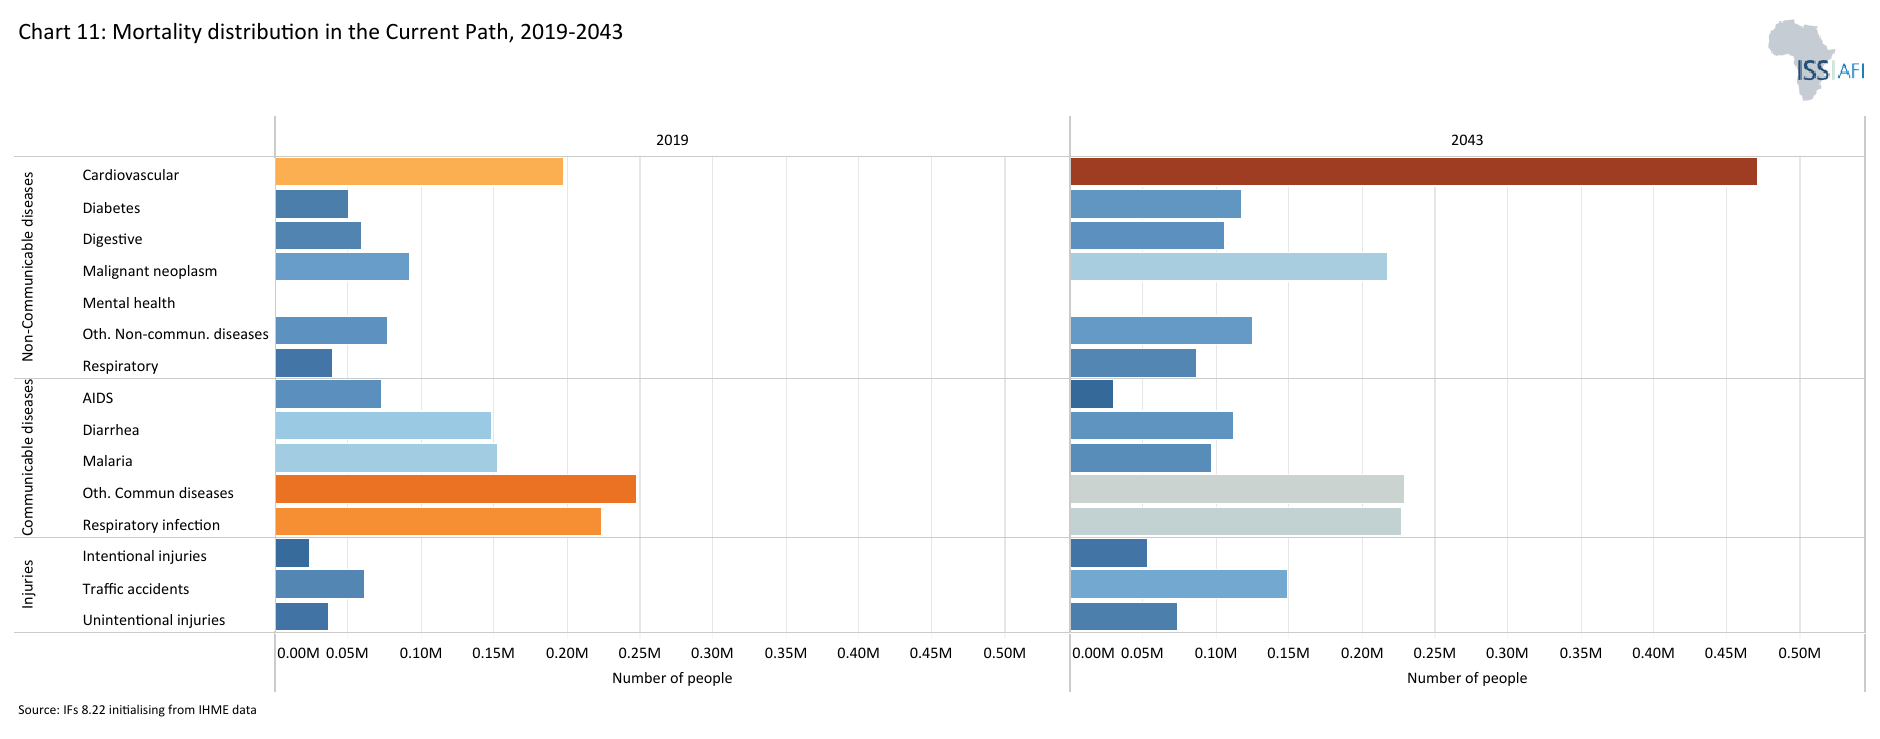
Chart 11 presents the mortality distribution in 2023.
The Demographics and Health scenario envisions ambitious improvements in child and maternal mortality rates, enhanced access to modern contraception, and decreased mortality from communicable diseases (e.g., AIDS, diarrhoea, malaria, respiratory infections) and non-communicable diseases (e.g., diabetes), alongside advancements in safe water access and sanitation. This scenario assumes a swift demographic transition supported by heightened health and water, sanitation, and hygiene (WaSH) infrastructure investments.
Visit the themes on Demographics and Health/WaSH for more detail on the scenario structure and interventions.
In 2021, according to the GBD, neonatal disorders and malaria were amongst the leading causes of death in several ECCAS member states, including Angola, Burundi, Cameroon, DR Congo and Equatorial Guinea. Other countries in the region, such as Chad, Central African Republic, Rwanda, and São Tomé and Príncipe, had different leading causes, including diarrheal diseases, tuberculosis, stroke and lower respiratory infections. This highlights significant health challenges across ECCAS, with neonatal disorders being a leading cause of death in nearly all countries. This indicates widespread issues with maternal and child health, underscoring the need for improved healthcare services for pregnant women, newborns and young children. Additionally, the prevalence of diseases like malaria, HIV/AIDS, tuberculosis and diarrheal diseases across multiple member states reveals persistent public health challenges related to infectious diseases. These conditions are often linked to factors like poverty, inadequate healthcare infrastructure, limited access to clean water and sanitation, and insufficient disease prevention and treatment programs.
In 2023, communicable diseases were the leading cause of death in ECCAS, accounting for 54% of fatalities (867 000). Non-communicable diseases followed at 37% (589 000). However, this trend is projected to reverse: by 2034, non-communicable diseases will surpass communicable diseases as the primary cause of death in the region. By 2035, non-communicable diseases will account for 45% of deaths, while communicable diseases will decline to 44%. This shift will continue, with non-communicable diseases reaching 52% of deaths by 2043 and communicable diseases decreasing to 35%. Despite the grim outlook, the projected increase in non-communicable diseases reflects positive developments in the region as rising life expectancy, incomes and living standards are associated with a higher incidence of diseases like cancer and stroke. Simultaneously, the decline in communicable diseases, such as HIV/AIDS and malaria, indicates the effectiveness of healthcare advancements. However, this shift presents new challenges for ECCAS healthcare systems, necessitating increased investment in non-communicable disease prevention, diagnosis and treatment.
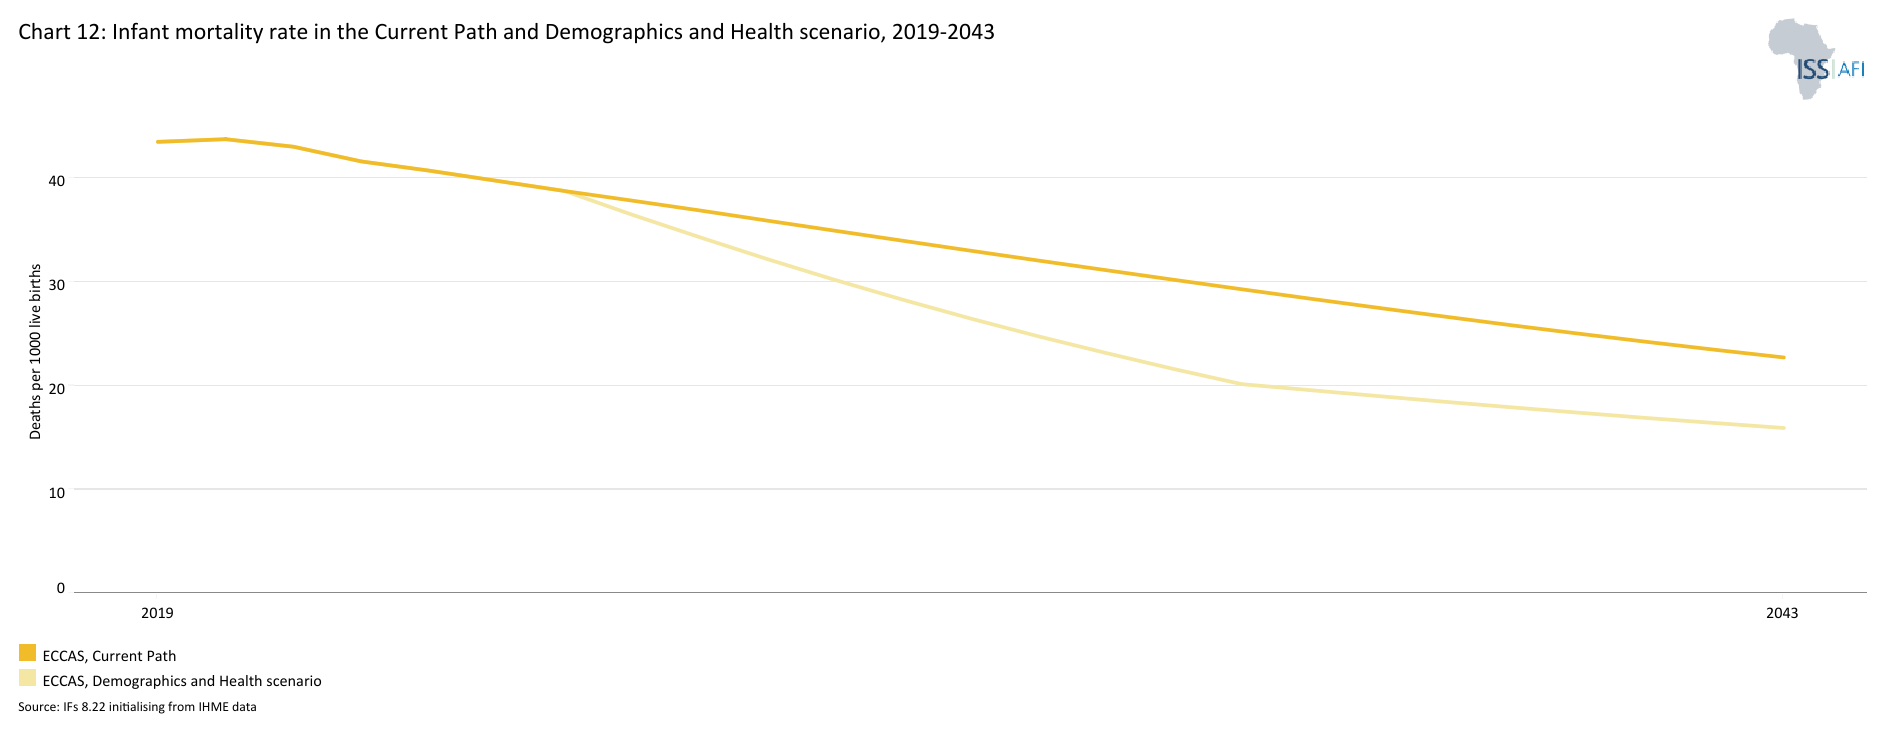
Chart 12 depicts the infant mortality rate in the Current Path versus the Demographics and Health scenario, from 2019 to 2043.
The infant mortality rate is the probability of a child born in a specific year dying before reaching the age of one. It measures the child-born survival rate and reflects the social, economic and environmental conditions in which children live, including their health care. It is measured as the number of infant deaths per 1 000 live births and is an important marker of the overall quality of the health system in a country.
In 2023, the infant mortality rate in ECCAS was 41.04 which means that for every 1 000 infants who were born about 41 died. It is slightly below the average of 42.3 for Africa and also the third-highest among all RECs. Central African Republic, Chad and Cameroon have the highest infant mortality rates (79.4, 66.9 and 43.5 deaths per 1 000 live births, respectively). The rate is lowest in São Tomé and Príncipe, Gabon and the Republic of Congo (19.2, 22.8 and 28 deaths per 1 000 live births, respectively). The health system in the Central African Republic is barely functioning due to a severe shortage of skilled health workers and medical supplies. Limited access to vaccination means that easily preventable diseases continue to take a toll. In Chad, many people live in rural areas with little to no access to healthcare, resulting in a Universal Health Coverage rate of approximately 31.4%. Coverage for reproductive, maternal, newborn and child health in Chad is similarly low, estimated to be between 28.9% and 33.5%. Conversely, since 1985, São Tomé and Príncipe, with support from UNFPA, has significantly expanded reproductive health services, leading to improved indicators for child and maternal health.
By 2043, in the Demographics and Health scenario, infant mortality in the region will decline to 15.9 deaths per 1 000 live births, which will be above Africa’s average of 25.1, yet lower than the 22.7 in the Current Path. Central African Republic (38.6), Chad (33) and Cameroon (19.7) will have the highest infant mortality rates in the Demographics and Health scenario by 2043, while rates are lowest for São Tomé and Príncipe (9), Rwanda (7.8) and Angola (11.2). The Demographics and Health scenario will have the greatest impact on Central African Republic, Chad and Burundi, where the infant mortality rates will drop by 23.2, 12.1 and 11 deaths per 1 000 live births, respectively. São Tomé and Príncipe, Republic of Congo and Angola will experience the smallest reductions in this scenario, namely a drop of 1.7, 3.9 and 4.3 per 1 000 live births, respectively.
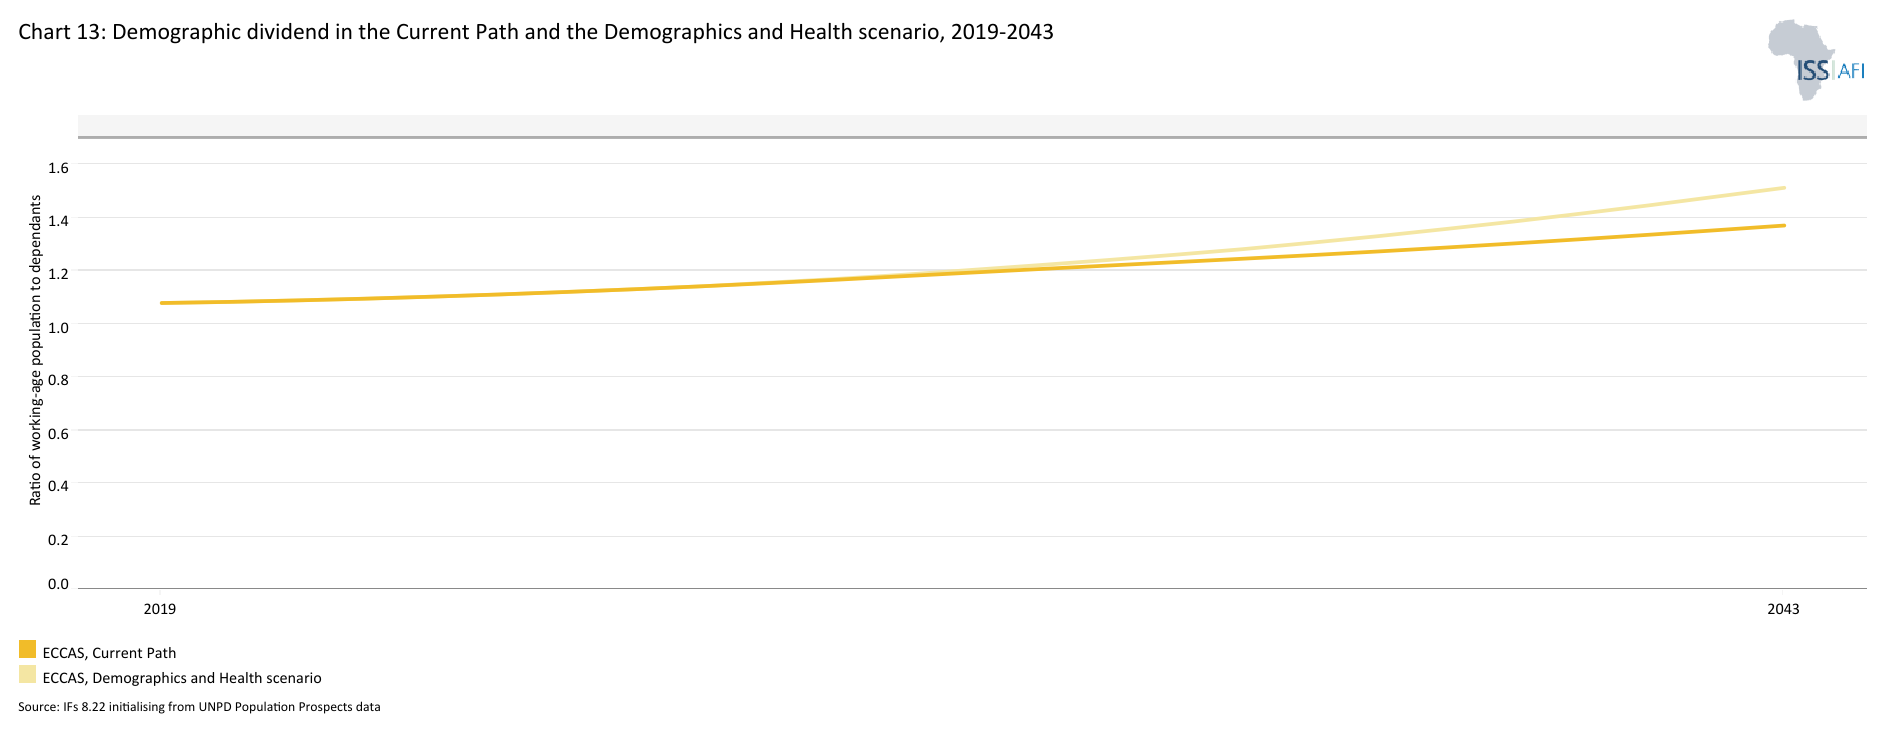
Chart 13 presents the demographic dividend in the Current Path compared to the Demographics and Health scenario, from 2019 to 2043.
The dividend is the window of economic growth opportunity that opens when the ratio of working-age persons to dependents increases to 1.7 to 1 and higher.
In 2023, the ratio of the working-age population to dependents in ECCAS was 1.08:1, meaning that for every 1.08 persons of working age, one dependent was supported. This ratio was lower than the 1.26:1 recorded for Africa as a whole, making it the lowest among the RECs. The low ratio indicates a smaller working-age population relative to dependents, which can constrain ECCAS’s economic growth potential. At 1.82:1, the AMU has the highest ratio since the median age of its population is the highest amongst all RECs.
Gabon has the highest ratio of working-age population to dependents (about 1.47:1), followed by Equatorial Guinea and Rwanda (1.38:1 and 1.34:1, respectively). The ratio is the worst in the Central African Republic, Chad and Burundi (0.97:1, 1:1 and 1.02:1, respectively). In these countries, their large youthful populations mean that economic growth has to be particularly rapid if it is to translate into income growth.
The Demographics and Health scenario will increase this ratio to 1.51:1 by 2043 for the region, meaning it will not enter a potential demographic window of opportunity even by then. The ratio will be slightly below the average of 1.57:1 for Africa but 0.14 higher than on the Current Path. The impact of the scenario among member countries will differ, with ratios ranging from 2.29:1 (Rwanda) to 1.24:1 (Niger).
The countries that will experience the greatest change in their ratio as a result of the Demographics and Health scenario are Rwanda, São Tomé and Príncipe and DR Congo. Chad and Equatorial Guinea will see the smallest change in their ratios. Because the contribution that labour makes to economic growth is particularly important at lower levels of development, the slow demographic transition in these countries serves as an important drag on income growth.
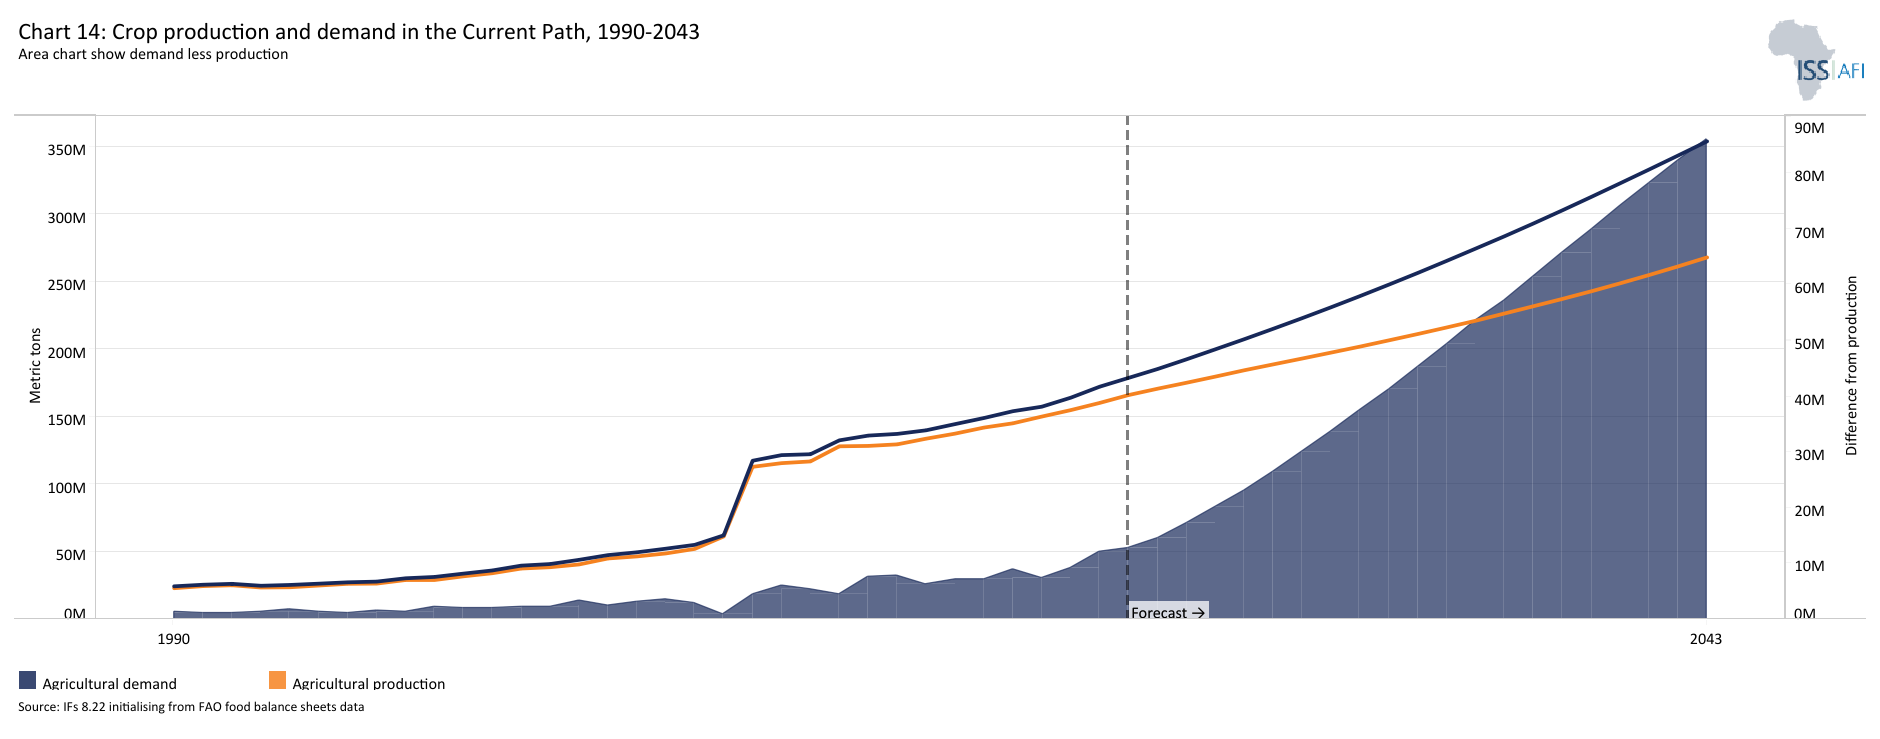
Chart 14 shows the crop production and demand from 1990 to 2043.
The Agriculture scenario envisions an agricultural revolution that ensures food security through ambitious yet feasible increases in yields per hectare, thanks to improved management, seed, and fertilizer technology, as well as expanded irrigation and equipped land. Efforts to reduce food loss and waste are emphasized, with increased calorie consumption serving as an indicator of self-sufficiency and prioritizing it over food exports. Additionally, enhanced forest protection signifies a commitment to sustainable land use practices.
Visit the theme on Agriculture for our conceptualisation and details on the scenario structure and interventions.
High population growth rates, coupled with low agricultural productivity and the instability caused by weak land tenure systems, ethnic clashes and political conditions, pose significant challenges to food systems in Central Africa.
Given the agricultural sector's significant contribution of over 20% to Central Africa's economic growth, a regional conference was convened in Cameroon in January 2024 by ECCAS, in partnership with CORAF and FAO, to modernise the Common Agricultural Policy (CAP) and bolster agricultural resilience within the region.
In 1990, ECCAS's crop production was only 23.1 million metric tons. By 2023, ECCAS's production had increased to 166.3 million metric tons, making it the fifth-largest producer among RECs. However, even with this growth, the region's demand for agricultural products exceeded supply by 12.7 million metric tons as demand stood at 179 million metric tons.
DR Congo dominated crop production within ECCAS, contributing 60.4 million metric tons or 41.5% of the region's total output. Cameroon and Angola followed closely, producing 29.6 million metric tons (20.4%) and 24.4 million metric tons (16.8%), respectively. São Tomé and Príncipe produced the smallest crop output within ECCAS, contributing only 126 thousand metric tons, or less than 1% of the region's total. Equatorial Guinea and Gabon followed with 300 thousand and 1.7 million metric tons, respectively.
The region's demand exceeded its crop production, indicating a shortfall of 8.9 million metric tons in domestic supply. DR Congo exhibited the highest demand at 61.9 million metric tons with a shortfall of 1.5 million metric tons, followed by Cameroon and Angola at 31.5 million and 27.5 million metric tons, respectively. São Tomé and Príncipe, Equatorial Guinea and Gabon continued to exhibit the lowest agricultural demand within ECCAS, with consumption levels of 160 thousand, 839 thousand, and 2 million metric tons, respectively.
This supply-demand gap is projected to worsen. Under the Agriculture scenario, ECCAS's crop production will reach 295.7 million metric tons by 2043, while demand will increase to 356.3 million metric tons. This will result in a shortfall of 60.6 million metric tons.
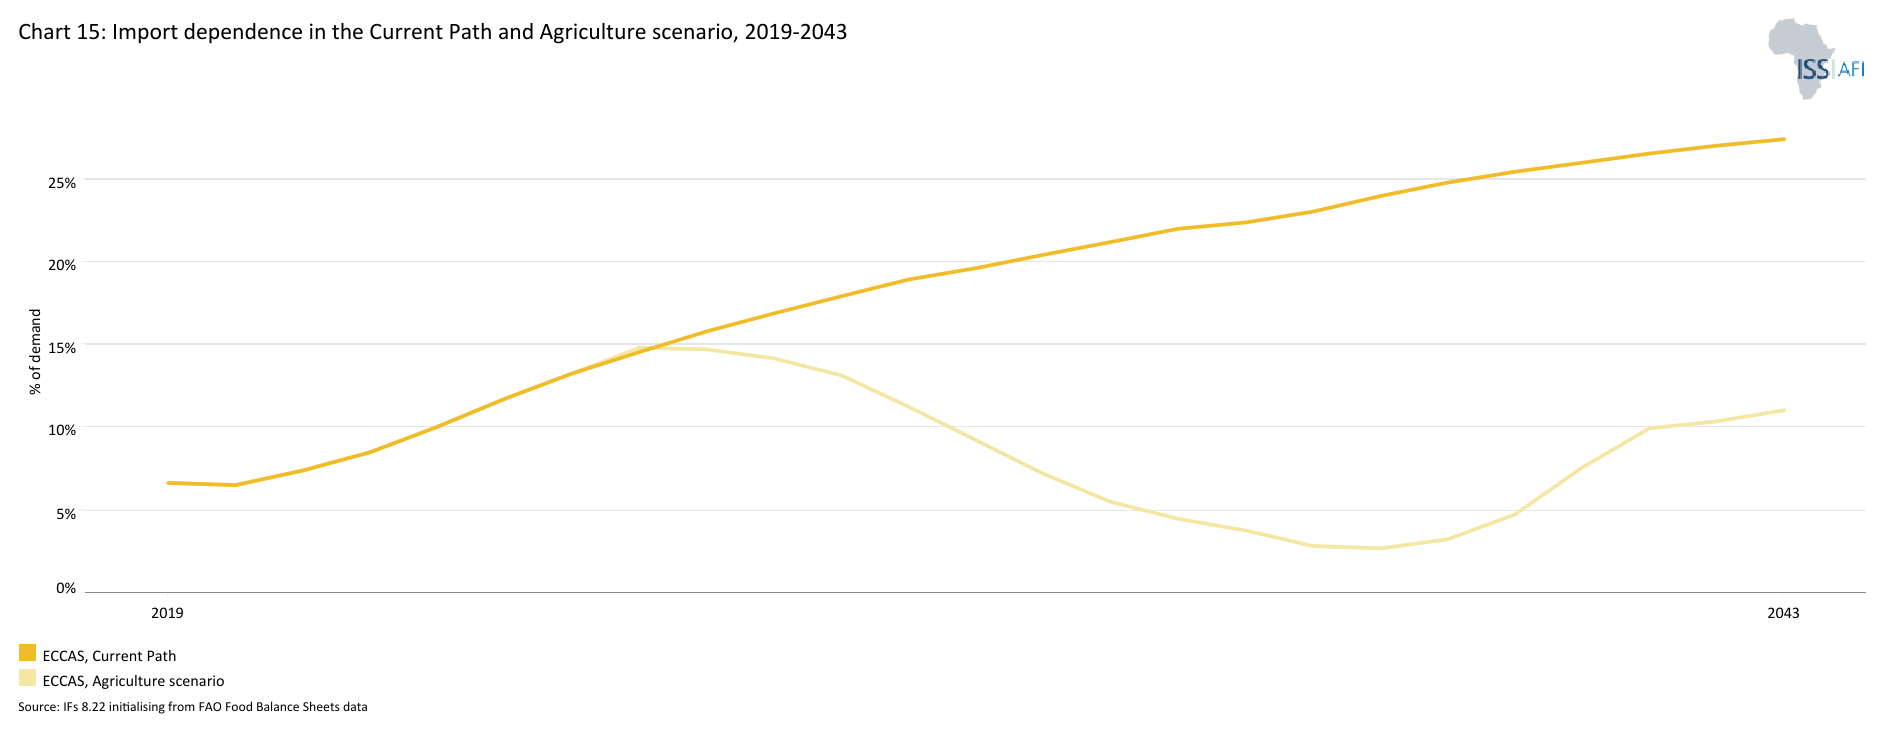
Chart 15 presents the import dependence in the Current Path and the Agriculture scenario, from 2019 to 2043.
In 2023, Africa had an import dependence of 12%, indicating that it imported 12% of its total consumption, while ECCAS had a lower import dependence of 8.8%. This suggests that ECCAS was more self-sufficient in terms of producing goods and services for its domestic market. ECCAS ranked third among the RECs in terms of lowest import dependence, following SADC and EAC. Equatorial Guinea exhibited the highest import dependence within ECCAS, importing over 58% of its total consumption. This low level of self-sufficiency, coupled with rising global food prices and supply shocks, has exacerbated food insecurity, particularly among rural populations. São Tomé and Príncipe followed with an import dependence of 23.2%, while Gabon stood at 18.6%. Burundi, Chad and DR Congo exhibited relatively low import dependence, with rates of 5.5%, 6.1% and 6.6%, respectively.
DR Congo is the primary destination for agricultural imports at all processing stages within ECCAS. ECOWAS and ECCAS hold the largest market shares for highly processed imports. Among ECCAS members, Gabon, the Central African Republic and Cameroon emerged as the leading importers of unprocessed, semi-processed and highly processed agricultural goods.
ECCAS's import dependence is projected to undergo a substantial transformation under the Agriculture scenario, declining from 25.9% to 8.2% by 2043. This represents a reduction of 17.7 percentage points. Angola is poised to make the most significant strides, achieving a surplus with a negative import dependence of -9.6%. In contrast, Equatorial Guinea's import dependence is expected to worsen, reaching 64.3%.
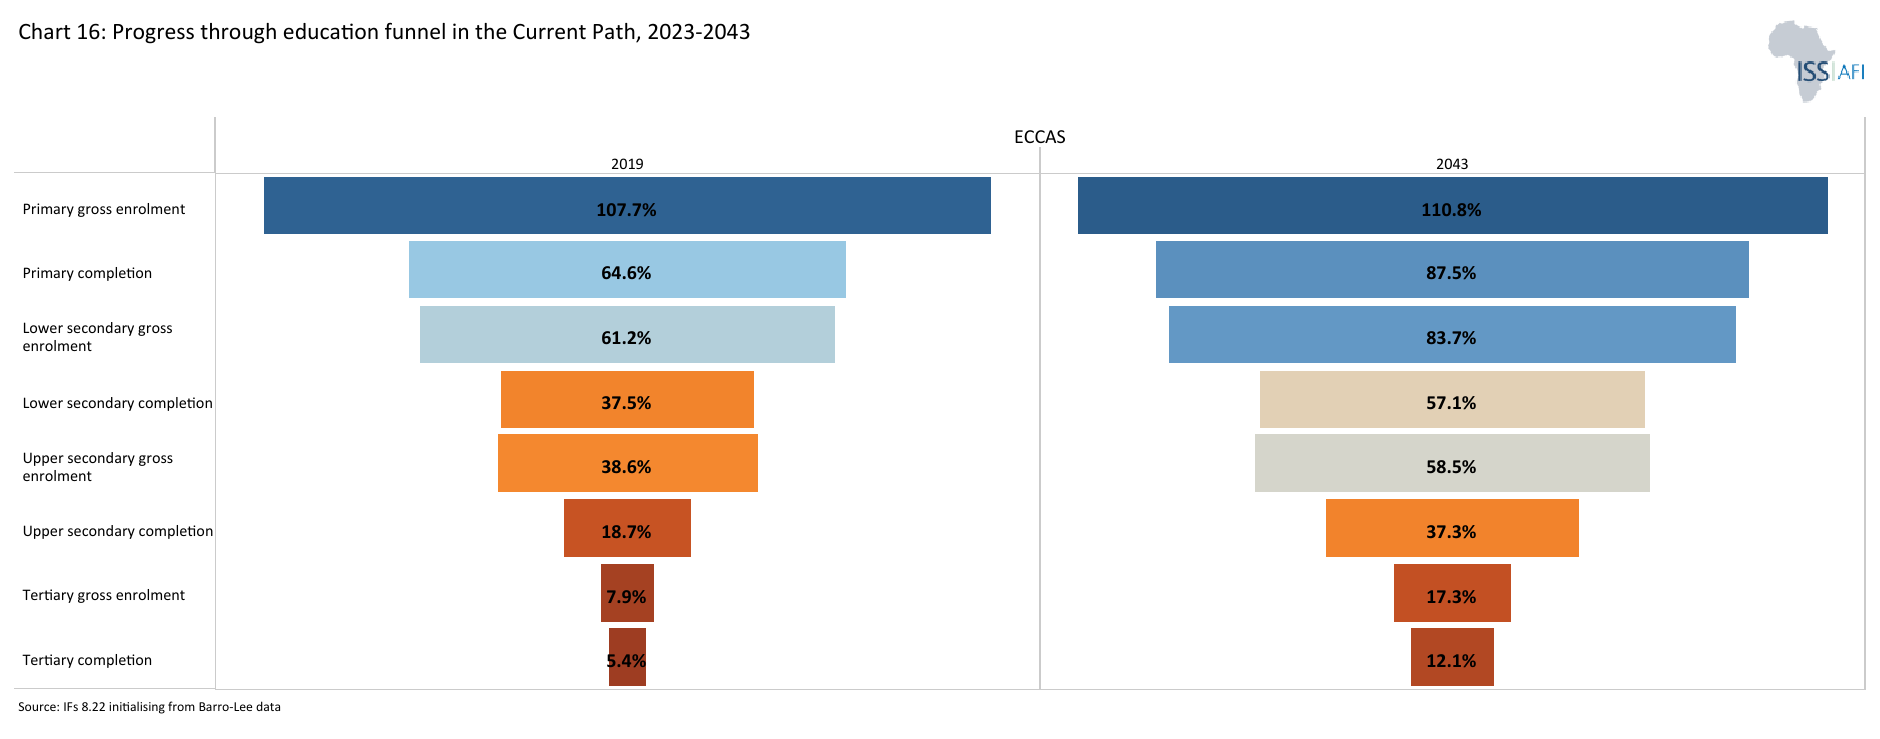
Chart 16 presents the progress through the educational system compared to the Africa income group (primary gross enrolment, primary completion, lower-secondary gross enrolment, lower-secondary completion, upper-secondary enrolment, upper-secondary completion, tertiary enrolment, and tertiary completion (for 2023 and 2043)).
The Education scenario represents reasonable but ambitious improved intake, transition and graduation rates from primary to tertiary levels and better quality of education at primary and secondary levels. It also models substantive progress towards gender parity at all levels, additional vocational training at the secondary school level and increases in the share of science and engineering graduates.
Visit the theme on Education for our conceptualisation and details on the scenario structure and interventions.
Many ECCAS countries, including the Central African Republic, are grappling with a learning crisis. In sub-Saharan Africa, a staggering 89% of children are unable to read and understand an age-appropriate text by age 10, a condition known as learning poverty. Even countries like Angola, which ended its civil war over a decade ago, continue to face significant challenges in their education systems. Areas where classrooms were destroyed during the war have not been rebuilt and classes are often held outside and are forced to be canceled due to bad weather conditions. Factors such as inadequate infrastructure, gender inequalities, poor-quality education and limited funding hinder educational progress in countries like Cameroon. In Burundi, while school enrollment rates have increased, they remain high for younger children and drop significantly for adolescents due to household poverty, early pregnancy coupled with school violence. DR Congo struggles with both access and affordability of education, despite policies aimed at providing free primary schooling. São Tomé and Príncipe faces similar challenges, with limited access in rural areas due to geographical isolation and poverty. Additionally, the language barrier, as the official language of instruction is Portuguese, presents a significant challenge for students, many of whom speak local dialects at home. Equatorial Guinea's education system is largely private but faces challenges due to underqualified teachers, inadequate resources and poor conditions.
Rwanda, a post-genocide society, has implemented a unique approach to historical education, emphasising a single, approved narrative. However, the country's education system still faces challenges, including a lack of English proficiency among many teachers. Chad is also plagued by low schooling rates, particularly among girls, and high illiteracy levels. Teacher qualifications are generally low, with many lacking beyond secondary education.
In 2023, the primary gross enrollment rate for ECCAS was 112%, surpassing Africa’s average of 104.6%. However, the gross enrollment rates for lower-secondary education were 66.2%, slightly above the continental average of 65.4%, while upper-secondary enrollment lagged 41%, behind Africa’s average of 42.3%. Additionally, the tertiary enrollment rate stood at 8.2%, significantly lower than Africa’s average of 14.4%.
ECCAS demonstrated strong primary education enrollment at 112%, ranking second among the RECs behind SADC (112.7%). However, its performance declined at higher levels. In lower-secondary education, ECCAS ranked fifth at 66.2%, trailing CENSAD (66.4%) and COMESA (66.6%). At the upper-secondary level, it maintained a fifth-place position among RECs. The greatest challenge for ECCAS was tertiary education enrollment, which stood at 8.2%, the second lowest among the RECs, with only the EAC performing slightly worse at 8%.
In 2023, ECCAS's education system lagged behind the African average at all levels. Primary completion rates stood at 71.3%, lower than the continental average of 77.2%. Lower-secondary completion rates were even more concerning, at 39% compared to Africa's 47.3%. The situation worsened at the upper-secondary level, with only 21% of students completing, significantly below the African average of 28.9%. Tertiary education completion rates were particularly low, reaching just 5.8% compared to Africa's 8.5%. ECCAS also faced significant challenges in education completion rates. At the primary level, it ranked second lowest among RECs, surpassed only by IGAD(56.3%). In lower- and upper-secondary education, ECCAS had the lowest completion rates of all RECs. Additionally, it ranked fifth for tertiary education completion, trailing IGAD (6.6%).
In the Education scenario, primary enrollment rates will increase from 110.8% to 117.4%, representing a 6% increase from the Current Path. Lower-secondary enrollment will rise from 83.8% to 123.7%, a substantial 47.5% increase from the Current Path. Upper-secondary enrollment is anticipated to grow from 58.5% to 91.3%, a 56.2% increase from the Current Path. Tertiary enrollment will also improve significantly, increasing from 17.3% to 31.6%, a 45.1% increase from the Current Path.
Under the Education scenario, ECCAS will make significant strides in education completion by 2043. Primary completion rates will increase from 87.5% in the Current Path to 117.6% (an increase of 34.1%). Lower-secondary completion will rise from 57% to 71.6% (25.3% increase), and upper-secondary completion will grow from 37.3% to 43.7% (17.2% increase). Tertiary completion will also improve, increasing from 12% to 16.1% (34.2% increase).
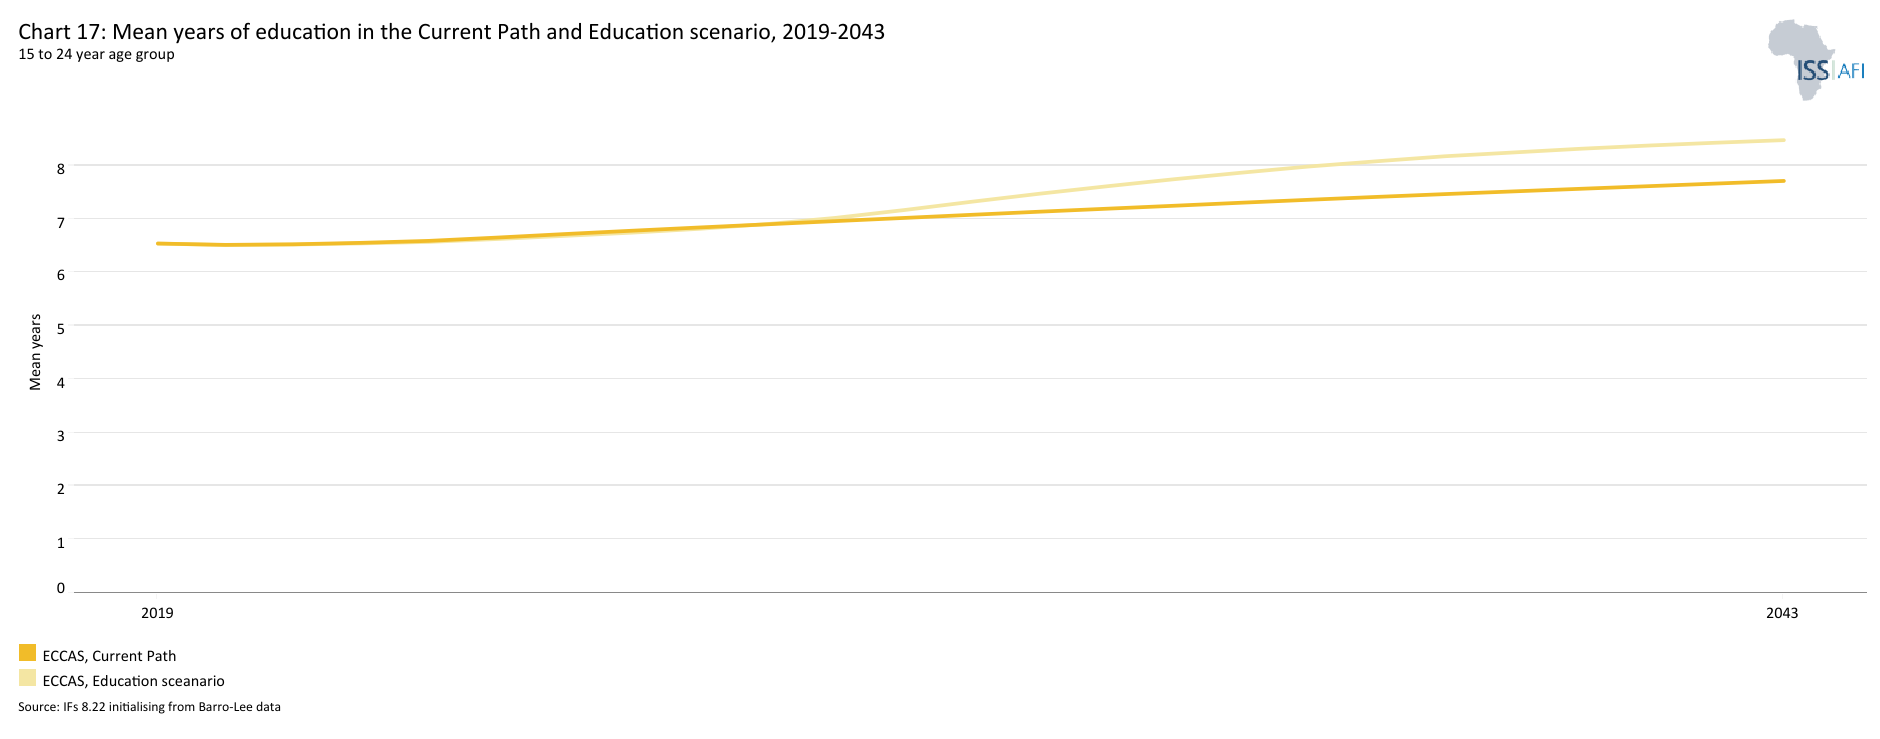
Chart 17 depicts the mean years of education in the Current Path compared to the Education scenario (for the 15 to 24 age group), from 2019 to 2043.
The average years of education in the adult population aged 15 to 24 is a good first indicator of how the stock of knowledge in society is changing.
Education is fundamental to development, but improvements in this area take time to show impact. In 2019, the average ECCAS adult aged 15-24 had completed 6.5 years of education, lagging behind Africa's average of 7.1 years. Under the Education scenario, ECCAS's average will rise to 8.5 years by 2043, exceeding Africa's projected increase to 8.1 years.
In 2019, males in ECCAS had an average of 6.8 years of education, while females had 6.3 years, reflecting a gender gap of 0.5 years. By 2043, this gap will be closed in the Education scenario as gender equality improves. Gabon will have the highest average years of education at 12.6, followed by Cameroon with 10.2 years. The Central African Republic will have the lowest, with an average of 5.6 years, falling below the ECCAS regional average. Equatorial Guinea is poised to benefit the most from the Education scenario, gaining an additional 1.64 years of education on average, followed by DR Congo with an increase of 1.24 years.
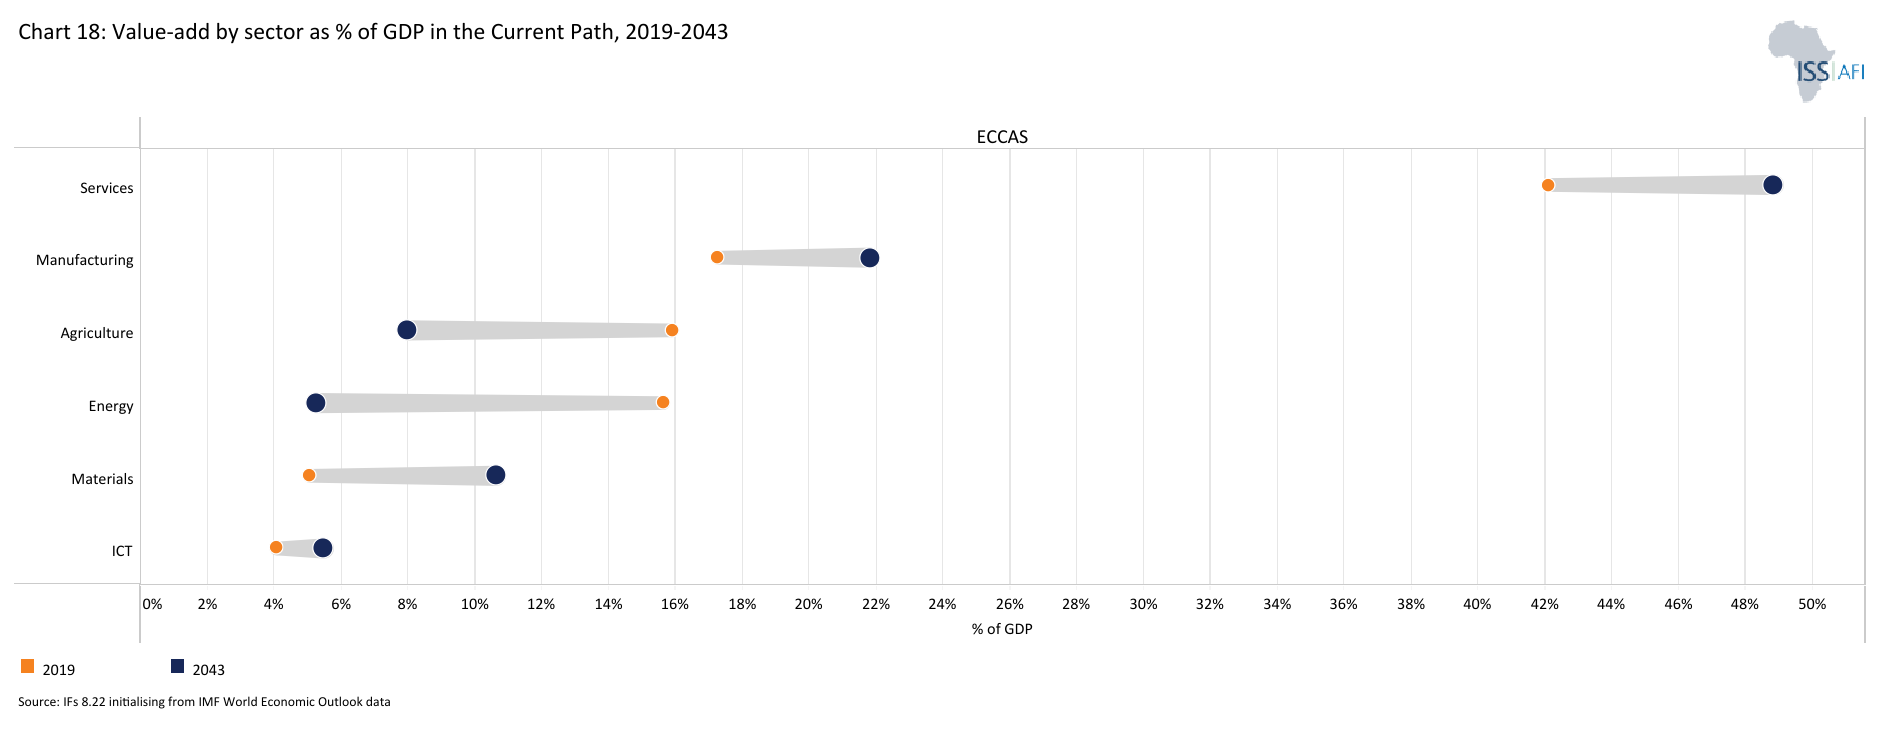
Chart 18 presents manufacturing as a share of GDP in the Current Path compared to the Africa income group, from 2019 to 2043.
In the Manufacturing scenario, reasonable but ambitious growth in manufacturing is envisaged through increased investment in the sector, in research and development (R&D), and through improved government regulation of businesses. This is aimed at enhancing total labour participation rates, particularly among females where appropriate, and is accompanied by increased welfare transfers to unskilled workers to mitigate the initial rises in inequality typically associated with a low-end manufacturing transition.
Visit the theme on Manufacturing for our conceptualisation and details on the scenario structure and interventions.
Manufacturing plays a relatively minor role in the region's GDP compared to sectors such as agriculture and extractive industries. The existing manufacturing base is often tied to the processing of raw materials, particularly in resource-rich countries like Angola, DR Congo and Gabon. However, this processing is typically limited to basic stages, offering minimal value addition. The growth of manufacturing is hindered by infrastructure challenges, particularly in transportation and energy. Unreliable electricity supply and high energy costs pose significant barriers, especially for landlocked countries such as Chad and the Central African Republic. Despite this, Africa is poised to become the ‘next great manufacturing hub’, attracting a significant portion of the 100 million labour-intensive manufacturing jobs anticipated to relocate from China by 2030. Rwanda, a member of ECCAS, is among the countries expected to benefit from this trend, having recently implemented policies to promote manufacturing and industrial development.
In 2023, ECCAS's value added manufacturing sector contributed 17.4% to its GDP, slightly below the African average of 17.6%. Within the RECs, ECCAS ranked third, trailing behind SADC. Within ECCAS, DR Congo boasted the highest manufacturing contribution to its GDP at 25.3%, followed closely by Gabon at 24.1% and Equatorial Guinea at 18.9%. Chad, São Tomé and Príncipe, and Burundi exhibited the lowest manufacturing shares, with contributions of 4.8%, 7.3% and 10.4%, respectively. By 2043, manufacturing is projected to account for 24.6% of ECCAS's economy, reflecting a 41% increase from 2023. At this stage, ECCAS will place second among Africa's RECs in manufacturing output after AMU. Equatorial Guinea will surpass DR Congo, reaching the highest manufacturing share among member states at 28.9%, followed by the Republic of Congo at 27.2%%. Chad will hold the lowest manufacturing share at 6.8%, with Sao Tome and Principe close behind at 9.6%.
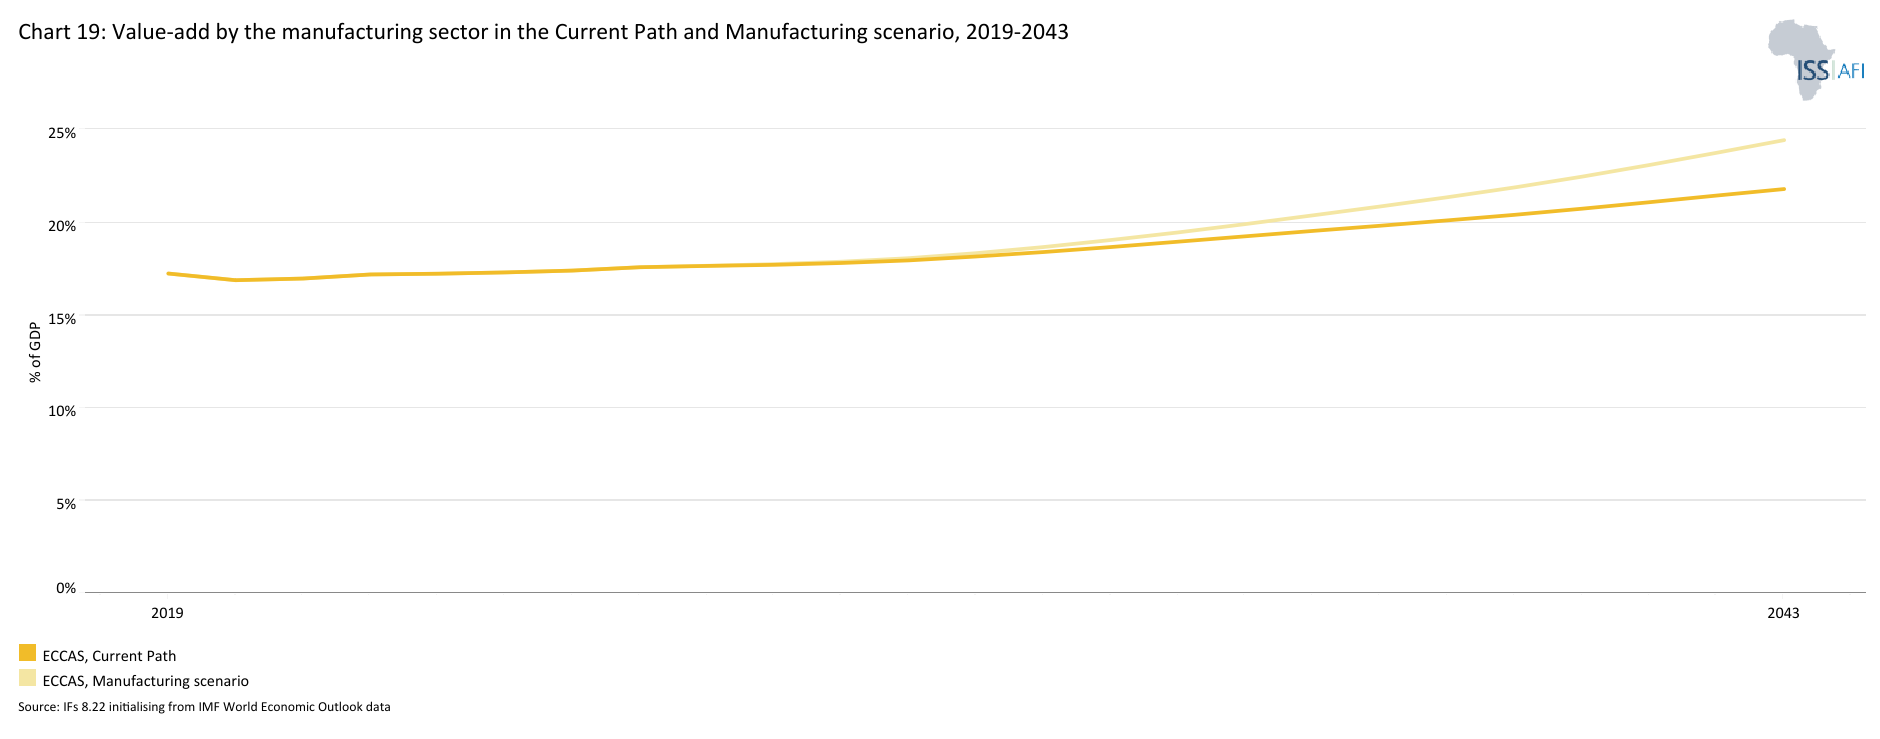
Chart 19 shows the value-add of the manufacturing sector in the Current Path and the Manufacturing scenario, from 2019 to 2023.
The Central African subregion is seeking to address economic challenges and achieve sustainable development through a harmonized industrialization and economic diversification masterplan (PDIDE). This plan aims to double the region's industrial contribution to GDP, currently at 12%, by focusing on structural transformation, value addition, and boosting manufacturing capabilities across various sectors.
Under the Manufacturing scenario, ECCAS's manufacturing value-added share will reach 24.5% by 2043, surpassing both the African average of 21% and its own Current Path average of 21.8%. ECCAS will also have the highest manufacturing value-added share among all RECs, surpassing both AMU and COMESA. Equatorial Guinea will surpass Gabon as the region's leader in manufacturing value-added share, with its value-added share to increase from 31.1% to 34.6% by 2043. Gabon and the Republic of Congo will follow closely, with projected shares of 29% (from 26.1%) and 28.9% (from 25.2%). Chad, São Tomé and Príncipe, and Burundi will maintain the lowest manufacturing value-added shares within ECCAS, with anticipated figures of 7.8%, 10% and 17.2%, respectively.
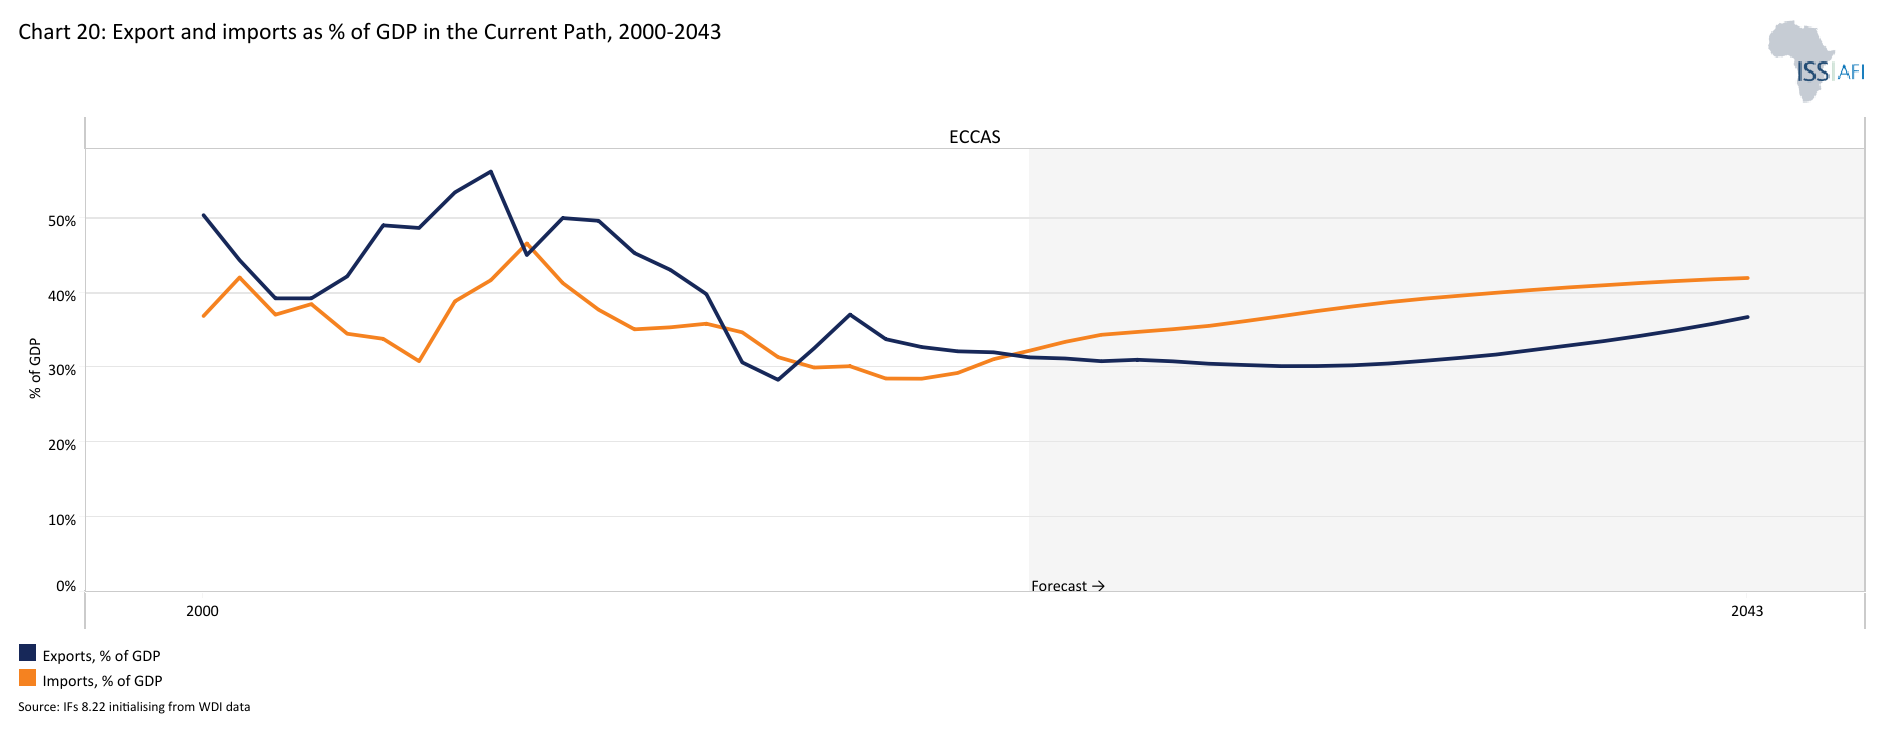
Chart 20 shows exports and imports as per cent of GDP, from 1990 to 2043.
The AfCFTA scenario represents the impact of fully implementing the African Continental Free Trade Agreement by 2034. The scenario increases exports in manufacturing, agriculture, services, ICT, materials and energy. It also includes an improvement in multifactor productivity growth emanating from trade and a reduction in tariffs for all sectors.
Visit the theme on AfCFTA for our conceptualisation and details on the scenario structure and interventions.
The economies of ECCAS are largely driven by natural resources. Crude petroleum and diamonds are significant exports in many nations, including Angola, Cameroon, the Republic of Congo, Equatorial Guinea and Gabon. Other notable exports include gold, copper, cobalt and agricultural products such as coffee, tea and cocoa. Key imports for most countries in the region include refined petroleum products, wheat, rice, medicines and machinery. Some countries also import fertilisers, gold, vehicles and packaged medicaments.
ECCAS's primary trading partners are China, India, the United Arab Emirates and the Netherlands. On a continental level, ECCAS member states have made limited progress in reducing tariffs on intra-regional trade, with only 34% of tariff lines reduced to zero. This has resulted in ECCAS having the lowest share of intra-regional trade as a percentage of GDP compared to the other RECs. A study found that mobile phones and export lead times can positively affect intra-ECCAS and intra-ECOWAS trade. However, internet access appears to be more influential in boosting trade within ECCAS. Inançli and Mahamat (2019) also identified factors like GDP, population, distance and political stability as drivers of bilateral trade within ECCAS.
In 2023, the total export value of ECCAS was US$74.3 billion, representing 31.6% of GDP while its total imports were valued at US$76.7 billion, constituting 32.5% of GDP. This indicates that the region had a trade deficit, as the value of imports exceeded that of exports. Angola led the region in exports with a total value of US$25 billion, representing 33.6% of ECCAS’s total exports. It was followed by DR Congo with exports worth US$17.5 billion and Cameroon with US$7.1 billion. Regarding imports, DR Congo led the region with imports valued at US$21 billion, accounting for 27.4% of ECCAS’s total imports. Angola followed with imports worth US$17.3 billion, and Cameroon with US$9 billion.
In the AfCFTA scenario, by 2043, the total value of exports will reach US$419.9 billion, accounting for 49.3% of GDP. This is in contrast to the Current Path, where exports will be US$278.7 billion, representing 36.8% of GDP. Therefore, under the AfCFTA scenario, the ECCAS economy will gain an additional US$141.2 billion in export value. The total value of imports will reach US$432.8 billion under the AfCFTA scenario, compared to US$318.2 billion in the Current Path indicating that, under the scenario, ECCAS will experience a trade deficit as imports will exceed exports. DR Congo will dominate the region's exports, reaching US$178.8 billion, which will account for 23.6% of the total ECCAS GDP. In contrast, Burundi will trail with exports valued at just US$363 million, representing a meager 4.38% of the regional GDP. Similarly, DR Congo will lead in imports with US$182.5 billion, comprising 24% of ECCAS GDP, while São Tomé and Príncipe will rank lowest with imports of US$778 million, contributing less than 1% to the total.
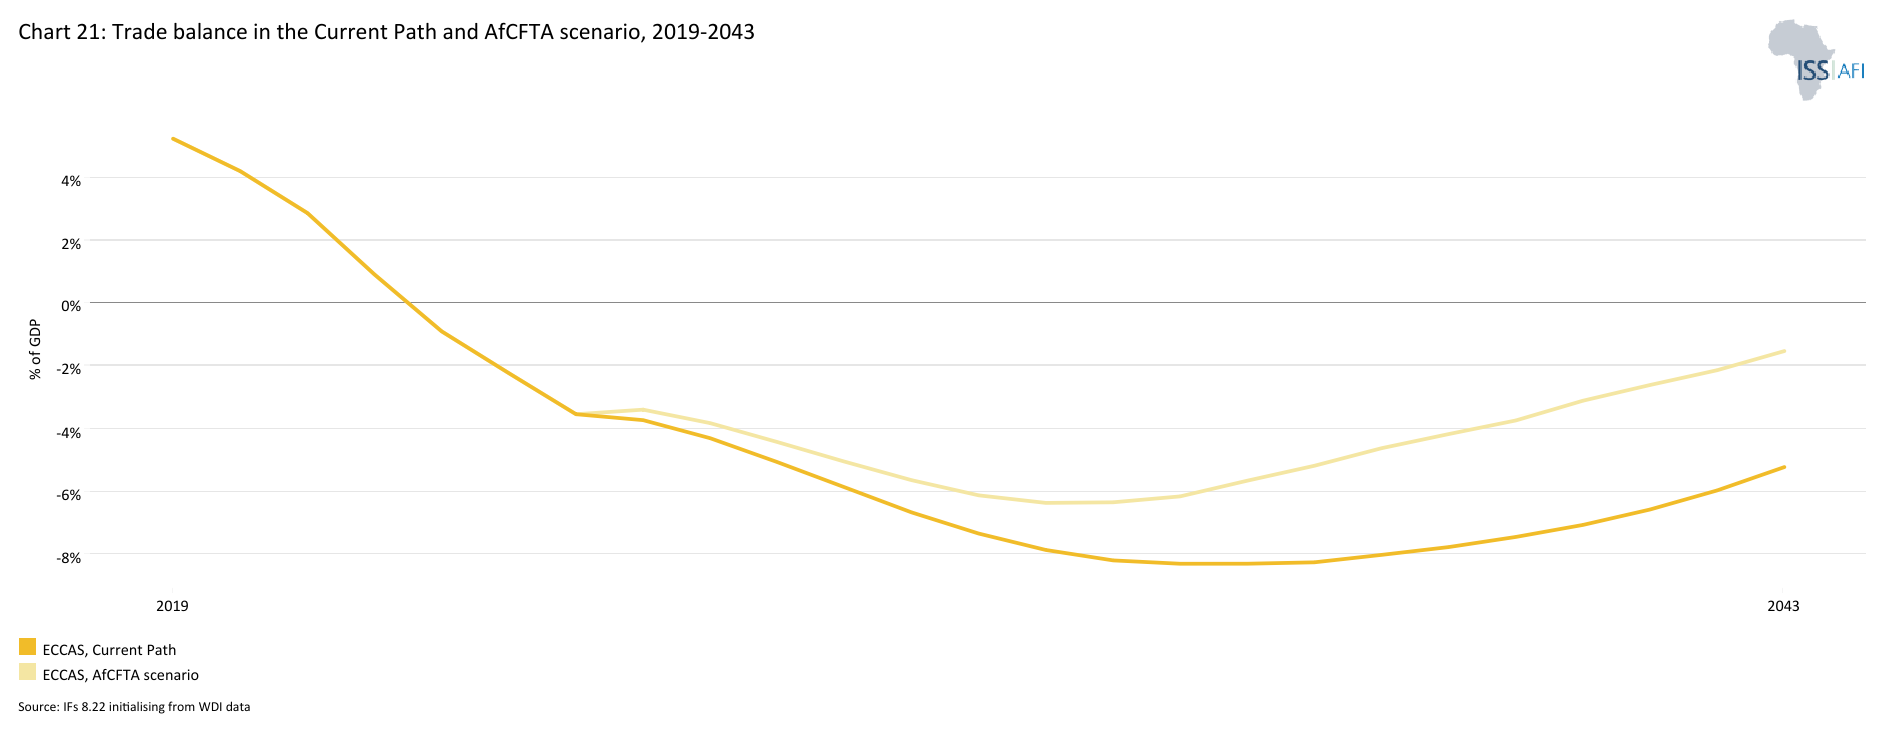
Chart 21 shows the trade balance as a share of GDP in the Current Path compared to the AfCFTA scenario, from 2019 to 2043.
In December 2019, the UN Economic Commission for Africa (ECA) and the ECCAS General Secretariat organised a regional workshop in Cameroon, to prepare comprehensive lists of services for unhampered trade under the AfCFTA regime. This workshop, held from December 3 to 5, brought together national experts from the eleven ECCAS Member States. The primary goal was to support these states in drafting convergent regional lists of commitments in five priority sectors: financial services, transport, telecommunications/ICTs, professional services and tourism. This initiative underscores ECCAS’s commitment to enhancing trade openness and integration within the region. By aligning with the AfCFTA Protocol on Trade in Services, ECCAS aims to liberalise trade in services at a continental level, fostering economic growth and regional cooperation.
In 2023, ECCAS had a trade balance equivalent to 64.1% of its GDP. This indicates that the region’s exports significantly exceeded its imports, contributing positively to its overall economic performance. Among the member states, the Republic of Congo had the highest trade balance, amounting to 121% of its GDP. This exceptionally high figure suggests that the Republic of Congo’s economy was heavily reliant on exports, likely driven by its oil and mineral resources. Equatorial Guinea followed with a trade balance of 92.3% of its GDP, also reflecting a strong export-oriented economy. Under the AfCFTA scenario, the Republic of Congo maintained its top position with 155.1% percent, with Chad following at 109.8% indicating that Chad may have successfully diversified its exports to take advantage of the reduced trade barriers within the AfCFTA.
By 2043, under the AfCFTA scenario, ECCAS will achieve a trade balance of 100% of GDP, a significant improvement compared to 78.8% in the Current Path. The Republic of Congo will maintain its leading position with a trade balance of 155.1% of GDP, highlighting an even greater reliance on exports. Chad will follow with a trade balance of 109.8% of GDP, reflecting its robust export activities. These figures underscore the potential impact of the AfCFTA in enhancing trade dynamics within ECCAS, particularly benefiting countries with strong export sectors.
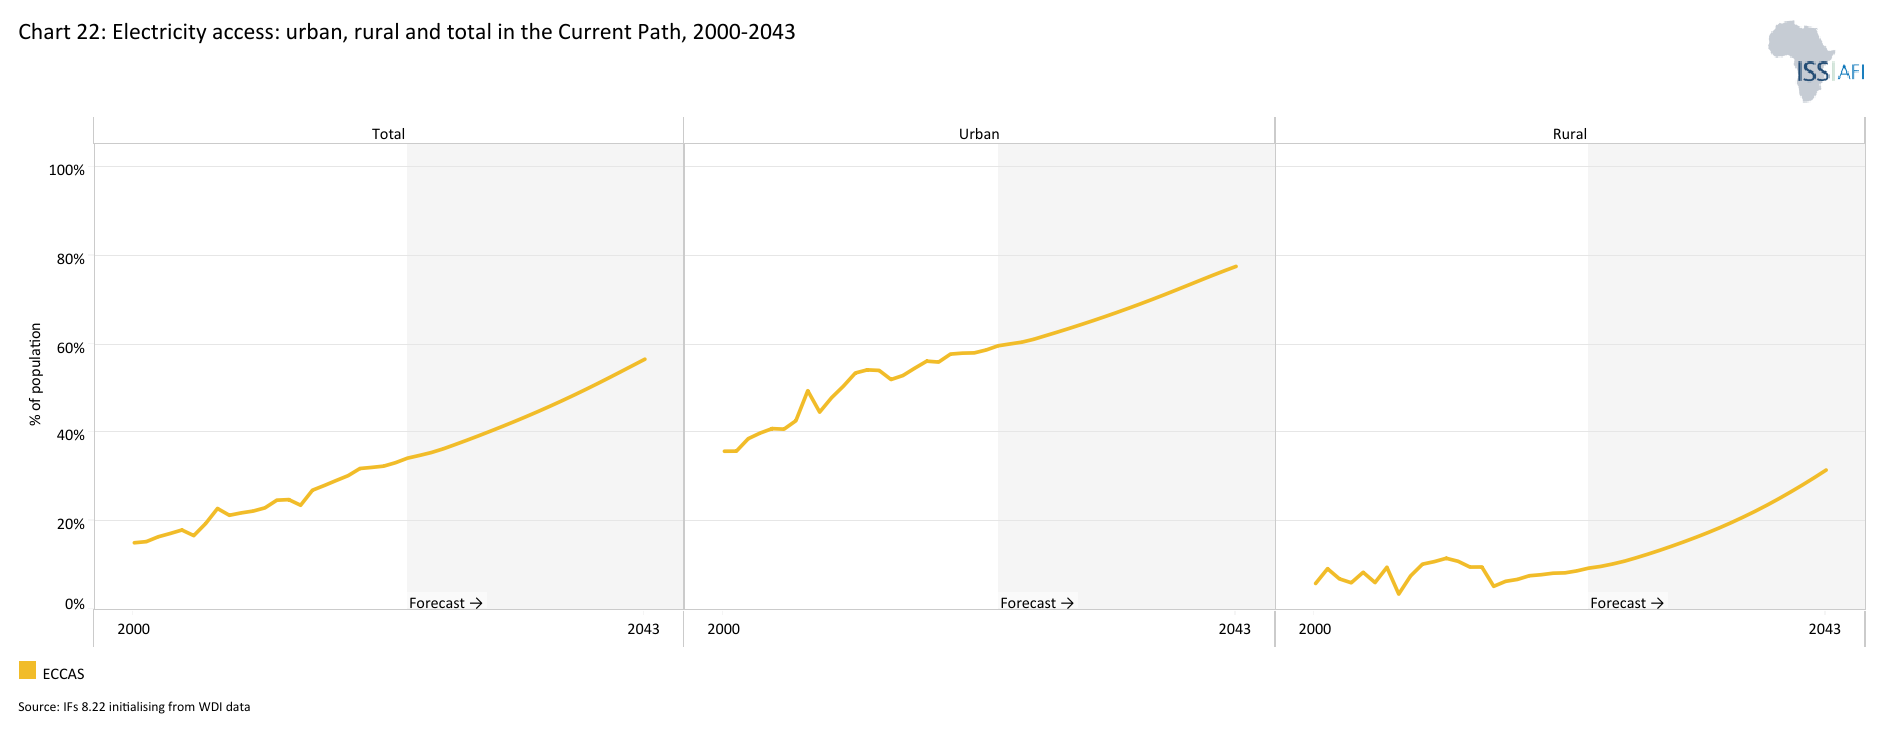
Chart 22 presents the access to electricity in the Current Path for urban, rural and total populations, from 1990 to 2043.
The Large Infrastructure and Leapfrogging scenario involves ambitious investments in road and renewable energy infrastructure, improved electricity access and accelerated broadband connectivity. It emphasises the adoption of modern technologies to enhance government efficiency and the rapid formalisation of the informal sector, incorporating significant investments in major infrastructure projects like rail, ports, and airports, while highlighting the positive impacts of renewables and ICT.
Visit the themes on Large Infrastructure and Leapfrogging for our conceptualisation and details on the scenario structure and interventions.
A 2011 study revealed that Central Africa's infrastructure lagged behind all other African regions in terms of overall performance. Transportation within the region was characterised by slow speeds, high costs, poor road conditions, border delays, port congestion, time-consuming administrative procedures, a fragmented railway network and inefficient air transport. Additionally, the ICT backbone remained underdeveloped, with low access rates and exorbitant service costs.
Despite possessing the continent's largest hydroelectric potential at 650 million gigawatt hours per year (GWh/year), or over 57% of the total, Central Africa remains the least electrified sub-region in Africa. This is evidenced by its annual electricity production rate of approximately 4% compared to Southern Africa's 60%. Additionally, its per capita electricity consumption is around 109 kilowatt-hours (kWh) per year, far below North Africa’s 740 kWh and Southern Africa’s 1,600 kWh.
In 1991, ECCAS's urban electricity access rate stood at 63%, below the African average of 71%. Among the RECs, ECCAS ranked third, trailing ECOWAS and CENSAD. ECCAS's urban electricity access rate declined from 63% in 1991 to 59.6% in 2023, driven by rapid population growth outpacing electricity infrastructure development and ongoing political instability in the region. This rate is well below the African average of 80.8% and ranking lowest among all RECs. Within ECCAS, Gabon boasted the highest urban electrification rate at 98.6%, followed closely by Cameroon at 93.6% and Equatorial Guinea at 90.8%. In contrast, the Central African Republic exhibited the lowest rates at 32.7%, followed by Chad and DR Congo, which reported 36.8% and 45.3%.
In 1991, ECCAS's rural electrification rate was a mere 6.1%, significantly lagging behind Africa's average of 12.2%. It held the lowest position among all RECs. Despite modest improvements, the rate increased to only 9.4% by 2023, still falling short of Africa's average of 39.5%. ECCAS remained at the bottom of the RECs, with SADC ranking second lowest at 22%, highlighting the region's substantial gap in rural electrification. Within ECCAS, São Tomé and Príncipe led the way in rural electrification with a rate of 69%, followed by Rwanda at 42.8% and Gabon at 30.1%. In contrast, Chad, the Central African Republic and Burundi exhibited alarmingly low rates, with only 1.3%, 1.8% and 2.3%, respectively.
ECCAS's total electrification rate increased modestly from 29% in 1991 to 34.2% in 2023. However, this progress lagged behind the African average which rose from 29.4% to 57% during the same period. As a result, ECCAS slipped from third to last place among the RECs in terms of electrification rates. Gabon led the region in total electrification with a rate of 92.7%, followed closely by São Tomé and Príncipe at 76.1% and Equatorial Guinea at 69.1%. In contrast, Chad, Burundi and the Central African Republic exhibited significantly lower rates, with only 9.8%, 10.7% and 15%, respectively.
Under the Large Infrastructure and Leapfrogging scenario, ECCAS's urban electrification rate will increase slightly from 77.6% to 81.4% by 2043. However, this improvement will still fall short of the overall African average which will reach 89% during the same period. Cameroon and Gabon will achieve universal urban electrification by 2043, reaching a rate of 100%. DR Congo and Burundi will make the most significant strides, with their electrification rates increasing from 73.8% and 79% in the Current Path to 78% and 85.4%. ECCAS's rural electrification rate will increase from 31.8% to 41.5% by 2043. However, this improvement will still fall short of the overall African average, which will be 55.4% during the same period.
São Tomé and Príncipe will maintain its leadership in rural electrification, with a projected rate of 100%. Rwanda and Cameroon will showcase the most improvement, with their rates increasing from 73.6% to 97% and 51.7% to 64.1%, respectively. ECCAS's total electrification rate will increase modestly from 56.7% to 62.9% by 2043. However, this improvement will still fall short of the overall African average which will reach 72% during the same period. Rwanda will lead with the highest electrification rate, with a projected rate of 97.5%, surpassing Gabon with 97.2%. DR Congo and Rwanda will make significant strides, increasing their rates from 51.6% to 57.9% and 78.1% to 97.5%, respectively.
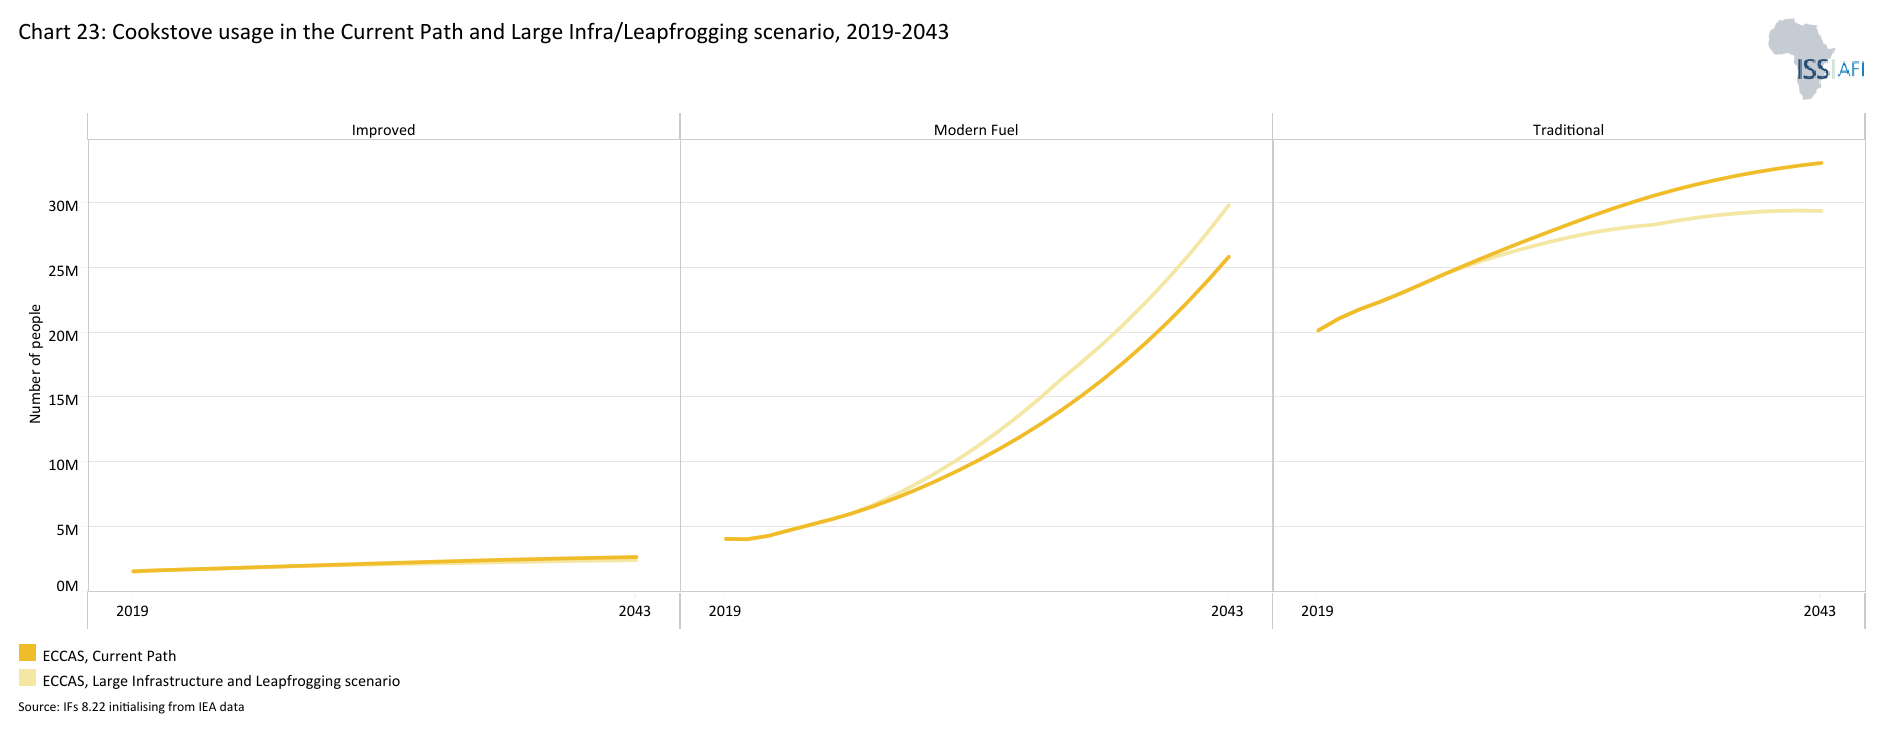
Chart 23 shows the number of people using cookstoves in the Current Path versus the Large Infrastructure and Leapfrogging scenario, from 2019 to 2043.
The scenario distinguishes between three types of cookstoves: traditional, improved and modern. The transition from traditional fuels to modern fuels can significantly improve the health and well-being of communities, particularly women and children, by reducing exposure to harmful pollutants, preventing accidental fires and burns, and saving time and labor.
In 2023, 23 million people in the region relied on traditional stoves fueled by firewood or charcoal for cooking. This placed ECCAS seventh among African regions in terms of the prevalence of traditional stoves, following EAC (30 million), SADC (39.5 million) and IGAD (41.4 million). On average, 140 million people in Africa used traditional stoves. DR Congo had the highest number of people relying on traditional cookstoves within ECCAS, with 9.2 million. Rwanda followed with 3 million. In contrast, São Tomé and Príncipe and Gabon exhibited significantly lower figures, with only 22 000 and 77 000 people, respectively, using traditional stoves. The Large Infrastructure and Leapfrogging scenario predicts a decline in people using traditional cookstoves from 33.1 million in the Current Path to 29.4 million by 2043. Despite this 3.7 million decrease overall, more people will be relying on traditional cookstoves than in 2023. DR Congo will continue to have the highest number of people relying on traditional cookstoves, with 13.2 million, down from 14.5 million in the Current Path. Burundi follows with 3.9 million, down from 4 million in the Current Path. São Tomé and Príncipe will have the least number of people relying on traditional cookstoves, with 16 000 people, from 19 000 in the Current Path. Rwanda showed significant improvement, with 1.8 million who will be relying on traditional cookstoves, down from 3 million in the Current Path.
In 2023, 1.8 million people in ECCAS relied on improved cookstoves, falling below Africa’s average of 8.8 million. Among the RECs, ECCAS ranked sixth, following IGAD with 1.85 million users and ECOWAS with 2.6 million. Within ECCAS, Cameroon led in the adoption of improved cookstoves with 500 000 users, followed closely by Chad with 505 000 and DR Congo with 468 000. In contrast, São Tomé and Príncipe had significantly lower adoption rates, with only 400 users, while Gabon reported 1 600. In the Large Infrastructure and Leapfrogging scenario, ECCAS will have 2.5 million improved cookstove users, a decline of 243 000 compared to the Current Path. Chad will lead in adoption by 2043, with 1.05 million users, slightly down from 1.07 million in the Current Path. DR Congo will follow with 692 000 users, down from 765 000. São Tomé and Príncipe will continue to have the fewest users, with only 300 people relying on improved cookstoves.
In 2023, 5.2 million people in ECCAS used modern cookstoves, well below Africa’s average of 81.2 million. Among the RECs, ECCAS ranked sixth, following IGAD with 6.7 million users and EAC with 4.4 million. Angola led in adoption within ECCAS, with 1.9 million users, followed by Cameroon with 1.2 million and DR Congo with 903 000. In the Large Infrastructure and Leapfrogging scenario, by 2043, ECCAS will have 29.9 million modern cookstove users, an increase of 3.98 million compared to the Current Path. DR Congo will have the highest number of users, reaching 9.16 million, up from 7.7 million. Angola follows with an estimated 7.4 million users, rising from 7 million. São Tomé and Príncipe will have the fewest, with only 39 000 people utilising modern cookstoves.
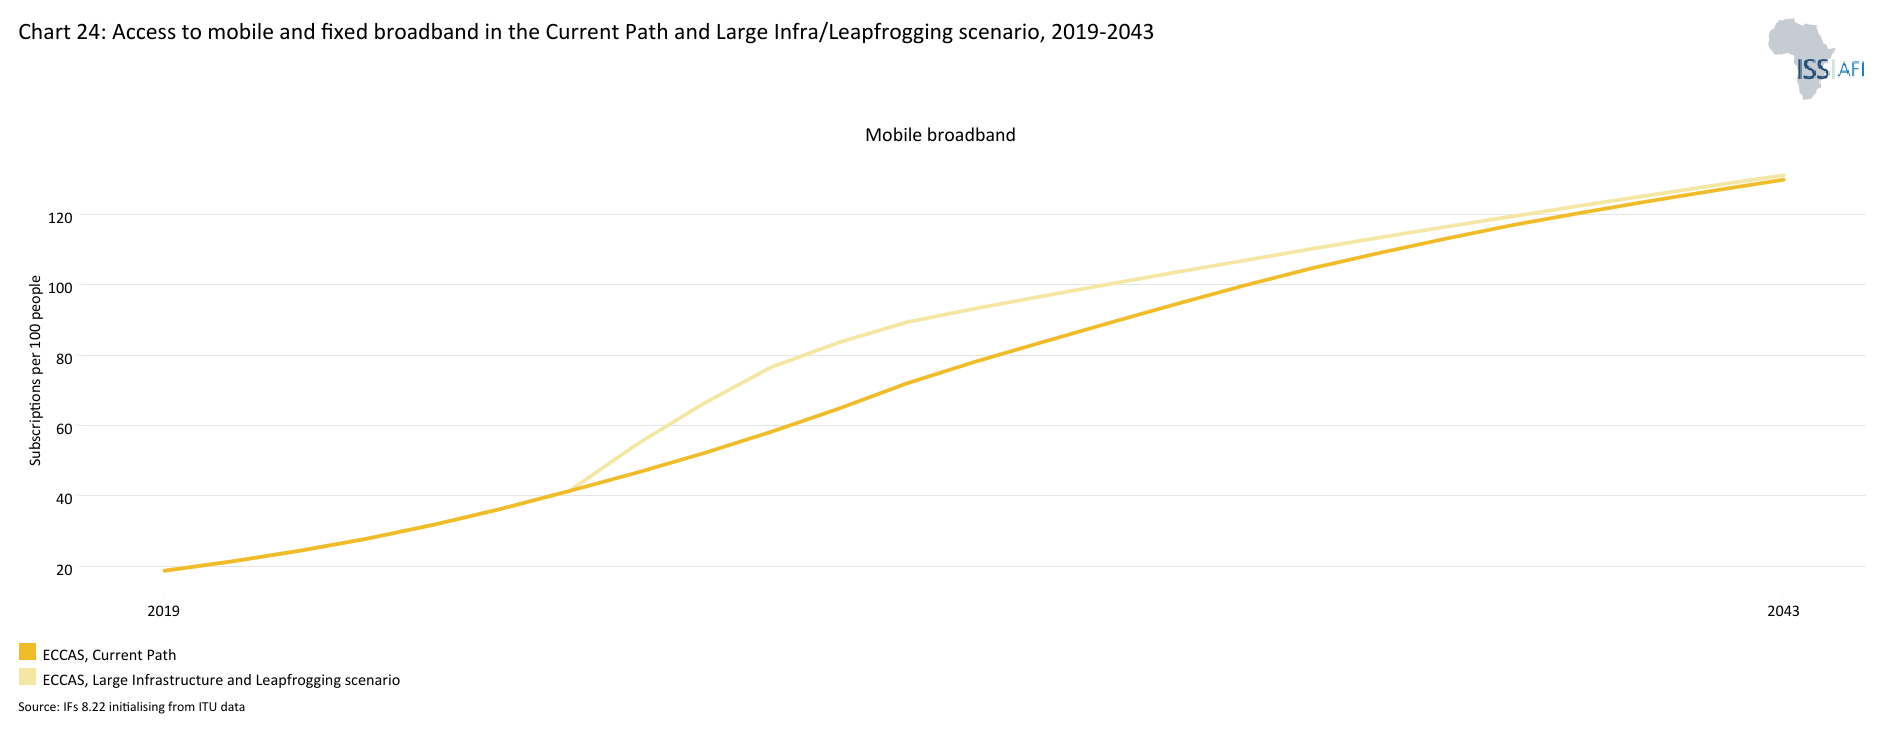
Chart 24 presents the percentage of the population and number of people with access to mobile and fixed broadband in the Current Path compared to the Large Infrastructure and Leapfrogging scenario, from 2019 to 2043. The user can toggle between mobile and fixed broadband.
Mobile technology is the cornerstone for e-commerce in ECCAS, overcoming infrastructure challenges. With limited fixed broadband access, mobile devices are the primary gateway to the internet. Additionally, mobile money services have expanded online payment options, mitigating cash-on-delivery risks and addressing the low penetration of traditional banking methods. By the end of 2019, ECCAS boasted 17 active mobile money services serving approximately 50 million registered accounts. However, several factors hinder the growth of e-commerce in ECCAS. These include limited access to affordable mobile internet, especially for low-income populations, low adoption of digital payments, insufficient addressing systems, bureaucratic customs procedures, and a challenging business environment for e-commerce startups.
In 2023, ECCAS had 32.05 mobile broadband subscriptions per 100 people, significantly lower than the African average of 58.1 subscriptions per 100 people, representing a 44.8% gap compared to the continental average. ECCAS had the lowest number of mobile subscriptions among the RECs. In contrast, AMU had the highest with 105.4 subscriptions per 100 people, while IGAD was slightly higher than ECCAS at 44.1 subscriptions per 100 people. Among the member states, Gabon had the highest number of mobile broadband subscriptions, with 107.3 subscriptions per 100 people, followed by Rwanda with 68.9 subscriptions per 100 people. Equatorial Guinea had the lowest, with only 6.9 subscriptions per 100 people, closely followed by the Central African Republic at 8.8 subscriptions per 100 people. By 2043, under the Large Infrastructure and Leapfrogging scenario, ECCAS will reach 131.2 mobile broadband subscriptions per 100 people, up by 1.3 from the 129.9 subscriptions in the Current Path. Gabon will maintain the highest number of subscriptions, with 153.4 per 100 people, a slight increase of 0.1 from the Current Path. Rwanda will follow with 144.4 subscriptions per 100 people, up by 1.6 from 142.8. The Central African Republic will have the fewest subscriptions at 104.8 per 100 people, an increase of 2.1 from the Current Path, followed by Burundi with 123.8 subscriptions per 100 people, up by 1.9.
Internet access is expanding rapidly in Africa, offering a valuable solution for connecting remote and rural populations in ECCAS. Fixed broadband can support the growth of digital media, improve access to government services and boost business productivity. However, the growth in ECCAS lags behind the continental average. In 2023, fixed broadband access in ECCAS was 2.2 per 100 people, compared to the African average of 3.5. This placed ECCAS seventh among the RECs, ahead of ECOWAS, which had 1.9 subscriptions per 100 people, respectively. In the Current Path, fixed broadband access in ECCAS will reach 20.6 subscriptions per 100 people by 2043. Under the Large Infrastructure and Leapfrogging scenario, this figure will rise to 30.5, an increase of 9.9. Cameroon will have the highest number of subscriptions at 40.8, up by 8.1 from 32.7 in the Current Path. Most member states will experience substantial growth, with DR Congo increasing to 26.2 subscriptions per 100 people, up by 9 from 17.2 in the Current Path, and Chad rising to 28.6 subscriptions per 100 people, up by 10.1 from 18.5 in the Current Path.
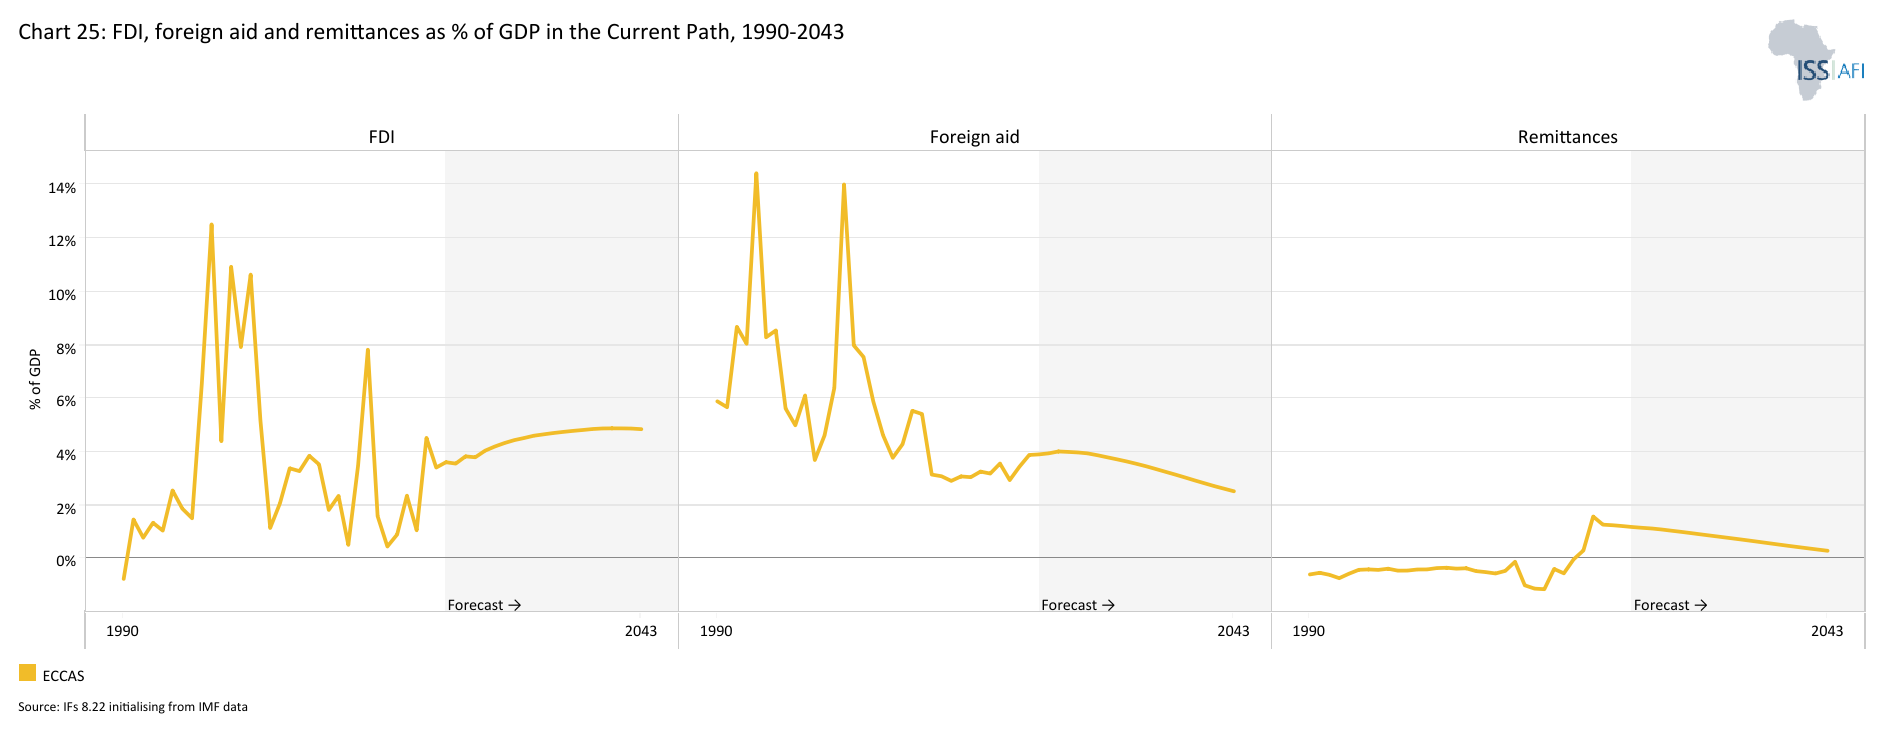
Chart 25 depicts the trends in Foreign Direct Investment, aid and remittances as a percentage of GDP, from 1990 to 2043.
The Financial Flows scenario represents a reasonable but ambitious increase in inward flows of worker remittances, aid to poor countries and an increase in the stock of foreign direct investment (FDI) and additional portfolio investment inflows. We reduce outward financial flows to emulate a reduction in illicit financial outflows.
Visit the theme on Financial Flows for our conceptualisation and details on the scenario structure and interventions.
The ECCAS group's net aid will rise significantly from US$9.1 billion in 2023 to US$19.13 billion in 2043. However, as the economies within the Community expand, the relative impact of aid decreases. While aid as a percentage of GDP increases initially, it ultimately declines, falling from 3.9% in 2023 to 2.5% in 2043 under the Current Path. The Financial Flows scenario, which involves a more gradual reduction in aid as a percentage of GDP, results in higher overall aid levels for the ECCAS group.
The distribution of aid within the ECCAS group is uneven. Upper-middle-income countries like Gabon and Equatorial Guinea receive minimal aid. Conversely, low-income nations, particularly Burundi and the Central African Republic, rely heavily on aid. While CAR's aid as a percentage of GDP declines under the Current Path, it remains higher under the Financial Flows scenario. The Democratic Republic of Congo (DR Congo) receives the most aid in absolute terms, with an increase of US$1.036 billion in 2043 compared to the Current Path. In 2043, aid to the DR Congo constitutes 3.5% of its GDP under the Financial Flows scenario, exceeding the 3.2% projected under the Current Path. Under the Financial Flows scenario, Equatorial Guinea's aid levels will decline to 0.2% of GDP by 2043. Due to their relatively high GDP per capita, Angola's aid will drop to 0 percent of GDP during the same period.
Remittances are a crucial component of many African economies, contributing significantly to their GDP. Beyond their economic impact, remittances serve as a lifeline for many African households, providing crucial income and driving local development. In 2022, remittances accounted for an average of 1.4% of GDP in Central Africa. The cost of sending US$200 in remittances to the ECCAS region averages 9.5%, significantly exceeding the SDG target of less than 3%. The leading remittance-sending countries to ECCAS are primarily francophone European nations, with France accounting for 13% and Belgium for 11%. Most migrants, both men and women, are concentrated in the DR Congo (16%), Uganda (8%) and Rwanda (7%). In 2023, remittances made up 1.1% of ECCAS's GDP, the second lowest among the RECs, with only SADC having a lower share at 0.2% of GDP. The Central African Republic had the highest reliance on remittances within ECCAS, accounting for 40.7% of its GDP. Burundi followed closely at 36.6%, while Chad received remittances equivalent to 2.6% of its GDP. In contrast, Angola and Gabon experienced net outflows of remittances, with negative percentages of -0.79% and -0.76% of GDP, respectively. By 2043, remittances in ECCAS will account for 0.47% of GDP under the Financial Flows scenario, compared to 0.30% in the Current Path. Burundi will have the highest remittance-to-GDP ratio at 32.6%, followed by the Central African Republic at 20.6%. On the other end, Equatorial Guinea and Gabon will have the lowest ratios, at -1.3% and -0.70%, respectively.
According to the United Nations Conference on Trade and Development (UNCTAD), foreign direct investment (FDI) in Central Africa decreased by 17%. Despite a significant increase in the number and value of greenfield projects, the region was adversely affected by the decline in international project finance deals.
In 2021, FDI inflows to ECCAS amounted to US$7.3 billion, representing 8.75% of Africa’s total inflows, which stood at US$80 billion. In 2023, Equatorial Guinea, with its abundant natural resources, particularly oil, received the highest FDI inflows, accounting for 11.5% of its GDP. The growing mining sector has attracted significant investor interest. Equatorial Guinea has made significant progress in its economic development, particularly through business-friendly reforms and the exploration of its natural resources. The government has streamlined regulations and reduced bureaucracy, making it easier for businesses to operate. This has fostered innovation and economic growth, especially in the industrial sector. The country is also capitalising on its natural resources, such as the Congo Basin and its coastal areas, to promote green growth and climate finance. São Tomé and Príncipe, primarily driven by the oil sector, ranked second with FDI inflows amounting to 10.3% of GDP. Under the Financial Flows scenario, FDI inflows will increase significantly in these countries by 2043. In Equatorial Guinea, they will rise to 17.8% of GDP (compared to 15.8% in the Current Path), in São Tomé and Príncipe to 16.8% (from 12.9%).
Chart 26 shows government revenue in the Current Path compared to the Financial Flows scenario, from 2019 to 2043. The data is in US$ 2017 and % of GDP.
Wagner's law, or the law of increasing state activity, is the observation that public expenditure increases as national income rises. It is, therefore, reasonable to expect that government revenues will increase as a percent of GDP in the Financial Flows scenario compared to the Current Path.
In 2023, the government’s total revenue in ECCAS amounted to US$44.6 billion, equivalent to 19% of GDP which was below the average of 20.3% of GDP for Africa. Among member countries, it ranged from 33% of GDP in the Central African Republic to just about 12% of GDP in DR Congo. In the Financial Flows scenario, government revenue will rise to US$170.6 billion in 2043, representing 21.8% of GDP just below the average of 22.8% for Africa. Compared to the Current Path, the scenario can improve government revenue by an additional US$380 million by 2043. Central African Republic, Republic of Congo and Burundi will have the highest government revenue to GDP ratios at 35%, 29.4% and 28.76%, respectively. DR Congo (17.7%), Cameroon (19%) and Chad (21.7%) will record the lowest government revenue to GDP ratios in the scenario by 2043.
Chart 27 presents the Current Path of government effectiveness from 1990 to 2043.
This scenario assumes better governance consisting of stability, capacity and inclusion. It measures a state’s progress using the average of these three indices. To this end, it includes an index (0 to 1) for each dimension, with higher scores indicating improved outcomes.
Visit the theme on Governance for a full conceptualisation and details on the scenario structure and interventions.
Unlike ECOWAS, ECCAS lacks a specific, binding protocol for monitoring democracy and governance within the region. Instead, it relies on the African Charter on Democracy, Elections, and Governance, which has been ratified by only five of its eleven member states. Many ECCAS countries have a history of extending presidential terms through constitutional reviews. Chad is one example, having removed term limits in 2005. As a result, the region holds the African record for the longest-serving presidents. As witnessed in Chad's transition and other Central African nations like Gabon, power transfers frequently involve military coups and fraudulent elections.
In 2023, ECCAS's government effectiveness index score under the Current Path was 1.395. This score will improve to 1.830 by 2043. However, under the Governance scenario, government effectiveness will increase by 22.3% in 2043 compared to the Current Path, reaching a score of 2.237. In 2023, among ECCAS member states, Rwanda had the highest government effectiveness score at 2.623. São Tomé and Príncipe followed with a score of 1.756, and Cameroon with 1.671.
Under the Governance scenario, the government effectiveness scores of the Central African Republic, the DR Congo, and Chad will improve significantly by 2043. The Central African Republic's score will increase by 33%, from 1.140 to 1.520. The DR Congo's score is anticipated to rise by 23.5%, from 1.572 to 1.942. Chad's score will improve by 29.3%, from 1.036 to 1.339.
Chart 28 shows the composite governance index in the Current Path compared to the Governance scenario, from 2019 to 2043.
Central Africa is one of Africa's most vulnerable regions, having experienced numerous coups, crises and conflicts since 1990. The region has been plagued by a variety of conflicts, including ethnoreligious clashes, border disputes, civil wars and genocides. Notable examples include the ethnoreligious conflicts between Burundi and Rwanda, the 1994 Rwandan genocide, the struggle for control of Angola's government by three ethnopolitical factions, and the border disputes between Cameroon and Chad.
ECCAS's peace and security architecture, Central African Early Warning Mechanism (MARAC), and Central African Multinational Force (FOMAC) were established in 2004 to address regional threats. MARAC monitors conflicts, while FOMAC is a multinational force for peacekeeping and humanitarian missions. In discharging duties through MARAC and FOMAC, ECCAS is hindered by insufficient intelligence, limited resources, and reliance on external support by the AU and UN. Despite its intended role in addressing conflicts and promoting democracy in Central Africa, ECCAS has been largely ineffective in preventing constitutional changes, ensuring fair elections, or resolving crises.
In 2023, the region scored 0.60 on the Governance Security Index, which was the lowest among the RECs and below Africa’s average of 0.68. Gabon, São Tomé and Príncipe and Rwanda had the highest scores (0.77, 0.75 and 0.73, respectively) which indicates relative stability in these nations. Central African Republic, DR Congo and Chad had the lowest scores (0.53, 0.54, and 0.61, respectively) which aligns with these countries’ history of political instability.
In the Governance scenario, ECCAS’s score on the government security index will improve to 0.72 by 2043, which will be higher than the Current Path of 0.67 and will be slightly below the average of 0.73 for Africa, indicating the region’s path towards stability. In this scenario, São Tomé and Príncipe, Gabon and Rwanda still maintain the highest scores, Central African Republic, DR Congo and Chad still maintain the lowest scores. Despite maintaining the lowest scores, Central African Republic and DR Congo will record the largest improvement in the scenario of 0.089 and 0.069, respectively. Republic of Congo (0.014) and Equatorial Guinea (0.019) will have the least improvement in the scenario relative to the Current Path.
ECCAS's 2023 government capacity score of 0.23 lagged behind the African average (0.30) and other RECs. Rwanda, Gabon and the Republic of Congo demonstrated higher capacity (0.41, 0.38, and 0.37, respectively), while Burundi, DR Congo and the Central African Republic struggled (0.15, 0.16 and 0.19, respectively). These scores align with the 2023 Transparency International Corruption Perception Index, where the DR Congo, Burundi and Chad ranked among the lowest (162 out of 180).
In the Governance scenario, the score of ECCAS on the governance capacity index will reach 0.36 by 2043. This will be a 13.7% improvement over the Current Path. Rwanda (0.56), Gabon (0.49) and Angola (0.48) will maintain the highest scores. Burundi (0.29), DR Congo (0.303) and Republic of Congo (0.306) maintain the lowest scores. Notably, São Tomé and Príncipe (0.062), Rwanda (0.063) and the Central African Republic (0.054) will experience the most significant gains; whereas Republic of Congo (0.029) Cameroon (0.040) and Chad (0.041) will see the least improvement.
In July 2020, ECCAS signed a Memorandum of Understanding with UN Women to support the implementation of its Gender Policy and Action Plan. This collaboration aims to harmonise policies and strengthen ECCAS's institutional capacity to promote gender equality and women's empowerment in line with Agenda 2063 and the ECCAS Strategic Plan 2021-2025. Joint efforts will focus on knowledge sharing, capacity building and advocacy, including organising a conference on women's economic empowerment and entrepreneurship in Central Africa.
In 2023, ECCAS had a governance inclusion score of 0.32, below Africa’s average of 0.48 and below the average of all the RECs. Within ECCAS, Gabon exhibited the highest governance inclusion score at 0.56 evidenced by the fact that Gabon elected its first female prime minister in July 2020, marking a significant step towards gender equality in the country's leadership. The Central African Republic (0.49) and São Tomé and Príncipe (0.47) followed Gabon. In contrast, the Republic of Congo recorded the lowest score at 0.26, with DR Congo (0.28) and Cameroon (0.33) also showing relatively low levels of governance inclusion.
By 2043, the ECCAS score on government inclusion will reach 0.45 in the Governance scenario, which will be 21% more than the Current Path and 20.3% below Africa's average. Gabon, Central African Republic and São Tomé and Príncipe will continue to have the highest inclusion scores while, Republic of Congo, DR Congo and Cameroon will have the lowest score.
Chart 29 presents GDP per capita in the Current Path and all sectoral scenarios, from 2019 to 2043.
The scenario with the greatest impact on GDP per capita by 2043 is the AfCFTA scenario, followed by the Manufacturing and Governance scenarios. Under the AfCFTA scenario, ECCAS’s GDP per capita will rise to US$4 317, representing an increase of US$325 or 8.1% above the Current Path. In the Manufacturing scenario, GDP per capita will be US$233 or 5.8%, higher than the Current Path. This underscores the importance of addressing the region’s governance challenges and ensuring that member states ratify and fully implement the continental free trade agreement to unlock their development potential. Investment in physical infrastructure, crucial for development, will further catalyse growth. Conversely, the scenarios with the least impact on GDP per capita are the Financial Flows and Demographics and Health scenarios.
The AfCFTA, Financial Flows, and Governance scenarios have the greatest overall impact on GDP per capita across the countries analyzed. The AfCFTA scenario significantly boosts GDP per capita in Equatorial Guinea and Rwanda, while its impact is less pronounced in Chad and the Central African Republic. The Financial Flows scenario most benefits Equatorial Guinea and Gabon, with minimal impact in Burundi and the Central African Republic. Similarly, the Governance scenario has a substantial influence on GDP per capita in Gabon and Equatorial Guinea but shows limited effects in Burundi and Chad.
Chart 30 shows poverty in the Current Path and all sectoral scenarios, from 2019 to 2043. The user can select the number of extremely poor people or the percentage of the population.
The scenarios with the greatest potential to reduce extreme poverty by 2043 in ECCAS are the Manufacturing, Education and Governance scenarios. In the Manufacturing scenario, there will be 20.2 million fewer extremely poor people compared to the Current Path. The Education and the Governance scenarios have the potential to reduce extreme poverty in the region by 8.9 million and 8 million people, respectively. These scenarios are interconnected in their potential to reduce extreme poverty in ECCAS. A strong manufacturing sector can create jobs and drive economic growth, but it requires a well-educated workforce and a stable governance environment to thrive. Education equips individuals with the skills and knowledge needed to participate in the labor market and contribute to economic development. Good governance promotes stability, security and the rule of law, which are essential for attracting investment and fostering a conducive environment for businesses and job creation. By focusing on these three areas, ECCAS countries can create a virtuous cycle of economic growth and poverty reduction.
In all scenarios, the DR Congo and Burundi see the greatest poverty reduction, except in the Manufacturing scenario, where Angola replaces Burundi. In the AfCFTA scenario, Chad and the Republic of Congo experience the smallest reductions in poverty. Gabon consistently sees the least poverty reduction across multiple scenarios, including Agriculture, Demographics and Health, Education, Financial Flows, Governance, Large Infrastructure and Leapfrogging, and Manufacturing. Equatorial Guinea shows minimal progress in the Agriculture, Financial Flows, and Large Infrastructure and Leapfrogging scenarios, while São Tomé and Príncipe sees the least poverty reduction in the Demographics and Health, Governance, and Manufacturing scenarios. Rwanda experiences the smallest poverty reduction in the Education scenario.
Chart 31 presents GDP in the Current Path and in the Combined scenario, from 2019 to 2043. The data is in US$ 2017 and at market exchange rates.
The Combined scenario consists of the combination of all eight sectoral scenarios, namely Governance, Demographics and Health, Education, Large Infrastructure and Leapfrogging, Agriculture, Manufacturing, AfCFTA and Financial Flows.
The GDP of ECCAS will increase from US$235.6 billion in 2023 to US$1.2 trillion by 2043 in the Combined scenario. This represents an increase of 409% within this period. The size of the ECCAS economy will be 127.7% larger in the Combined scenario than in the Current Path. The large increase will be driven by DR Congo’s economy, which will account for 38.8% of total GDP in the region by 2043, followed by Angola and Cameroon at 24.5% and 14.2%, respectively. DR Congo demonstrates the most significant improvement in the Combined scenario, with the economy expanding by an additional US$222.8 billion compared to the Current Path. This growth can be attributed to enhanced management and exploitation of its abundant natural resources, including cobalt, and rising global demand for these critical materials, particularly as the popularity of electric vehicles, reliant on cobalt-based batteries, surges. This is followed by Angola and Cameroon, which see increases of US$90.3 billion and US$56.7 billion, respectively. Conversely, São Tomé and Príncipe, the Central African Republic, and Burundi will experience the smallest relative changes in GDP within the Combined scenario, with gains of US$1 billion, US$5.2 billion and US$9 billion, respectively.
Chart 32 presents the value added by sector in the Current Path and in the Combined scenario, from 2019 to 2043. The data is in US$ 2017 and as a % of GDP.
In the Combined scenario, the service sector’s contribution to GDP will be US$201.3 billion larger than in the Current Path for 2043, equivalent to 46.5% of GDP. Manufacturing will be the second-biggest contributor, adding US$133.7 billion to the regional economy above the Current Path to constitute 24.3% of the ECCAS economy in the scenario. The materials sector will also contribute US$83.4 billion more in the scenario than in the Current Path, equivalent to 13.3% of GDP. Agriculture will contribute US$29.7 billion above the Current Path, accounting for 7.3% of GDP in the scenario. The contributions of ICT and energy will account for 5.1% and 3.4%, respectively, translating to US$21.7 and US$2.3 more than in the Current Path by 2043.
In the Combined scenario, the service sector in São Tomé and Príncipe will contribute 75.5% to GDP, the largest contribution in the region, while that of the Republic of Congo will be the lowest at 32.9% of GDP. At 36.8%, Republic of Congo’s manufacturing sector will be the largest in the region while São Tomé and Príncipe’s contribution of 7.2% to manufacturing in the scenario will be the lowest. The contribution of materials to GDP in the scenario will range from 29% in DR Congo to a paltry 0.6% in São Tomé and Príncipe by 2043. The agriculture sector in the Central African Republic will be largest in the region contributing 23.4% while the ICT sector in Equatorial Guinea (8.8%) and the energy sector in the Republic of Congo (16.5%) will be the largest in the region.
Chart 33 presents the size of the informal sector as a percentage of the total economy in the Current Path and in the Combined scenario, from 2019 to 2043.
The informal sector in ECCAS is characterized by high prevalence, a focus on agriculture and trade, limited access to formal financial services, vulnerability to shocks, and a significant role in cross-border trade. Despite these challenges, it remains a vital source of employment and income for many people in the region.
In 2023, the informal sector played a substantial role in ECCAS's economy, contributing 31.7% to GDP. DR Congo had the highest reliance on the informal sector, with a 42% contribution, followed by the Central African Republic at 40%. In contrast, Equatorial Guinea had the lowest reliance, with only 13.4% of its GDP coming from the informal sector, followed by Cameroon at 23.5%.
The informal labor force was also significant, accounting for 68% of total employment. DR Congo once again had the highest proportion of informal laborers at 83.8%, while Equatorial Guinea had the lowest at 19%.
In the Combined scenario, by 2043, the informal sector will account for 19.4% of GDP, a decrease from 27.8% in the Current Path. The Central African Republic will have the highest share at 23.5%, followed closely by the Republic of the Congo at 23.3% and Chad at 22.2%. In contrast, Equatorial Guinea will have the lowest contribution at just 1%, followed by Cameroon at 14.7% and São Tomé and Príncipe at 15.3%. The Central African Republic will experience the largest reduction in the informal sector's share of GDP, decreasing by 12.5%, followed by the DR Congo with a reduction of 12%. Angola will see the least reduction at 5.3%, with Cameroon not far behind at 6.5%.
By 2043, the informal labor force will decrease significantly to 29.2%. At that time, the Central African Republic will have the highest proportion of informal laborers at 42.5%, while Equatorial Guinea will continue to have the lowest, with only 1% of its labor force in informal employment
Chart 34 compares life expectancy in the Current Path with the Combined scenario from 2019 to 2043.
In 2023, the average life expectancy for people in the ECCAS region was 65.5 years, which was lower than the average of 67.4 years for Africa. It was lowest among the RECs. On average, females in ECCAS live about 4.5 years longer than males. Among member countries, life expectancy was highest in São Tomé and Príncipe (72 years) and Rwanda (69.8 years), and lowest in the Central African Republic (53.9 years) and Chad (61.6 years). In the Current Path, life expectancy in the region will increase to 70.6 years by 2043. However, the Combined scenario leads to a greater increase such that, by 2043, the average life expectancy in ECCAS will be around 72.2 years, below the average of 72.6 years for Africa in the same year.
In the Combined scenario, São Tomé and Príncipe will still have the highest life expectancy in the region at 77 years. This will be followed by Rwanda and Angola at 75.6 years and 75.3 years, respectively. Central African Republic, Chad and DR Congo will have the lowest life expectancies (63.8 years, 70.8 years and 71.1 years, respectively). The largest increase in life expectancy between the Current Path and Combined scenario will occur in Central African Republic, Chad and Equatorial Guinea which will see averages increase by 4.9, 3.7 and 2.7 years, respectively. The smallest increments will be seen in DR Congo, Republic of Congo and Rwanda with life expectancies lengthening by only 0.88, 0.90 and 0.94 years, respectively.
Chart 35 compares the Gini coefficient in the Current Path with the Combined scenario, from 2019 to 2043.
In 2023, ECCAS’s Gini coefficient was 0.44 compared to the average of 0.40 for Africa. This makes ECCAS the second most equal region among the RECs. Among member states, it ranges from 0.56 in the Central African Republic to 0.37 in Burundi.
On the Current Path, income inequality in ECCAS will decrease with a Gini coefficient of 0.42 by 2043. In the Combined scenario, inequality in ECCAS will be lower than the Current Path with a Gini coefficient of 0.38 by 2043. Among member countries, the Central African Republic (0.61) will continue to be the most unequal country in the region followed by Angola (0.50) and Equatorial Guinea (0.49). DR Congo (0.30), Burundi (0.33) and Liberia (0.35) will be the least unequal countries. The greatest reduction in inequality occurs in DR Congo, Burundi and Rwanda while the lowest reduction occurs in Cameroon, Angola and Gabon.
Chart 36 compares carbon emissions in the Current Path with the Combined scenario from 2019 to 2043.
In 2023, ECCAS emitted a total of 23 million tons of carbon from fossil fuels. Among the RECs, ECCAS recorded the second-lowest emissions, following only the EAC. Among member countries, Angola was the highest emitter of carbon (8 million tons: 34.8% of total emissions). It was followed by Equatorial Guinea (4.8 million tons: 20.9% of total emissions) and Cameroon (3 million tons: 13% of total emissions).
By 2043, total carbon emissions will have more than quintupled to 85 million tons in the Current Path. In the Combined scenario, the region will emit 110 million tons of carbon by 2043, which is 29.4% above the Current Path.
The AfCFTA, Manufacturing and Governance scenarios are the most carbon-intensive primarily due to their potential to stimulate economic growth and industrialization. These factors can lead to increased energy consumption, particularly from fossil fuels, resulting in higher carbon emissions. The AfCFTA, for example, could increase trade and economic activity, leading to higher demand for transportation and industrial production. Manufacturing, by its nature, often involves energy-intensive processes. While good governance can promote sustainable development, it may also lead to increased economic activity and associated emissions if not accompanied by effective environmental policies. The Demographics and Health, Education and the Financial Flows scenarios are the least carbon-intensive. In the Combined scenario, Angola will be the largest carbon emitter, releasing 33 million tons, followed by DR Congo with 30 million tons. At the other end of the spectrum, São Tomé and Príncipe will emit the least, with only 200 000 tons, followed by the Central African Republic at 900 000 tons.
Chart 37 compares energy production from 2019 to 2043 in the Current Path with the Combined scenario in six types, namely oil, gas, coal, hydro, nuclear and other renewables. The data is converted into billion barrels of oil equivalent (BOE) to allow for comparisons between different sources. Note that energy production could be for domestic use or export.
In 2023, ECCAS produced 790 million barrels of oil equivalent (BOE), including 186 million BOE of gas, 7 million BOE of coal, 50 million BOE of hydropower, 300 000 BOE of nuclear energy, and 3 million BOE of other renewable sources. Angola emerged as the largest oil producer, generating 406 million BOE, with the Republic of Congo following at 116 million BOE. Angola also led in gas production with 84 million BOE, while Cameroon followed with 37 million BOE. DR Congo was the top producer of hydro energy at 32 million BOE and also led in other renewables, producing 1 million BOE. Additionally, Equatorial Guinea was the leading producer of coal, contributing 4.5 million BOE. There is a lack of nuclear energy data in the ECCAS region, which can be attributed to economic priorities, technological and expertise gaps, regulatory and safety concerns, political instability, and a regional energy mix that relies on traditional sources. Nevertheless, some member states are making strides toward nuclear development. Rwanda, for instance, is actively pursuing nuclear development through collaborations with Dual Fluid and internal initiatives. The country aims to establish a demonstration nuclear reactor by 2026 and is conducting feasibility studies for a nuclear research reactor and a nuclear power program, with key milestones set for 2024. Similarly, Burundi is taking steps to pursue nuclear development, having established its first Country Programme Framework with the International Atomic Energy Agency in 2016. To strengthen its nuclear capabilities, Burundi's Ministry of Foreign Affairs introduced a legislative framework in 2019, detailing regulations for the peaceful use, safety and security of nuclear energy and ionising radiation.
Under the Combined scenario, ECCAS will produce 792 million BOE by 2043, exceeding the Current Path by 3 million BOE. Gas production will reach 275 million BOE, 4 million BOE below the Current Path. Coal production will be 10 million BOE, 1 million BOE less than the Current Path f. Hydropower generation will increase to 246 million BOE, surpassing the Current Path by 60 million BOE. Nuclear energy production will reach 1.2 million BOE, 200 000 BOE more than the Current Path. Finally, other renewable sources will produce 58 million BOE, 7 million BOE more than the Current Path. Angola is set to be the largest producer of oil, with an output of 251 million BOE. The DR Congo will lead in hydro production, generating 175 million BOE. Additionally, Angola will be the top producer of gas at 133 million BOE and will also excel in producing other renewables, reaching 19 million BOE. Equatorial Guinea will take the lead in coal production with 6.3 million BOE, while Burundi will be the largest producer of nuclear energy, generating 400 000 BOE.
Chart 38 summarises the policy recommendations for ECCAS.
Despite progress, ECCAS continues to face significant challenges, including insufficient crop production, a persistent supply-demand gap in agriculture, and a reliance on imports that undermine self-sufficiency. These issues are compounded by low electrification rates, especially in rural areas, which hinder development and exacerbate inequality.
While ECCAS has made strides in increasing agricultural output, the region still struggles to meet its growing demand, resulting in a substantial shortfall in domestic supply. The manufacturing sector, though improving, remains below the African average, with only a few countries like Gabon and Equatorial Guinea showing significant contributions. Additionally, ECCAS's trade balance, heavily dependent on exports from a few resource-rich countries, highlights the region's vulnerability to external market fluctuations.
The analysis indicates that, although ECCAS is on a path of gradual improvement, the progress is not transformative enough to address the region's deep-rooted structural challenges. Without significant and aggressive interventions, ECCAS will likely fail to achieve its targets for inclusive and sustainable development by 2043. The region's future hinges on closing the agricultural supply-demand gap, boosting manufacturing capacity and improving access to electricity, particularly in rural areas, to foster long-term growth and stability.
Thus, rigorous and targeted socio-economic policy interventions in the areas of demographics and health, education, agriculture, infrastructure, manufacturing, trade, financial flows and governance need to be undertaken to improve the region’s current development trajectory.
Specifically the region should:
- Promote investment in key sectors by focusing on attracting FDI in sectors with high growth potential, such as agriculture, manufacturing and renewable energy.
- Strengthen regional integration by facilitating cross-border investment and trade to create a more attractive investment climate.
- Strengthen conflict resolution mechanisms by improving the effectiveness of the Central African Early Warning Mechanism (MARAC) and the Central African Multinational Force (FOMAC) by providing adequate funding, training, and intelligence resources.
- Address resource dependence by diversifying national economies to reduce reliance on extractive resources, which can exacerbate corruption and conflict.
- Strengthen healthcare infrastructure by building and equipping new healthcare facilities, as well as training more healthcare professionals.
- Enhance transportation networks by improving roads and transportation systems to facilitate the efficient movement of agricultural products to markets.
- Improve irrigation systems by expanding and modernising irrigation infrastructure to ensure year-round crop production and reduce reliance on rainfall.
- Expand access to secondary education by increasing the availability of secondary schools, especially in rural areas, to ensure that more children can complete their education.
- Develop relevant curricula to ensure that curricula are aligned with the needs of the labour market and promote critical thinking and problem-solving skills.
- Develop value-added products by promoting the development of value-added products to increase export earnings and create higher-skilled jobs.
Page information
Contact at AFI team is Tumi Mkhize-Malebo
This entry was last updated on 6 December 2024 using IFs v8.22.
Reuse our work
- All visualizations, data, and text produced by African Futures are completely open access under the Creative Commons BY license. You have the permission to use, distribute, and reproduce these in any medium, provided the source and authors are credited.
- The data produced by third parties and made available by African Futures is subject to the license terms from the original third-party authors. We will always indicate the original source of the data in our documentation, so you should always check the license of any such third-party data before use and redistribution.
- All of our charts can be embedded in any site.
Cite this research
Tumi Mkhize-Malebo (2026) ECCAS. Published online at futures.issafrica.org. Retrieved from https://futures.issafrica.org/geographic/recs/eccas/ [Online Resource] Updated 6 December 2024.
