 COMESA
Feedback welcome
Our aim is to use the best data to inform our analysis. See our Technical page for information on the IFs forecasting platform. We appreciate your help and references for improvements via our feedback form.
Please note: This regional report was developed using African Futures’ previous analytical framework, which organised the assessment across 11 sectoral scenarios. We have since updated and streamlined the analytical architecture to 8 sectoral scenarios. While the two frameworks remain broadly aligned, the current structure improves consistency, comparability and integration across themes and geographic studies. This page will therefore be updated to the current framework in due course. Read more about our analytical framework on the Technical Page.
In this entry, we first describe the Current Path forecast for COMESA as it is expected to unfold to 2043, the end of the third ten-year implementation plan of the African Union’s Agenda 2063 long-term vision for Africa. The Current Path in the International Futures (IFs) forecasting model initialises from country-level data that is drawn from a range of data providers. We prioritise data from national sources.
The Current Path forecast is divided into summaries on demographics, economics, poverty, health/WaSH and climate change/energy. A second section then presents a single positive scenario for potential improvements in stability, demographics, health/WaSH, agriculture, education, manufacturing/transfers, leapfrogging, free trade, financial flows, infrastructure, governance and the impact of various scenarios on carbon emissions. With the individual impact of these sectors and dimensions having been considered, a final section presents the impact of the Combined Agenda 2063 scenario.
We generally review the impact of each scenario and the Combined Agenda 2063 scenario on gross domestic product (GDP) per person and extreme poverty except for Health/WaSH that uses life expectancy and infant mortality.
The information is presented graphically and supported by brief interpretive text.
All US$ numbers are in 2017 values.
Executive Summary
- Current Path forecast
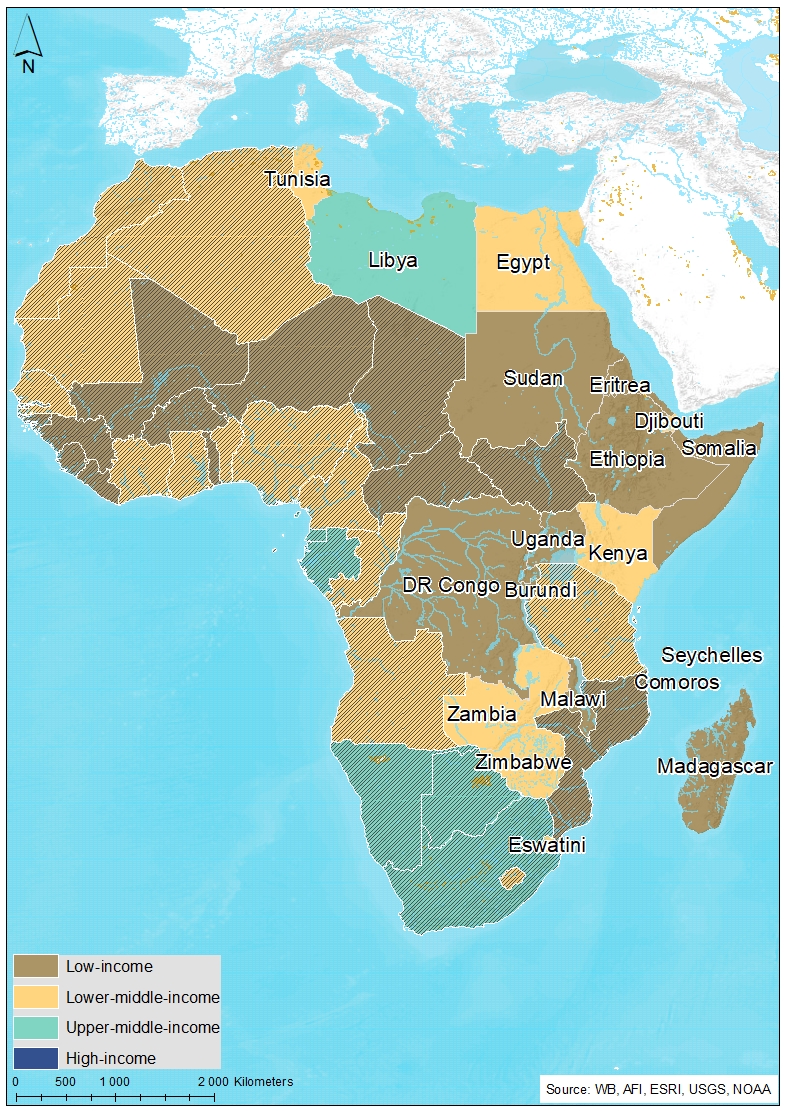
- The Common Market for Eastern and Southern Africa (COMESA) has 21 member states, making it the second largest regional economic community in Africa. The community has ten low-income countries, eight lower middle-income countries, two upper middle-income countries and one high-income country. Jump to forecast: Current Path
- COMESA’s total population size was 582.4 million in 2019 and is expected to reach 982.2 million people by 2043. At the country level, Ethiopia has the largest population, with 112 million people in 2019, while Djibouti, Comoros and Seychelles all had fewer than 1 million citizens in 2019. Jump to Demographics: Current Path
- Considerable divergences exist between COMESA members’ GDPs per capita, as Seychelles’ GDP per capita is projected to rise to US$33 409 by 2043, while Burundi’s is projected to only reach US$1 297 in that same year. Jump to Economics: Current Path
- In 2019, 35.4% of COMESA’s population was deemed extremely poor; by 2043, this figure would have dropped to 18.8%. This equates to a reduction of 22 million people — a positive outcome considering COMESA’s population is projected to increase by 399.8 million people in that time. Jump to Poverty: Current Path
- The country primarily responsible for COMESA’s total carbon emissions of 130 million tons in 2019 was Egypt, which accounted for 51.9% of emissions in that year and is projected to account for 48.9% in 2043. Jump to Carbon emissions/Energy: Current Path
- Sectoral scenarios
- COMESA’s average GDP per capita will be US$247 higher in the Stability scenario compared to the Current Path forecast by 2043, US$347 below the average for Africa for the same year. Jump to Stability scenario
- COMESA will reach its period of demographic dividend seven years earlier in the Demographic scenario than in Current Path forecast, mainly due to the combination of reduced infant mortality, a lower total fertility rate and increased life expectancy. Jump to Demographic scenario
- The infant mortality rate in COMESA will be 16.7 deaths per 1 000 live births in 2043 in the Health/WaSH scenario, 1.8 deaths lower than the Current Path forecast and 22.5 deaths lower than in 2019. Jump to Health/WaSH scenario
- In the Agriculture scenario, COMESA’s yield per hectare will be 7.3 tons in 2043, 2.3 tons higher than in the Current Path forecast, with Eswatini expected to experience the largest increase among COMESA’s members. Jump to Agriculture scenario
- COMESA’s total mean years of adult education was 0.5 years below the average for Africa in 2019 but is expected to close the gap to 0.3 years in the Education scenario. The large disparity of 1.1 years between male and female figures in 2019 will be reduced to 0.7 by 2043 in the Education scenario. Jump to Education scenario
- In the Manufacturing/Transfers scenario, COMESA’s poverty rate will be 2.5 percentage points lower than the Current Path forecast, equating to 25.2 million fewer people being extremely poor by 2043. Jump to Manufacturing/Transfers scenario
- In the Leapfrogging scenario, COMESA’s average total electricity access would reach 84% by 2043, 11 percentage points higher than Africa’s Current Path forecast for the same year. Jump to Leapfrogging scenario
- The Free Trade scenario would have the largest positive effect on COMESA’s GDP per capita out of all the scenarios modelled, boosting the average GDP per capita to US$7 218 in 2043, US$655 higher than the Current Path forecast for the same year. Jump to Free Trade scenario
- Malawi gets the largest increase in inward FDI as a per cent of GDP among COMESA by 2043 in the Financial Flows scenario, with its rate being 2.3 percentage points higher by 2043 compared to the Current Path forecast. Jump to Financial Flows scenario
- COMESA’s average in the Rural Access Index (RAI) was 54.3% in 2019, and the Infrastructure scenario will boost this figure to 63.9% by 2043, 2.2 percentage points higher than the Current Path forecast. Jump to Infrastructure scenario
- The Governance scenario helps COMESA to increase its low governance effectiveness score of 1.75 out of 5 in 2019, raising its score to 2.37 by 2043, 0.15 above Africa’s average. Jump to Governance scenario
- The rise in economic activity brought about by the scenarios will lead to increased carbon emissions, with the Free Trade scenario affecting highest increase, followed by the Manufacturing/Transfers and Stability scenarios. Jump to Impact of scenario on carbon emissions
- Combined Agenda 2063 scenario
- The Combined Agenda 2063 scenario will significantly increase COMESA’s GDP per capita to US$10 235 by 2043, US$3 672 higher than the Current Path forecast for the same year. Jump to Combined Agenda 2063 scenario
- From a high level of 35.4% in 2019, COMESA’s poverty rate is projected to rapidly decline to 4.1% in the Combined Agenda 2063 scenario, a 14.7 percentage point decrease compared to the Current Path forecast that equates to 146.9 million fewer people being extremely poor by 2043. Jump to Combined Agenda 2063 scenario
- The increase in carbon emissions due to the Combined Agenda 2063 scenario is significant but not unmanageable as by 2043 carbon emissions will be 73 million tons more than in the Current Path forecast, necessitating increased efforts to find ways to combat rising emissions as development takes place. Jump to Combined Agenda 2063 scenario
All charts for COMESA Development Futures
- Chart 1: Political map of COMESA
- Chart 2: Population structure in CP, 1990–2043
- Chart 3: Urban and rural population in CP, 1990–2043
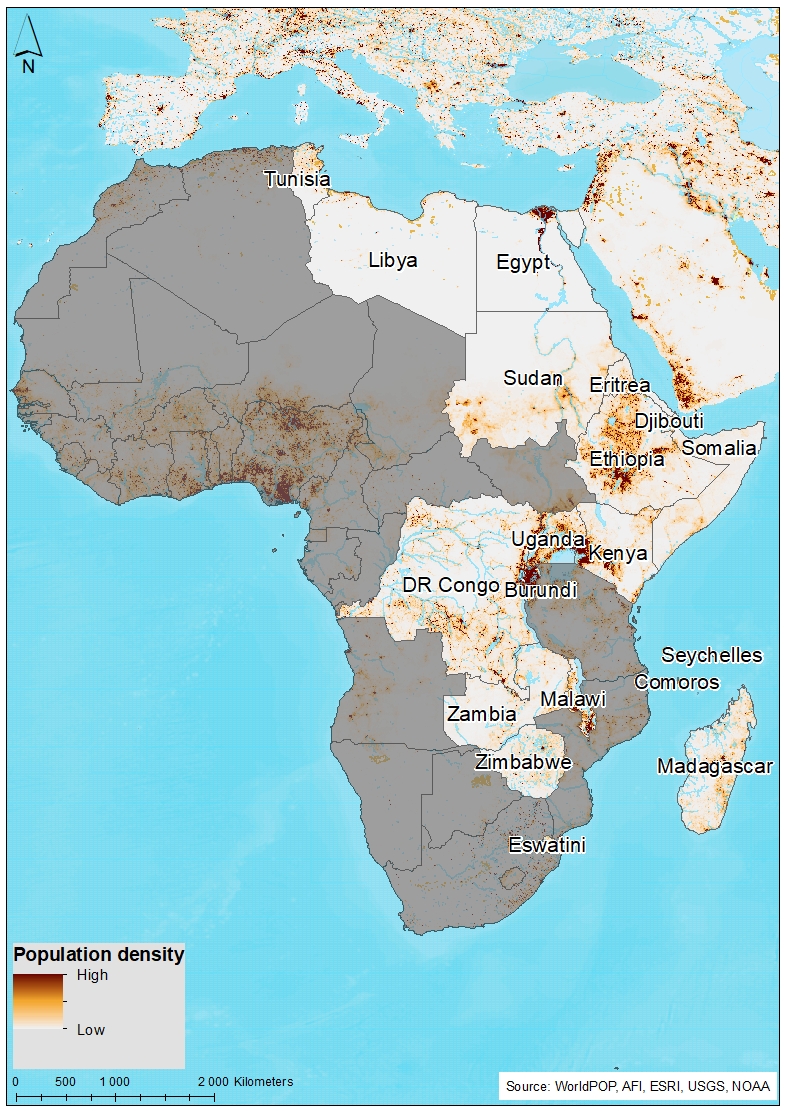
- Chart 4: Population density map for 2019
- Chart 5: GDP in CP, 1990–2043
- Chart 6: GDP per capita in CP, 1990–2043
- Chart 7: Informal sector value in CP, 2015–2043
- Chart 8: Value added by sector in CP, 2015–2043
- Chart 9: Agriculture production/demand in CP, 1990–2043
- Chart 10: Poverty in CP, 2015–2043
- Chart 11: Energy production by type in CP, 1990–2043
- Chart 12: Carbon emissions in CP, 1990–2043
- Chart 13: Governance security in CP and Stability scenario, 2019–2043
- Chart 14: GDP per capita in CP and Stability scenario, 2019–2043
- Chart 15: Poverty in CP and Stability scenario, 2019–2043
- Chart 16: Demographic dividend in CP and Demog scenario, 2019–2043
- Chart 17: Infant mortality in CP and Demog scenario, 2019–2043
- Chart 18: GDP per capita in CP and Demog scenario, 2019–2043
- Chart 19: Poverty in CP and Demog scenario, 2019–2043
- Chart 20: Life expectancy in CP and Health/WaSH scenario, 2019–2043
- Chart 21: Infant mortality in CP and Health/WaSH scenario, 2019–2043
- Chart 22: Yield/hectare in CP and Agric scenario, 2019–2043
- Chart 23: Agriculture imports in CP and Agric scenario, 2019–2043
- Chart 24: GDP per capita in the CP and Agric scenario, 2019–2043
- Chart 25: Poverty in CP and Agric scenario, 2019–2043
- Chart 26: Mean years of education in CP and Educ scenario, 2019–2043
- Chart 27: Education quality in CP and Educ scenario, 2019–2043
- Chart 28: GDP per capita in CP and Educ scenario, 2019–2043
- Chart 29: Poverty in CP and Educ scenario, 2019–2043
- Chart 30: Value added by sector in CP and Manufac/Transfers scenario, 2019–2043
- Chart 31: Gov welfare transfers in CP and Manufac/Transfers scenario, 2019–2043
- Chart 32: GDP per capita in CP and Manufac/Transfers scenario, 2019–2043
- Chart 33: Poverty in CP and Manufac/Transfers scenario, 2019–2043
- Chart 34: Fixed broadband access in CP and Leapfrogging scenario, 2019–2043
- Chart 35: Mobile broadband access in CP and Leapfrogging scenario, 2019–2043
- Chart 36: Electricity access in CP and Leapfrogging scenario, 2019–2043
- Chart 37: GDP per capita in CP and Leapfrogging scenario, 2019–2043
- Chart 38: Poverty in CP and Leapfrogging scenario, 2019–2043
- Chart 39: Trade balance in CP and Free Trade scenario, 2019–2043
- Chart 40: GDP per capita in CP and Free Trade scenario, 2019–2043
- Chart 41: Poverty in CP and Free Trade scenario, 2019–2043
- Chart 42: Foreign aid in CP and Financial Flows scenario, 2019–2043
- Chart 43: Inflow of FDI in CP and Financial Flows scenario, 2019–2043
- Chart 44: Remittances in CP and Financial Flows scenario, 2019–2043
- Chart 45: GDP per capita in CP and Financial Flows scenario, 2019–2043
- Chart 46: Poverty in CP and Financial Flows scenario, 2019–2043
- Chart 47: Electricity access in CP and Infrastructure scenario, 2019–2043
- Chart 48: Rural road access in CP and Infrastructure scenario, 2019–2043
- Chart 49: GDP per capita in CP and Infrastructure scenario, 2019–2043
- Chart 50: Poverty in CP and Infrastructure scenario, 2019–2043
- Chart 51: Gov effectiveness in CP and Governance scenario, 2019–2043
- Chart 52: GDP per capita in CP and Governance scenario, 2019–2043
- Chart 53: Poverty in CP and Governance scenario, 2019–2043
- Chart 54: Carbon emissions in CP and scenarios, 2019–2043
- Chart 55: GDP per capita in CP and scenarios, 2019–2043
- Chart 56: GDP per capita in CP and Combined scenario, 2019–2043
- Chart 57: Poverty in CP and Combined scenario, 2019–2043
- Chart 58: Value added by sector in CP and Combined scenario, 2019–2043
- Chart 59: GDP in CP and Combined scenario, 2019–2043
- Chart 60: Carbon emissions in CP and Combined scenario, 2019–2043


COMESA Development Futures: Current Path
Download to pdfThis page provides an overview of the key characteristics of COMESA along its likely (or Current Path) development trajectory. The Current Path forecast from the International Futures forecasting (IFs) platform is a dynamic scenario that imitates the continuation of current policies and environmental conditions. The Current Path is therefore in congruence with historical patterns and produces a series of dynamic forecasts endogenised in relationships across crucial global systems. We use 2019 as a standard reference year and the forecasts generally extend to 2043 to coincide with the end of the third ten-year implementation plan of the African Union’s Agenda 2063 long-term development vision.
The Common Market for Eastern and Southern Africa (COMESA) has 21 member states, making it the second largest regional economic community in Africa. The community has ten low-income countries: Burundi, the Democratic Republic of the Congo (DR Congo), Eritrea, Ethiopia, Madagascar, Malawi, Rwanda, Somalia, Sudan and Uganda; eight lower middle-income countries: Comoros, Djibouti, Egypt, Eswatini, Kenya, Tunisia, Zambia and Zimbabwe; two upper middle-income countries: Libya and Mauritius; and one high-income country: Seychelles.
The regional economic community (REC) was formed in December 1994, aimed at forming a larger economic and trading unit that collectively overcomes trade barriers individual states face. The REC launched a free trade area in 2000 that currently has 16 members and is aiming to evolve into a customs union in the future. The community faces a common problem for Africa’s regional economic communities in that all its members form part of at least one other REC. Overlapping membership dilutes the effectiveness of COMESA in promoting intra-REC trade.
COMESA’s total population size was 277.2 million in 1990 and increased to 582.4 million by 2019 — a rise of 110.1%. The community is projected to continue to experience robust population growth, reaching a population size of 982.2 million people by 2043. At the country level, Ethiopia has the largest population, with 112 million people in 2019, followed by Egypt (100.5 million) and the DR Congo (86.9 million). There is a wide discrepancy between members, with the three least populous countries (Djibouti, Comoros and Seychelles) all having fewer than 1 million citizens in 2019.
The composition of COMESA’s population is projected to gradually become more mature, as 62.4% of the community’s inhabitants will be between the ages of 15 and 64 in 2043, 6.3 percentage points higher than 2019. The trend is positive, signalling the emergence of a demographic dividend, where the ratio of working-age persons to dependants reaches 1.7. To guard against instability, steps must be taken to ensure that the increasingly youthful population finds work and is furnished with the appropriate skills to make a productive contribution to the economy. Countries such as Libya, Eswatini, Tunisia, Sudan and Egypt, where youth unemployment was above 25% in 2019, are particularly vulnerable to increased instability due to a youth bulge.
COMESA’s population is predominantly rural, with only 27.2% living in urban areas in 2019. The REC is projected to steadily urbanise over the forecast horizon as the rural population reaches 57.2% of the total population in 2043 — a 15.6 percentage point decrease. There are large differences between states: Rwanda’s urban population will constitute only 19.5% of the population in 2043, whereas Libya’s will reach 84.3%. Madagascar and Seychelles urbanise at roughly the same rate as the REC, with rural population sizes decreasing by more than 15 percentage points. Zimbabwe is expected to be 1.3 percentage points more rural in 2043.
COMESA’s population density was 0.5 persons per hectare in 2019 and is expected to increase to 0.9 by 2043. There is however a large variance between individual countries due to COMESA containing the four most densely populated countries in Africa in 2019: Mauritius, Rwanda, Comoros and Burundi. While Mauritius is projected to see a small increase, the other three countries are expected to see significant larger densities. Rwanda, Burundi and Comoros will have a population density above seven persons per hectare by 2043. The combination of high total fertility rates, especially in Burundi, and small land area explain the increases in these countries.
COMESA’s combined GDP reached US$918.9 billion in 2019 and is projected to increase to US$3 150.1 billion by 2043. The increase will largely be driven by robust growth in Egypt, Ethiopia, Uganda and Kenya. The largest growth is projected to occur in Ethiopia, whose economy will be seven times bigger at US$588.6 billion in 2043 compared to 2019.
Growth of this magnitude will bring the size of the Ethiopian economy closer to the largest economy in COMESA, Egypt, but the North African country is expected to continue its dominance of COMESA. In 2019, the Egyptian economy accounted for 38% of COMESA’s combined GDP, with Ethiopia second on 7.7%. In the Current Path forecast, this dynamic is expected to shift significantly, with Ethiopia’s economy accounting for 18.7% of combined GDP in 2043, while Egypt will see a 6.8 percentage point decline to 31.2%.
At the other end of the spectrum, 14 countries are projected to contribute less than 5% to COMESA’s combined GDP by 2043. These smaller economies are all projected to experience robust growth however, with Malawi in particular seeing a 576% rise from 2019. Tunisia, Mauritius and Seychelles will all experience an increase under 100%, but Mauritius and Seychelles have a small population compared to Tunisia. Tunisia’s slower growth means it will see a 3.4 percentage point decrease in its contribution to COMESA’s combined GDP by 2043.
Although many of the charts in the sectoral scenarios also include GDP per capita, this overview is an essential point of departure for interpreting the general economic outlook of COMESA.
There was steady growth of COMESA’s GDP per capita from 1990 to 2019, as it rose by 48% in that time. The REC is projected to continue along this upward trajectory, reaching US$6 563 per person by 2043. The average for Africa as a whole would still be higher however, standing at US$7 157 by 2043 in the Current Path forecast.
Considerable divergences exist within COMESA’s membership: Seychelles is expected to see its GDP per capita rise to US$33 409 by 2043, while Burundi’s is projected to only reach US$1 297 in that same year. In total, 16 out 21 members are projected to be below Africa’s average GDP per capita by 2043.
The value of COMESA’s informal sector was below the average for Africa in 2019 and is expected to gradually decrease in value over the forecast horizon, falling from 23.8% of GDP in 2019 to 21.5% in 2043.
Zimbabwe is the individual country projected to see the largest reduction, of 21.7 percentage points, over the forecast horizon, while Madagascar’s decrease of 0.9 percentage points would be the smallest. Notably, Madagascar would lose ground on its fellow COMESA members and go from having the 11th biggest informal sector by value as a per cent of GDP to 7th by 2043. Mauritius’ decrease of 4.7 percentage points would push the value of the informal sector below 4% and confer added benefits of increasing formality and productivity in the country.
The IFs platform uses data from the Global Trade and Analysis Project (GTAP) to classify economic activity into six sectors: agriculture, energy, materials (including mining), manufactures, services and information and communications technology (ICT). Most other sources use a threefold distinction between only agriculture, industry and services with the result that data may differ.
The value added by each sector as per cent of total value added highlights the importance of services for COMESA. The sector added 50.1% of all value added in 2019, equating to US$459.8 billion, and is expected to grow to 56% by 2043. ICT and materials are projected to marginally expand across the forecast horizon, while agriculture would decrease by 10.5 percentage points. Manufactures is expected to grow steadily, reaching 22.6% in 2043.
Reflecting the overall trend for the RECs, all individual economies are projected to see a decline in the value agriculture adds. Ethiopia is expected to see the largest fall, equating to 26 percentage points in 2043. The manufacturing sector would also grow in all but one of the RECs economies, namely Mauritius, with Eritrea and Malawi potentially seeing increases over 10 percentage points. Services would however continue to dominate; in 18 countries services would contribute 50% or more of all value added in the economy, and in four this figure is above 70%.
The data on agricultural production and demand in the IFs forecasting platform initialises from data provided on food balances by the Food and Agriculture Organization (FAO). IFs contains data on numerous types of agriculture but aggregates its forecast into crops, meat and fish, presented in million metric tons. Chart 9 shows agricultural production and demand as a total of all three categories.
The projected trajectory for COMESA’s agricultural production and demand along the Current Path forecast shows a situation of increased divergence, with a shortfall of 59 million metric tons in 2019 growing to 294.1 million metric tons in 2043. This growing gap mirrors the likely trajectory for Africa as a whole.
A projected increase of 68.6% in population size in that time helps explain the growing gap as demand is set to grow quickly over the forecast horizon and place added pressure on domestic production. To meet this demand, food imports will have to increase, making the REC more food insecure and more susceptible to changes in international food prices as a whole.
Most member countries are expected to see a significant increase in the size of their agriculture production shortfall. Egypt and the DR Congo are projected to have the largest gaps by 2043: their shortfalls exceeding 50 million metric tons in 2043. The only country expected to see a decrease in the size of their shortfall is Libya, whose gap between production and demand is projected to decrease by 21%.
There are numerous methodologies and approaches to defining poverty. We measure income poverty and use GDP per capita as a proxy. In 2015, the World Bank adopted the measure of US$1.90 per person per day (in 2011 international prices), also used to measure progress towards the achievement of Sustainable Development Goal 1 of eradicating extreme poverty. To account for extreme poverty in richer countries occurring at slightly higher levels of income than in poor countries, the World Bank introduced three additional poverty lines in 2017:
- US$3.20 for lower middle-income countries
- US$5.50 for upper middle-income countries
- US$22.70 for high-income countries.
COMESA is projected to make progress in reducing the amount of extremely poor people in the community and have a steady decline in the percentage of the population classed as extremely poor. In 2019, at the poverty level of $1.90 per day, 35.4% of the population was deemed extremely poor; by 2043, this figure would have dropped to 18.8%. This equates to a reduction of 22 million people — a positive outcome considering the REC’s total population is projected to grow by 399.8 million people in that time. Still, by 2043, 184.3 million people would still be classified as extremely poor at the $1.90 poverty line.
COMESA has countries in each of the four World Bank income groups. At the $1.90 level, the REC is projected to see good progress, with Malawi, Rwanda and Somalia expected to see percentage point decreases of 51.4, 32.5 and 28.6 respectively by 2043. Madagascar’s progress is projected to be muted however, with only a 6.6 percentage point drop to 66.6% by 2043. At the $3.20 per day level, Djibouti, Kenya and Zimbabwe are expected to see reductions above 20 percentage points by 2043, while Zambia would struggle with a decrease of only 7.1 percentage points and poverty of 67.3% in 2043. At the $5.50 per day poverty line, Libya and Mauritius would both have a poverty rate below 5% in 2043 in the Current Path forecast, while Seychelles, as a high-income country, will continue to struggle at the high poverty line of $22.70, with a poverty rate of 49.7%.
The IFs platform forecasts six types of energy, namely oil, gas, coal, hydro, nuclear and other renewables. To allow comparisons between different types of energy, the data is converted into billion barrels of oil equivalent (BBOE). The energy contained in a barrel of oil is approximately 5.8 million British thermal units (MBTUs) or 1 700 kilowatt-hours (kWh) of energy.
COMESA predominantly relies on gas and oil for its energy production, with hydro playing a smaller part (Chart 11). This is projected to change, and by 2043 other renewables, excluding hydro power, would constitute the largest share of energy production at 39.2%, followed by gas at 24.1% and oil at 16.8%. Combined with hydro, renewable energy production would amount to 52.7% of the total energy produced, a positive step towards a more environmentally friendly future.
Individually, the projected paths for COMESA’s members vary but an overall shift towards renewables is still discernible. For example, Burundi is projected to experience a substantial reconfiguration. The country primarily produced energy from gas in 2019 — the resource accounting for 86.1% of total energy produced. By 2043, however, other renewables are projected to account for 66.7% of energy production and gas only 17.8%. In total, by 2043, 14 of the 21 members would have other renewables or hydro as their primary source of energy production, a sizable jump from 5 out of 21 in 2019.
Carbon is released in many ways, but the three most important contributors to greenhouse gases are carbon dioxide (CO2), carbon monoxide (CO) and methane (CH4). Since each has a different molecular weight, IFs uses carbon. Many other sites and calculations use CO2 equivalent.
COMESA’s carbon emissions are projected to increase from 130 million tons in 2019 to 307 million tons in 2043, an increase of 136.2% — slightly above Africa’s of 122.5%. The REC contributed 30.8% of the continent’s emissions in 2019, a figure expected to rise to 32.7% by 2043 in the Current Path forecast. Increasing emissions are a consequence of COMESA’s expanding economies, shown in Chart 5.
The COMESA member state with the largest total emissions is Egypt, which accounted for 51.9% of emissions in 2019 and will account for 48.9% in 2043. Egypt also ranked second in Africa in 2019 for most carbon emissions behind South Africa and is projected to still be in that position by 2043.
Sectoral Scenarios for COMESA Development Futures
Download to pdfThe Stability scenario represents reasonable but ambitious reductions in risk of regime instability and lower levels of internal conflict. Stability is generally a prerequisite for other aspects of development and this would encourage inflows of foreign direct investment (FDI) and improve business confidence. Better governance through the accountability that follows substantive democracy is modelled separately.
The intervention is explained here in the thematic part of the website.
COMESA’s governance security index score would rise from 0.67 in 2019 to 0.84 in 2043 in the Stability scenario — a 15% improvement compared to the Current Path forecast.
The country that is projected to see the biggest improvement is Somalia, which is understandable given the years of upheaval it has experienced, followed by the DR Congo, a country similarly hampered by continued disorder. Mauritius and Seychelles would experience small increases, due to their scores already being high.
COMESA’s average GDP per capita is projected to be US$247 higher in the Stability scenario compared to the Current Path forecast in 2043. The REC is expected to be US$347 behind Africa’s average of US$7 157 in 2043 — a much smaller margin than in 2019 when it was US$731.
Somalia would benefit the most from the Stability scenario’s intervention, seeing a 7.8% increase in GDP per capita by 2043 compared to the Current Path forecast. This is understandable given the continued internal conflict that still hampers Somalia’s growth. The more stable countries of Mauritius and Seychelles would see the smallest increases of below 2% in 2043 compared to the Current Path forecast.
In 2019, the average extreme poverty rate in COMESA was 35.4% (using US$1.90), representing 206.3 million people. It was highest at 76.7% in Burundi (8.5 million people). The Stability scenario is projected to decrease COMESA’s poverty rate by 1.6 percentage points in 2043 compared to the Current Path forecast. This translates to 15 million fewer extremely poor people. It is particularly impressive given the expected increase of 399.8 million people to the REC’s population by 2043 in the Current Path forecast.
Madagascar, the DR Congo and Somalia are all projected to see a 3 percentage point or higher decrease in their poverty rates by 2043 compared to the Current Path forecast. Other countries, where internal conflict and political stability are less of a problem, see smaller decreases and require further interventions to combat their struggle with extreme poverty.
This section presents the impact of a Demographic scenario that aims to hasten and increase the demographic dividend through reasonable but ambitious reductions in the communicable-disease burden for children under five, the maternal mortality ratio and increased access to modern contraception.
The intervention is explained here in the thematic part of the website.
Demographers typically differentiate between a first, second and even a third demographic dividend. We focus here on the contribution of the size of the labour force (between 15 and 64 years of age) relative to dependants (children and the elderly) as part of the first dividend. A window of opportunity opens when the ratio of the working-age population to dependants is equal to or surpasses 1.7.
Chart 16 shows COMESA getting to a potential demographic dividend seven years earlier, in 2036, in the Demographic scenario compared to the Current Path forecast. The combination of reduced infant mortality and total fertility and increased life expectancy also mean that COMESA’s dividend would last longer compared to the Current Path forecast.
In 2019, there were five countries already in a potential demographic dividend (Mauritius, Seychelles, Tunisia, Libya and Djibouti) and their ratio of working-age population to dependants will remain the same in the Demographic scenario as in the Current Path forecast. The other 16 members will experience higher peaks in their ratios, and Comoros, Eritrea, Ethiopia and Zimbabwe are all projected to experience a potential demographic dividend five years earlier than in the Current Path forecast.
The infant mortality rate is the number of infant deaths per 1 000 live births and is an important marker of the overall quality of the health system in a country.
COMESA’s infant mortality rate of 39.2 deaths per 1 000 live births in 2019, 7.6 deaths lower than Africa’s average, is projected to drop significantly to 14.7 in 2043 in the Demographic scenario, 3.8 lower than in the Current Path forecast.
The country with the highest infant mortality rate in 2019 was Somalia at 67 deaths per 1 000 live births. By 2043, Somalia and Madagascar are projected to see the largest reduction in deaths in the Demographic scenario compared to the Current Path forecast, at 6.2 and 7.8 deaths per 1 000 live births respectively. Ethiopia is also projected to see robust progress as infant mortality falls from 39.3 deaths in 2019 to 8.2 in 2043, a level below both Mauritius and Egypt, countries whose GDP per capita is much higher.
COMESA is expected to see a 4%, or US$261, increase in its GDP per capita in 2043 in the Demographic scenario compared to the Current Path forecast. The reduction in population size and earlier arrival of the demographic dividend act only as enabling factors for greater GDP growth and must be matched with better education and healthcare to unlock a more productive labour force.
Malawi is expected to see the biggest increase in GDP per capita with a 7.5% improvement in 2043 in the Demographic scenario compared to the Current Path forecast. Tunisia, Mauritius and Seychelles have already entered a potential demographic dividend window of opportunity and will see little improvement in the Demographic scenario. All will see increases of less than a per cent by 2043 compared to the Current Path forecast.
In the Demographic scenario, COMESA’s poverty is projected to decrease by 18 percentage points from 35.4% in 2019 to 17.4% in 2043. The decrease would put the REC 1.4 percentage points below its Current Path forecast and 2.4 percentage points below Africa’s Current Path forecast poverty rate.
Madagascar is projected to see the largest reduction in its poverty rate, with a decrease of 5.4 percentage points, but will still have 61.3% of its population living in extreme poverty by 2043. At the US$3.20 poverty level, Zambia’s poverty rate is projected to still be 65.1% by 2043. The interventions proposed in the Demographic scenario must be accompanied by improvements in education and healthcare outcomes as well as other efforts to improve labour productivity to significantly accelerate economic growth and reduce poverty.
This section presents reasonable but ambitious improvements in the Health/WaSH scenario, which include reductions in the mortality rate associated with both communicable diseases (e.g. AIDS, diarrhoea, malaria and respiratory infections) and non-communicable diseases (NCDs) (e.g. diabetes), as well as improvements in access to safe water and better sanitation. The acronym WaSH stands for water, sanitation and hygiene.
The intervention is explained here in the thematic part of the website.
COMESA’s life expectancy was 66.4 years in 2019 — 0.6 years above the average for Africa. In the Health/WaSH scenario, COMESA is projected to see a 0.5-year improvement in life expectancy compared to its Current Path forecast, reaching 72.5 years by 2043.
Eswatini is projected to see the largest increase in life expectancy from 2019 to 2043 of 10.5 years. Eswatini will also have the largest increase compared to the Current Path forecast, 1.2 years higher in 2043, equivalent to an 18% improvement. Comoros and Djibouti will gain the least. The REC is projected to have three of the six lowest ranked countries in Africa by 2043 but also six of the top ten, highlighting the large development differences within the REC.
COMESA’s infant mortality rate is projected to be 16.7 per 1 000 live births in 2043 in the Health/WaSH scenario, 1.8 deaths lower than the Current Path forecast and 22.5 deaths lower than in 2019. The REC’s infant mortality rate would be 5.9 deaths below Africa’s Current Path forecast average in 2043.
The biggest reduction will occur in Madagascar’s rate, which decreases by 4.7 deaths per 1 000 live births in 2043 compared to the Current Path forecast. Somalia performs much worse in this scenario compared to the Demographic scenario: the country’s rate is 4.2 deaths higher in 2043 compared to the latter scenario, showing how much it is struggling with an under-5 communicable-disease burden.
The Agriculture scenario represents reasonable but ambitious increases in yields per hectare (reflecting better management and seed and fertiliser technology), increased land under irrigation and reduced loss and waste. Where appropriate, it includes an increase in calorie consumption, reflecting the prioritisation of food self-sufficiency above food exports as a desirable policy objective.
The intervention is explained here in the thematic part of the website.
The data on yield per hectare (in metric tons) is for crops but does not distinguish between different categories of crops.
At 4.3 tons per hectare, COMESA’s crop yields are marginally higher than the average for Africa: in 2019, the gap was 0.4 tons per hectare and by 2043 the gap would have shrunk to 0.1 tons in the Agriculture scenario. The REC’s yield per hectare is projected to be 7.3 tons in 2043, 2.3 tons higher than in the Current Path forecast. These numbers obscure very large differences between high-yield countries such as Mauritius and Eswatini versus countries such as Zimbabwe and Sudan where yields are below 2 tons per hectare.
Eswatini is expected to experience the largest increase in yield among COMESA’s members: its yield per hectare is projected to increase by 5.5 tons in 2043 in the Agriculture scenario compared to the Current Path forecast. This increase comes from an already high base, with the country ranking second in Africa in 2019 for yield per hectare. Mauritius, which held the top spot in 2019, is expected to see a drop in its yield per hectare in both the Current Path forecast and the Agriculture scenario. The small island nation faces problems regarding land available for economically viable agriculture use and inefficiencies in sugarcane processing. The second highest increase is projected to come from Burundi, with a rise of 4.5 tons above the Current Path forecast in 2043. Burundi is performing below its potential, due in large part to a lack of access to resources such as fertiliser.
COMESA’s food security situation aligns with that of Africa as a whole. The REC’s average agricultural imports as a per cent of agricultural demand was 11.5% in 2019 — 0.6 percentage points above Africa’s average. The situation is projected to worsen considerably in the Current Path forecast and by 2043 COMESA would import almost a third of its food. The Agriculture scenario neutralises this sharp rise and in 2043 the rate would mirror its 2019 level at 11.5%.
Ethiopia is projected to see robust progress in counteracting its agricultural import dependence. In 2019, the country's agricultural imports equalled 5% of demand but in the Agriculture scenario this figure drops to -39% by 2043, making it a net exporter of agricultural products and self-sufficient in meeting demand for food. The Agriculture scenario also aids Sudan and Burundi in avoiding a sharp rise in import dependence, reducing their 2043 figures by 39 and 36 percentage points respectively. Countries such as Djibouti and Seychelles which face natural constraints to agricultural production are projected to continue to have a high import dependence, despite the scenario’s interventions.
The Agriculture scenario is projected to have a strong. positive impact on COMESA’s GDP per capita, increasing the figure by US$259 above the Current Path forecast for 2043. The gap between this and Africa’s average GDP per capita decreases to US$335 in the Agriculture scenario, an improvement compared to the US$731 gap in 2019.
The Agriculture scenario is among the most powerful scenarios for increasing GDP per capita for several countries. Madagascar, the DR Congo, Burundi, Sudan, Comoros and Kenya will all see large increases of 9% in 2043 or higher compared to their Current Path forecasts. This shows how the positive effect of unlocking their agricultural potential can have on bettering living standards for their citizens.
In 2019, the average extreme poverty rate in COMESA was 35.4% (using US$1.90), representing 206.3 million people. It was highest at 76.7% in Burundi (8.5 million people). The Agriculture scenario reduces COMESA’s extreme poverty rate by 5 percentage points in 2043 compared to the Current Path forecast, putting its rate 7.1 percentage points lower than Africa’s average poverty rate for the same year.
Madagascar would perform especially well in the Agriculture scenario, seeing a 16.7 percentage point decrease compared to the Current Path forecast in 2043. The DR Congo and Burundi also see sizable decreases of 14.8 and 10.5 percentage points respectively. Five countries (Egypt, Mauritius, Libya, Tunisia and Seychelles) that are not heavily dependent on their agriculture sectors for employment and economic activity will not experience any decrease in their respective poverty rates.
The Education scenario represents reasonable but ambitious improved intake, transition and graduation rates from primary to tertiary levels and better quality of education. It also models substantive progress towards gender parity at all levels, additional vocational training at secondary school level and increases in the share of science and engineering graduates.
The intervention is explained here in the thematic part of the website.
The 2019 average of COMESA’s mean years of adult education, combining male and female years, was 5.7 years, improving to 7.2 years in 2043 in the Current Path forecast and 7.6 years in the Education scenario. The REC’s average was 0.5 years below the average for Africa in 2019 but the gap is expected to narrow in Africa’s Current Path forecast to 0.3 in the Education scenario.
Mean years of adult education in 2019 ranged from 4 years in Sudan to 9.5 years in Seychelles. Sudan, coming from a low base, is projected to see the largest increase compared to its 2019 levels, increasing from 4 to 6.4 years in 2043, 0.4 years higher than the Current Path forecast. Similarly, Eritrea and Ethiopia are projected to progress steadily in the Education scenario but will only surpass Africa’s 2019 average by 0.1 years in 2043.
The scenario increases mean years of education for both male and female learners above the Current Path forecast, but there is a large disparity between COMESA’s male and female figures, with male mean years of education 1.1 years higher in 2019. In 2043, the gap would be reduced to 0.7 years in the Education scenario. The gap will be the biggest in Somalia, at 2.1 years in 2043, while in Libya, females will have 1.6 years more education than males.
The average test scores for learners at primary and secondary level serve as a proxy for education quality. COMESA’s primary level score was 30 in 2019, 1.4 below Africa’s average, with its secondary level score 8.9 points higher at 38.9, 0.2 below Africa’s average. The Education scenario boosts these scores considerably. Primary level score will reach 38.2 in 2043, 5.4 points above the Current Path forecast. The secondary level score overtakes Africa’s Current Path forecast average, reaching 48.2 by 2043, 8.2 higher than the Current Path forecast.
Mauritius is projected to have the largest increases at both levels in the Education scenario compared to the Current Path forecast, improving by 8 points at primary level and 12 points at secondary level in 2043. The country is projected to have the highest scores at both levels by 2043, reflecting its continued investments in educating its populace. Despite the Education scenario’s interventions and reasonable improvements, Burundi, Djibouti, the DR Congo, Eritrea, Ethiopia, Rwanda, Sudan and Zambia will still score below Africa’s average of 38.8 for primary learners by 2043.
The Education scenario increases COMESA’s GDP per capita by US$212 above the Current Path forecast in 2043. The scenario marginally narrows the gap with Africa’s Current Path forecast GDP per capita of US$7 157 in 2043 to US$382, down from a gap of US$594 in the Current Path forecast.
Malawi is expected to see the largest increase in GDP per capita of 5.3% in 2043 compared to the Current Path forecast. Libya is projected to see the smallest increase of all COMESA’s members at 1.7% in 2043. The impact of the scenario’s interventions, mirroring those of the Demographic scenario, will only fully be felt in the long term, past the 2043 forecast horizon.
In 2019, 206.3 million (or 35.4%) of COMESA’s population lived in extreme poverty. In the Current Path forecast, it will be 184.3 million (18.8%) in 2043. COMESA’s poverty rate is projected to be 1.5 percentage points lower in 2043 in the Education scenario, compared to the Current Path forecast, and would be 3.6 percentage points lower than Africa’s average. The decrease equates to the extremely poor population being 15.2 million people fewer in 2043.
In line with the impact the scenario has on GDP per capita, decreases in poverty rates are relatively small. Zambia, the DR Congo and Madagascar are the only countries that see a 3 percentage point or higher reduction in their poverty rates in 2043 compared to the Current Path forecast. Given the size of its poor population, the largest decline is in the DR Congo with 5.6 million fewer extremely poor people in 2043.
The Manufacturing/Transfers scenario represents reasonable but ambitious manufacturing growth through greater investment in the economy, investments in research and development, and promotion of the export of manufactured goods. It is accompanied by an increase in welfare transfers (social grants) to moderate the initial increases in inequality that are typically associated with a manufacturing transition. To this end, the scenario improves tax administration and increases government revenues.
The intervention is explained here in the thematic part of the website.
Chart 30 should be read with that presents a stacked area graph on the contribution to GDP and size, in billion US$, of the Current Path economy for each of the sectors.
In 2043, the manufacturing sector, as a per cent of GDP, will be 0.2 percentage points bigger, an increase that equates to US$69.3 billion more value added than in the Current Path forecast. Services would add US$167.9 billion more in the scenario by 2043 compared to the Current Path forecast, reflecting the trend of rapid growth in the service sector seen throughout Africa.
The size of the manufacturing sector is projected to increase for all countries in the Current Path forecast, except Mauritius, which sees a 0.6 percentage point decline. Malawi is projected to see the largest increase of 13.2 percentage points by 2043 compared to 2019, pushing the value added by the manufacturing sector to nearly a third of total value added in 2043. The structural shift towards manufacturing’s more productive and higher value activities mean agriculture will add significantly less value by 2043. Ethiopia would see the largest decrease of 26.3 percentage points in agriculture’s contribution to total value added by 2043.
The Manufacturing/Transfers scenario increases government welfare transfers to unskilled workers to combat the increased poverty caused by the initial investment in manufacturing. Unskilled workers serve as a proxy for the poor, and welfare transfers to these citizens should help to alleviate poverty and dampen the effects of increased inequality often associated with a manufacturing-led growth path. COMESA is projected to see a 53% increase in these welfare transfers in the Manufacturing/Transfers scenario compared to the Current Path forecast, reaching US$271.4 billion by 2043.
In absolute terms, the increase is largely driven by Egypt, Uganda and Ethiopia, while the DR Congo, Somalia and Malawi would all see increases above 80% compared to their Current Path forecasts by 2043. These increases translate to the latter three countries seeing sizable reductions in poverty rates by 2043.
The Manufacturing/Transfers scenario would have a significant effect on COMESA’s GDP per capita. The REC’s average GDP per capita would reach US$6 954 in 2043, US$391 higher than the Current Path forecast for the same year. This 6% increase closes the gap with Africa’s average GDP per capita to US$203 in 2043, down from the US$731 gap in 2019.
Malawi is expected to see the largest increase in GDP per capita in the scenario, potentially experiencing a 10.4% increase in 2043 compared to the Current Path forecast. Libya would see the smallest increase of just 0.9% above the Current Path forecast in 2043. The scenario further boosts the expected progress multiple countries will make in the Current Path forecast. Five of COMESA’s members (Rwanda, the DR Congo, Eritrea, Uganda and Ethiopia,) are projected to more than double their GDP per capita in the Manufacturing/Transfers scenario compared to their 2019 level, while Malawi’s would more than triple from its low base of US$1 288.
In 2019, 206.3 million (or 35.4%) of COMESA’s population lived in extreme poverty. In the Current Path forecast, it will be 184.3 million (18.8%) in 2043. In the Manufacturing/Transfers scenario, COMESA’s poverty rate is projected to be 2.5 percentage points lower in 2043 than in the Current Path forecast and would be 4.7 percentage points lower than Africa’s average. The decrease equates to the extremely poor population being 25.2 million people fewer in 2043.
In line with the impact the scenario has on GDP per capita, Malawi sees the biggest decrease in its poverty rate. In 2043, Malawi’s poverty rate is projected to be 6.1 percentage points lower than in the Current Path forecast. The sizable decline is largely due to the 82.6% increase Malawi is projected to see in government transfers to unskilled workers, as discussed in Chart 31. Countries such as Mauritius, Libya and Tunisia, which have all already achieved the SDG goal of eliminating extreme poverty, see negligible to no decreases, due mainly to minimal increases in their government transfers to unskilled workers.
The Leapfrogging scenario represents a reasonable but ambitious adoption of and investment in renewable energy technologies, resulting in better access to electricity in urban and rural areas. The scenario includes accelerated access to mobile and fixed broadband and the adoption of modern technology that improves government efficiency and allows for the more rapid formalisation of the informal sector.
The intervention is explained here in the thematic part of the website.
Fixed broadband includes cable modem Internet connections, DSL Internet connections of at least 256 KB/s, fibre and other fixed broadband technology connections (such as satellite broadband Internet, ethernet local area networks, fixed-wireless access, wireless local area networks, WiMAX, etc.).
COMESA’s fixed broadband subscriptions would increase to 48.3 per 100 people by 2043 in the Leapfrogging scenario, 19.1 subscriptions more than in the Current Path forecast for the same year. Growth of this magnitude is impressive, as it comes from a low base of 3.2 subscriptions in 2019. The related benefits of increased Internet access are multiple and varied, leading to greater communication and information transfer and prompting higher levels of innovation across the region.
Seychelles and Mauritius come off a much higher penetration rate than other COMESA member states although Libya will experience particularly rapid growth. Individually, five countries (Eritrea, Sudan, Kenya, Zambia and Burundi) are projected to see increases of 100% or more by 2043 compared to the Current Path forecast. The scenario enables most of COMESA’s members to reach 50 subscriptions per 100 people by 2043, which is considered the saturation level in the IFs model. Only Burundi and Sudan, both of which come from the lowest bases in 2019, would still be below 50 subscriptions per 100 people at 42.2 and 40.3 subscriptions in 2043 respectively.
Mobile broadband refers to wireless Internet access delivered through cellular towers to computers and other digital devices.
The potential benefits of Internet access are more easily attainable through mobile telephones, which are cheaper than fixed-line Internet solutions. Africa generally has leveraged mobile phone technology to circumvent the costly implementation of fixed-line infrastructure. Within IFs, subscription rates of 150 per 100 people is considered saturation level.
COMESA is projected to see very robust growth in mobile subscriptions, reaching 142.3 subscriptions by 2043 in the Leapfrogging scenario, nearly 300% higher than the 2019 level of 35.9 subscriptions. Improvements differ between countries, however, with Eritrea and Sudan trailing other countries in the Current Path forecast and in the Leapfrogging scenario.
The impact of the Leapfrogging scenario is most notable in Seychelles, which is an interesting case. The country is projected to go from trailing low-income countries such as Sudan and Burundi in 2019 to having 158.7 subscriptions per 100 people by 2043, the highest in Africa and 6.5 subscriptions more than in the Current Path forecast. Somalia would also catch up to upper middle income countries such as Mauritius and Libya, and experience the largest increase compared to 2019 and compared to its Current Path forecast, reaching 153.2 subscriptions per 100 people in 2043.
Increased access to electricity enables households to enjoy the benefits of cleaner cooking methods, lighting to study and for leisure and it is a necessary condition for Internet access, a major boon for development in itself. In 2019, Africa’s total electricity access stood at 53% of the total population, two percentage points higher than COMESA’s average for the same year. In the Leapfrogging scenario, COMESA’s average rate of access would reach 84% by 2043, 11 percentage points higher than Africa’s Current Path forecast.
Uganda stands to benefit the most from the Leapfrogging scenario, with its total electricity access increasing by 21.5 percentage points above the Current Path forecast to reach 92.4% in 2043. Burundi will however continue to struggle, only reaching 32.7% in 2043 in the Leapfrogging scenario, despite a 9 percentage point increase compared to the Current Path forecast. The country would only reach 21.4% rural access in the Leapfrogging scenario by 2043.
Across COMESA’s members, rural access lags behind urban access, with five countries (Burundi, the DR Congo, Zambia, Somalia and Madagascar) projected to have rural access rates below 50% in 2043 in the Leapfrogging scenario.
The Leapfrogging scenario would appreciably improve COMESA’s GDP per capita. The REC’s average GDP per capita would reach US$6 975 in 2043, US$412 higher than in the Current Path forecast for the same year. This 6.3% increase narrows the gap with Africa’s Current Path forecast GDP per capita to US$182 in 2043, down from a difference of US$594 in the Current Path forecast.
Madagascar is expected to see the largest increase of 20% in GDP per capita in the Leapfrogging scenario compared to the Current Path forecast. Mauritius would see the smallest increase of just 1.1% above the Current Path forecast in 2043 due to its already small informal sector and high level of electricity access.
In 2019, 206.3 million (or 35.4%) of COMESA’s population lived in extreme poverty. In the Current Path forecast, it will be 184.3 million (18.8%) in 2043. The poverty rate for COMESA is projected to decline by 2.6 percentage points by 2043 compared to the Current Path forecast, a reduction equalling 25.4 million people. The REC would have a poverty rate 4.7 percentage points below Africa’s average poverty rate in 2043 of 20.9%.
The Free Trade scenario represents the impact of the full implementation of the African Continental Free Trade Area (AfCFTA) by 2034 through increases in exports, improved productivity and increased trade and economic freedom.
The intervention is explained here in the thematic part of the website.
The trade balance is the difference between the value of a country's exports and its imports. A country that imports more goods and services than it exports in terms of value has a trade deficit, while a country that exports more goods and services than it imports has a trade surplus.
COMESA’s trade balance is expected to worsen in the Free Trade scenario, even though the REC’s trade volume increases compared to Current Path forecast. Exports are projected to be 59.3% higher in 2043 in the Free Trade scenario compared to the Current Path forecast, but due to the AfCFTA’s relaxation of restrictions to trade, imports increase by 67.2%. As a result, by 2043, COMESA’s trade balance would be -7.1% of GDP in the Free Trade scenario, down 2.7 percentage points from the Current Path forecast. Encouragingly, the Free Trade scenario boosts manufacturing exports for the REC and will equate to 35.9% of GDP in 2043, 12.4 percentage points higher than in the Current Path forecast.
The increase in COMESA’s trade deficit is because only three countries (Eritrea, Sudan and Burundi) see a positive change to their trade balance, with Burundi’s swing from -32.1% in the Current Path forecast to 2.2% in the Free Trade scenario in 2043 a particularly marked improvement. The rest of COMESA’s members would see their trade deficits grow or surpluses shrink, but all would see an increase in overall trade. Ethiopia, Uganda and Kenya are all projected to see an increase of 80% or higher in their trade volume by 2043 compared to the Current Path forecast. The scenario would also improve value-added exports from the manufacturing sector for all COMESA’s members, except for Burundi.
The Free Trade scenario would have the largest effect on COMESA’s GDP per capita out of all the scenarios discussed. As shown in Chart 40, COMESA’s average GDP per capita would reach US$7 218 in 2043, US$655 higher than the Current Path forecast for the same year. This 10% increase reduces the gap with Africa’s Current Path forecast GDP per capita to only US$61 in 2043, down from the US$731 difference in 2019.
Malawi will see the largest increase in GDP per capita in the scenario, potentially experiencing a 20.4% increase in 2043 compared to the Current Path forecast. Rwanda and Madagascar also do well. Mauritius would again see the smallest increase of 3.4% above the Current Path forecast in 2043. The small island nation already has a high level of productivity and economic freedom, limiting the effect the scenario has.
In 2019, 206.3 million people (or 35.4% of COMESA’s total population) were living below GDP per capita of US$1.90 per person per day. In the Current Path forecast, it would reduce to 184.3 million in 2043 (18.8%). COMESA’s poverty rate is projected to be 4.1 percentage points lower in 2043 in the Free Trade scenario (14.7%) compared to the Current Path forecast and would be 6.1 percentage points lower than Africa’s average. The decrease equates to the extremely poor population being 40 million people fewer in 2043.
The scenario significantly reduces the poverty rates of multiple members of COMESA. The DR Congo and Madagascar are projected to see a reduction above 10 percentage points by 2043 compared to the Current Path forecast, translating into a 2043 reduction of 22 million and 5.3 million people respectively. With the lowest GDP per capita among the COMESA members, extreme poverty in Burundi increases by 1.8 million people in 2043 compared to the Current Path forecast for that year.
The Financial Flows scenario represents a reasonable but ambitious increase in worker remittances and aid flows to poor countries, and an increase in the stock of foreign direct investment (FDI) and additional portfolio investment inflows to middle-income countries. We also reduced outward financial flows to emulate a reduction in illicit financial outflows.
The intervention is explained here in the thematic part of the website.
COMESA’s average dependence on foreign aid in 2019 (3.2% of GDP) was above the African average (2.4% of GDP). In the Financial Flows scenario, aid inflows will decline to 1.7% in 2043 for COMESA and to 1.3% of GDP for Africa. The REC’s downward trajectory (expressed as a portion of GDP) therefore mirrors the decline in contribution in Africa’s average, which would reach 1.2% in 2043 in the Current Path forecast.
In absolute terms, aid to COMESA will, however, increase substantially both in the Current Path forecast and the Financial Flows scenario. Expressed in absolute numbers, COMESA will receive US$56.4 billion aid in the Financial Flows scenario in 2043 instead of US$51 billion in the Current Path forecast for that year. In 2019, COMESA received US$28.9 billion in aid.
Three countries that receive the highest levels of aid expressed as a per cent of GDP are Malawi, Burundi and Rwanda, whose aid receipts equalled 24%, 20% and 15% of GDP respectively in 2019. This is not unexpected given their high levels of poverty, which range from 54% to 77% of the population living below the $1.90 poverty line. In the Financial Flows scenario, they will receive 12.3%, 13.8% and 8.2% respectively of GDP in aid in 2043, reflecting the general reduction in aid as a portion of GDP as African economies grow. In both the Current Path forecast and the Financial Flows scenario, foreign aid is expected to decrease to 2043 when expressed as a per cent of GDP, although the scenario marginally lessens the decline. Burundi would see the largest increase of 1.7 percentage points above the Current Path forecast by 2043. Given the small size of its economy that increase is equivalent to an additional US$165 million of aid.
FDI serves as an effective means through which African countries can finance their economic development and increase participation in the global economy. COMESA’s level of FDI inflows was nearly a percentage point higher than Africa’s average in 2019 — a gap which is projected to shrink to 0.6 percentage points by 2043 in the Financial Flows scenario. Expressed as a per cent of GDP, the 2019 rates vary considerably among COMESA members, from Seychelles (at 14.1% of GDP) and Djibouti (at 9.2%) to Burundi and Comoros (both at 1.1%).
By 2043, Seychelles is expected to receive inflows equivalent to 10.5% of GDP, followed by Djibouti (at 7.3%) and Madagascar (at 6.9%). It is, however, Malawi that will have the largest increase in FDI inflows as a per cent of GDP compared to its 2019 levels, with its rate being 2.3 percentage points higher by 2043 in the Financial Flows scenario than in the Current Path forecast. Across the REC, FDI inflows measured as a per cent of GDP do not increase by much, and four countries (Seychelles, Djibouti, Libya and Zambia) decrease compared to their 2019 levels. Seychelles, which had the highest rate in 2019, is projected to see a 3.5 percentage point decrease and rank sixth on the continent in the Financial Flows scenario by 2043.
In absolute terms, however, Egypt gets the largest increase compared to the Current Path forecast (US$7.3 billion more in 2043), followed by Ethiopia (US$1.9 billion more) and Uganda (US$1.8 billion more). The countries that get the smallest increase are Seychelles (which comes off a much higher base), Burundi and Comoros. The latter two have received little FDI inflows historically.
Because African economies and populations are generally growing quite rapidly, remittance inflows are expected to decrease across Africa when expressed as a per cent of GDP to 2043, although not in absolute terms. In the Financial Flows scenario, remittances will increase from US$37.8 billion (1.2% of GDP) to US$45.6 billion (1.4% of GDP) in 2043 when comparing the Current Path forecast. In 2019, COMESA member states received US$17.7 billion in remittances (1.9% of GDP). These averages obscure the fact that, in 2019, eight COMESA members (Eritrea, Sudan, Rwanda, Zambia, Seychelles, the DR Congo, Mauritius and Libya) experienced net outflows of remittances. In the Current Path forecast, these countries will still be doing that in 2043.
The impact of the Financial Flows scenario on remittances differs from country to country given the size of migrant flows and historical trends, among others. Five COMESA members (Zambia, Seychelles, Eritrea, Libya and Mauritius) will receive fewer remittances (in US$ terms) in the Financial Flows scenario by 2043 than in the Current Path forecast for that year. All other member states will receive larger inflows. The additional remittance inflows to Egypt will be largest, at US$2.7 billion. In the Financial Flows scenario, Mauritius, Rwanda, Seychelles, Zambia, Eritrea, Sudan, Libya Mauritius and the DR Congo will experience a net outflow of remittances in 2043.
The Financial Flows scenario would have a relatively small effect on COMESA’s GDP per capita. As shown in Chart 45, the REC’s average GDP per capita would reach US$6 693 in 2043, US$130 higher than the Current Path forecast for the same year. This small 2% increase reduces the gap with Africa’s average GDP per capita to US$464 in 2043, down from the US$731 gap in 2019.
Seychelles and Mauritius do best (US$645 and US$620 respectively above the 2043 Current Path forecast) and Somalia and Burundi gain least (US$28 and US$15 respectively above the 2043 Current Path forecast). As with most of the scenarios, Malawi is expected to see the largest increase in GDP per capita in the Financial Flows scenario, experiencing a 6.6% increase in 2043, compared to the Current Path forecast. Ethiopia would see the smallest increase of just 0.9% above the Current Path forecast in 2043 given a much more rapid decline in foreign aid than for other COMESA members and lower levels of FDI, despite remittance inflows being high.
Trade openness will reduce poverty in the long term after initially increasing it due to the redistributive effects of trade. Most African countries export primary commodities and low-tech manufacturing products, and therefore a continental free trade agreement (AfCFTA) that reduces tariffs and non-tariff barriers across Africa will increase competition among countries in primary commodities and low-tech manufacturing exports. Countries with inefficient, high-cost manufacturing sectors might be displaced as the AfCFTA is implemented, thereby pushing up poverty rates. In the long term, as the economy adjusts and produces and exports its comparatively advantaged (lower relative cost) goods and services, poverty rates will decline.
In 2019, the average extreme poverty rate in COMESA was 35.4% (using US%1.90), representing 206.3 million people. It was highest at 76.7% in Burundi (8.5 million people). In the Current Path forecast, COMESA's poverty rate is projected to decline to 18.8% by 2043 and to 17.9% in the Financial Flows scenario, a small decrease of 8.7 million people.
The scenario does little to reduce the poverty rates of multiple members of COMESA. Madagascar, which would see the largest increase in its government revenues, is projected to have a reduction of 3.3 percentage points by 2043 compared to the Current Path forecast, equivalent to 1.5 million fewer extremely poor people. Reductions in poverty rates broadly follow this trend, with Libya, Ethiopia and Mauritius all seeing low reductions in poverty rates and low increases in government revenues.
The Infrastructure scenario represents a reasonable but ambitious increase in infrastructure spending across Africa, focusing on basic infrastructure (roads, water, sanitation, electricity access and ICT) in low-income countries and increasing emphasis on advanced infrastructure (such as ports, airports, railway and electricity generation) in higher-income countries.
Note that health and sanitation infrastructure is included as part of the Health/WaSH scenario and that ICT infrastructure and more rapid uptake of renewables are part of the Leapfrogging scenario. The interventions there push directly on outcomes, whereas those modelled in this scenario increase infrastructure spending, indirectly boosting other forms of infrastructure, including that supporting health, sanitation and ICT.
The intervention is explained here in the thematic part of the website.
Electricity access is crucial for growth to occur, enabling more sophisticated and productive processes in urban and rural areas alike. It is a precondition to enable high speed connections to the Internet and to improve healthcare and education outcomes. COMESA’s total electricity access needs addressing, as its average was below Africa’s in 2019. In the Infrastructure scenario, COMESA is projected to overtake Africa’s Current Path forecast by 2034 and reach 75.6% in 2043, 2.9 percentage points above Africa’s average in that year. In terms of rural access, COMESA is projected to increase its advantage over Africa from 2.1 percentage points in 2019 to 5.8 percentage points in 2043 along the Infrastructure scenario.
The Infrastructure scenario boosts all of COMESA’s members' performance. Zambia will see the largest improvement, equivalent to 19% above the 2043 Current Path forecasts, helping it to gain ground on its lower-middle income peers. Other countries that also do well are Zimbabwe, Somalia and Burundi.
Electricity access rates in urban areas are high for most of COMESA’s members, with 17 of the 21 countries projected to have a rate above 80% in 2043 in the Infrastructure scenario. In rural areas however, access is lagging behind. Only nine members would have an access rate above 80% in 2043, while five would be below 50% in the Infrastructure scenario. Burundi and the DR Congo, with rates of 15.7% and 21.4% respectively, are particularly concerning cases.
Indicator 9.1.1 in the Sustainable Development Goals refers to the proportion of the rural population who live within 2 km of an all-season road and is captured in the Rural Access Index.
The Rural Access Index reflects urban–rural connectivity and the ease with which rural populations can access the benefits of larger markets and better services. COMESA’s average in the Rural Access Index was 54.3% in 2019, and the Infrastructure scenario helps to boost this figure to 63.9% by 2043, 2.2 percentage points higher than the Current Path forecast.
There is a wide disparity between COMESA’s members, with Seychelles’ Rural Access Index score being 96.7 in 2019, while both Uganda and the DR Congo had a score below 40. In the Current Path forecast, most of COMESA’s members would see a steady increase in their Rural Access Index score, with Mauritius’ 15 percentage point jump from its 2019 level to 2043 being the largest. The Infrastructure scenario helps to boost this increase further, adding 5.9 percentage points to Rwanda’s Current Path forecast in 2043, the largest increase of all COMESA’s members.
Similar to the Financial Flows scenario, the Infrastructure scenario would have a small effect on COMESA’s GDP per capita. As shown in Chart 49, the REC’s average GDP per capita would reach US$6 737 in 2043, US$174 higher than the Current Path forecast for the same year. This 2.7% increase narrows the gap with Africa’s average GDP per capita to US$420 in 2043, down from the US$731 gap in 2019.
Zambia is expected to see the biggest increase in GDP per capita along the scenario, potentially experiencing a 7.3% increase in 2043 compared to the Current Path forecast. Burundi and Mauritius would both only see increases of 0.9% above the Current Path forecast in 2043, the smallest among the REC’s members. Burundi’s small increase is problematic however, seeing as it had the lowest GDP per capita on the African continent in 2019.
In 2019, the average extreme poverty rate in COMESA was 35.4% (using US$1.90), representing 206.3 million people. It was highest at 76.7% in Burundi (8.5 million people) and lowest at 7.7% in Mauritius (0.1 million people). In the Infrastructure scenario, COMESA’s poverty rate is projected to be 1 percentage point lower in 2043 compared to the Current Path forecast, and it would be 3.1 percentage points lower than Africa’s average. This equates to a decrease of 9.4 million people in the extremely poor population in 2043.
Madagascar would once again see the biggest reduction in its poverty rate, with a decrease of 3.3 percentage points by 2043 compared to the Current Path forecast. Zambia would see the largest decrease among Africa’s lower middle-income countries at 3.1 percentage points by 2043. Both these countries see large improvements in improved access to water and sanitation in the Infrastructure scenario, an important prerequisite for improved health outcomes and increased labour productivity.
The Governance scenario represents a reasonable but ambitious improvement in accountability and reduces corruption, and hence improves the quality of service delivery by government.
The intervention is explained here in the thematic part of the website.
As defined by the World Bank, government effectiveness ‘captures perceptions of the quality of public services, the quality of the civil service and the degree of its independence from political pressures, the quality of policy formulation and implementation, and the credibility of the government’s commitment to such policies’.
Chart 51 presents the impact of the interventions in the Governance scenario on government effectiveness.
The problem of corruption on the African continent has long been a drag on growth and development, stymying investment and hampering effective service delivery. Increasing governments’ abilities to responsibly serve their citizens remains a key aspect of addressing poverty on the continent. The average score for both Africa and COMESA in the World Bank’s government effectiveness score highlights the problem facing African countries. In 2019, both only scored 1.75 out of 5 in the index, 1.04 points below the average for the World without Africa. The Governance scenario helps COMESA to improve Africa’s average but still only manages to raise the REC’s score to 2.37 by 2043, 0.15 above Africa’s average.
Eritrea, the DR Congo and Somalia are the worst performing among COMESA members in government effectiveness in 2019. All will experience robust improvement in the Governance scenario. Eritrea would see a 17% improvement compared to the Current Path forecast level in 2043; the DR Congo would improve by 7% and Somalia by 9%. Mauritius and Seychelles will continue to rank as two of the top three countries for government effectiveness in Africa by 2043.
The Governance scenario would have a minimal effect on COMESA’s GDP per capita; the REC’s average GDP per capita would reach US$6 757 in 2043, US$194 higher than the Current Path forecast for the same year. This 3% increase modestly narrows the gap to Africa’s average GDP per capita to US$400 in 2043, down from a US$731 gap in 2019.
Rwanda is expected to see the largest increase in GDP per capita in the scenario, followed by Malawi, potentially experiencing a 4.5% and 4.4% increase respectively in 2043 compared to the Current Path forecast. The countries with the highest GDP per capita figures in the REC, Seychelles and Mauritius, would see the smallest increases of just 0.8% and 0.7% respectively above the Current Path forecast in 2043.
In 2019, the average extreme poverty rate in COMESA was 35.4% (using US$1.90), representing 206.3 million people. It was highest at 76.7% in Burundi (8.5 million people). Mirroring the modest improvement in the Infrastructure scenario, COMESA’s poverty rate is projected to be 1 percentage point lower in 2043 in the Governance scenario compared to the Current Path forecast and would be 3.1 percentage points lower than Africa’s average. It equates to a decrease of 9.3 million people in COMESA’s extremely poor population in 2043.
The Governance scenario has a limited impact on COMESA’s members' poverty rates, as the scenario’s interventions do not focus on poverty alleviation directly but rather governments’ ability to implement change effectively. As such, the largest reduction, 2.3 percentage points by 2043 compared to the Current Path forecast for Madagascar is small compared to other scenarios. Indeed, half of the member countries see decreases below a per cent compared to the Current Path forecast in 2043.
This section presents projections for carbon emissions in the Current Path for COMESA and the 11 scenarios. Note that IFs uses carbon equivalents rather than CO2 equivalents.
The scenarios help boost economic activity and growth in COMESA’s economies, which inevitably leads to greater emissions compared to the Current Path forecast. The Free Trade scenario results in the largest increase in emissions by 2043, followed by the Manufacturing/Transfers and Stability scenarios.
Interestingly, COMESA is projected to emit less carbon in the Leapfrogging scenario than in the Current Path forecast, even though the scenario ranks third for largest increases in GDP per capita, behind only the Stability and Free Trade scenarios. This shows the long-term benefits of investing in renewable energy sources, both for increased growth and reduced emissions.
The Stability scenario would boost GDP per capita considerably in multiple countries, such as Somalia and the DR Congo, and as such the scenario ranks high for increases in carbon emissions across COMESA’s member states. The Demographic scenario on the other hand ranks low for increases in emissions compared to the Current Path forecast, due to the associated decreases in population size.
The Combined Agenda 2063 scenario consists of the combination of all 11 sectoral scenarios presented above, namely the Stability, Demographic, Health/WaSH, Agriculture, Education, Manufacturing/Transfers, Leapfrogging, Free Trade, Financial Flows, Infrastructure and Governance scenarios. The cumulative impact of better education, health, infrastructure, etc. means that countries get an additional benefit in the integrated IFs forecasting platform that we refer to as the synergistic effect. Chart 55 presents the contribution of each of these 12 components to GDP per capita in the Combined Agenda 2063 scenario as a stacked area graph.
COMESA stands to benefit the most from the Free Trade scenario in terms of additional GDP per capita above the Current Path forecast. In 2043, the scenario would add US$655 to the Current Path forecast’s GDP per capita figure of US$6 563, followed by the Leapfrogging scenario which would add US$412. The synergistic effect of implementing all the scenarios’ interventions equates to an additional US$686 in 2043, highlighting the benefits of wide-scale, multi-sectoral reform.
Individual members largely mirror these trends, although certain members, such as the DR Congo and Somalia, would gain more from the Stability scenario or the Leapfrogging scenario, such as Madagascar. The Financial Flows scenario generally ranks low, but for the more diversified and developed economies of Mauritius and the Seychelles, the scenario ranks third and fourth respectively.
Whereas Chart 55 presents a stacked area graph on the contribution of each scenario to GDP per capita as well as the additional benefit or synergistic effect, Chart 56 presents only the GDP per capita in the Current Path forecast and the Combined Agenda 2063 scenario.
The Combined Agenda 2063 scenario would dramatically increase COMESA’s GDP per capita. The REC’s average GDP per capita would reach US$10 235 in 2043, US$3 672 higher than the Current Path forecast for the same year. The sizable increase of 56% means the REC opens a positive gap to Africa’s average GDP per capita of US$3 078 in 2043.
The combined impact of implementing all 11 scenarios’ interventions is impressive for COMESA’s members: Malawi would once again see the largest increase in GDP per capita in the scenario, potentially experiencing a 135.1% increase in 2043, compared to the Current Path forecast. As in earlier scenarios, Mauritius and Seychelles would see the smallest increases of 17.5% and 20.7% respectively above the Current Path forecast in 2043.
Compared to their 2019 levels, Uganda and Ethiopia could see their GDP per capita quadrupling by 2043, while 13 other members would see increases between 100% and 200%.
The simultaneous implementation of all 11 scenarios’ interventions as envisaged in the Combined Agenda 2063 scenario would nearly eradicate extreme poverty at the US$1.90 poverty line for COMESA by 2043. From a high level of 35.4% in 2019, the poverty rate is projected to rapidly decline to 4.1% by 2043, a 14.7 percentage point decrease compared to the Current Path forecast for 2043. A reduction of that magnitude would result in 146.9 million fewer people being extremely poor in 2043.
The Combined Agenda 2063 scenario has the potential to decrease the poverty rates of five countries (Malawi, the DR Congo, Burundi, Madagascar and Somalia) by 50 percentage points or more by 2043 compared to the Current Path forecast, eradicating extreme poverty in Malawi in the process. Four other low-income countries would also see extreme poverty eradicated, but Burundi and Madagascar would still have poverty rates above 17% in 2043, highlighting the urgent need for action.
Similarly, at the US$3.20 level, Eswatini would continue to struggle even with a 35.4 percentage point reduction, only reducing its poverty rate to 24.5% by 2043.
See Chart 8 to view the Current Path forecast of the sectoral composition of the economy.
The Combined Agenda 2063 scenario significantly boosts the service sector for COMESA, increasing its percentage contribution to total GDP by 5.3 points compared to the Current Path forecast for 2043. In contrast, the manufacturing sector declines in its percentage contribution, potentially seeing a 3.4 percentage point reduction by 2043. Both sectors do however grow in absolute terms, although services far outstrip manufactures — US$1 551 billion additional GDP to the economy by 2043 compared to the Current Path forecast.
Djibouti is the only country that is projected to see a divergent trend, as its service sector is projected to contribute 6.7 percentage points less to GDP compared to the Current Path forecast, while its manufacturing sector would contribute 7.7 percentage points more. However, the service sector would still contribute 69% of GDP by 2043. Eritrea would see the largest decrease in its manufacturing sector’s contribution to GDP, experiencing a potential decrease of 11.3 percentage points in 2043 compared to the Current Path forecast. This could be a negative trend should these activities be replaced with low-end services.
COMESA’s GDP is expected to grow significantly even along the Current Path forecast, reaching US$3 150 billion by 2043. However, the Combined Agenda 2063 scenario would have a much larger effect, increasing GDP by US$2 262.8 above the Current Path forecast for 2043 — a 72% increase.
Malawi is projected to see the largest percentage increase compared to its 2019 level in the Combined Agenda 2063 scenario. By 2043, the country’s GDP is projected to be US$193 billion, 145% more than in the Current Path forecast. Ethiopia is also expected to see a significant increase in its GDP, reaching US$959 billion in 2043, 63% higher than the Current Path forecast for 2043. Additionally, Ethiopia's GDP would constitute 17.7% of COMESA’s total GDP by 2043, 10 percentage points more than in 2019.
The inevitable consequence of the increased economic activity and prosperity envisaged in the Combined Agenda 2063 scenario is increasing carbon emissions, but COMESA’s projected increases are not unmanageable. By 2043, carbon emissions are expected to be 380 million metric tons of carbon, 73 million tons more than in the Current Path forecast. Although inescapable if growth is to be realised, attention should be given to ways to combat rising emissions as development occurs.
Zambia is projected to see the largest increase in percentage terms, nearly 135%, in its carbon emissions compared to the Current Path forecast by 2043. The second and third largest increases are expected for Malawi and Ethiopia, which is to be expected considering the discussion about Chart 59 regarding their rapid economic growth in the Combined Agenda 2063 scenario. Egypt continues to be the largest emitter in the REC, reaching 177 million tons of carbon emissions by 2043, a 17.7% increase compared to the Current Path forecast.
Page information
Contact at AFI team is Du Toit McLachlan
This entry was last updated on 28 May 2026 using IFs v7.63.
Donors and sponsors


Reuse our work
- All visualizations, data, and text produced by African Futures are completely open access under the Creative Commons BY license. You have the permission to use, distribute, and reproduce these in any medium, provided the source and authors are credited.
- The data produced by third parties and made available by African Futures is subject to the license terms from the original third-party authors. We will always indicate the original source of the data in our documentation, so you should always check the license of any such third-party data before use and redistribution.
- All of our charts can be embedded in any site.
Cite this research
Du Toit McLachlan (2026) COMESA Development Futures. Published online at futures.issafrica.org. Retrieved from https://futures.issafrica.org/geographic/recs/comesa/ [Online Resource] Updated 28 May 2026.