 CEN-SAD
Feedback welcome
Our aim is to use the best data to inform our analysis. See our Technical page for information on the IFs forecasting platform. We appreciate your help and references for improvements via our feedback form.
In this entry, we first describe the Current Path forecast for CEN-SAD as it is expected to unfold to 2043, the end of the third ten-year implementation plan of the African Union’s Agenda 2063 long-term vision for Africa. The Current Path in the International Futures (IFs) forecasting model initialises from country-level data that is drawn from a range of data providers. We prioritise data from national sources.
The Current Path forecast is divided into summaries on demographics, economics, poverty, health/WaSH and climate change/energy. A second section then presents a single positive scenario for potential improvements in stability, demographics, health/WaSH, agriculture, education, manufacturing/transfers, leapfrogging, free trade, financial flows, infrastructure, governance and the impact of various scenarios on carbon emissions. With the individual impact of these sectors and dimensions having been considered, a final section presents the impact of the Combined Agenda 2063 scenario.
We generally review the impact of each scenario and the Combined Agenda 2063 scenario on gross domestic product (GDP) per person and extreme poverty except for Health/WaSH that uses life expectancy and infant mortality.
The information is presented graphically and supported by brief interpretive text.
All US$ numbers are in 2017 values.
Summary
- Current Path forecast
- The Community of Sahel-Saharan States (CEN-SAD) has 29 member states, making it the largest regional economic community in Africa. The regional economic community (REC) comprises 14 low-income countries, 14 lower middle-income countries and one upper middle-income country. Jump to forecast: Current Path
- CEN-SAD’s total population is projected to almost double from 2019 to 2043 in the Current Path forecast, rising from 688 million to 1 175 million, an increase of 71%. Jump to Demographics: Current Path
- Considerable heterogeneities exist among CEN-SAD members: Libya’s GDP per capita is projected to rise to US$31 250 by 2043, while the Central African Republic’s is projected to only reach US$1 561 in that same year. Jump to Economics: Current Path
- In 2019, CEN-SAD had a poverty rate of 28.2% at the US$1.90 benchmark, and by 2043, it will have dropped to 18.2% — 2.7 percentage points below Africa’s average. Jump to Poverty: Current Path
- Egypt was CEN-SAD’s largest carbon emitter in 2019, but will be overtaken by Nigeria before 2043 due to the latter’s projected population and economic growth. In 2019, Egypt emitted 67.7 million tons of carbon compared to Nigeria’s 39.3 million tons, but by 2043, Nigeria is expected to emit 198.1 million tons to Egypt’s 150 million tons. Jump to Carbon emissions/Energy: Current Path
- Sectoral scenarios
- CEN-SAD’s average GDP per capita will be US$275 higher in the Stability scenario than in the Current Path forecast by 2043 — US$1 096 above the projected average for Africa for the same year. Jump to Stability scenario
- CEN-SAD is projected to not experience a demographic dividend in the Current Path forecast; however, in the Demographic scenario the REC is projected to enter its period of demographic dividend in 2043. Jump to Demographic scenario
- The infant mortality rate for CEN-SAD is projected to decline from 49.5 deaths per 1 000 live births in 2019 to 24.8 deaths by 2043 in the Health/WaSH scenario — a reduction which places it below Africa’s Current Path forecast average of 25.6 deaths for 2043. Jump to Health/WaSH scenario
- In the Agriculture scenario, Djibouti will have the highest average crop yields per hectare by 2043 at 41.4 tons per hectare. The scenario boosts the REC’s average crop yields per hectare from 4 tons in 2019 to 7 tons in 2043. Jump to Agriculture scenario
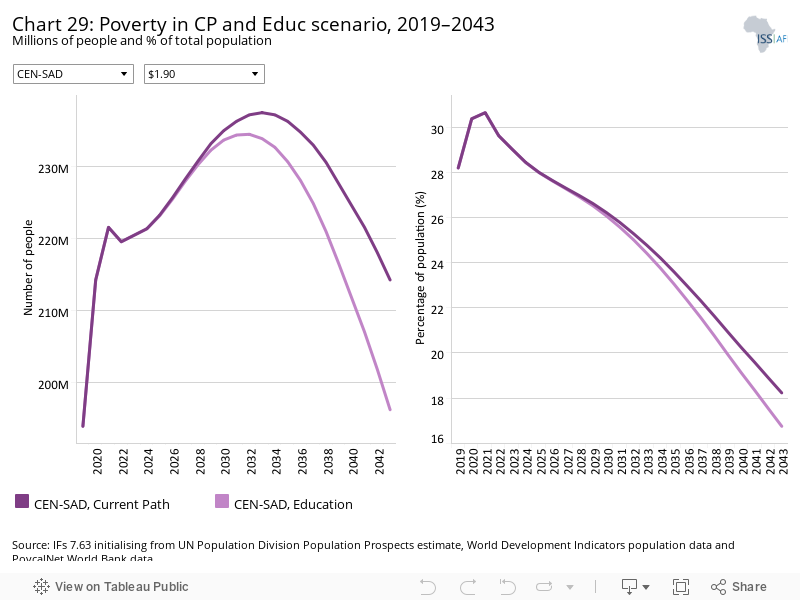
- The difference between female and male average years of education is a problem among CEN-SAD’s members, with only two countries having education in favour of the female population in 2019. CEN-SAD’s average gap will however decrease in the Education scenario, from 1.4 years in 2019 to 1 year in 2043. Jump to Education scenario
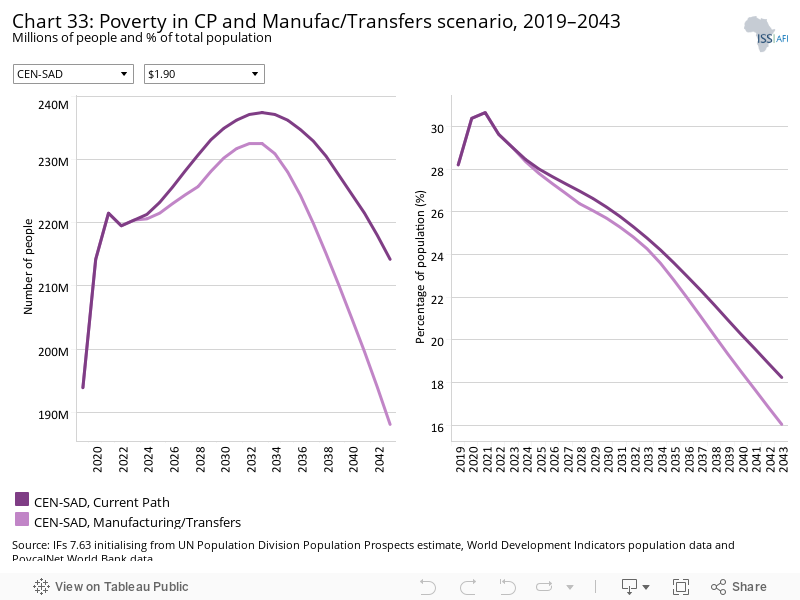
- The Manufacturing/Transfers scenario reduces CEN-SAD’s poverty rate by 2.2 percentage points and 26.1 million people by 2043 compared to the Current Path forecast. Jump to Manufacturing/Transfers scenario
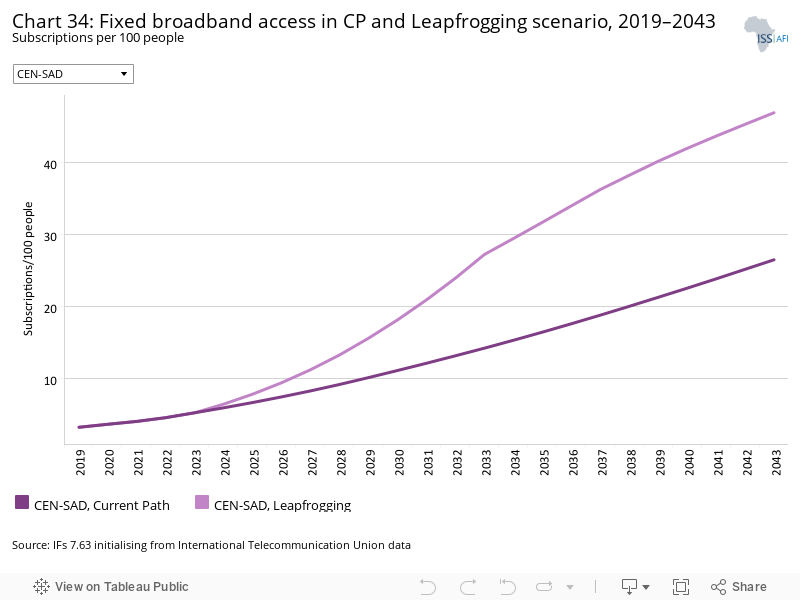
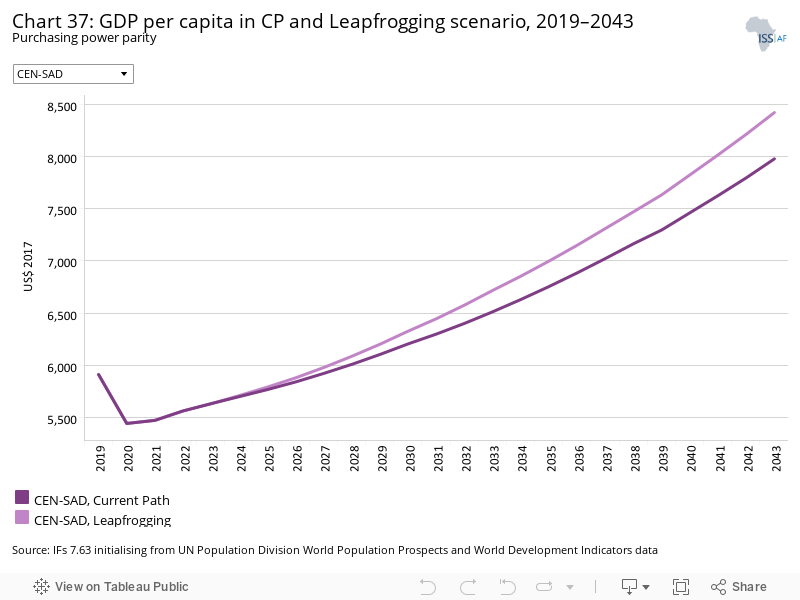
- CEN-SAD’s fixed broadband subscriptions will increase to 47 per 100 people by 2043 in the Leapfrogging scenario, 20.5 subscriptions more than in the Current Path forecast, which is impressive growth coming from a low base of 3.1 subscriptions in 2019. Jump to Leapfrogging scenario
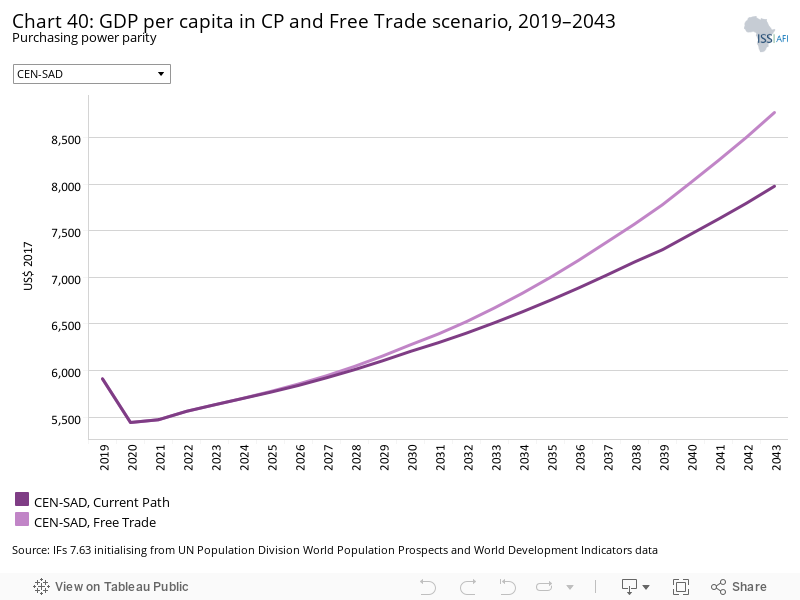
- The Free Trade scenario’s interventions are effective in spurring economic growth, increasing CEN-SAD’s GDP per capita the most out of all the scenarios discussed. The Free Trade scenario increases the REC’s GDP per capita to US$8 769 in 2043 — US$791 higher than in the Current Path forecast. Jump to Free Trade scenario
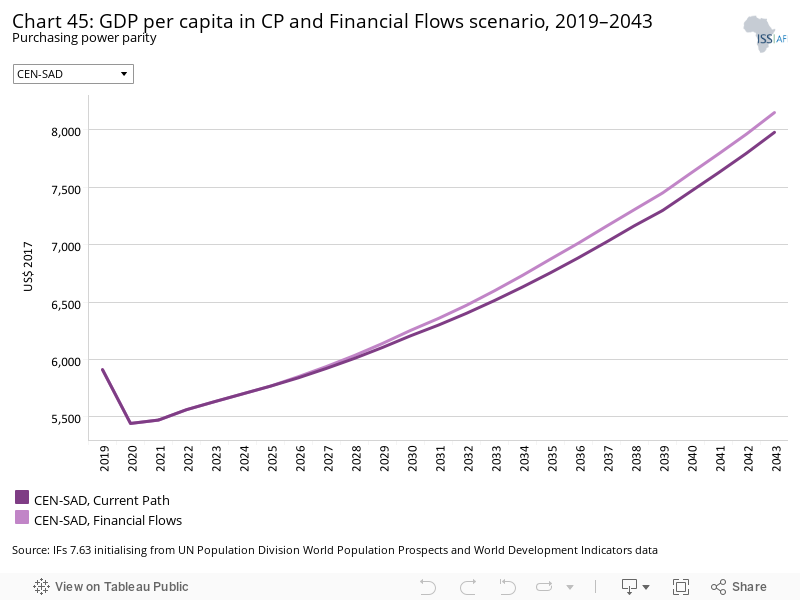
- In the Financial Flows scenario, CEN-SAD’s remittances will rise from US$47.6 billion in 2019 to US$128.8 billion in 2043 — US$17.4 billion more than in the Current Path forecast. Jump to Financial Flows scenario
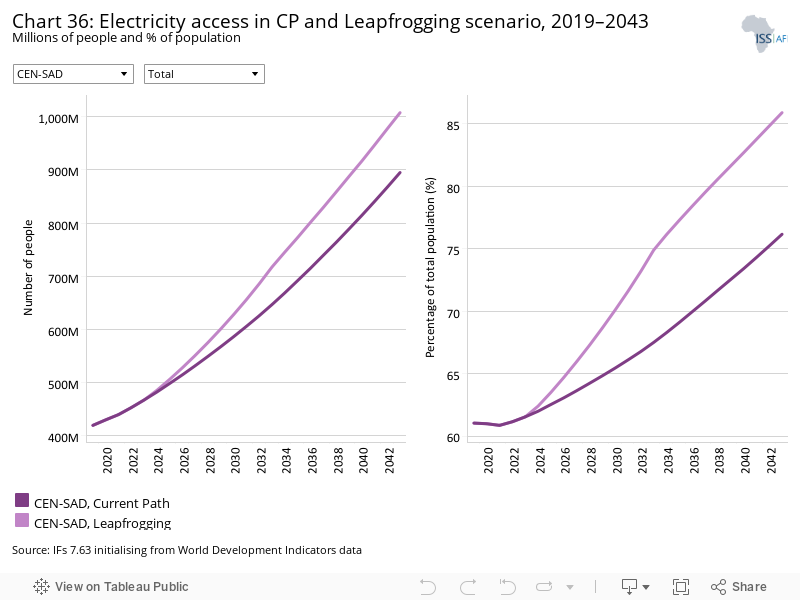
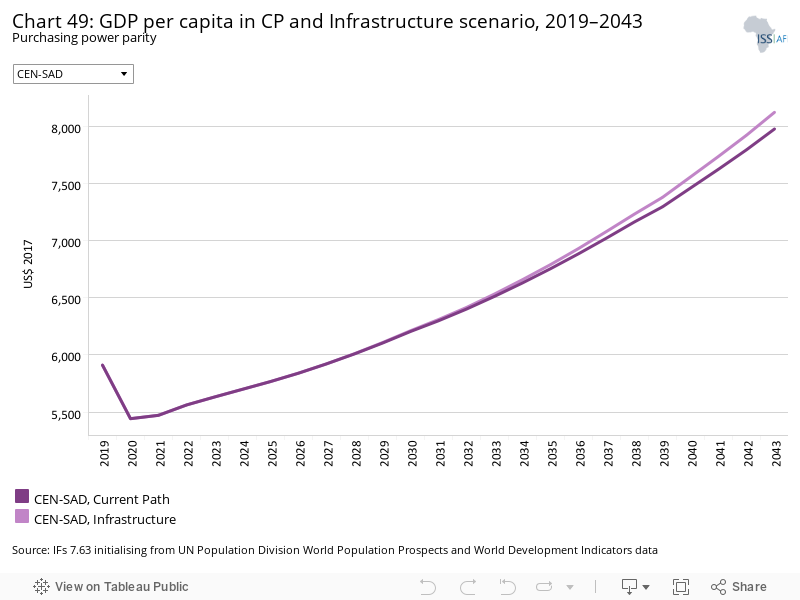
- In the Infrastructure scenario, CEN-SAD’s total electricity access is projected to rise from 61.1% in 2019 to 80.1% in 2043; urban access will rise from 78.3% to 89.5% and rural access will rise considerably from 47.5% to 70.1%. Jump to Infrastructure scenario
- In the Governance scenario, CEN-SAD’s average government effectiveness score of 1.6 out of 5 in 2019 increases to 2.2 by 2043, on par with Africa’s Current Path forecast average. Jump to Governance scenario
- The projected rise in economic activity in the scenarios will lead to increased carbon emissions. In 2043, the Free Trade scenario will increase carbon emissions the most compared to the Current Path forecast, with the Manufacturing/Transfers and Agriculture scenarios following. Jump to Impact of scenario on carbon emissions
- Combined Agenda 2063 scenario Jump to Combined Agenda 2063 scenario
- The Combined Agenda 2063 scenario will have a dramatic impact on GDP per capita for CEN-SAD. In 2043, the REC’s GDP per capita is projected to be US$4 470 higher than the Current Path forecast, an increase of 56%.
- There are wide discrepancies in the Combined Agenda 2063 scenario’s effectiveness in reducing poverty in individual countries, with Sierra Leone expected to see a 32 percentage point reduction in its poverty rate for 2043, while Tunisia and Morocco, countries where poverty is already low, would see reductions below 5 percentage points.
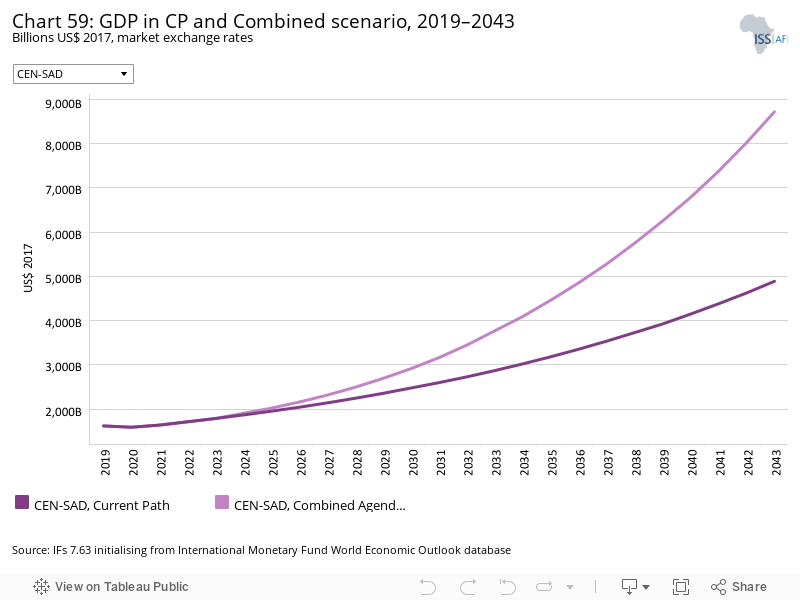
- CEN-SAD’s combined economy is expected to grow significantly in the Current Path but the effect of the Combined Agenda 2063 scenario on GDP is more impressive. CEN-SAD’s GDP increases to US$8.7 trillion by 2043 —78.3% higher than the Current Path forecast.
All charts for CEN-SAD
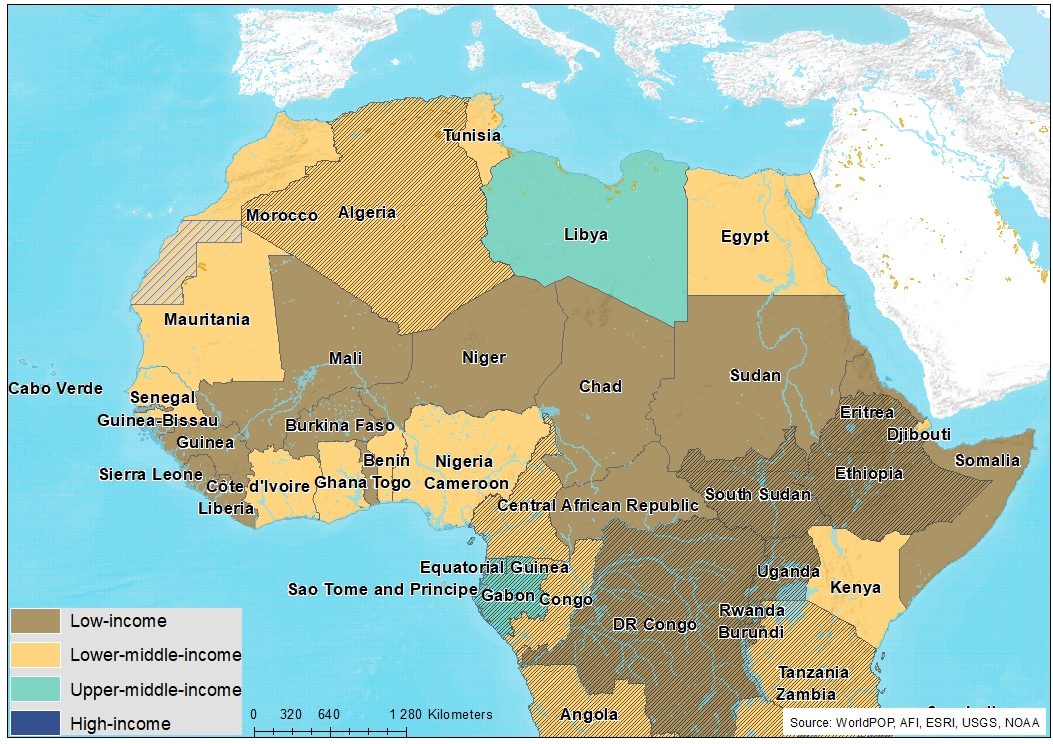
- Chart 1: Political map of CEN-SAD
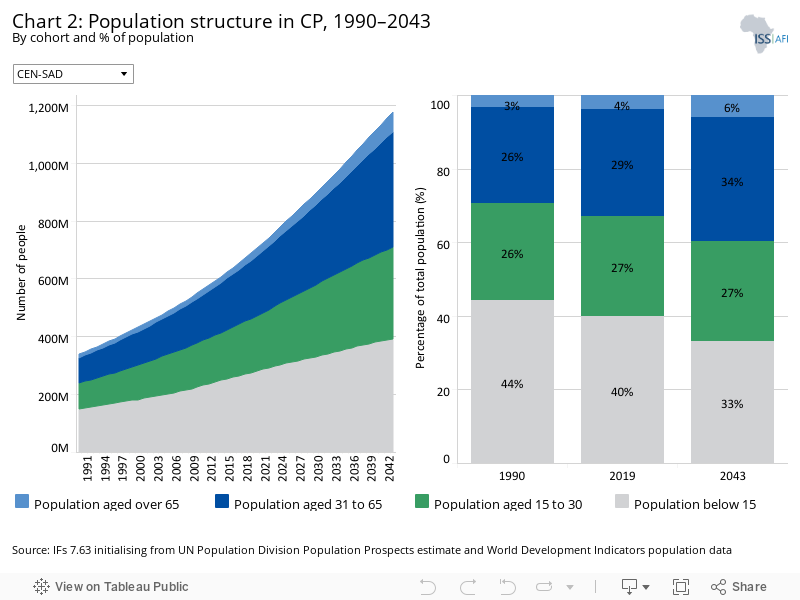
- Chart 2: Population structure in CP, 1990–2043
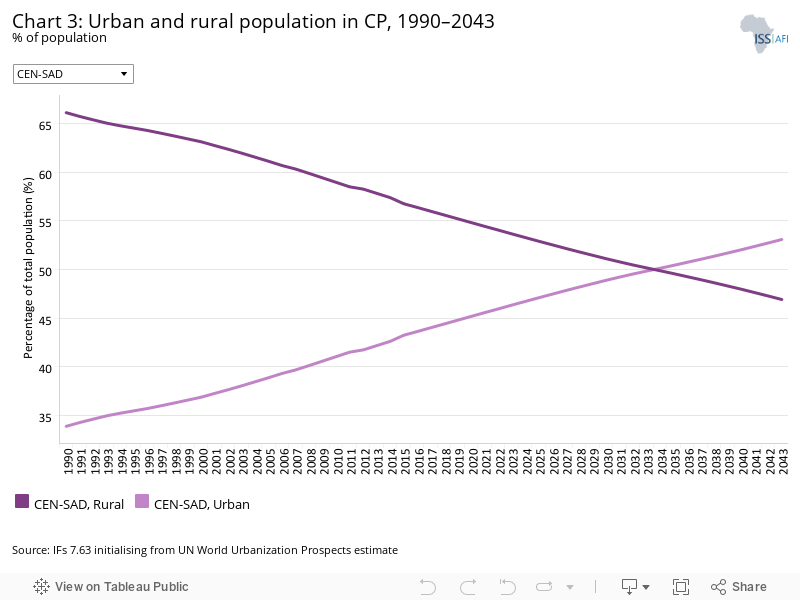
- Chart 3: Urban and rural population in CP, 1990–2043
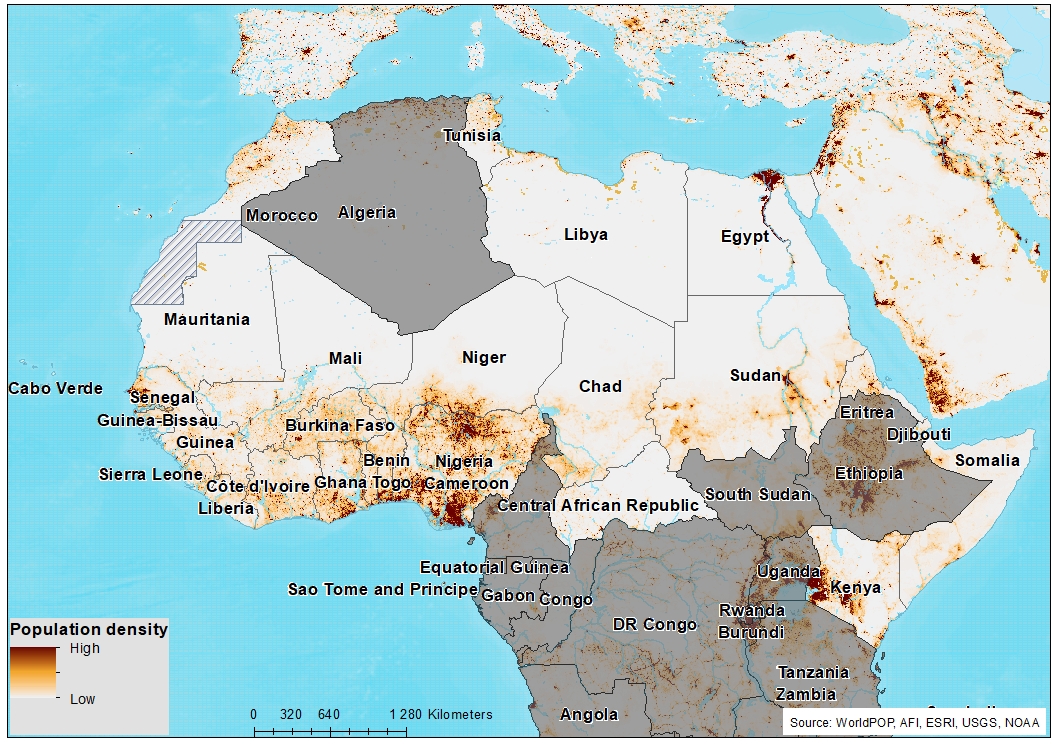
- Chart 4: Population density map for 2019
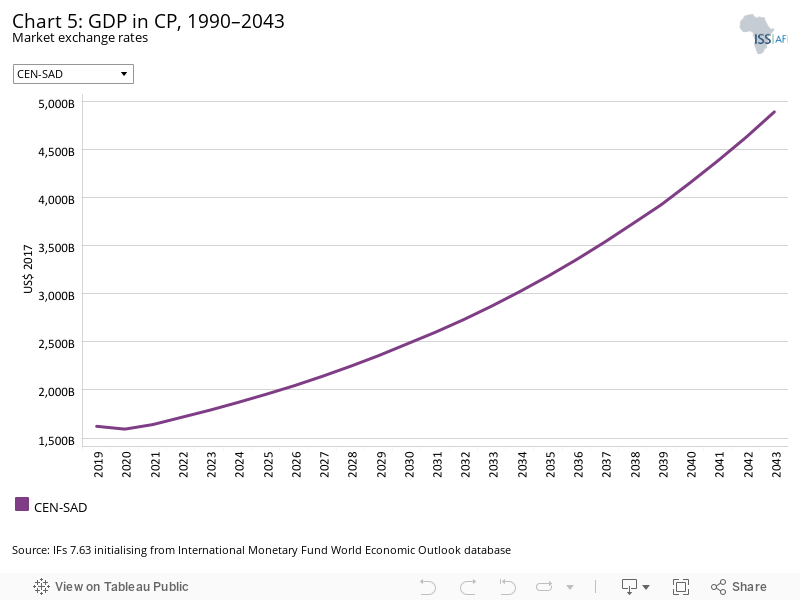
- Chart 5: GDP in CP, 1990–2043
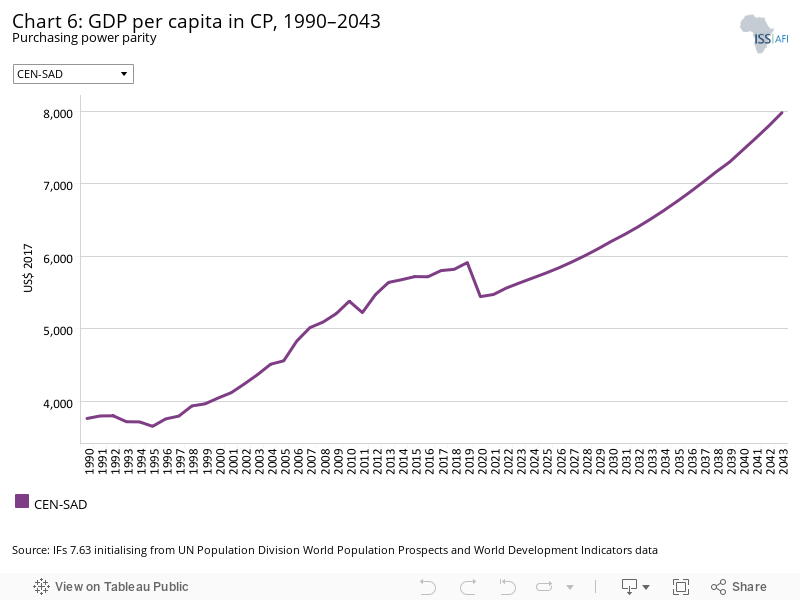
- Chart 6: GDP per capita in CP, 1990–2043
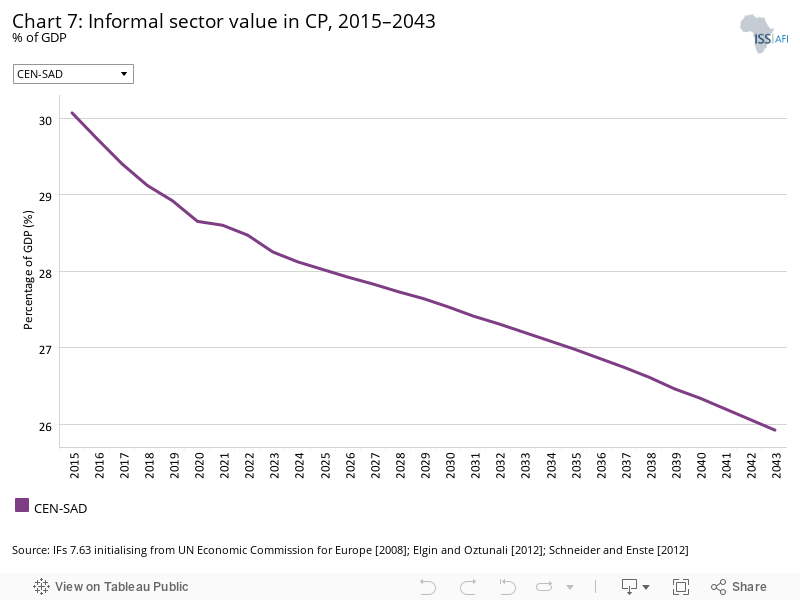
- Chart 7: Informal sector value in CP, 2015–2043
- Chart 8: Value added by sector in CP, 2015–2043
- Chart 9: Agriculture production/demand in CP, 1990–2043
- Chart 10: Poverty in CP, 2015–2043
- Chart 11: Energy production by type in CP, 1990–2043
- Chart 12: Carbon emissions in CP, 1990–2043
- Chart 13: Governance security in CP and Stability scenario, 2019–2043
- Chart 14: GDP per capita in CP and Stability scenario, 2019–2043
- Chart 15: Poverty in CP and Stability scenario, 2019–2043
- Chart 16: Demographic dividend in CP and Demog scenario, 2019–2043
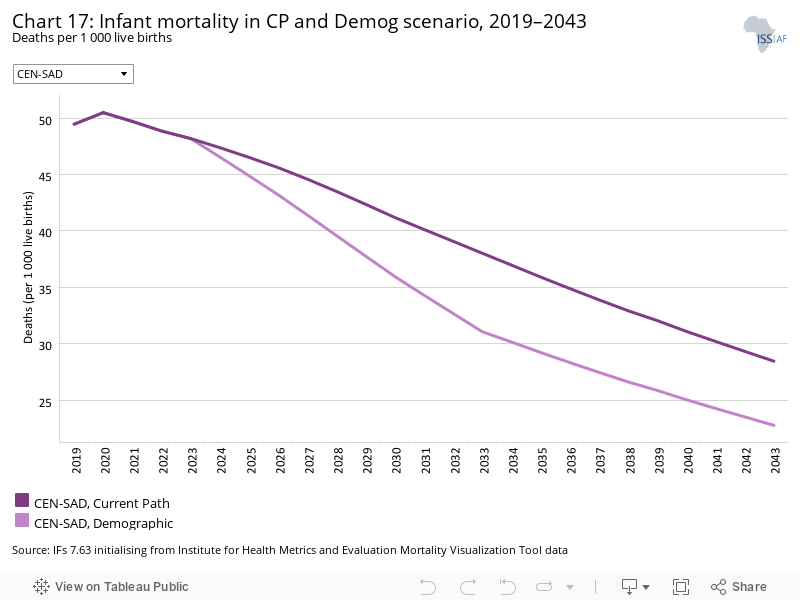
- Chart 17: Infant mortality in CP and Demog scenario, 2019–2043
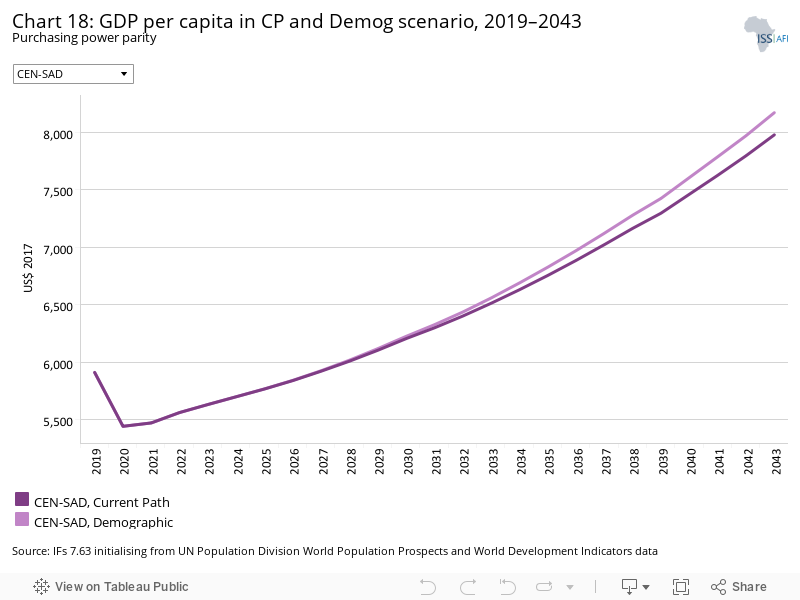
- Chart 18: GDP per capita in CP and Demog scenario, 2019–2043
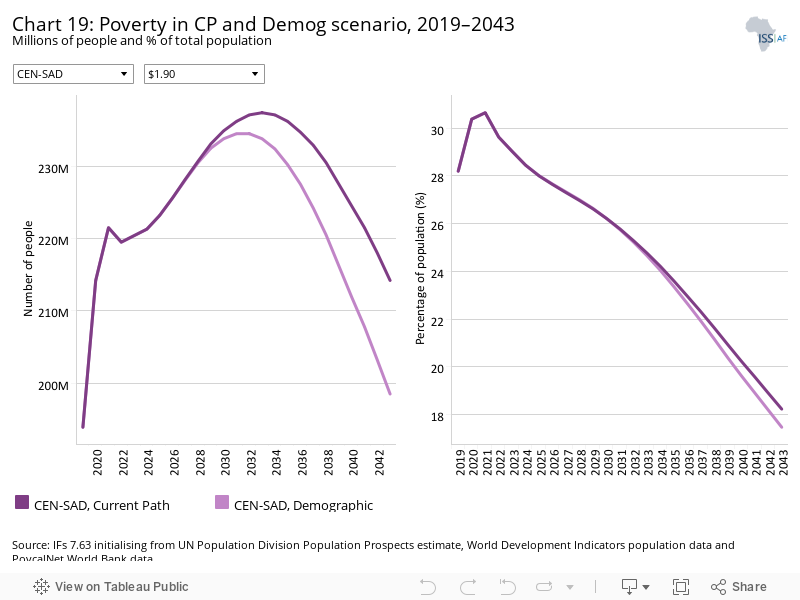
- Chart 19: Poverty in CP and Demog scenario, 2019–2043
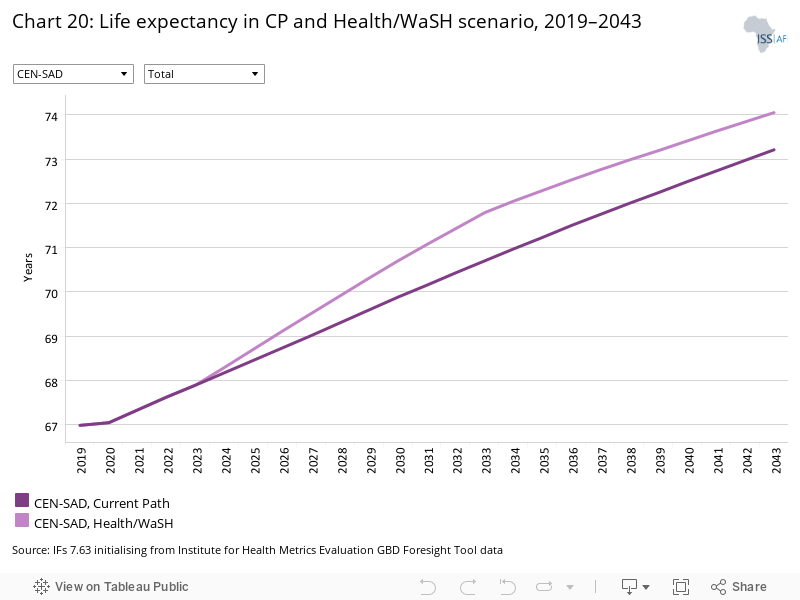
- Chart 20: Life expectancy in CP and Health/WaSH scenario, 2019–2043
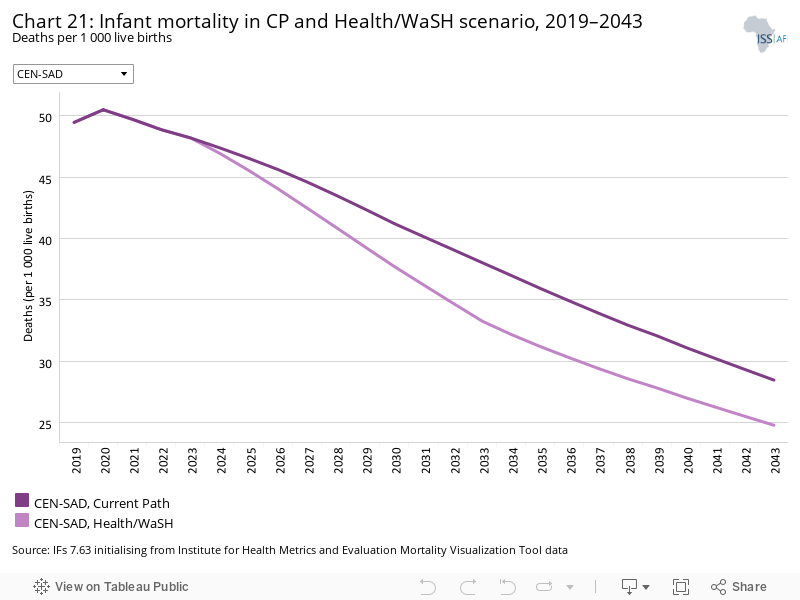
- Chart 21: Infant mortality in CP and Health/WaSH scenario, 2019–2043
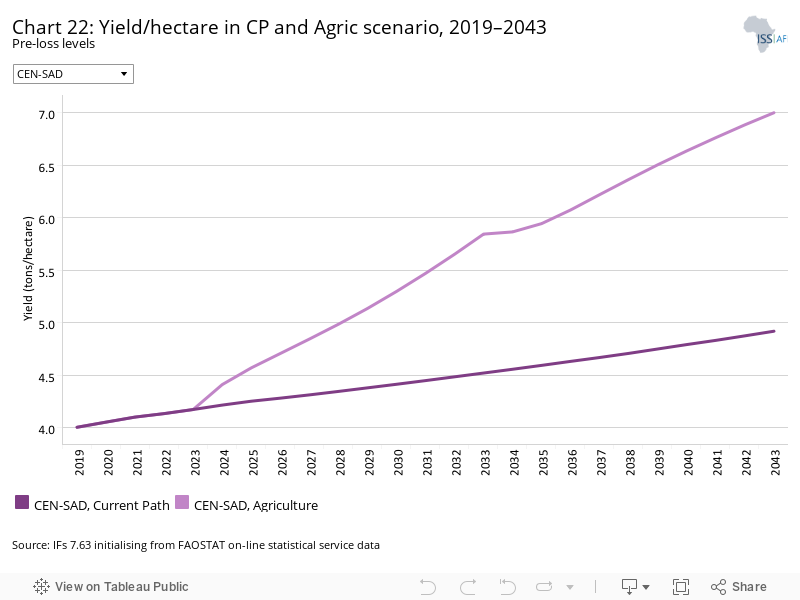
- Chart 22: Yield/hectare in CP and Agric scenario, 2019–2043
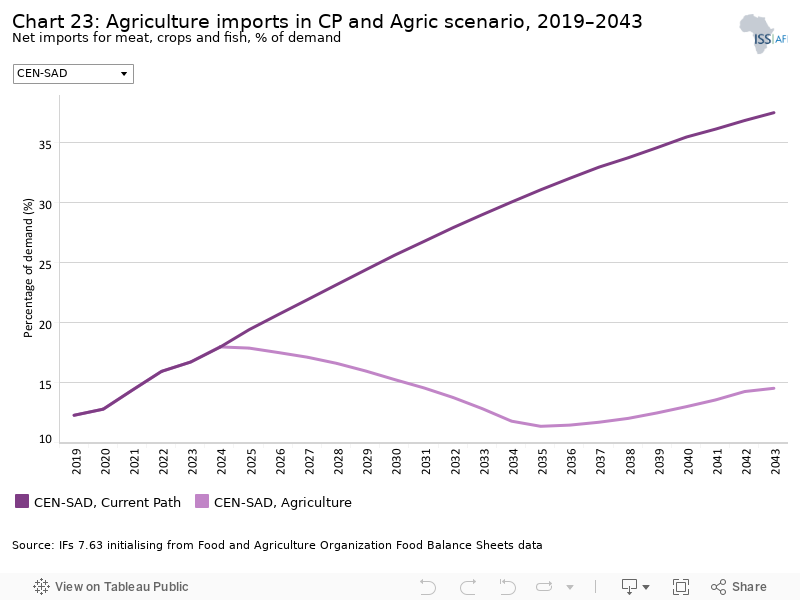
- Chart 23: Agriculture imports in CP and Agric scenario, 2019–2043
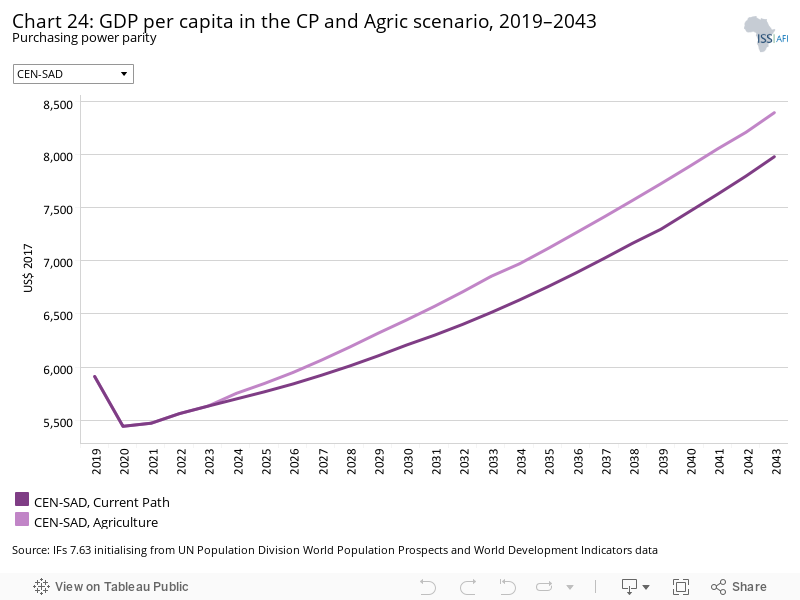
- Chart 24: GDP per capita in the CP and Agric scenario, 2019–2043
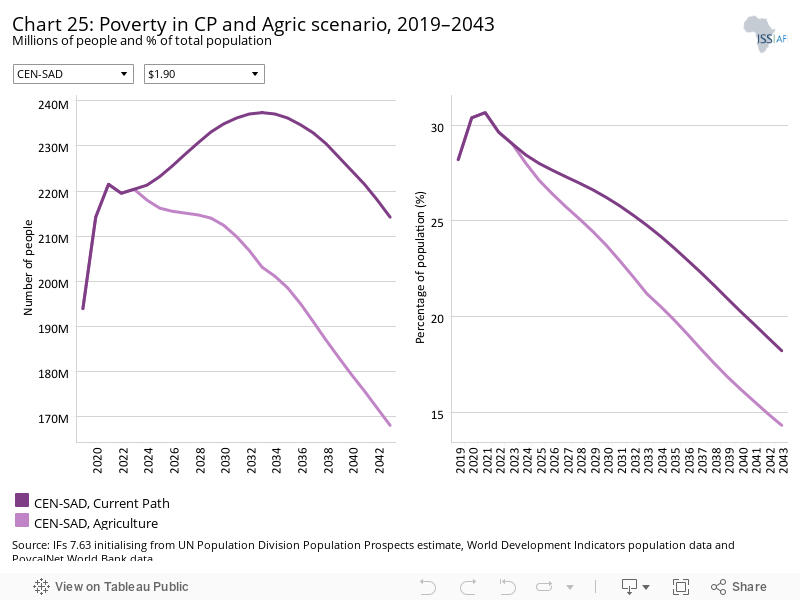
- Chart 25: Poverty in CP and Agric scenario, 2019–2043
- Chart 26: Mean years of education in CP and Educ scenario, 2019–2043
- Chart 27: Education quality in CP and Educ scenario, 2019–2043
- Chart 28: GDP per capita in CP and Educ scenario, 2019–2043
- Chart 29: Poverty in CP and Educ scenario, 2019–2043
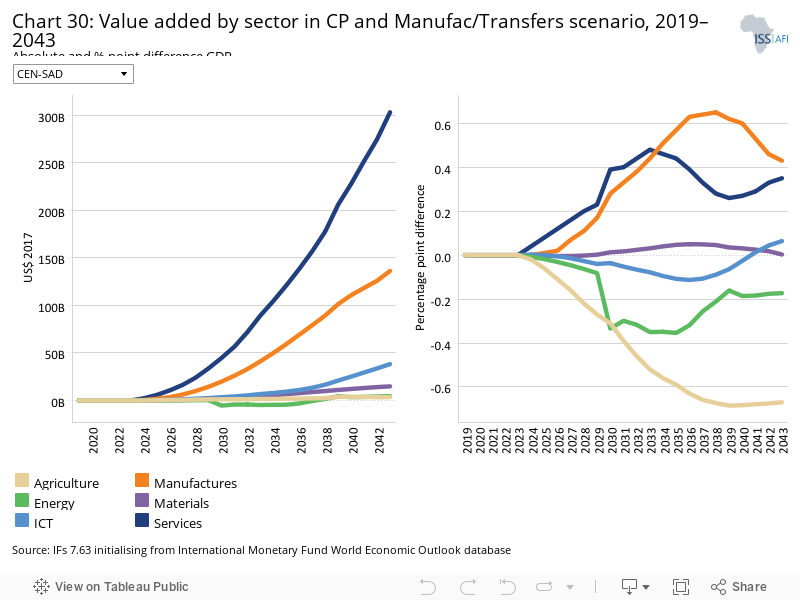
- Chart 30: Value added by sector in CP and Manufac/Transfers scenario, 2019–2043
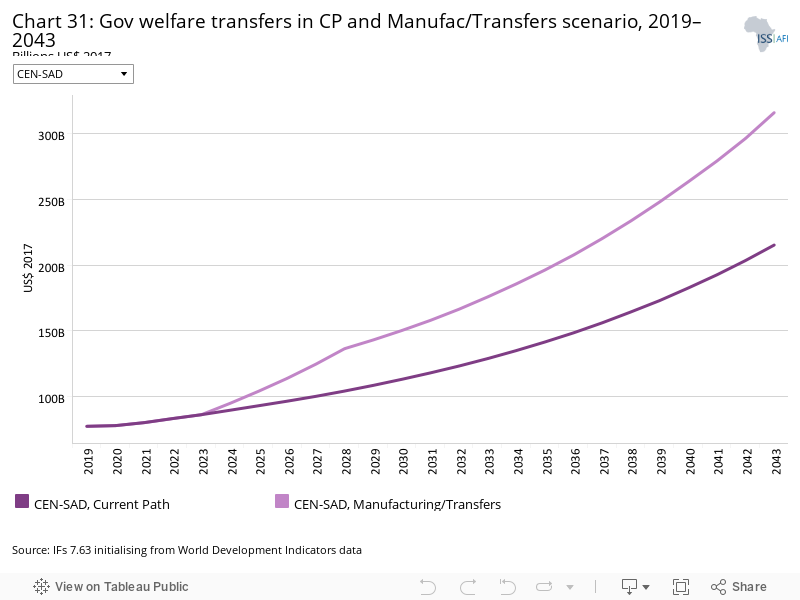
- Chart 31: Gov welfare transfers in CP and Manufac/Transfers scenario, 2019–2043
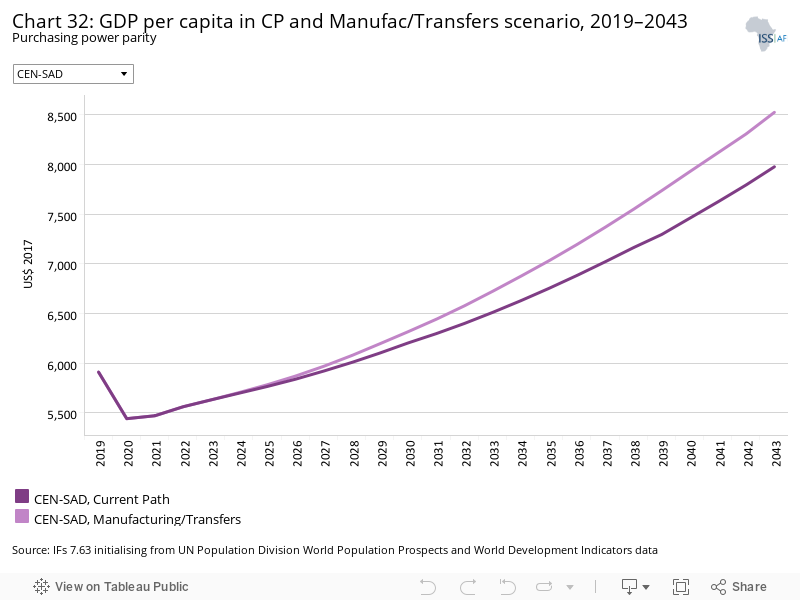
- Chart 32: GDP per capita in CP and Manufac/Transfers scenario, 2019–2043
- Chart 33: Poverty in CP and Manufac/Transfers scenario, 2019–2043
- Chart 34: Fixed broadband access in CP and Leapfrogging scenario, 2019–2043
- Chart 35: Mobile broadband access in CP and Leapfrogging scenario, 2019–2043
- Chart 36: Electricity access in CP and Leapfrogging scenario, 2019–2043
- Chart 37: GDP per capita in CP and Leapfrogging scenario, 2019–2043
- Chart 38: Poverty in CP and Leapfrogging scenario, 2019–2043
- Chart 39: Trade balance in CP and Free Trade scenario, 2019–2043
- Chart 40: GDP per capita in CP and Free Trade scenario, 2019–2043
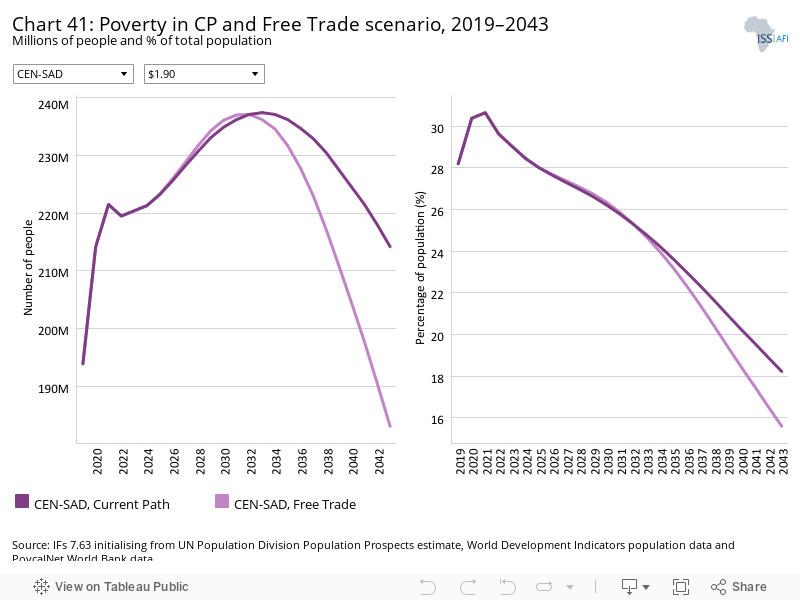
- Chart 41: Poverty in CP and Free Trade scenario, 2019–2043
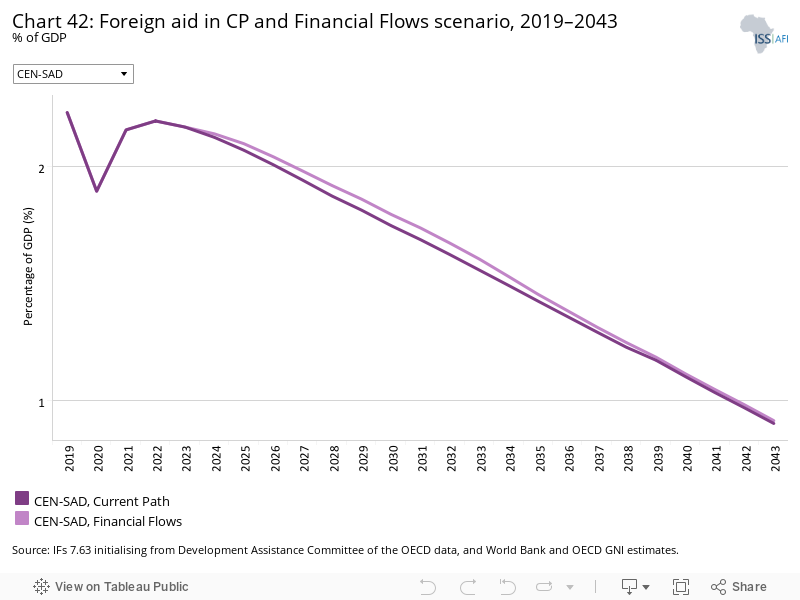
- Chart 42: Foreign aid in CP and Financial Flows scenario, 2019–2043
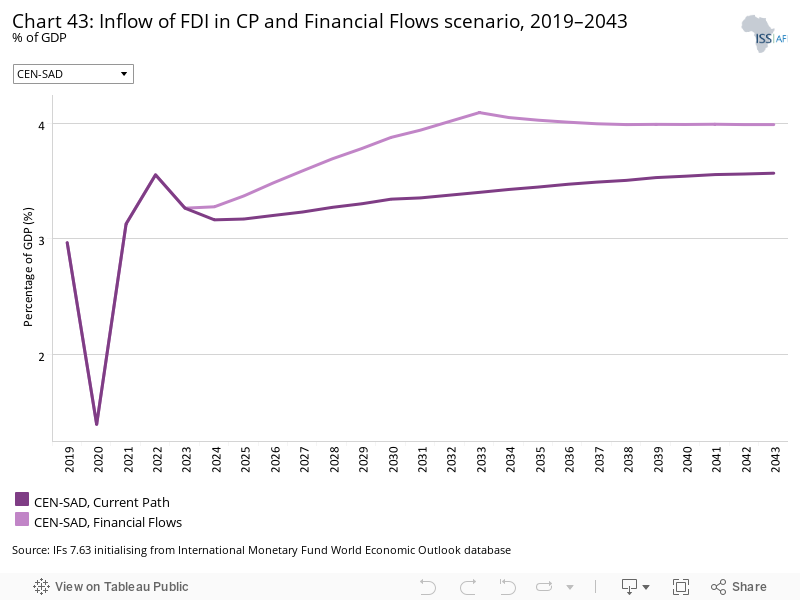
- Chart 43: Inflow of FDI in CP and Financial Flows scenario, 2019–2043
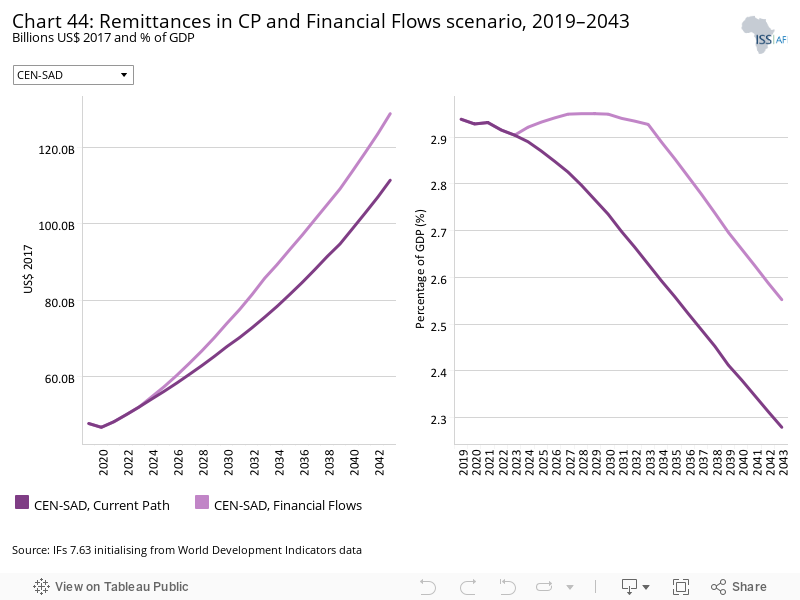
- Chart 44: Remittances in CP and Financial Flows scenario, 2019–2043
- Chart 45: GDP per capita in CP and Financial Flows scenario, 2019–2043
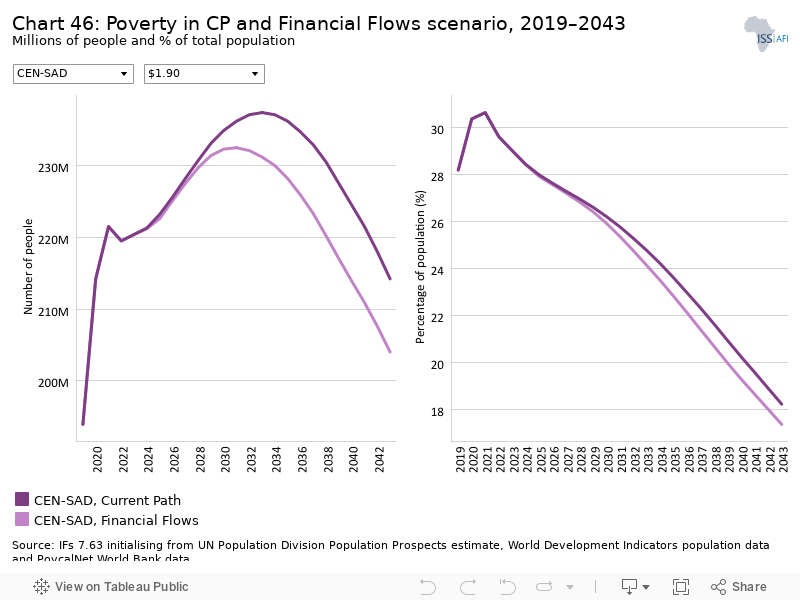
- Chart 46: Poverty in CP and Financial Flows scenario, 2019–2043
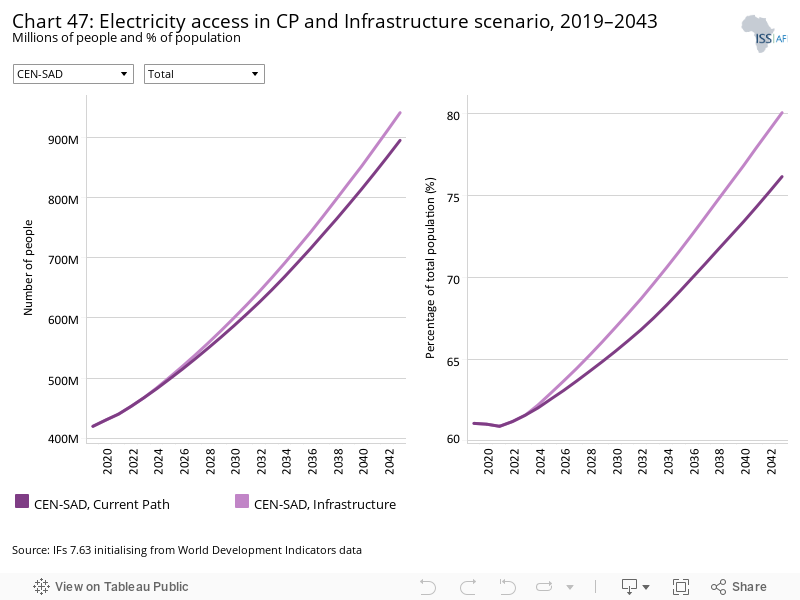
- Chart 47: Electricity access in CP and Infrastructure scenario, 2019–2043
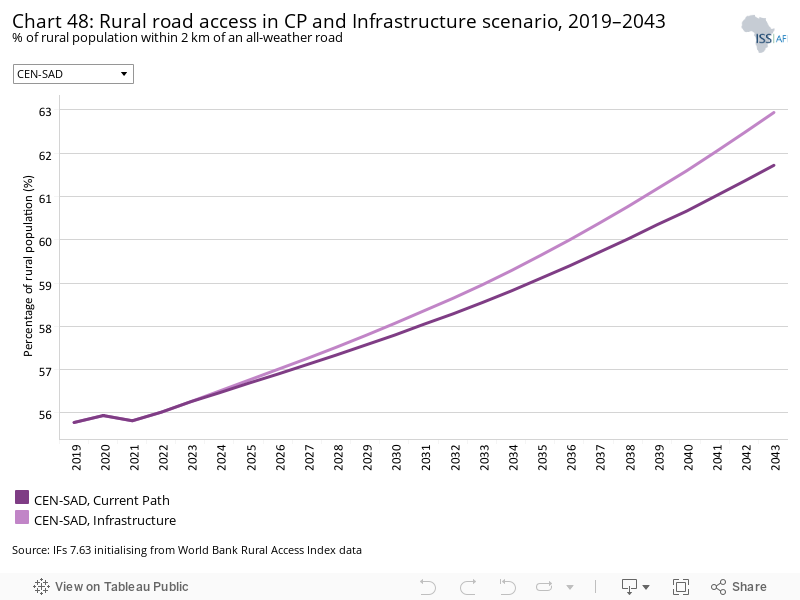
- Chart 48: Rural road access in CP and Infrastructure scenario, 2019–2043
- Chart 49: GDP per capita in CP and Infrastructure scenario, 2019–2043
- Chart 50: Poverty in CP and Infrastructure scenario, 2019–2043
- Chart 51: Gov effectiveness in CP and Governance scenario, 2019–2043
- Chart 52: GDP per capita in CP and Governance scenario, 2019–2043
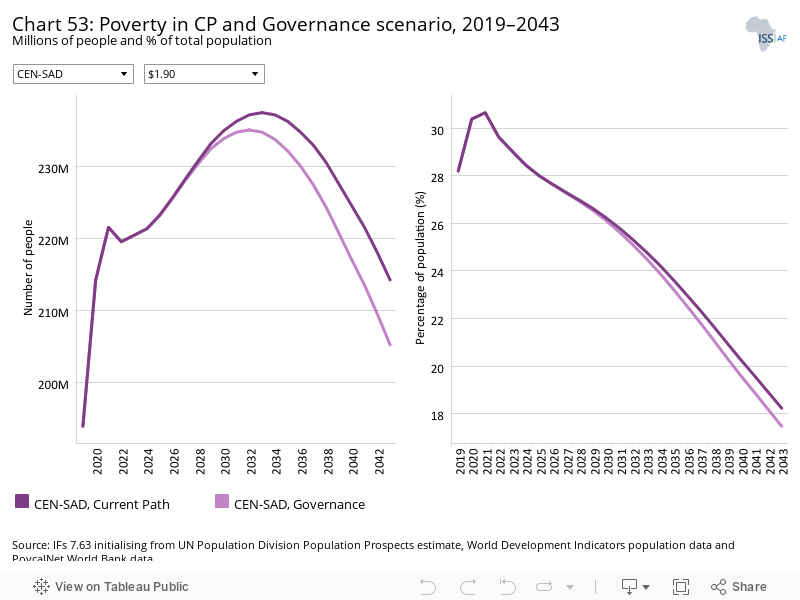
- Chart 53: Poverty in CP and Governance scenario, 2019–2043
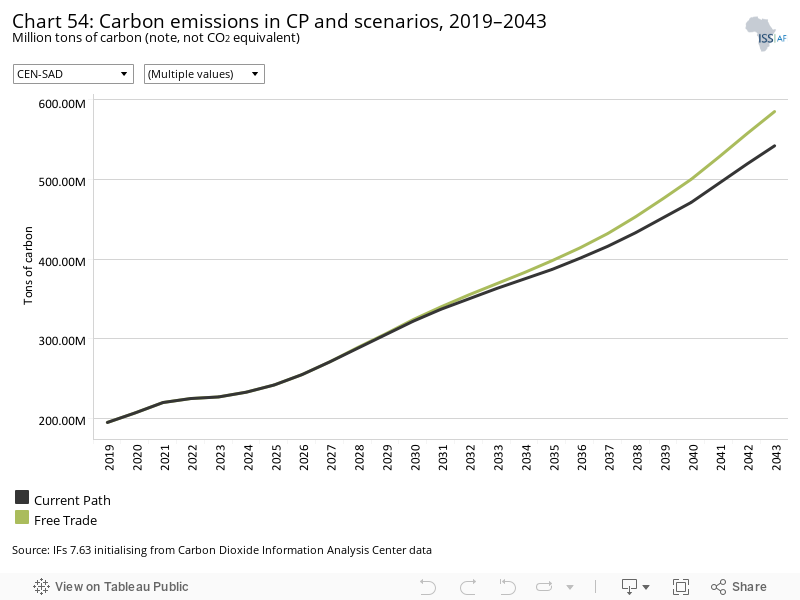
- Chart 54: Carbon emissions in CP and scenarios, 2019–2043
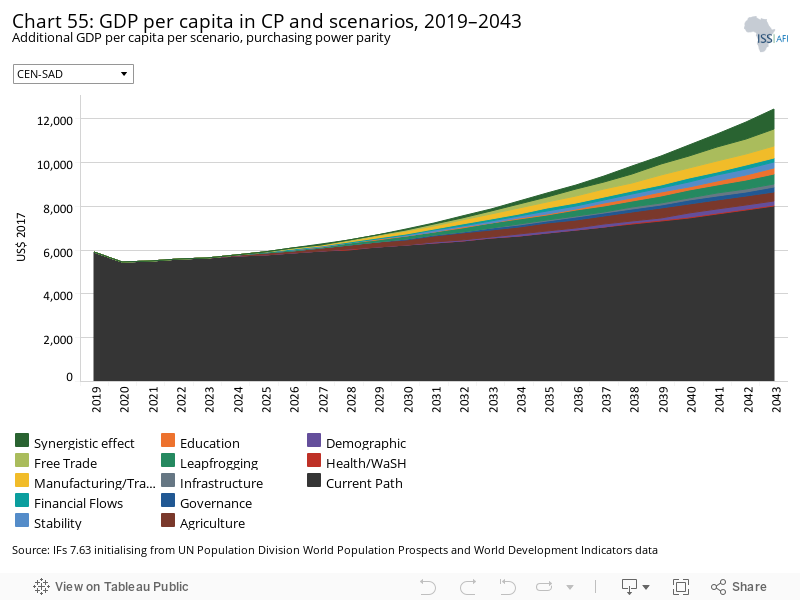
- Chart 55: GDP per capita in CP and scenarios, 2019–2043
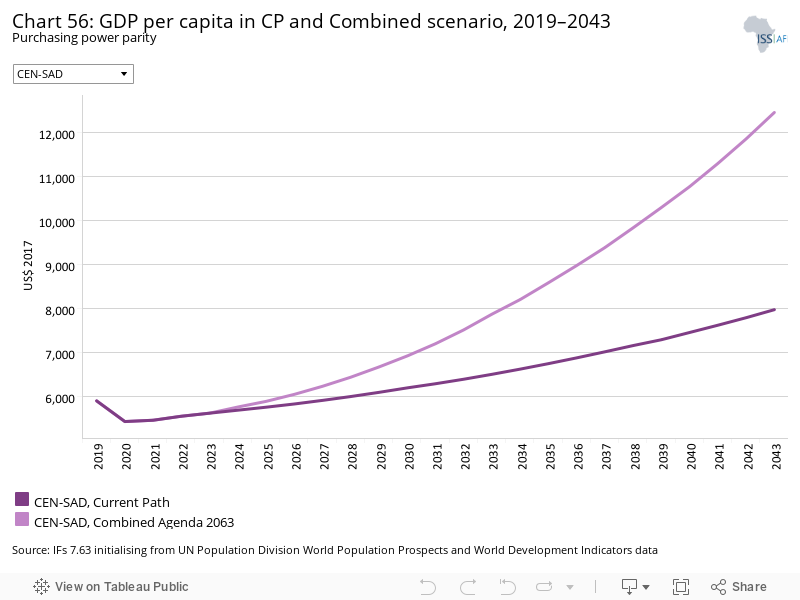
- Chart 56: GDP per capita in CP and Combined scenario, 2019–2043
- Chart 57: Poverty in CP and Combined scenario, 2019–2043
- Chart 58: Value added by sector in CP and Combined scenario, 2019–2043
- Chart 59: GDP in CP and Combined scenario, 2019–2043
- Chart 60: Carbon emissions in CP and Combined scenario, 2019–2043

This page provides an overview of the key characteristics of CEN-SAD along its likely (or Current Path) development trajectory. The Current Path forecast from the International Futures forecasting (IFs) platform is a dynamic scenario that imitates the continuation of current policies and environmental conditions. The Current Path is therefore in congruence with historical patterns and produces a series of dynamic forecasts endogenised in relationships across crucial global systems. We use 2019 as a standard reference year and the forecasts generally extend to 2043 to coincide with the end of the third ten-year implementation plan of the African Union’s Agenda 2063 long-term development vision.
The Community of Sahel-Saharan States (CEN-SAD) was established in 1998 in Libya and became a regional economic community in 2000. It is an economic and integration organisation that seeks the economic union of the member countries and the promotion of international trade. CEN-SAD has 29 members, making it the largest regional economic community (REC) in Africa, comprising: Benin, Burkina Faso, Cape Verde, the Central African Republic (CAR), Chad, Comoros, Côte d’Ivoire, Djibouti, Egypt, Eritrea, The Gambia, Ghana, Guinea, Guinea-Bissau, Kenya, Liberia, Libya, Mali, Mauritania, Morocco, Niger, Nigeria, São Tomé and Príncipe, Senegal, Sierra Leone, Somalia, Sudan, Togo and Tunisia.
The members of the community are widely dispersed and no country is solely a member of CEN-SAD, thus negatively affecting the community’s effectiveness and autonomy. The grouping has a wide variety of countries in terms of income classification. There are 14 low-income members, 14 lower middle-income members and one upper middle-income member. Integration between countries is also low when compared to other RECs.
CEN-SAD’s total population is projected to almost double from 2019 to 2043 in the Current Path forecast, rising from 688 million to 1 175 million — an increase of 71%. The increase builds on the trend that the REC experienced between 1990 to 2019, when the population increased by 104% from 337 million to 688 million people.
The total populations of CEN-SAD’s members vary greatly: Nigeria, the most populous country in Africa, had a total population of 204 million people in 2019, while the three island nations of the Comoros, Cape Verde and São Tomé and Príncipe all had populations below 1 million people. Niger and Chad are projected to see increases above 100% from 2019 to 2043, while significantly, Nigeria will see the fourth highest increase at 90%, reaching a total population of 388 million people in 2043.
The population structure of CEN-SAD will gradually shift towards a more mature composition, as the section of the population who are of working age will grow from 56.3% in 2019 to 60.9% in 2043. Additionally, those aged under 15 will constitute 33.2% of the total population in 2043 — 6.7 percentage points less than in 2019. The dependency ratio will thus decrease, opening the way for the demographic dividend, provided the working-age population is adequately skilled and is productively employed in the formal economy.
Individually, population structures also vary considerably. In 2019, nearly 50% of Niger’s population was aged below 15, while only 24% of Tunisia’s was of that age, and 9% was aged 65 or above. By 2043, Tunisia will be joined by Morocco, Libya and Cape Verde as countries where those aged above 65 constitute more than 10% of the total population. Niger, Chad and Somalia will continue to have a youthful population, with more than 40% of their people aged below 15 in 2043.
CEN-SAD’s population has been steadily urbanising since 1990, when 66% of the population lived in rural areas. By 2019, 55% lived in rural areas and by 2043, urban areas are projected to house 53% of the CEN-SAD’s population.
There are sizable differences between member states: in 2019, 82% of Libya’s population lived in urban areas, whereas only 16% of Niger’s did. Rates of urbanisation differ markedly too: Mauritania’s urban population is expected to increase by 14.2 percentage points from 2019 to 2043, while CAR will become slightly more rural, the urban population shrinking by 2.1 percentage points. The country will thus buck Africa’s urbanisation trend, mainly due to the prolonged instability in the country forcing urban inhabitants to rural areas as they flee conflict. The country has struggled with repeated waves of internal displacement as a result, explaining the inversion of the urbanisation trend.
The population density of CEN-SAD is projected to rise from 0.48 people per hectare in 2019 to 0.82 people per hectare 2043, which would be slightly higher than Africa’s average of 0.76 in the same year.
On an individual member level, the small nations of the Comoros, The Gambia and São Tomé and Príncipe naturally rank high, while countries with large land areas such as Sudan, Libya and Chad rank low. Two interesting cases are Nigeria and Egypt, who have relatively large land areas and high population densities. Nigeria ranked fourth among CEN-SAD members for population density in 2019 and is projected to rank third in 2043, highlighting the rapid population growth the country is expected to face and contend with moving forward.
The size of CEN-SAD’s combined economy equated to US$1.6 trillion in 2019, and is expected to grow to about US$4.9 trillion by 2043 — a large increase of 201.4%. The increase of US$3 266.8 billion is mostly driven by Nigeria and Egypt; the former is expected to see an increase of US$1.4 trillion, while the latter would see a rise of US$635 billion. In percentage terms, the largest increase will come from The Gambia, whose economy nearly quintuples from US$2.1 billion to US$10 billion in 2043. Guinea-Bissau, Niger, Eritrea, Senegal and Guinea are all projected to see their economies grow fourfold from 2019 to 2043. The third and eight largest economies in 2019, Morocco and Tunisia, will only grow by 65% and 64% respectively, the smallest increases among CEN-SAD’s members.
The REC’s GDP distribution has been titled heavily in favour of Nigeria since 1990, when the West African country accounted for 31.5% of CEN-SAD’s combined GDP, with its share increasing to 34.6% in 2019 and potentially rising to 40.3% in 2043. The second largest economy is expected to remain Egypt, with its share dipping from 21.5% in 2019 to 20.1% in 2043. Libya is expected to see the largest decrease between 1990 and 2043, dropping from 11.7% to 3.7%.
Although many of the charts in the sectoral scenarios also include GDP per capita, this overview is an essential point of departure for interpreting the general economic outlook of CEN-SAD.
CEN-SAD’s GDP per capita grew steadily from 1990 to 2019, rising by 57% from US$3 763 to US$5 911. Recovery from the COVID-19 pandemic is projected to take some time, with the REC’s GDP per capita only reaching 2019 levels in 2027 again. By 2043, GDP per capita will be 35% higher than in 2019, reaching US$7 978 and outpacing the projected average for Africa.
CEN-SAD has a large number of members, with a wide discrepancy in terms of development. Somalia and CAR both had GDP per capita below US$900 in 2019, while Egypt and Tunisia’s were above US$10 000 and Libya’s was above US$20 000. By 2043, 23 out of the 29 members will still be below Africa’s average of US$7 157. Libya will have the highest GDP per capita at US$31 250, while Guinea-Bissau, Eritrea, Niger, Liberia and Togo would more than double their 2019 figures.
The size of CEN-SAD’s informal sector was 29% of the subregion’s GDP, 2.6 percentage points above Africa’s average of 26.4% of GDP in 2019, but the REC is projected to gradually catch up, reaching 25.9% in 2043 and reducing the gap to only 1.2 percentage points.
All 29 members will see a decrease in the size of their informal sectors, which augurs well for governments’ revenue in the area due to the tax revenue increased formalisation brings. The largest decrease will be seen in Liberia, where the informal sector will be 8 percentage points smaller by 2043. Sudan will only see a 1 percentage point decrease, but the country’s level of informality was already the lowest among CEN-SAD’s members at 13.9% in 2019.
The IFs platform uses data from the Global Trade and Analysis Project (GTAP) to classify economic activity into six sectors: agriculture, energy, materials (including mining), manufacturing, services and information and communication technologies (ICT). Most other sources use a threefold distinction between only agriculture, industry and services with the result that data may differ.
The service sector is very important to the CEN-SAD economy, constituting 50.9% of GDP in 2019, and is forecast to account for 56.8% of GDP in 2043. The agriculture sector has the second largest contribution to CEN-SAD’s GDP with its share in GDP of 19.3% in 2019. The share of agriculture is, however, projected to steadily decline to 7.9% by 2043 while that of the manufacturing sector will grow from 16.7% in 2019 to 22.7% by 2043, indicating the structural transformation of the economy.
The decrease in agriculture's contribution is universal among members, but the largest decrease will be in Guinea-Bissau, where the agriculture sector shrinks by 27 percentage points by 2043 compared to its level in 2019. Manufacturing also grows, with only Mauritania seeing a small decrease in the size of its manufacturing sector. Chad, Mali and Eritrea’s manufacturing sectors are expected to add more than 12 percentage points extra value by 2043.
Ultimately, however, the service sector is projected to overshadow all other sectors. The smallest share of the sector in GDP by 2043 is in Chad, where it still adds 41% of total value added. Djibouti’s service sector will hold the largest share at 75.7% in 2043, with São Tomé and Príncipe and Cape Verde’s shares also above 70%, respectively. The dominance of the service sector could be detrimental to long-term growth if the productivity in the sector is low and quality of employment is lacking.
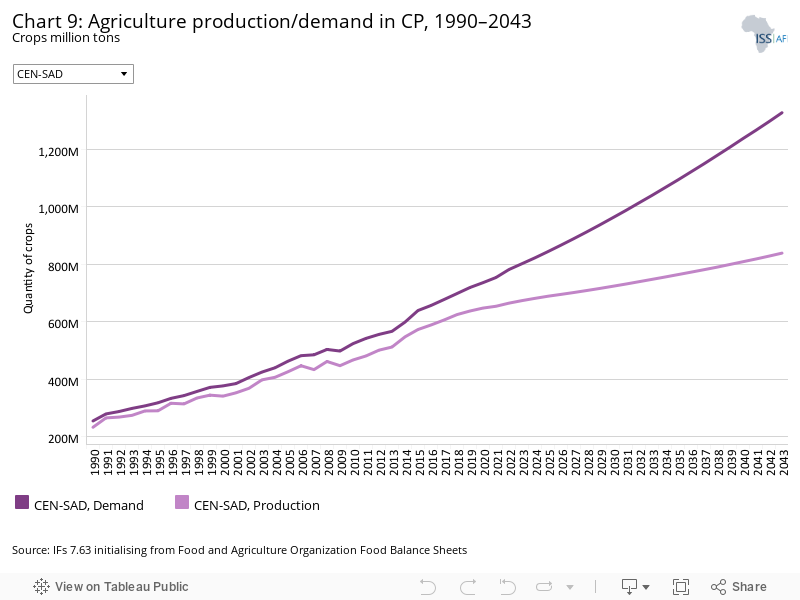
The data on agricultural production and demand in the IFs forecasting platform initialises from data provided on food balances by the Food and Agriculture Organization (FAO). IFs contains data on numerous types of agriculture but aggregates its forecast into crops, meat and fish, presented in million metric tons. Chart 9 shows agricultural production and demand as a total of all three categories.
CEN-SAD’s agriculture demand is projected to continue to rise across the forecast horizon, rising from 719.2 million tons in 2019 to 1.33 trillion tons in 2043 — an increase of 84.6%. Agriculture production will not however rise to meet this increase in demand and a scenario of increased food import dependence is projected for the REC. Production will increase by 31.6% from 637.3 million tons in 2019 to 838.9 million tons by 2043. These trends show that agricultural production in the CEN-SAD area is not keeping pace with the expected 71% increase in the population from 2019 to 2043.
CEN-SAD’s members are all expected to see a significant increase in the size of their agriculture production shortfalls, except for Morocco, whose production will increase by 8 percentage points more than its demand from 2019 to 2043. Chad, Somalia and Niger on the other hand will see the largest increases in demand over this period, with increases above 150% driven by rapid population growth.
Nigeria is projected to have the largest gap between production and demand by 2043: its shortfall will exceed 200 million metric tons in 2043, nearly triple the size of the next largest deficit, which would be Egypt’s at 81.7 million tons. Libya is expected to have the smallest gap by 2043 of 60 000 tons.
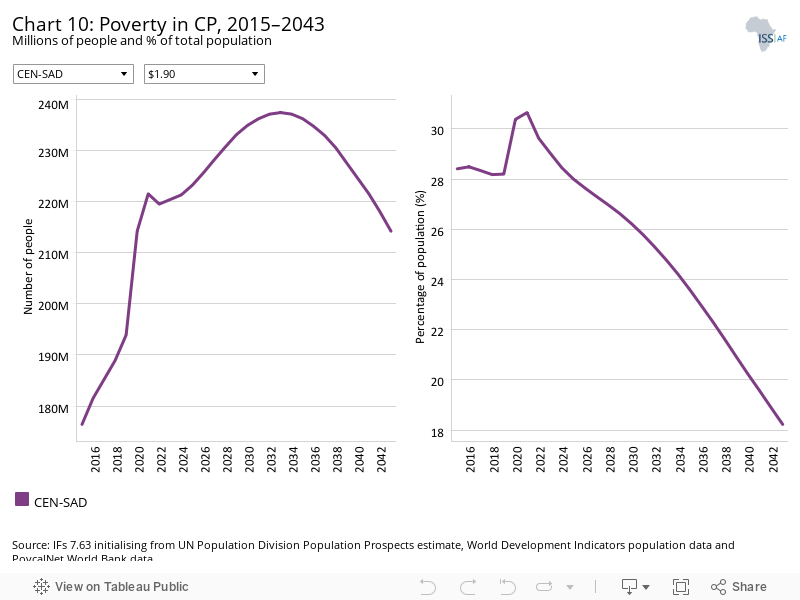
There are numerous methodologies for and approaches to defining poverty. We measure income poverty and use GDP per capita as a proxy. In 2015, the World Bank adopted the measure of US$1.90 per person per day (in 2011 international prices), also used to measure progress towards the achievement of Sustainable Development Goal (SDG) 1 of eradicating extreme poverty. To account for extreme poverty in richer countries occurring at slightly higher levels of income than in poor countries, the World Bank introduced three additional poverty lines in 2017:
- US$3.20 for lower middle-income countries
- US$5.50 for upper middle-income countries
- US$22.70 for high-income countries.
Using the US$1.90 per person a day poverty threshold, the CEN-SAD region had a poverty rate of 28.2% in 2019, 6.6 percentage points below Africa's average of 34.8%. By 2043, CEN-SAD’s poverty rate will have dropped to 18.2%, 2.7 percentage points below Africa’s average. The percentage reduction is significant but in absolute terms an extra 20.3 million people is expected to be extremely poor by 2043 due to rapid population growth.
Poverty is a major problem in a number of CEN-SAD’s members. Three countries at the US$3.20 per person a day poverty threshold, Nigeria, São Tomé and Príncipe and Benin, had poverty rates above 70%, which worsened even further in 2020 due to the COVID-19 pandemic. The only country which will likely eradicate extreme poverty at the appropriate poverty level designated by its World Bank income group by 2043 is The Gambia, achieving a rate below 3% in 2040. In the Current Path forecast, Senegal will see the largest reduction in its US$3.20 poverty rate compared to 2019 levels, with a decline of 33 percentage points by 2043.
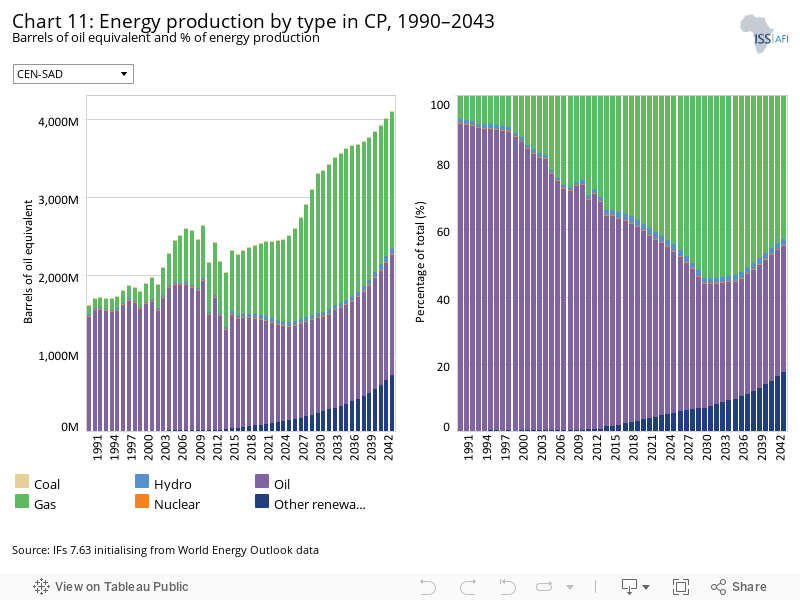
The IFs platform forecasts six types of energy, namely oil, gas, coal, hydro, nuclear and other renewables. To allow comparisons between different types of energy, the data is converted into billion barrels of oil equivalent (BBOE). The energy contained in a barrel of oil is approximately 5.8 million British thermal units (MBTUs) or 1 700 kilowatt-hours (kWh) of energy.
The majority of CEN-SAD’s energy production comes from oil: in 2019, oil accounted for 58% of total energy produced, while gas was second at 37%. The energy mix is projected to gradually move towards gas and other renewables, excluding hydro. In 2043, gas would account for 43% of total energy produced, followed by oil at 38% and other renewables at 18%, a 15 percentage point increase from 3% in 2019.
The scale of energy production varies greatly between CEN-SAD’s members, with multiple countries producing little to no energy of their own due to the lack of natural resources or small land area, such as the island states of São Tomé and Príncipe and Comoros. Nigeria is the dominant force in terms of energy production, accounting for over 50% of total energy production in 2019. Nigeria’s share is projected to grow slightly from 53.4% in 2019 to 55.2% in 2043, with oil’s contribution dropping from 66.5% to 45.5%.
Kenya is projected to lead the way in terms of producing energy through renewable resources: in 2019, it produced the most renewable energy, 53 million BOE, and by 2043 production would have nearly quadrupled to 209 million BOE, constituting 98.1% of the country’s total energy production.
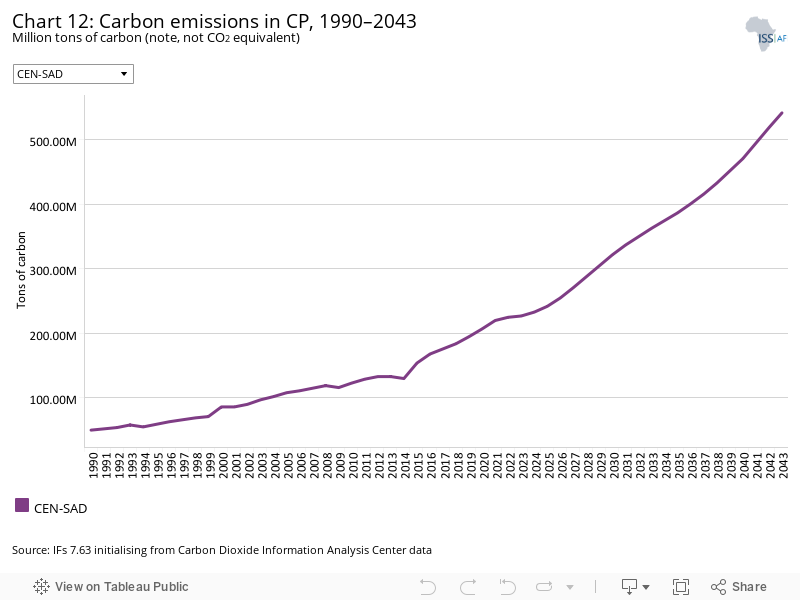
Carbon is released in many ways, but the three most important contributors to greenhouse gases are carbon dioxide (CO2), carbon monoxide (CO) and methane (CH4). Since each has a different molecular weight, IFs uses carbon. Many other sites and calculations use CO2 equivalent.
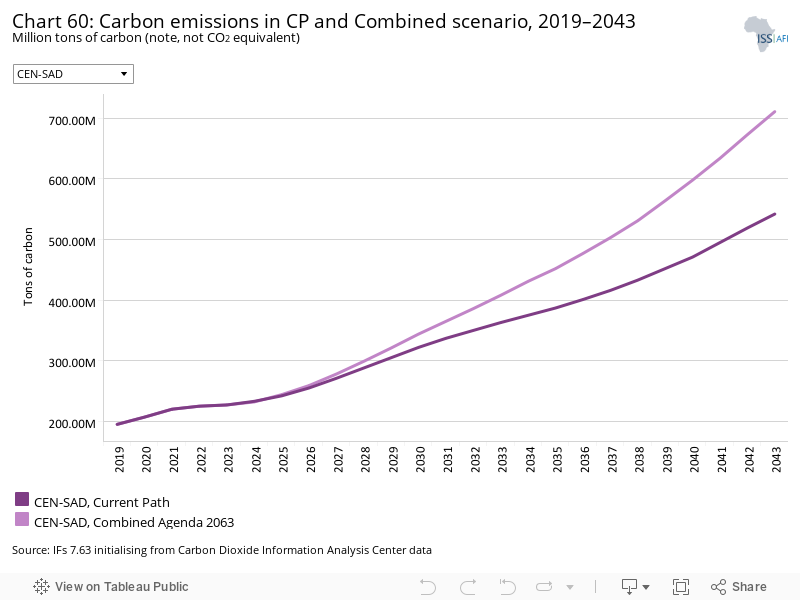
CEN-SAD’s carbon emissions increased by 290% between 1990 and 2019, and is projected to increase by 178% between 2019 and 2043, reaching 542 million tons of carbon emissions by 2043 in the Current Path forecast. The continued increase is a consequence of the projected growth of the economies of CEN-SAD’s members.
On an individual level, Egypt was the largest emitter in 2019, but will be overtaken by Nigeria before 2043, due to the latter’s projected economic growth over the forecast horizon. In 2019, Egypt emitted 67.7 million tons of carbon compared to Nigeria’s 39.3 million tons, but by 2043, Nigeria is expected to emit 198.1 million tons compared to Egypt’s 150 million tons.
The divergence in economic size between CEN-SAD’s members, discussed in Chart 5, informs the sizable discrepancy in carbon emissions: Nigeria and Egypt combined accounted for 55.9% of emissions in 2019, rising to 64.2% in 2043. No other individual country is projected to emit more than 6% of the REC’s total carbon emissions by 2043.
Sectoral Scenarios for CEN-SAD
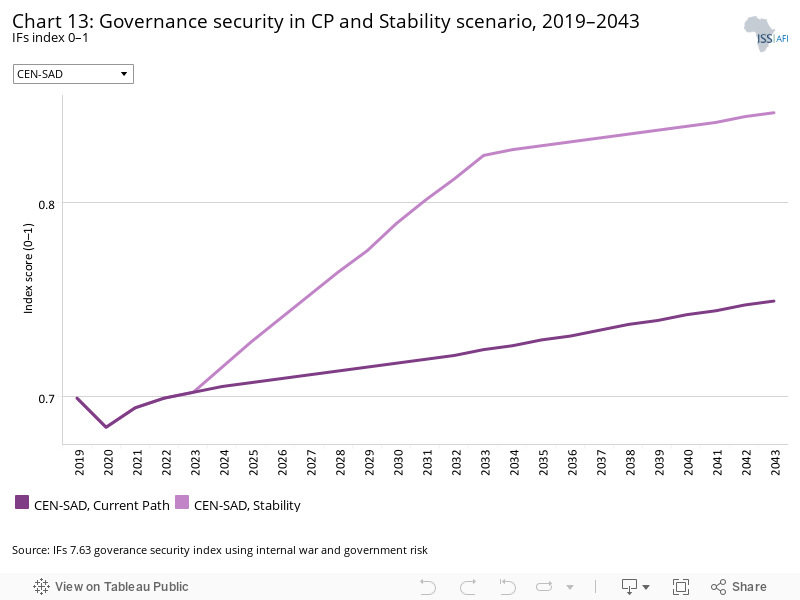
Download to pdfThe Stability scenario represents reasonable but ambitious reductions in risk of regime instability and lower levels of internal conflict. Stability is generally a prerequisite for other aspects of development and this would encourage inflows of foreign direct investment (FDI) and improve business confidence. Better governance through the accountability that follows substantive democracy is modelled separately.
The intervention is explained here in the thematic part of the website.
IFs governance security index ranges from 0 (low security) to 1 (high security). CEN-SAD’s score on the index is expected to rise from 0.7 in 2019 to 0.85 by 2043 in the Stability scenario, an increase of 0.1 above the Current Path forecast of 0.75 for the same year. The average for Africa in the Current Path forecast will be 0.74 by 2043.
Somalia will see the biggest increase from 2019 to 2043, as its score rises by 53.5% in the Stability scenario. The large increase comes from the lowest base among CEN-SAD’s members, which is due to the continued terrorist activity that hampers Somalia’s development and stability. The Central African Republic (CAR) and Sudan will also see sizable increases above 30% by 2043, while on the other end of the spectrum, Tunisia would see the lowest increase, as it comes from a very high base of 0.85 in 2019.
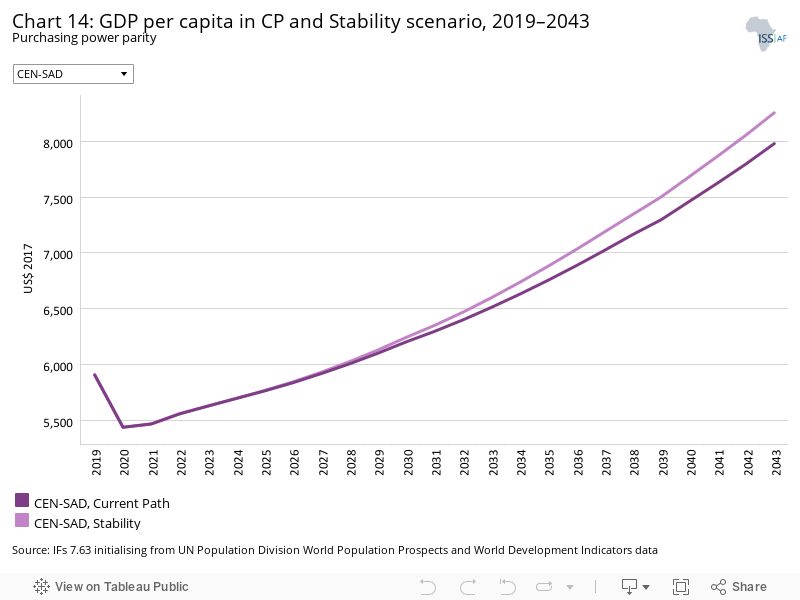
The Stability scenario increases CEN-SAD’s GDP per capita by US$ 275 above the Current Path forecast for 2043, increasing the gap to Africa’s average from US$622 in 2019 to US$1 096 in 2043.
Guinea, Somalia and CAR will experience the largest increases compared to their Current Path forecasts, with Guinea seeing a nearly 9% increase. Stable countries such as Ghana, Egypt and Tunisia will see small increases below 3%.
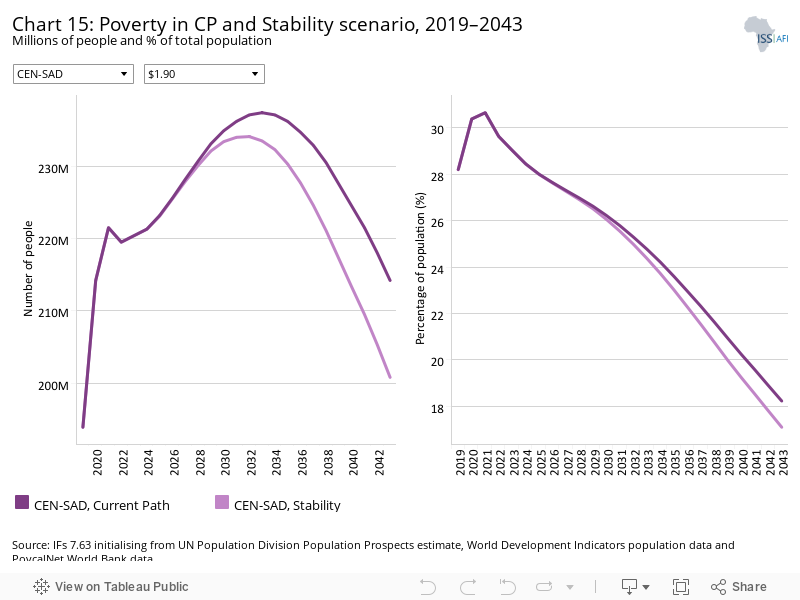
The Stability scenario reduces CEN-SAD’s poverty rate by 1.9 percentage points compared to the Current Path forecast for 2043, a decline which equates to 22.5 million fewer people being extremely poor.
Somalia will see the largest decline in its poverty rate by 2043, experiencing a drop of 6.3 percentage points compared to the Current Path forecast. This is understandable given that conflict and political instability are among the leading causes of poverty in Somalia. CAR will continue to struggle with extreme poverty as its poverty rate will still be 64.4% in 2043 despite the scenario reducing the rate by 3.9 percentage points compared to the Current Path forecast.
This section presents the impact of a Demographic scenario that aims to hasten and increase the demographic dividend through reasonable but ambitious reductions in the communicable-disease burden for children under five, the maternal mortality ratio and increased access to modern contraception.
The intervention is explained here in the thematic part of the website.
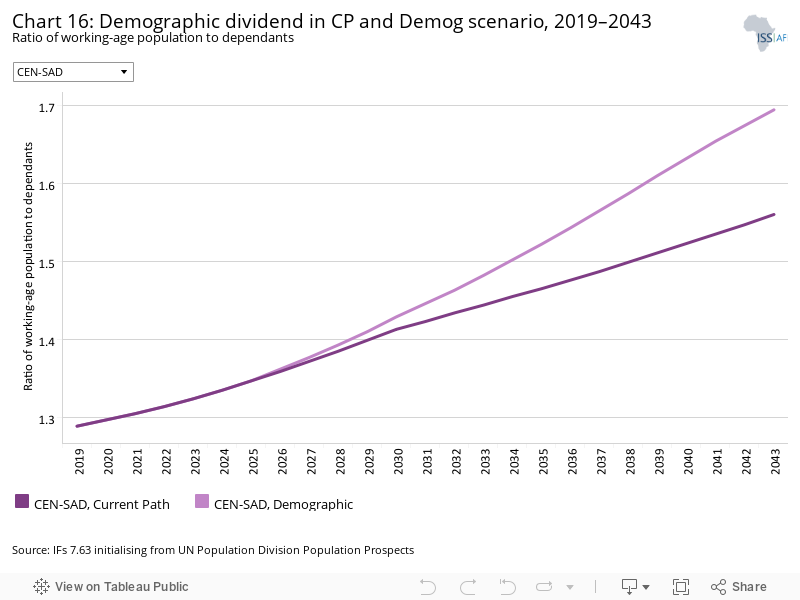
Demographers typically differentiate between a first, second and even a third demographic dividend. We focus here on the contribution of the size of the labour force (between 15 and 64 years of age) relative to dependants (children and the elderly) as part of the first dividend. A window of opportunity opens when the ratio of the working-age population to dependants is equal to or surpasses 1.7.
On the Current Path, CEN-SAD will likely not reach the minimum ratio of 1.7 persons of the working-age population for each dependant across the forecast horizon. The ratio of the working-age population to dependants is forecast to only reach 1.56 by 2043, an increase of 0.27 compared to 2019. In the Demographic scenario however, the regional economic community (REC) is projected to reach 1.69 by 2043, thus entering a demographic dividend post the forecast horizon. This crucial stage of development must be accompanied by improved educational outcomes to ensure the larger cohort of working-age population citizens are properly skilled to find gainful employment.
Five countries, Cape Verde, Djibouti, Libya, Egypt and Tunisia, were already in a period of demographic dividend in 2019, and will continue to be by 2043, thus the Demographic scenario does not have a noticeable impact. There are however four countries who will greatly benefit from the scenario’s interventions: Comoros, São Tomé and Príncipe, Senegal and Sierra Leone will all enter a demographic dividend period five or more years earlier than in the Current Path forecast. The scenario not only hastens the onset of this period, but also increases the maximum size of the ratio across the forecast horizon. Kenya’s largest ratio will be 0.4 higher than in the Current Path forecast, while Egypt’s is expected to be 0.3 larger.
The infant mortality rate is the number of infant deaths per 1 000 live births and is an important marker of the overall quality of the health system in a country.
CEN-SAD’s rate of infant mortality is projected to decline significantly from its very high level of 49.5 deaths per 1 000 live births in 2019 to 22.8 deaths by 2043 in the Demographic scenario, 5.7 deaths below the Current Path forecast. Africa’s Current Path forecast for 2043 is 25.6 — 2.8 deaths per 1 000 live births above CEN-SAD’s projected rate in the Demographic scenario.
In 2019, 41% of CEN-SAD’s members had an infant mortality rate above Africa’s of 46.8 deaths per 1 000 live births. CAR’s was the highest at 81 deaths per 1 000 live births. In the Demographic scenario, by 2043 only CAR, Nigeria and Chad will be above Africa’s Current Path forecast rate of 25.6.
Compared to its 2019 level, Niger is projected to see the largest percentage decline by 2043, as its infant mortality rate falls by 77.2% in the Demographic scenario. Compared to their Current Path forecast for 2043, Guinea and Somalia will see the largest declines of over 23% in the Demographic scenario.
In the Demographic scenario, CEN-SAD’s GDP per capita is forecast to be US$8 171 by 2043, US$193, or 2.4%, larger than the Current Path forecast in the same year.
Kenya will see the largest increase, 4.7%, above its Current Path forecast for 2043, while Morocco, Cape Verde, Tunisia and Libya would all experience increases below 1%. The relatively lower infant mortality rates, and small population size in the case of Cape Verde, means the scenario has a muted effect on average incomes for these countries.
CEN-SAD’s poverty rate will only decline by an extra 0.7 percentage points in the Demographic scenario compared to the Current Path forecast by 2043 — a drop equal to 15.7 million people. The poverty rates for the scenario and the Current Path forecast will remain the same until 2033, when the Demographic scenario starts to take effect.
The Demographic scenario will have the largest effect on Liberia’s and Sierra Leone’s poverty rates, decreasing them by more than 2 percentage points by 2043 compared to the Current Path forecast. Three countries, Morocco, Cape Verde and Tunisia, see almost no reduction in their poverty rates at the US$3.20 per person per day threshold.
This section presents reasonable but ambitious improvements in the Health/WaSH scenario, which include reductions in the mortality rate associated with both communicable diseases (e.g. AIDS, diarrhoea, malaria and respiratory infections) and non-communicable diseases (NCDs) (e.g. diabetes), as well as improvements in access to safe water and better sanitation. The acronym WaSH stands for water, sanitation and hygiene.
The intervention is explained here in the thematic part of the website.
The life expectancy for CEN-SAD was 67 years in 2019 and is expected to increase to 74.1 years in the Health/WaSH scenario by 2043, 0.9 years more than the Current Path forecast. Africa’s average life expectancy by 2043 in the Current Path forecast will be 72.1 years, 2 years below CEN-SAD’s life expectancy in the Health/WaSH scenario. The gap between CEN-SAD’s female and male life expectancy is projected to increase from 3.3 years in 2019 to 4.1 years in 2043 in the Health/WaSH scenario.
Tunisia is projected to have the highest life expectancy at 80.8 years by 2043 in the Health/WaSH scenario, remaining the country with the highest life expectancy from 2019. CAR will continue to be the country with the lowest life expectancy at 61.4 years by 2043, but will see the largest percentage increase of 19.9% in the Health/WaSH scenario over the forecast horizon. Relative to its fellow CEN-SAD members, Niger will benefit greatly from the Health/WaSH scenario, as it ranks 13th highest for life expectancy in 2043 compared to 20th in 2019. Mali will also jump 7 places from 17th to 10th by 2043, while Comoros drops eight places from 11th to 19th.
The infant mortality rate for CEN-SAD is projected to decline from 49.5 in 2019 to 24.8 by 2043 in the Health/WaSH scenario, a reduction which places it below Africa’s Current Path forecast average of 25.6 for 2043.
The country which will see the largest decrease in the Health/WaSH scenario is CAR, whose infant mortality is projected to decrease from 81 deaths per 1 000 live births in 2019 to 30.7 deaths by 2043. The North African countries of Libya, Tunisia, Morocco and Egypt see the lowest decreases, together with Cape Verde, due to their rates already being under control in 2019.
The Agriculture scenario represents reasonable but ambitious increases in yields per hectare (reflecting better management and seed and fertiliser technology), increased land under irrigation and reduced loss and waste. Where appropriate, it includes an increase in calorie consumption, reflecting the prioritisation of food self-sufficiency above food exports as a desirable policy objective.
The intervention is explained here in the thematic part of the website.
The data on yield per hectare (in metric tons) is for crops but does not distinguish between different categories of crops.
CEN-SAD’s average crop yields per hectare will rise by 75% from 4 tons per hectare in 2019 to 7 tons per hectare by 2043 in the Agriculture scenario. The increase would put the REC 2.1 tons per hectare above the Current Path forecast for 2043. The country with the highest average crop yields per hectare in 2019 was Egypt with 29.3 tons per hectare, with the lowest being Niger with 0.8 tons per hectare. By 2043 in the Agriculture scenario, Djibouti would have the highest average yields per hectare at 41.4 tons per hectare, 14.6 tons per hectare higher than its Current Path forecast, with Egypt ranking second with 32.2 tons per hectare, 4.2 tons per hectare higher than its Current Path forecast. There is a large discrepancy between the size of these two countries however, and Egypt produces more in absolute terms, only behind Nigeria whose total agricultural production is the highest for CEN-SAD members.
CEN-SAD had a food security situation comparable to Africa’s average, whose net agricultural imports as a per cent of agricultural demand equalled 12.2% in 2019 compared to Africa’s 10.9%. The Agriculture scenario will dramatically alter the course of the REC’s dependence on food imports: by 2043, the agricultural imports dependence will be 14.5% of total demand compared to 37.5% in the Current Path forecast, translating to a much more manageable food security situation.
Individually, the degree to which countries can provide for their own citizens differs markedly: Djibouti imported almost all of its food in 2019, with a rate of 97%, while Côte d’Ivoire had a surplus equivalent to 1% of total demand. By 2043, nine countries, Comoros, Libya, Guinea, Côte d’Ivoire, Burkina Faso, Togo, Ghana, Guinea-Bissau and Morocco, will have an agricultural surplus, with the highest being Morocco at 29% of total demand. All nine will have agricultural surplus by 2043 in the Current Path forecast.
The Agriculture scenario is projected to have a robust impact on CEN-SAD’s average GDP per capita, increasing the average income by US$414 in 2043 compared to the Current Path forecast. CEN-SAD’s GDP per capita in the Agriculture scenario is US$1 235 above Africa’s Current Path forecast average for 2043.
Multiple countries would benefit greatly from an agricultural revolution, with Guinea-Bissau, Chad and Sierra Leone experiencing increases in their GDP per capita above 15% for 2043 compared to the Current Path forecast. Djibouti is the only country which would see no increase, as it lacks arable land and mostly depends on food imports to meet food consumption demands. Improvement in agriculture production in Djibouti will require heavy investment in climate-smart technologies and productivity-enhancing farming methods, given the harsh dry climate and limited arable land. This may reduce investment in other sectors with high growth potential, negatively affecting GDP growth and lowering GDP per capita. In other words, it will likely be a trade-off between food security and economic growth in Djibouti.
The Agriculture scenario reduces CEN-SAD’s poverty rate by 3.9 percentage points compared to the Current Path forecast for 2043, a decline which equates to 46.2 million fewer people being extremely poor. The scenario will have the greatest impact on poverty rates of all the scenarios discussed, mostly due to 48% of CEN-SAD’s labour force being employed in the agriculture sector in 2019.
The two countries which will see the largest declines in their respective poverty rates are Guinea-Bissau and Sierra Leone, with decreases of 15 percentage points by 2043 compared to the Current Path forecast for that same year. Their robust performance is explained by agriculture adding the majority of value as a percentage of GDP in 2019. Liberia will experience a significant drop from its 2019 level of 62.9%, reaching 21.3% by 2043 in the Agriculture scenario, a decrease of 41.7 percentage points.
The Education scenario represents reasonable but ambitious improved intake, transition and graduation rates from primary to tertiary levels and better quality of education. It also models substantive progress towards gender parity at all levels, additional vocational training at secondary school level and increases in the share of science and engineering graduates.
The intervention is explained here in the thematic part of the website.
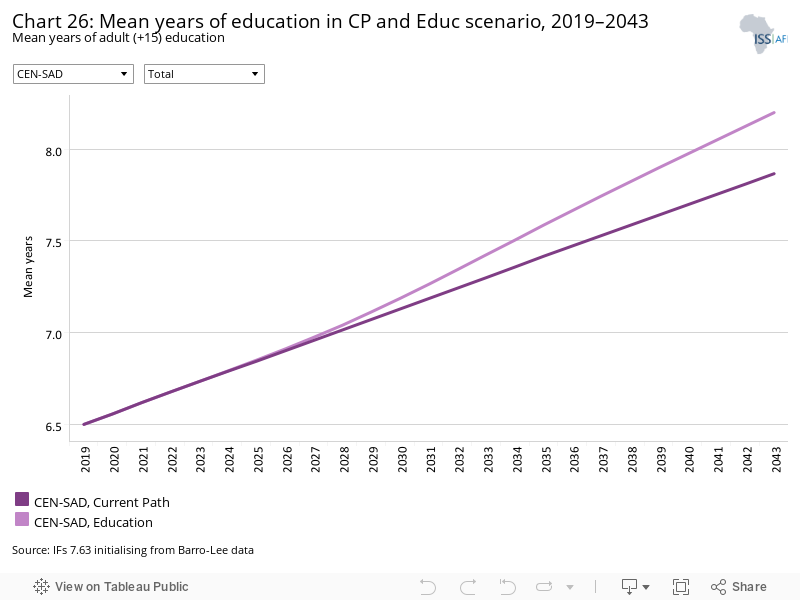
CEN-SAD’s average years of adult education, combining male and female years, was 6.5 in 2019, and is projected to climb to 7.9 years by 2043 in the Current Path forecast, while in the Education scenario average years of education would reach 8.2. Africa’s average years of education was 6.2 in 2019, and will be 7.6 years by 2043 in the Current Path forecast.
Individually, Libya had the highest mean years of education in 2019 at 8.9 years and will continue to lead the way by 2043 in the Education scenario, reaching 10.8 years. Niger had the lowest mean years of education in 2019 with 2.7, but it will more than double to reach 5.5 years in the Education scenario, 0.7 years more than in the Current Path forecast. Nigeria will see the smallest increase between 2019 and 2043 in the Education scenario, as its average years of education only rises by 1.1 years and improves on the Current Path forecast for 2043 by just 0.3 years.
The difference between female and male average years of education is a problem among CEN-SAD’s members, with only two countries having education in favour of the female population in 2019 — Libya and Mali. In the Education scenario, only three countries will have such a gap by 2043 — Libya, Cape Verde and São Tomé and Príncipe. The average gap for CEN-SAD does however decrease in the Education scenario, from 1.4 years in 2019 to 1 year in 2043. Still, action must be taken to ensure gender parity in education is reached to increase female participation in the economy and reduce the rate of population growth.
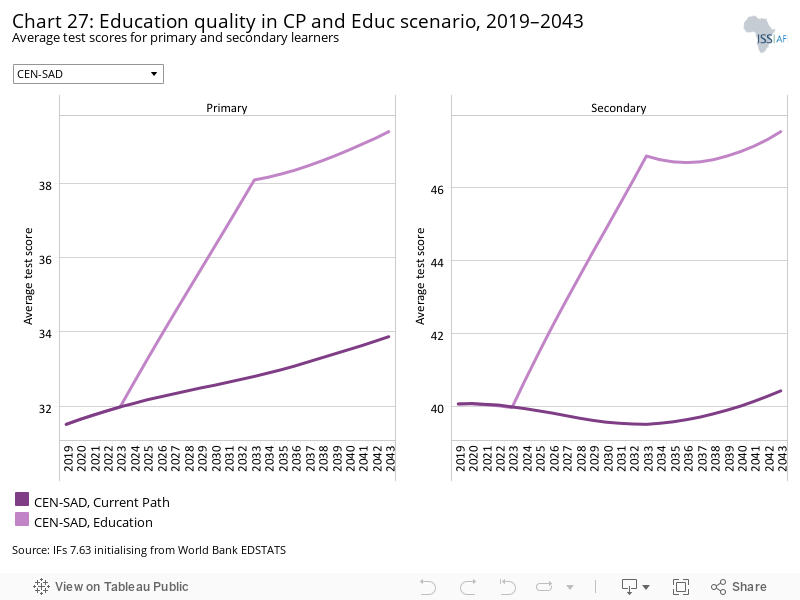
The average test scores for learners at primary and secondary level serve as a proxy for education quality. CEN-SAD’s average test score at primary level was 31.5 in 2019 and 40.1 at secondary level, and is projected to increase marginally to 33.9 and 40.4, respectively, by 2043 in the Current Path forecast. The Education scenario significantly improves on this performance, increasing the primary level score to 39.4 and the secondary level score to 47.5 by 2043, increases of 5.5 and 7.1, respectively.
The country with the highest average between primary and secondary level test score in 2019 was Tunisia with an average score of 41.4. In the Education scenario, Libya will have the highest average of 55.6 by 2043, 6.4 higher than its projected score in the Current Path forecast for the same year. Chad’s average score was the lowest in 2019 at 29.6 and will continue to be the lowest ranked country by 2043, with an average score of 31.5. This does however represent progress, as the Current Path forecast projected Chad’s average score decreasing by 2.8 between 2019 and 2043.
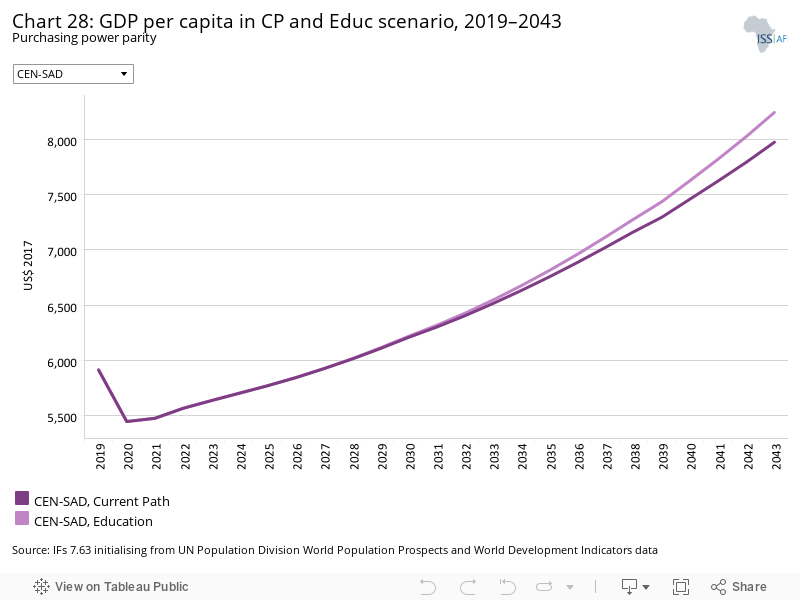
CEN-SAD’s GDP per capita will increase by US$270 in the Education scenario in 2043 compared to the Current Path forecast — a 3.4% rise which will increase its gap to Africa’s Current Path forecast average to US$1 091.
Guinea, Niger, Eritrea and Senegal will all experience increases above 4% compared to their Current Path forecasts for 2043, while Libya, Tunisia and Morocco will see the smallest increases, due to their relatively higher scores for education quality.
The Education scenario reduces CEN-SAD’s poverty rate by 1.5 percentage points compared to the Current Path forecast for 2043, a decline which equates to 18 million fewer people being extremely poor. Senegal will see a significant reduction of 3.3 percentage points in its poverty rate by 2043, compared to the Current Path forecast.
The Manufacturing/Transfers scenario represents reasonable but ambitious manufacturing growth through greater investment in the economy, investments in research and development, and promotion of the export of manufactured goods. It is accompanied by an increase in welfare transfers (social grants) to moderate the initial increases in inequality that are typically associated with a manufacturing transition. To this end, the scenario improves tax administration and increases government revenues.
The intervention is explained here in the thematic part of the website.
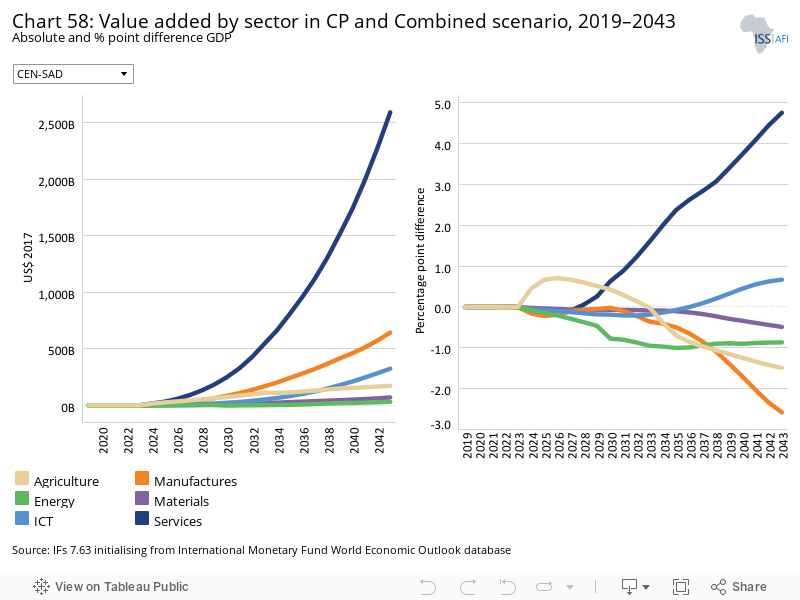
Chart 30 should be read with Chart 8 that presents a stacked area graph on the contribution to GDP and size, in billion US$, of the Current Path economy for each of the sectors.
The Manufacturing/Transfers scenario increases the size of the manufacturing sector as a proportion of GDP by 0.4 percentage points, an increase which equates to an additional US$136.3 billion by 2043 compared to the Current Path forecast. The service sector far outstrips this however, adding an extra US$303 billion in value by 2043 compared to the Current Path forecast.
The scenario projects Ghana and Chad will increase the sizes of their manufacturing sectors by a 1 percentage point of GDP or more compared to the Current Path forecast by 2043, while six countries, Egypt, Niger, Togo, Somalia, Mali and Guinea, will see a slight decline. The structural shift towards manufacturing and services means agriculture’s value added will constitute less a percentage of total value added. All but two countries, Libya and Djibouti, will see a reduction in their agriculture sectors, with the largest coming from Chad at 1.5 percentage points in 2043 compared to the Current Path forecast.
The Manufacturing/Transfers scenario increases government welfare transfers to unskilled workers used as a proxy for the poor to tackle the increased poverty which is usually associated with the early stages of industrialisation. Industrialisation is generally funded by an initial crunch in consumption which increases poverty in the first few years. However, these efforts stimulate inclusive growth with a greater impact on poverty alleviation in the long term.
CEN-SAD is projected to spend 46.8% more on these welfare transfers by 2043 in the Manufacturing/Transfers scenario, seeing a rise from US$215.3 billion in 2019 to US$316.1 billion in 2043.
Egypt led the way in 2019, spending US$26.5 billion on welfare transfers to unskilled works. The country is projected to spend 261% more by 2043 in the Manufacturing/Transfers scenario, a rise which improves on the Current Path forecast for the same year by US$31.6 billion.
The scenario is projected to increase Eritrea’s welfare transfers the most compared to the Current Path forecast for 2043, with the country seeing an increase of 89.9%. Six other countries, CAR, Somalia, Niger, Guinea, Togo and Sierra Leone will also see an increase above 80%.
The Manufacturing/Transfers scenario increases CEN-SAD’s GDP per capita by US$548 in 2043 compared to the Current Path forecast. CEN-SAD’s GDP per capita in the Manufacturing/Transfers scenario is US$1 369 above Africa’s Current Path forecast average for 2043.
Senegal and Nigeria will experience increases above 8% in 2043 compared to the Current Path forecast, while Libya will see a small rise of 0.9%. The scenario has large potential to increase average incomes, with three countries, Senegal, Djibouti and Ghana, projected to move above Africa’s Current Path forecast average for 2043. They are projected to be below this average in the Current Path forecast.
The Manufacturing/Transfers scenario reduces CEN-SAD’s poverty rate by 2.2 percentage points by 2043 compared to the Current Path forecast, a decline equal to 26.1 million fewer people being extremely poor. The increased welfare transfers from the government aimed at mitigating the increased poverty which is generally associated with the early stages of industrialisation helps with poverty reduction.
Somalia will see the largest decrease in its poverty rate compared to the Current Path forecast with a 5.9 percentage point reduction by 2043. The Manufacturing/Transfers scenario will also bring Morocco and Tunisia within touching distance of eradicating extreme poverty at the US$3.20 per day benchmark, with Tunisia’s poverty rate equalling 3.1% and Morocco’s 4% by 2043. The two West African countries of Côte d’Ivoire and Ghana perform relatively worse when compared to other countries with similar poverty rates in 2019, as they will only see decreases of 11.2 and 10 percentage points by 2043, respectively, whereas Kenya and Comoros would see drops of 29.1 and 22.5 percentage points, respectively.
The Leapfrogging scenario represents a reasonable but ambitious adoption of and investment in renewable energy technologies, resulting in better access to electricity in urban and rural areas. The scenario includes accelerated access to mobile and fixed broadband and the adoption of modern technology that improves government efficiency and allows for the more rapid formalisation of the informal sector.
The intervention is explained here in the thematic part of the website.
Fixed broadband includes cable modem Internet connections, DSL Internet connections of at least 256 KB/s, fibre and other fixed broadband technology connections (such as satellite broadband Internet, ethernet local area networks, fixed-wireless access, wireless local area networks, WiMAX, etc.).
CEN-SAD’s fixed broadband subscriptions are projected to increase to 47 per 100 people by 2043 in the Leapfrogging scenario — 20.5 subscriptions more than in the Current Path forecast for the same year. This growth is impressive, as it comes from a low base of 3.1 subscriptions in 2019. Increased Internet access has multiple and varied benefits, as it reduces transaction costs, optimises supply chains with positive effect on productivity.
The REC’s members are expected to see massive percentage increases in fixed broadband subscriptions per 100 in the Current Path forecast, progress upon which the Leapfrogging scenario builds to further increased fixed broadband Internet access. Nigeria will see the biggest increase in 2043 between the Current Path forecast and the Leapfrogging scenario, with a 105% increase. Senegal, Côte d’Ivoire, Kenya, Chad, Sudan and Eritrea will also experience increases above 100%. Libya will see almost no impact from the Leapfrogging scenario as the country will almost reach the level of saturation at 50 subscriptions per 100 people on the Current Path forecast.
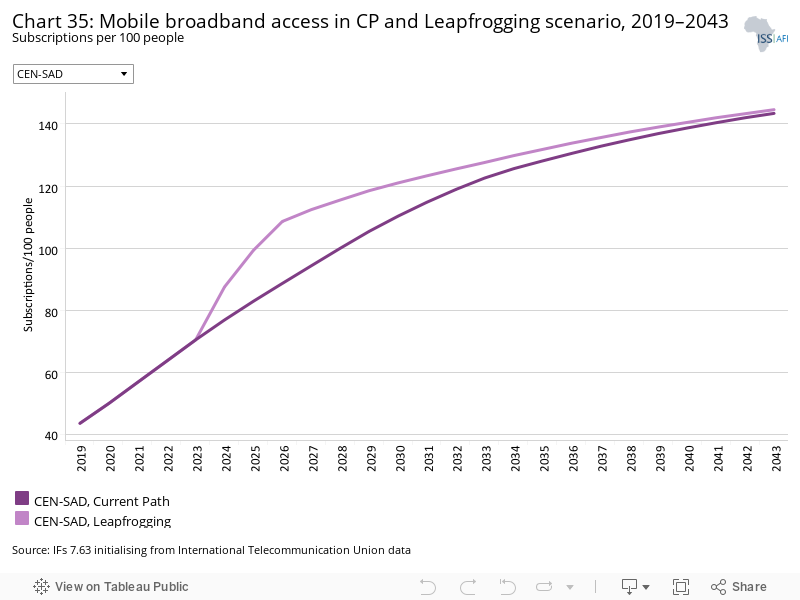
Mobile broadband refers to wireless Internet access delivered through cellular towers to computers and other digital devices.
The benefits of Internet access are more easily attained through mobile telephones and smartphones, which are considerably cheaper than fixed-line solutions. In general, Africa has turned to mobile phone technology to bypass the high costs associated with implementing fixed-line infrastructure. Importantly, forecasts in IFs are limited due to the model considering subscription rates of 150 per 100 people as the saturation level.
CEN-SAD’s mobile subscriptions per 100 people are expected to rise from 43.6 in 2019 to 144.6 by 2043 in the Leapfrogging scenario, which is a marginal improvement from 143.4 in the Current Path forecast for the same year. The REC will maintain its gap to Africa’s average between 2019 and 2043: in 2019, the difference was 3.1 subscriptions and by 2043 in the Leapfrogging scenario, the gap will be 2.8 compared to Africa’s Current Path forecast.
Ghana had the most mobile subscriptions at 102.5 per 100 people in 2019, but in the Leapfrogging scenario by 2043, Libya will have the most subscriptions at 158.4 per 100 people. The effect of the scenario on subscriptions is to push most countries to the saturation point of 150 subscriptions per 100 people, meaning there will be little variance between individual members by 2043. Eritrea however is an outlier, only reaching 89.5 subscriptions per 100 people by 2043 in the Leapfrogging scenario, although the country does come from a very low base of 5.9 subscriptions in 2019. Comoros comes from a lower level of 5.7 but reaches 138.2 subscriptions per 100 people by 2043 in the Leapfrogging scenario.
Access to electricity means households can enjoy the benefits of clean cooking methods, lighting to study and it is needed for them to access the Internet. CEN-SAD’s total electricity access rate was 61.1% in 2019, which is projected to increase to 85.9% in the Leapfrogging scenario by 2043, 9.7 percentage points higher than the Current Path forecast for the same year.
CEN-SAD’s urban electricity access rate is much higher than its rural electricity access rate. In 2019, the gap was 30.8 percentage points and is expected to decrease to 22.5 percentage points by 2043 in the Current Path forecast. In the Leapfrogging scenario, however, the difference will narrow to 11.8 percentage points by 2043, a reduction of 10.7 percentage points.
The four North African countries of Tunisia, Morocco, Egypt and Libya were the only CEN-SAD members to have total electricity access rates above 90% in 2019, but in the Leapfrogging scenario, almost 50% of the REC’s members will have access rates above that mark. Furthermore, only one country, Chad, will have an access rate below 50% by 2043, while in 2019, 14 countries had an access rate below 50%. The largest increase between the Current Path forecast and the Leapfrogging scenario in 2043 will be Guinea’s increase, projected at 16.1 percentage points.
CEN-SAD’s GDP per capita is US$8 421 will be the Leapfrogging scenario in 2043, US$443 larger than the Current Path forecast in the same year. CEN-SAD’s GDP per capita in the scenario is US$1 264 above Africa’s Current Path forecast average, and translates to a 42% improvement compared to 2019.
Somalia and Mali are projected to experience increases above 12% compared to their Current Path forecast for 2043, with both benefiting from substantial increases in total electricity access. Libya, Tunisia and Morocco will all see small increases in their GDP per capita, due mainly to their already high levels of electricity access.
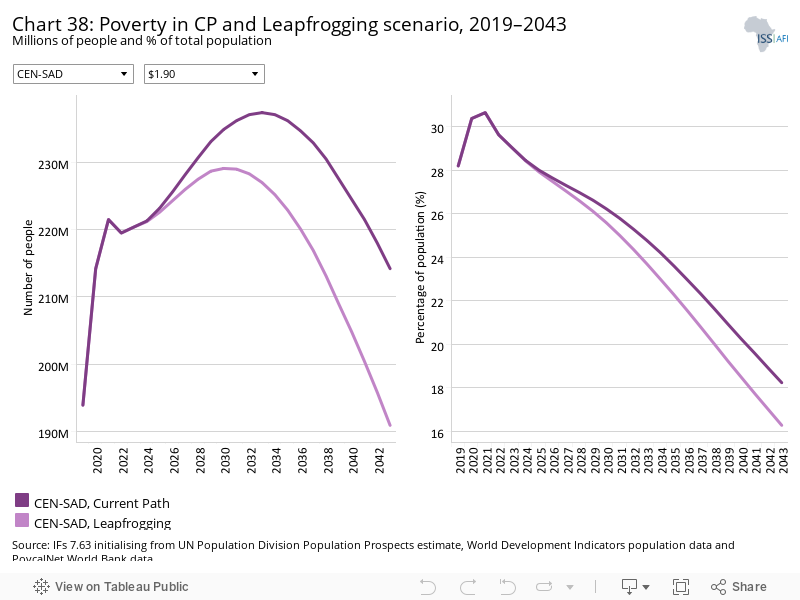
In the Leapfrogging scenario, CEN-SAD’s poverty rate will be 16.3% by 2043 — 2.2 percentage points lower than the Current Path forecast, a decline that equals 23.3 million fewer people being extremely poor. Out of all CEN-SAD’s members, Mali performs particularly well, seeing a 5.4 percentage point reduction by 2043 compared to the Current Path forecast for the same year. Countries such as Tunisia and Morocco, where electricity access is already high, will see small decreases below half a percentage point.
The Free Trade scenario represents the impact of the full implementation of the African Continental Free Trade Area (AfCFTA) by 2034 through increases in exports, improved productivity and increased trade and economic freedom.
The intervention is explained here in the thematic part of the website.
The trade balance is the difference between the value of a country’s exports and its imports. A country that imports more goods and services than it exports in terms of value has a trade deficit, while a country that exports more goods and services than it imports has a trade surplus.
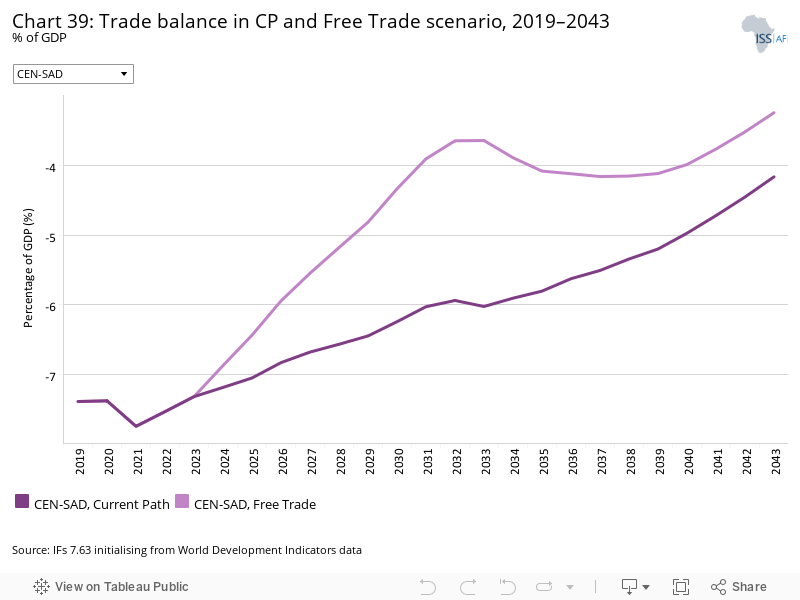
The Free Trade scenario spurs on CEN-SAD’s exports and imports, and thus does not significantly affect the REC’s trade balance: the trade deficit is projected to increase from 7.4% of GDP in 2019 to 3.3% by 2043 in the Free Trade scenario, 0.9 percentage lower than in the Current Path forecast. Exports however increase significantly, rising by 70.7% in 2043 compared to the Current Path forecast, while imports will rise by 60.3% in the Free Trade scenario. The lifting of non-trade barriers and reduction in tariffs will increase trade going in and out of countries, as consumers and businesses alike can more easily source inputs and goods at prices lower than local prices. The scenario will also increase manufacturing exports for the REC, rising by 6.1 percentage points in 2043 compared to the Current Path forecast.
The Free Trade scenario will see five countries, Libya, Côte d’Ivoire, Sudan, Eritrea and Nigeria, having trade surpluses by 2043, compared to three in the Current Path forecast. However, 24 countries will see their trade balances worsen in the Free Trade scenario, but all 29 countries will see an increase in their exports by 2043, with Djibouti experiencing a 23.1 percentage point increase compared to the Current Path forecast, the largest of all CEN-SAD’s members.
Trade liberalisation increases productivity through technology diffusion and competition. Thus, the Free Trade scenario is particularly effective in spurring growth and income per capita. The Free Trade scenario increases CEN-SAD’s GDP per capita the most out of all the scenarios discussed. In 2043, the CEN-SAD’s GDP per capita in the Free Trade scenario was US$791 larger than the Current Path forecast and US$1 612 higher than Africa’s Current Path forecast average.
São Tomé and Príncipe will benefit greatly from the increased trade that the scenario envisages under the AfCFTA, as its GDP per capita is expected to rise by 14.3% compared to the Current Path forecast for 2043. The liberalisation of trade boosts all CEN-SAD members’ GDP per capita significantly, with only Libya expected to experience an increase below 5%.
Trade openness will reduce poverty in the long term after initially increasing it due to the redistributive effects of trade. Most African countries export primary commodities and low-tech manufacturing products, and therefore a continental free trade agreement (AfCFTA) that reduces tariffs and non-tariff barriers across Africa will increase competition among countries in primary commodities and low-tech manufacturing exports. Countries with inefficient, high-cost manufacturing sectors might be displaced as the AfCFTA is implemented, thereby pushing up poverty rates. In the long term, as the economy adjusts and produces and exports its comparatively advantaged (lower relative cost) goods and services, poverty rates will decline.
After increasing the poverty rate above the Current Path forecast between 2024 and 2032, the Free Trade scenario reduces CEN-SAD’s poverty rate below the Current Path such that by 2043, the poverty rate in the Free Trade scenario is 2.6 percentage points lower than the Current Path forecast. This is equivalent to 31.1 million fewer people being extremely poor. By 2043, the Free Trade scenario will have the second greatest impact on poverty rates of all the scenarios discussed.
Sierra Leone will benefit the most from the increased trade the scenario envisages, seeing a 10 percentage point drop in its poverty rate by 2043 when compared to the Current Path forecast. CAR’s poverty rate will only drop by 8.8 percentage points from 2019 to 2043 in the Free Trade scenario, a small decrease given its very high base of 73.9% in 2019.
The Financial Flows scenario represents a reasonable but ambitious increase in worker remittances and aid flows to poor countries, and an increase in the stock of foreign direct investment (FDI) and additional portfolio investment inflows to middle-income countries. We also reduced outward financial flows to emulate a reduction in illicit financial outflows.
The intervention is explained here in the thematic part of the website.
CEN-SAD’s dependence on foreign aid was comparable to Africa in 2019, with the REC receiving foreign aid equal to 2.2% of GDP compared to Africa’s 2.4%. Aid flows to the CEN-SAD area declined to 1.9% of GDP in 2020 due to the COVID-19 pandemic and its associated economic crisis. In the Financial Flows scenario, by 2043, aid to CEN-SAD as a percentage of GDP will decline slightly to 0.9%, the same level as projected in the Current Path forecast. Africa’s Current Path forecast for 2043 is 1.2%, similar to the REC’s level. In absolute terms, foreign aid to CEN-SAD will be 4.7% higher by 2043 in the Financial Flows scenario compared to the Current Path forecast.
As African economies grow over the forecast horizon, foreign aid as a percentage of GDP is projected to decline, but in absolute terms aid is expected to grow and result in CEN-SAD’s members still being dependent on foreign assistance to alleviate poverty. The Financial Flows scenario adds to this trend, increasing the value of aid in all but seven countries: São Tomé and Príncipe, Ghana, Tunisia, Libya, Côte d’Ivoire, Mauritania and Nigeria. As a percentage of GDP, only Sierra Leone is projected to see an increase above 1 percentage point by 2043 in the Financial Flows scenario.
Foreign direct investment is an effective way for African countries to finance their economic development, especially fixed, long-term investment, and increase their participation in the global economy. FDI flows to CEN-SAD, as a percentage of GDP, were just above Africa’s average in 2019 at 3% and are expected to maintain the gap in the Financial Flows scenario at 0.2 percentage points by 2043. In absolute terms, the REC’s FDI is projected to be 15.4% higher by 2043 in the Financial Flows scenario compared to the Current Path forecast.
The effect of the scenario is minimal across the board, with the highest increase between the Current Path forecast and the scenario by 2043 coming from Liberia at 2.2 percentage points. In absolute terms however, the increase is more impressive: in 2043, Liberia will see its FDI inflows rise by 27.6%, or US$522 million, in the scenario compared to the Current Path forecast. Nigeria will experience the largest increase in absolute terms, at US$7.6 billion by 2043.
CEN-SAD is a net receiver of remittances, equating to 2.9% of GDP in 2019, and dropping to 2.6% in 2043 in the Financial Flows scenario, 0.3 percentage points higher than in the Current Path forecast. In absolute terms, remittances will however rise over this period, from US$47.6 billion in 2019 to US$128.8 billion in 2043 — US$17.4 billion more than in the Current Path forecast.
This increase is driven largely by Nigeria, which has a large diaspora, as the country will see its remittances rising from US$22.4 billion in 2019 to US$93.9 billion by 2043 in the Financial Flows scenario, US$9.6 billion more than in the Current Path forecast. Percentage point wise, Comoros will see the largest increase between the scenario and the Current Path forecast, rising by 1 percentage point in 2043. At the other end of the spectrum, Libya, Côte d’Ivoire and Mauritania will see their outflow of remittances increase in 2043, with the largest increase of 82.9% coming from Libya.
The Financial Flows scenario only marginally improves CEN-SAD’s GDP per capita, raising it by US$177 compared to the Current Path forecast for 2043. The small increase, however, widens the gap over Africa’s Current Path forecast average to US$993, up from US$622 in 2019.
Liberia is the only country to significantly benefit from the scenario’s interventions, seeing a 9.1% increase in its GDP per capita compared to its Current Path forecast for 2043. The outstanding performance is due to the Financial Flows scenario addressing the lack of financial investments needed to improve human capital and access the technology required to convert abundant natural resources into value-added goods. The rest of CEN-SAD’s members will see increases between 1% and 3%; only Sierra Leone and Togo achieve an increase above 3%.
Overall, the Financial Flows scenario has a modest impact on CEN-SAD’s GDP per capita. In contrast to FDI, external financial flows such as remittances and aid do not have a clear relationship with economic growth. Also, although it is diversifying into manufacturing and service sectors, FDI to CEN-SAD goes mainly to the extractives sector which has little connection with the other sectors of the economy.
CEN-SAD’s poverty rate will only decline by an extra 0.8 percentage points in the Financial Flows scenario compared to the Current Path forecast by 2043, a drop equal to 10.2 million people. The weak effect is driven by small decreases for most of CEN-SAD’s members, except for Liberia. The country will see a substantial drop of 6.8 percentage points by 2043 when compared to the Current Path forecast, nearly double the amount of Sierra Leone in second place.
The Infrastructure scenario represents a reasonable but ambitious increase in infrastructure spending across Africa, focusing on basic infrastructure (roads, water, sanitation, electricity access and ICT) in low-income countries and increasing emphasis on advanced infrastructure (such as ports, airports, railway and electricity generation) in higher-income countries.
Note that health and sanitation infrastructure is included as part of the Health/WaSH scenario and that ICT infrastructure and more rapid uptake of renewables are part of the Leapfrogging scenario. The interventions there push directly on outcomes, whereas those modelled in this scenario increase infrastructure spending, indirectly boosting other forms of infrastructure, including those supporting health, sanitation and ICT.
The intervention is explained here in the thematic part of the website.
Electricity access is crucial for economic growth, enabling a country’s population to access more advanced productive processes. It is needed too for high speed Internet connections and to improve healthcare outcomes. In the Infrastructure scenario, CEN-SAD’s total electricity access is projected to rise from 61.1% in 2019 to 80.1% in 2043, 3.9 percentage points more than the Current Path forecast for that same year. Urban access will rise from 78.3% to 89.5%, while rural access will rise considerably from 47.5% to 70.1% between 2019 and 2043.
In the Infrastructure scenario, only nine countries in CEN-SAD are projected to have electricity access levels above 90% by 2043, and four countries will reach 100% access in 2043 — Tunisia, Morocco, Libya and Egypt. The gap between CEN-SAD’s urban and rural electricity access rates drops from 30.8 percentage points in 2019 to 19.4 percentage points by 2043, 3.1 percentage points less than in the Current Path forecast.
CEN-SAD’s rural access increases by 10 percentage points, but Chad will continue to struggle in the Infrastructure scenario, only reaching a rural electricity access rate of 18.8% by 2043, 1.9 percentage points higher than in the Current Path forecast.
Indicator 9.1.1 in the Sustainable Development Goals refers to the proportion of the rural population who live within 2 km of an all-season road and is captured in the Rural Access Index.
The Rural Access Index reflects how connected the rural population is to urban centres and thus how easily they can access larger markets and better services. CEN-SAD’s score in the Rural Access Index was above Africa’s average in 2019, with 55.8% of its rural population having reliable access to urban centres compared to Africa’s 53%. The Infrastructure scenario builds on and magnifies the positive trend projected in the Current Path forecast, as the REC’s Rural Access Index score reaches 62.9% in 2043, 1.2 percentage points above the Current Path forecast.
Wide disparities exist between countries within CEN-SAD: the REC’s only upper middle-income country, Libya, had the highest score in 2019 at 90.7%, while Chad had a score of 16.1%, with Mali not far ahead on 17.5%. Access in Mali and Chad is projected to marginally improve in the Infrastructure scenario to 32.9% and 24.5%, respectively, while Libya would reach 100% access by 2043. The Gambia will see the largest percentage point increase between its Current Path forecast and the Infrastructure scenario projection for 2043, with a rise of 5.5 percentage points. Nigeria will see the smallest increase of 0.5 percentage points, only reaching 62.2% by 2043 in the Infrastructure scenario.
The Infrastructure scenario increases CEN-SAD’s GDP per capita by US$146 compared to the Current Path forecast for 2043. In 2043, CEN-SAD’s GDP per capita was US$967 larger than the Africa’s Current Path forecast average.
Several countries are expected to benefit substantially from the scenario’s interventions: Guinea, Burkina Faso and Côte d’Ivoire will all see increases above 6% compared to their Current Path forecasts. Five countries, Kenya, Egypt, Libya, Ghana and Nigeria, will only see increases of 1%.
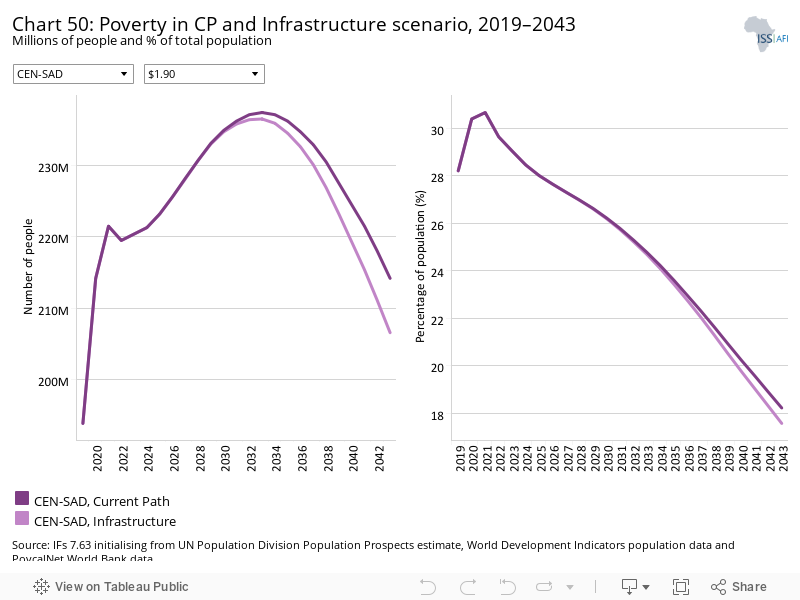
The Infrastructure scenario has a limited effect on poverty, reducing CEN-SAD’s average poverty rate at US$1.90 by 0.6 percentage points compared to the Current Path forecast for 2043. The reduction equated to 7.6 million fewer people being extremely poor, and means the REC’s poverty rate of 17.6% will be 3.3 percentage points below Africa’s Current Path forecast average.
Côte d’Ivoire is expected to see the largest decline in its poverty rate at 3.4 percentage points at the US$3.20 poverty line, while the North African states of Libya, Tunisia and Morocco see minimal reductions due their already low projected poverty levels in the Current Path forecast.
The Governance scenario represents a reasonable but ambitious improvement in accountability and reduces corruption, and hence improves the quality of service delivery by government.
The intervention is explained here in the thematic part of the website.
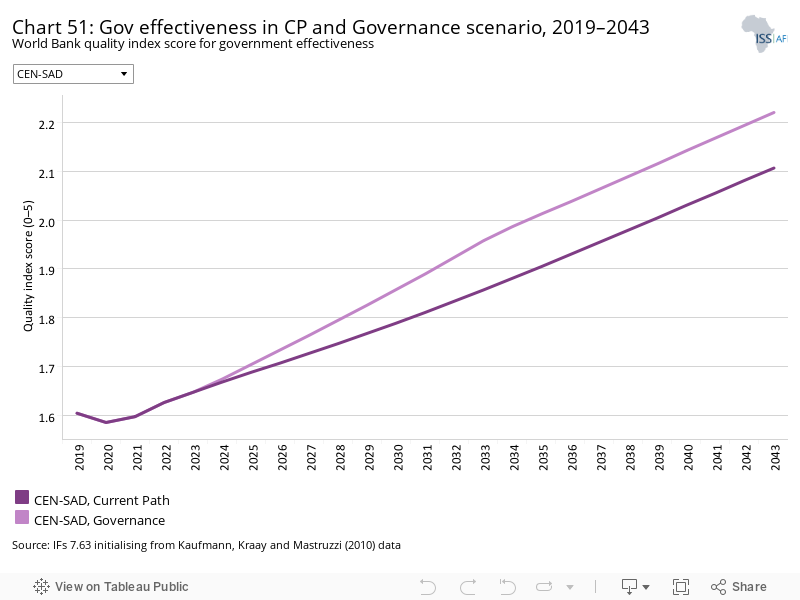
As defined by the World Bank, government effectiveness ‘captures perceptions of the quality of public services, the quality of the civil service and the degree of its independence from political pressures, the quality of policy formulation and implementation, and the credibility of the government’s commitment to such policies’.
Chart 51 presents the impact of the interventions in the Governance scenario on government effectiveness
Corruption in Africa has historically weighed heavily on growth and development, stymied investment and hampered service delivery. Increasing governments’ abilities to serve their citizens effectively and efficiently in a responsible manner remains a crucial factor in alleviating poverty on the continent. CEN-SAD’s score on the World Bank governance effectiveness index was below Africa’s score of 1.74 in 2019, with the REC scoring 1.6. The index is scored out of 5. CEN-SAD’s performance is expected to improve in the Governance scenario, reaching 2.2 by 2043, but this would only match Africa’s Current Path forecast for the same year.
The level of governance effectiveness varies considerably between CEN-SAD’s members: Cape Verde and Morocco are the only two countries who score more than 2.5, or 50%, on the index, while CAR and Somalia score less than a point, with 0.8 and 0.4, respectively. By 2043, the Governance scenario has helped increase the number of countries who achieve a score above 2.5 to 10, 4 more than there would have been in the Current Path forecast. The largest increases are expected to come from Eritrea and Sudan, who see a rise of 0.3 in 2043 compared to the Current Path forecast for the same year.
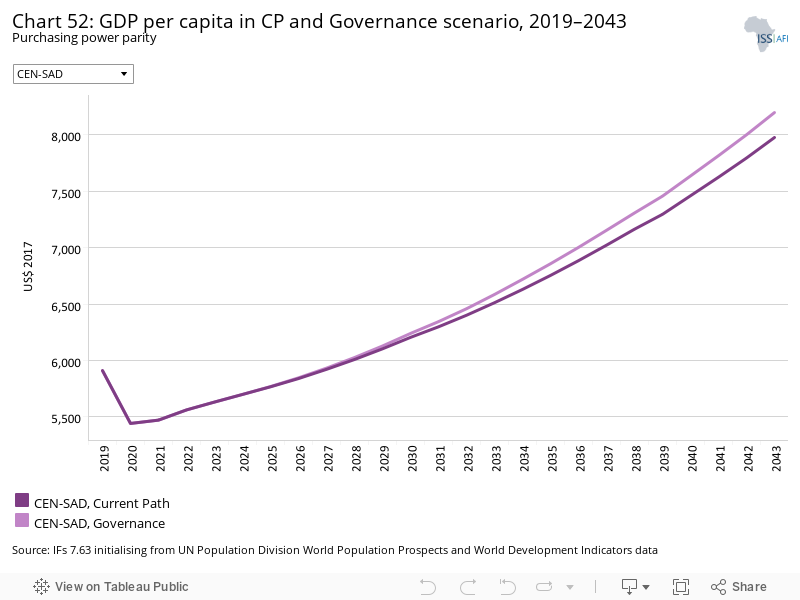
CEN-SAD’s average GDP per capita is expected to increase by US$221 above its Current Path forecast for 2043 — a 3% rise that increases the REC’s average GDP per capita US$1 042 above Africa’s Current Path forecast to US$8 199 in the same year.
Mali would benefit the most from increased transparency and improved government effectiveness, experiencing a 4.3% increase in its GDP per capita for 2043 compared to the Current Path forecast. Libya and Cape Verde would both see increases of just 1%.
The Governance scenario reduces CEN-SAD’s poverty by 0.7 percentage points compared to the Current Path forecast for 2043. This equates to 9 million fewer poor people in the Governance scenario than in the Current Path forecast. The poverty rate in the Governance scenario in 2043 is more than 10 percentage points lower than its level of 28.2% in 2019.
Mali would see the largest reduction in its poverty rate, in line with the effect that the scenario has on average incomes. The country will see a 2.3 percentage point drop in its poverty rate — a reduction equating to 900 000 fewer people being extremely poor at the US$1.90 poverty line. As before, the North African states of Libya, Tunisia and Morocco are expected to see large decreases in poverty in the Current Path forecast, and thus the scenario has little impact on their poverty rates.
This section presents projections for carbon emissions in the Current Path for CEN-SAD and the 11 scenarios. Note that IFs uses carbon equivalents rather than CO2 equivalents.
All the scenarios increase economic growth and thus lead to increased carbon emissions for CEN-SAD. In 2043, the Free Trade scenario will increase carbon emissions the most compared to the Current Path forecast, followed by the Manufacturing/Transfers and Agriculture scenarios.
The Demographic scenario causes carbon emissions to decrease due to a smaller total population by 2043. The reduction of population growth reduces population pressure on the utilisation of resources and hence minimises environmental degradation.
The Leapfrogging scenario is unique in that it increases GDP per capita the third most out of all scenarios in 2043 but ranks second from bottom in terms of increasing carbon emissions. The scenario highlights the potential benefits of adopting renewable energy generation and increased access to fixed and mobile broadband, both for the environment and average incomes.
Individually, the Free Trade scenario leads to the most emissions for most CEN-SAD members, although Sierra Leone will emit the most in the Leapfrogging scenario and Egypt in the Manufacturing/Transfers scenario by 2043. The single largest increase will stem from the Free Trade scenario’s impact on Nigeria, with a rise of 19.7 million tons of carbon in 2043 compared to the Current Path forecast.
The Combined Agenda 2063 scenario consists of the combination of all 11 sectoral scenarios presented above, namely the Stability, Demographic, Health/WaSH, Agriculture, Education, Manufacturing/Transfers, Leapfrogging, Free Trade, Financial Flows, Infrastructure and Governance scenarios. The cumulative impact of better education, health, infrastructure, etc. means that countries get an additional benefit in the integrated IFs forecasting platform that we refer to as the synergistic effect. Chart 55 presents the contribution of each of these 12 components to GDP per capita in the Combined Agenda 2063 scenario as a stacked area graph.
The Free Trade scenario is projected to have the largest positive impact on CEN-SAD's GDP per capita. The scenario would add US$791 to the regional economic community’s (REC) Current Path forecast for 2043, followed by the Manufacturing/Transfers increase of US$548 and the Leapfrogging scenario increase of US$444. The synergistic effect of implementing all 11 scenario’s interventions simultaneously is US$923, highlighting the importance of a holistic approach to development.
Individually, CEN-SAD’s members mostly follow the same pattern, with the Free Trade scenario leading to the largest percentage increases for most countries. The Agriculture scenario provides the biggest increase for nine countries, Togo, Mauritania, Guinea-Bissau, Burkina Faso, Chad, Liberia, Sierra Leone, Niger and the Central African Republic (CAR), while the Leapfrogging scenario raises Somalia’s and Mali’s GDP per capita the most. Egypt’s highest increase comes from the Manufacturing/Transfers scenario, the only country to do so.
Whereas Chart 55 presents a stacked area graph on the contribution of each scenario to GDP per capita as well as the additional benefit or synergistic effect, Chart 56 presents only the GDP per capita in the Current Path forecast and the Combined Agenda 2063 scenario.
The Combined Agenda 2063 scenario which combines all the 11 scenario interventions will have a dramatic impact on GDP per capita for CEN-SAD. In the Combined Agenda 2063 scenario, it is assumed that the Governments of CEN-SAD member countries make a concerted effort to remove the binding constraints to growth and development. In 2043, the CEN-SAD’s GDP per capita is projected to be US$4 470 higher than the Current Path forecast — an increase of 56%.
CEN-SAD’s members will make remarkable progress in catching up with Africa’s Current Path forecast average GDP per capita for 2043: ten members, Guinea-Bissau, Senegal, Côte d’Ivoire, Benin, Kenya, The Gambia, Comoros, Sudan, Mauritania, Ghana and Djibouti, will all have a higher GDP per capita than Africa’s US$7 157 in 2043 in the Combined Agenda 2063 scenario, where they would not have done in the Current Path forecast. Guinea-Bissau does particularly well, nearly doubling its Current Path forecast to reach US$7 867 in 2043.
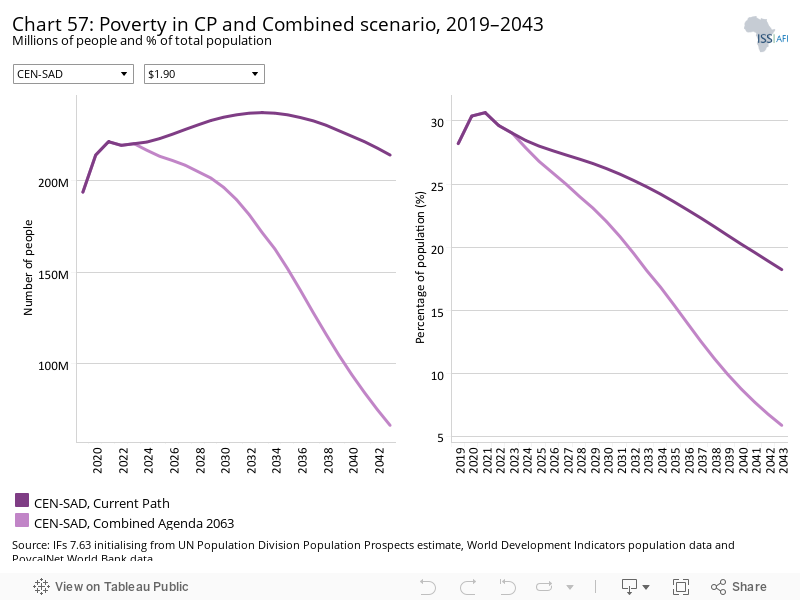
The Combined Agenda 2063 scenario’s full implementation would enable CEN-SAD to dramatically reduce poverty. The poverty rate in the Combined Agenda 2063 scenario is 5.9% in 2043, 12.3 percentage points below the Current Path forecast of 18.2% for the same year. The reduction would equate to 147.9 million fewer people being extremely poor at the US$1.90 poverty line in 2043 compared to the Current Path forecast.
Individually, there are wide discrepancies in how effective the Combined Agenda 2063 scenario will be, with Sierra Leone expected to see a 32 percentage point reduction in its poverty rate for 2043, while Tunisia and Morocco, countries where poverty is already low, see reductions below 5 percentage points.
CAR’s poverty rate will remain stubbornly high at 43% in 2043, despite a 25 percentage point reduction compared to the Current Path forecast. Three other countries, Nigeria, São Tomé and Príncipe and Benin, will still have poverty rates above 30%, in spite of reductions above 20 percentage points. The continued struggle to alleviate poverty in these countries, in spite of the Combined Agenda 2063 scenario’s extensive interventions, highlights how poverty is ingrained in these countries and the scale of the challenge they face. Other CEN-SAD members fare better however, as six countries (Eritrea, Guinea, Niger, Sudan, Morocco and Tunisia) will eliminate extreme poverty by 2043 due to the Combined Agenda 2063 scenario’s interventions.
See Chart 8 to view the Current Path forecast of the sectoral composition of the economy.
The service sector will grow significantly in the Combined Agenda 2063 scenario compared to the Current Path forecast: by 2043, CEN-SAD’s services will add an additional 4.8 percentage points in value added over the Current Path figure of 56.8%. The share of manufacturing in GDP in contrast will shrink by 2.6 percentage points compared to the Current Path forecast for 2043, but both will increase in terms of absolute values. Services will add an extra US$2.6 trillion, while manufacturing is projected to add US$643.1 billion over its Current Path forecast; ICT will grow by US$323.7 billion.
Djibouti, Burkina Faso and Guinea-Bissau are the only countries who do not follow this trend; the value added by services as a proportion of GDP declines by 6.7, 2.1 and 1 percentage point, respectively, in 2043. Eritrea on the other hand pivots sharply towards services, which adds an additional 11.5 percentage points of total value added, while its manufacturing sector shrinks by 11.3 percentage points in 2043. Djibouti and Liberia in contrast will see their manufacturing sectors add 7.7 and 6.7 percentage points, respectively, more to total value added in Combined Agenda 2063 scenario by 2043.
The effect of the Combined Agenda 2063 scenario on the CEN-SAD GDP is impressive. In 2043, the size of the CEN-SAD economy is forecast to grow to US$8.7 trillion by 2043 — 78.3% higher than the Current Path forecast.
Guinea-Bissau, CEN-SAD’s third smallest economy in 2019, is projected to see the biggest increase in 2043 compared to the Current Path forecast, growing by 123% to reach US$16.4 billion. Nigeria is also expected to benefit greatly from the Combined Agenda 2063 scenario: the economy is expected to grow by 91.7% in 2043 compared to the Current Path forecast. The Nigerian economy will also constitute 43.4% of CEN-SAD’s combined GDP, 3.1 percentage points more than in the Current Path forecast.
The Combined Agenda 2063 scenario is projected to significantly increase economic activity for CEN-SAD, which in turn will lead to an increase in the amount of carbon the REC emits. In 2043, CEN-SAD is expected to emit 711 million tons of carbon in the Combined Agenda 2063 scenario, an increase of 31.2% compared to the Current Path forecast. The need for development is great but must be balanced against environmental concerns.
The economies of Nigeria and Egypt are forecast to undergo sizable expansions in the Combined Agenda 2063 scenario, meaning their total carbon emissions will jump significantly too. In 2043, Nigeria will emit 288.7 million tons of carbon, 45.8% more than in the Current Path forecast, while Egypt will emit 176.5 million tons, a smaller rise of 17.7%. The same relationship between GDP growth and an increase in carbon emissions holds for most of CEN-SAD’s members, with a few exceptions: Ghana is projected to see a 68.9% increase in GDP but only a 5.7% increase in carbon emissions in 2043. Chad, on the other hand, will see a 104% increase in GDP, but must manage a 71.9% increase in carbon emissions.
It is important to note that the total carbon emissions, as a percentage of Africa and the world’s carbon emissions, is still small; however, the implementation of the Combined Agenda 2063 scenario, should be accompanied by concrete steps for climate change adaptation and mitigation.
Page information
Contact at AFI team is Du Toit McLachlan
This entry was last updated on 25 June 2024 using IFs v7.63.
Donors and sponsors


Reuse our work
- All visualizations, data, and text produced by African Futures are completely open access under the Creative Commons BY license. You have the permission to use, distribute, and reproduce these in any medium, provided the source and authors are credited.
- The data produced by third parties and made available by African Futures is subject to the license terms from the original third-party authors. We will always indicate the original source of the data in our documentation, so you should always check the license of any such third-party data before use and redistribution.
- All of our charts can be embedded in any site.
Cite this research
Du Toit McLachlan (2025) CEN-SAD. Published online at futures.issafrica.org. Retrieved from https://futures.issafrica.org/geographic/recs/cen-sad/ [Online Resource] Updated 25 June 2024.