 Upper middle-income Africa
Feedback welcome
Our aim is to use the best data to inform our analysis. See our Technical page for information on the IFs forecasting platform. We appreciate your help and references for improvements via our feedback form.
In this entry, we first describe the Current Path forecast for upper middle-income Africa as it is expected to unfold to 2043, the end of the third ten-year implementation plan of the African Union’s Agenda 2063 long-term vision for Africa. The Current Path in the International Futures (IFs) forecasting model initialises from country-level data that is drawn from a range of data providers. We prioritise data from national sources.
The Current Path forecast is divided into summaries on demographics, economics, poverty, health/WaSH and climate change/energy. A second section then presents a single positive scenario for potential improvements in stability, demographics, health/WaSH, agriculture, education, manufacturing/transfers, leapfrogging, free trade, financial flows, infrastructure, governance and the impact of various scenarios on carbon emissions. With the individual impact of these sectors and dimensions having been considered, a final section presents the impact of the Combined Agenda 2063 scenario.
We generally review the impact of each scenario and the Combined Agenda 2063 scenario on gross domestic product (GDP) per person and extreme poverty except for Health/WaSH that uses life expectancy and infant mortality.
The information is presented graphically and supported by brief interpretive text.
All US$ numbers are in 2017 values.
Summary
- Current Path forecast
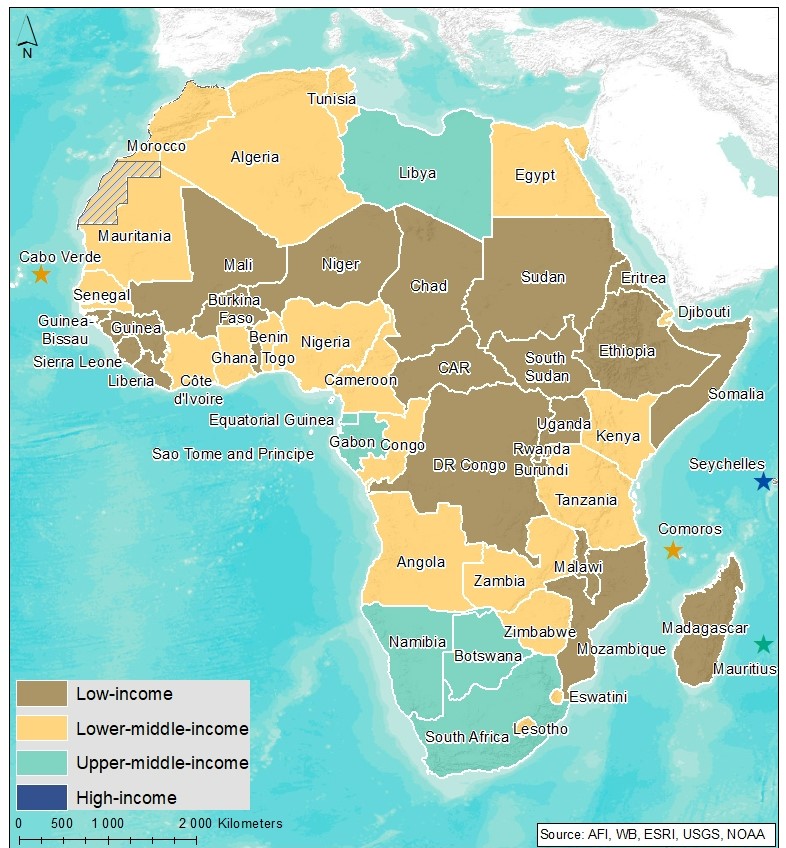
- Upper middle-income Africa is an income group comprising seven countries, namely Mauritius, South Africa, Botswana, Namibia, Equatorial Guinea, Gabon and Libya, that have a gross national income per capita between US$4 096 and US$12 695 (as of July 2021). Jump to forecast: Current Path
- The population of upper middle-income Africa is set to increase by 17 million people, resulting in a population of 91.4million people by 2043, up from 74.9 million in 2019. It will experience an increase in life expectancy from 64.7 years in 2019 to 70 years by 2043, and a drop in fertility rates from 2.5 live births per woman in 2019 to 2 live births per woman by 2043. At the same time, the income group will have predominantly urban settlements with an urbanisation rate of 68.4% in 2019, set to increase to 77.6% by 2043. Jump to Demographics: Current Path
- The income group is expected to experience aggressive GDP growth from US$675.5 billion in 2019 to a US$1.2 trillion economy by 2043. It will experience an increase in GDP per capita from US$14 235, reaching US$17 734 per capita by 2043, and its informal sector contribution to GDP will increase, expanding the informal labour force from 20.8% in 2019 to 35.2% by 2043. Jump to Economics: Current Path
- Upper middle-income Africa sees poverty rates decreasing marginally, dropping to 42.7% by 2043, down from 48.7% in 2019. However, 2.2 million more people will be classified as extremely poor in 2043 compared to 2019. Jump to Poverty: Current Path
- Carbon emissions are set to decline from 165 million metric tons in 2019 to 156 million metric tons in 2043. South Africa is the largest single emitter in the group — 80% of emissions are from South Africa alone. In 2043, South Africa’s carbon emissions will decline to 70%, while Libya, the second largest emitter, will see its contribution of carbon emissions increase from 15% in 2019 to 18% in 2043. Jump to Carbon emissions/Energy: Current Path
- Sectoral scenarios
- In the Stability scenario, the proportion of people in extreme poverty will decrease to about 39% by 2043, compared to 42.7% in the Current Path forecast for the same year. Jump to Stability scenario
- The Demographic scenario will see only a marginal increase in GDP per capita of US$55 above the Current Path forecast in 2043. Jump to Demographic scenario
- In the Health/WaSH scenario, life expectancy will increase by 1.6 years compared to the Current Path forecast by 2043. Jump to Health/WaSH scenario
- The Agriculture scenario has the potential to reduce net agricultural import dependency to 15.86% from 20.66% in the Current Path forecast; however, upper middle-income Africa will continue to be a net agricultural importer. Jump to Agriculture scenario
- The Education scenario will raise the average GDP per capita to US$18 149, up from US$17 734 in the Current Path by 2043. Jump to Education scenario
- The Manufacturing/Transfers scenario will result in a 1.81 percentage point decline in extreme poverty compared to the Current Path forecast, resulting in 1.67 million fewer people living in poverty by 2043. Jump to Manufacturing/Transfers scenario
- The Leapfrogging scenario has the potential to drastically improve electricity access from 82.3% in 2019 to 98.2% by 2043, 11.09 percentage points above the Current Path forecast. Jump to Leapfrogging scenario
- In the Free Trade scenario, GDP per capita is expected to increase to US$18 824 by 2043, compared to a per capita income of US$17 734 in the Current Path forecast. Jump to Free Trade scenario
- In the Financial Flows scenario, foreign direct investment (FDI) inflows will represent 3.8% of GDP by 2043, compared to the Current Path forecast of 3.2% of GDP during the same period. Jump to Financial Flows scenario
- The Infrastructure scenario will positively influence rural accessibility, and by 2043 85.2% of the rural population will have access to an all-weather road, compared to 84.5% in the Current Path forecast. Jump to Infrastructure scenario
- In the Governance scenario, the number of people in poverty will reduce to 35.6 million people compared to 36.3 million in the Current Path by 2043. Jump to Governance scenario
- In 2043, upper middle-income Africa will release the most carbon in the Free Trade scenario (161 million tons), followed by the Manufacturing/Transfers scenario (160 million tons). Jump to the Impact of scenarios on carbon emissions
- Combined Agenda 2063 scenario
- Carbon emissions in upper middle-income Africa are set to increase by an additional 11 million tons by 2043 compared to the Current Path forecast. A significant increase in GDP per capita is expected, reaching US$21 985 by 2043 — an increase of US$4 251 per capita from the Current Path forecast, and aggressive economic growth reaching GDP (MER) of US$1 576.6 billion by 2043. In the Combined Agenda 2063 scenario, extreme poverty decreases drastically to 33% by 2043, compared to the Current Path forecast of 39.7% in 2019. Jump to Combined Agenda 2063 scenario
All charts for Upper middle-income Africa
- Chart 1: Political map of Upper middle-income Africa
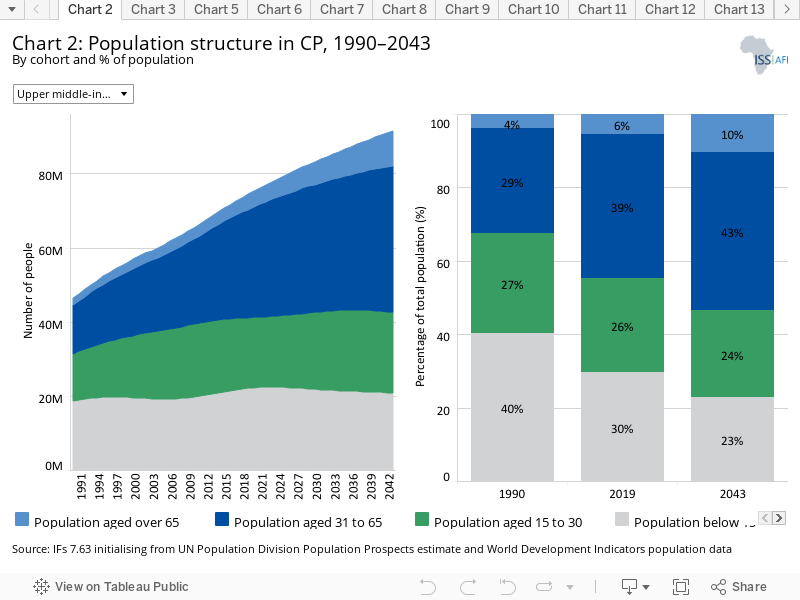
- Chart 2: Population structure in CP, 1990–2043
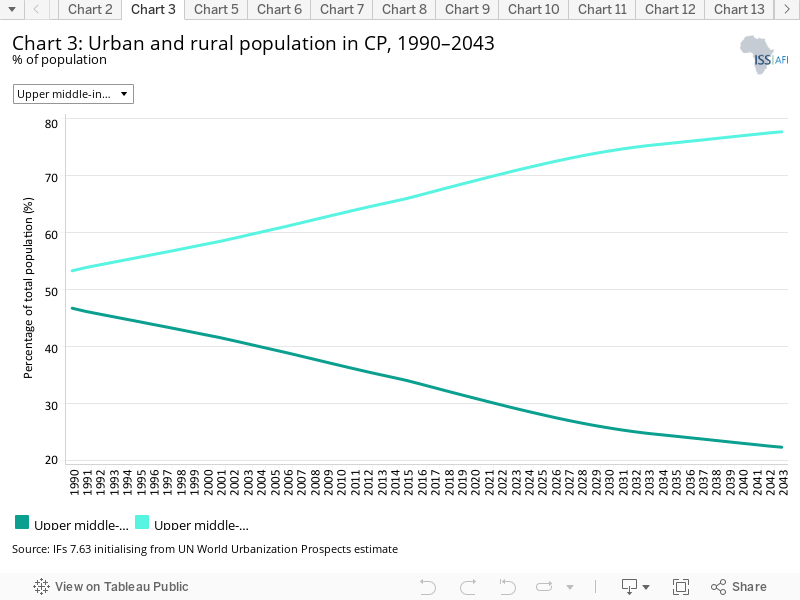
- Chart 3: Urban and rural population in CP, 1990–2043
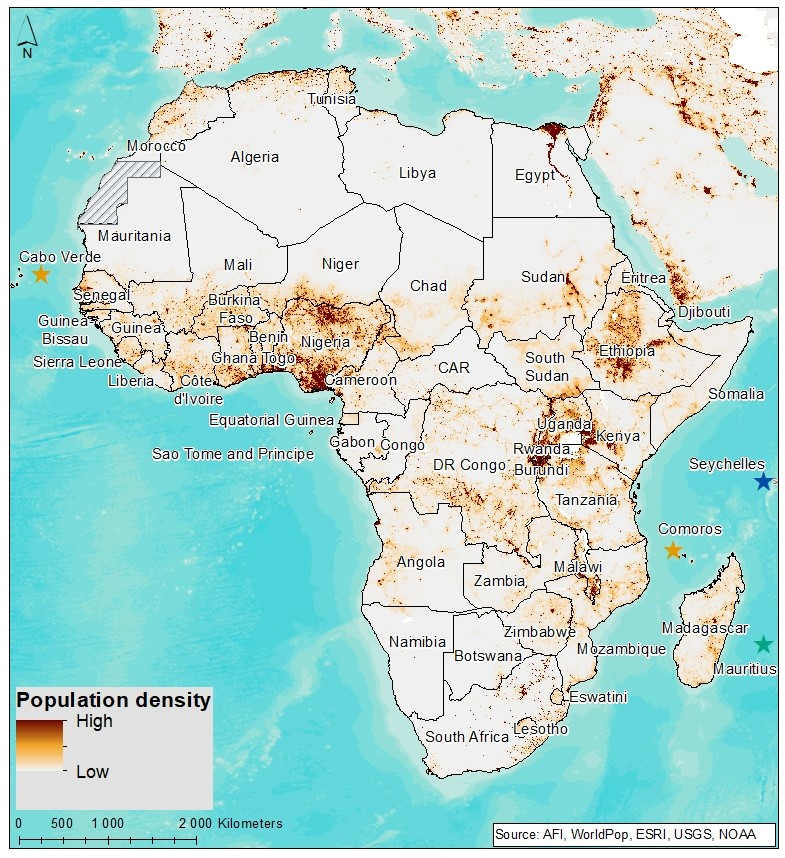
- Chart 4: Population density map for 2019
- Chart 5: GDP in CP, 1990–2043
- Chart 6: GDP per capita in CP, 1990–2043
- Chart 7: Informal sector value in CP, 2015–2043
- Chart 8: Value added by sector in CP, 2015–2043
- Chart 9: Agriculture production/demand in CP, 1990–2043
- Chart 10: Poverty in CP, 2015–2043
- Chart 11: Energy production by type in CP, 1990–2043
- Chart 12: Carbon emissions in CP, 1990–2043
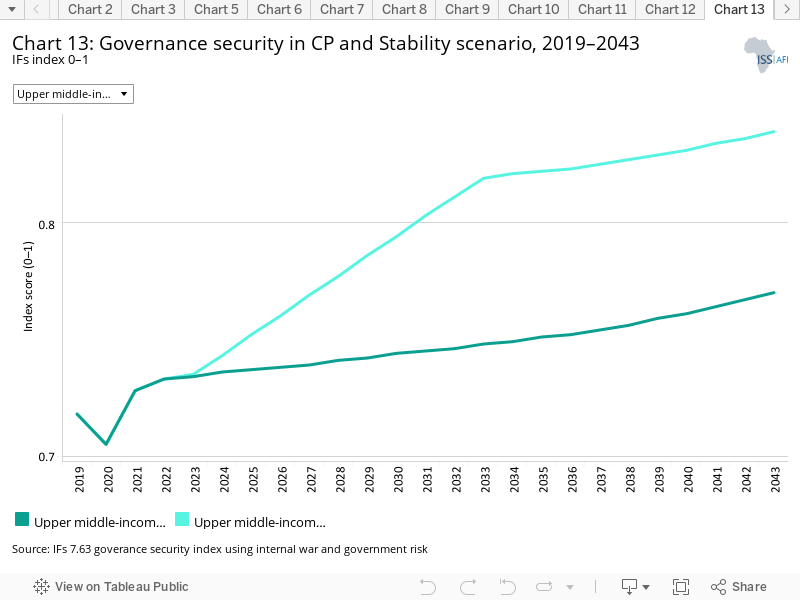
- Chart 13: Governance security in CP and Stability scenario, 2019–2043
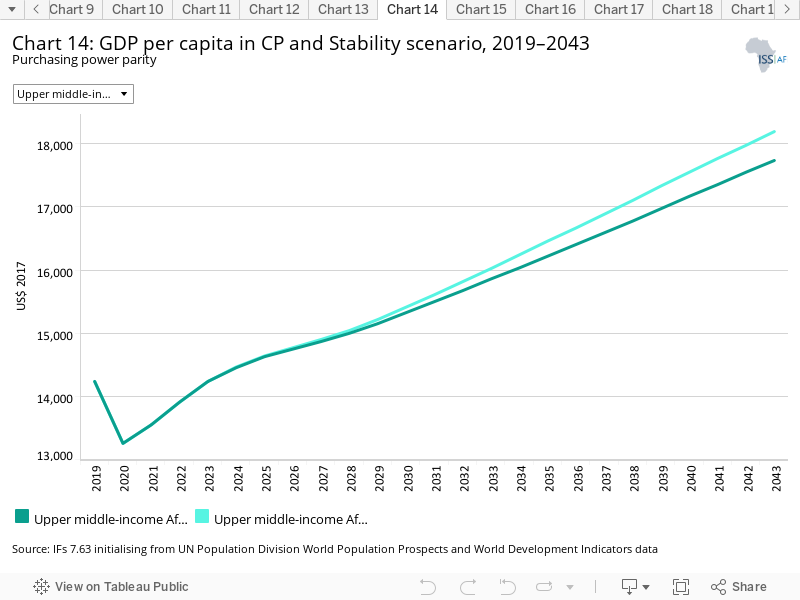
- Chart 14: GDP per capita in CP and Stability scenario, 2019–2043
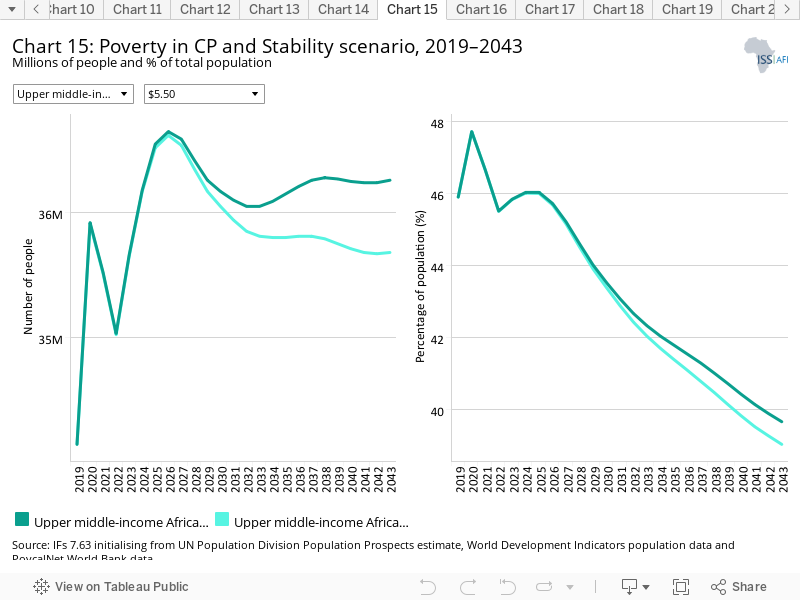
- Chart 15: Poverty in CP and Stability scenario, 2019–2043
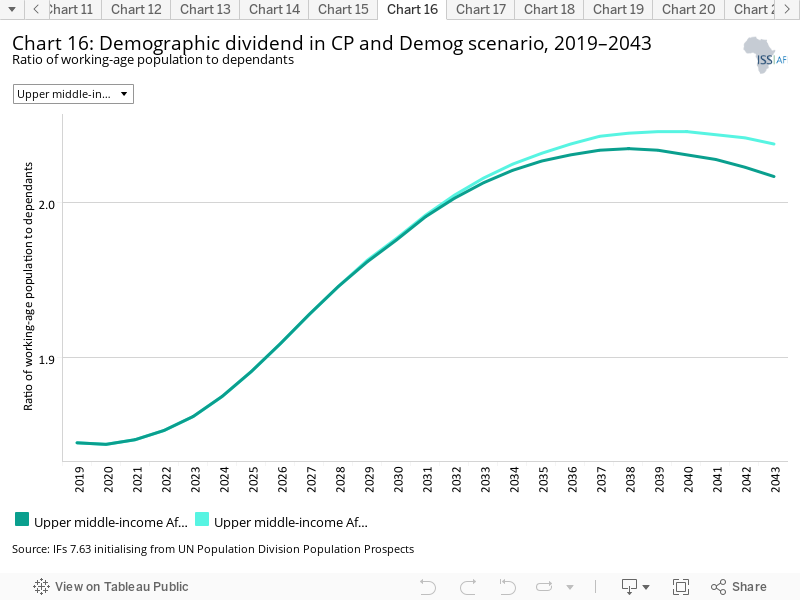
- Chart 16: Demographic dividend in CP and Demog scenario, 2019–2043
- Chart 17: Infant mortality in CP and Demog scenario, 2019–2043
- Chart 18: GDP per capita in CP and Demog scenario, 2019–2043
- Chart 19: Poverty in CP and Demog scenario, 2019–2043
- Chart 20: Life expectancy in CP and Health/WaSH scenario, 2019–2043
- Chart 21: Infant mortality in CP and Health/WaSH scenario, 2019–2043
- Chart 22: Yield/hectare in CP and Agric scenario, 2019–2043
- Chart 23: Agriculture imports in CP and Agric scenario, 2019–2043
- Chart 24: GDP per capita in the CP and Agric scenario, 2019–2043
- Chart 25: Poverty in CP and Agric scenario, 2019–2043
- Chart 26: Mean years of education in CP and Educ scenario, 2019–2043
- Chart 27: Education quality in CP and Educ scenario, 2019–2043
- Chart 28: GDP per capita in CP and Educ scenario, 2019–2043
- Chart 29: Poverty in CP and Educ scenario, 2019–2043
- Chart 30: Value added by sector in CP and Manufac/Transfers scenario, 2019–2043
- Chart 31: Gov welfare transfers in CP and Manufac/Transfers scenario, 2019–2043
- Chart 32: GDP per capita in CP and Manufac/Transfers scenario, 2019–2043
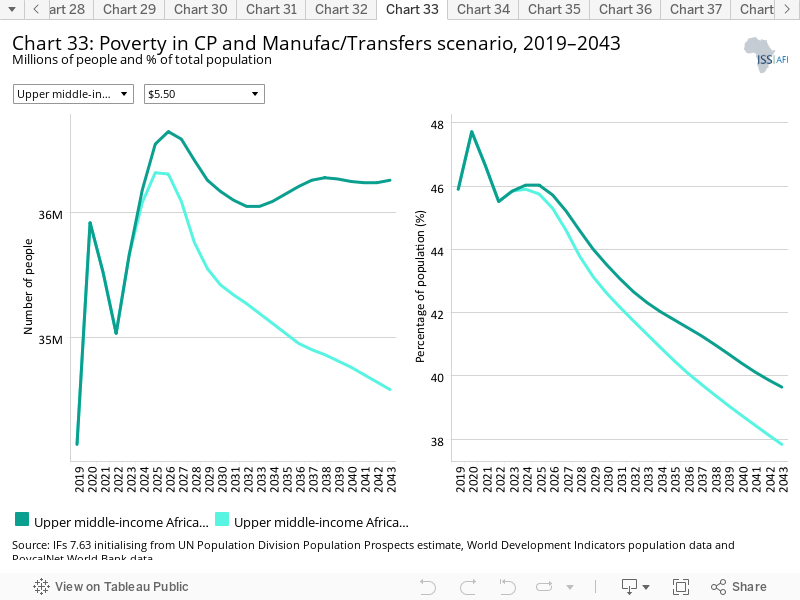
- Chart 33: Poverty in CP and Manufac/Transfers scenario, 2019–2043
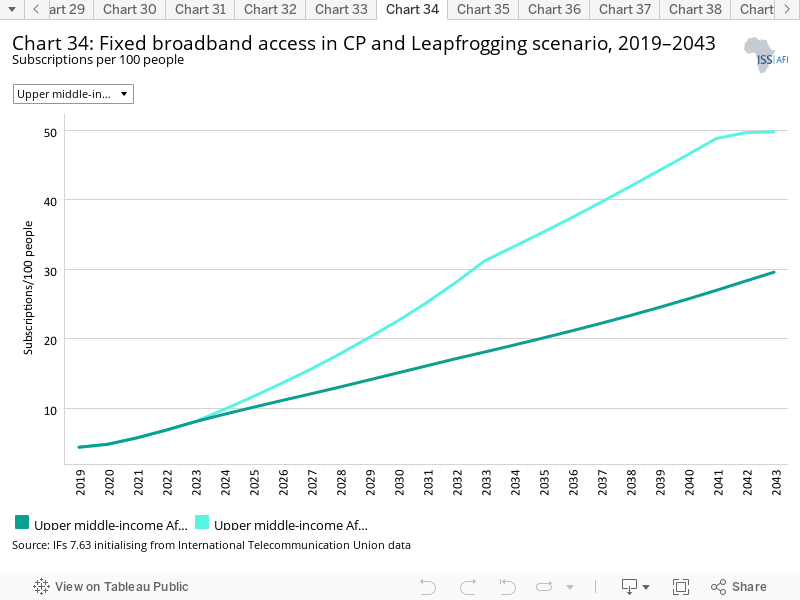
- Chart 34: Fixed broadband access in CP and Leapfrogging scenario, 2019–2043
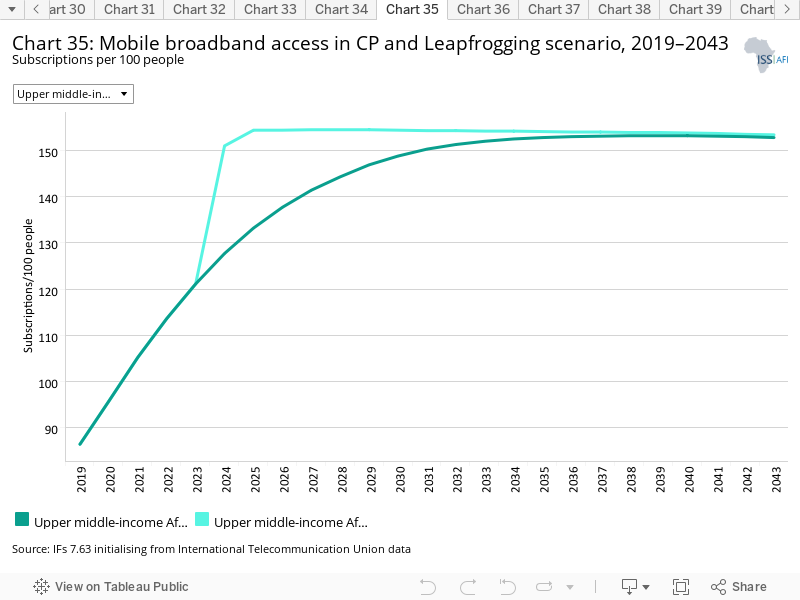
- Chart 35: Mobile broadband access in CP and Leapfrogging scenario, 2019–2043
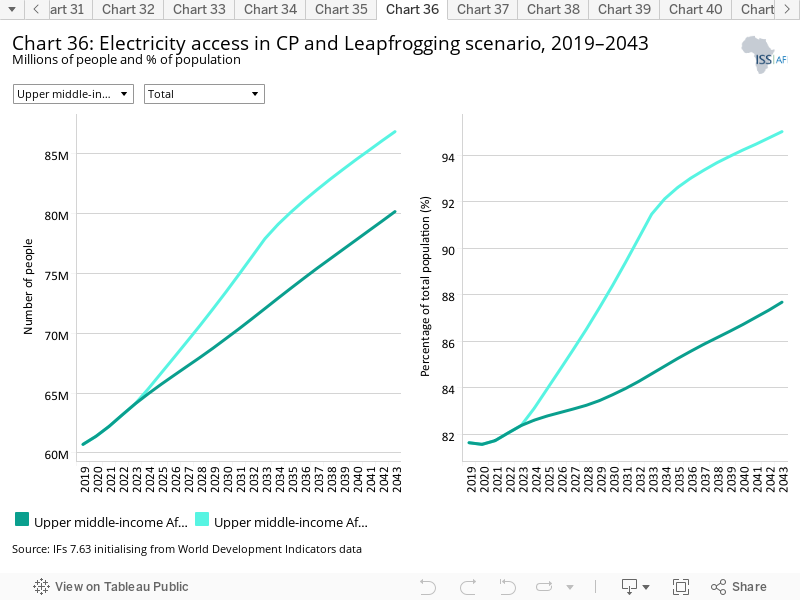
- Chart 36: Electricity access in CP and Leapfrogging scenario, 2019–2043
- Chart 37: GDP per capita in CP and Leapfrogging scenario, 2019–2043
- Chart 38: Poverty in CP and Leapfrogging scenario, 2019–2043
- Chart 39: Trade balance in CP and Free Trade scenario, 2019–2043
- Chart 40: GDP per capita in CP and Free Trade scenario, 2019–2043
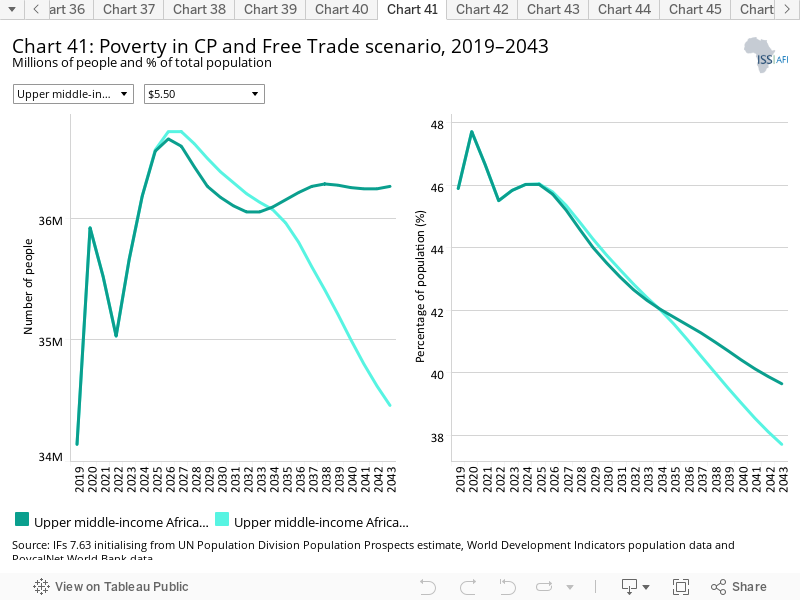
- Chart 41: Poverty in CP and Free Trade scenario, 2019–2043
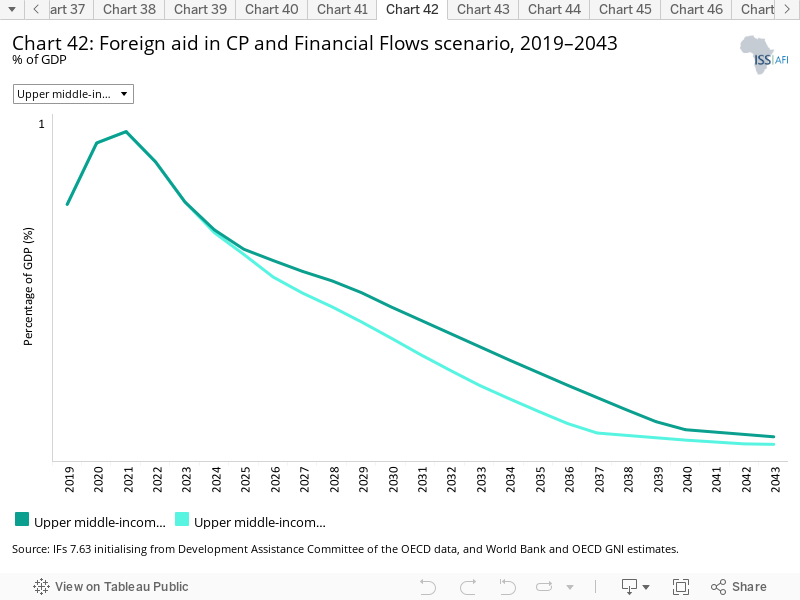
- Chart 42: Foreign aid in CP and Financial Flows scenario, 2019–2043
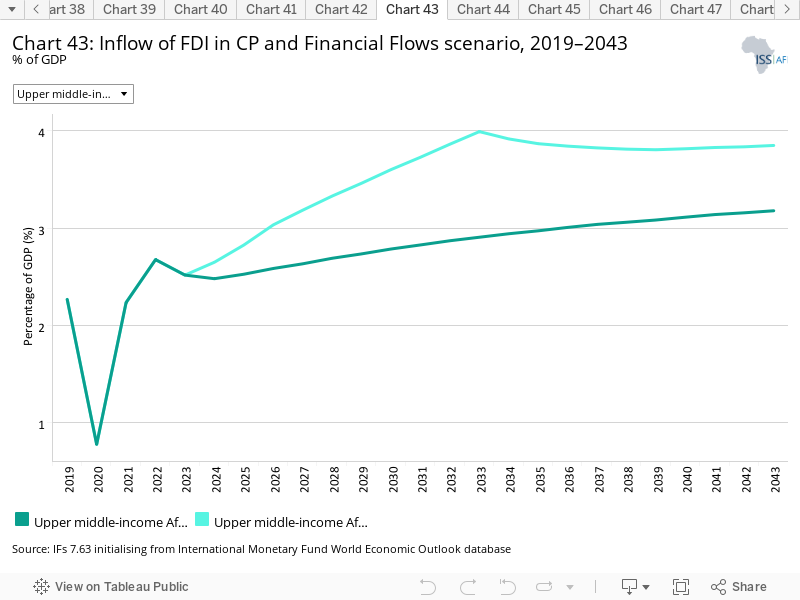
- Chart 43: Inflow of FDI in CP and Financial Flows scenario, 2019–2043
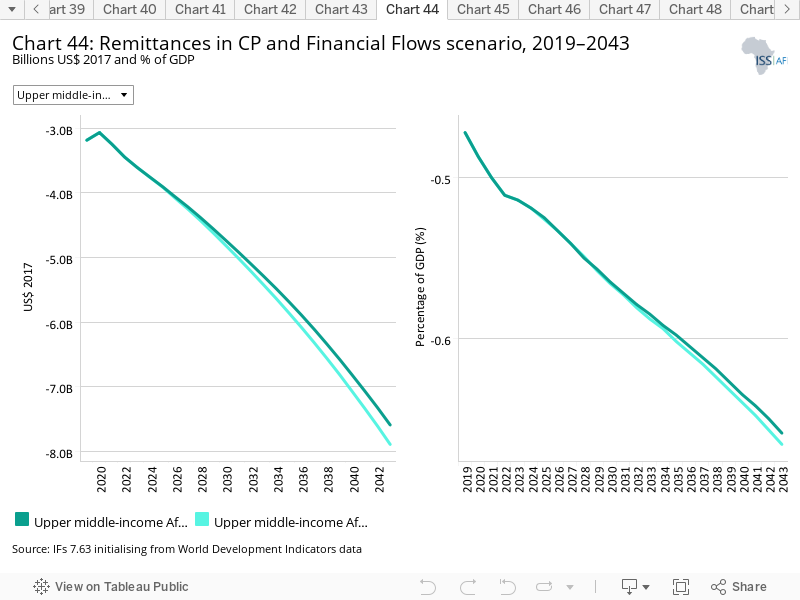
- Chart 44: Remittances in CP and Financial Flows scenario, 2019–2043
- Chart 45: GDP per capita in CP and Financial Flows scenario, 2019–2043
- Chart 46: Poverty in CP and Financial Flows scenario, 2019–2043
- Chart 47: Electricity access in CP and Infrastructure scenario, 2019–2043
- Chart 48: Rural road access in CP and Infrastructure scenario, 2019–2043
- Chart 49: GDP per capita in CP and Infrastructure scenario, 2019–2043
- Chart 50: Poverty in CP and Infrastructure scenario, 2019–2043
- Chart 51: Gov effectiveness in CP and Governance scenario, 2019–2043
- Chart 52: GDP per capita in CP and Governance scenario, 2019–2043
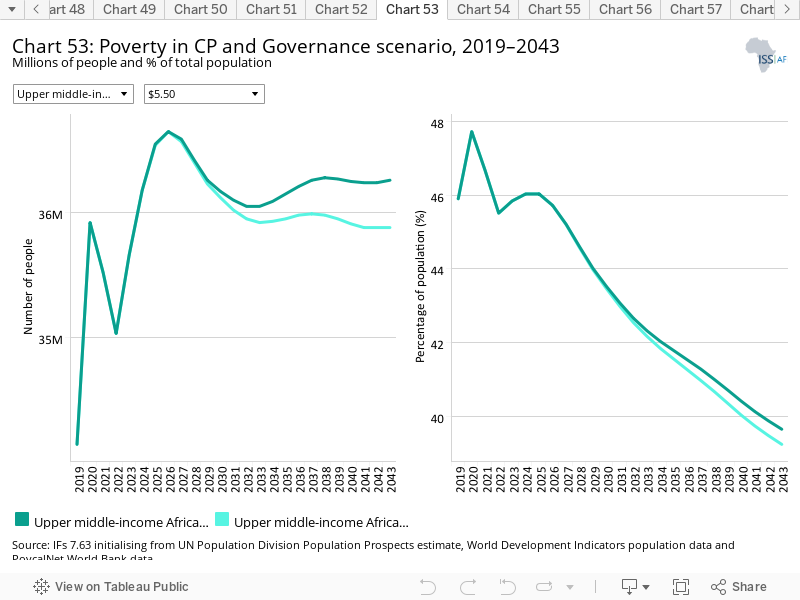
- Chart 53: Poverty in CP and Governance scenario, 2019–2043
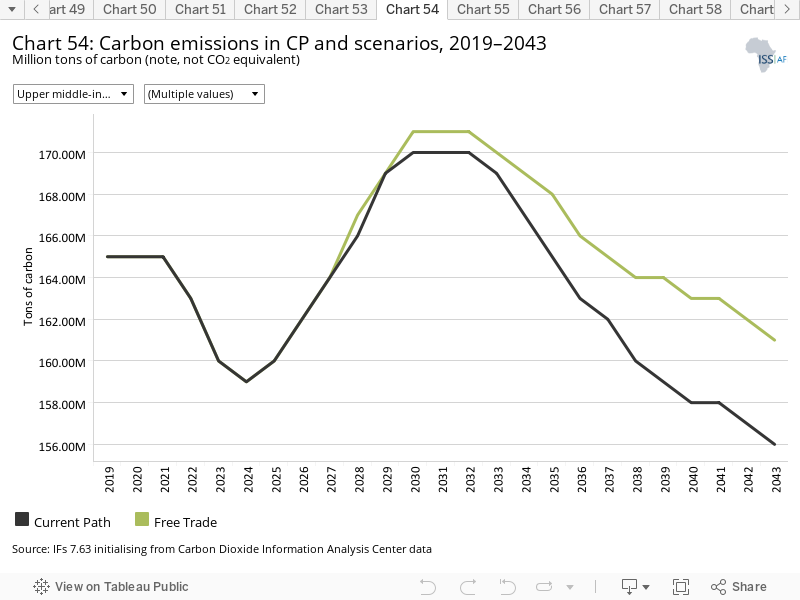
- Chart 54: Carbon emissions in CP and scenarios, 2019–2043
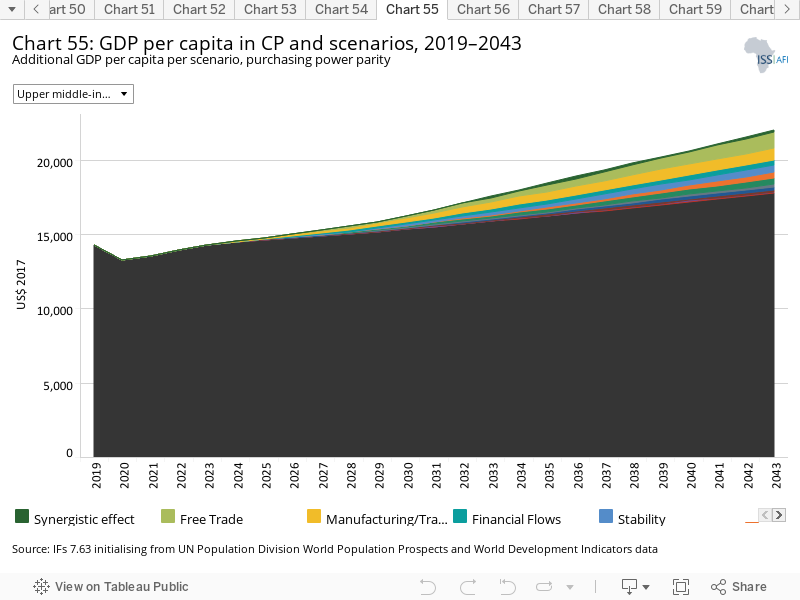
- Chart 55: GDP per capita in CP and scenarios, 2019–2043
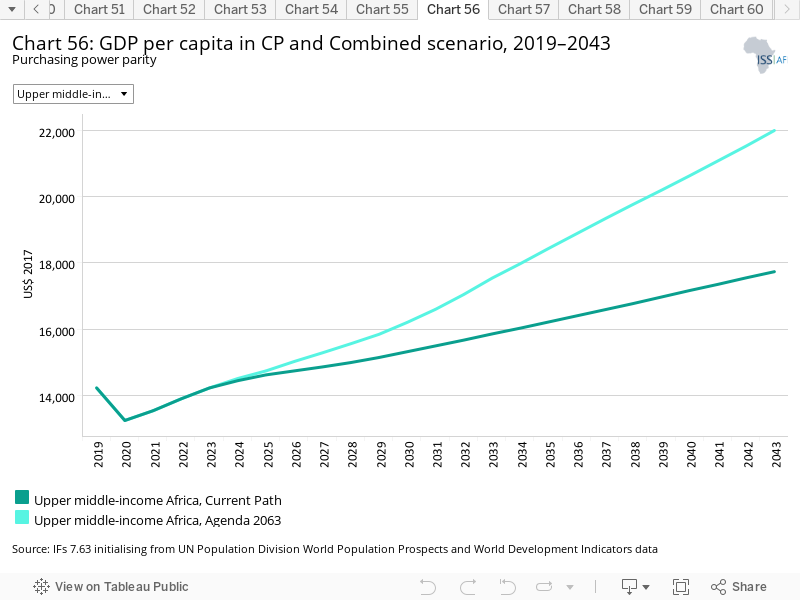
- Chart 56: GDP per capita in CP and Combined scenario, 2019–2043
- Chart 57: Poverty in CP and Combined scenario, 2019–2043
- Chart 58: Value added by sector in CP and Combined scenario, 2019–2043
- Chart 59: GDP in CP and Combined scenario, 2019–2043
- Chart 60: Carbon emissions in CP and Combined scenario, 2019–2043
Upper middle-income Africa: Current Path
Download to pdfThis page provides an overview of the key characteristics of upper middle-income Africa along its likely (or Current Path) development trajectory. The Current Path forecast from the International Futures forecasting (IFs) platform is a dynamic scenario that imitates the continuation of current policies and environmental conditions. The Current Path is therefore in congruence with historical patterns and produces a series of dynamic forecasts endogenised in relationships across crucial global systems. We use 2019 as a standard reference year and the forecasts generally extend to 2043 to coincide with the end of the third ten-year implementation plan of the African Union’s Agenda 2063 long-term development vision.
Upper middle-income Africa is a group of seven countries, namely Mauritius, South Africa, Botswana, Namibia, Equatorial Guinea, Gabon and Libya, that have a gross national income per capita between US$4 096 and US$12 695 (as of July 2021).
In 2019, the population of the upper middle-income countries was 5.7% of the population of Africa with 87% of the population in South Africa. Libya, Namibia, Botswana and Gabon have individual populations of less than 3 million, while Mauritius and Equatorial Guinea have populations of less than 1.5 million. All the countries, except Libya, geographically lie within sub-Saharan Africa, with South Africa, Botswana and Namibia in the Southern Africa region, Mauritius an East African island country in the Indian Ocean, Gabon and Equatorial Guinea situated on the west coast of Central Africa, and Libya in North Africa. The population density ranges from 6.3 persons per hectare in Mauritius to 0.03 in Namibia.
The climates of upper middle-income countries in Africa vary greatly, given the extent of the income group. Libya’s climate is Mediterranean along the coast, becoming semiarid as it extends inland, and hot and arid to the south in the Sahara Desert; this climate dominates, though it is moderated by the coast of the Mediterranean Sea. In the summer, the influence of the Sahara is stronger, and from October to March westerly winds bring cyclonic storms and rains across the north. The Mediterranean climate has a cool, rainy winter and a hot, dry summer. In the Saharan zone, 200 consecutive rainless days per year are recorded.
Gabon has a tropical climate with dry and cool weather from June to August. Similarly, in Equatorial Guinea the climate is tropical with high temperatures and heavy rainfall which is higher on the coast than inland. Wet seasons in the continental region are from February to June and September to December.
Namibia has a subtropical desert climate with vast day and night temperature differences, and low humidity and rainfall. During the dry winter season, from May to October, there is no rainfall and humidity is low. In the summer, from November to April, heavy downpours occur in the afternoon with the temperature ranging from 30–40 °C.Inland, Botswana, like Namibia, has a semiarid climate, which is mostly hot and dry. The summer sees heavy, erratic and unpredictable rainfall.
South Africa has a cool and arid climate on the west coast near the Namib desert, a subtropical climate in the southern coast with dry summers in the westernmost part and no dry season in the eastern part, and the plateau with dry, sunny winters, more arid in the western part than in the eastern part. The temperature is mild all year round.
In 2019, the population of upper middle-income Africa stood at 74.4 million, representing 5.6% of Africa’s population. Three-quarter of the population of upper middle-income Africa is in South Africa,but Equatorial Guinea (3%), Gabon (2.3%) and Namibia (2.2%) have the fastest-growing populations.
In 2019, about 55% of the population of upper middle-income Africa was under 30 years old, mainly as a result of the youthful population in South Africa, shrinking to 45% of the population by 2043. The elderly population (65 years and old) of 5.6% is set to increase by over 100% to 10.4% during the same period. The median age in 2019 was 27.3 years, significantly higher than the mean of 20 years for Africa. The total fertility rate of 2.5 live births per woman is set to decrease to the population replacement rate of 2.1 in 2039.
Life expectancy is low at 65 years in 2019 due to a remarkably high disease burden particularly from communicable diseases (mostly HIV/AIDS in South Africa and to a lesser extent in Botswana and Namibia) and increasingly also from non-communicable diseases as populations age. As the disease burden subsides, and access to improved sanitation increases, life expectancy is expected to improve to 70 years in 2043.
Whereas the gap in life expectancy between upper middle-income Africa and the global average for upper middle-income countries was almost 11 years in 2019, it will decrease to 9 years in 2043.
The upper middle-income Africa group of countries is predominantly urban, with an urbanisation rate of 68.4% in 2019 — a 15 percentage point increase from 1990. In the Current Path forecast, the urbanisation rate will increase to 77.6% in 2043.
South Africa undoubtedly has some of the most long-standing modern cities that are centres of finance and trade in Southern Africa as well as attracting migration from neighbouring countries.
The seven upper middle-income African countries are among the most sparsely populated in Africa. Mauritius is the most densely populated in the group with 6.3 persons per hectare, and Namibia — a vast country with two deserts and few people — is the least densely populated in Africa at just 0.03 persons per hectare. Situated in the Sahel region with unfavourable climate conditions for living, Libya is the next most sparsely populated upper middle-income Africa country with a population density of 0.04 persons per hectare. Indeed Botswana (0.04) and Gabon (0.08) have low population densities, relatively lower than South Africa (0.48) and Equatorial Guinea (0.47).
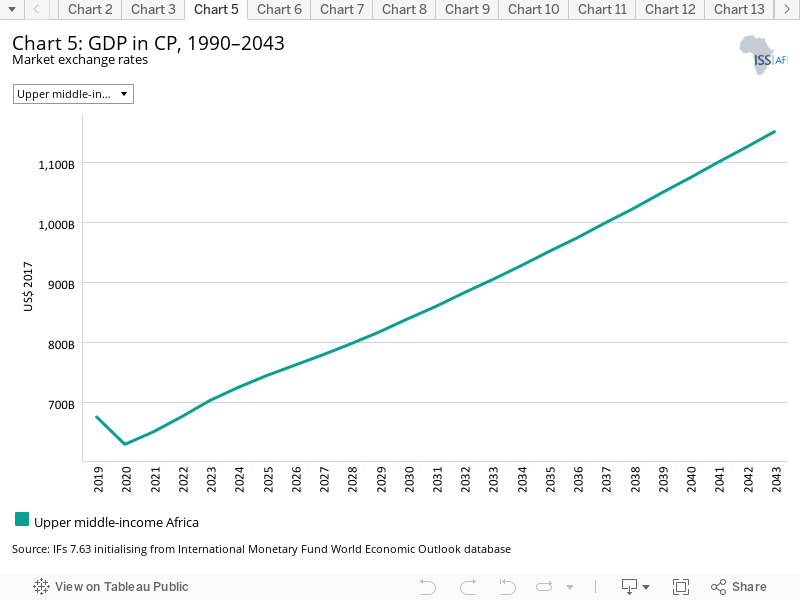
In 1990, the GDP of upper middle-income Africa was US$354.3 billion, representing 33% of the GDP of Africa. From 1990 to 2019, the income group’s economies managed to increase the collective size of by 90% to US$675.8 billion; however, their share of Africa's economy decreased to 22.1% as a result of more rapid growth in the lower-income and lower middle-income Africa income groups. Economic growth during this period was largely due to growth in the service and manufacturing sectors. In South Africa, economic growth averaged at 1.7% per annum due to the fall in investment and exports from 2007 to 2019.
In the Current Path forecast, the economy of upper middle-income Africa is set to grow to US$1 152.1 billion in 2043, representing 59% growth compared to 2019. The sectors that will increase their share of the economy from 2019 to 2043 are manufacturing (3 percentage points larger), materials (2 points) and ICT (1.4 points), whereas the services (−3 percentage points smaller), energy (−2.4 points), and agriculture (−1.2 points) sectors will decrease their share of the economy in 2043.
Although many of the charts in the sectoral scenarios also include GDP per capita, this overview is an essential point of departure for interpreting the general economic outlook of upper middle-income Africa.
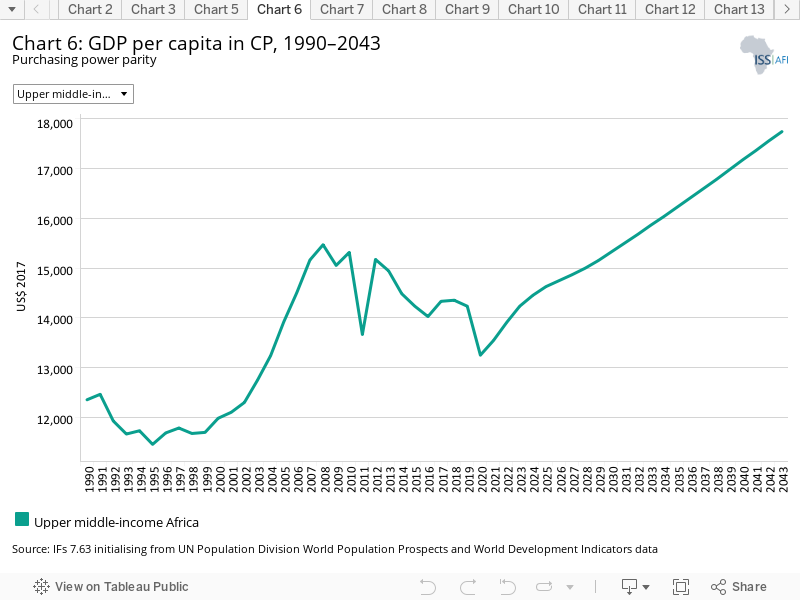
From 1990 to 2019, the trend in GDP per capita is generally categorised into three phases. The GDP per capita fell marginally by US$654 during the 1990s, followed by a rapid increase in income per capita during the fast-growth period of 2000 to 2008. During this period, income increased by US$4 000 to US$15 467 on the eve of the financial crisis. About half of the income gain during the 2000 to 2008 period was lost in the 2010s due to the effect of the financial crisis and since 2020 the global COVID-19 pandemic. The impact of the various oil shocks are also evident with GDP per capita in Equatorial Guinea and Libya increasing rapidly during the 1990s and 2000s before falling more recently. Coming off a high base, the impact of the COVID-19 pandemic was particularly severe on GDP per capita in Mauritius. In the Current Path forecast, per capita income will increase rapidly from US$14 225 to US$17 734 in 2043.
In 2019, GDP per capita within the group was highest in Mauritius, followed by Equatorial Guinea and Libya. Namibia had the lowest GDP per capita within the group but, by 2043, will catch up with South Africa, the country with the second lowest GDP per capita in the group in 2019 and which is forecast to experience the slowest improvement among the upper middle-income countries to 2043.
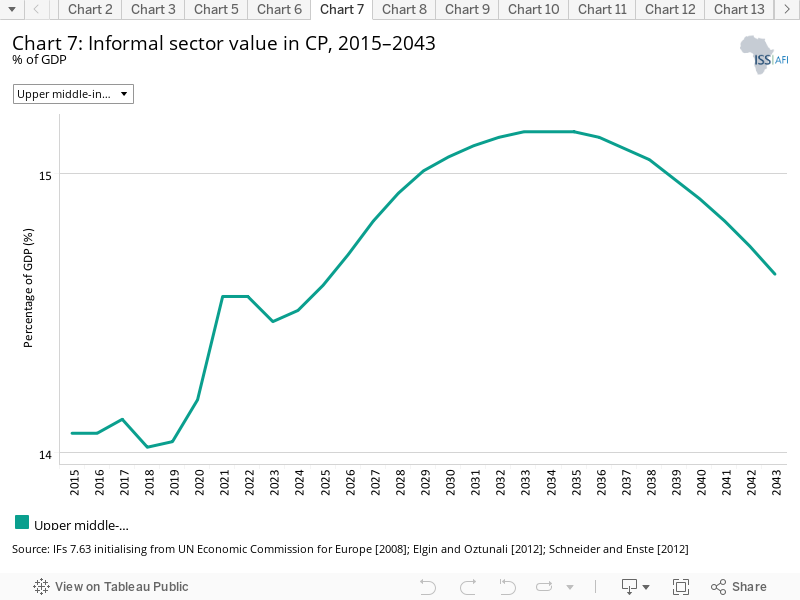
In 2019, 14.04% of upper middle-income Africa operated in the informal sector, higher than the average for other upper middle-income economies of 7.6%. The informal sector was largest in Gabon, constituting a third of the economy, and lowest in Mauritius, at 8.6%, in 2019. South Africa (13%) and Libya (13.8%) were below the group average in 2019, while Botswana (18.7%) and Namibia (17%) had rates twice the average of other upper middle-income economies.
In the Current Path forecast, the informal sector will only marginally increase to 14.64% in 2043 due to the large share of the labour force that will continue to operate in subsistence agriculture in rural areas and the large dependency ratio across the region over time. In the 2043 Current Path forecast, all countries will experience a decline in the informal sector except South Africa, where it is set to increase from 13% in 2019 to 16.1% in 2043.
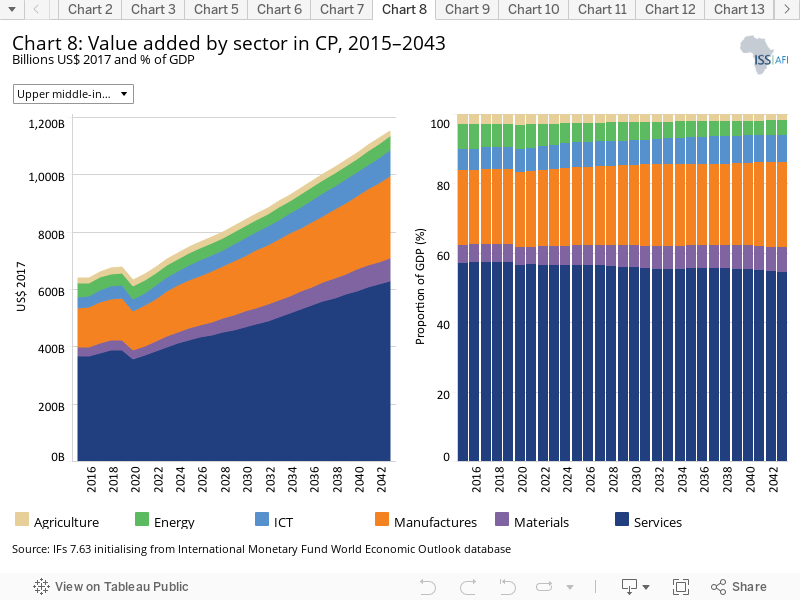
The IFs platform uses data from the Global Trade and Analysis Project (GTAP) to classify economic activity into six sectors: agriculture, energy, materials (including mining), manufacturing, services and information and communication technologies (ICT). Most other sources use a threefold distinction between only agriculture, industry and services with the result that data may differ.
The service sector is the most dominant sector in upper middle-income Africa, amounting to 57.4% of GDP (US$387.7 billion) in 2019. The contribution of the service sector will marginally decline to 54.5% (US$4 628.1 billion) in 2043. In 2019, the manufacturing sector contributed 21.7% (US$146.5 billion) to upper middle-income Africa’s GDP against the projected 24.6% (US$283.6 billion) in 2043. The share of the agriculture sector in GDP is set to decline from 3% in 2019 to 1.2% in the Current Path forecast in 2043. The ICT and materials sectors will see increases in their quantities and shares of GDP between 2019 and 2043.
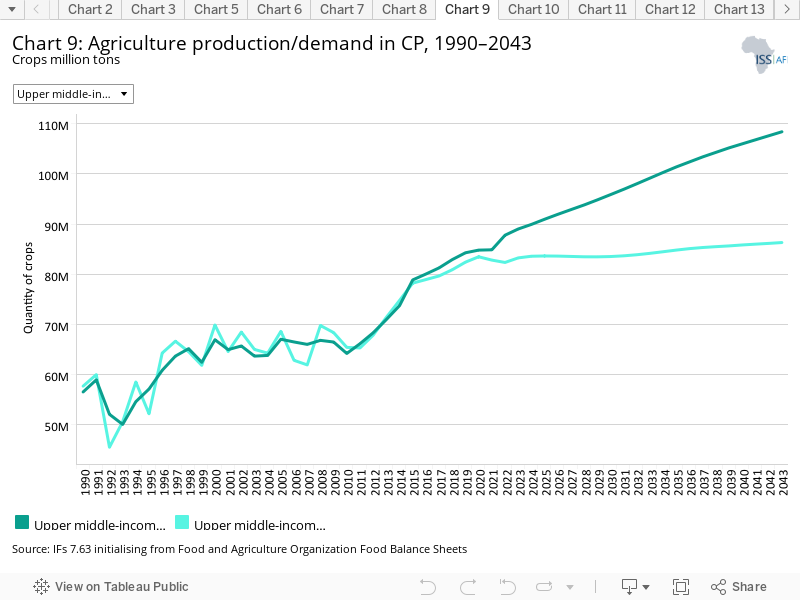
The data on agricultural production and demand in the IFs forecasting platform initialises from data provided on food balances by the Food and Agriculture Organization (FAO). IFs contains data on numerous types of agriculture but aggregates its forecast into crops, meat and fish, presented in million metric tons. Chart 9 shows agricultural production and demand as a total of all three categories.
The agriculture sector contributed 2.8% of GDP in Africa in 2019 and is set to decline to 1.8% in 2043. The sector is therefore significantly smaller than the average for Africa as a whole, which stands at 15.6%. In 2019, upper middle-income Africa’s yield per hectare, at 4.7 tons, was significantly lower than the global average of 9.2 tons for upper middle-income economies. Despite the small agriculture sector in upper middle-income Africa, food security is not a problem because agricultural production is about the size of agricultural demand.
In 1990, the gap between production and demand was 1.2 million tons and remained thereabouts in 2019 at 1.9 million tons. This is driven by South Africa’s highly productive agriculture sector that produced 1.6 million tons in excess of demand in 1990 and 90 000 tons in 2019. Botswana and Gabon are the most food insecure countries in the income group, with demand being consistently higher than production.
In the Current Path forecast, as the share of the agriculture sector declines to 1.8% and the capacity to produce food decreases, and while population growth increases demand for food, excess demand will grow to 22.1 million tons in 2043.
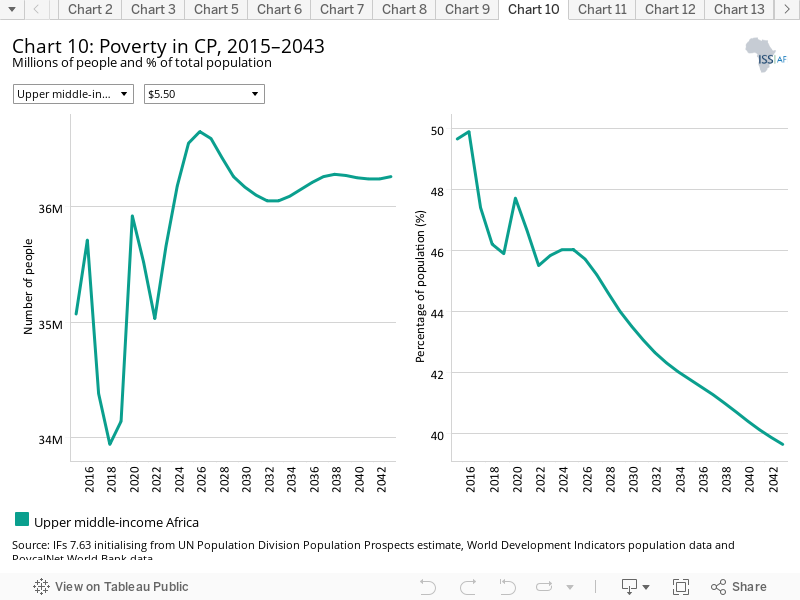
There are numerous methodologies for and approaches to defining poverty. We measure income poverty and use GDP per capita as a proxy. In 2015, the World Bank adopted the measure of US$1.90 per person per day (in 2011 international prices), also used to measure progress towards the achievement of Sustainable Development Goal (SDG) 1 of eradicating extreme poverty. To account for extreme poverty in richer countries occurring at slightly higher levels of income than in poor countries, the World Bank introduced three additional poverty lines in 2017:
- US$3.20 for lower middle-income countries
- US$5.50 for upper middle-income countries
- US$22.70 for high-income countries
In 2019, the number of the extremely poor people (using the US$5.50 per day measure) in upper middle-income Africa was 34.1 million, representing 45.9% of the population. This is more than double the average poverty rate in upper middle-income countries at 18.2%. In the Current Path forecast, the number of poor people will increase to 36.7 million in 2026 before declining to 36.3 million in 2043. At that point, 39.7% of the population of upper middle-income Africa will live in extreme poverty. The Current Path forecast poverty rate of 39.7% in 2043 is 34.5 percentage points higher than the average for upper middle-income peers.
The depth of poverty (using US$5.50) differs among the different upper middle-income countries in Africa, with rates in Namibia (65.8%) around 20 percentage points higher than South Africa (49.6%), Botswana (45.7%) and Gabon (43.5%). Rates in Libya (20.1%) and Mauritius (7.7%) are significantly lower. In the 2043 Current Path forecast, all countries will achieve at least a 10 percentage point decrease in poverty compared to 2019, except South Africa. South Africa will only reduce its poverty in 2043 by 3.5 percentage points to 46.1%, then marginally below Namibia at 47%.
The persistently high poverty rate in South Africa is due to the high unemployment rate, with sluggish economic growth, a relatively small informal sector and high levels of inequality.
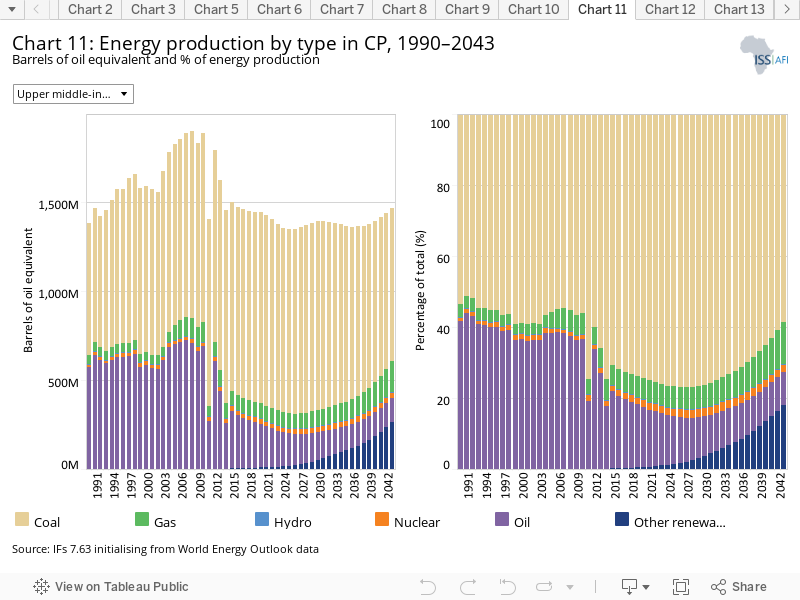
The IFs platform forecasts six types of energy, namely oil, gas, coal, hydro, nuclear and other renewables. To allow comparisons between different types of energy, the data is converted into billion barrels of oil equivalent (BBOE). The energy contained in a barrel of oil is approximately 5.8 million British thermal units (MBTUs) or 1 700 kilowatt-hours (kWh) of energy.
In 1990, half (0.74 billion barrels) of the energy produced in upper middle-income Africa was coal, with South Africa as the largest coal producer in Africa. Oil was the next largest energy produced at 41.7% (0.58 billion barrels) on the back of oil production in Equatorial Guinea, and Gabon, with insignificant gas production during the same timeframe. Over time, both the quantity and share of oil produced decrease. In 2019, only 18.2% of the energy produced was oil while the share of coal produced increased to 73.8% (1.07 billion tons).
In the 2043, Current Path forecast, coal’s share will decline to 58.7% and oil will cease to be the second largest energy produced. Other renewable energy (wind and solar) will significantly grow to 17.9% (0.26 billion tons) and gas will contribute 11.7%, higher than oil’s share of 9.3%.
Most oil and gas is, however, exported and not refined or used domestically. In spite of the fact that upper middle-income Africa exports large amounts of energy, most of the income group’s countries still struggle to provide a stable electricity supply.
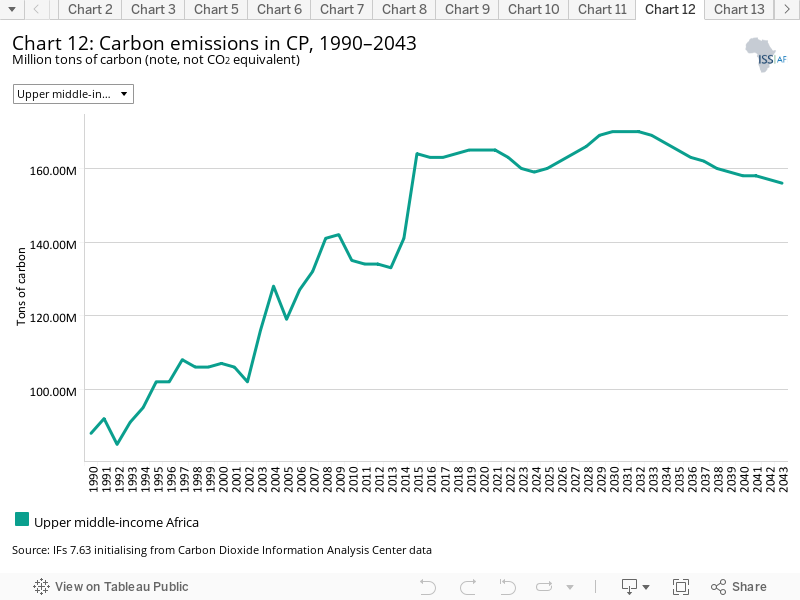
Carbon is released in many ways, but the three most important contributors to greenhouse gases are carbon dioxide (CO2), carbon monoxide (CO) and methane (CH4). Since each has a different molecular weight, IFs uses carbon. Many other sites and calculations use CO2 equivalent.
Upper middle-income Africa’s total carbon emissions steadily increased from 88 million tons in 1990 to 165 million tons in 2019 — 39.1% of Africa’s emissions and 3.6% of global upper middle-income economies’ emissions. Because of the size of its economy and its reliance on coal for electricity generation, South Africa contributed 80% of the total carbon emissions in upper middle-income Africa in 2019, followed by Libya with 15% of the emissions in the same year. Other upper middle-income Africa economies have relatively small carbon footprints.
As renewable technology is increasingly adopted and the share of other renewables increases in energy production to 17.9%, carbon emissions are set to decline to 156 million tons in 2043. In the Current Path forecast, the relative ranking in carbon emissions among the members of upper middle-income Africa does not change in 2043 compared to 2019.
Sectoral Scenarios for Upper middle-income Africa
Download to pdfThe Stability scenario represents reasonable but ambitious reductions in risk of regime instability and lower levels of internal conflict. Stability is generally a prerequisite for other aspects of development and this would encourage inflows of foreign direct investment (FDI) and improve business confidence. Better governance through the accountability that follows substantive democracy is modelled separately.
The intervention is explained here in the thematic part of the website.
The Stability scenario entails significant interventions in increasing regime stability and lowering levels of internal conflict. These interventions allow for reductions in military expenditure and increase inward investment flows from abroad. Upper middle-income Africa has a high level of governance security compared to the average for Africa. In 2019, the group had an average governance security index of 0.72, which was higher than the average for Africa (0.69) but lower than the global average for upper middle-income economies (0.78).
Mauritius (0.89) and Botswana (0.80) are two of the most enduring and stable democracies in Africa. Until the 2019 general elections that were marred with allegations of corruption and bribery, Mauritians were not known for organising large-scale anti-government protests. Mauritius is known as the textbook of success for democracy and stability. In Botswana, the ruling Botswana Democratic Party (BDP) has dominated the political arena with all five presidents since independence coming from the BDP. Even in the October 2019 election, following a split in the party and with the three main opposition parties competing with the ruling BDP, the BDP maintained its dominance in a free and fair election.
On the other end of the spectrum of democracy and stability in upper middle-income Africa is Equatorial Guinea and to some extent South Africa. Equatorial Guinea has been ruled by Teodoro Obiang Nguema Mbasogo since 1979 and has managed to control both the media and judiciary with an iron fist, prosecuting opponents and critics. The last strong opposition was imprisoned after the 2018 election. Because of its strong autocratic characteristics, Equatorial Guinea is relatively stable — perhaps due to the fear of a dictator — however, relatively, Equatorial Guinea has the lowest government stability index in IFs. In South Africa, due to high inequality and unemployment among the youth, crime rates are high despite the government’s efforts. The country had the second lowest government stability index in upper middle-income Africa in 2019. By 2043, South Africa will be the most unstable country in the group in the Current Path forecast.
In the 2043 Stability scenario, as governments spend less on conflicts and free up funds for development, the governance security index is set to increase to 0.84. Libya experiences the largest increase (11% above the Current Path forecast in 2043), followed by South Africa (9% improvement).
In 2019, the average GDP per capita for upper middle-income Africa was US$14 235 — US$4 164 less than the global average per capita GDP for peers in upper middle-income economies.
Mauritius was relegated from the high-income group to upper middle-income in 2021 with a GDP per capita of US$23 784 — the highest in upper middle-income Africa. It is followed by Libya (US$20 296), Equatorial Guinea (US$20 296), Botswana (US$18 138), Gabon (US$17 440), South Africa (US$13 080) and Namibia (US$10 419). The COVID-19 pandemic wiped nearly US$1 000 in GDP per capita of the average upper middle-income African economy between 2019 and 2020.
In the Stability scenario, upper middle-income Africa will add US$458 to its Current Path forecast of US$17 734 in 2043. Coming from a low base in the stability index since the fall of Colonel Ghaddafi in October 2011, Libya will have the greatest addition to GDP per capita in the Stability scenario compared to the Current Path forecast in 2043 of US$1 929. In all other countries, the addition will be less than US$1 000.
While the poverty rate will decline from 45.9% in 2019 to 39.7% in 2043, the number of poor people is set to increase from 34.1 million (using US$5.50) to 36.3 million.
In the Stability scenario, the number of extremely poor people (percentage of poor people) in upper middle-income Africa falls to 35.7 million (39%). This means that in the Stability scenario, upper middle-income Africa will have 700 000 fewer people living in extreme poverty in 2043 — a marginal difference of almost 0.06 percentage points.
Botswana and Namibia will record the greatest reduction in poverty rates in the Stability scenario compared to the Current Path forecast, achieving reductions of 1 and 1.3 percentage points in 2043, respectively, whereas other upper middle-income countries will only reduce poverty by less than 0.6 percentage points.
This section presents the impact of a Demographic scenario that aims to hasten and increase the demographic dividend through reasonable but ambitious reductions in the communicable-disease burden for children under five, the maternal mortality ratio and increased access to modern contraception.
The intervention is explained here in the thematic part of the website.
Demographers typically differentiate between a first, second and even a third demographic dividend. We focus here on the contribution of the size of the labour force (between 15 and 64 years of age) relative to dependants (children and the elderly) as part of the first dividend. A window of opportunity opens when the ratio of the working-age population to dependants is equal to or surpasses 1.7.
The ratio of working-age persons to dependants in upper middle-income Africa exceeded 1.7 to 1 in 2003. In 2019, the ratio of working-age persons to dependants was 1.88, lower than the global average for upper middle-income economies at 2.24 but significantly above the average for Africa of 1.2. Individually, Mauritius entered a potential demographic dividend earlier than its peers in 1984, Libya in 2001 and South Africa in 2003. Botswana, Equatorial Guinea, Gabon and Namibia will attain demographic dividends later in the forecast horizon.
In the Current Path forecast, upper middle-income Africa will attain a ratio of working-age persons to dependants of 2 to 1 in 2043, greater than the global average upper middle-income economies of 1.67 to 1. As upper middle-income Africa reaps the demographic dividend, other upper middle-income economies retract on gains made in this respect due to their ageing populations.
In the Demographic scenario, increased contraception use together with lower child and maternal mortality rates will increase the 2043 working-age persons to dependants ratio to 2.04.
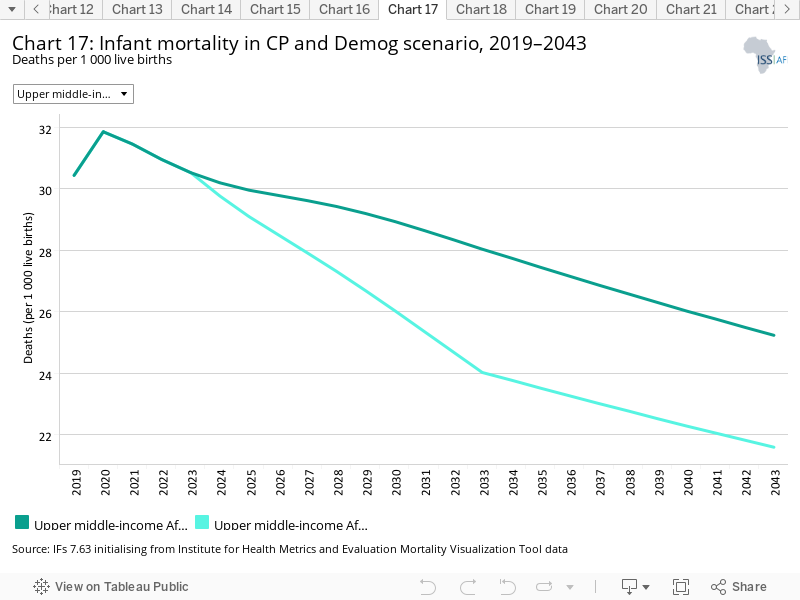
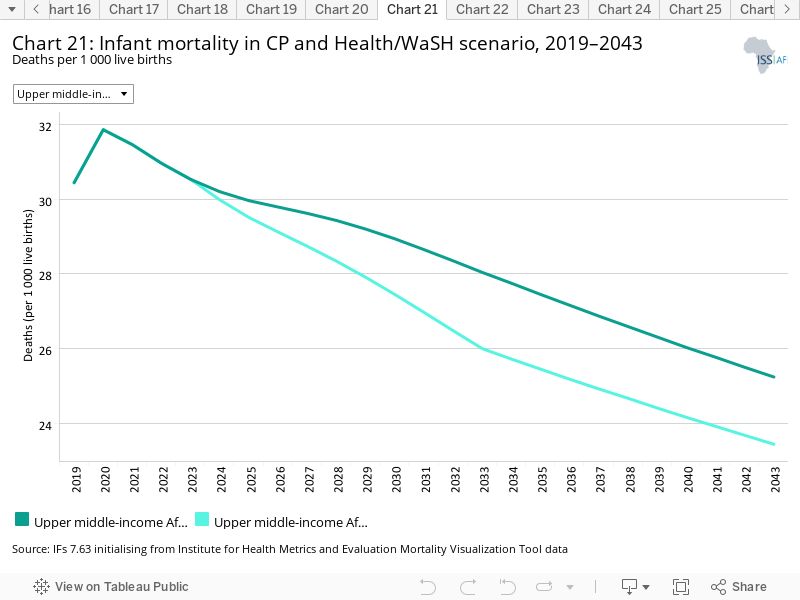
The infant mortality rate is the number of infant deaths per 1 000 live births and is an important marker of the overall quality of the health system in a country.
In 2019, the infant mortality rate for upper middle-income Africa was 2.5 times the rate for global upper middle-income economies and 65% of Africa’s. There is wide disparity in the infant mortality rates among upper middle-income members: the infant mortality rate in Equatorial Guinea is 7 times higher than Libya, 4 times higher than Mauritius, and 3 times higher than Botswana.
In the Current Path forecast, the infant mortality rate is set to decline to 25.3 deaths per 1 000 live births in 2043 compared to 7.5 for other upper middle-income countries in the world. In the Demographic scenario, on account of increased use of contraception, infant mortality will decline to 21.6 deaths per 1 000 live births instead of 25.3 in the Current Path.
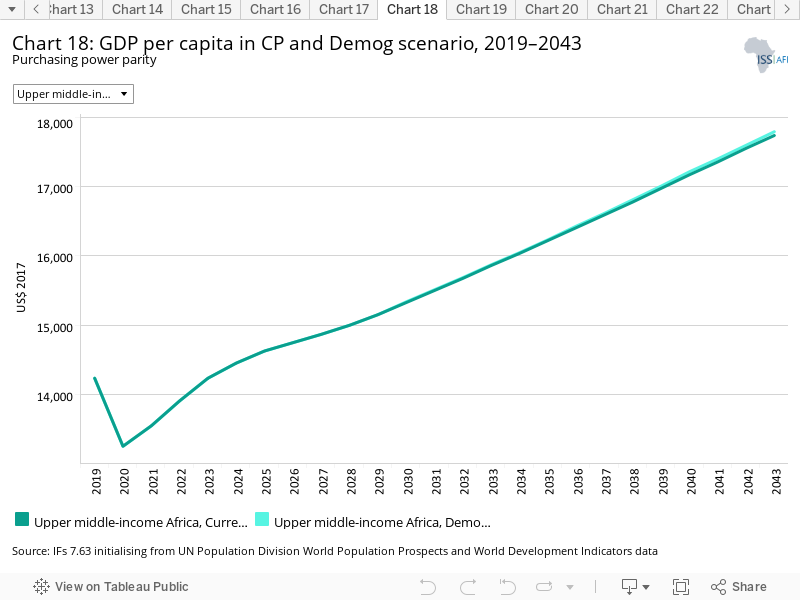
The GDP per capita fell sharply from US$14 235 in 2019 to US$13 254 in 2020 due to the COVID-19 pandemic. In the Current Path forecast, GDP per capita increases rapidly to US$17 734 in 2043. The Demographic scenario will marginally increase the average GDP per capita for upper middle-income Africa by US$55. The insignificant effect of the Demographic scenario on income is because 50% of upper middle-income members have attained demographic dividend since the early 2000s, so there is not much that a higher working-age persons to dependants ratio can do to income.
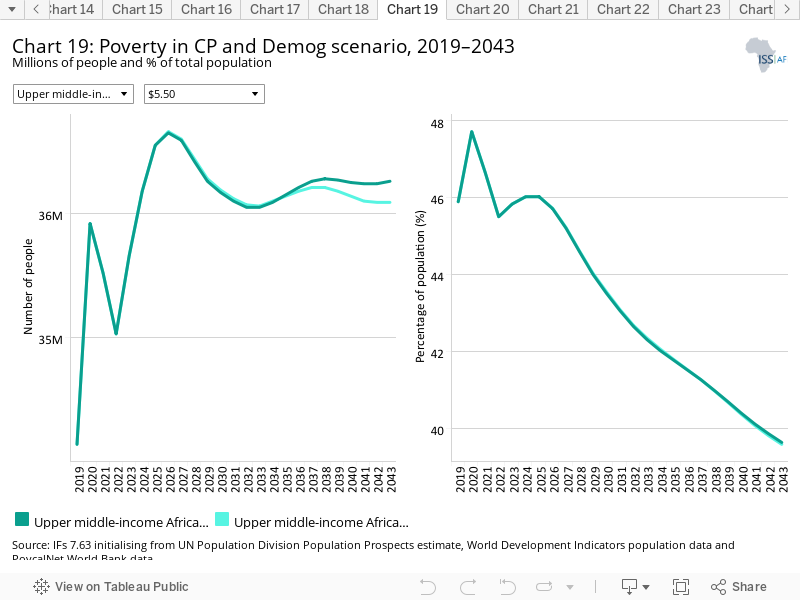
The number of extremely poor people will increase to 36.67 million in 2026 from 34.14 million in 2019, and remain relatively constant across the forecast horizon thereafter. However, the Current Path forecast for the poverty rate will decline by 8.1 percentage points to 39.6% in 2043. Since most upper middle-income African countries have entered a potential demographic dividend, the Demographic scenario does not reduce the poverty rate (the number of poor people) significantly.
This section presents reasonable but ambitious improvements in the Health/WaSH scenario, which include reductions in the mortality rate associated with both communicable diseases (e.g. AIDS, diarrhoea, malaria and respiratory infections) and non-communicable diseases (NCDs) (e.g. diabetes), as well as improvements in access to safe water and better sanitation. The acronym WaSH stands for water, sanitation and hygiene.
The intervention is explained here in the thematic part of the website.
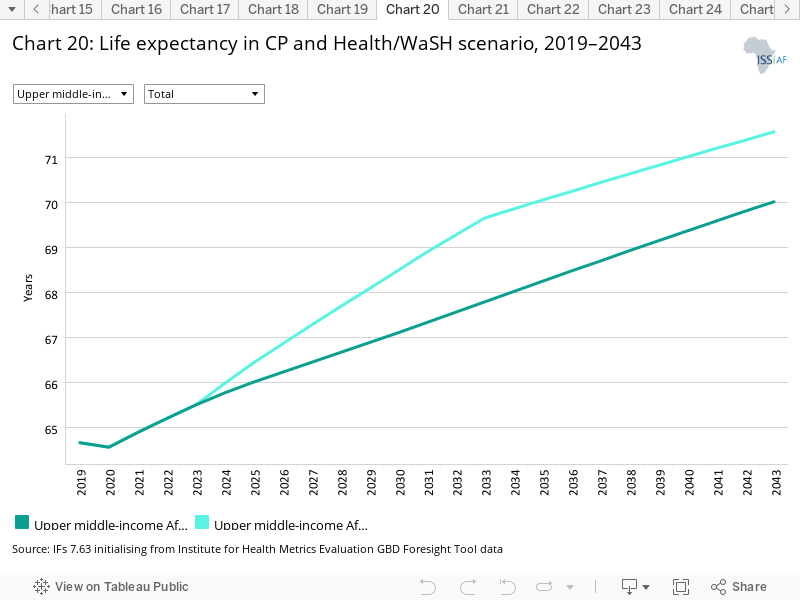
In the Current Path forecast, life expectancy in upper middle-income Africa will rise from 64.7 years in 2019 to 70 years in 2043. Life expectancy changes slowly, and in the WaSH/Health scenario the continent will gain 1.4 years compared to the Current Path forecast in 2043. In 2019, upper middle-income Africa’s average life expectancy was almost 11 years below the average life expectancy rate for upper middle-income countries globally. In the Health/WaSH scenario, Africa will start to marginally close that gap to 9.6 years by 2043.
Infant mortality in upper middle-income Africa will fall from 30.4 to 25.2 deaths per 1 000 live births in 2043 in the Current Path forecast. Equatorial Guinea (51.8) and South Africa (33.1) had the highest rates while Libya (6.8) and Mauritius (12) had the lowest in 2019.
In the Health/WaSH scenario, the infant mortality rate is expected to fall by 1.8 deaths per 1 000 live births compared to the Current Path forecast in 2043. Despite the faster reduction in the infant mortality rate in the Health/WaSH scenario, upper middle-income Africa has about 17 deaths per 1 000 live births, more than the average upper middle-income economy globally in 2043.
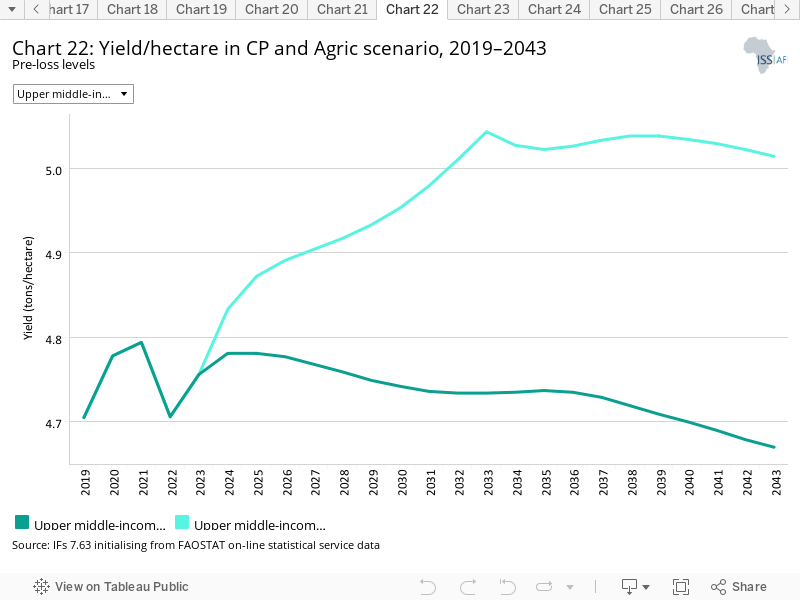
The Agriculture scenario represents reasonable but ambitious increases in yields per hectare (reflecting better management and seed and fertiliser technology), increased land under irrigation and reduced loss and waste. Where appropriate, it includes an increase in calorie consumption, reflecting the prioritisation of food self-sufficiency above food exports as a desirable policy objective.
The intervention is explained here in the thematic part of the website.
The data on yield per hectare (in metric tons) is for crops but does not distinguish between different categories of crops.
In 2019, the crop yield in Mauritius of 62.3 tons per hectare was 15 times larger than in Gabon — the second most productive country in upper middle-income Africa — at 3.7 tons per hectare, although the forecast is for yield in Mauritius to decline to 57.8 tons in 2043. The Agriculture scenario will marginally increase crop yield from 4.7 tons per hectare in 2019 to 5 tons per hectare in 2043. Compared to the Current Path forecast, the increase in yield in the Agriculture scenario is modest: 1.8 additional tons by 2043 in Botswana, 0.2 in Libya, 0.3 in South Africa, 1.2 in Gabon, and 0.7 in Equatorial Guinea. Agricultural production will increase marginally from 82.4 metric tons in 2019 to 86.3 metric tons in 2043, and in the Agriculture scenario production is set to increase to 91.1 metric tons, with more than 60% of the improvement from South Africa (3 out of 4.8 metric tons). The forecast is that agricultural production will decline in the Agriculture scenario compared to the Current Path forecast in Mauritius, while all other upper middle-income African countries will see an increase.
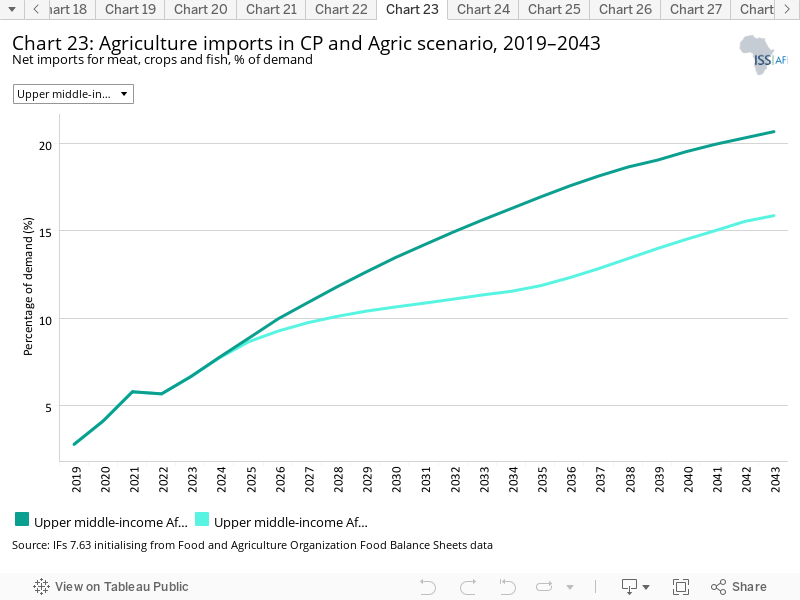
Agricultural import dependence is lowest in Mauritius, Libya and South Africa; in South Africa it is less than 0.5% of demand. Import dependence will increase from 2.8% in 2019 to 20.7% in 2043. By improving productivity, the Agriculture scenario reduces import dependence to 15.8% in 2043 compared to 20.7% in the Current Path forecast. The Agriculture scenario will reduce import dependence by more than 10 percentage points in Gabon and Botswana, and by more than 15 percentage points in Namibia compared to the 2043 Current Path forecast.
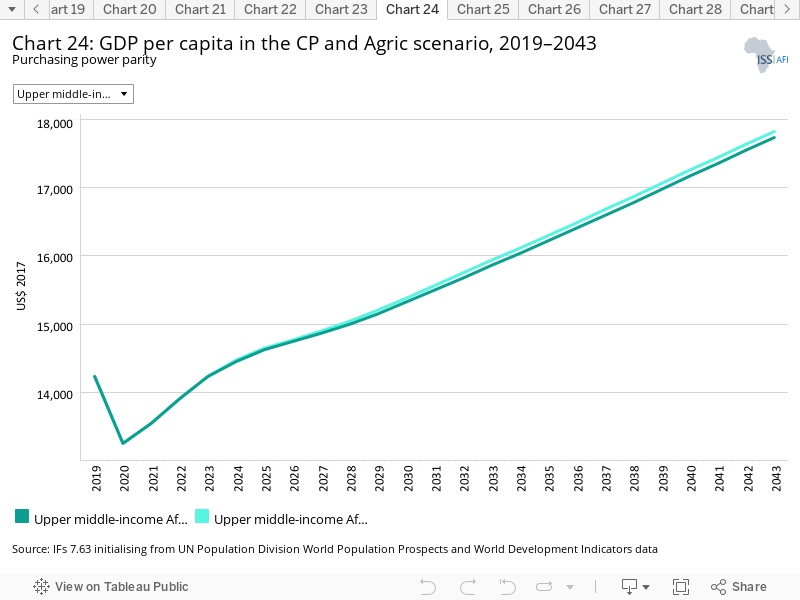
The Agriculture scenario increases GDP per capita by less than 1% in 2043. In the Agriculture scenario, GDP per capita will increase marginally by US$87 compared to the Current Path forecast of US$17 734 in 2043.
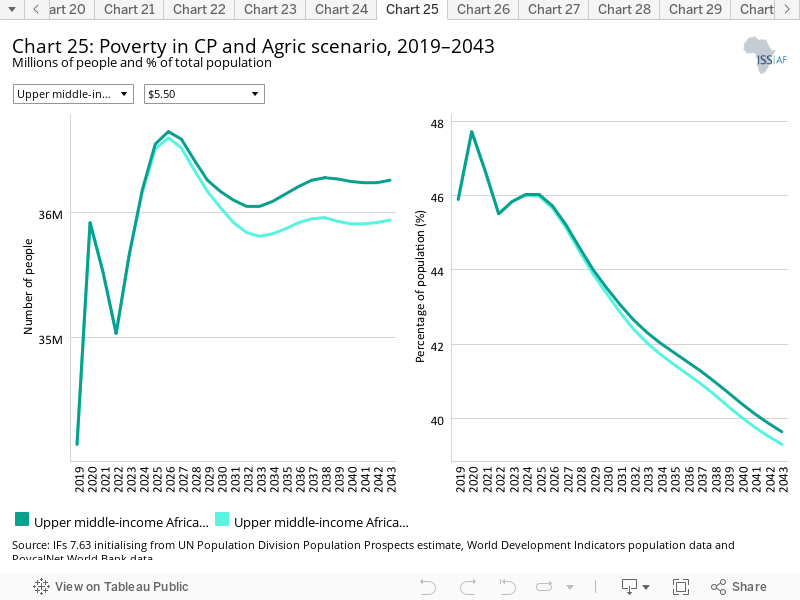
Given the large agriculture sector in upper middle-income Africa, the Agriculture scenario has a significant impact on reducing extreme poverty. Coming off a relatively high base, the number of extremely poor people in the Current Path forecast in the group will decrease from 34.1 million people in 2019 (45.9% of population) to 36.3 million (39.7%) in 2043. Compared to the Current Path, the Agriculture scenario will lift an additional 400 000 people out of poverty and reduce the poverty rate by 0.4 percentage points to 39.4%.
The Education scenario represents reasonable but ambitious improved intake, transition and graduation rates from primary to tertiary levels and better quality of education. It also models substantive progress towards gender parity at all levels, additional vocational training at secondary school level and increases in the share of science and engineering graduates.
The intervention is explained here in the thematic part of the website.
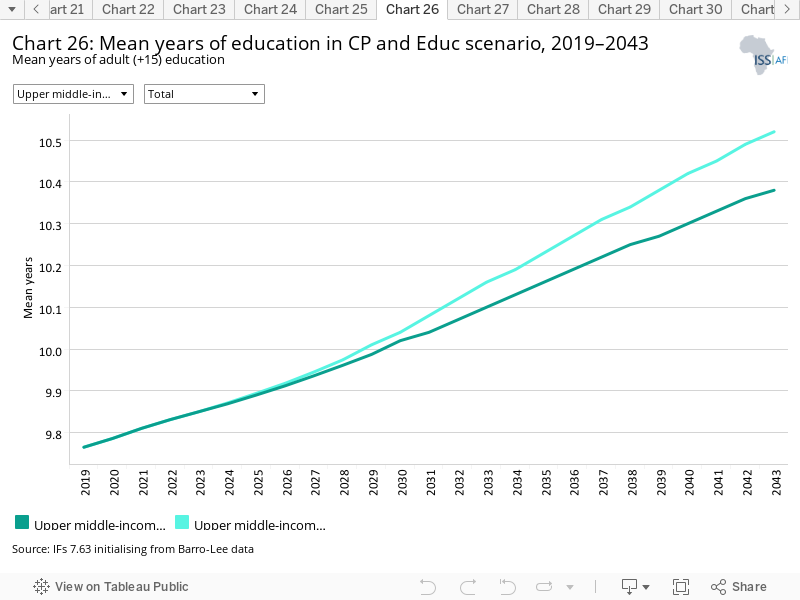
In 2019, the mean years of adult education in Africa was more than two years below the average for South America and around one year below the average for South Asia.
Mean years of education was 9.8 years in 2019, higher than 6.2 for Africa but slightly lower than the average for upper middle-income countries globally. In the Current Path forecast, mean years of adult education will increase to 10.4 years in 2043 and to 10.5 years in the Education scenario. This may not seem like much since education has a lot of inertia and changes only slowly. There is a gender gap in the mean years of education, as females had about 0.17 years more education than men in 2019, which increases to 0.35 in 2043 in the Current Path forecast and to 0.36 in the Education scenario. Compared to the Current Path forecast, the Education scenario will increase adult years of education most in Equatorial Guinea by 0.37 years and the least in Libya by 0.012.
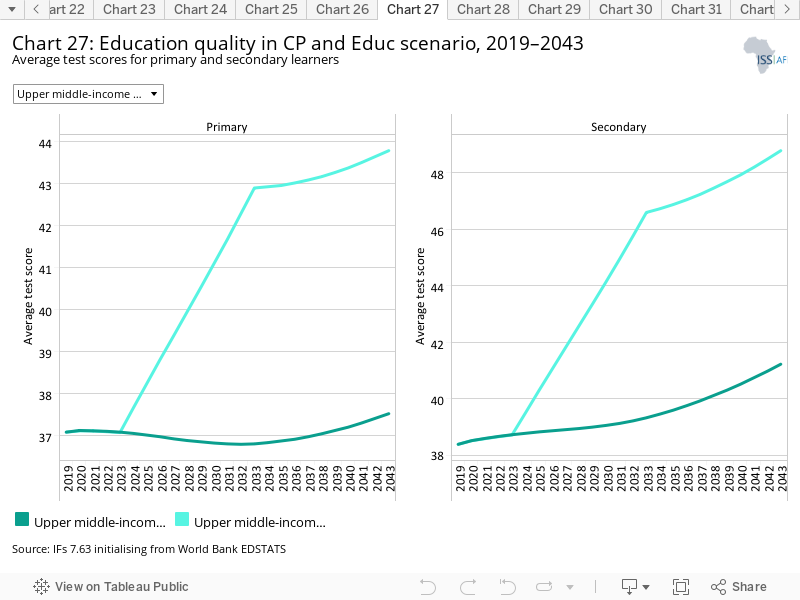
Quality of education is a key predictor of the level of human capital a country enjoys. In the Education scenario, average test scores of primary learners in upper middle-income Africa improve by 17% above the Current Path forecast in 2043 and by 18.4% in the case of secondary learners. Up to 2028, primary test scores are skewed towards males, and thereafter until 2043 female test scores are on average greater than male test scores. However, males test scores are forecast to consistently outweigh female test scores throughout the forecast horizon.
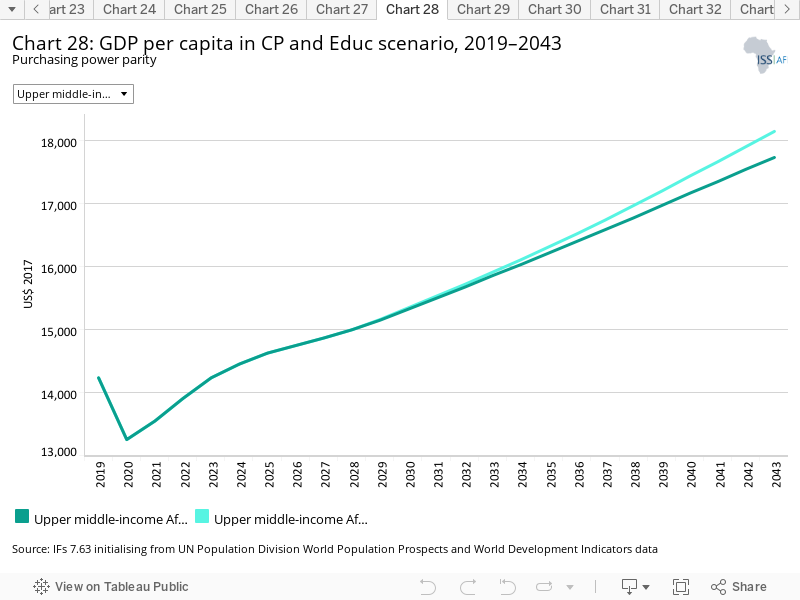
As improvements in education take a long time to work through society, GDP per capita for upper middle-income Africa will only increase by 2.3% in 2043 but the impact is evident in all scenarios. The average GDP per capita for upper middle-income Africa was US$14 235 in 2019, and is set to increase to US$17 734 by 2043 in the Current Path forecast. In the Education scenario, GDP per capita will improve by US$380 to US$18 149 in 2043. The Education scenario improves the 2043 Current Path forecast of GDP per capita by US$649 in Equatorial Guinea, US$715 in Botswana and least by US$375 in South Africa.
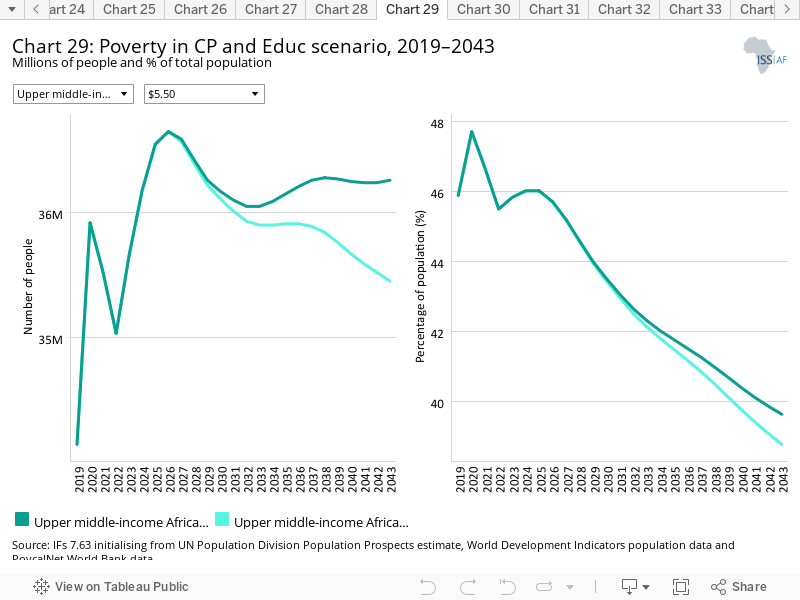
By 2043 in the Education scenario, 800 000 people will be lifted out of poverty compared to the Current Path forecast, representing 0.9 percentage points reduction in extreme poverty. In the Education scenario,poverty will fall to 41%, which is, however, five times higher than the average poverty rate (8.2%) for other upper middle-income economies in 2043.
The Manufacturing/Transfers scenario represents reasonable but ambitious manufacturing growth through greater investment in the economy, investments in research and development, and promotion of the export of manufactured goods. It is accompanied by an increase in welfare transfers (social grants) to moderate the initial increases in inequality that are typically associated with a manufacturing transition. To this end, the scenario improves tax administration and increases government revenues.
The intervention is explained here in the thematic part of the website.
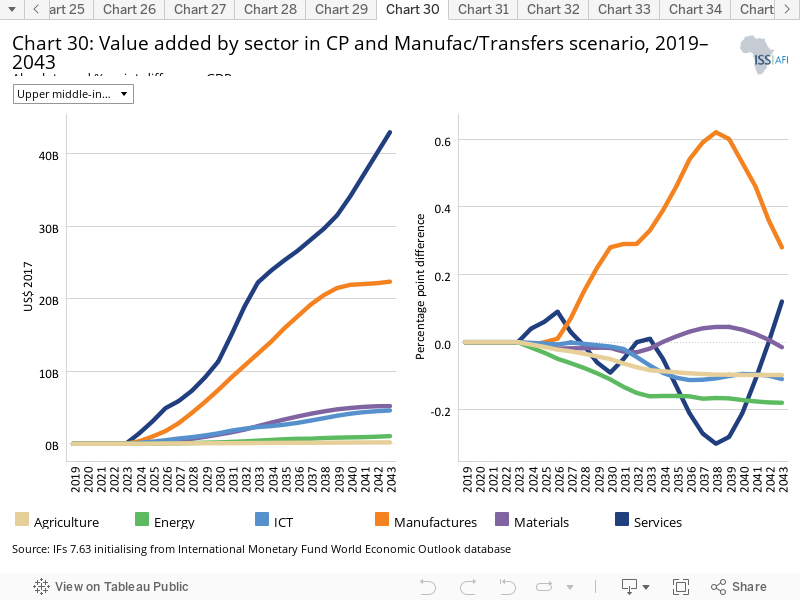
Chart 30 should be read with Chart 8 that presents a stacked area graph on the contribution to GDP and size, in billion US$, of the Current Path economy for each of the sectors.
All sectors will be larger in value by 2043 than the Current Path forecast for that year. The increase in the contribution from the manufacturing sector will be largest, increasing by 2.8 percentage points by 2043, compared to an increase of only 0.12% in the contribution of the service sector. Because it comes from a much higher base, in absolute terms, the service sector will be US$43 billion larger in 2043, while manufacturing adds only US$22.4 billion to GDP. This is because the service sector is half of the economy while the manufacturing sector contributes a quarter to the economy.
Although they will be larger in value compared to the Current Path, the agriculture, ICT and energy sectors will decline in relative importance in 2043. The impact of the scenario increases the size of upper middle-income Africa’s economy by 6.7% above the 2043 Current Path forecast.
The contribution of South Africa’s economy, accounting for 75% of the total economic size within the group, will contribute around 65% by 2043. The strongest growth among the remaining six countries is from Libya that would see its contribution to the upper middle-income group's economy increase from 11% in 2019 to 15% in 2043.
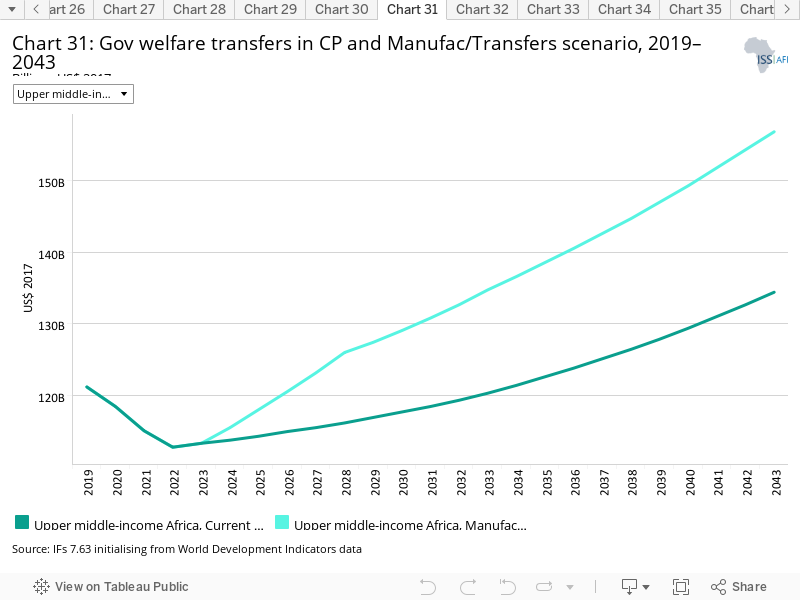
The average government transfer to households in upper middle-income Africa will rise from US$121.2 billion in 2019 to US$134.4 billion in 2043 in the Current Path forecast. The Manufacturing/transfers scenario will add a significant US$22 billion to the Current Path forecast to the total of US$156.7 billion in 2043. The size of transfers in South Africa, at US$108 billion in 2019, dwarfs that of other members of the group. By 2043, South Africa’s transfers will account for US$108.1 billion in the Current Path forecast and US$124 billion in the Manufacturing/Transfers scenario, almost ten times more than that of Libya, the second largest provider of transfers.
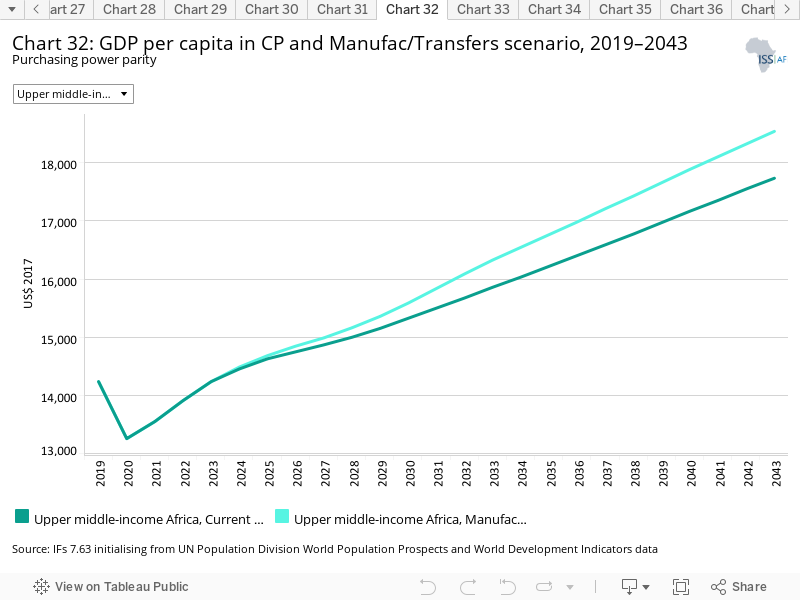
In 2019, the GDP per capita in upper middle-income Africa was US$14 235 — 80% of GDP per capita for other middle-income economies. In the Current Path forecast, upper middle-income Africa will increase its GDP per capita to US$17 734 in 2043. In the Manufacturing/Transfers scenario, GDP per capita increases to US$18 641 in 2043, an addition of US$807 to the Current Path forecast, with most of the increase from Namibia at US$1 358, followed by Botswana at US$1 279. Equatorial Guinea will see a modest increase above the Current Path forecast of US$281 in 2043.
The Manufacturing/Transfers scenario will reduce the number of poor people (using US$5.50) to 34.6 million (37.8%) by 2043, down from 36.3 million (39.7%) in the Current Path forecast for the same year. This scenario will result in a 1.9 percentage point alleviation of extreme poverty by 2043 compared to the Current Path forecast, representing 1.7 million people being lifted out of extreme poverty. Namibia and Botswana will see the greatest reduction in poverty below the Current Path forecast in 2043 of 5.8 and 5.4 percentage points, respectively, while Equatorial Guinea will see a marginal increase in extreme poverty rate above the Current Path forecast by 0.004 percentage points.
The Leapfrogging scenario represents a reasonable but ambitious adoption of and investment in renewable energy technologies, resulting in better access to electricity in urban and rural areas. The scenario includes accelerated access to mobile and fixed broadband and the adoption of modern technology that improves government efficiency and allows for the more rapid formalisation of the informal sector.
The intervention is explained here in the thematic part of the website.
Fixed broadband includes cable modem Internet connections, DSL Internet connections of at least 256 KB/s, fibre and other fixed broadband technology connections (such as satellite broadband Internet, ethernet local area networks, fixed-wireless access, wireless local area networks, WiMAX, etc.).
Upper middle-income Africa had a very low fixed broadband rate at 4.4 subscriptions per 100 people in 2019, although rates in the small island of Mauritius are significantly higher than for other upper middle-income countries. Africa is moving rapidly to mobile broadband as the preferred means of connecting to the internet. In the Leapfrogging scenario, fixed broadband increases to 49.8 subscriptions per 100 people by 2043. This is 20.2 subscriptions more than in the Current Path forecast and lower than the average for other upper middle-income economies.
Mobile broadband refers to wireless Internet access delivered through cellular towers to computers and other digital devices.
Upper middle-income Africa had a mobile broadband subscription rate of 86.4 per 100 people in 2019, 14.3 subscriptions fewer than the average for income group peers in the rest of the world. By 2025, the subscription rate will be approaching 130 subscriptions per 100 people. Since upper middle-income Africa comes from a lower base, subscriptions in the Leapfrogging scenario increase rapidly, reaching 150 subscriptions per 100 people in 2024 instead of in 2031 as in the Current Path forecast. Mobile broadband in upper middle-income Africa is projected to increase to 153.4 subscriptions per 100 people by 2043. This is only 0.6 subscriptions more than the Current Path forecast, given levels of saturation. Equatorial Guinea trails significantly behind other upper middle-income countries both in the current low rates of access as well in the scenario.
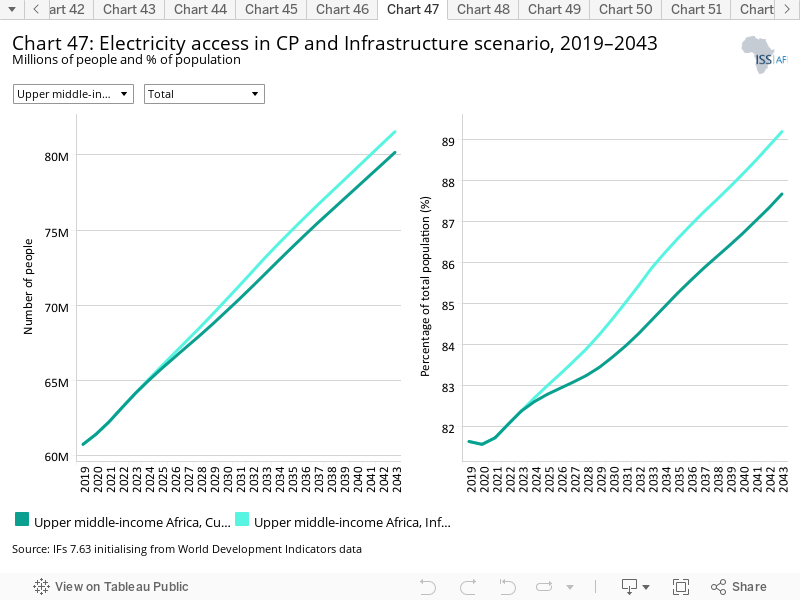
In 2019, 81.6% of upper middle-income Africa (60.7 million people) had access to electricity, lower than the average for other upper middle-income economies (99%) but higher than the average for Africa (53.3%). Namibia (50%), Botswana (62%) and Equatorial Guinea (68%) had particularly low rates of access in 2019 compared to Libya (98%).
In the Current Path forecast, 87.7% of upper middle-income Africa (80.1 million people) will have access to electricity by 2043, still significantly below the rate for upper middle-income economies globally of 99.1%. In the Leapfrogging scenario, electricity access is projected to reach 95% (86.9 million people) by 2043 through the widespread adoption of decentralised renewables such as wind and solar in mini- and off-grid solutions. Coming from low bases of 50.3% and 61.8%, Namibia and Botswana will have the largest improvements in the Leapfrogging scenario in 2043.
Progress in rural areas will, however, lag. In the Current Path forecast, rural electricity access will increase from 77.4% in 2019 to 84% in 2043 and to 95.4% in the Leapfrogging scenario. The disparity in rural electricity access among members of upper middle-income Africa is enormous. Libya had 99.5% rural access in 2019 while Equatorial Guinea had only 9.9% access. In urban upper middle-income Africa, electricity access in the Leapfrogging scenario will be 94.8% in 2043 compared to 88.6% in the Current Path forecast.
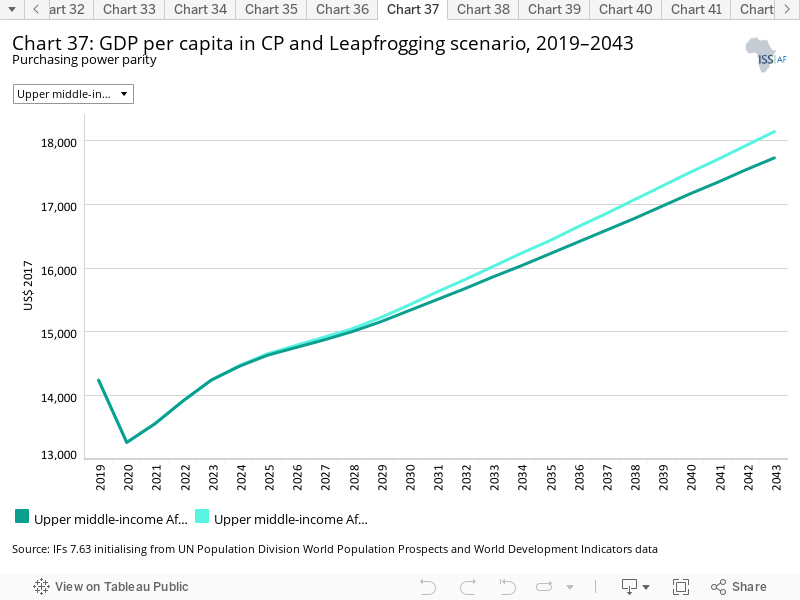
In 2019, the GDP per capita in upper middle-income Africa was US$14 235 — lower than the average GDP per capita for other middle-income economies of US$18 334. In the Current Path forecast, upper middle-income Africa will increase its GDP per capita to US$17 734, US$415 lower than the Leapfrogging scenario of US$18 149 in 2043 due to greater access to electricity, Internet services, the adoption of modern technologies and more rapid formalisation of the informal sector. Namibia and South Africa will see 10 and 8.2 percentage points increase, respectively, in access to electricity in the Leapfrogging scenario above the Current Path forecast. Libya will see the least increase of only 0.38 percentage points.
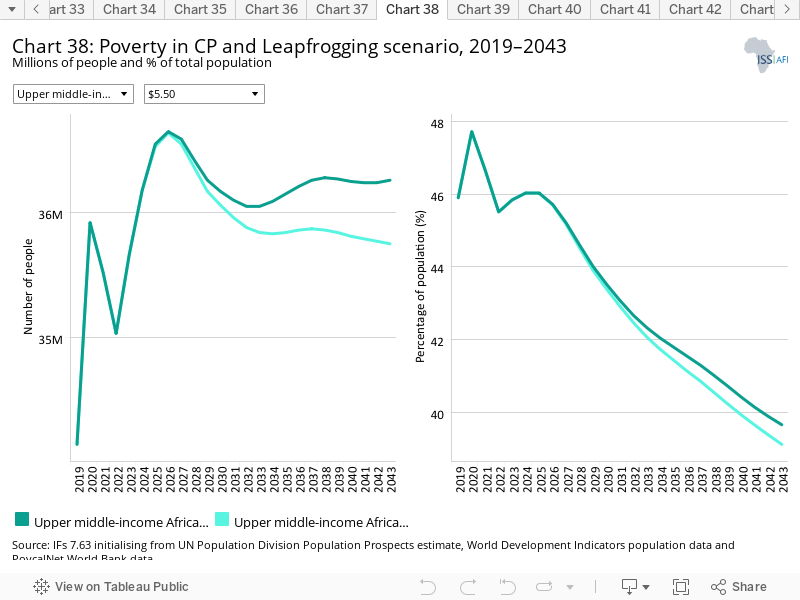
While the poverty rate in upper middle-income Africa reduces from 45.9% in 2019 to 39.7% by 2043 in the Current Path forecast, the number of poor people is set to increase to 36.5 million in 2043 from 34.14 million in 2019. In the Leapfrogging scenario, the poverty rate declines by 0.54 percentage points less than in the Current Path forecast amounting to 500 000 fewer people in poverty in 2043. The poverty gains from the Leapfrogging scenario are due to increased access to electricity, Internet services and the adoption of modern technologies in government.
The three countries that experience the lowest extreme poverty in the Leapfrogging scenario in 2043 are Libya (1.8%), Equatorial Guinea (5.2%) and Mauritius (7.9%). In spite of large oil revenues for a small population, Equatorial Guinea has a high poverty rate — 97.8% in 2019 declining to 95% by 2043 in the Current Path forecast. In the Leapfrogging scenario, extreme poverty in Equatorial Guinea declines to 94.5%.
The Free Trade scenario represents the impact of the full implementation of the African Continental Free Trade Area (AfCFTA) by 2034 through increases in exports, improved productivity and increased trade and economic freedom.
The intervention is explained here in the thematic part of the website.
The trade balance is the difference between the value of a country's exports and its imports. A country that imports more goods and services than it exports in terms of value has a trade deficit, while a country that exports more goods and services than it imports has a trade surplus.
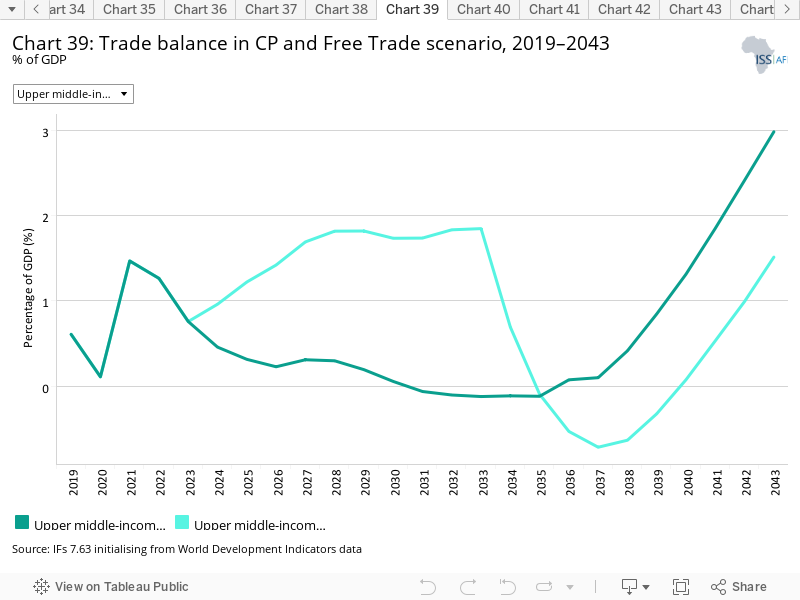
In 2019, upper middle-income Africa enjoyed a trade surplus of 0.61% of GDP, which quickly increased to 1.47% in 2021. In the Current Path, the income group will enjoy a trade surplus until 2030 and between 2031 and 2035 trade balance will turn negative. From 2038 to 2043, the trade balance will surge to a 2.98% surplus. In the Free Trade scenario, the trade balance will remain positive until 2034, when it will dip between 2035 and 2040. As a result, the Free Trade scenario will lead to a worse trade balance of 1.5% compared to 3% in the Current Path in 2043.
Although the implementation of the AfCFTA is an important step in the structural transformation of African economies towards higher-value production, the results reflect the importance of additional efforts to incentivise Africa’s manufacturing sector, reflected in the Manufacturing/Transfers scenario.
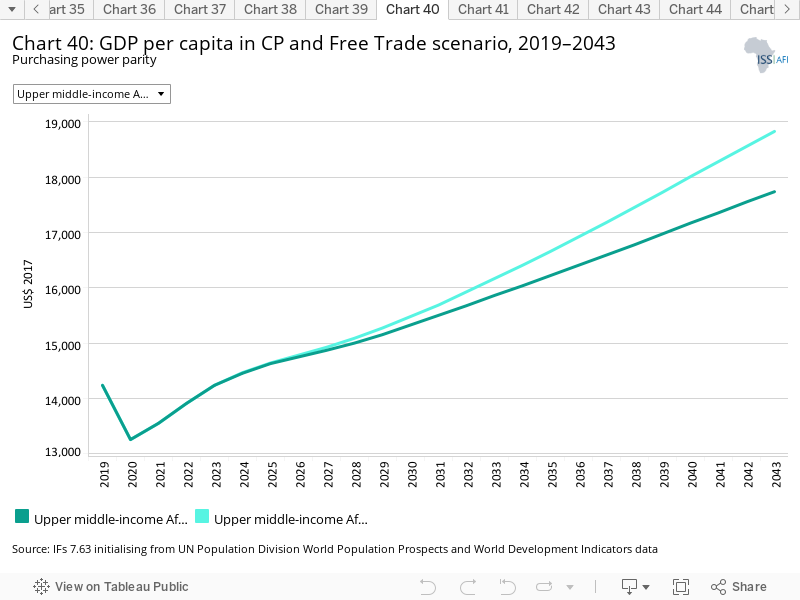
In 2019, the GDP per capita in upper middle-income Africa was US$14 235, lower than the GDP per capita of other upper middle-income countries. In the Current Path forecast, upper middle-income Africa will fall behind income group peers to 62% of their GDP per capita in 2043. In 2043, GDP per capita for upper middle-income Africa will be US$17 734.
In the Free Trade scenario, GDP per capita increases in upper middle-income Africa to US$18 824, an improvement of 6% compared to the Current Path forecast for 2043.
Trade openness will reduce poverty in the long term after initially increasing it due to the redistributive effects of trade. Most African countries export primary commodities and low-tech manufacturing products, and therefore a continental free trade agreement (AfCFTA) that reduces tariffs and non-tariff barriers across Africa will increase competition among countries in primary commodities and low-tech manufacturing exports. Countries with inefficient, high-cost manufacturing sectors might be displaced as the AfCFTA is implemented, thereby pushing up poverty rates. In the long term, as the economy adjusts and produces and exports its comparatively advantaged (lower relative cost) goods and services, poverty rates will decline.
While the poverty rate in upper middle-income Africa modestly reduces from 45.9% in 2019 to 39.7% in 2043 in the Current Path, the number of poor people is set to increase from 34.14 million in 2019 to 36.3 million in 2043. In the Free Trade scenario, the poverty rate declines to 37.7%, with 2 million fewer people living in extreme poverty in 2043 compared to the Current Path forecast. By 2043, only Botswana will be close to joining Mauritius and Libya in eliminating extreme poverty (to under 3% using US$1.90). Using US$5.50, only Mauritius will effectively have eliminated extreme poverty by 2043 although the impact of the Free Trade scenario on poverty reduction on the island is marginal.
The Free Trade scenario makes a modest contribution to lower rates of extreme poverty in upper middle-income Africa and its impact is only evident towards the end of the forecast horizon. On its own, the scenario is insufficient to bring about a substantive decline.
The Financial Flows scenario represents a reasonable but ambitious increase in worker remittances and aid flows to poor countries, and an increase in the stock of foreign direct investment (FDI) and additional portfolio investment inflows to middle-income countries. We also reduced outward financial flows to emulate a reduction in illicit financial outflows.
The intervention is explained here in the thematic part of the website.
Aid has traditionally been sent to poor countries, and as such upper middle-income Africa receives little aid, except for Namibia which received the equivalent of 2.1% of GDP in aid in 2019. Foreign aid constituted 0.61% of GDP in upper middle-income Africa in 2019, below the average for Africa of 2.38%, decreasing to 0.12% in the Current Path forecast by 2043 (equivalent to a US$1.4 billion reduction).
In the Financial Flows scenario, foreign aid, already at low levels in upper middle-income Africa, is set to decrease to 0.10% of GDP, or by 0.02 percentage points, compared to the Current Path forecast in 2043. Because most foreign aid goes to low-income countries, low-income African countries will see a 13% increase in aid receipt in the Financial Flows scenario compared to the Current Path forecast in 2043. By comparison, Africa’s seven upper middle-income countries actually experience an 11% decline in their aid receipts when expressed as a percentage of GDP.
Africa is steadily attracting more FDI as a percentage of GDP, although the improvement is slow. In the Current Path forecast, FDI inflows to upper middle-income Africa increase from 2.3% of GDP in 2019 to 3.2% in 2043, whereas in the Financial Flows scenario FDI inflows increase by 0.7 percentage points above the Current Path forecast in 2043.
Inflows of FDI, as a percentage of GDP, to Libya and Namibia were 6.2% and 4.9%, respectively, in 2019, and in Equatorial Guinea (at 1.8% in 2019) inflows will grow by 86% between 2019 and 2043, so that in 2043 FDI inflows will stand 12.6%. Much of this inflow will be in the oil and gas sectors of the country.
The Financial Flows scenario accelerates these forecasts such that in 2043 Equatorial Guinea attracts 13.7% of GDP in FDI (11.6% in the Current Path forecast). Expressed as a percentage of GDP, South Africa attracts the least FDI, although the actual numbers are large given the size of its economy. South Africa, Libya, Mauritius, Gabon and Botswana will increase between 2019 and 2043, while inflows decline in Namibia Equatorial Guinea as investments in search of natural resources in these countries wane.
FDI inflows in Africa will increase to 3.8% of GDP in the Financial Flows scenario, a 0.67 percentage points improvement on than the Current Path forecast in 2043. The stock of FDI in upper middle-income Africa, at US$239 billion in 2019, will increase to US$617.3 billion in the Financial Flows scenario in 2043, an improvement of US$109.9 billion above the 2043 Current Path forecast.
Upper middle-income Africa countries are collectively remittance senders. In 2019, outward remittance flows amounted to US$3.19 billion (0.47% of GDP) which will increase to US$7.6 billion (0.66% of GDP) in the 2043 Current Path forecast and to US$7.9 billion (0.67% of GDP) in the Financial Flows scenario.
Compared to its income group peers, upper middle-income countries in Africa are net remittance senders, whereas other upper middle-income countries are on average remittance receivers across the forecast horizon. Viewed as a percentage of GDP, remittance outflows from Mauritius and Libya are significantly larger than for other upper middle-income countries.
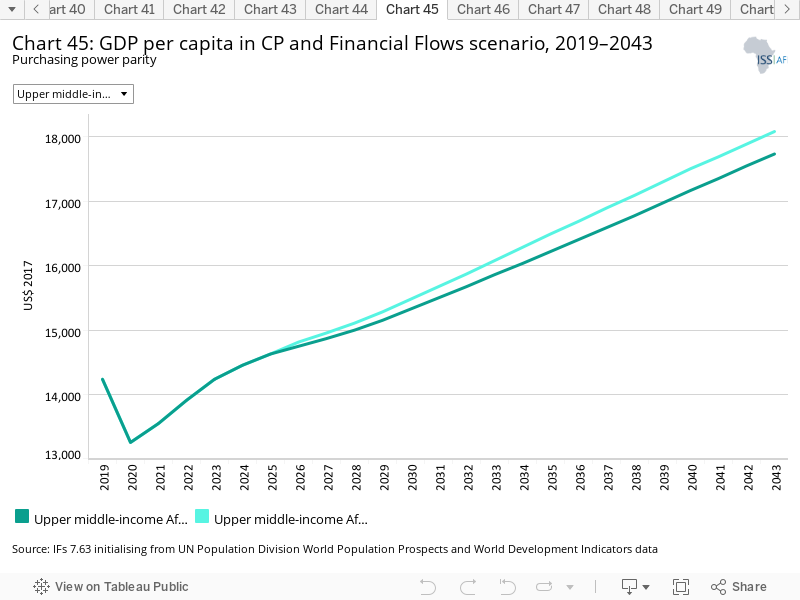
In 2019, the income group’s GDP per capita of US$14 235 was below the average for upper middle-income countries globally at US$18 334. In the Current Path forecast, upper middle-income Africa will increase its GDP per capita to US$17 734, which is US$11 053 lower than the average GDP per capita for upper middle-income countries globally in 2043. In the Financial Flows scenario, GDP per capita increases to US$18 083 in 2043, mainly due to FDI inflows to resource-rich countries in upper middle-income Africa.
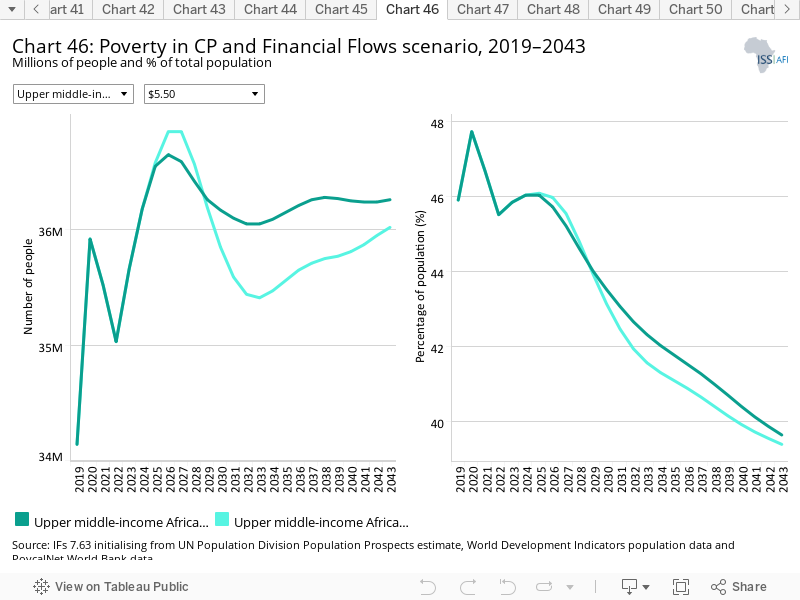
In the Current Path forecast, the poverty rate reduces from 45.9 in 2019 to 39.6% in 2043 (at the US$5.50 poverty line), but the number of poor people is set to increase from 34.14 million to 36.3 million people between 2019 and 2043. In the Financial Flows scenarios, the poverty rate declines marginally (0.22 percentage points or 0.24 million fewer extremely poor people). More aid, FDI, and less illicit financial outflows are insufficient to reduce extreme poverty and increase incomes. Much more is required to unlock rapid growth, grow incomes and achieve structural transformation of upper middle-income African economies.
The reduction in poverty in the Financial Flows scenario compared to the Current Path in 2043 is not the same throughout the income group: the reduction in Namibia will be 1.3 percentage points, Mauritius 0.4 percentage points, and least in South Africa with 0.2 percentage points.
The Infrastructure scenario represents a reasonable but ambitious increase in infrastructure spending across Africa, focusing on basic infrastructure (roads, water, sanitation, electricity access and ICT) in low-income countries and increasing emphasis on advanced infrastructure (such as ports, airports, railway and electricity generation) in higher-income countries.
Note that health and sanitation infrastructure is included as part of the Health/WaSH scenario and that ICT infrastructure and more rapid uptake of renewables are part of the Leapfrogging scenario. The interventions there push directly on outcomes, whereas those modelled in this scenario increase infrastructure spending, indirectly boosting other forms of infrastructure, including those supporting health, sanitation and ICT.
The intervention is explained here in the thematic part of the website.
In upper middle-income Africa, nearly 1.5 million more people will have access to electricity in 2043 compared to the Current Path forecast of 80.17 million. Already at almost 100% access, improvements in Libya are minimal. Gabon, Mauritius and South Africa all have access rates of above 80% and all register solid improvements. Access in Namibia in 2019 stood at 50%, improving to 78% in the Current Path forecast and to 79% in the Infrastructure scenario.
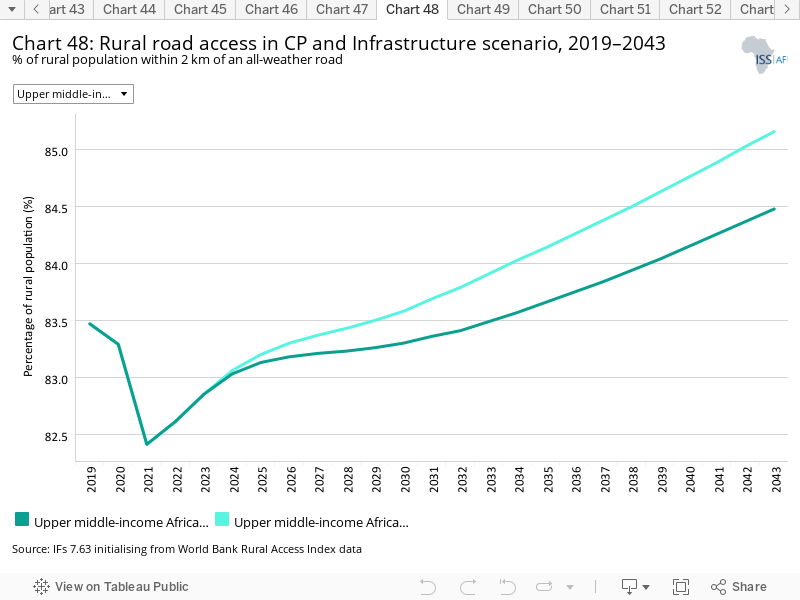
Indicator 9.1.1 in the Sustainable Development Goals refers to the proportion of the rural population who live within 2 km of an all-season road and is captured in the Rural Access Index.
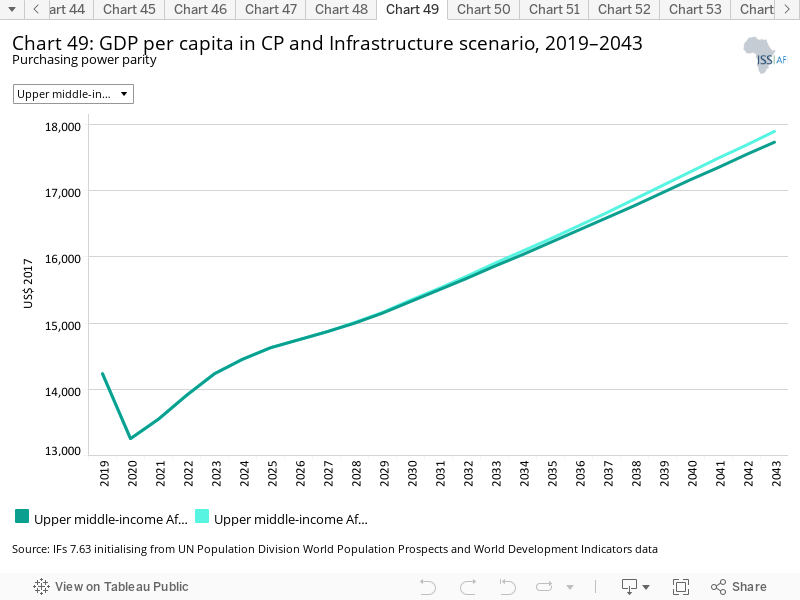
The proportion of the population in upper middle-income Africa with access to an all-season road is set to increase from 83.5% in 2019 to 84.5% 2043 in the Current Path forecast and to 85.2% in the Infrastructure scenario, equivalent to an additional 17.4 million rural upper middle-income Africans with such access. The Infrastructure scenario will add an additional 3 and 1.6 percentage points of rural population with all-season access to roads in Libya and Mauritius, respectively. The intervention adds around 25 000 km of paved roads to upper middle-income African countries by 2043 above the Current Path forecast.
In 2019, GDP per capita in upper middle-income Africa was US$14 235, lower than the global average for middle-income countries. In the Current Path forecast, upper middle-income Africa will increase its GDP per capita to US$17 734. In the Infrastructure scenario, GDP per capita increases marginally to US$17 898 in 2043, adding less than US$200 to the Current Path forecast value. The additional increase in the Infrastructure scenario will accrue to greater spending on advanced infrastructure.
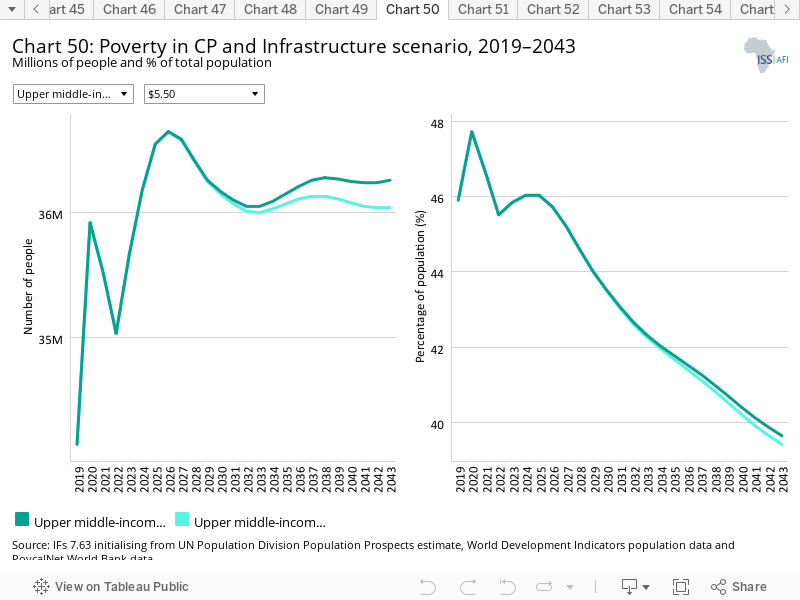
Poverty rate (at the US$5.50 poverty line) in Africa is set to reduce from 45.9% to 39.7%, and the number of poor people from 34.14 million to 36.46 million between 2019 and 2043, respectively. In the Infrastructure scenario, the poverty rate will decline marginally (0.23 percentage points) compared to the Current Path forecast, amounting to 0.22 million fewer people in poverty in 2043.
The Governance scenario represents a reasonable but ambitious improvement in accountability and reduces corruption, and hence improves the quality of service delivery by government.
The intervention is explained here in the thematic part of the website.
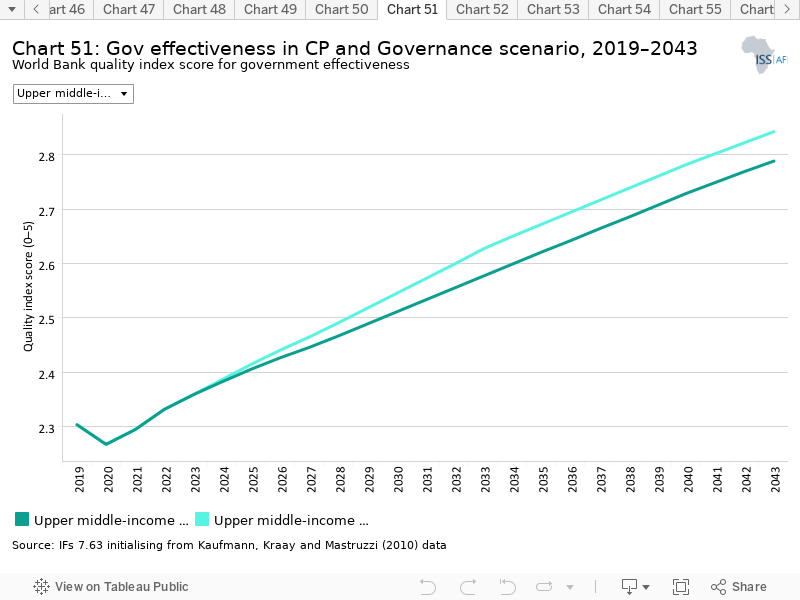
As defined by the World Bank, government effectiveness ‘captures perceptions of the quality of public services, the quality of the civil service and the degree of its independence from political pressures, the quality of policy formulation and implementation, and the credibility of the government’s commitment to such policies’.
Chart 51 presents the impact of the interventions in the Governance scenario on government effectiveness.
Upper middle-income Africa scored 2.3 out of a possible 5 in the World Bank government effectiveness index in 2019. (Africa scored 1.7 and upper middle-income countries globally scored 2.4.) Government effectiveness in upper middle-income Africa is above the average for Africa but below the global average, although scores range from 3.6 for Mauritius to 0.98 for Equatorial Guinea. Government effectiveness in upper middle-income Africa is forecast to improve to 2.84 in 2043 as a result of more democratic accountability, representing a 2% improvement on the Current Path.
Coming from a very low base, in 2043 Equatorial Guinea will experience a 16% improvement in government effectiveness, followed by 4% in Libya. The countries that will gain the least improvements in government effectiveness by 2043 are those that already do well, namely Botswana and Mauritius. South Africa had the third highest score in 2019, and by 2043 it will be overtaken by Namibia — both in the Current Path forecast and in the Governance scenario. Whereas in 2019 the average government effectiveness score in upper middle-income Africa was less than the average for upper middle-income countries globally, by 2043 it will be greater in the Governance scenario.
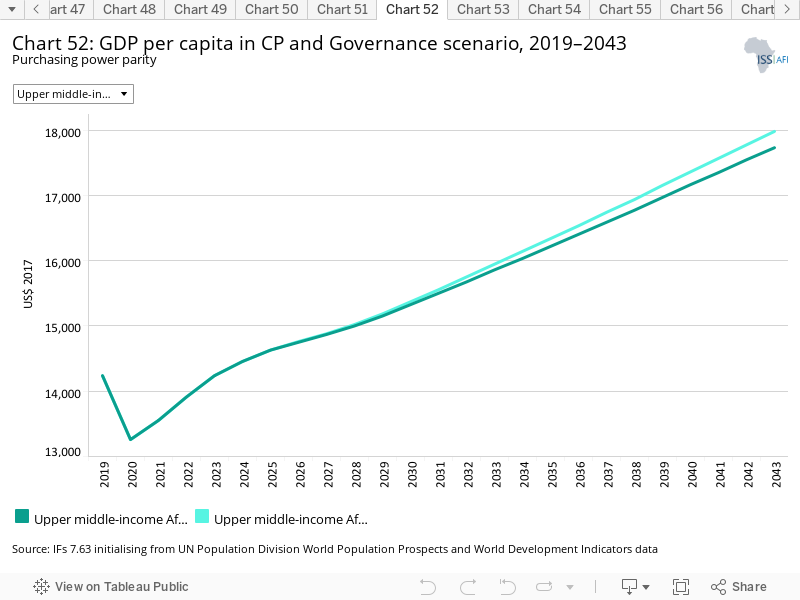
In 2019, the GDP per capita in Africa was US$14 235, which was lower than the average GDP per capita for other upper middle-income economies of US$18 399. More democratic accountability improves GDP per capita by 1.4% above the Current Path forecast in 2043 to US$7 985, with the largest impact in Equatorial Guinea.
While Africa’s poverty rate reduces from 45.9% in 2019 to 39.7% in 2043 in the Current Path forecast, the number of poor people is set to increase from 34.1 million to 36.3 million people between 2019 and 2043. On its own, the Governance scenario reduces extreme poverty marginally (0.4 percentage points) below the Current Path forecast to 35.9% in 2043. This amounts to 500 000 fewer people in extreme poverty compared to the Current Path forecast in 2043. Generally, more accountability and democracy serve as a force multiplier in other scenarios.
This section presents projections for carbon emissions in the Current Path for upper middle-income Africa and the 11 scenarios. Note that IFs uses carbon equivalents rather than CO2 equivalents.
In 2019, upper middle-income African countries released 166 million tons of carbon and, after recovering from the impact of the COVID-19 pandemic, emissions are expected to generally increase in all scenarios until around 2031, driven by the carbon intensity of the large South African economy which releases around 80% of emissions in the group. As South Africa transitions to renewable energy and decommissions its fleet of high-polluting coal stations, the carbon intensity of all scenarios declines. The result is that all scenarios at the income group level eventually have lower carbon emissions towards the end of the forecasting horizon. The forecast for South Africa also constrains the growth in carbon emissions of the group which would otherwise increase much more sharply. In 2043, upper middle-income Africa will release the most carbon in the Free Trade scenario (161 million tons), followed by the Manufacturing/Transfers scenario (160 million tons). Because of the growth in renewables, carbon emissions in the Leapfrogging scenario are below the Current Path forecast and this scenario sees the least carbon emitted (151 million tons in 2043).
The Combined Agenda 2063 scenario consists of the combination of all 11 sectoral scenarios presented above, namely the Stability, Demographic, Health/WaSH, Agriculture, Education, Manufacturing/Transfers, Leapfrogging, Free Trade, Financial Flows, Infrastructure and Governance scenarios. The cumulative impact of better education, health, infrastructure, etc. means that countries get an additional benefit in the integrated IFs forecasting platform that we refer to as the synergistic effect. Chart 55 presents the contribution of each of these 12 components to GDP per capita in the Combined Agenda 2063 scenario as a stacked area graph.
The GDP per capita in upper middle-income Africa in 2019 was US$14 235 and will increase to US$17 734 in the Current Path forecast by 2043. It increases most in the Free Trade scenario, reflecting the huge potential that the full implementation of the AfCFTA has on Africa’s prospects, of US$1 090, followed by the Manufacturing/Transfers scenario of US$807.
The Health/WaSH and Governance scenarios make the smallest contribution to GDP per capita by 2043.
Whereas Chart 55 presents a stacked area graph on the contribution of each scenario to GDP per capita as well as the additional benefit or synergistic effect, Chart 56 presents only the GDP per capita in the Current Path forecast and the Combined Agenda 2063 scenario.
In 2019, GDP per capita in upper middle-income Africa was US$14 235 and will increase to US$17 734 on the Current Path forecast by 2043. In the Combined Agenda 2063 scenario, GDP per capita increases significantly to US$21 985 in 2043 — a difference of US$4 251, or 24%, above the Current Path forecast.
In percentage terms, Namibia gains the most from the Combined Agenda 2063 scenario. In 2043, its GDP per capita will be 52% larger than the Current Path forecast for that year, followed by South Africa (24%) and Gabon (24%). The countries that gain the least are Equatorial Guinea (17%) and Mauritius (18%).
Using the absolute value increase above the 2043 Current Path forecast as a measure of improvement, Namibia does the best, adding US$7 968 to its Current Path forecast, followed by Libya at US$6 769. The countries that gain the least in absolute terms above the 2043 Current Path forecast are South Africa (US$3 641) and Gabon (US$4 840).
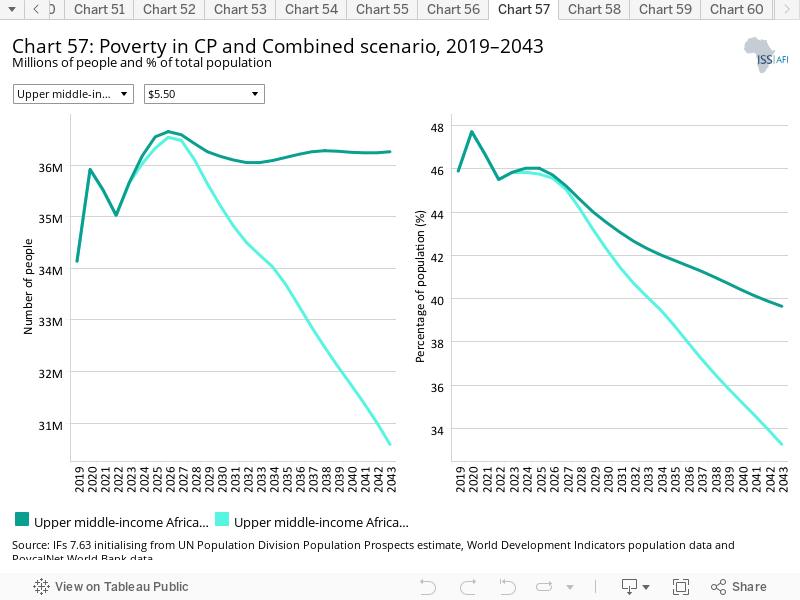
In the Combined Agenda 2063 scenario, the poverty rate (using US$5.50) in upper middle-income Africa will decline significantly from 46% in 2019 to 33% in 2043, compared to 40% on the Current Path forecast for that year. This will equal 5.67 million fewer people in extreme poverty compared to the Current Path forecast in 2043. Individually, extreme poverty (at US$5.50 poverty line) was highest in Equatorial Guinea (98%), Namibia (66%) and South Africa (50%), and lowest in Libya (20%) and Mauritius (7.7%) in 2019. Compared to the 2043 Current Path forecast, the Combined Agenda 2063 scenario will reduce poverty rates most in South Africa (by 4 percentage points) Namibia (by 0.7 percentage points) and Gabon (by 0.3 percentage points), and least in Mauritius (0.03) because of its low base.
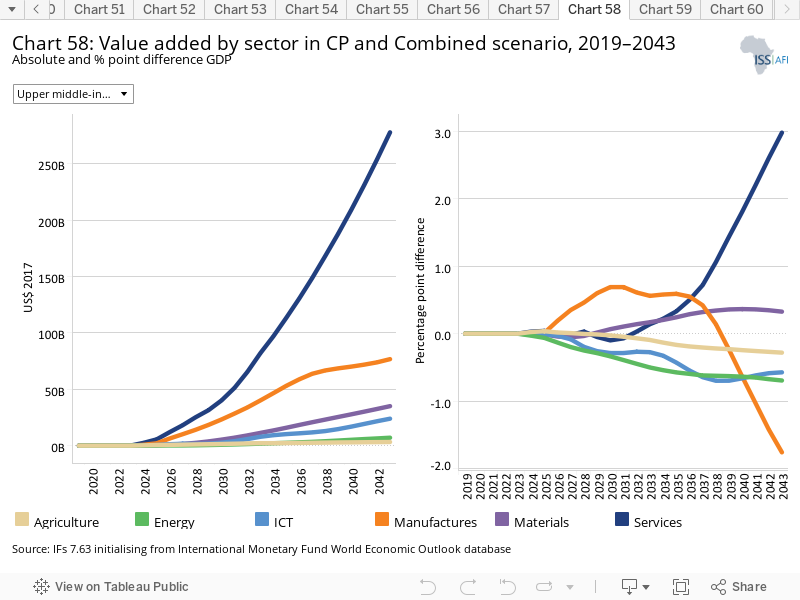
See Chart 8 to view the Current Path forecast of the sectoral composition of the economy.
By 2043, all sectors are larger in value in the Combined Agenda 2063 scenario compared to the Current Path forecast for that year. The service and materials sectors increase their share of GDP by 2.98 and 0.33 percentage points, respectively, in 2043, while all other sectors will reduce in significance in share of GDP, the biggest decrease being the manufacturing sector at −1.76 percentage points. In terms of the added value of contribution, the service sector will make the greatest contribution to GDP in the Combined Agenda 2063 scenario of US$277.95 billion followed by the manufacturing sector of US$76.74 billion; and the smallest increase in contribution to GDP is in the agriculture sector at US$3.2 billion.
In Botswana, the manufacturing sector will see the largest increase in its value added as a share of GDP by 9.07 percentage points, or US$10.2 billion, while its contribution drops most significantly in Libya (by −3.3 percentage points) in 2043. The service sector grows most dramatically in Mauritius.
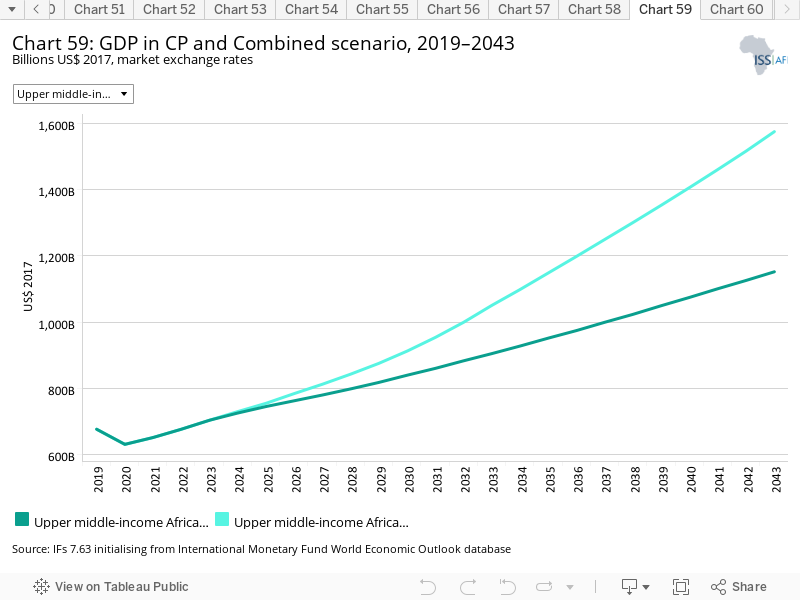
In the Current Path forecast, Africa’s economy will grow from US$675.8 billion in 2019 to US$1 152.1 billion in 2043. In the Combined Agenda 2063 scenario, the upper middle-income African economy is set to increase to US$1 576.1 billion, more than 10% larger than the Current Path forecast in 2043. As the largest economy in upper middle-income Africa, South Africa will make the greatest addition to the Current Path forecast of US$294.5 billion, followed in distant second by Libya of US$33.4 billion; the smallest compared to the Combined Agenda 2063 scenario are made by Mauritius and Equatorial Guinea.
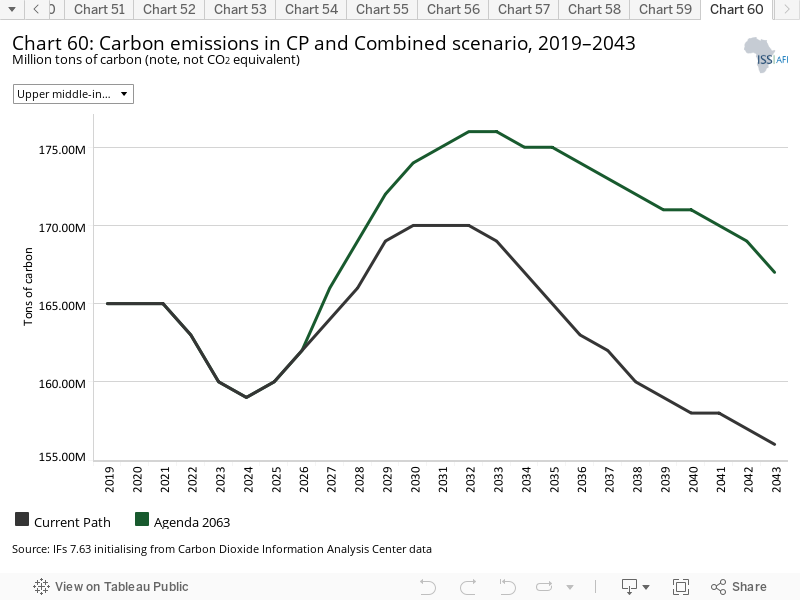
Carbon emissions will decrease from 165 million tons in 2019 to 156 million tons in 2043 in the Current Path forecast, driven by the steady decline in South Africa’s carbon intensity as it decommissions its ageing coal-fired electricity plants. In the Combined Agenda 2063 scenario, carbon emissions are set to increase very slightly above the 2019 level to 167 million tons in 2043, 11 million tons more compared to the Current Path forecast. Given the size of its economy, South Africa will still be the largest carbon emitter (at 114.7 million tons) in the Combined Agenda 2063 scenario. Mauritius, by virtue of its small size, will be the smallest carbon emitter at 2.07 million tons.
Page information
Contact at AFI team is Mustapha Jobarteh
This entry was last updated on 30 June 2024 using IFs v7.63.
Donors and sponsors


Reuse our work
- All visualizations, data, and text produced by African Futures are completely open access under the Creative Commons BY license. You have the permission to use, distribute, and reproduce these in any medium, provided the source and authors are credited.
- The data produced by third parties and made available by African Futures is subject to the license terms from the original third-party authors. We will always indicate the original source of the data in our documentation, so you should always check the license of any such third-party data before use and redistribution.
- All of our charts can be embedded in any site.
Cite this research
Mustapha Jobarteh (2025) Upper middle-income Africa. Published online at futures.issafrica.org. Retrieved from https://futures.issafrica.org/geographic/income-groups/upper-middle-income-africa/ [Online Resource] Updated 30 June 2024.