 Lower middle-income Africa
Feedback welcome
Our aim is to use the best data to inform our analysis. See our Technical page for information on the IFs forecasting platform. We appreciate your help and references for improvements via our feedback form.
In this entry, we first describe the Current Path forecast for Lower Middle-Income Africa (LMI Africa) as it is expected to unfold to 2043, the end of the third ten-year implementation plan of the African Union’s Agenda 2063 long-term vision for Africa. The Current Path in the International Futures (IFs) forecasting model initialises from country-level data that is drawn from a range of data providers. We prioritise data from national sources.
The Current Path forecast is divided into summaries on demographics, economics, poverty, health/WaSH and climate change/energy. A second section then presents a single positive scenario for potential improvements in stability, demographics, health/WaSH, agriculture, education, manufacturing/transfers, leapfrogging, free trade, financial flows, infrastructure, governance and the impact of various scenarios on carbon emissions. With the individual impact of these sectors and dimensions having been considered, a final section presents the impact of the Combined Agenda 2063 scenario.
We generally review the impact of each scenario and the Combined Agenda 2063 scenario on gross domestic product (GDP) per person and extreme poverty except for Health/WaSH that uses life expectancy and infant mortality.
The information is presented graphically and supported by brief interpretive text.
All US$ numbers are in 2017 values.
Summary
- Current Path forecast
- The total population of LMI Africa was 697.8 million in 2019 and is expected to increase to 1 170 million by 2043. As a result of its youthful population, LMI Africa will only benefit from demographic dividend during the second half of the 21st century. Jump to Demographics: Current Path
- The population and size of the economies of member states differ greatly. In 2019, the economies in LMI Africa ranged in size from US$560.7 billion in Nigeria to US$317 million in São Tomé and Príncipe. Jump to Economics: Current Path
- Because of its high rates of population growth and relatively slow economic growth, the number of extremely poor people (using US$3.20) in LMI Africa will increase from 349.3 million in 2019 to 448.4 million in 2043 in the Current Path forecast. In 2019, extreme poverty at US$3.20 was highest in Benin (72.6%) and Zambia (72.4%) and lowest in Algeria (2.1%). Jump to Poverty: Current Path
- LMI Africa countries emitted 228.7 million tons of carbon in 2019 — an amount that will almost triple to 628.5 million tons by 2043. Egypt is the largest emitter. Jump to Carbon emissions/Energy: Current Path
- Sectoral scenarios
- The Stability scenario models an improvement to current average levels of stability in Africa and reduces the number of extremely poor people by 17.4 million in 2043 compared to the Current Path forecast. Jump to Stability scenario
- The Demographic scenario reduces fertility rates to the extent that LMI Africa enters the demographic dividend in 2041 instead of 2053. Jump to Demographic scenario
- The impact of the Health/WaSH scenario is an increase of life expectancy in LMI Africa by seven months by 2043. Jump to Health/WaSH scenario
- With significant agricultural potential, average crop yields in LMI Africa increase by 44% in the Agriculture scenario and reduce the percentage of people living in extreme poverty by almost 5 percentage points to 33.3% by 2043. Jump to Agriculture scenario
- The impact of the Education scenario on GDP per capita within the group is the largest in Eswatini and Egypt. The GDP per capita increases by US$614 and US$526, respectively, by 2043, compared to the Current Path forecast for that year. Jump to Education scenario
- Ghana gains the largest percentage point increase in the size of its manufacturing sector in the Manufacturing/Transfers scenario, followed by Cameroon and Nigeria. Comoros gains the least, and the size of the manufacturing sector will decline in Lesotho, Egypt, Zimbabwe and Eswatini. Jump to Manufacturing/Transfers scenario
- In 2019, fixed broadband access per 100 people in LMI Africa stood at 3.8, and in the Current Path forecast it is set to increase to 26.5 per 100 people by 2043. In the Leapfrogging scenario, that rate almost doubles to 47.5, with large country to country variations. Jump to Leapfrogging scenario
- Tanzania and Senegal will realise the greatest decline in extreme poverty in 2043 as a result of the impact of the Leapfrogging scenario, compared to the Current Path forecast, followed by Nigeria. Jump to Free Trade scenario
- The flow of remittances in the Financial Flows scenario is set to increase by US$16.1 billion in 2043 compared to the Current Path forecast in that year. The improvement is largest in Nigeria and Egypt. Jump to Financial Flows scenario
- The Republic of the Congo gains most from the Infrastructure scenario, improving rural access to an all-season road by 6.4 percentage points by 2043, followed by Comoros. Jump to Infrastructure scenario
- The Governance scenario improves government effectiveness by 9% in 2043 above the Current Path forecast. The Republic of the Congo improves the most (12.6%) and Cape Verde the least (0.3%). Jump to Governance scenario
- In 2019, Egypt was the largest carbon emitter in LMI Africa, followed by Algeria. Looking to 2043, the Free Trade scenario is the most carbon-intensive scenario for LMI Africa. Jump to Impact of scenarios on carbon emissions
- Combined Agenda 2063 scenario
- In 2019, the average GDP per capita in LMI Africa was US$2 826. In the Current Path forecast, it will increase to US$9 142 in 2043. It could be US$14 562 in 2043 in the Combined Agenda 2063 scenario, which is 91.4% larger than the Current Path forecast for that year. Tanzania will experience the largest decline in extreme poverty at 35.7 percentage points by 2043, compared to the Current Path forecast. In the Combined Agenda 2063 scenario, LMI Africa will release 836 million tons of carbon in 2043, compared to 629 million tons in the Current Path forecast. Jump to Combined Agenda 2063 scenario
All charts for Lower middle-income Africa
- Chart 1: Political map of LMI Africa
- Chart 2: Population structure in CP, 1990–2043
- Chart 3: Urban and rural population in CP, 1990–2043
-
Chart 4: Population density map for 2019
Chart 4: Population density map for 2019
 Source: Source goes here
 - Chart 5: GDP in CP, 1990–2043
- Chart 6: GDP per capita in CP, 1990–2043
- Chart 7: Informal sector value in CP, 2015–2043
- Chart 8: Value added by sector in CP, 2015–2043
- Chart 9: Agriculture production/demand in CP, 1990–2043
- Chart 10: Poverty in CP, 2015–2043
- Chart 11: Energy production by type in CP, 1990–2043
- Chart 12: Carbon emissions in CP, 1990–2043
- Chart 13: Governance security in CP and Stability scenario, 2019–2043
- Chart 14: GDP per capita in CP and Stability scenario, 2019–2043
- Chart 15: Poverty in CP and Stability scenario, 2019–2043
- Chart 16: Demographic dividend in CP and Demog scenario, 2019–2043
- Chart 17: Infant mortality in CP and Demog scenario, 2019–2043
- Chart 18: GDP per capita in CP and Demog scenario, 2019–2043
- Chart 19: Poverty in CP and Demog scenario, 2019–2043
- Chart 20: Life expectancy in CP and Health/WaSH scenario, 2019–2043
- Chart 21: Infant mortality in CP and Health/WaSH scenario, 2019–2043
- Chart 22: Yield/hectare in CP and Agric scenario, 2019–2043
- Chart 23: Agriculture imports in CP and Agric scenario, 2019–2043
- Chart 24: GDP per capita in the CP and Agric scenario, 2019–2043
- Chart 25: Poverty in CP and Agric scenario, 2019–2043
- Chart 26: Mean years of education in CP and Educ scenario, 2019–2043
- Chart 27: Education quality in CP and Educ scenario, 2019–2043
- Chart 28: GDP per capita in CP and Educ scenario, 2019–2043
- Chart 29: Poverty in CP and Educ scenario, 2019–2043
- Chart 30: Value added by sector in CP and Manufac/Transfers scenario, 2019–2043
- Chart 31: Gov welfare transfers in CP and Manufac/Transfers scenario, 2019–2043
- Chart 32: GDP per capita in CP and Manufac/Transfers scenario, 2019–2043
- Chart 33: Poverty in CP and Manufac/Transfers scenario, 2019–2043
- Chart 34: Fixed broadband access in CP and Leapfrogging scenario, 2019–2043
- Chart 35: Mobile broadband access in CP and Leapfrogging scenario, 2019–2043
- Chart 36: Electricity access in CP and Leapfrogging scenario, 2019–2043
- Chart 37: GDP per capita in CP and Leapfrogging scenario, 2019–2043
- Chart 38: Poverty in CP and Leapfrogging scenario, 2019–2043
- Chart 39: Trade balance in CP and Free Trade scenario, 2019–2043
- Chart 40: GDP per capita in CP and Free Trade scenario, 2019–2043
- Chart 41: Poverty in CP and Free Trade scenario, 2019–2043
- Chart 42: Foreign aid in CP and Financial Flows scenario, 2019–2043
- Chart 43: Inflow of FDI in CP and Financial Flows scenario, 2019–2043
- Chart 44: Remittances in CP and Financial Flows scenario, 2019–2043
- Chart 45: GDP per capita in CP and Financial Flows scenario, 2019–2043
- Chart 46: Poverty in CP and Financial Flows scenario, 2019–2043
- Chart 47: Electricity access in CP and Infrastructure scenario, 2019–2043
- Chart 48: Rural road access in CP and Infrastructure scenario, 2019–2043
- Chart 49: GDP per capita in CP and Infrastructure scenario, 2019–2043
- Chart 50: Poverty in CP and Infrastructure scenario, 2019–2043
- Chart 51: Gov effectiveness in CP and Governance scenario, 2019–2043
- Chart 52: GDP per capita in CP and Governance scenario, 2019–2043
- Chart 53: Poverty in CP and Governance scenario, 2019–2043
- Chart 54: Carbon emissions in CP and scenarios, 2019–2043
- Chart 55: GDP per capita in CP and scenarios, 2019–2043
- Chart 56: GDP per capita in CP and Combined scenario, 2019–2043
- Chart 57: Poverty in CP and Combined scenario, 2019–2043
- Chart 58: Value added by sector in CP and Combined scenario, 2019–2043
- Chart 59: GDP in CP and Combined scenario, 2019–2043
- Chart 60: Carbon emissions in CP and Combined scenario, 2019–2043
Lower middle-income Africa: Current Path
Download to pdfThis page provides an overview of the key characteristics of LMI Africa along its likely (or Current Path) development trajectory. The Current Path forecast from the International Futures forecasting (IFs) platform is a dynamic scenario that imitates the continuation of current policies and environmental conditions. The Current Path is therefore in congruence with historical patterns and produces a series of dynamic forecasts endogenised in relationships across crucial global systems. We use 2019 as a standard reference year and the forecasts generally extend to 2043 to coincide with the end of the third ten-year implementation plan of the African Union’s Agenda 2063 long-term development vision.
According to the World Bank 2021/22 country income group classification, LMI Africa has 23 member states: Algeria, Angola, Benin, Cameroon, Cape Verde, Comoros, the Republic of the Congo, Côte d’Ivoire, Djibouti, Egypt, Ghana, Kenya, Lesotho, Mauritania, Morocco, Nigeria, São Tomé and Príncipe, Senegal, Eswatini, Tanzania, Tunisia, Zambia and Zimbabwe. Membership is based on the World Bank classification of income ranging from US$1 046 to US$4 095 based on 2020 gross national income (GNI) per capita. The World Bank reviews the classification annually.
Membership cuts across all regions of Africa with five members from North Africa, six from West Africa, five from Central Africa, three East African countries, and four Southern African countries. Similarly, the LMI Africa grouping has members in all eight AU recognised regional economic communities, with large country to country differences. Some of the countries, such as Kenya, Comoros, Tunisia, Angola and Cameroon, are members of more than one AU-recognised REC in Africa.
The total population of LMI Africa increased from 630.1 million people in 2015 to 697.8 million in 2019 and is expected to increase to 1 170 million by 2043. Whereas the average population growth rate was highest at 2.5% in 2019, it will modestly decline to 1.8% by 2043. In 2019, Nigeria had the largest population with 203.8 million people, followed by Egypt (100.5 million people) and Tanzania (58.1 million). The least populous countries are the island states of Comoros (857 000 people), Cape Verde (55 000 people), and São Tomé and Príncipe (218 000 people).
The average 2020 fertility rate in LMI Africa was 4.3 children per woman, which is set to decline to 3.1 in 2043. The countries with the highest fertility rates across the forecast horizon are Angola, Nigeria and Tanzania. By 2043, these countries would still have total fertility rates of 4.3, 3.9, and 3.3 children per fertile woman, respectively.
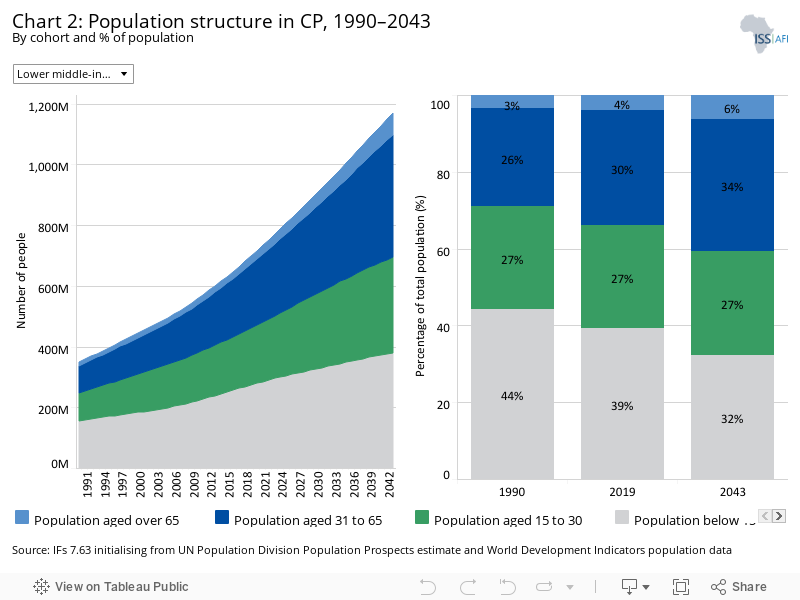
In 2019, the median age for the group ranged from 32.6 years in Tunisia to 16.6 years in Angola. LMI Africa, therefore, has an exceptionally young population with 44% of its adult population in the age group 15 to 29 years of age in 2019, typically considered as constituting a youth bulge. Even by 2043, 40% of the adult population will still be in this bulge, implying considerable momentum towards social turbulence without very rapid expansion of services and opportunities. With only 56.9% of its population in the general working-age bracket (15 to 64 years of age) in 2019, LMI Africa will only benefit from a demographic dividend during the second half of the century in 2053.
At 67.5 years, the 2019 average life expectancy for the LMI Africa group is slightly above the African average at 65.8 years. The average life expectancy in LMI Africa will increase to 73.3 years in 2043 with the gap between males and females expected to increase from 3.7 to 4.4 years.
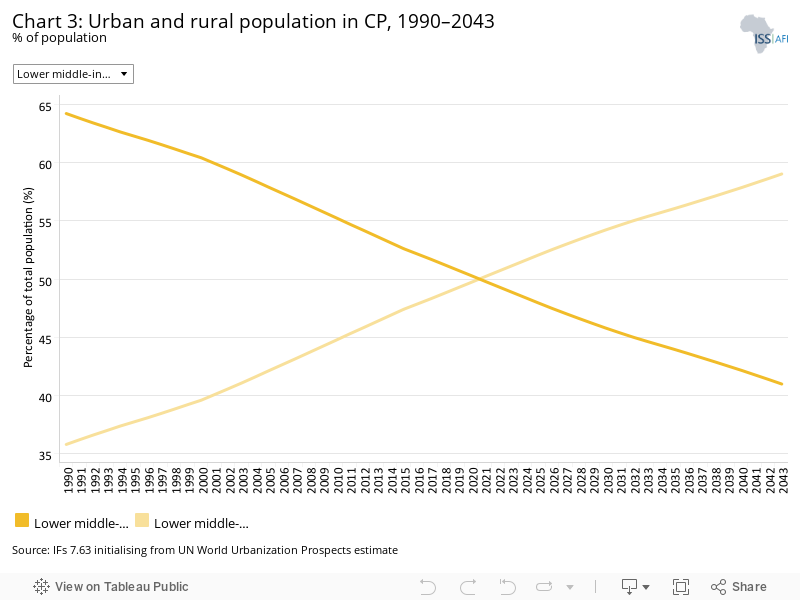
LMI Africa is still mainly rural (average of 50.8% in 2019) but rates differ enormously between member states. In 2019, four out of 23 group members (Eswatini, Kenya, Lesotho and Comoros) had more than 70% of the population living in rural areas, three out of 23 (São Tomé and Príncipe, Algeria and Djibouti) had less than 30% rural population, while only 13% in Burundi. On average, the group will become predominantly urban by 2022, and by 2043, 59% of the population will live in urban spaces.
Compared to the lower-income Africa and upper middle-income Africa groupings, LMI Africa has the highest population density, with large differences between countries. Comoros and São Tomé and Príncipe are the most densely populated countries within LMI Africa with 4.6 and 2.3 persons per hectare, respectively, followed by Nigeria with 2.2 persons per hectare. Of the 23 member states, 16 have low densities of less than one person per hectare. By 2043, Comoros will still be the most densely populated country at 7.4 persons per hectare, followed by Nigeria at 4.3.
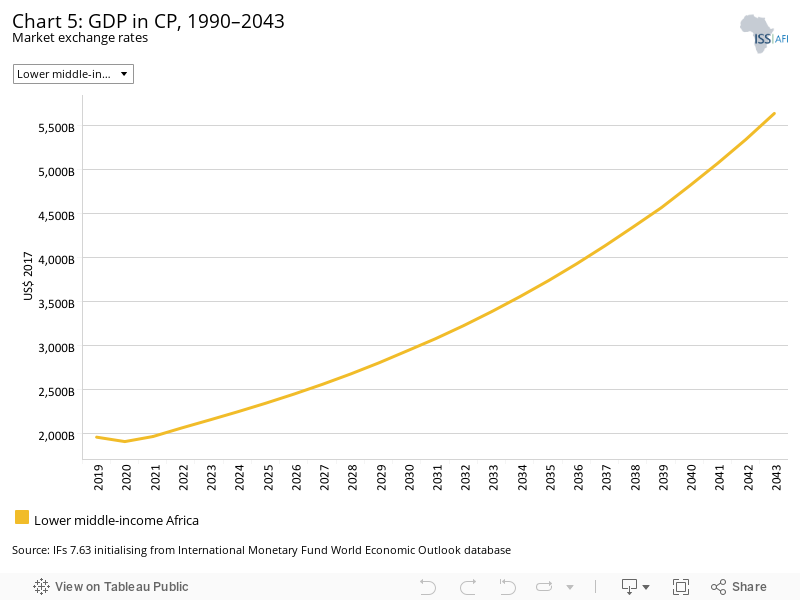
The combined GDP of LMI Africa has nearly tripled from US$954.9 billion in 1990 to US$1 959.8 billion in 2019. It is expected to expand to US$5 637.5 billion by 2043. In 2019, LMI Africa’s share of the continent’s economy was 64.1%, which is set to slightly increase to 64.6% in 2043 as the average growth rate falls below the 5.6% rate for Africa. There are big differences in economic growth rates across the group. In 2019, 10 out of the 23 group members had average GDP growth rates of more than 5%, while four countries had less than 1% growth rate in that year. GDP growth rates range from 7.5% in Djibouti to −8.1% in Zimbabwe as it struggles with a currency crisis.
The LMI Africa group is dominated by Nigeria and Egypt, collectively constituting 46.4% the GDP of the group, followed by Algeria and Morocco at 13% and 7%, respectively. Looking to 2043, the share of Nigeria is set to increase to 34.9% (from 28.6% in 2019). Of the 23 countries in the group, 10 have very small economies constituting less than 1% of the total GDP.
Although many of the charts in the sectoral scenarios also include GDP per capita, this overview is an essential point of departure for interpreting the general economic outlook of LMI Africa.
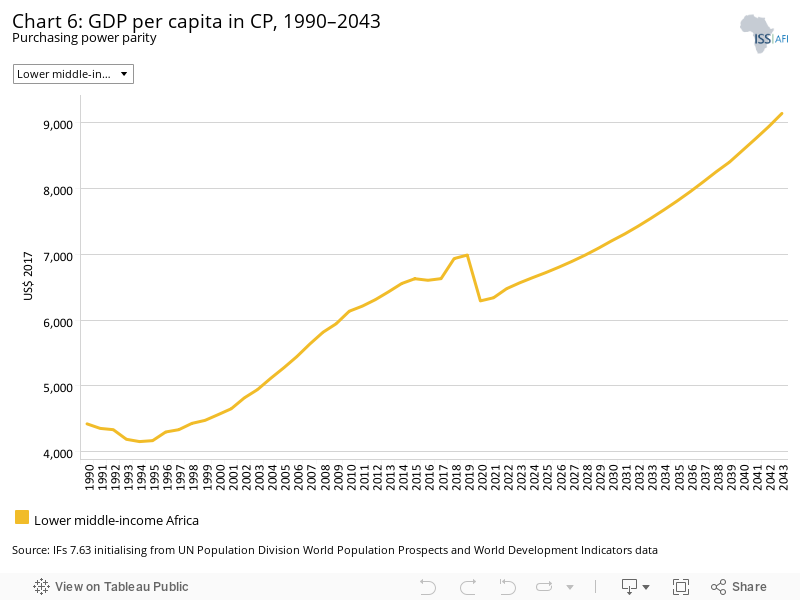
The average GDP per capita for LMI Africa was US$6 898 in 2019, higher than the average GDP per capita in Africa of US$5 289 in that year. The North African countries of Algeria, Egypt and Tunisia had the highest income levels of more than US$10 000 in 2019, while Benin, Zimbabwe and Comoros had the lowest at less than US$3 000. Though Nigeria had the largest economy (US$560.7 billion) in Africa, its large population size (201 million people in 2019) and low level of industrialisation (lowest in the group at 9.4% in 2019) mean that it ranks eighth among the LMI Africa group of countries on GDP per capita, while Eswatini with a small economy (US$6.4 billion) and population (1.14 million), and with a high manufacturing share of GDP (highest in the group at 35.3% in 2019) ranked fourth in 2019.
In the Current Path forecast, LMI Africa is set to increase its GDP per capita to US$9 142 in 2043, higher than the African average of US$7 157. Egypt will record the highest per capita GDP of US$17 015, while the economic woes of Zimbabwe will see it record the lowest at US$4 469 in 2043.
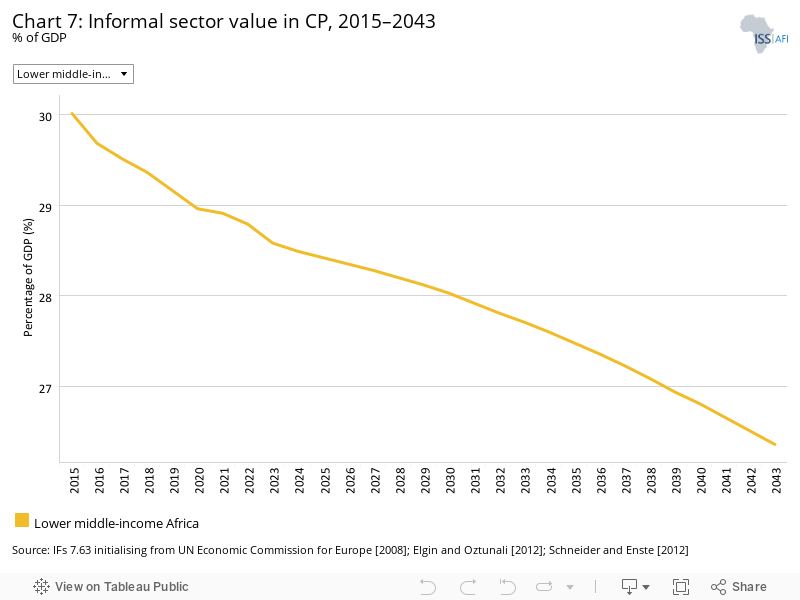
Estimates on the contribution of the informal sector to GDP in 2019 range from 52.8% in Zimbabwe to 18.4% in Algeria. By 2043, these numbers will have declined to 35.8% and 16.3%, respectively.
At 29.2% in 2019 (or US$571.4 billion), the LMI Africa informal sector was about three percentage points of GDP larger than the average for Africa, reflecting the extent to which a very large portion of the population depends on this sector. By 2043, the GDP share of the informal sector is set to decline to 26.4%, equivalent to US$1485.7 billion.
The informal sector share of GDP is largest in Zimbabwe (at 52.8%) and smallest in Algeria (at 18.4%). This does not necessarily reflect the informal labour share of the total labour force, which ranges from 77.6% in Benin to 27.2% in Algeria. Since its economy is also the largest within LMI Africa (and indeed within Africa), Nigeria had the largest informal sector size in absolute terms among the LMI Africa group members with a value of US$220.2 billion in 2019 (39.3% of GDP), that will increase to US$634 billion in 2043, but decline in its contribution to 33.2% of GDP.
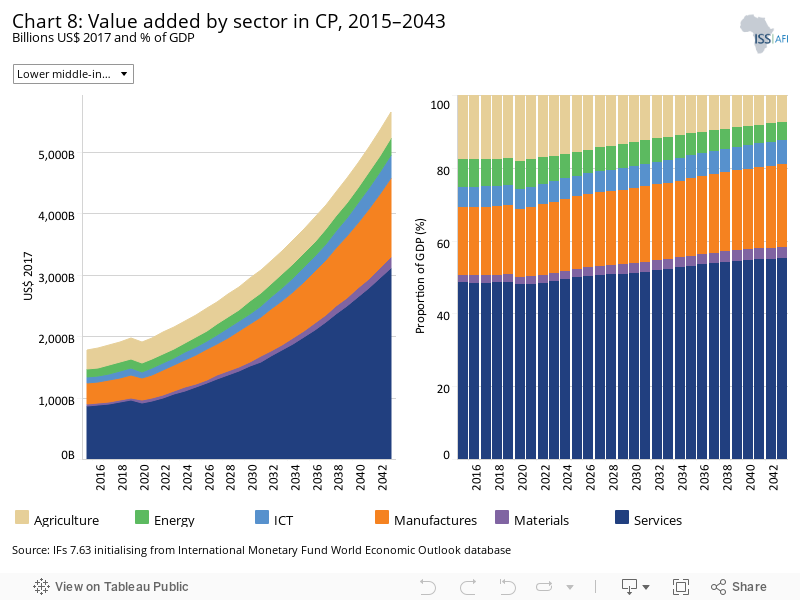
The IFs platform uses data from the Global Trade and Analysis Project (GTAP) to classify economic activity into six sectors: agriculture, energy, materials (including mining), manufacturing, service and information and communication technologies (ICT). Most other sources use a threefold distinction between only agriculture, industry and services with the result that data may differ.
Generally, the service sector dominates within LMI Africa, accounting on average 48%, ranging from 77.9% in Djibouti to 31.8% in Algeria. The service sector contributed more than 45% of GDP in 21 of the 23 LMI group members in 2019, and in other countries the value ranges between 40% and 51%. These are, however, generally low-end services, either as part of subsistence agriculture or low-end retail services located in informal urban areas. The contribution of the service sector is set to steadily increase from 48.6% in 2019 to 55.2% in 2043, while the contribution of agriculture declines from 17.3% to 7.4% during the same period despite its substantial potential. In 2019, agriculture contributed most to GDP in Kenya at 29.9% and least in Djibouti at 0.4%. These numbers will decline to 12.8% and 0.02%, respectively.
In the same vein, the share of manufacturing to GDP in LMI Africa will modestly increase from 18.9% in 2019 to 22.8% in 2043. In 2019, country to country variations were that the manufacturing share ranges from 35.3% in Eswatini to 9.4% in Nigeria. The contribution of the energy sector, at 7.3% in 2019, is boosted by oil production in the Republic of the Congo (23% of GDP in 2019), Angola (16%) and Algeria (16%) and is set to decline to an average for the group of 5% of GDP by 2043. The contribution of the ICT sector is at 5.6%, just next to the material sector; both sectors are set to increase marginally in 2043. Tunisia had the largest ICT sector in LMI Africa in 2019 at 7.7%, while Egypt will have the largest in 2043 at 8.7%. The ICT sector in Djibouti is smallest in the group at 0.9% and 2.4% in 2019 and 2043, respectively.
On average, the sizes of the service sector and, to a lesser extent, the manufacturing sector are set to increase significantly in absolute values over the forecast horizon. The sizes of other sectors do not substantially increase to the same extent. For example, while the LMI Africa’s agriculture value in 2019 is 80% of its 2043 value, its services and manufacturing 2019 values are 30% and 28% of the 2043 values, respectively.
The service sector will grow most rapidly in Egypt, where it increases from US$173 billion in 2019 to US$531 billion in 2043, followed by Angola, where it will increase from US$68.5 billion in 2019 to US$252.5 billion in 2043, significantly larger in size than other group members. Because of the large size of its economy, Nigeria will experience the greatest increase in the value of its manufacturing sector between 2019 and 2043 amounting to US$294 billion. São Tomé and Príncipe will just see US$68 million addition to its service sector during the same period.
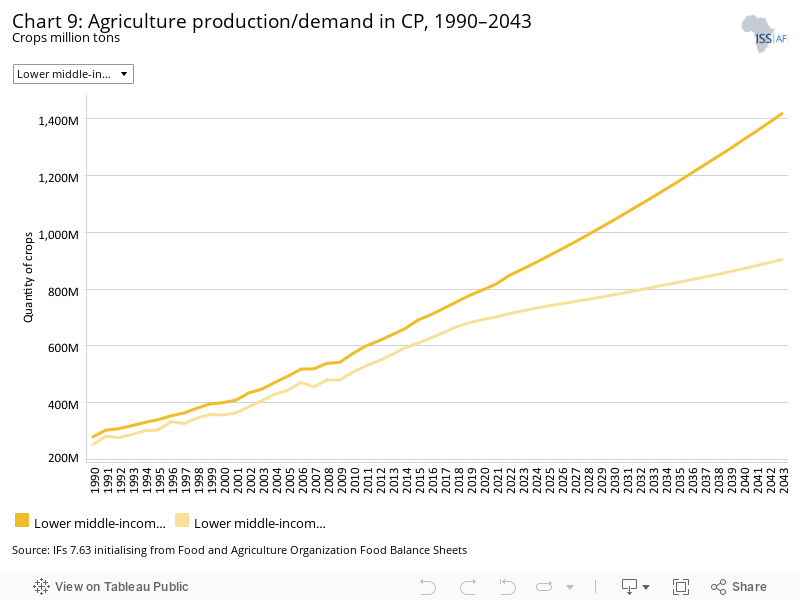
The data on agricultural production and demand in the IFs forecasting platform initialises from data provided on food balances by the Food and Agriculture Organization (FAO). IFs contains data on numerous types of agriculture but aggregates its forecast into crops, meat and fish, presented in million metric tons. Chart 9 shows agricultural production and demand as a total of all three categories.
In 2019, total agricultural demand exceeded production by 105 million metric tons — a gap that is expected to increase to 560 million metric tons by 2043. The LMI Africa region is, therefore, becoming increasingly food insecure, not only because of poor domestic production but also because of changes in dietary preferences.
Nigeria was the greatest producer of crop, meat and fish in LMI Africa of 213 million metric tons in 2019, followed by Egypt and Tanzania at 114 million and 51 million, respectively. São Tomé and Príncipe and Djibouti were the smallest agricultural producers in the LMI Africa group. By 2043, Nigeria is poised to increase its agricultural production by 33% to 282.4 million metric tons; Djibouti, the smallest producer, will decrease production to 124 000 metric tons from 87 000 metric tons.
Crop production comprises more than 90% of total agricultural production in LMI Africa in 2019, and by 2033 this will decline to below 90% such that in 2043 crop production will amount to 88% of total agricultural production.
There are numerous methodologies for and approaches to defining poverty. We measure income poverty and use GDP per capita as a proxy. In 2015, the World Bank adopted the measure of US$1.90 per person per day (in 2011 international prices), also used to measure progress towards the achievement of Sustainable Development Goal (SDG) 1 of eradicating extreme poverty. To account for extreme poverty in richer countries occurring at slightly higher levels of income than in poor countries, the World Bank introduced three additional poverty lines in 2017:
- US$3.20 for lower middle-income countries
- US$5.50 for upper middle-income countries
- US$22.70 for high-income countries.
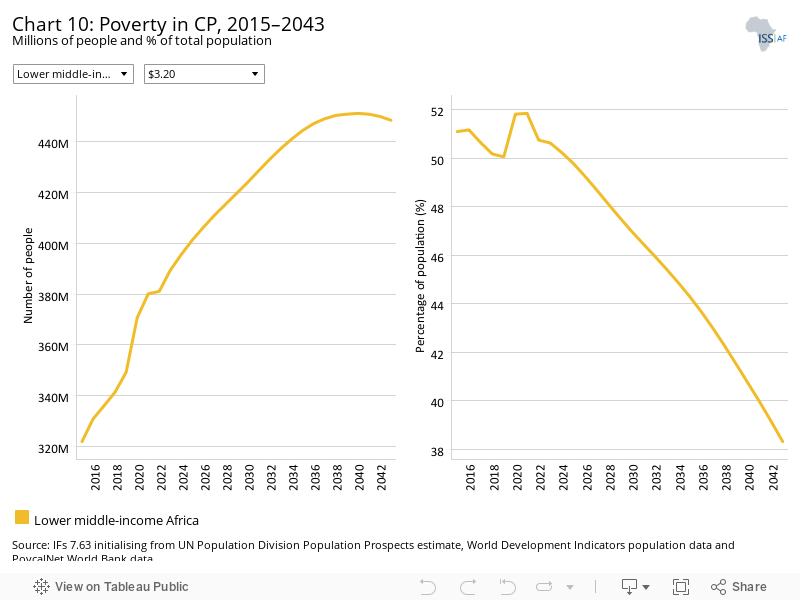
Because of its high rates of population growth and relatively slow economic growth, the number of extremely poor people (using US$3.20) in LMI Africa will increase from 322 million in 2019 to 448.4 million in 2043. Nearly 80% of the increase in the number of poor people is due to Nigeria, where the number increases by 100 million between 2019 and 2043. In Egypt, the number of poor people will decline from 21.8 million in 2019 to 17 million in 2043, while the poverty rate will decline from 24% in 2019 to 12% in 2043. Benin, Zambia, Nigeria, Tanzania and São Tomé and Príncipe have the highest poverty rates of >70%, while Algeria, Tunisia and Morocco have the lowest poverty rates in LMI Africa of <7% in 2019. While in 2019 seven countries had a poverty rate of >65%, by 2043 all LMI Africa countries will experience poverty rates of below 65% with Zambia topping the list at 64.9%. The decline in poverty in LMI Africa will be supported by strong economic growth with ten out of 23 group members having >5% economic growth rate in 2019.
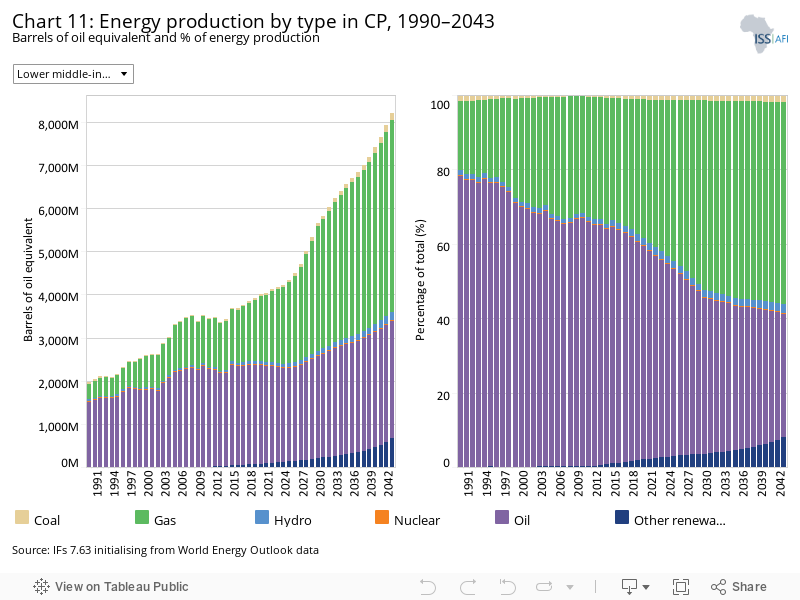
The IFs platform forecasts six types of energy, namely oil, gas, coal, hydro, nuclear and other renewables. To allow comparisons between different types of energy, the data is converted into billion barrels of oil equivalent (BBOE). The energy contained in a barrel of oil is approximately 5.8 million British thermal units (MBTUs) or 1 700 kilowatt-hours (kWh) of energy.
Nigeria and Angola produce significantly more energy among the LMI Africa member states, mostly oil, and they are the biggest gas producers producing more than 400 million barrels in 2019.
Hydro energy production is strongest in Zambia and Ghana, though coal, hydro and nuclear energy production comprise less than 1% of total energy production in LMI Africa. In 2019, oil and gas comprised 63% and 36% of total energy production, respectively. Kenya leads in the production of other renewable sources of energy such as solar and wind energy.
In the Current Path forecast for 2043, more gas (54%) than oil (33%) will be produced, as the production of other sources of energy increases to 12%. Gas production in Algeria will increase almost fivefold between 2019 and 2043, while in Nigeria it will increase by 2.5-fold during the same period.
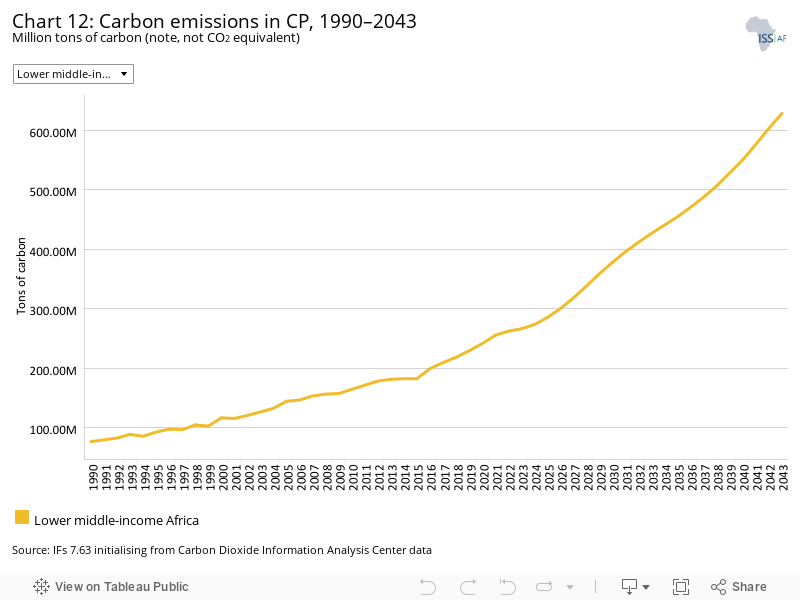
Carbon is released in many ways, but the three most important contributors to greenhouse gases are carbon dioxide (CO2), carbon monoxide (CO) and methane (CH4). Since each has a different molecular weight, IFs uses carbon. Many other sites and calculations use CO2 equivalent.
As a group, LMI Africa countries emitted 229 million tons of carbon in 2019 — an amount that will increase by nearly threefold to 629 million tons by 2043. In the process, LMI Africa will increase its portion of Africa’s carbon emissions from 54% of the African total to 67%. Due to their large economies and oil production, Egypt, Algeria and Nigeria are the largest emitters, contributing 66% of total emissions in 2019.
In the Current Path forecast, the top three emitters will still contribute two-thirds of all carbon emissions in 2043, with Egypt experiencing the largest growth in emission of 220% between 2019 and 2043.
Sectoral Scenarios for Lower middle-income Africa
Download to pdfThe Stability scenario represents reasonable but ambitious reductions in risk of regime instability and lower levels of internal conflict. Stability is generally a prerequisite for other aspects of development and this would encourage inflows of foreign direct investment (FDI) and improve business confidence. Better governance through the accountability that follows substantive democracy is modelled separately.
The intervention is explained here in the thematic part of the website.
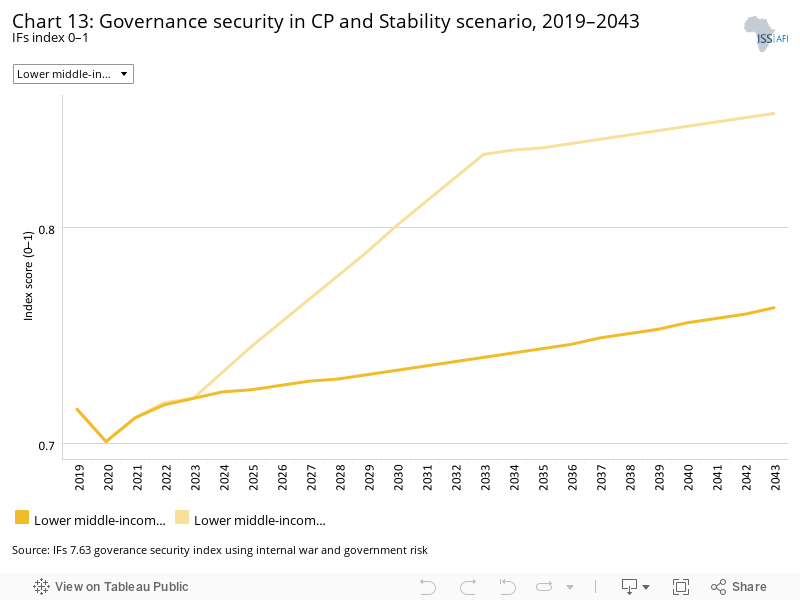
Using the governance security index within IFs, LMI Africa is below the average for LMI countries of 0.74 but above the average for Africa of 0.69. The LMI Africa Current Path forecast will see a modest improvement in governance security between 2019 and 2043. In 2019, Tunisia and Cape Verde had the highest score in the governance security index in the group of 0.85 and 0.81, respectively, while Angola, with its violent past, large youth bulge and high levels of corruption, had the lowest at 0.63. Although Tunisia was the trigger for the Arab Spring in December 2010, it rapidly transitioned from a relatively stable autocracy to high levels of democracy, explaining its good score, and Cape Verde is known for its high level of security. In the Stability scenario, group members will improve the 2043 Current Path forecast by 12% above the Current Path forecast. Changes range from an 18% improvement above the Current Path forecast in 2043 in Angola — due to its low base — to 0.11 in Tunisia and Cape Verde — due to their already high governance security level. With its turbulent history, the Republic of the Congo will also see a 14% improvement in its 2043 Current Path forecast of governance security due to the Stability scenario.
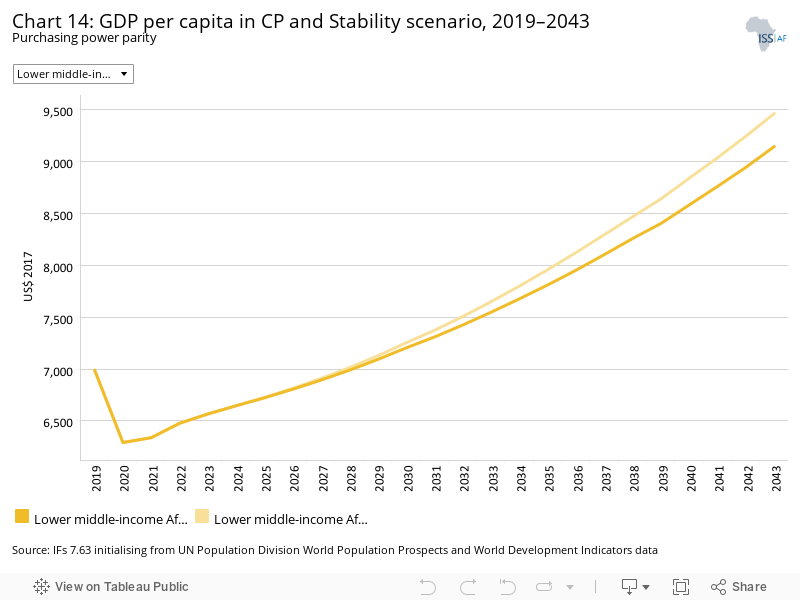
Stability is a general prerequisite for other aspects of development. The Stability scenario increases GDP per capita by US$504 in 2043 compared to the Current Path forecast. The increase ranges from US$927 in Algeria (the largest increase), US$896 in Eswatini and US$883 in Angola, to US$217 in Benin (least improvement).
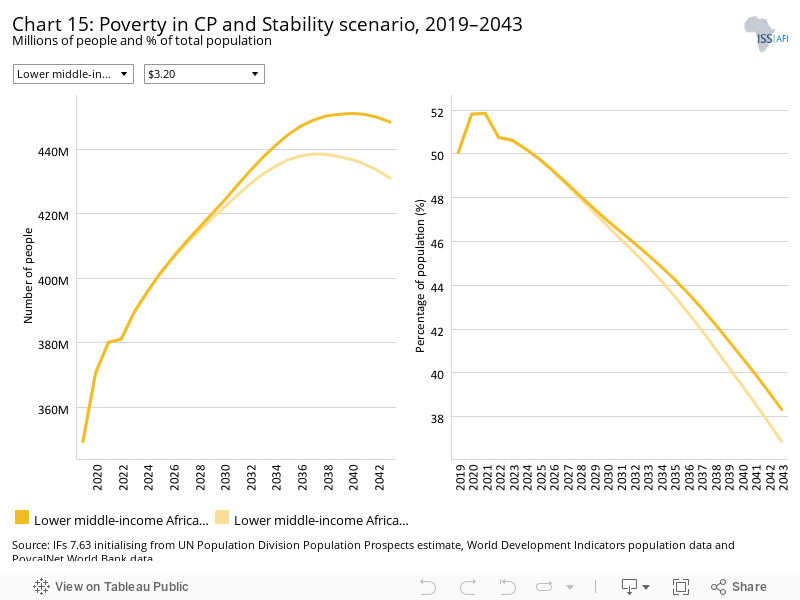
By 2030, the Stability scenario will reduce the number of extremely poor people in LMI Africa by 17.3 million people in 2043, compared to the Current Path forecast (using US$3.20). The largest gains are made in Nigeria which will see a reduction of 6.1 million extremely poor people (1.5 percentage points) in 2043, while Cape Verde will see the smallest reduction of 361 177 people.
Instead of an extreme poverty rate (using US$3.20) of 38.3% in 2043, the 2043 extreme poverty rate for LMI Africa will be 36.8% in the Stability scenario.
This section presents the impact of a Demographic scenario that aims to hasten and increase the demographic dividend through reasonable but ambitious reductions in the communicable-disease burden for children under five, the maternal mortality ratio and increased access to modern contraception.
The intervention is explained here in the thematic part of the website.
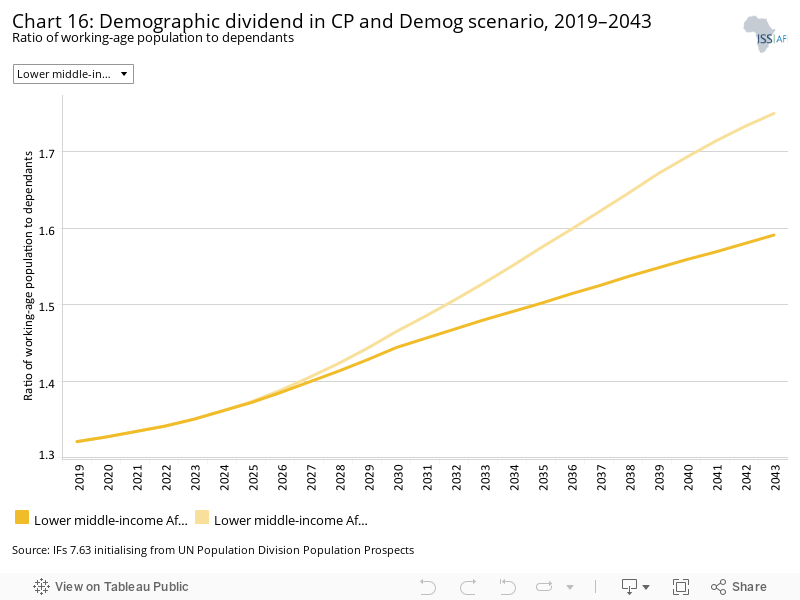
Demographers typically differentiate between a first, second and even a third demographic dividend. We focus here on the contribution of the size of the labour force (between 15 and 64 years of age) relative to dependants (children and the elderly) as part of the first dividend. A window of opportunity opens when the ratio of the working-age population to dependants is equal to or surpasses 1.7.
In 2019, the ratio of working-age persons to dependants in LMI Africa was only 1.3, and in the Current Path forecast, LMI Africa only enters the demographic dividend in 2053, given its population momentum and high fertility rates. This is two years later than the average for Africa. In the Demographic scenario, LMI Africa gets to a ratio of 1.7 working-age persons to every dependant by 2041.
In 2019, four of the 23 LMI Africa members (Cape Verde, Algeria, Djibouti and Morocco) entered a potential demographic dividend.
Compared to the Current Path forecast, Zimbabwe and Kenya will see the largest improvement in the ratio of working-age persons to dependants in the Demographic scenario by 2043.
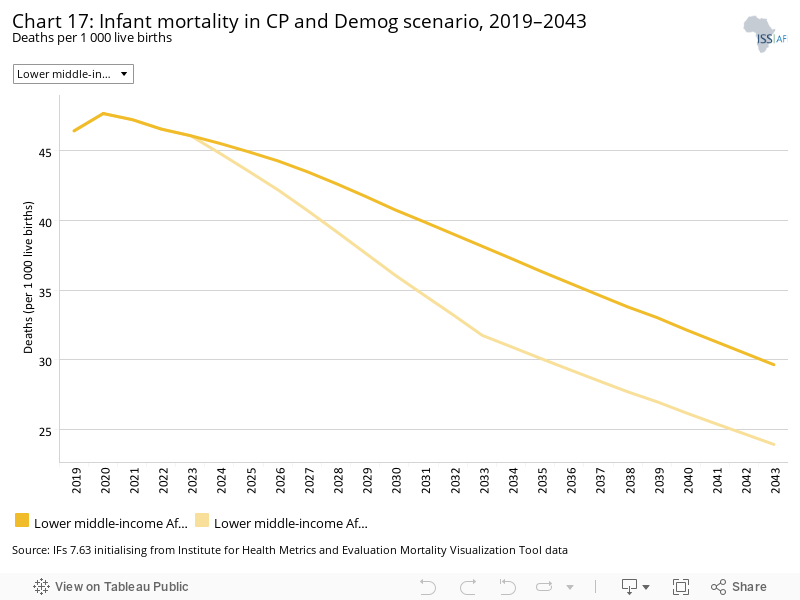
The infant mortality rate is the number of infant deaths per 1 000 live births and is an important marker of the overall quality of the health system in a country.
The average infant mortality rate for the group in 2019 was 46.4 deaths, and is set to decline to 26.7 in 2043, which is below the average for Africa at 25.6. In 2019, infant mortality rates range from 67.5 in Nigeria to 9.6 in Tunisia.
In the Demographic scenario, the average infant mortality rate for LMI Africa declines to 23.9 in 2043, with Nigeria experiencing the largest decrease of 8.5 fewer deaths per 1 000 live births in 2043 compared to the Current Path forecast.
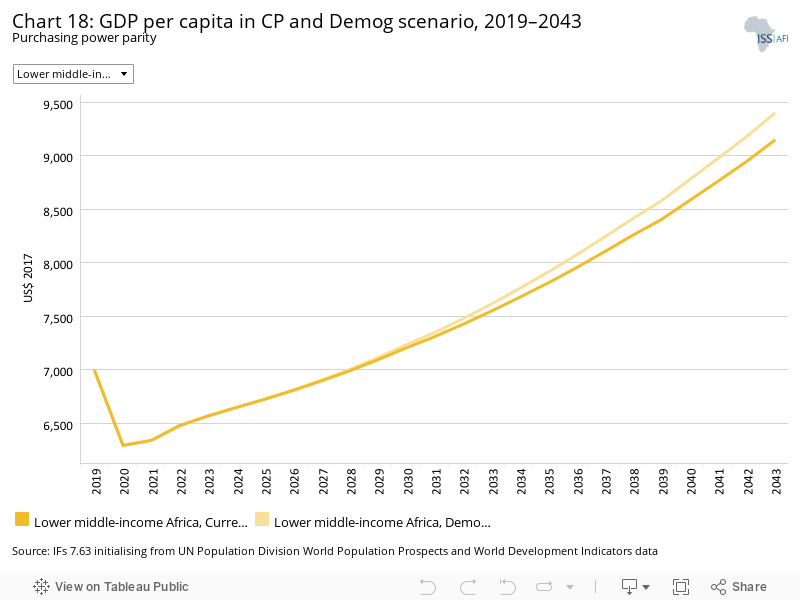
By 2043, the Demographic scenario will increase average GDP per capita by US$252 compared to the Current Path forecast. Egypt and Eswatini will benefit the most from the Demographic scenario by 2043 (at US$558 and US$338, respectively, compared to the Current Path forecast) followed by Algeria, with an improvement of US$329. Coming off a high base, Tunisia and Cape Verde gain the least at US$12 and US$27 by 2043, respectively, compared to the Current Path forecast.
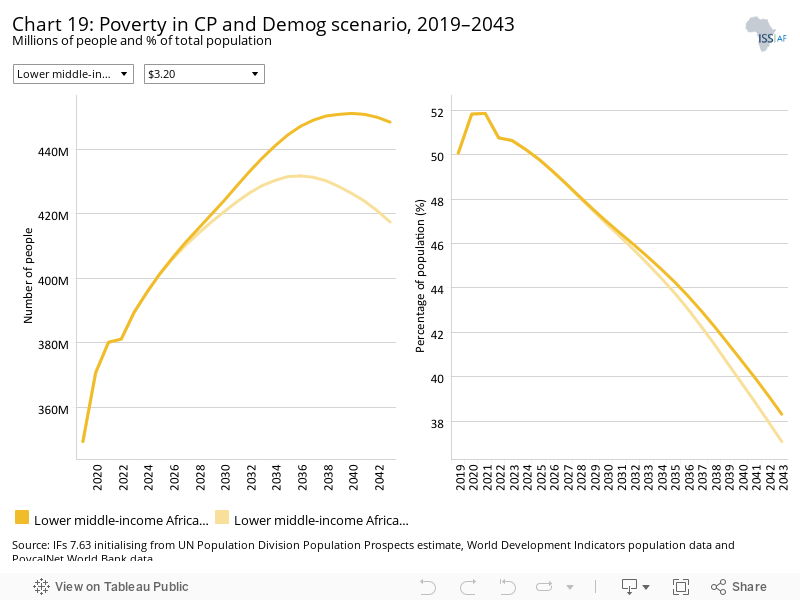
Compared to the Current Path forecast, the Demographic scenario will reduce extreme poverty in LMI Africa by 30.9 million (1.2 percentage points) using US$3.20 in 2043. In 2043, Zimbabwe will see the largest percentage point decrease in extreme poverty rate of 3.2, followed by Tanzania at 2.7 when compared to the Current Path forecast. In Nigeria and Tanzania, the Demographic scenario will reduce the number of extremely poor people by 9.5 million and 5.3 million, respectively, in 2043 compared to the Current Path forecast.
This section presents reasonable but ambitious improvements in the Health/WaSH scenario, which include reductions in the mortality rate associated with both communicable diseases (e.g. AIDS, diarrhoea, malaria and respiratory infections) and non-communicable diseases (NCDs) (e.g. diabetes), as well as improvements in access to safe water and better sanitation. The acronym WaSH stands for water, sanitation and hygiene.
The intervention is explained here in the thematic part of the website.
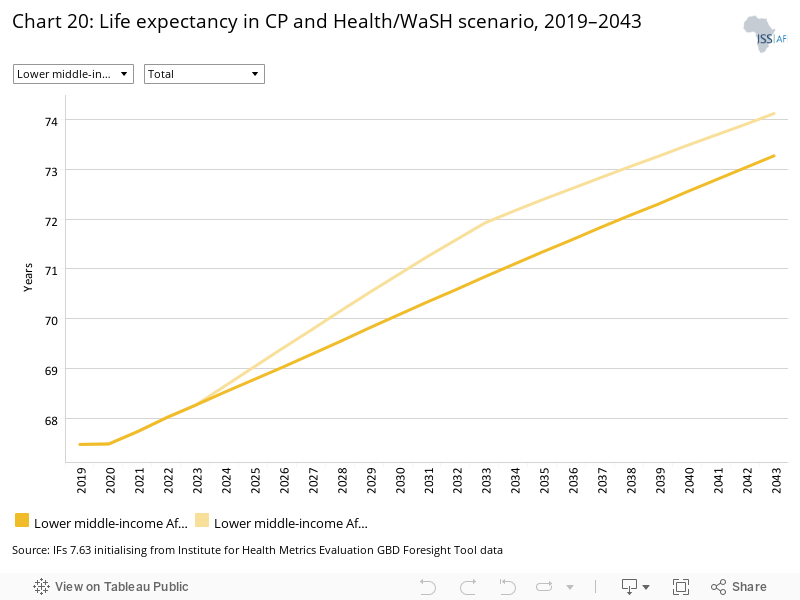
Life expectancy among LMI Africa member states ranged from 77.8 years in Tunisia to 51.9 years in Lesotho in 2019. In 2019, average life expectancy was 67.5 years and in the Current Path forecast it will increase to 73.3 years in 2043. The Health/WaSH scenario results in a marginal life expectancy increase above the Current Path forecast of less than one year. Lesotho, with its low life expectancy of 51.9 years in 2019 as a result of HIV/AIDS, experiences the largest increase of two years and Djibouti the least (0.06 years). Average life expectancy in LMI Africa remains above the average for Africa, with 2 years more in 2043 in the Health/WaSH scenario.
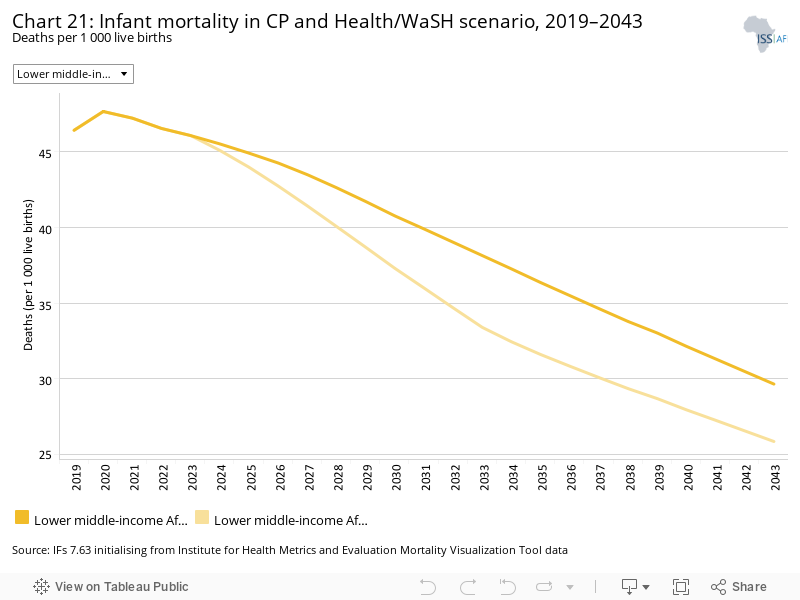
The rate of infant mortality in LMI Africa in 2019 was 46.5 deaths per 1 000 live births and will reduce to 29.7 in the Current Path forecast by 2043. In the Health/WaSH scenario, the average by 2043 is 25.9 — 3.8 deaths fewer compared to the Current Path forecast. These rates remain above the average for Africa to 2043. Nigeria experiences the largest decline in infant mortality in the Health/WaSH scenario of 6.4 fewer deaths per 1 000 live births, followed by Angola at 4.3.
The Agriculture scenario represents reasonable but ambitious increases in yields per hectare (reflecting better management and seed and fertiliser technology), increased land under irrigation and reduced loss and waste. Where appropriate, it includes an increase in calorie consumption, reflecting the prioritisation of food self-sufficiency above food exports as a desirable policy objective.
The intervention is explained here in the thematic part of the website.
The data on yield per hectare (in metric tons) is for crops but does not distinguish between different categories of crops.
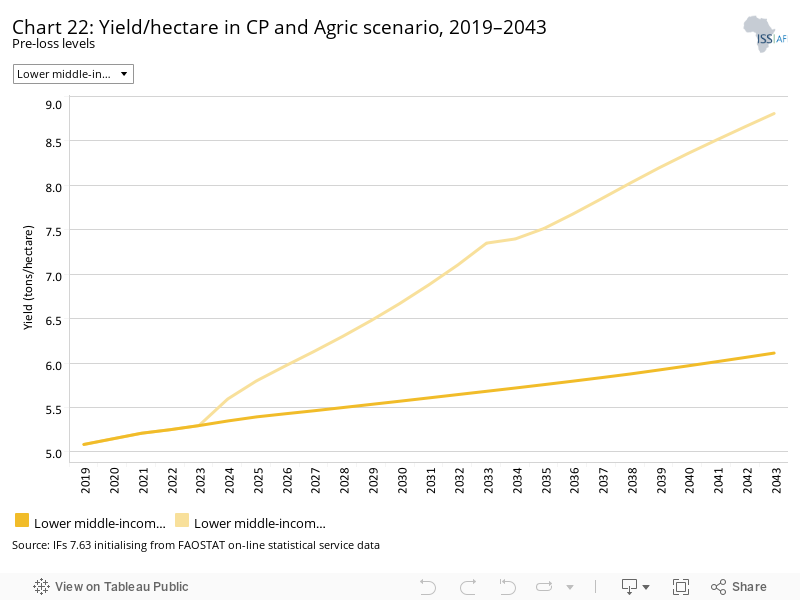
In 2019, the average crop yield in LMI Africa was 5.1 metric tons, which is above the average for Africa of 3.9 tons. In the Current Path forecast, LMI Africa will improve yields to 6.1 metric tons by 2043 and to 8.8 tons in the Agriculture scenario — a difference of almost 45%.
Eswatini has the highest pre-loss crop yields per hectare among the LMI Africa members by a large margin, reflecting its rich soils, higher rainfall average, the intensity of farming and better utilisation of technology. Yields per hectare for Eswatini increase from 43.7 tons in 2019 to 44.6 tons in 2043 in the Current Path forecast and to 50 tons in the Agriculture scenario. Lesotho and Mauritania have the lowest pre-loss crop yields per hectare at 1.6 tons and 1 ton, respectively, in 2019.
Compared to the Current Path forecast, Eswatini will experience the largest improvement (5.5 tons by 2043) in the Agriculture scenario, followed by São Tomé and Príncipe (4 tons), Tanzania (3.8 tons) and Comoros 3.6 tons. Tunisia and Algeria will experience the least improvements of 0.1 tons and 1.2 tons, respectively, in the Agriculture scenario.
In the Current Path forecast, the contribution of agriculture to the GDP of LMI Africa will decline from 17.3% in 2019 to 7.4% in 2043. In the Agriculture scenario, agriculture will still contribute almost 9.6% to GDP by 2043, and LMI Africa group will produce 358.1 million metric tons more crops by 2043, compared to the Current Path forecast.
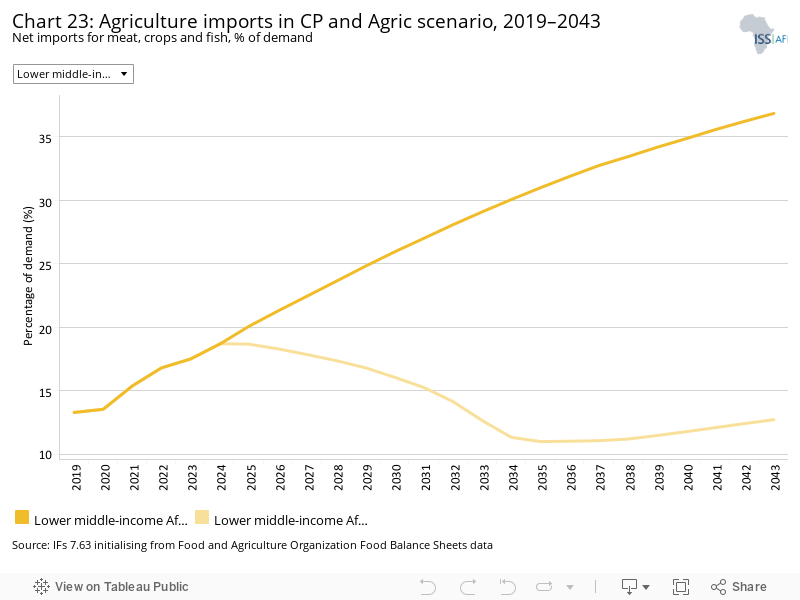
In the Agriculture scenario, import dependence in LMI Africa is set to decrease to 11.2% instead of 38% in the Current Path forecast, resulting in US$261 million fewer imports than in the Current Path in 2043. Agricultural exports will sky rocket in 2043 in the Agriculture scenario to 115.1 million metric tons from 14.3 million metric tons. Compared to the Current Path forecast, Tanzania (at 49 million tons), followed by Ghana (at 15.2 million tons) will see the greatest increments in agricultural exports. The least improvement will come from Cape Verde and Djibouti in 2043
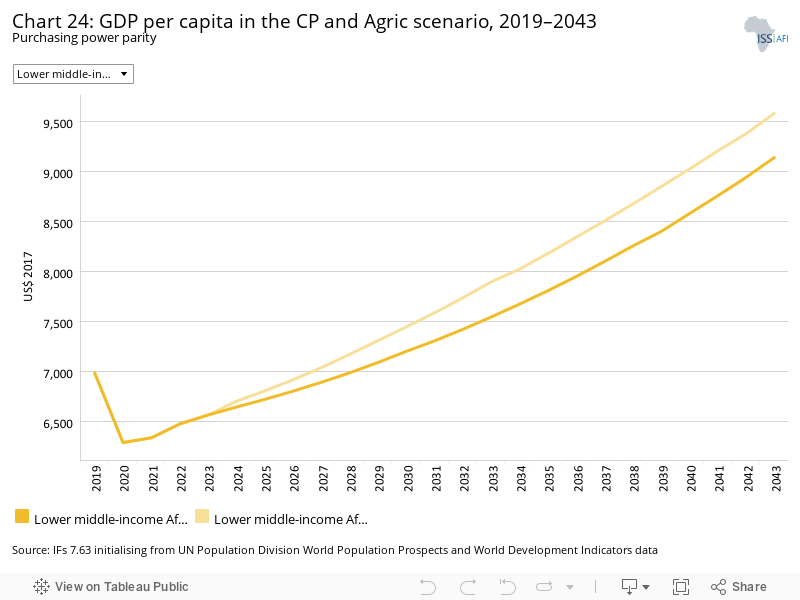
The average improvement in GDP per capita in the Agriculture scenario is US$440 in 2043, compared to the Current Path forecast for that year. Tanzania will benefit the most: its GDP per capita in 2043 will be US$813 larger than in the Current Path forecast for that year, followed by Mauritania and Morocco, while Egypt and Eswatini will benefit the least.
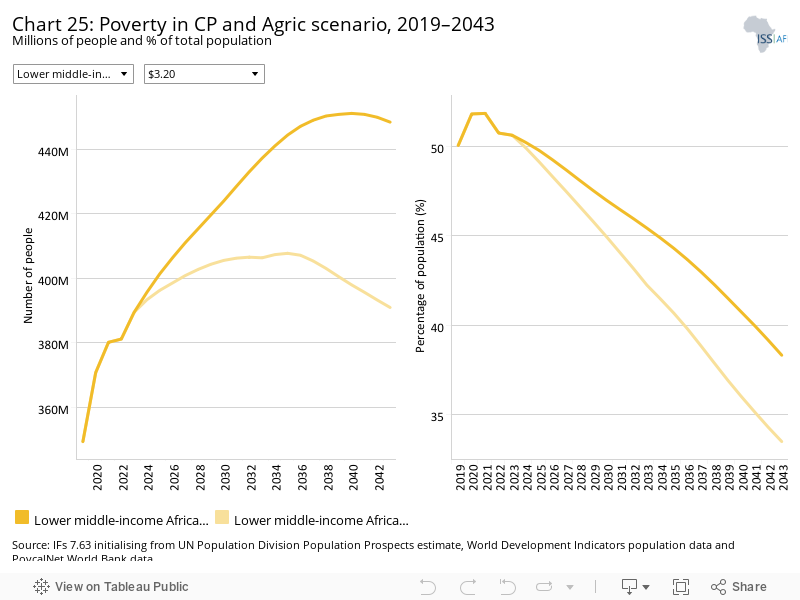
Agriculture traditionally has a significant effect on extreme poverty. While LMI Africa would still have 448.4 million people living below US$3.20 in the Current Path in 2043, in the Agriculture scenario the number comes down to 390.9 million, mainly from Nigeria and Tanzania. In the Agriculture scenario, the number of extremely poor people in Tanzania and Nigeria will decline by 18.2 million and 15.6 million people, respectively, in 2043 compared to the Current Path forecast for that year.
Whereas, in 2019, 50.1% of people in LMI lived below US$3.20 per day, it will decline to 38.3% by 2043 in the Current Path forecast and 33.5% in the Agriculture scenario. The impact of the Agriculture scenario is such that it reduces the extreme poverty rate by 17.1 and 12.9 percentage points in Tanzania and Côte d'Ivoire compared to the Current Path forecast. Lesotho and Egypt would record the least impact from the Agriculture scenario on extreme poverty.
The Education scenario represents reasonable but ambitious improved intake, transition and graduation rates from primary to tertiary levels and better quality of education. It also models substantive progress towards gender parity at all levels, additional vocational training at secondary school level and increases in the share of science and engineering graduates.
The intervention is explained here in the thematic part of the website.
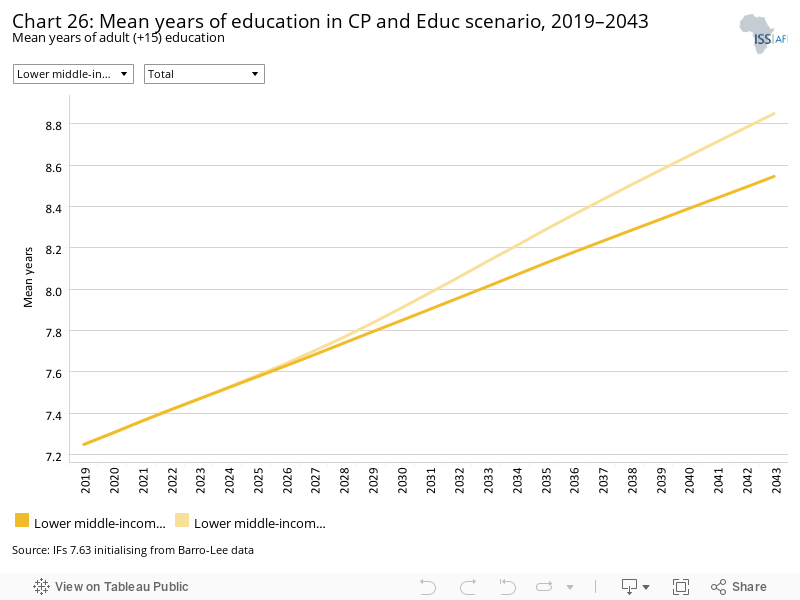
Education is a key development booster but comes with long lags in impact. In 2019, the adult population of LMI Africa had, on average, 6.7 years of education, set to increase to 8.1 years in 2043. In the Education scenario, the mean years of education of LMI Africa would increase to 8.4 years. While the mean years of male education was 7.5 years in 2019, for females it was 5.8 years, a gap of 1.7 years. In the Education scenario, the gap in mean years of male and female education is forecast to modestly decline to 1.2 years by 2043, as gender inequality improves. Tanzania will experience the largest increase in education years of 0.38 and Côte d'Ivoire of 0.31 years.
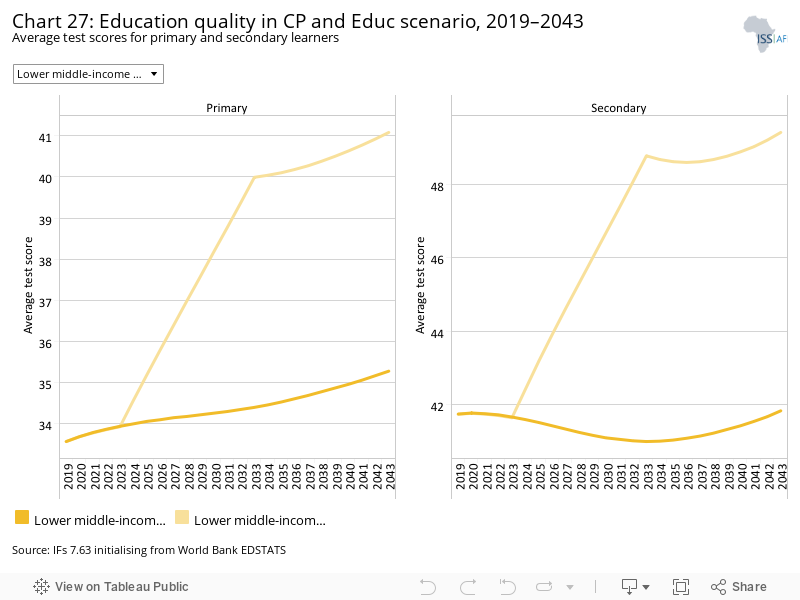
In 2019, average test score for primary learners was 28.4, set to increase to 31.8 in 2043. The Education scenario will increase average primary test scores by 20% to 34.1 compared to the Current Path forecast.
Secondary education quality in the Current Path forecast ranges from 37 in 2019 to 39.4 in 2043, which only increases to 42.5 in the Education scenario. The largest increases will be in Zimbabwe and the Republic of the Congo of additional 4.2 and 3.9 in 2043 compared to the Current Path forecast, whereas the lowest increases will result in Djibouti and Tunisia of 2.5 and 2.4, respectively.
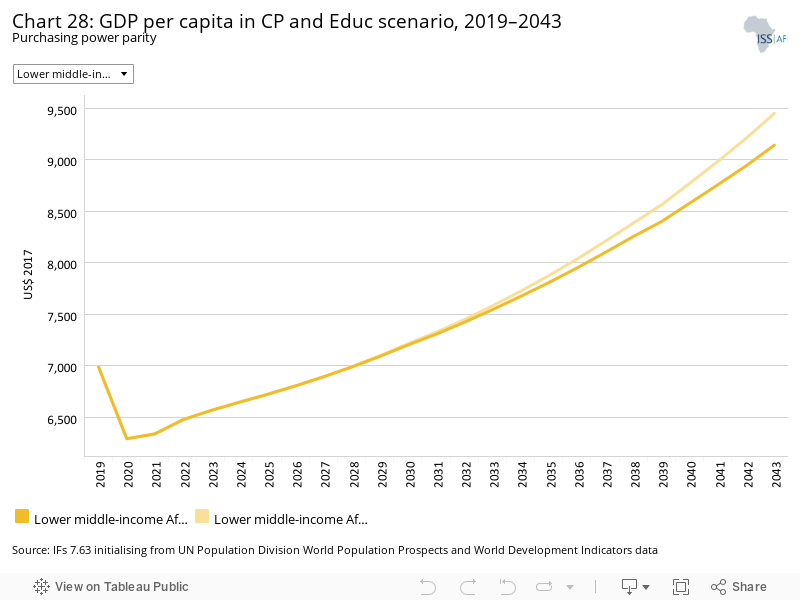
The impact of the Education scenario on GDP per capita is an average improvement for LMI Africa of US$310 in the Current Path forecast to US$9 451 in 2043. The impact is the largest in Eswatini of US$614 and Egypt of US$527 compared to the Current Path forecast for that year. The impact is lowest in Zimbabwe — only US$12 above the Current Path forecast in 2043.
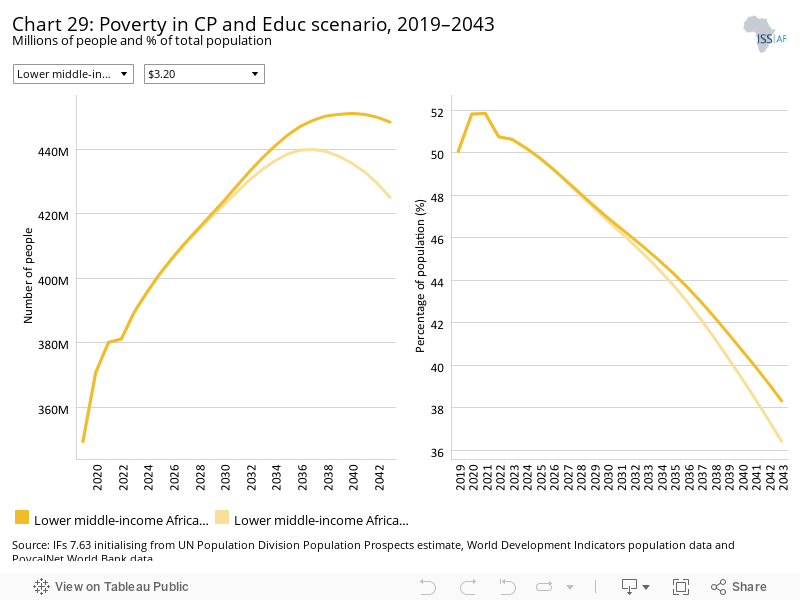
The Education scenario will lift 23.4 million more people out of extreme poverty in 2043 compared to the Current Path forecast, with most in Nigeria (8 million) and Tanzania (4.1 million). Due to starting from a high low base, the impact of education on extreme poverty is lowest in São Tomé and Príncipe and Cape Verde.
In the Education scenario, extreme poverty would be 1.9 percentage points lower by 2043 compared to the Current Path forecast for that year. Viewed as a percentage point reduction in rates of extreme poverty from the Current Path forecast, Tanzania and Senegal will experience the largest decline of 3.7 and 3.3 percentage points, respectively, whereas Tunisia and Morocco will see the least decline in extreme poverty due to the Education scenario in 2043.
The Manufacturing/Transfers scenario represents reasonable but ambitious manufacturing growth through greater investment in the economy, investments in research and development, and promotion of the export of manufactured goods. It is accompanied by an increase in welfare transfers (social grants) to moderate the initial increases in inequality that are typically associated with a manufacturing transition. To this end, the scenario improves tax administration and increases government revenues.
The intervention is explained here in the thematic part of the website.
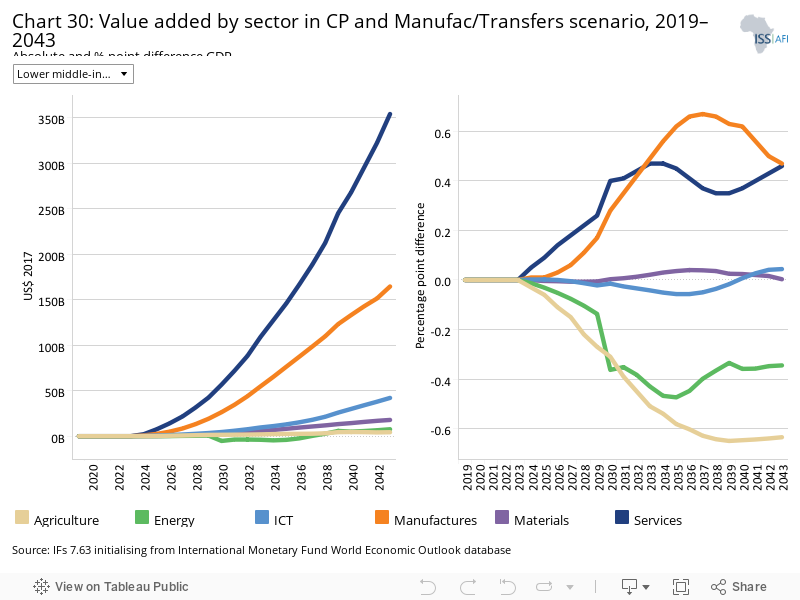
Chart 30 should be read with Chart 8 that presents a stacked area graph on the contribution to GDP and size, in billion US$, of the Current Path economy for each of the sectors.
Because of its forward and backward linkages to other sectors, the manufacturing sector is unique in its contribution to productivity improvements in most economies. In 2019, the service sector represented 48.8% of GDP in LMI Africa, agriculture 17.3%, manufacturing 18.9%, energy 7.3%, ICT 5.6% and materials 2.1%. By 2043, the percentage contributions to GDP in the Current Path forecast are agriculture 7.4%, manufacturing 22.8%, energy 4.9%, ICT 6.7% and materials 2.9%.
The increased contribution from manufacturing peaks by 0.67 percentage points above the Current Path forecast by 2037 before modestly declining to 0.43 in 2043. Increases in the contribution of services peak in 2034 (0.47 percentage points), decline to 0.35 in 2038, before finally rising to 0.46 percentage points in 2043. The relative contribution of the energy and agriculture sectors generally decline, while the ICT and materials sectors largely remain stable. The dynamics differ across countries. In Nigeria, the manufacturing sector’s relative contribution increases consistently across the 2043 forecast horizon, while the contribution from the service sector follows a declining trend starting in 2033, when its contribution falls by 0.9, till 2043. In Tunisia, the contribution of manufacturing increases, agriculture declines, while all other sectors remain modestly stable in the Manufacturing/Transfers scenario compared to the Current Path forecast.
All sectors increase in absolute size in the Manufacturing/Transfers scenario compared to the Current Path forecast. The service sector is, by 2043, US$354.3 billion larger than the Current Path forecast for that year, followed by the manufacturing sector which is US$164.6 billion larger; ICT is US$42.1 billion larger. The increases in size for the agriculture, material and energy sectors are marginal. Though the magnitude of increases in the sectors differ across countries, the general trend is for a larger contribution from the service sector, followed by manufacturing and ICT for all major economies in LMI Africa.
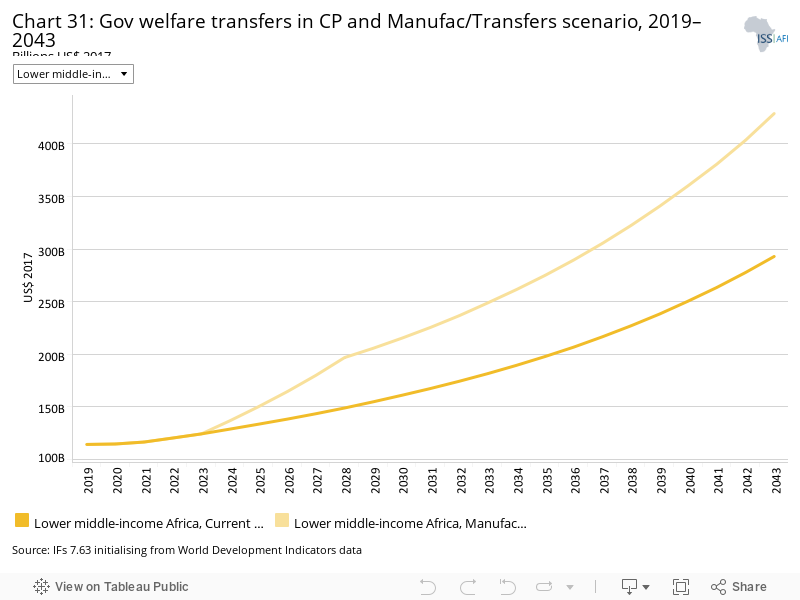
The efforts to use welfare transfers to unskilled workers offset the increase in poverty/inequality that is often associated with investments in manufacturing. Whereas LMI Africa countries transferred US$195.3 billion in welfare transfers in 2019, the 2043 amount in the Manufacturing/Transfers scenario, at US$737.6 billion, is US$175 billion more than in the Current Path forecast. Without these transfers, extreme poverty would be significantly higher. Because of the size of their economies, Egypt, Algeria and Nigeria have the largest transfers in the Manufacturing/Transfers scenario compared to the Current Path forecast. Egypt will add US$44.3 billion more to transfers, while both Algeria and Nigeria will add US$27 billion.
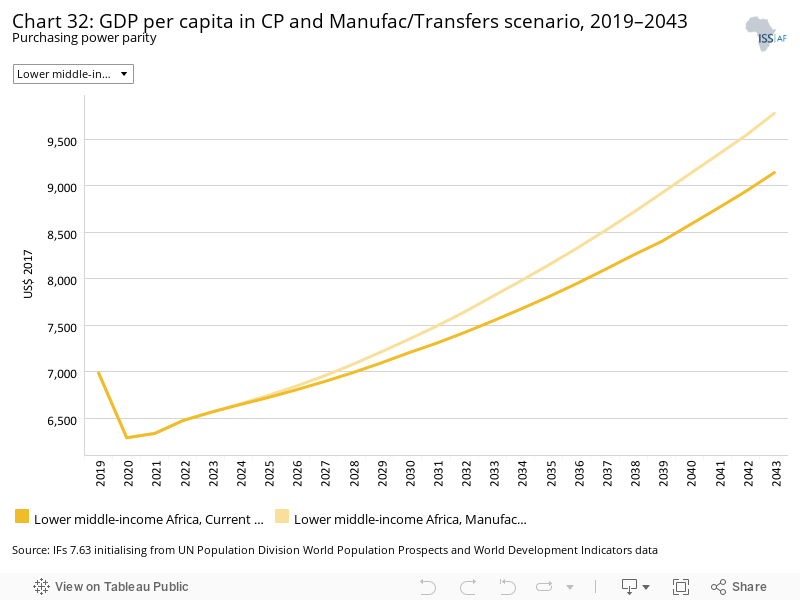
Instead of a GDP per capita of US$9142 in 2043, LMI Africa could have a GDP per capita of US$9 778.4 in the Manufacturing/Transfers scenario. In dollar values, the scenario has the most positive impact on Egypt where GDP per capita in 2043 is US$1 194 higher than the Current Path forecast for that year, followed by Eswatini (US$860) and Tunisia (US$814). Mauritania (US$106), Lesotho (US$228) and Zambia (US$249) benefit the least.
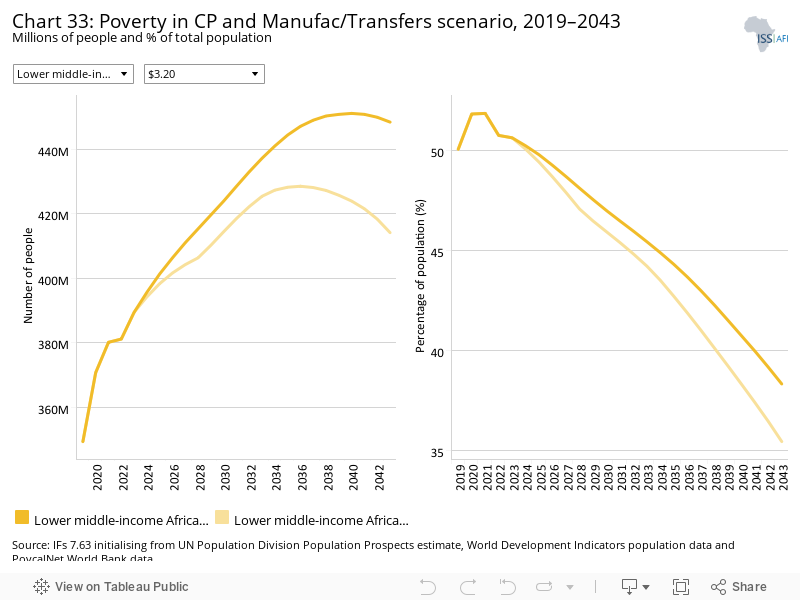
In the Manufacturing/Transfers scenario, LMI Africa would have 414.1 million extremely poor people in 2043 (using US$3.20) instead of 448.4 million, a difference of 34.3 million people. Given its large population, most of that decline (11.5 million people in 2043) is in Nigeria, followed by Egypt (5 million fewer in 2043).
In the Manufacturing/Transfers scenario, LMI Africa would have 35.4% extremely poor people (using US$3.20) in 2043 instead of 38.3% in the Current Path forecast. Much of the decline is due from Djibouti (4.8 percentage point decline) and Senegal (4.4 percentage points).
The Leapfrogging scenario represents a reasonable but ambitious adoption of and investment in renewable energy technologies, resulting in better access to electricity in urban and rural areas. The scenario includes accelerated access to mobile and fixed broadband and the adoption of modern technology that improves government efficiency and allows for the more rapid formalisation of the informal sector.
The intervention is explained here in the thematic part of the website.
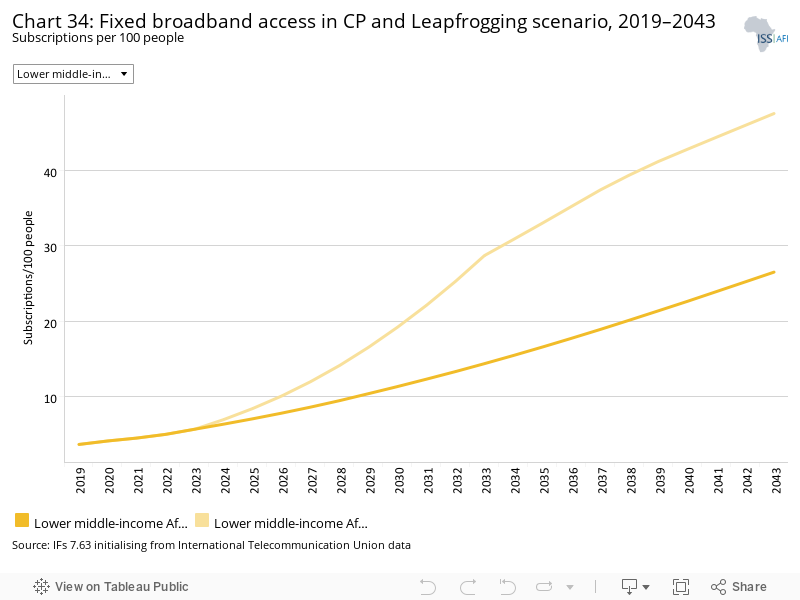
Fixed broadband includes cable modem Internet connections, DSL Internet connections of at least 256 KB/s, fibre and other fixed broadband technology connections (such as satellite broadband Internet, ethernet local area networks, fixed-wireless access, wireless local area networks, WiMAX, etc.).
In 2019, fixed broadband access per 100 people in LMI Africa was at 3.7, and is set to increase to 26.5 in the Current Path by 2043. In the Leapfrogging scenario, that rate almost doubles to 47.5 with large country to country variations.
Ten out of the 23 LMI African states will add more than 20 subscriptions per 100 people in the 2043 Leapfrogging scenario compared to the Current Path forecast, with the most rapid growth in Angola (25.9) and Senegal (25.6). The least growth will occur in Djibouti (9.1) and the Republic of the Congo.
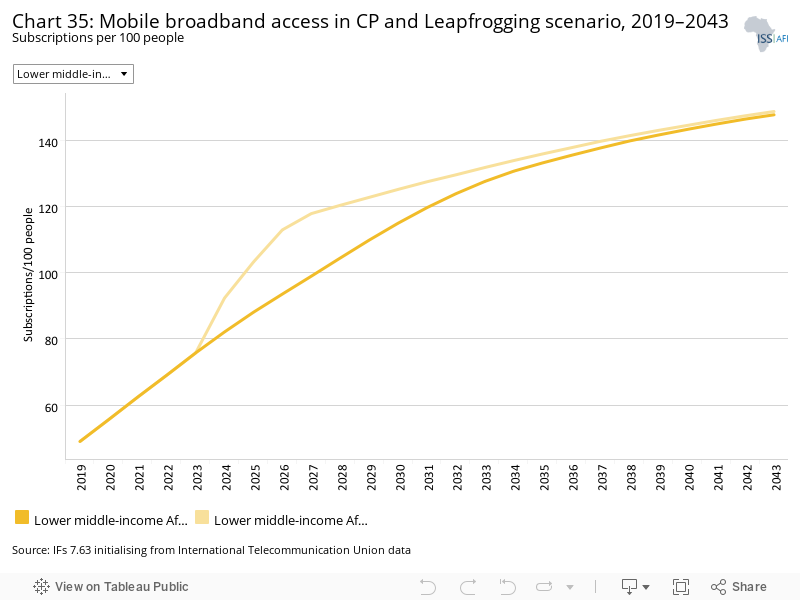
Mobile broadband refers to wireless Internet access delivered through cellular towers to computers and other digital devices.
Even more rapid than increased subscriptions to fixed broadband is the improved access to mobile broadband, which may be reaching saturation levels. In 2019, 49 out of every 100 persons in LMI Africa were connected to mobile broadband. The ratio rises faster in the Leapfrogging scenario than in the Current Path forecast. In the Current Path forecast, LMI Africa will reach saturation in 2045 (150 subscriptions per 100 people).
The Leapfrogging scenario accelerates the already aggressive forecasts on mobile broadband access within IFs, though the growth registered in Leapfrogging scenario for mobile broadband is mild compared to fixed broad subscriptions. In 2043, the greatest growth will occur in Eswatini of additional 4.8 subscriptions compared to the Current Path forecast, followed by Côte d’Ivoire at 1.9. Due to its very high number of subscriptions in the Current Path, the least growth will occur in Ghana of 0.032 subscriptions per 100.
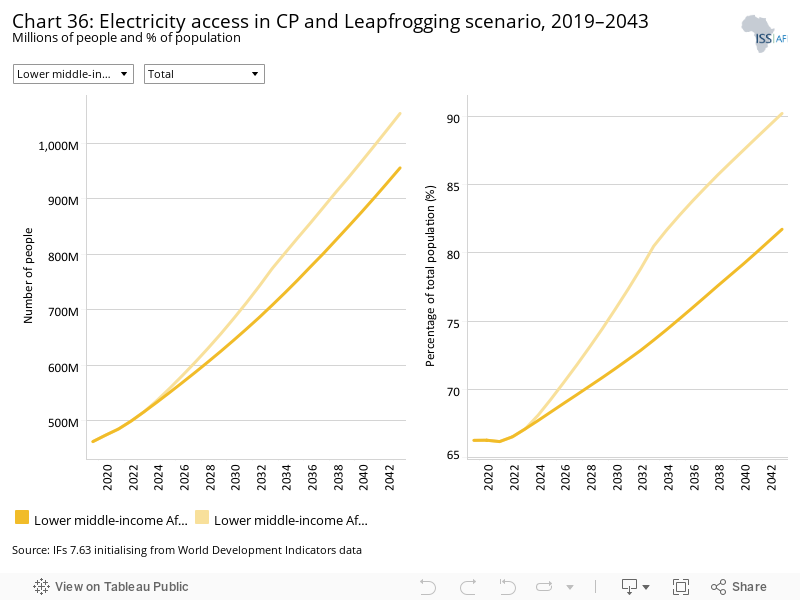
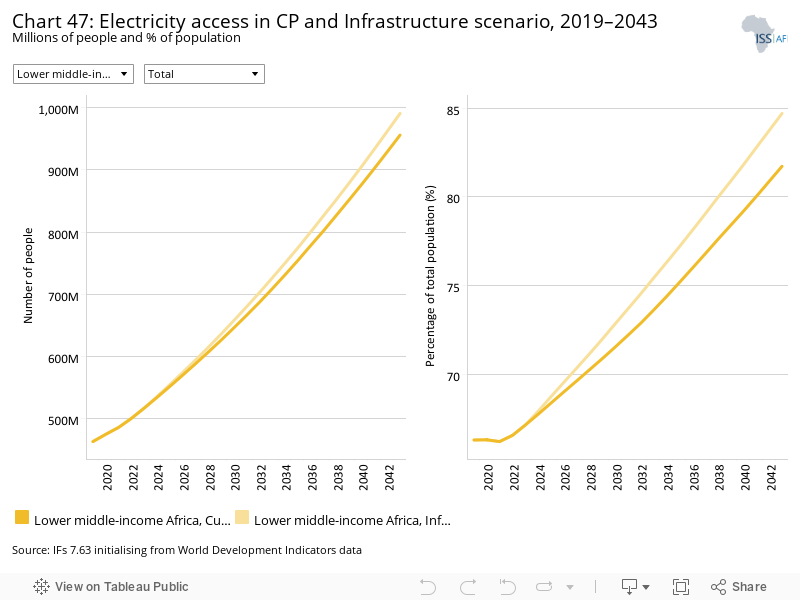
The SDG target for 2030 (Indicator 7.1.1) is 98% electricity access. Only the North African nations of Algeria, Tunisia, Morocco and Egypt will reach this target by 2030, with the rest of LMI Africa trailing behind. In 2019, the LMI Africa average was 66.3%, forecast to increase to 71% in 2030 and 81.7% by 2043 in the Current Path forecast. In the Leapfrogging scenario, the average for LMI improves to 75.8% in 2030 and 90.2% by 2043. Zimbabwe has the largest improvement at 17.4 percentage points above the Current Path forecast by 2043, followed by Tanzania (13.4) and Lesotho (13.1). Due to their already high electricity access rates, the four North African countries in LMI Africa (Algeria, Tunisia, Morocco and Egypt) yield the least Leapfrogging scenario impact in 2043.
The average urban electrification rate in LMI Africa was 82.7% in 2019 and is forecast to improve to 84.7% in 2030 and 90% in the Current Path forecast. In the Leapfrogging scenario, urban electricity access improves to 94.3% in 2043. Zambia is forecast to improve most at 9.7 percentage points in 2043, followed by Nigeria at 6.5. Six LMI countries will not see any improvement in urban electrification because of reaching 100% electricity access, mainly the North African group member states.
The rural–urban gap in electricity access is high in LMI Africa at more than 30 percentage points in 2019. Electricity access in rural LMI Africa is set to increase from 50.7% in 2019 to 69.3% in 2043 (in the Current Path forecast) and 83.7% in the Leapfrogging scenario. The impact of the Leapfrogging scenario on rural electrification is highest in Zimbabwe at 23.4 percentage points above the Current Path forecast, followed by São Tomé and Príncipe at 21.5 percentage points. Overall, six of the LMI countries will see a more than 20 percentage point improvement in rural electricity access due to the Leapfrogging scenario in 2043.
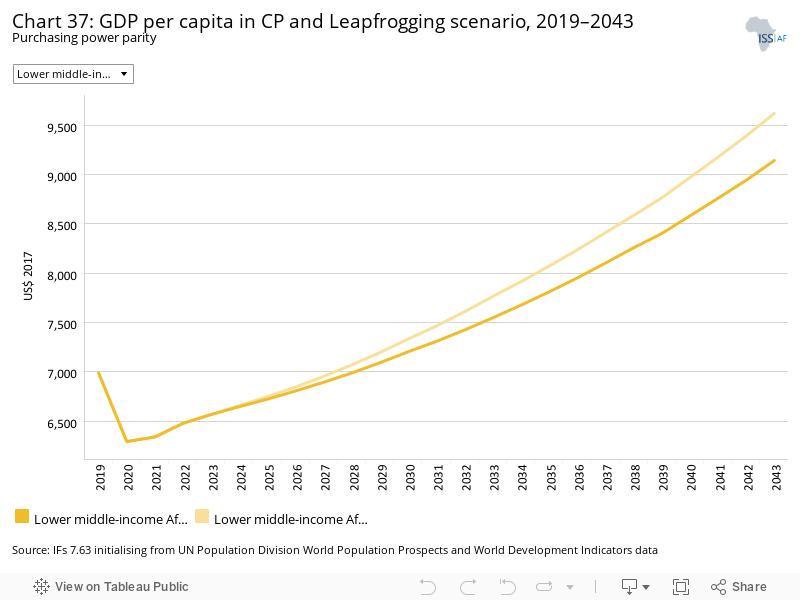
In 2019, GDP per capita was at US$6 989 and is forecast to increase to US$9 142 by 2043 in the Current Path. In the Leapfrogging scenario, GDP per capita will increase by US$ to US$9 619 in 2043. Compared to the Current Path forecast, the largest increase is forecast for Eswatini at US$811, followed by Egypt (US$711), Nigeria (US$603) and the Republic of the Congo (US$521). The countries with the least improvement are Kenya, Cameroon and Lesotho (at US$232).
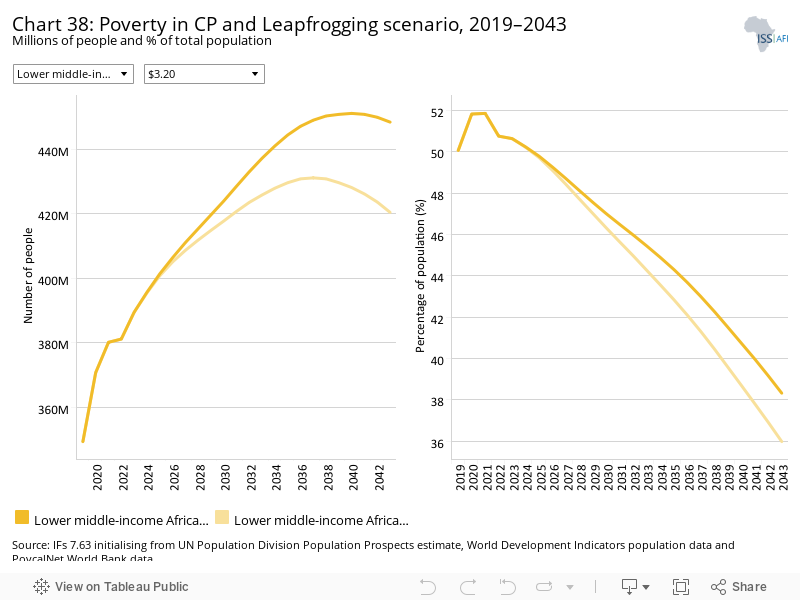
In the Leapfrogging scenario, Tanzania will experience the largest decline in the number of extremely poor people (using US$3.20) among the LMI countries by 2043, compared to the Current Path forecast. It will reduce extreme poverty by 4 percentage points, compared to the Current Path forecast. This reduces to 3.3 for Senegal. Algeria, Tunisia and Morocco will register the least poverty impacts of the Leapfrogging scenario since all have already achieved the SDG target.
In 2019, 349.3 million people in LMI Africa lived in extreme poverty, set to increase to 448.4 million in 2043 in the Current Path forecast even as the poverty rate declines from 50.1% in 2019 to 38.3% in 2043. Instead of 233.4 million extremely poor people in 2043, Nigeria will have 221.6 million, a difference of 11.8 million people; in 2030, the difference will be 1.6 million people. Using US$3.20, Tanzania, the country that will experience the second highest impact, will reduce poverty by 4.3 million people in 2043, compared to the Current Path forecast for that year. Whereas LMI Africa was forecast to have 448.4 million extremely poor people in 2043, that number would only be 420.4 million in the Leapfrogging scenario.
The Free Trade scenario represents the impact of the full implementation of the African Continental Free Trade Area (AfCFTA) by 2034 through increases in exports, improved productivity and increased trade and economic freedom.
The intervention is explained here in the thematic part of the website.
The trade balance is the difference between the value of a country's exports and its imports. A country that imports more goods and services than it exports in terms of value has a trade deficit, while a country that exports more goods and services than it imports has a trade surplus.
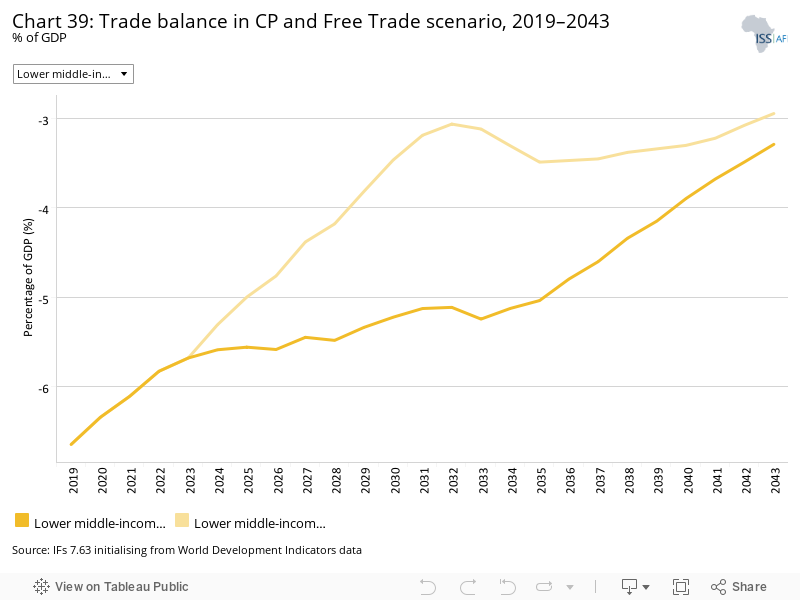
In 2019, LMI Africa had a negative trade balance of − 6.6% of GDP, expected to marginally improve to −3.2% in 2043. The impact of the Free Trade scenario is to reduce this negative trade balance down to −3% in 2043. By 2043, the group would be exporting the value of US$2 109 billion in Free Trade scenario instead of US$1 235 billion in the Current Path forecast and importing US$2 288 billion instead of US$1 418 billion. LMI Africa will see its imports share of GDP decrease in the Current Path forecast, while in the Free Trade scenario, it will start to increase from 2028 after its initial decline. In 2043, the import share of GDP will be 35% in the Free Trade scenario.
Compared to the Current Path forecast, the Free Trade scenario will increase imports per cent of GDP by 24 percentage points in Djibouti in 2043, 23 in Cape Verde, 21 in Eswatini and 20.9 in Tunisia. At the same time, the Free Trade scenario will boost exports per cent of GDP by an additional 23 percentage points in Djibouti compared to the Current Path forecast in 2043, and in Côte d'Ivoire by just 8.1 percentage points.
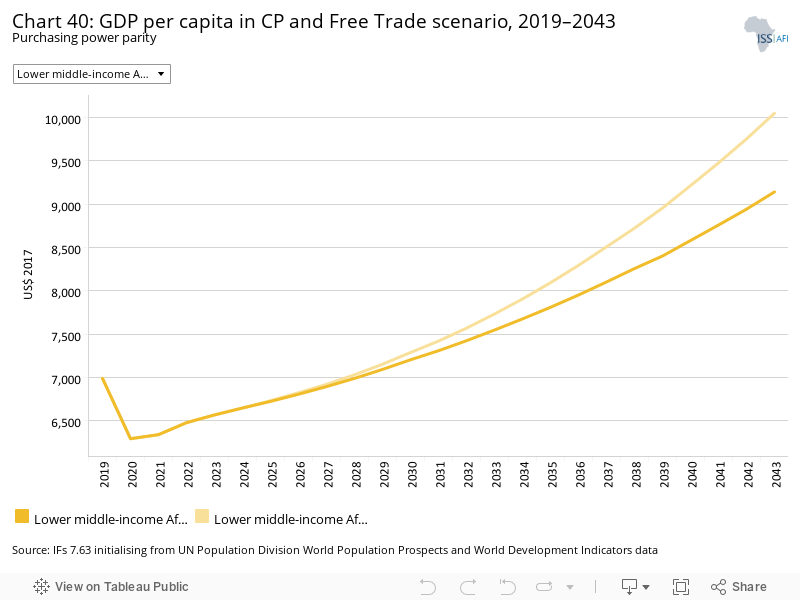
The GDP per capita for LMI Africa was US$6 989 in 2019 and is set to increase to US$9 142 in the Current Path forecast. In the Free Trade scenario, this will increase to US$10 050 in 2043, a difference of US$908. The countries that do best are Cape Verde, Eswatini and Egypt. The countries that gain the least from the Free Trade scenario are Zimbabwe, Benin and Lesotho.
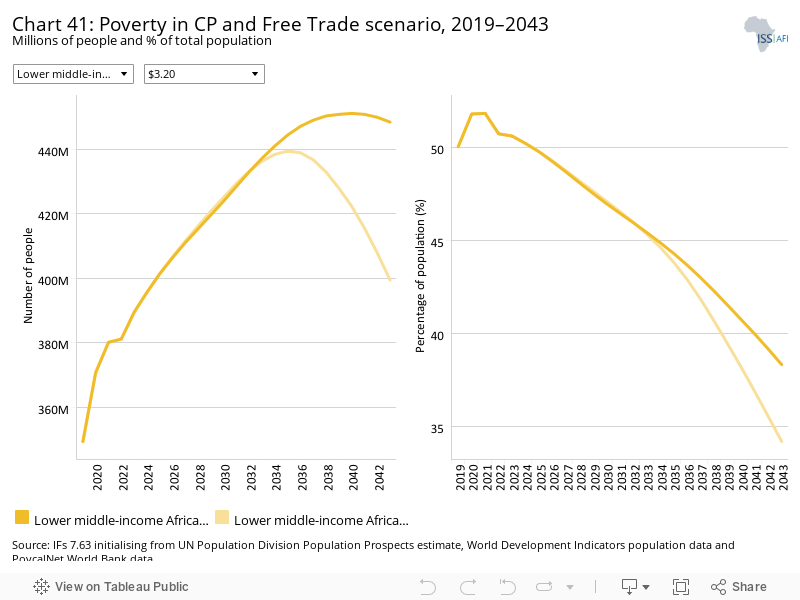
In the Current Path forecast, rates of extreme poverty (using US$3.20) in LMI Africa are set to decline from 50.1% in 2019 to 47% in 2030 and to 38.3% in 2043. In the Free Trade scenario, rates of extreme poverty decline to 34.2% in 2043, 4.2 percentage points below the Current Path forecast. Tanzania will see the largest decline of 8.8 percentage points (compared to the Current Path), followed by Eswatini with a decline of 8.7 percentage points by 2043.
In 2019, 349.3 million people were considered to live on less than US$3.20 per person per day in LMI Africa. In the Current Path forecast it will increase to 448.4 million in 2043. In the Free Trade scenario, extreme poverty numbers will decline to 399.4 million in 2043. This means that the impact of the Free Trade scenario is to lift an additional 48.9 million people out of extreme poverty. Nigeria, with its large poor population, will see the greatest improvement at a reduction of 15.2 million fewer extremely poor people, followed by Tanzania at 9.4 million people.
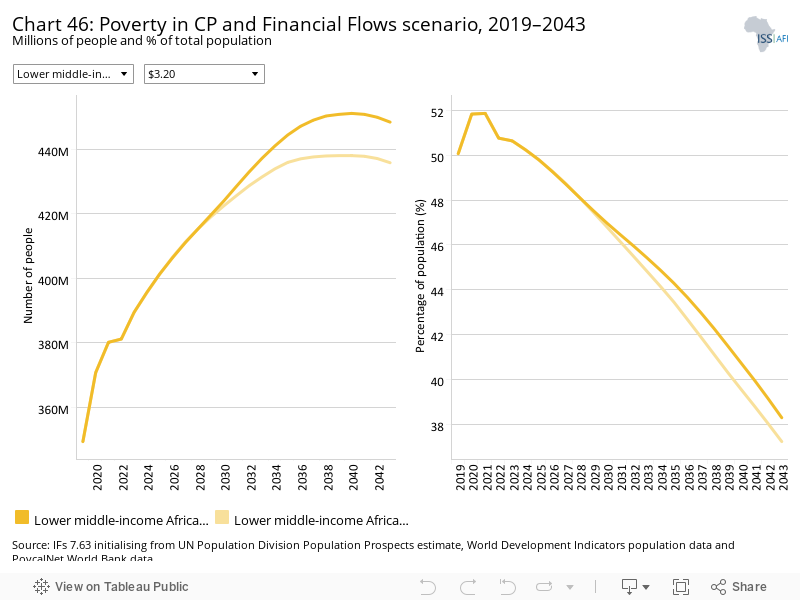
The Financial Flows scenario represents a reasonable but ambitious increase in worker remittances and aid flows to poor countries, and an increase in the stock of foreign direct investment (FDI) and additional portfolio investment inflows to middle-income countries. We also reduced outward financial flows to emulate a reduction in illicit financial outflows.
The intervention is explained here in the thematic part of the website.
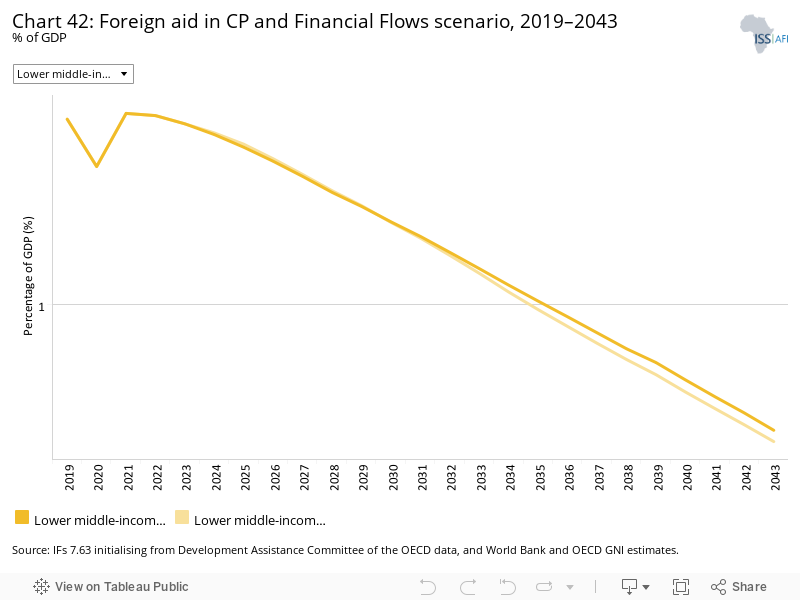
Historically, more aid goes to low-income and fragile states than to middle-income countries. In 2019, the LMI group received US$32.8 billion net aid that would increase to US$30.6 in 2043 in the Current Path forecast. However, as a per cent of GDP, aid continually reduces from 1.7% of GDP in 2019 to 1.3% in 2030 and 0.5% in 2043. This is because the increase in aid does not keep pace with economic growth within the group.
The impact of the Financial Flows scenario on LMI Africa is marginal, reducing aid as a percentage of GDP by 0.04 percentage points compared to the Current Path forecast in 2043, a difference equivalent to US$1.5 billion in that year.
Aid as a percentage of GDP is highest in small LMI African countries of São Tomé and Príncipe (at 14.6% of GDP), Cape Verde, Comoros and Djibouti. Larger economies get much less aid, for example, in Nigeria where aid is just 1.4% of GDP in 2019, although its income from oil also plays a role in low levels of aid.
As a result, in the Financial Flows scenario, the reduction in aid as a per cent of GDP is slower than in the Current Path. By 2030, aid constitutes 1.3% of GDP and is at 0.5% of GDP in 2043. In 2030, LMI Africa will receive US$296 million more aid in the Financial Flows scenario than in the Current Path forecast and US$1.4 billion less in 2043.
Whereas the percentage of aid flows decreases for LMI African countries, in the non-resource rich sub-Saharan member countries the absolute dollar values increase both in the Current Path forecast and the Financial Flows scenario by 2043.
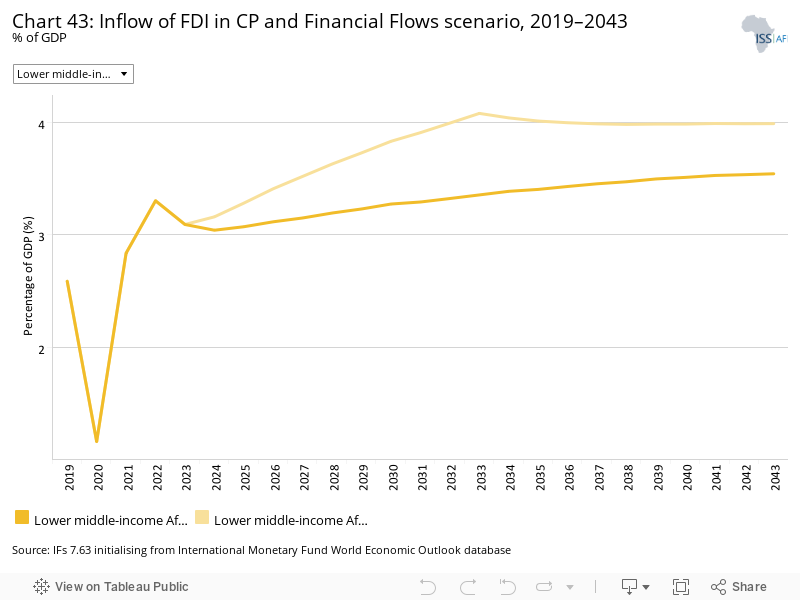
FDI typically goes to middle- and high-income countries rather than low-income countries. In 2019, São Tomé and Príncipe, Mauritania, and Djibouti receive the largest FDI inflows of >9% of GDP. Algeria and Comoros received the least. The impact of the Financial Flows scenario will be greatest in São Tomé and Príncipe where it will boost FDI by additional 1.3 percentage points compared to the Current Path, followed by Djibouti (1.1) and the Republic of the Congo (1.0). Within the LMI Africa group, FDI inflows will increase to 3.5% in 2043 from 2.6% in 2019 in the Current Path forecast. The Financial Flows scenario will increase FDI inflows to 4% in 2043.
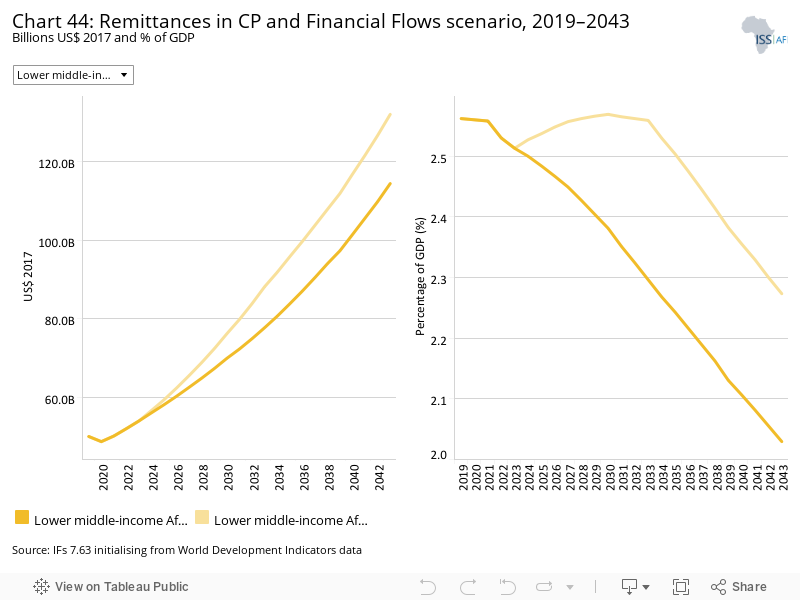
LMI Africa is a net receiver of remittances at US$50 billion in 2019, set to more than double to US$114.4 billion in 2043, and in the Financial Flows scenario this will further rise to US$131.9 billion in 2043. In 2019, 18 out of the 23 LMI countries were net receivers of remittance with Nigeria topping the list at US$22.4 billion, followed by Egypt at just half of Nigeria (US$11.4 billion). A number of countries experienced net outflows in 2019, namely the Republic of the Congo, Zambia, Mauritania, Côte Ivoire and Angola.
By 2043, Nigeria will benefit most from the Financial Flows scenario by boosting remittances receipt by an additional US$9.6 billion, followed by Egypt at US$2.7 billion.
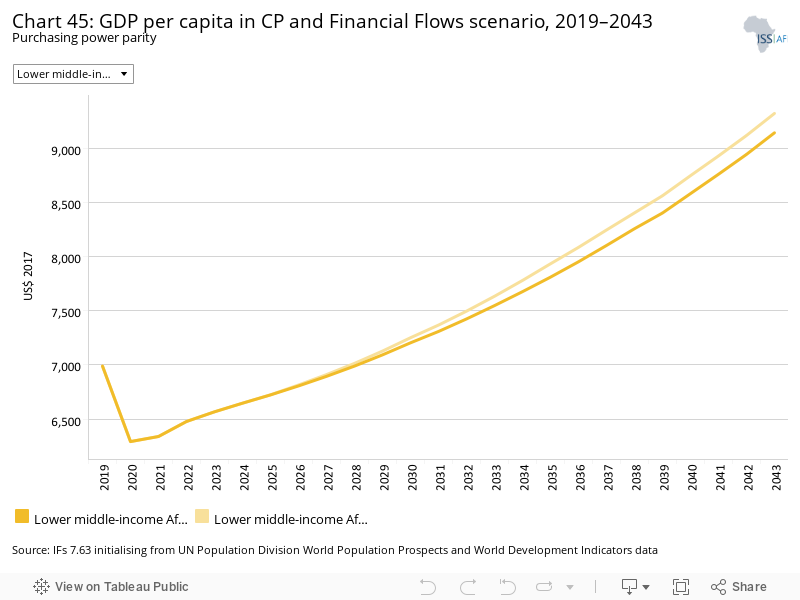
In 2019, the GDP per capita in LMI Africa was US$6 989. In the Current Path forecast, GDP per capita will come to US$9 142 in 2043. Instead, in the Financial Flows scenario, it comes to US$9 321, a difference of US$178. Compared to the Current Path forecast, Eswatini receives the largest increase at US$385 in 2043, followed by Egypt and Tunisia. Mauritania, Comoros and Algeria achieve the smallest improvement at below US$50 per person.
Trade openness will reduce poverty in the long term after initially increasing it due to the redistributive effects of trade. Most African countries export primary commodities and low-tech manufacturing products, and therefore a continental free trade agreement (AfCFTA) that reduces tariffs and non-tariff barriers across Africa will increase competition among countries in primary commodities and low-tech manufacturing exports. Countries with inefficient, high-cost manufacturing sectors might be displaced as the AfCFTA is implemented, thereby pushing up poverty rates. In the long term, as the economy adjusts and produces and exports its comparatively advantaged (lower relative cost) goods and services, poverty rates will decline.
The difference between the Current Path forecast and the Financial Flows scenario is equivalent to 1.5 million fewer extremely poor people in 2030 (using US$3.20) and 12.6 million fewer in 2043. The largest decline is in Nigeria (5.2 million people) and Tanzania (1.6 million).
The extreme poverty rate in 2019 (at US$1.90) was 26.9%, which is likely to decline to 23.9% in 2030 and 18% in 2043. In the Financial Flows scenario, the rate of extreme poverty declines to 17.3% in 2043.
The Infrastructure scenario represents a reasonable but ambitious increase in infrastructure spending across Africa, focusing on basic infrastructure (roads, water, sanitation, electricity access and ICT) in low-income countries and increasing emphasis on advanced infrastructure (such as ports, airports, railway and electricity generation) in higher-income countries.
Note that health and sanitation infrastructure is included as part of the Health/WaSH scenario and that ICT infrastructure and more rapid uptake of renewables are part of the Leapfrogging scenario. The interventions there push directly on outcomes, whereas those modelled in this scenario increase infrastructure spending, indirectly boosting other forms of infrastructure, including those supporting health, sanitation and ICT.
The intervention is explained here in the thematic part of the website.
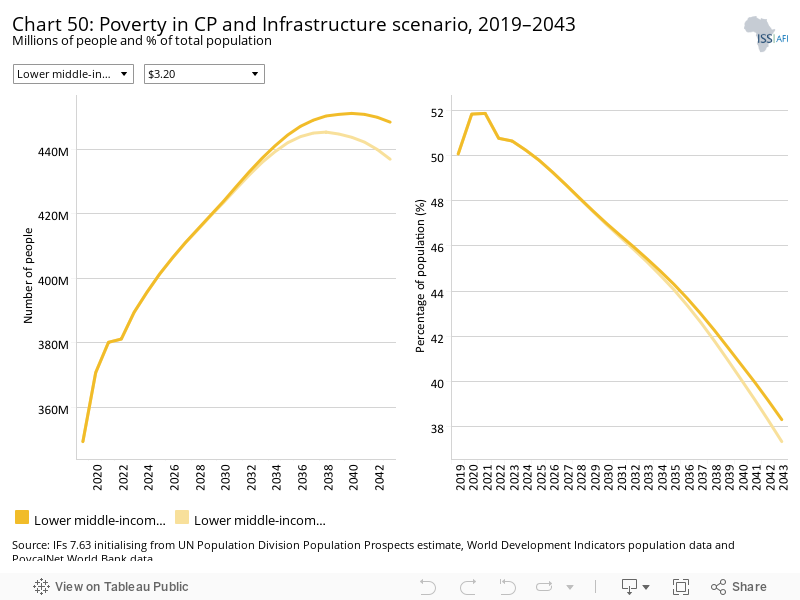
In 2019, electricity access in LMI Africa was 66.3%; in 2030 it will increase to 71.5%, and in the 2043 Current Path forecast it reaches 81.7%. Because of its high income level, average LMI Africa will in the Infrastructure scenario enjoy 1.3 percentage points more electricity access in 2030 compared to the Current Path forecast, which increases to 3 percentage points in 2043. The Infrastructure scenario has the effect of boosting electricity access across member countries by an average of 3 percentage points in 2043 compared to the Current Path forecast. This amounts to 34 million more people with access to electricity, of which 24.6 million will live in urban areas. Zambia and Zimbabwe will see the greatest boost in access to electricity due to the Infrastructure scenario of 10.9 and 10.7 percentage points in 2043. At the same time, Tunisia and Morocco will see the least improvements.
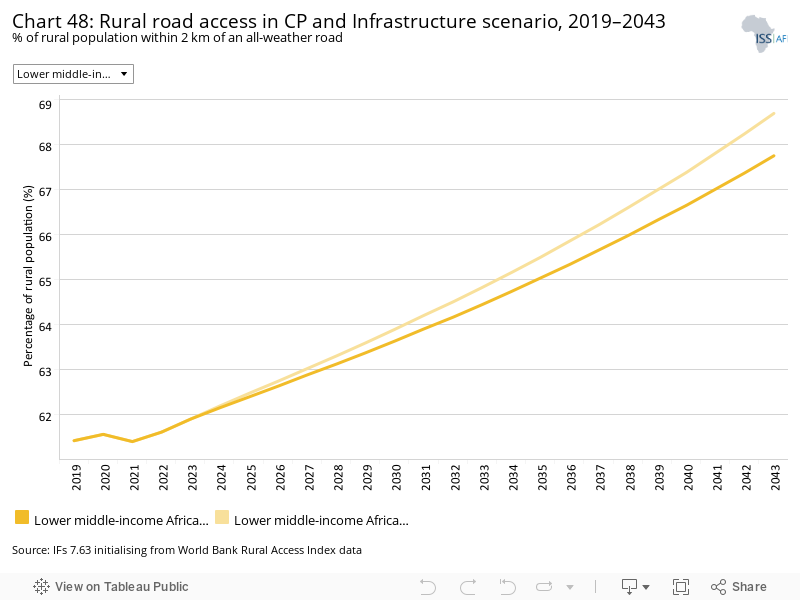
Indicator 9.1.1. in the Sustainable Development Goals refers to the proportion of the rural population who live within 2 km of an all-season road and is captured in the Rural Access Index.
In 2019, 61.4% of the population in rural areas in LMI Africa were within 2 km of an all-weather road. The Current Path forecast is that this will improve to 63.6% by 2030 and 67.8% by 2043. The LMI African countries with the best access are Algeria (86%) and Egypt (83%). The worst performing countries are Senegal (32.9%) and Cameroon (25.2%). In the Infrastructure scenario average access improves to 68.7% in 2043. The Republic of the Congo gains most from the Infrastructure scenario, improving access by 6.4 percentage points above the Current Path forecast by 2043, followed by Comoros. In the two East African neighbouring countries of Tanzania and Kenya, and in Ghana, Infrastructure scenario has the least impact on rural access to all-weather roads of less than 0.6 percentage points.
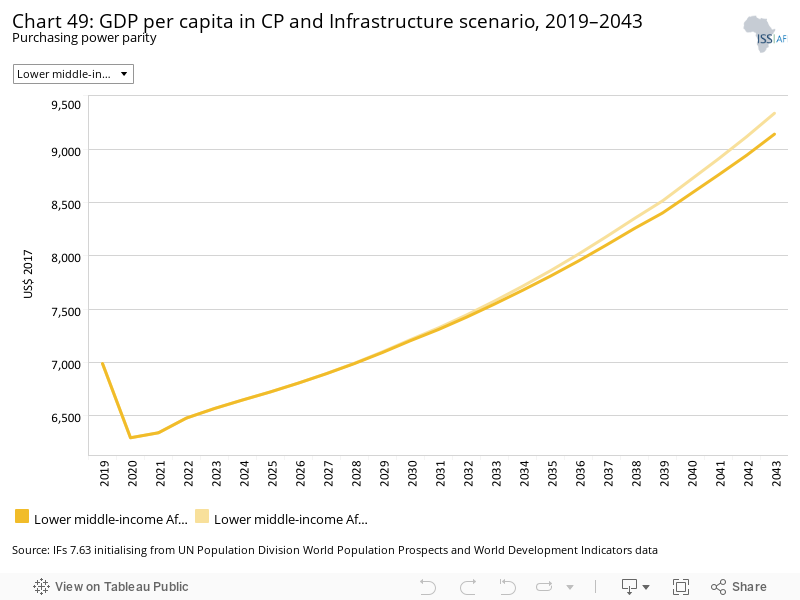
The GDP per capita for LMI Africa was US$6 989 in 2019 and set to increase to US$9 142 in the Current Path forecast, compared to US$9 338 in the Infrastructure scenario by 2043. Eswatini gains the most in GDP per capita that increases US$605 above the Current Path forecast by 2043, followed by Angola (US$528). Ghana, which benefits the least, will only add US$75 per person by 2043 from the Infrastructure scenario.
The Current Path forecast is that extreme poverty in LMI Africa (using US$3.20) will increase from 349.3 million people (50.1% of the population) in 2019 to 423.5 million in 2030 and 448.4 million in 2043, representing 47% and 38.3% of the population, respectively. The number of extremely poor people in the Infrastructure scenario in 2030 is 423.5 million in 2030 and 436.9 million in 2043. These numbers represent 46.9% and 37.4% of the total population. The decline in poverty is most significant in the Côte d'Ivoire and Zambia with 3.7 and 3.2 percentage points less poverty rates in 2043 compared to the Current Path forecast.
The Governance scenario represents a reasonable but ambitious improvement in accountability and reduces corruption, and hence improves the quality of service delivery by government.
The intervention is explained here in the thematic part of the website.
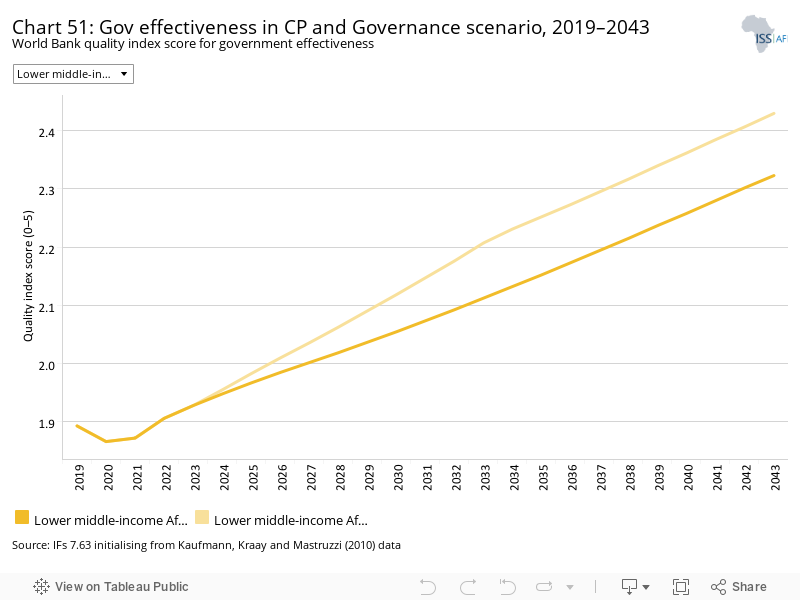
As defined by the World Bank, government effectiveness ‘captures perceptions of the quality of public services, the quality of the civil service and the degree of its independence from political pressures, the quality of policy formulation and implementation, and the credibility of the government’s commitment to such policies’.
Chart 51 presents the impact of the interventions in the Governance scenario on government effectiveness.
The Governance scenario improves government effectiveness by 4.7% in 2043 above the Current Path forecast. The Republic of the Congo improves the most, 13%, and Cape Verde the least (less than 1% improvement). Chart 51 shows the government effectiveness in the Current Path forecast and the Governance scenario for the LMI Africa countries.
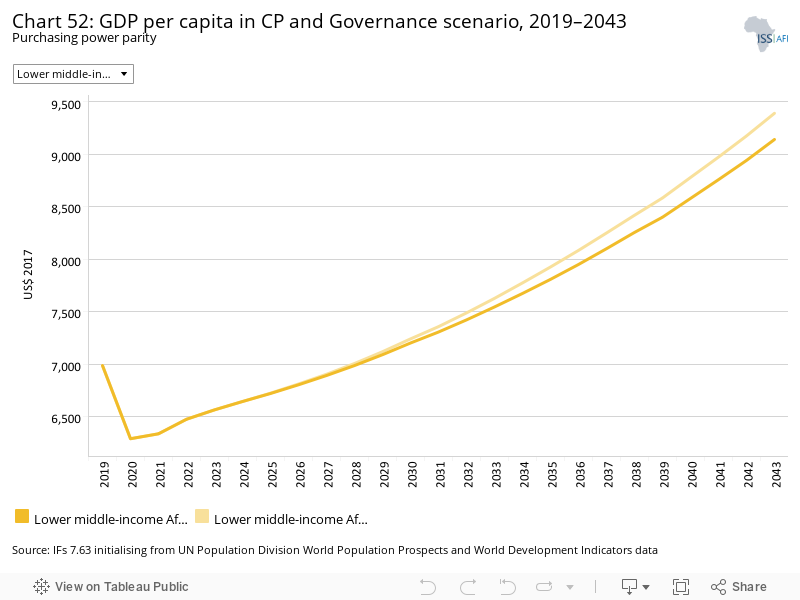
In 2019, GDP per capita in LMI Africa was US$6 989 and is set to improve to US$9 142 in 2043. In the Governance scenario, GDP per capita increases to US$9 391. Egypt will gain the most in the Governance scenario compared to the Current Path forecast at US$494. Zimbabwe will gain the least at a meagre US$86 above the Current Path forecast in 2043.
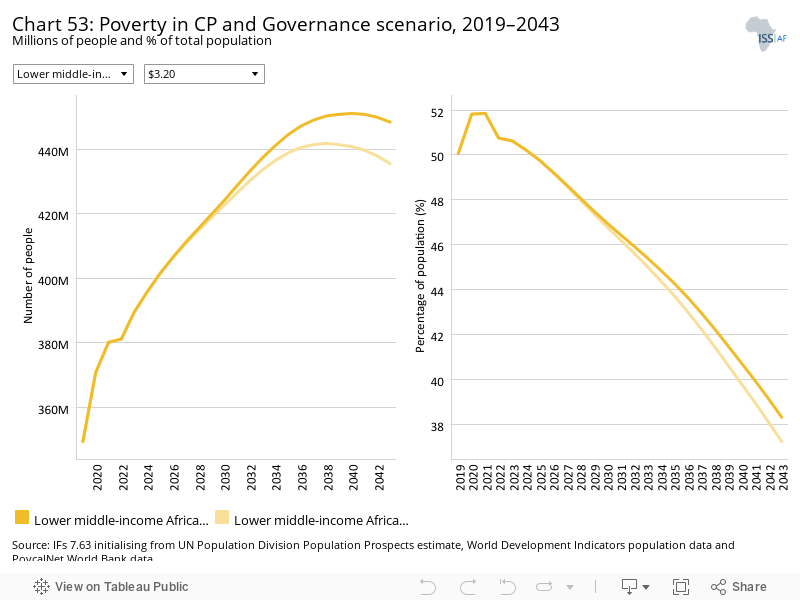
The rate of extreme poverty (using US$3.20) was 50.1% in LMI Africa in 2019, equivalent to 349.3 million people. In the Governance scenario, extreme poverty will decline to 37.2% (435.5 million people) by 2043, compared to 38.3% (448.4 million people) in the Current Path forecast. Extreme poverty in Senegal and Djibouti will decline most by 1.7 and 1.8 percentage points, respectively, in 2043 compared to the Current Path forecast. In Cape Verde and Morocco, extreme poverty at US$3.20 will decline the least as a result of the Governance scenario.
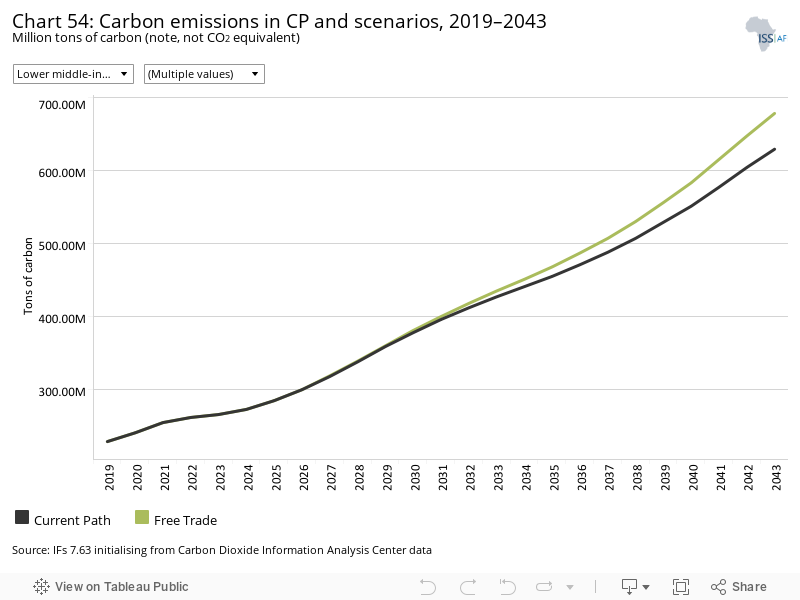
This section presents projections for carbon emissions in the Current Path for LMI Africa and the 11 scenarios. Note that IFs uses carbon equivalents rather than CO2 equivalents.
In 2019, the LMI Africa group released only 229 million tons of carbon of which 69% was released by only three countries (Egypt, Algeria and Nigeria). In the Current Path forecast, LMI Africa will release 629 million tons of carbon in 2043, as a result of greater economic activity and its larger population.
The Free Trade scenario is the most carbon-intensive scenario (678 million tons in 2043), followed by Manufacturing/Transfers scenario (661 million tons) and the Agriculture scenario (651 million tons), while in the Demographic scenario, carbon emissions in 2043 will be 11 million tons below the Current Path forecast.
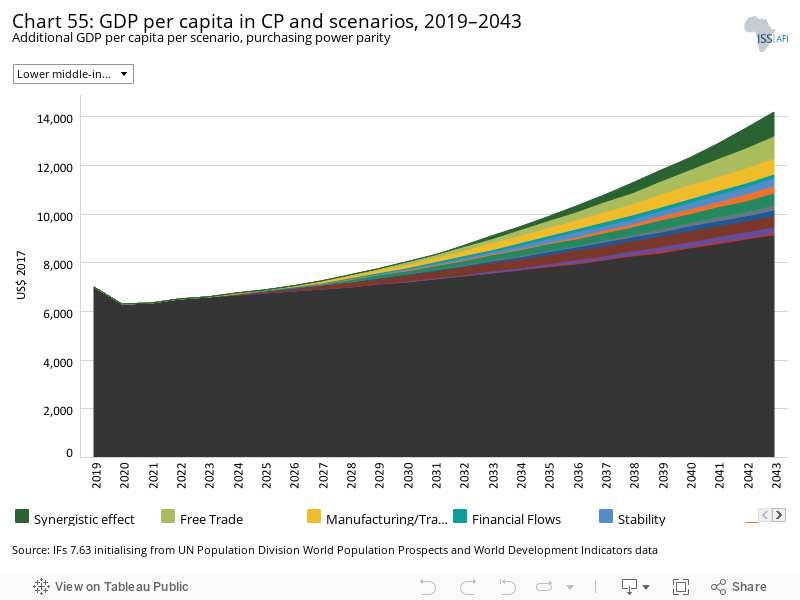
The Combined Agenda 2063 scenario consists of the combination of all 11 sectoral scenarios presented above, namely the Stability, Demographic, Health/WaSH, Agriculture, Education, Manufacturing/Transfers, Leapfrogging, Free Trade, Financial Flows, Infrastructure and Governance scenarios. The cumulative impact of better education, health, infrastructure, etc. means that countries get an additional benefit in the integrated IFs forecasting platform that we refer to as the synergistic effect. Chart 55 presents the contribution of each of these 12 components to GDP per capita in the Combined Agenda 2063 scenario as a stacked area graph.
In 2019, the average GDP per capita in LMI Africa was US$6 989. In the Current Path forecast, this will increase to US$9 142 in 2043. By 2033, the end of the second ten-year implementation plan of the Combined Agenda 2063, the Agriculture scenario provides the largest increase in GDP per capita, followed by the Manufacturing/Transfers and Leapfrogging scenarios. By 2043, the Free Trade scenario provides the largest increase in GDP per capita, followed by the Manufacturing/Transfers and Leapfrogging scenarios.
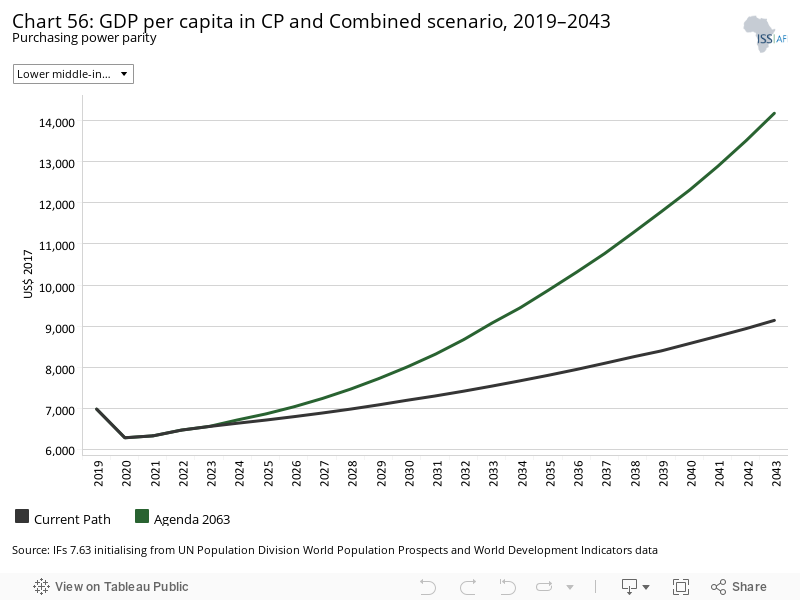
Whereas Chart 55 presents a stacked area graph on the contribution of each scenario to GDP per capita as well as the additional benefit or synergistic effect, Chart 56 presents only the GDP per capita in the Current Path forecast and the Combined Agenda 2063 scenario.
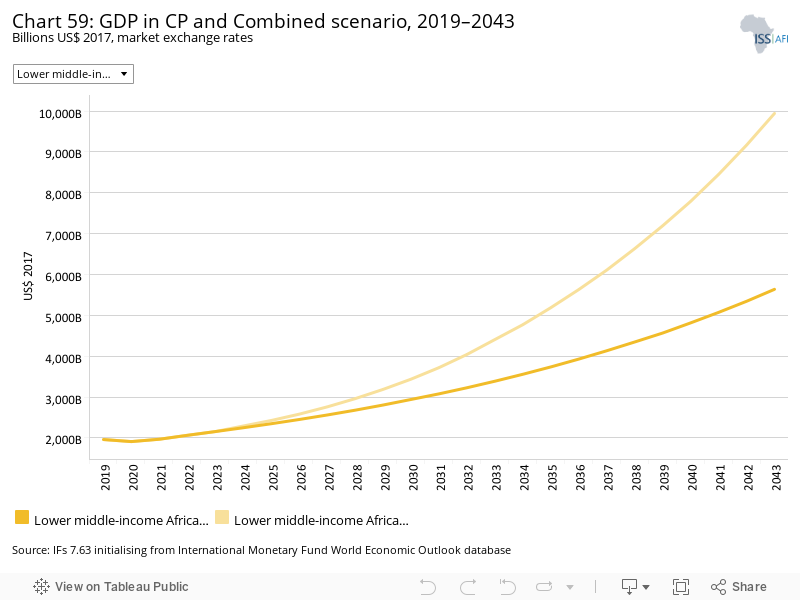
The Combined Agenda 2063 scenario has a substantial impact on incomes in the LMI Africa group. The GDP per capita for LMI Africa was US$6 989 in 2019 and is set to increase to US$9 142 in 2043 in the Current Path forecast. In the Combined Agenda 2063 scenario, the average GDP per capita for LMI Africa will be US$14 170, an increase of 55% above the Current Path forecast for that year.
Eswatini gains most in GDP per capita improvements in the Combined Agenda 2063 within the group. Its GDP per capita will be US$7 735 larger in 2043 compared to the Current Path forecast, followed by Angola at US$6 820. Lesotho only gains US$2 135 as a result of the Combined Agenda 2063 scenario in 2043.
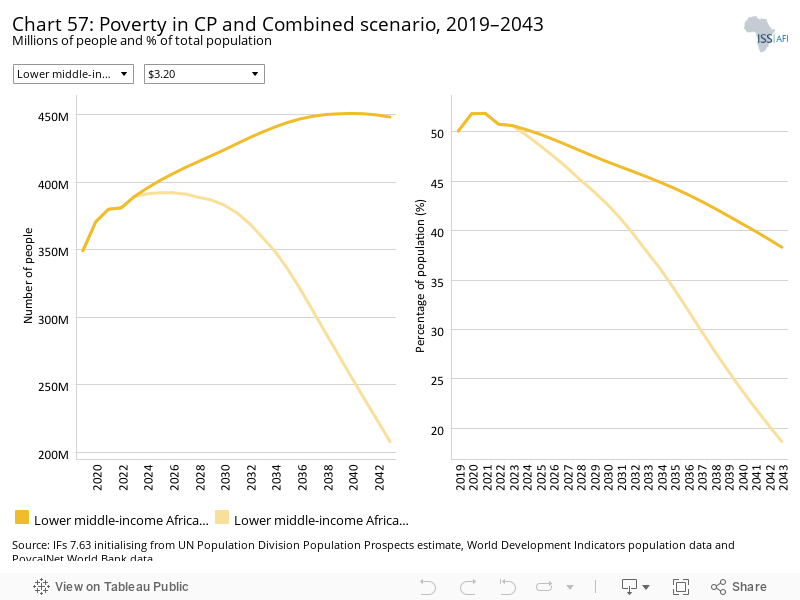
In 2019, extreme poverty at US$3.20 affected 50.1% in LMI Africa in 2019, equivalent to 349.3 million people. In the Combined Agenda 2063 forecast, the percentage of extremely poor people could decline to 18.7% by 2043 (equivalent to 207.9 million people), instead of 38.3% (or 448.4 million people) in the Current Path forecast.
Tanzania will experience the largest decline in extreme poverty, namely 32.8 percentage points, followed by Côte d’Ivoire and Zambia. Morocco, Tunisia and Algeria would register a less than 5 percentage point improvement.
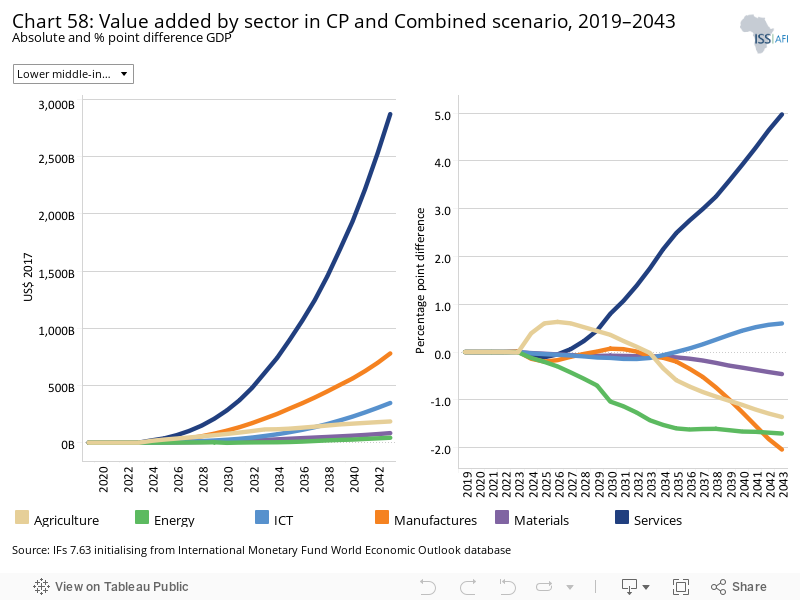
See Chart 8 to view the Current Path forecast of the sectoral composition of the economy.
All sectors increase in value when comparing the 2043 Current Path forecast with the Combined Agenda 2063 scenario although the relative contribution differs with the increase in the size of the service sector particularly large, followed by the manufacturing, ICT, agriculture, material and energy sectors.
In 2019, services represented 48.8% of the LMI Africa economy, increasing to 55.2% on the Current Path forecast by 2043. In the Combined Agenda 2063 scenario, services would represent 60.2% in 2043. The service sector will expand particularly rapidly in Egypt and Comoros.
The changes in the sectoral composition of the LMI Africa by 2043 will consist of a decline of the contribution of the energy, manufacturing, agriculture and materials sectors and increases in services and ICT. Initially, agriculture increases its contribution to GDP, but declines as from 2034 such that, by 2043, it contributes 1.4 percentage points less to GPD. By 2043, agriculture will decline most in Kenya (3 percentage points) and Tunisia (2.7 percentage points), and least in Tanzania by −0.54 percentage points.
In 2019, Nigeria (US$1805 billion) had the largest economy at US$560.7 billion, followed by Egypt at US$348.8 billion, and in the Current Path forecast Nigeria will grow its economy to US$1968.5 billion, and Egypt to US$983.8 billion by 2043. The Combined Agenda 2063 scenario will boost these economies by an additional US$1805 billion (in Nigeria) and US$536 billion (in Egypt) compared to the Current Path forecast in 2043. In 2043, the economies of Djibouti and São Tomé and Príncipe would see the smallest increases in size in the Combined Agenda 2063 scenario compared to the Current Path forecast for that year.
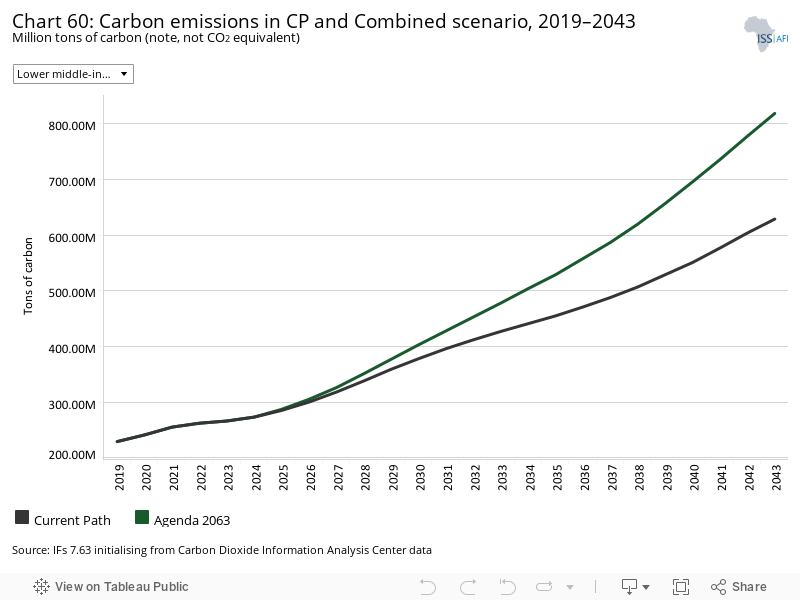
In 2019, LMI Africa released only 229 million tons of carbon. In the Combined Agenda 2063 scenario, LMI Africa will release 819 million tons of carbon in 2043 compared to 629 million tons in the Current Path forecast. Nigeria, the country with the largest absolute increase in emissions will, in 2033, release an additional 23 million tons in the Combined Agenda 2063 compared to the Current Path forecast. In 2043, Nigeria will release an additional 91 million tons.
Page information
Contact at AFI team is Mustapha Jobarteh
This entry was last updated on 13 December 2023 using IFs v7.63.
Donors and sponsors


Reuse our work
- All visualizations, data, and text produced by African Futures are completely open access under the Creative Commons BY license. You have the permission to use, distribute, and reproduce these in any medium, provided the source and authors are credited.
- The data produced by third parties and made available by African Futures is subject to the license terms from the original third-party authors. We will always indicate the original source of the data in our documentation, so you should always check the license of any such third-party data before use and redistribution.
- All of our charts can be embedded in any site.
Cite this research
Mustapha Jobarteh (2025) Lower middle-income Africa. Published online at futures.issafrica.org. Retrieved from https://futures.issafrica.org/geographic/income-groups/lower-middle-income-africa/ [Online Resource] Updated 13 December 2023.