 Low-income Africa
Feedback welcome
Our aim is to use the best data to inform our analysis. See our Technical page for information on the IFs forecasting platform. We appreciate your help and references for improvements via our feedback form.
In this entry, we first describe the Current Path forecast for low-income Africa as it is expected to unfold to 2043, the end of the third ten-year implementation plan of the African Union’s Agenda 2063 long-term vision for Africa. The Current Path in the International Futures (IFs) forecasting model initialises from country-level data that is drawn from a range of data providers. We prioritise data from national sources.
The Current Path forecast is divided into summaries on demographics, economics, poverty, health/WaSH and climate change/energy. A second section then presents a single positive scenario for potential improvements in stability, demographics, health/WaSH, agriculture, education, manufacturing/transfers, leapfrogging, free trade, financial flows, infrastructure, governance and the impact of various scenarios on carbon emissions. With the individual impact of these sectors and dimensions having been considered, a final section presents the impact of the Combined Agenda 2063 scenario.
We generally review the impact of each scenario and the Combined Agenda 2063 scenario on gross domestic product (GDP) per person and extreme poverty except for Health/WaSH that uses life expectancy and infant mortality.
The information is presented graphically and supported by brief interpretive text.
All US$ numbers are in 2017 values.
Summary
- Current Path forecast
- The total population of low-income Africa was 536 million in 2019, set to increase to 978 million by 2043. Because of its youthful population, with nearly one in two adults in the 15 to 29 age group, low-income Africa will start benefiting from demographic dividend halfway into the 21st Century. Jump to Demographics: Current Path
- Though all members fall within the same income range, there are individual country differences in population and size of the economy. In 2019, the sizes of the economies in low-income Africa ranged from US$72.7 billion in Sudan to US$1.6 billion in Guinea Bissau. Jump to Economics: Current Path
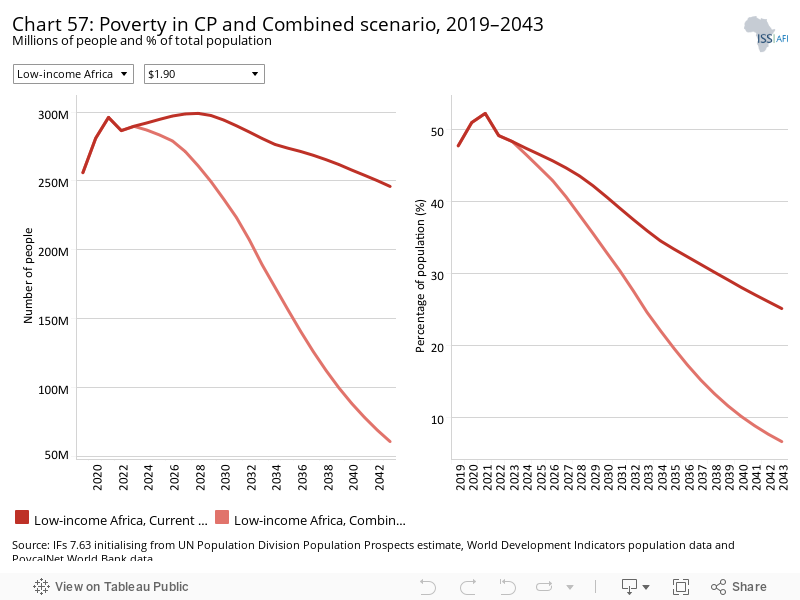
- Despite the projected growth in population, rapid economic growth will see a reduction in both the number of extremely poor people (using US$1.90) and the percentage of extremely poor people. Low-income Africa will see a decline in extreme poverty from 256 million in 2019 to 246 million in 2043 in the Current Path forecast, and at the same time, the proportion of extremely poor people will fall from 47.8% to 25.2% in 2043. Jump to Poverty: Current Path
- Low-income Africa countries emitted 28 million tons of carbon in 2019 — an amount that will increase more than five times to 154 million tons by 2043. Sudan, with the largest GDP in 2019, is also the largest emitter. Jump to Carbon emissions/Energy: Current Path
- Sectoral scenarios
- The Stability scenario models an improvement to current average levels of stability in low-income Africa and reduces the number of extremely poor people by 19.3 million in 2043 compared to the Current Path forecast. Jump to Stability scenario
- The Demographic scenario reduces fertility rates to the extent that low-income Africa enters the demographic dividend in 2042 instead of 2050. Jump to Demographic scenario
- The impact of the Health/WaSH scenario is an increase of life expectancy in low-income Africa by six months by 2043. Jump to Health/WaSH scenario
- With significant agricultural potential, average crop yields in low-income Africa increase by 69% in the Agriculture scenario (compared to the Current Path forecast) and reduce the percentage of people living in extreme poverty by almost 7 percentage points to 18.3% by 2043. Jump to Agriculture scenario
- The impact of the Education scenario is the largest in Malawi and Guinea. GDP per capita increases by US$214 and US$209, respectively, by 2043, compared to the Current Path forecast for that year. Jump to Education scenario
- Chad gains the largest percentage point increase in the size of its manufacturing sector in the Manufacturing/Transfers scenario, followed by Uganda and CAR. South Sudan gains the least, while the size of the manufacturing sector will decline in 10 of 23 low-income African countries. Jump to Manufacturing/Transfers scenario
- In 2019, fixed broadband subscriptions per 100 people in low-income Africa stood at 2.3, and in the Current Path forecast it is set to increase to 29 subscriptions by 2043. In the Leapfrogging scenario, that rate increases by 67% (19.3 subscriptions per 100 people), with large country to country variations, ranging from 25.2 in Chad to 0.85 in CAR. Jump to Leapfrogging scenario
- The flow of remittances in the Financial Flows scenario is set to increase by US$4.3 billion in 2043 compared to the Current Path forecast in that year. The improvement is largest in Ethiopia and Uganda, and least in Eritrea. Jump to Financial Flows scenario
- Rwanda gains most from the Infrastructure scenario, improving the portion of the rural population with access to an all-season road by 5.9 percentage points by 2043, followed by The Gambia at 5.5 percentage points. Jump to Infrastructure scenario
- The Governance scenario improves government effectiveness by almost 7% in 2043 above the Current Path forecast. Eritrea improves the most (16.8%) and Madagascar the least (1.9%). Jump to Governance scenario
- In 2019, Sudan was the largest carbon emitter in low-income Africa, followed by Mozambique. Looking to 2043, the Free Trade scenario is the most carbon-intensive scenario for low-income Africa and will release 174 million tons of carbon that year. Jump to Impact of scenarios on carbon emissions
- Combined Agenda 2063 scenario
- In 2019, average GDP per capita in low-income Africa was US$1 660. In the Current Path forecast, it increases to US$3 790 in 2043. It could be US$6 502 in 2043 in the Combined Agenda 2063 scenario, which is 71.6% larger than the Current Path forecast for that year. With high rates of extreme poverty, Madagascar and Burundi will experience the largest decline in extreme poverty at 48.8 and 38.7 percentage points, respectively, by 2043. In the Combined Agenda 2063 scenario, low-income Africa will release 230 million tons of carbon in 2043, compared to 154 million tons in the Current Path forecast. Jump to Combined Agenda 2063 scenario
All charts for Low-income Africa
- Chart 1: Political map of low-income Africa
- Chart 2: Population structure in CP, 1990–2043
- Chart 3: Urban and rural population in CP, 1990–2043
- Chart 4: Population density map for 2019
- Chart 5: GDP in CP, 1990–2043
- Chart 6: GDP per capita in CP, 1990–2043
- Chart 7: Informal sector value in CP, 2015–2043
- Chart 8: Value added by sector in CP, 2015–2043
- Chart 9: Agriculture production/demand in CP, 1990–2043
- Chart 10: Poverty in CP, 2015–2043
- Chart 11: Energy production by type in CP, 1990–2043
- Chart 12: Carbon emissions in CP, 1990–2043
- Chart 13: Governance security in CP and Stability scenario, 2019–2043
- Chart 14: GDP per capita in CP and Stability scenario, 2019–2043
- Chart 15: Poverty in CP and Stability scenario, 2019–2043
- Chart 16: Demographic dividend in CP and Demog scenario, 2019–2043
- Chart 17: Infant mortality in CP and Demog scenario, 2019–2043
- Chart 18: GDP per capita in CP and Demog scenario, 2019–2043
- Chart 19: Poverty in CP and Demog scenario, 2019–2043
- Chart 20: Life expectancy in CP and Health/WaSH scenario, 2019–2043
- Chart 21: Infant mortality in CP and Health/WaSH scenario, 2019–2043
- Chart 22: Yield/hectare in CP and Agric scenario, 2019–2043
- Chart 23: Agriculture imports in CP and Agric scenario, 2019–2043
- Chart 24: GDP per capita in the CP and Agric scenario, 2019–2043
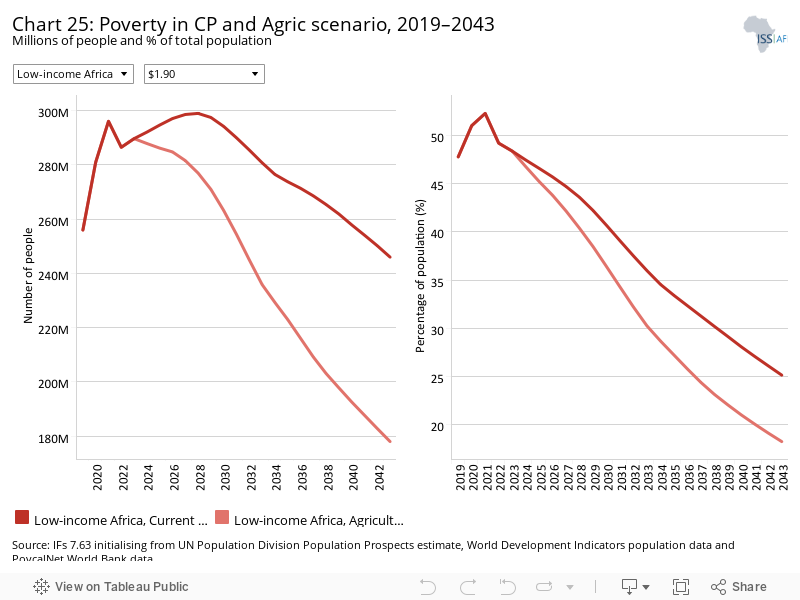
- Chart 25: Poverty in CP and Agric scenario, 2019–2043
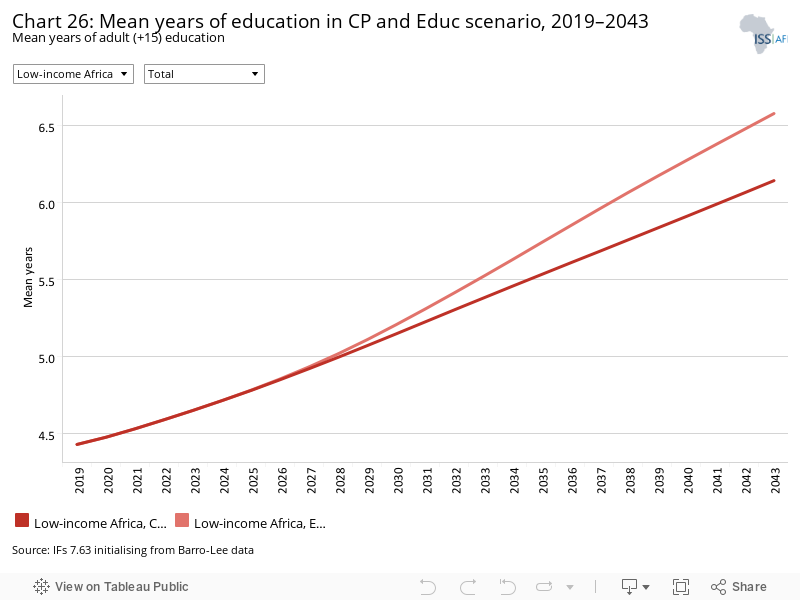
- Chart 26: Mean years of education in CP and Educ scenario, 2019–2043
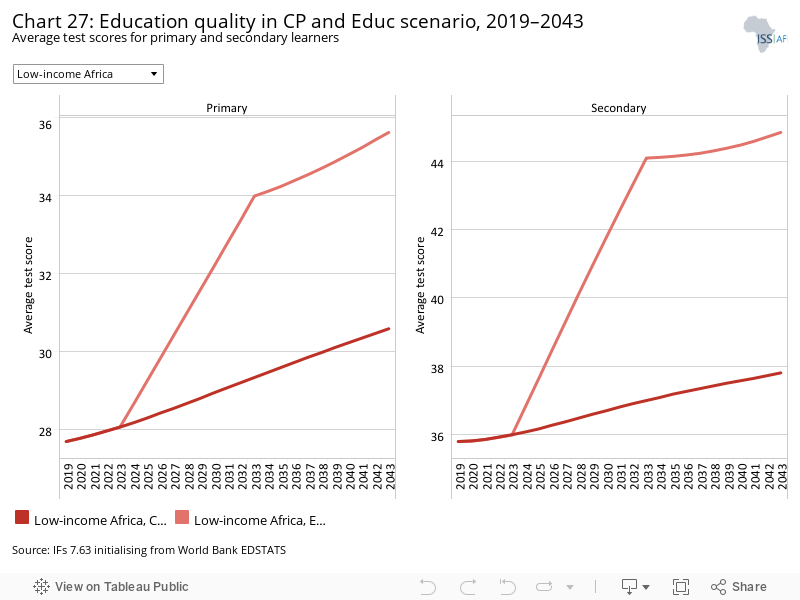
- Chart 27: Education quality in CP and Educ scenario, 2019–2043
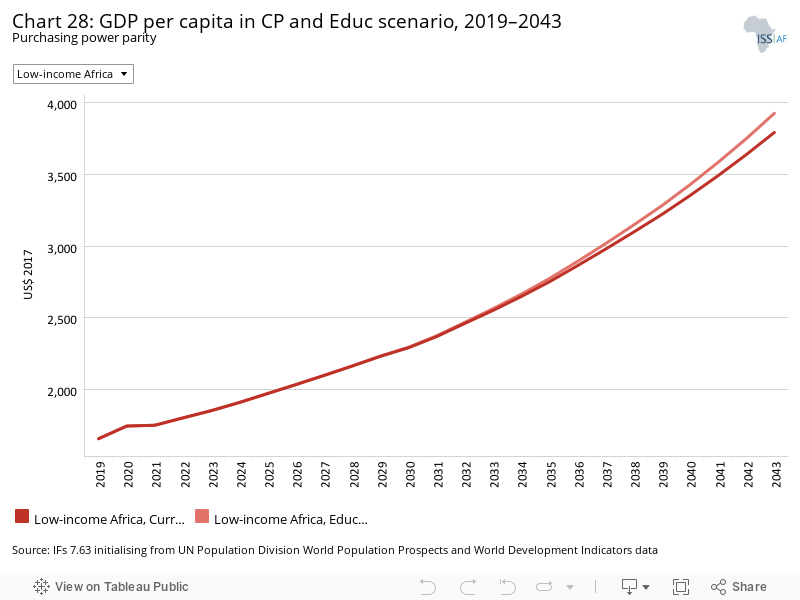
- Chart 28: GDP per capita in CP and Educ scenario, 2019–2043
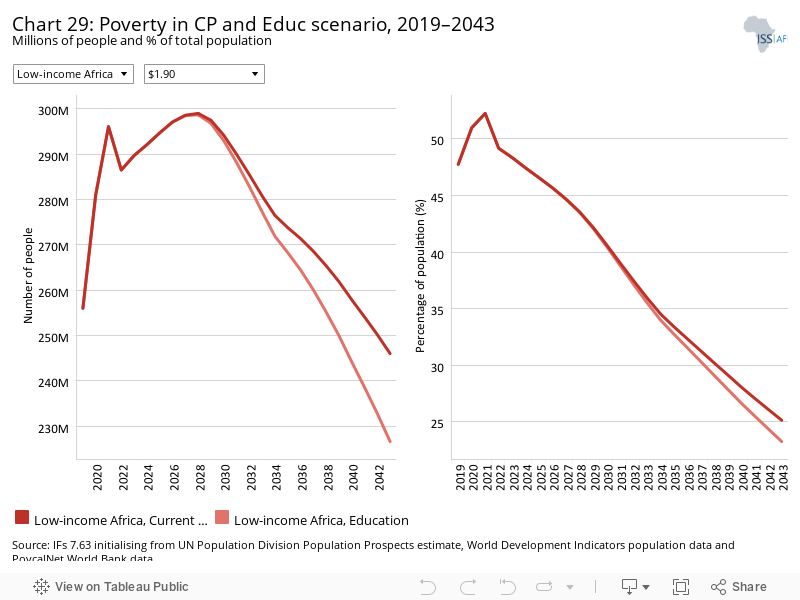
- Chart 29: Poverty in CP and Educ scenario, 2019–2043
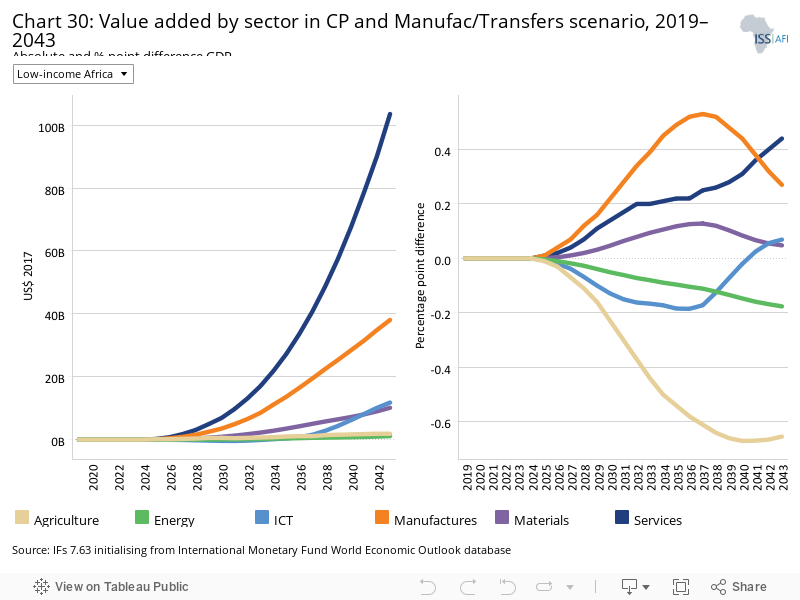
- Chart 30: Value added by sector in CP and Manufac/Transfers scenario, 2019–2043
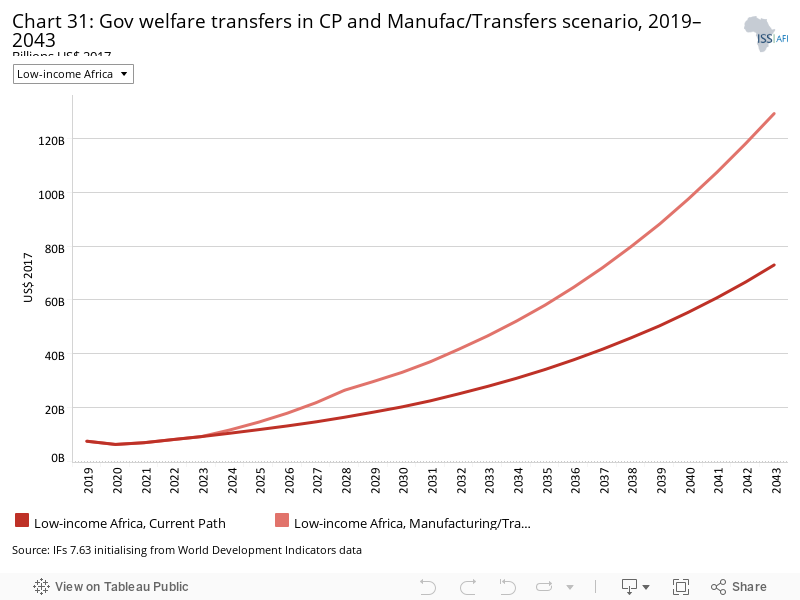
- Chart 31: Gov welfare transfers in CP and Manufac/Transfers scenario, 2019–2043
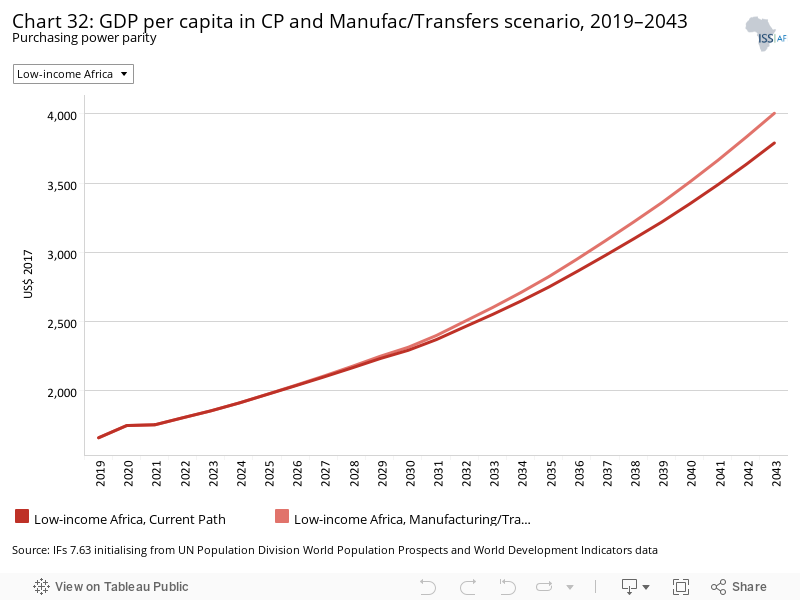
- Chart 32: GDP per capita in CP and Manufac/Transfers scenario, 2019–2043
- Chart 33: Poverty in CP and Manufac/Transfers scenario, 2019–2043
- Chart 34: Fixed broadband access in CP and Leapfrogging scenario, 2019–2043
- Chart 35: Mobile broadband access in CP and Leapfrogging scenario, 2019–2043
- Chart 36: Electricity access in CP and Leapfrogging scenario, 2019–2043
- Chart 37: GDP per capita in CP and Leapfrogging scenario, 2019–2043
- Chart 38: Poverty in CP and Leapfrogging scenario, 2019–2043
- Chart 39: Trade balance in CP and Free Trade scenario, 2019–2043
- Chart 40: GDP per capita in CP and Free Trade scenario, 2019–2043
- Chart 41: Poverty in CP and Free Trade scenario, 2019–2043
- Chart 42: Foreign aid in CP and Financial Flows scenario, 2019–2043
- Chart 43: Inflow of FDI in CP and Financial Flows scenario, 2019–2043
- Chart 44: Remittances in CP and Financial Flows scenario, 2019–2043
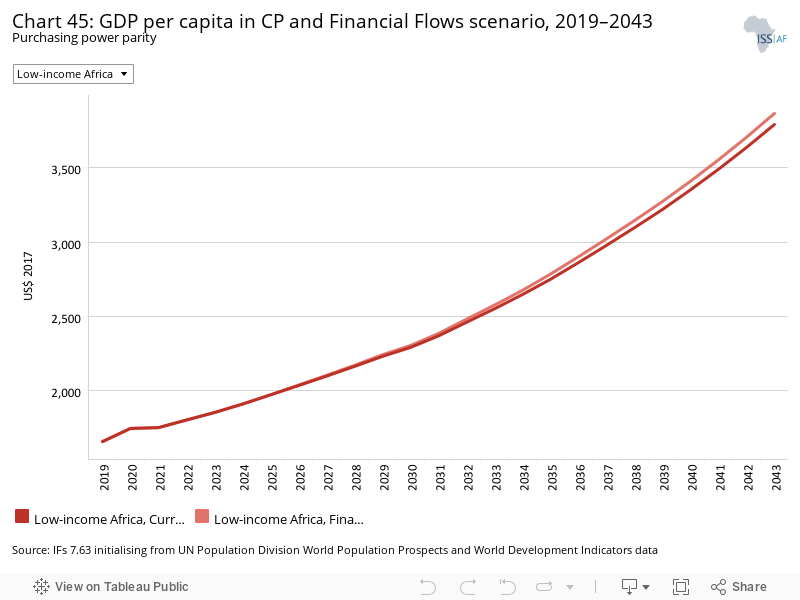
- Chart 45: GDP per capita in CP and Financial Flows scenario, 2019–2043
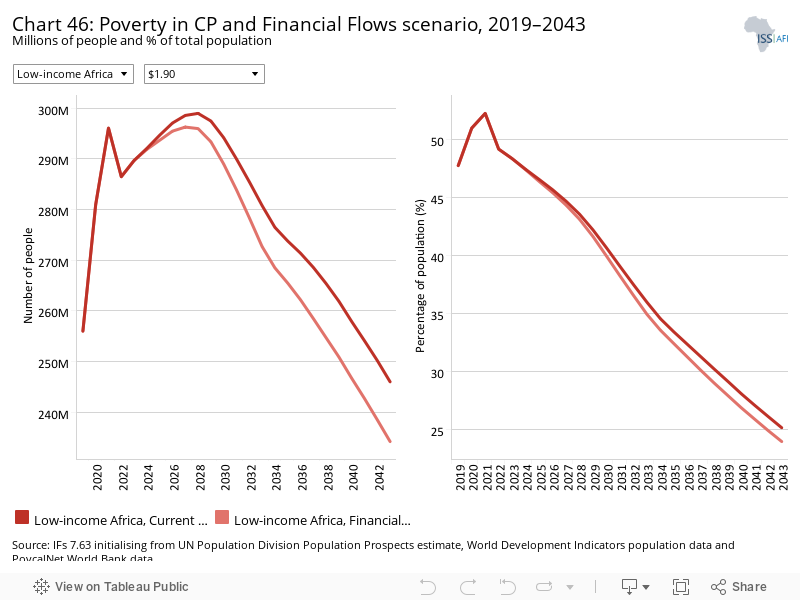
- Chart 46: Poverty in CP and Financial Flows scenario, 2019–2043
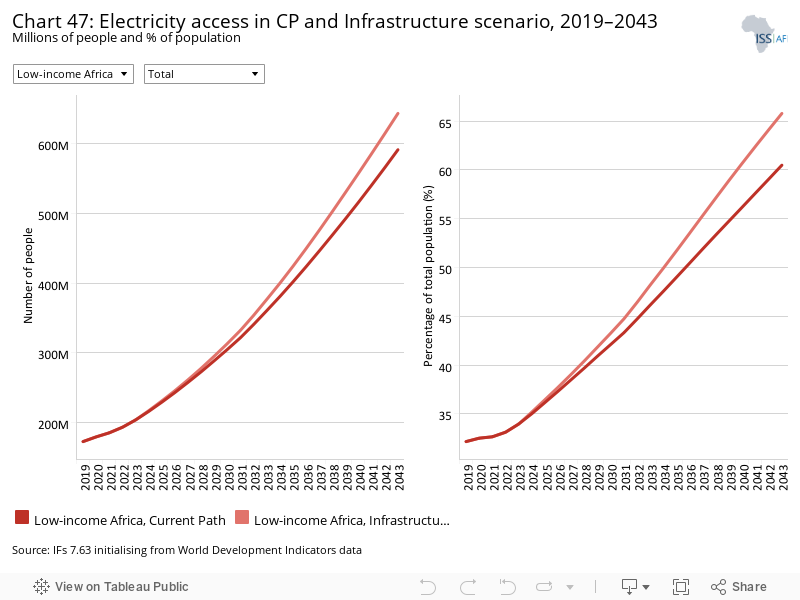
- Chart 47: Electricity access in CP and Infrastructure scenario, 2019–2043
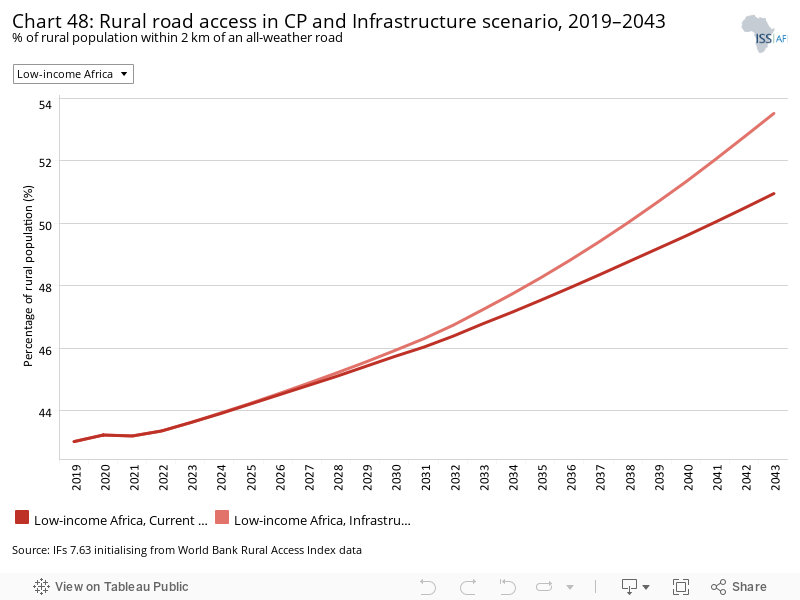
- Chart 48: Rural road access in CP and Infrastructure scenario, 2019–2043
- Chart 49: GDP per capita in CP and Infrastructure scenario, 2019–2043
- Chart 50: Poverty in CP and Infrastructure scenario, 2019–2043
- Chart 51: Gov effectiveness in CP and Governance scenario, 2019–2043
- Chart 52: GDP per capita in CP and Governance scenario, 2019–2043
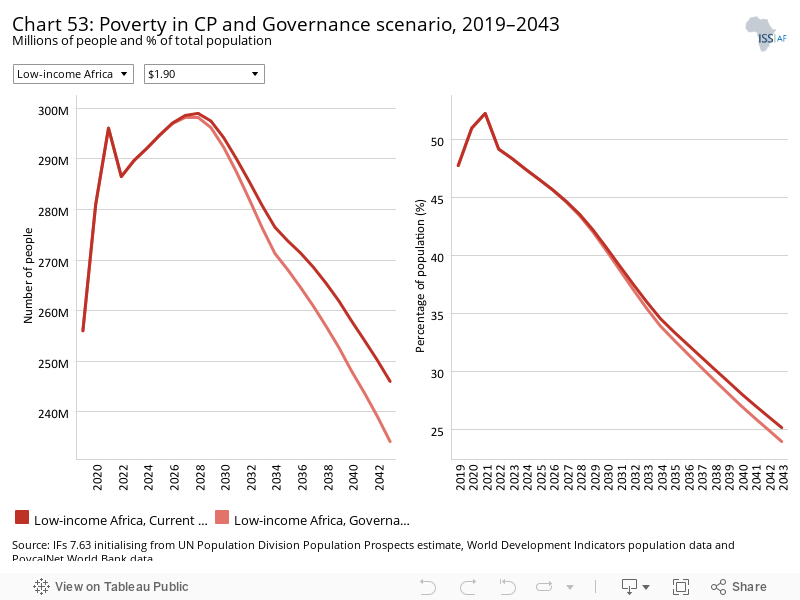
- Chart 53: Poverty in CP and Governance scenario, 2019–2043
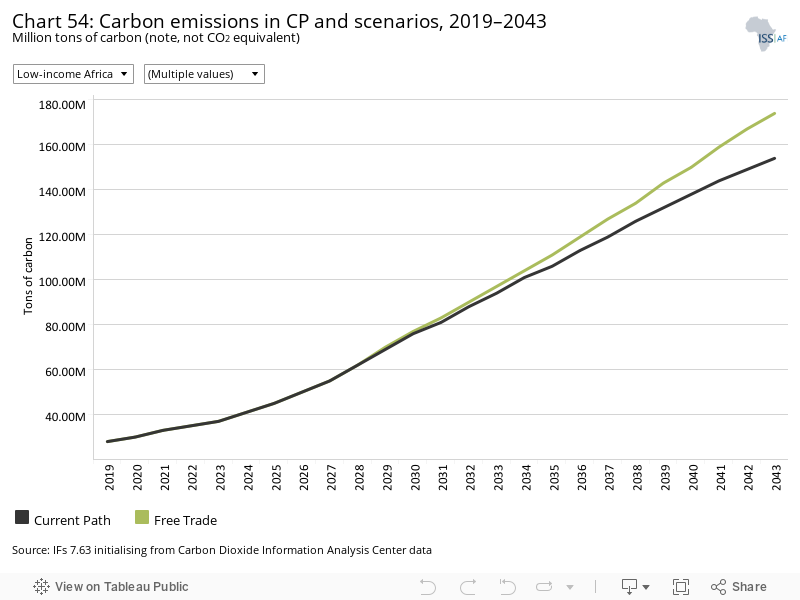
- Chart 54: Carbon emissions in CP and scenarios, 2019–2043
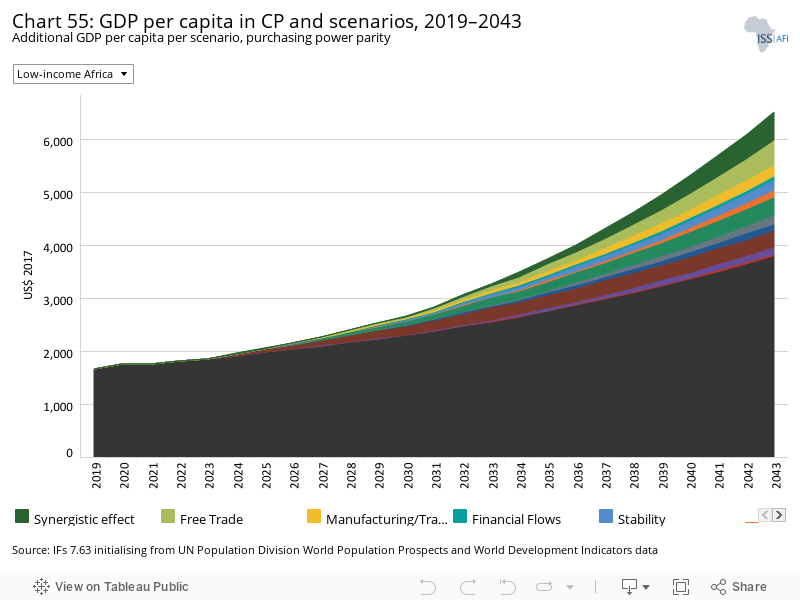
- Chart 55: GDP per capita in CP and scenarios, 2019–2043
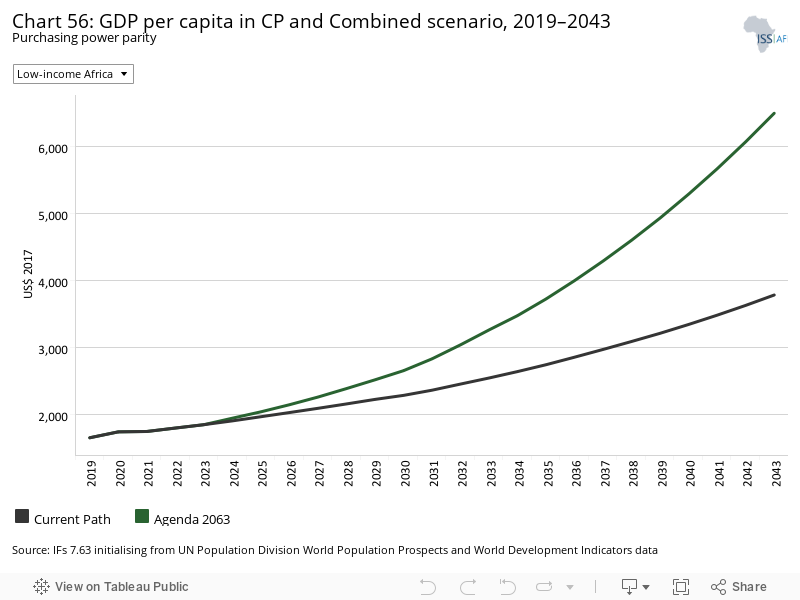
- Chart 56: GDP per capita in CP and Combined scenario, 2019–2043
- Chart 57: Poverty in CP and Combined scenario, 2019–2043
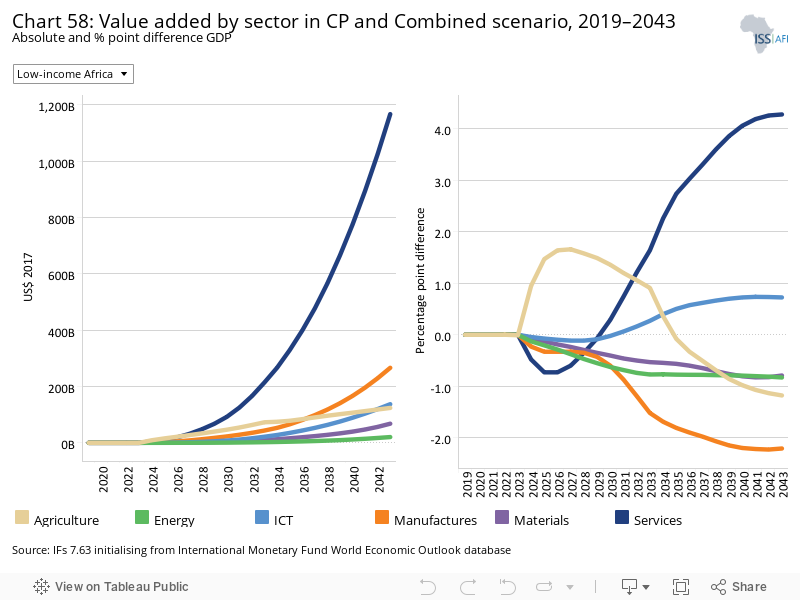
- Chart 58: Value added by sector in CP and Combined scenario, 2019–2043
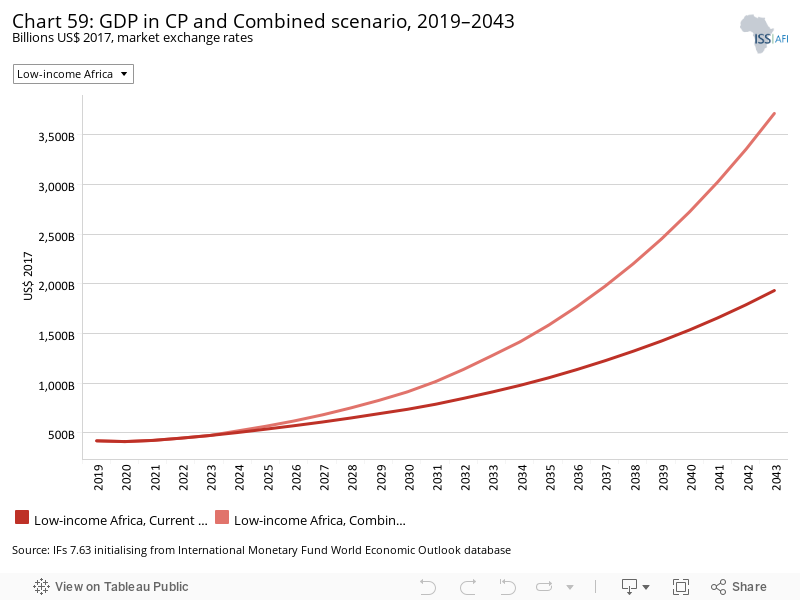
- Chart 59: GDP in CP and Combined scenario, 2019–2043
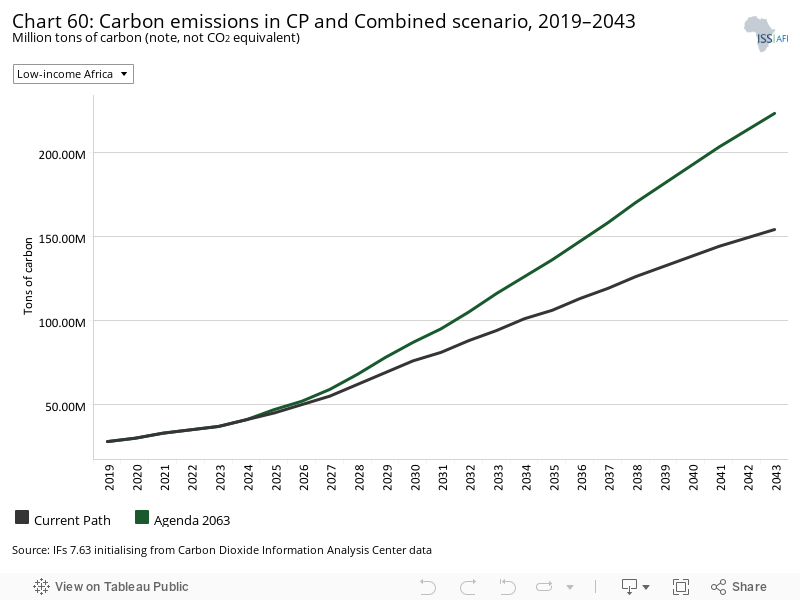
- Chart 60: Carbon emissions in CP and Combined scenario, 2019–2043
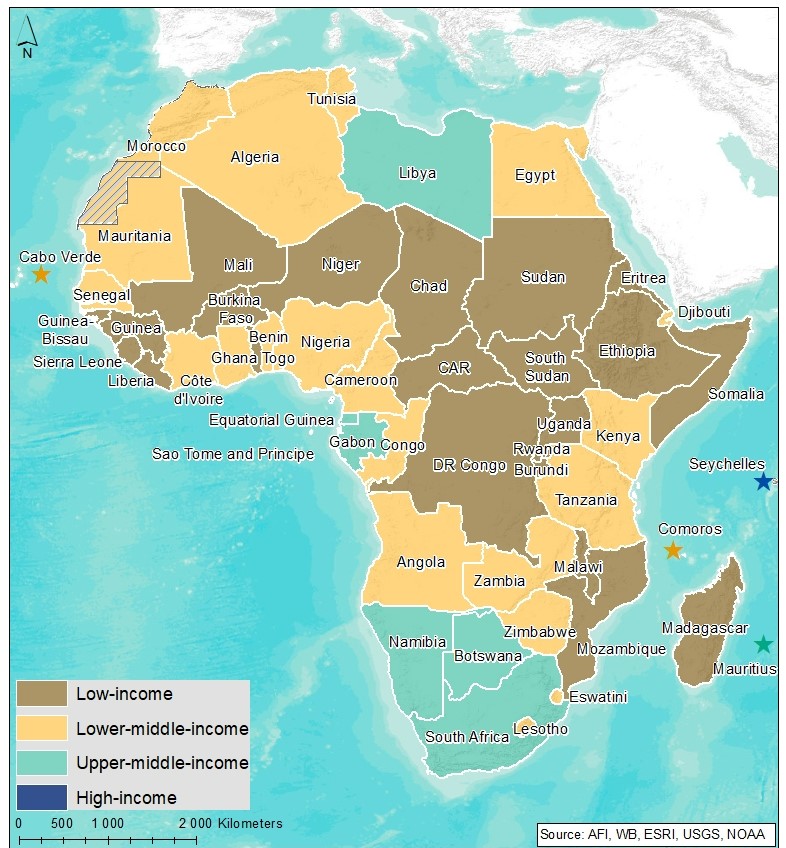
This page provides an overview of the key characteristics of low-income Africa along its likely (or Current Path) development trajectory. The Current Path forecast from the International Futures forecasting (IFs) platform is a dynamic scenario that imitates the continuation of current policies and environmental conditions. The Current Path is therefore in congruence with historical patterns and produces a series of dynamic forecasts endogenised in relationships across crucial global systems. We use 2019 as a standard reference year and the forecasts generally extend to 2043 to coincide with the end of the third ten-year implementation plan of the African Union’s Agenda 2063 long-term development vision.
Low-income Africa has 23 member states: Burkina Faso, Burundi, Central African Republic (CAR), Chad, the Democratic Republic of the Congo (DR Congo), Eritrea, Ethiopia, The Gambia, Guinea, Guinea Bissau, Liberia, Madagascar, Malawi, Mali, Mozambique, Niger, Rwanda, Sierra Leone, Somalia, Sudan, South Sudan, Togo and Uganda. Membership is based on the World Bank classification of income below US$1 046 based on 2021 gross national income (GNI) per capita. Membership is not static and is reviewed annually.
Membership cuts across all regions of Africa with eight members from East and Horn of Africa, eight from West Africa, four from Central Africa, and three Southern Africa. Similarly, the low-income Africa grouping has members in seven of the eight African Union (AU)recognised regional economic communities (RECs) — with the Arab Maghreb Union being the exception — amid pronounced country to country differences. Some of the countries are members of more than one AU recognised REC in Africa.
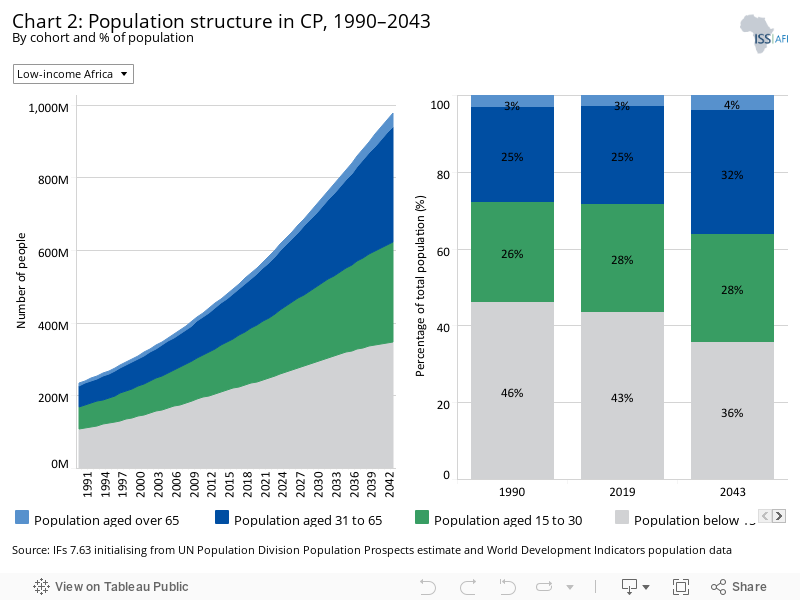
The population of low-income Africa stood at 234.2 million in 1990, and by 2019 the population had more than doubled to 537.9 million people. In the Current Path forecast, the population will reach almost a billion people (977 million) by 2043. This is reflective of the 2.8% population growth rate in 2019, which only declines to 2% by 2043. Ethiopia is the most populous member state with 112 million people in 2019, followed by the DR Congo (87 million people) and Uganda (43.8 million). The least populous countries are The Gambia (2.4 million) and Guinea Bissau (1.9 million).
Low-income Africa has an exceptionally young population with 50% of its adult population in the age group 15 to 29 years of age in 2019, typically considered as constituting its youth bulge. Even by 2043, 44% of its adult population will still be in this bulge, implying considerable momentum towards social turbulence if there is not rapid expansion of services and opportunities.
The population structure will gradually become older as the median age for the group increases from 16.8 in 1990 and 17.9 in 2019 to 22 years in 2043. At the individual country level, the median age within the group ranges from 20 in Rwanda to 15 in Niger.
As a result, the under-15 years cohort will decline from 43% in 2019 to 36% in 2043, while the 65 years and older cohort increases marginally from just 3% in 2019 to 4% in 2043. With only 53% of its population in the general working-age bracket (15 to 64 years of age) in 2019, low-income Africa will only benefit from a demographic dividend in 2050 when the ratio of working-age persons to dependants exceeds 1.7:1.
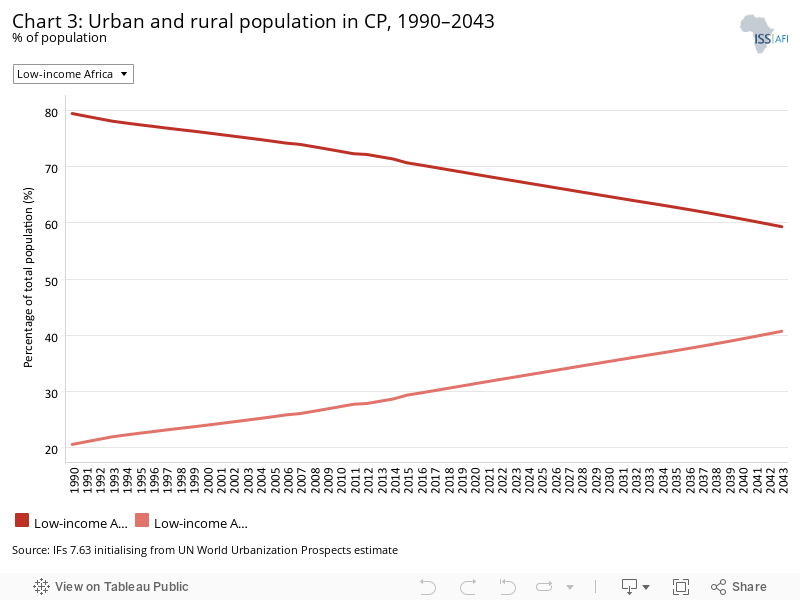
Low-income Africa is still mainly rural (average of 69.1% in 2019) but rates differ enormously between member states. In 2019, nine out of 23 group members (Burkina Faso, Burundi, Chad, South Sudan, Uganda, Ethiopia, Malawi, Niger and Rwanda) had more than 70% of population living in rural areas, and only two countries (The Gambia and Liberia) had less than 50% rural population. On average, the group will remain predominantly rural even by 2043, with only 41% of the population (398.2 million people) living in urban areas.
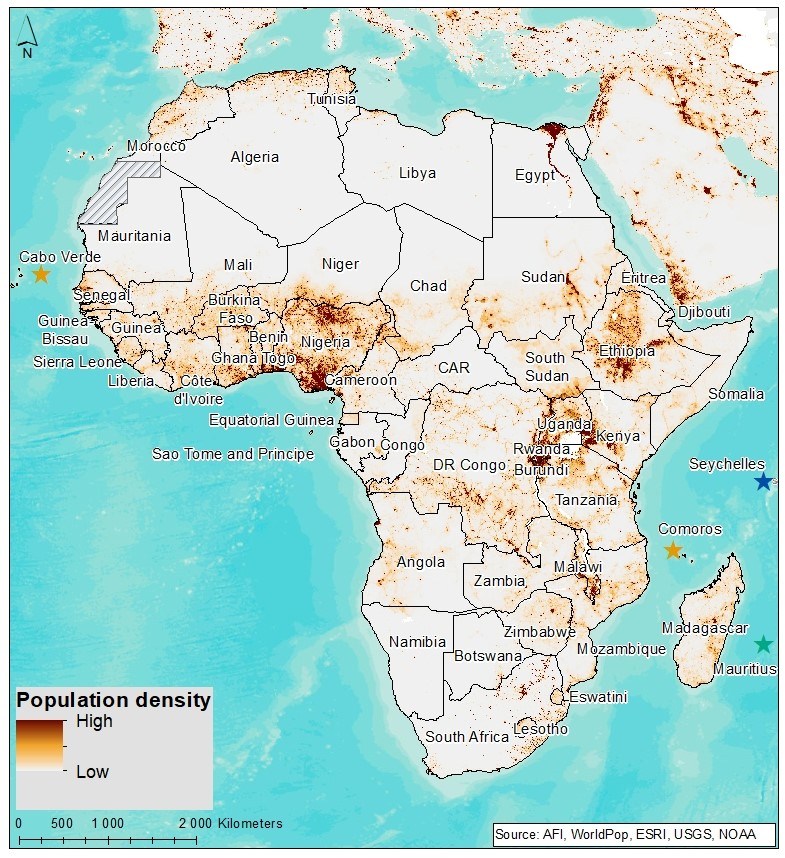
Low-income Africa has a significantly lower average population density than low middle-income Africa with large differences between countries. Rwanda and Burundi were the most densely populated countries within low-income Africa in 2019 with 5.1 and 4.3 persons per hectare, respectively, followed by The Gambia with 2.3 persons per hectare. In 2019, the CAR had the lowest density. Of the 23 members, 16 have a density of less than one person per hectare. By 2043, Rwanda will still be the most densely populated country at 8.3 persons per hectare, followed by Burundi at 7.7.
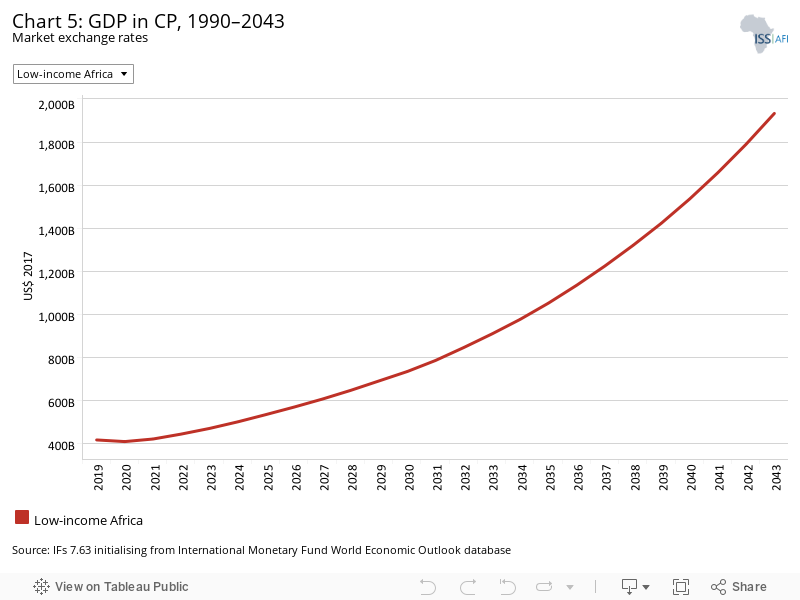
The combined GDP of low-income Africa has more than tripled from US$122.1 billion in 1990 to US$418.6 billion in 2019, and in the Current Path forecast it is set to more than quadruple to US$1 932.6 billion by 2043. In 2019, the largest economies within the group were Sudan (US$72.7 billion) and Ethiopia (US$70.6 billion), whereas The Gambia (US$2.1 billion) and Guinea Bissau (US$1.6 billion) were the smallest. By 2043, Ethiopia will have the largest economy in the group (US$588.6 billion), followed by Uganda (US$249.9 billion).
In 2019, low-income Africa’s share of Africa’s economy was 13.7%, which is set to increase to 22.2% in 2043 largely as a result of the growth of the population. There is a wide range of differences in economic growth rates across the low-income Africa group. In 2019, ten out of the 23 members had an average GDP growth rate of more than 5%, while five countries had less than 3% growth rate in that year, with negative growth rate in Liberia and Sudan. The GDP growth rate ranges from 9.4% in Rwanda to −2.6% in Sudan as it struggles with instability despite it being the largest economy in the group.
The low-income Africa group is dominated by Sudan and Ethiopia, collectively constituting 34.3% the GDP of the group, followed by the DR Congo and Uganda at 10.7% and 10.6%, respectively. Looking to 2043, the share of Ethiopia is set to increase to 30.4% (up from 17% in 2019). The economies of Liberia. Burundi, Eritrea, CAR, The Gambia and Guinea Bissau each constituted less than 1% of total GDP of low-income Africa in 2019.
Although many of the charts in the sectoral scenarios also include GDP per capita, this overview is an essential point of departure for interpreting the general economic outlook of low-income Africa.
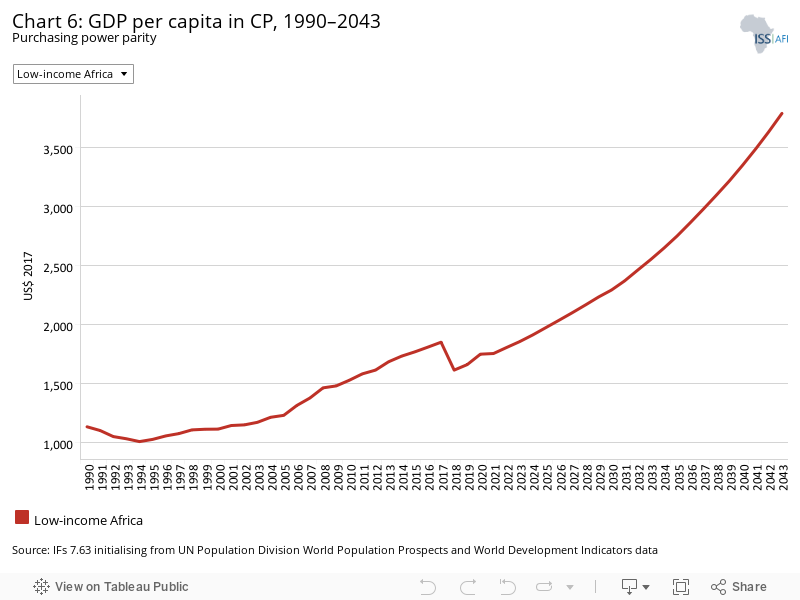
The average GDP per capita for low-income Africa was US$1 660 in 2019, significantly lower than the GDP per capita for an average African country of US$5 289 in that year. Sudan and The Gambia at US$4 298 and US$2 600, respectively, had the highest average income levels in 2019, while Somalia, CAR and Burundi the lowest at less than US$900 in 2019. Though Ethiopia has the second largest economy in the group (at US$70.6 billion), its large population size (112 million people in 2019) and low level of industrialisation (lowest in the group at 9.2% contribution of manufacturing to GDP in 2019) mean that it ranks sixth among the low-income Africa group of countries on GDP per capita, while The Gambia with a small economy (US$2.1 billion) and population (2.4 million) with a higher manufacturing value added as share of GDP ranked second in 2019.
In the Current Path, low-income Africa is set to increase its GDP per capita to US$3 790. Due to high GDP growth in Ethiopia (8.3% in 2019), it will record the second highest per capita GDP of US$5 888 by 2043, second to Sudan at US$5 918, while the economic woes of Burundi (growth rate of 1.8% in 2019) will see it recording the lowest at US$1 297 in 2043.
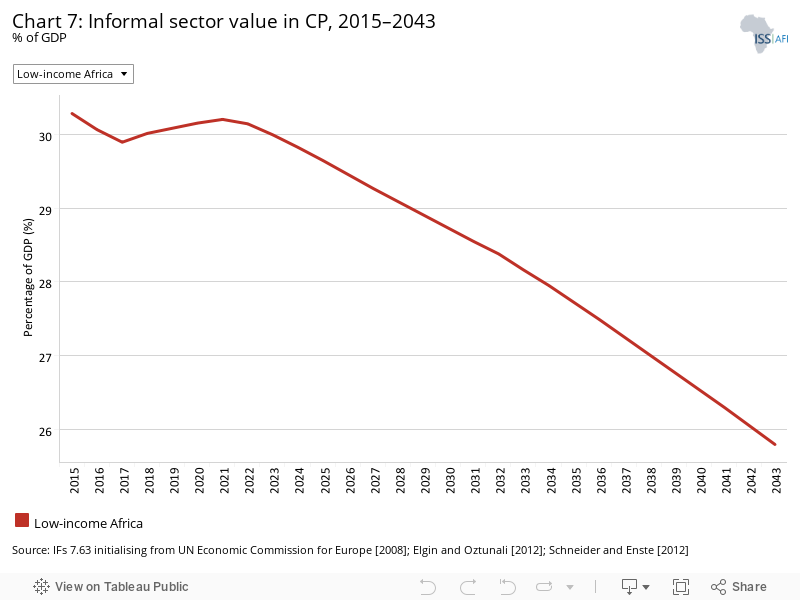
Estimates on the contribution of the informal sector to GDP in 2019 range from 40% in the DR Congo to 14% in Sudan. By 2043, these numbers will have declined to 33.8% and 12.9%, respectively.
At 30.1% (or US$125.9 billion) in 2019, the informal sector in low-income Africa was about five percentage points of GDP larger than the average for Africa, reflecting the extent to which a very large portion of the population depends on this sector. By 2043, the GDP share of the informal sector is set to decline to 25.8%, equivalent to US$598.6 billion.
The informal sector’s share of GDP is largest in the DR Congo (42%) and smallest in Sudan (14%), while the informal labour share of total labour force is largest in Madagascar at 85% and lowest in Sudan at 23.5% in 2019. Ethiopia, which ranks number two in the size of the economy in 2019, has the largest informal sector size within low-income Africa group members with a value of US$20.5 billion in 2019.
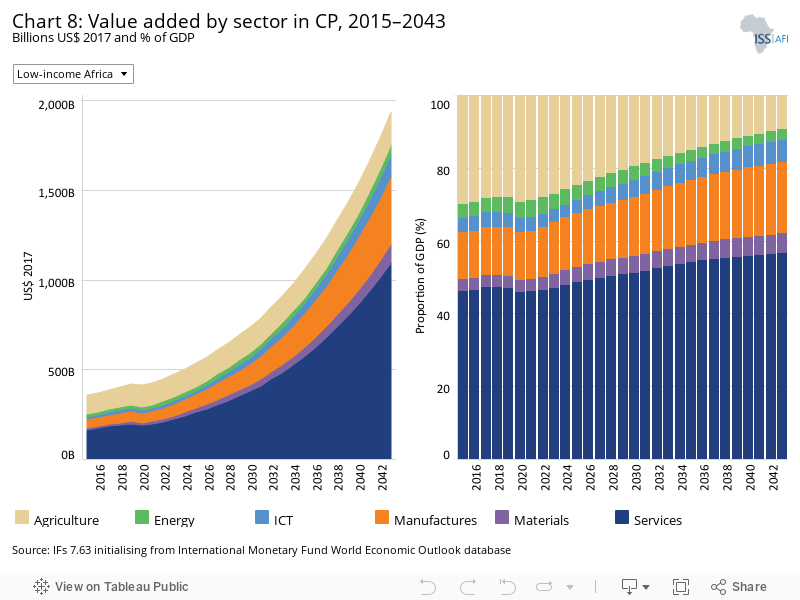
The IFs platform uses data from the Global Trade and Analysis Project (GTAP) to classify economic activity into six sectors: agriculture, energy, materials (including mining), manufacturing, service and information and communication technologies (ICT). Most other sources use a threefold distinction between only agriculture, industry and services with the result that data may differ.
Generally, the service sector dominates in low-income Africa, accounting on average 47%, ranging from 68.8% in Eritrea to 30.7% in the DR Congo. The service sector contributes more than 45% of GDP in 14 of the 23 low-income group members in 2019, and in other countries the value ranges from 42% to 31%. These are, however, generally low-end services, either as part of subsistence agriculture or low-end retail services located in informal urban areas. The contribution of the service sector is set to steadily increase from 47% in 2019 to 57% in 2043, while the contribution of agriculture declines from 28% to 9% during the same period despite its substantial potential. In 2019, agriculture contributed up to 44% of GDP in Chad and least in South Sudan at 10.1%. These numbers will decline to 27.3% and 6.4%, respectively.
In the same vein, the share of the manufacturing sector of GDP in low-income Africa will modestly increase from 13% in 2019 to 19.5% in 2043. In 2019, within group variation shows that the manufacturing share ranges from 21.3% in the DR Congo to just 2.2% in South Sudan — where economic activity is dominated by oil production as energy comprises 54% of GDP in 2019. The contribution of the energy sector, at 4.2% in 2019, is boosted by oil production in South Sudan (54% of GDP in 2019) and is set to decline to an average for the group of 2.9% of GDP by 2043. The ICT sector’s contribution is just next to the materials sector: both sectors are set to increase marginally in 2043. Rwanda, the champion for digitalisation in Africa, has the largest ICT sector in low-income Africa in 2019 at 5.2%, while Ethiopia will have ICT contribute most to GDP in 2043 at 8.4% (US$50 billion). By 2043, CAR will have the smallest ICT sector at 1.8% of GDP.
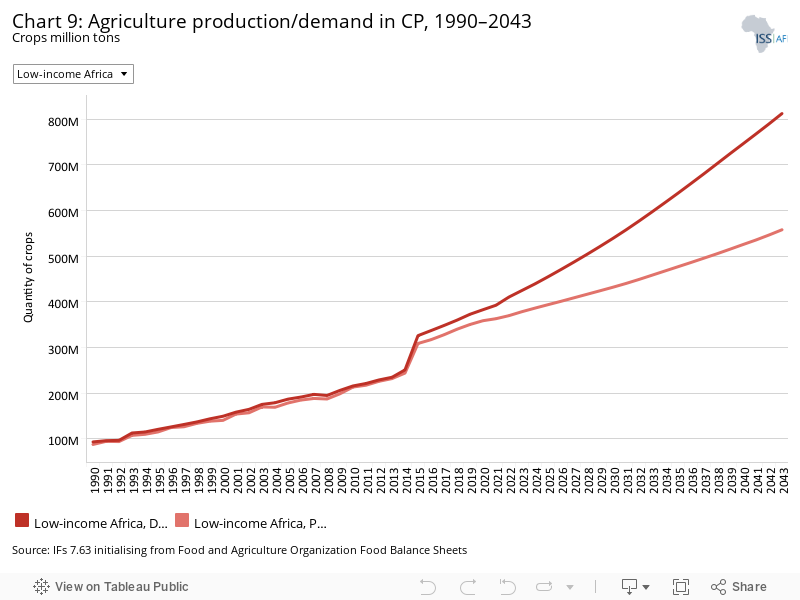
The data on agricultural production and demand in the IFs forecasting platform initialises from data provided on food balances by the Food and Agriculture Organization (FAO). IFs contains data on numerous types of agriculture but aggregates its forecast into crops, meat and fish, presented in million metric tons. Chart 9 shows agricultural production and demand as a total of all three categories.
In 2019, total agricultural demand exceeded production by 22.4 million metric tons — a gap that is expected to increase to 254.7 million metric tons by 2043. The low-income Africa region is, therefore, becoming increasingly food insecure, not only because of poor domestic production but also because of changes in dietary preferences.
In 2019, Ethiopia produced the most food in low-income Africa at 57.1 million metric tons, followed by the DR Congo and Uganda at 51.5 million metric tons and 32.7 million metric tons, respectively. Guinea Bissau and The Gambia were the smallest agricultural producers in the low-income Africa group. By 2043, Ethiopia will have increased its agricultural production by more than 100% to 121.4 million metric tons, and The Gambia, the smallest producer, will increase production to 1.1 million metric tons from 662 000 metric tons.
Crop production comprised more than 90% of total agricultural production in low-income Africa in 2019, and by 2033 this will decline to below 90% such that in 2043 crop production will amount to 82.7% of total agricultural production.
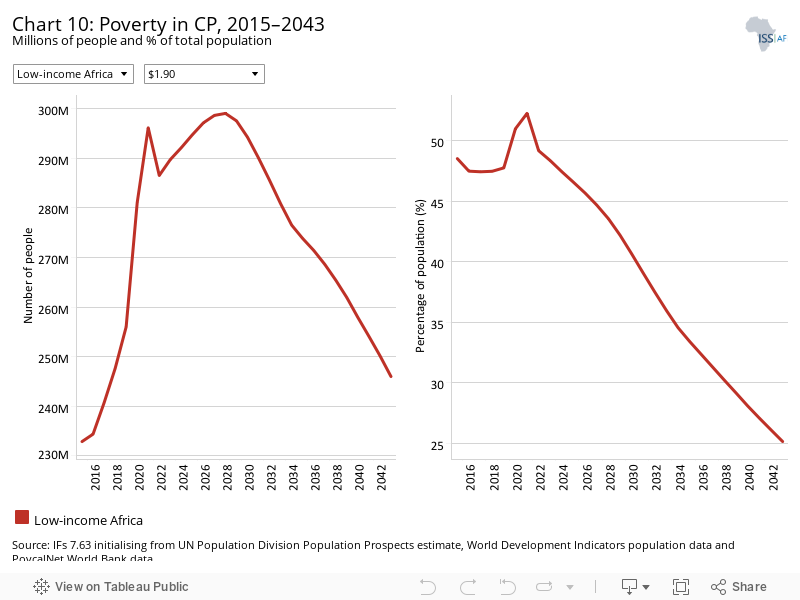
There are numerous methodologies for and approaches to defining poverty. We measure income poverty and use GDP per capita as a proxy. In 2015, the World Bank adopted the measure of US$1.90 per person per day (in 2011 international prices), also used to measure progress towards the achievement of Sustainable Development Goal (SDG) 1 of eradicating extreme poverty. To account for extreme poverty in richer countries occurring at slightly higher levels of income than in poor countries, the World Bank introduced three additional poverty lines in 2017:
- US$3.20 for lower middle-income countries
- US$5.50 for upper middle-income countries
- US$22.70 for high-income countries.
In spite of its high rates of economic growth, the number of extremely poor people (using US$1.90) in low-income Africa will only modestly decline from 256 million in 2019 to 243 million (25.2%) in 2043. During this period, poverty will increase until 2028 before starting to decline. By 2043, the extreme poverty rate will reduce to 25.2%, compared to 47.8%. While Ethiopia will do well in reducing the number of extremely poor people from 33 million in 2019 to just 5.9 million in 2043, the DR Congo will increase its population of extremely poor people from 62.8 million in 2019 to 81.9 million in 2043, although with a modest decline in the percentage of extremely poor people.
Whereas in 2019, nine out of the 23 low-income African countries had a poverty rate of >60%, by 2043, except for CAR and Madagascar, all low-income Africa countries will experience a poverty rate of below 60%. The decline in poverty in low-income Africa will be supported by strong economic growth with an average economic growth rate of 8% in 2043.
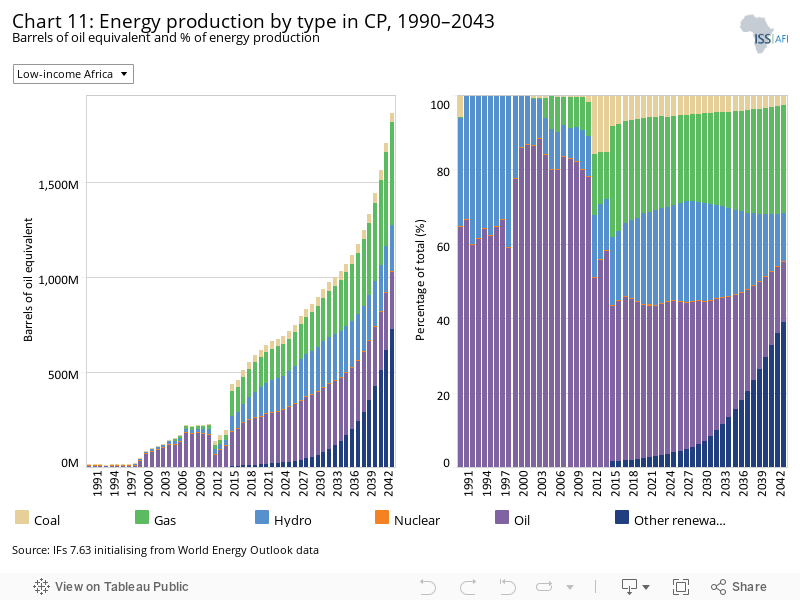
The IFs platform forecasts six types of energy, namely oil, gas, coal, hydro, nuclear and other renewables. To allow comparisons between different types of energy, the data is converted into billion barrels of oil equivalent (BBOE). The energy contained in a barrel of oil is approximately 5.8 million British thermal units (MBTUs) or 1 700 kilowatt-hours (kWh) of energy.
Ethiopia, South Sudan and Sudan produce significantly more energy among the low-income Africa member states. In South Sudan and Sudan this is mostly oil and in Ethiopia hydro. Uganda and Madagascar are the biggest gas producers with more than 60 million BOE in 2019.
Hydro energy production is strongest in Ethiopia, as it is now also leveraging the river Nile, and the DR Congo, with hydro accounting for one-fifth of energy production in low-income Africa. In 2019, oil and gas comprised 68.7% of total energy production. Ethiopia leads in the production of hydro and other renewable sources of energy at 104 million and 3 million BOE in 2019, respectively.
In the 2043 Current Path forecast, other renewables will dominate energy production in low-income Africa, accounting for 44%, followed by gas at 29%. The region will produce more renewable energy (729 million BOE) than gas (543 million BOE) or oil (300 million BOE). Ethiopia will be the powerhouse of other renewable energy production, producing 586 million BOE in 2043.
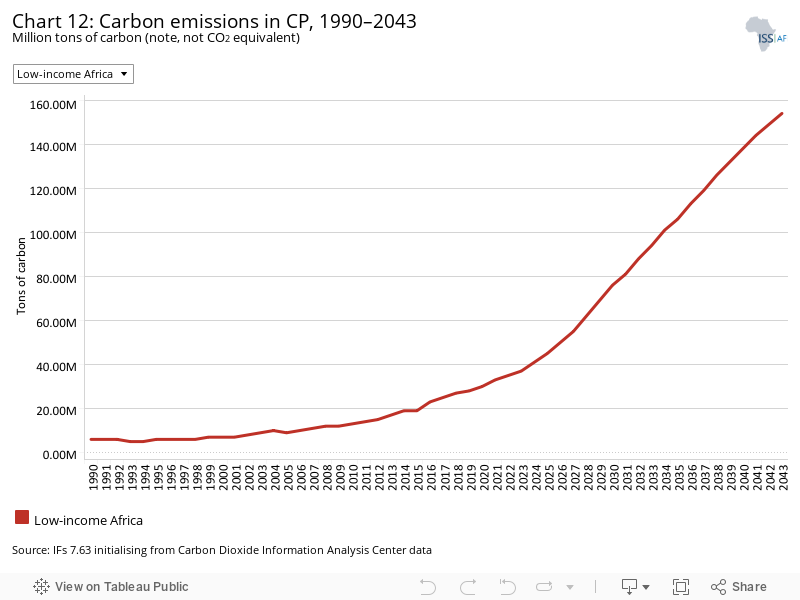
Carbon is released in many ways, but the three most important contributors to greenhouse gases are carbon dioxide (CO2), carbon monoxide (CO) and methane (CH4). Since each has a different molecular weight, IFs uses carbon. Many other sites and calculations use CO2 equivalent.
As a group, low-income Africa countries emitted 28 million tons of carbon in 2019 — an amount that will increase by more than fivefold to 154 million tons by 2043. In the process, low-income Africa will increase its portion of African carbon emissions from 6.7% of the African total to 16.4%. Sudan, Mozambique and Uganda are the largest emitters, contributing 42% of total emissions in 2019.
In the Current Path forecast, the top three emitters will still contribute 38.3% of all carbon emissions in 2043 with Uganda poised to contribute most.
Sectoral Scenarios for Low-income Africa
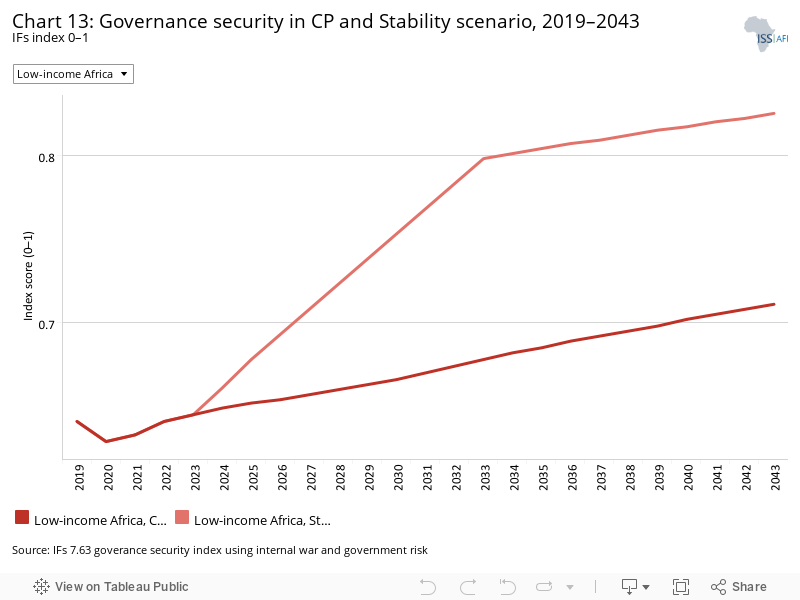
Download to pdfThe Stability scenario represents reasonable but ambitious reductions in risk of regime instability and lower levels of internal conflict. Stability is generally a prerequisite for other aspects of development and this would encourage inflows of foreign direct investment (FDI) and improve business confidence. Better governance through the accountability that follows substantive democracy is modelled separately.
The intervention is explained here in the thematic part of the website.
Poor countries are, almost inevitably, less stable. Using the governance security index within IFs, low-income Africa at 0.64 was below the average for Africa which was 0.74 in 2019. The low-income Africa Current Path forecast will see a modest improvement in governance security between 2019 and 2043. In 2019, Rwanda and The Gambia scored the highest in the governance security index in the group of 0.73 and 0.72, respectively, while Somalia had the lowest at 0.50. Rwanda has enjoyed a long period of stability after the genocide ended in 1994, while The Gambia’s newfound democracy has brought with it some level of governance security. In the Stability scenario, group members will improve the 2043 Current Path forecast by an amount ranging from 0.32 in Somalia — a large increase due to its low base — to 0.19. Coming from their turbulent history, the DR Congo, South Sudan and Sudan will each see at least 0.29 improvement in their 2043 Current Path forecast of governance security in the Stability scenario.
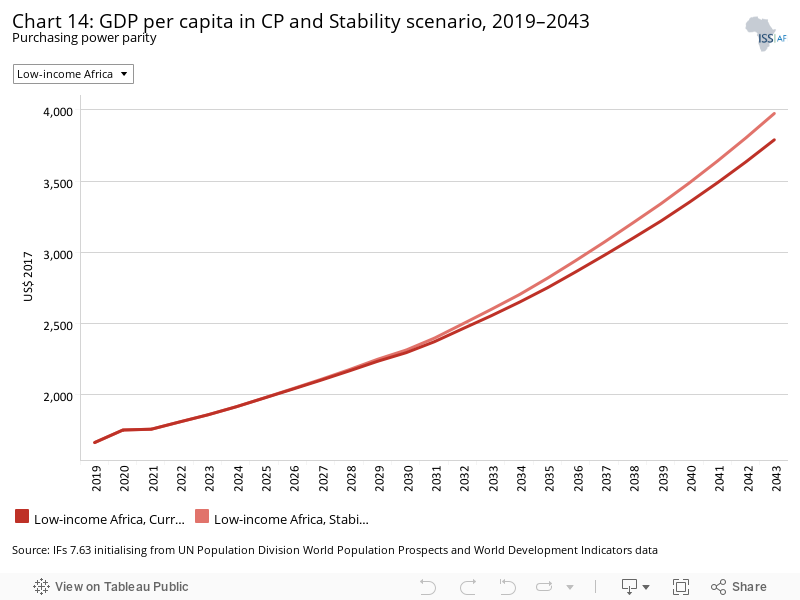
Stability is a general catalyst for other aspects of development. The Stability scenario increases GDP per capita by US$504 in 2043 compared to the Current Path forecast. The increase ranges from US$568 in Guinea (the most improvement), US$529 in Sudan and US$510 in Malawi, to US$108 in Burundi (least improvement).
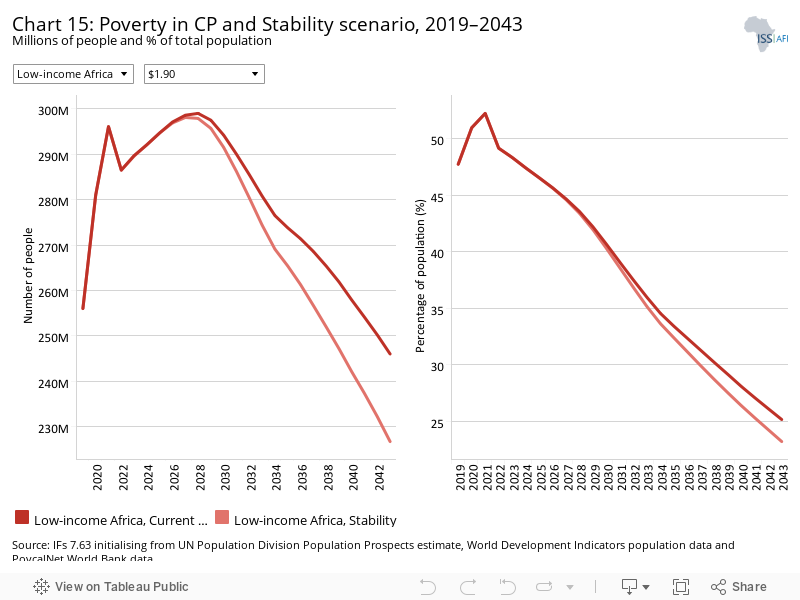
By 2030, the Stability scenario will reduce the number of extremely poor people in low-income Africa by 19.3 million people in 2043, compared to the Current Path forecast (using US$1.90). The largest gains are made in the DR Congo which will see a reduction of 7.4 million extremely poor people (5.5 percentage points) in 2043, while The Gambia will see the smallest reduction of 22 000 people, at which point it will effectively have eliminated extreme poverty
Instead of an extreme poverty rate (using US$1.90) of 25.2% in 2043, the 2043 extreme poverty rate for low-income Africa will be 23.2% in the Stability scenario.
This section presents the impact of a Demographic scenario that aims to hasten and increase the demographic dividend through reasonable but ambitious reductions in the communicable-disease burden for children under five, the maternal mortality ratio and increased access to modern contraception.
The intervention is explained here in the thematic part of the website.
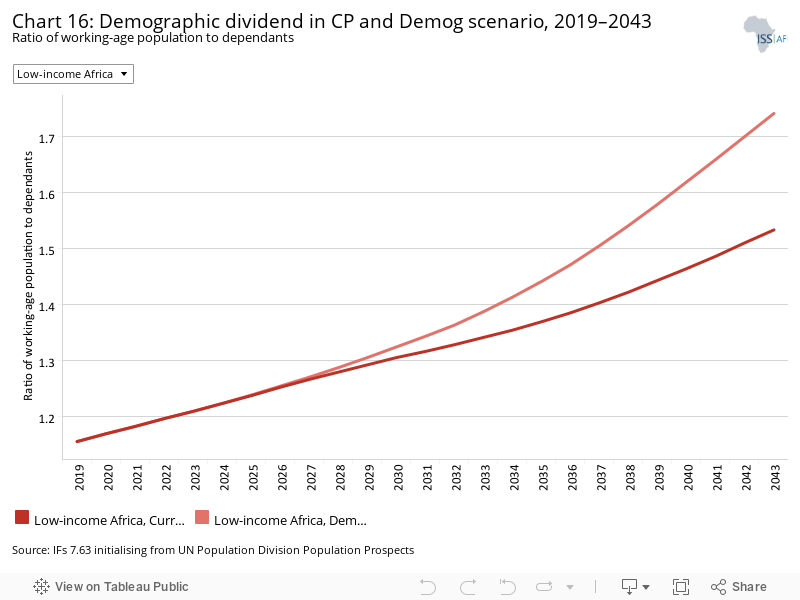
Demographers typically differentiate between a first, second and even a third demographic dividend. We focus here on the contribution of the size of the labour force (between 15 and 64 years of age) relative to dependants (children and the elderly) as part of the first dividend. A window of opportunity opens when the ratio of the working-age population to dependants is equal to or surpasses 1.7.
In 2019, the ratio of working-age persons to dependants for low-income Africa was 1.15:1, and in the Current Path forecast, low-income Africa enters the demographic dividend in 2050, halfway into the century, given its large population momentum and its high fertility rates. In the Demographic scenario, low-income Africa gets to a ratio of 1.7 working-age persons to every dependant in 2042.
Rwanda (in 2037) and Malawi (in 2042) are the only countries set to enjoy a demographic dividend in the Current Path before 2043. Compared to the Current Path forecast, Rwanda (an improvement of 0.49 in the ratio of working-age persons to dependants) and Ethiopia (an improvement of 0.39) will see the largest improvement in unlocking a potential dividend within the group, while Chad will see the least improvement in demographic dividend in 2043.
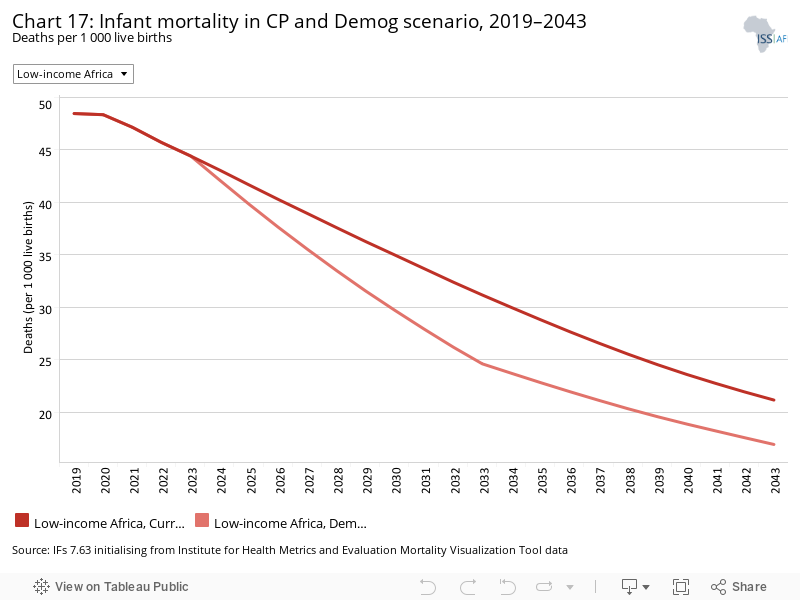
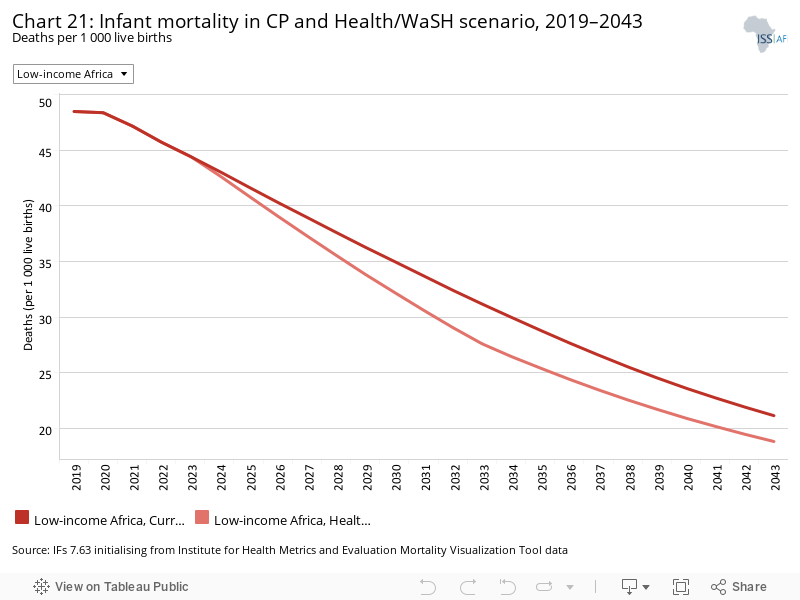
The infant mortality rate is the number of infant deaths per 1 000 live births and is an important marker of the overall quality of the health system in a country.
The average infant mortality rate for the group in 2019 was 48.5 deaths per 1 000 live births, set to decline to 21.2 in 2043. The average for Africa in 2043 will be 25.6. In 2019, infant mortality ranged from 81 deaths per 1 000 live births in CAR to 30 in The Gambia.
In the Demographic scenario, the infant mortality rate in low-income Africa rate declines to 16.9 in 2043, with South Sudan experiencing the largest decrease, with 10.1 fewer deaths per 1 000 live births in 2043 compared to the Current Path forecast.
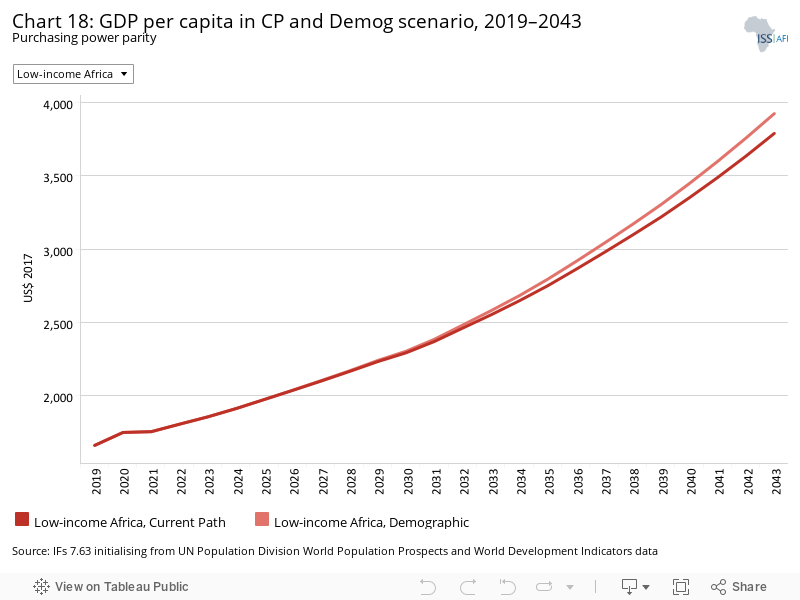
By 2043, the Demographic scenario will increase average GDP per capita by US$155 compared to the Current Path forecast. Malawi and Ethiopia will benefit the most from the Demographic scenario by 2043 (at US$290 and US$305, respectively, compared to the Current Path forecast) with Rwanda following with an improvement of US$280. Chad and South Sudan will see the least improvements in GDP per capita of US$38 and US$36 by 2043, compared to the Current Path forecast.
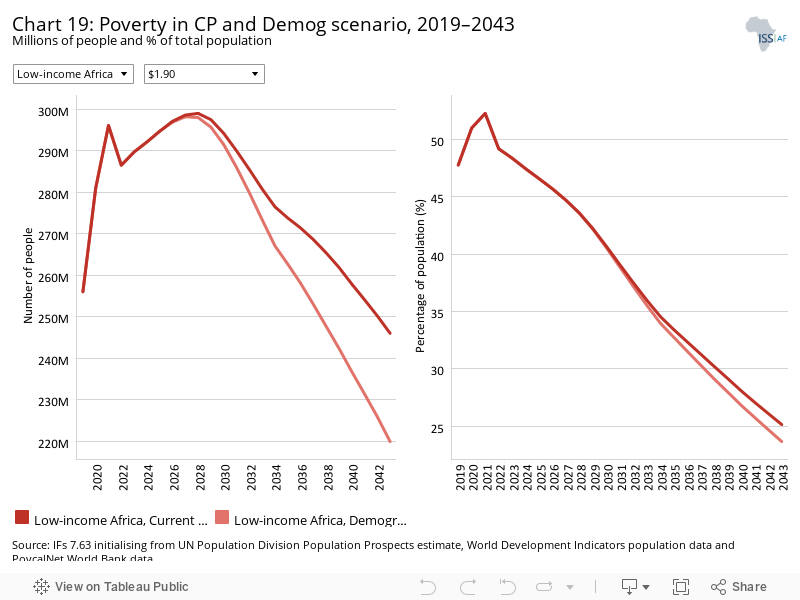
Compared to the Current Path forecast, the Demographic scenario would reduce extreme poverty in low-income Africa by 26 million people (1.5 percentage points) in using US$1.90. In 2043, Madagascar will see the largest percentage point decrease in extreme poverty rate of 5.4 points, followed by Liberia of 2.9 when compared to the Current Path forecast. Compared to the Current Path forecast, the Demographic scenario will lift 8.2 and 4.5 million more people out of extreme poverty in 2043 in the DR Congo and Madagascar.
This section presents reasonable but ambitious improvements in the Health/WaSH scenario, which include reductions in the mortality rate associated with both communicable diseases (e.g. AIDS, diarrhoea, malaria and respiratory infections) and non-communicable diseases (NCDs) (e.g. diabetes), as well as improvements in access to safe water and better sanitation. The acronym WaSH stands for water, sanitation and hygiene.
The intervention is explained here in the thematic part of the website.
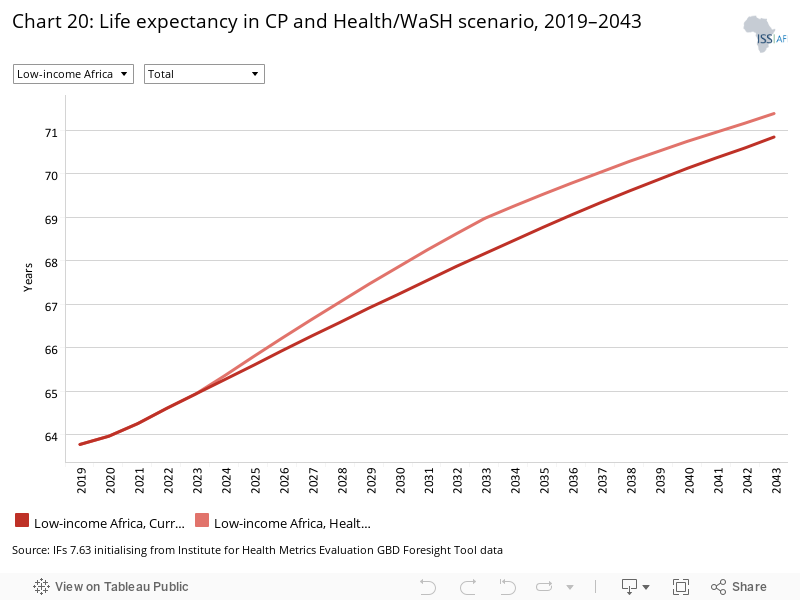
Life expectancy among low-income Africa member states ranged from 69.1 years in Rwanda in 2019 to 51.2 years in CAR. In 2019, average life expectancy was 63.8 years and in the Current Path forecast it will increase to 70.9 years in 2043. The Health/WaSH scenario results in a marginal life expectancy increase above the Current Path forecast of less than one year. South Sudan, with life expectancy of 58.8 years in 2019, experiences the largest increase of 1.3 years and The Gambia the least (0.06 years). Average life expectancy in low-income Africa remains below the average for Africa by less than one year in 2043 in the Health/WaSH scenario.
Rates of infant mortality in low-income Africa in 2019 were at 48.5 deaths per 1 000 live births and would reduce to 21.2 in the Current Path forecast by 2043. In the Health/WaSH scenario, the average by 2043 is 18.9, 2.3 deaths fewer compared to the Current Path forecast. South Sudan experiences the largest decline in infant mortality in the Health/WaSH scenario with 7.2 fewer deaths per 1 000 live births followed by Chad with 5.3.
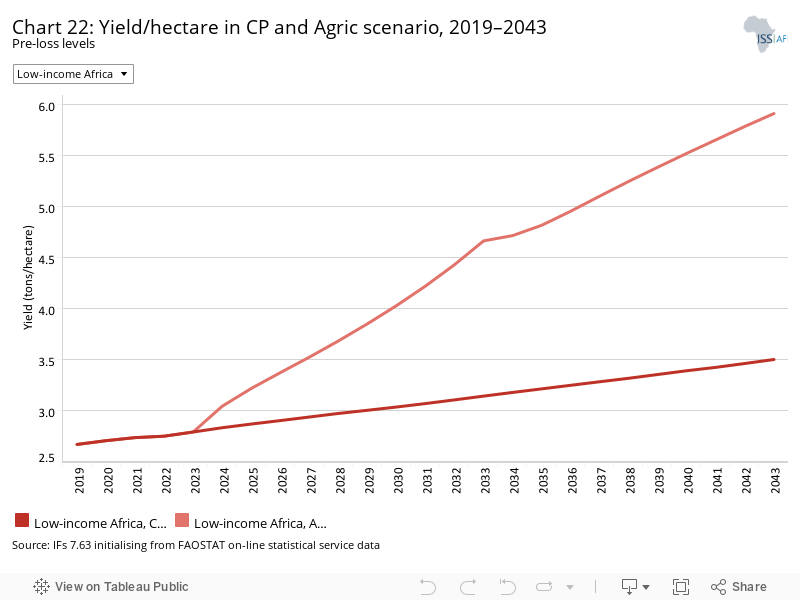
The Agriculture scenario represents reasonable but ambitious increases in yields per hectare (reflecting better management and seed and fertiliser technology), increased land under irrigation and reduced loss and waste. Where appropriate, it includes an increase in calorie consumption, reflecting the prioritisation of food self-sufficiency above food exports as a desirable policy objective.
The intervention is explained here in the thematic part of the website.
The data on yield per hectare (in metric tons) is for crops but does not distinguish between different categories of crops.
In 2019, the average crop yield in low-income Africa was 2.7 metric tons, below the average for Africa of 3.9 tons and low middle-income Africa at 5.1 tons. In the Current Path forecast, low-income Africa will modestly improve yields to 3.5 metric tons by 2043 and to 5.9 tons in the Agriculture scenario — a difference of almost 61%.
Rwanda has the highest pre-loss crop yields per hectare among the low-income Africa members as a result of its rich soils, higher rainfall, the intensity of farming and better utilisation of technology. Yield per hectare for Rwanda increases from 8.2 tons in 2019 to 10.6 tons in 2043 in the Current Path forecast and to 14 tons in the Agriculture scenario. Chad and Niger have the lowest pre-loss crop yields per hectare at 1.2 and 0.8 tons, respectively, in 2019.
Compared to the Current Path forecast, Mozambique will experience the largest improvement (5.5 tons by 2043) in the Agriculture scenario, followed by South Sudan (4.6 tons), Burundi (4.5 tons) and Guinea Bissau (4.1 tons). Somalia and Niger will experience the least improvements of 1.2 tons and 0.87 tons, respectively, in the Agriculture scenario.
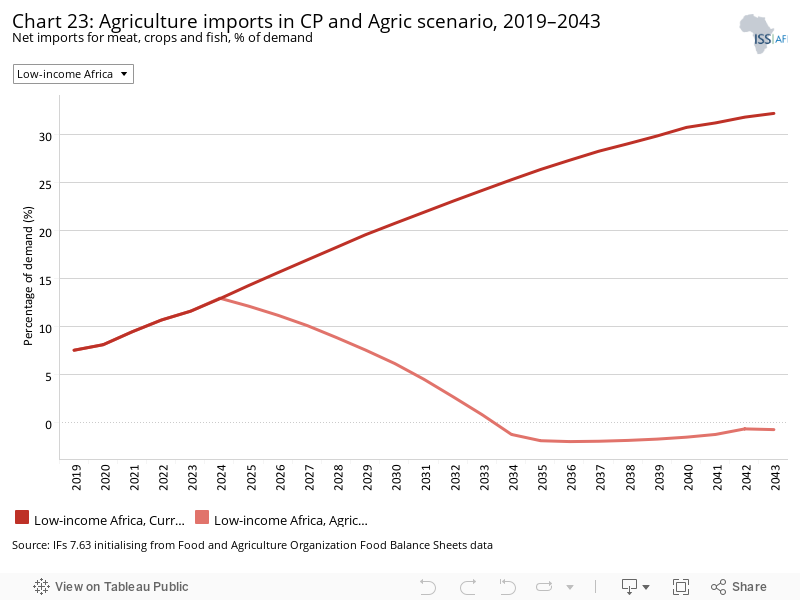
In the Current Path forecast, the contribution of agriculture to the GDP of low-income Africa would decline from 28% in 2019 to 9% in 2043. In the Agriculture scenario, agriculture would still contribute 13.4% to GDP by 2043, and low-income Africa group will produce 325.8 million metric tons more crops by 2043, compared to the Current Path forecast.
In the Agriculture scenario, import dependence in low-income Africa is set to decrease to −0.8% instead of 32.2% in the Current Path forecast, resulting in US$122 million fewer imports than in the Current Path in 2043. Total agricultural export will sky rocket in 2043 in the Agriculture scenario to 84 million metric tons from 6 million metric tons in 2019. Compared to the Current Path forecast, Ethiopia (at 54.7 million metric tons) followed by Mozambique (at 8.1 million metric tons) will see the greatest increments in agricultural exports. CAR, South Sudan and Chad will not experience an increase in exports.
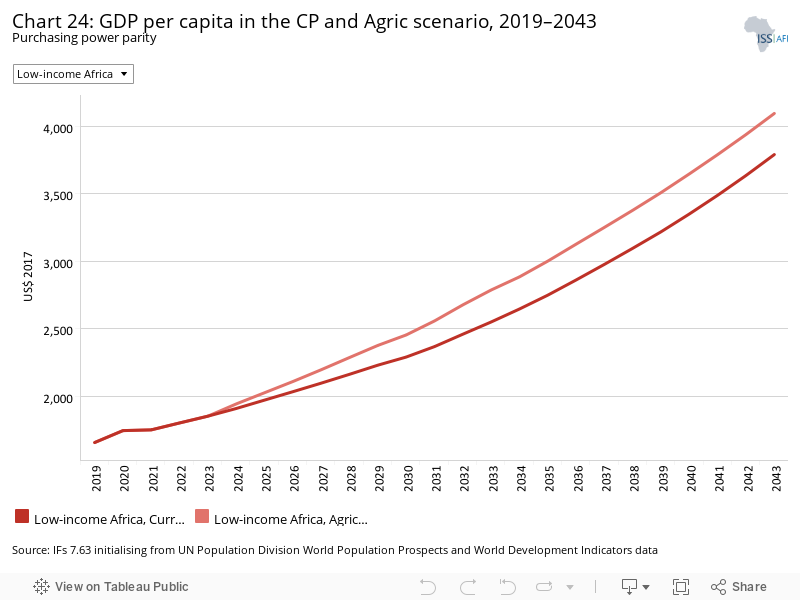
The average improvement in GDP per capita in the Agriculture scenario is US$334 in 2043, compared to the Current Path forecast for that year. Guinea Bissau will benefit the most: its GDP per capita in 2043 will be US$889 larger than in the Current Path forecast for that year, followed by Sudan, Chad and Malawi, while Ethiopia and Somalia will benefit the least.
Agriculture traditionally has a significant effect on extreme poverty. While low-income Africa would still have 246 million people living below US$1.90 in the Current Path in 2043, in the Agriculture scenario the number comes down to 178 million, mainly from the DR Congo and Madagascar. The number of extremely poor people in the DR Congo and Madagascar will decline by 25.9 million and 7.6 million people, respectively, in 2043 Agriculture scenario compared to the Current Path forecast for that year.
Whereas, in 2019, the percentage of people living below US$1.90 per day in low-income Africa was 47.8%, there would be a decline to 25.2% by 2043 in the Current Path forecast and 18.3% in the Agriculture scenario. The impact of the Agriculture scenario is such that it reduces the extreme poverty rate by 16.7 and 14.8 percentage points in Madagascar and the DR Congo, respectively, compared to the Current Path forecast. The least impact of agriculture on poverty will be in Ethiopia and The Gambia.
The Education scenario represents reasonable but ambitious improved intake, transition and graduation rates from primary to tertiary levels and better quality of education. It also models substantive progress towards gender parity at all levels, additional vocational training at secondary school level and increases in the share of science and engineering graduates.
The intervention is explained here in the thematic part of the website.
Education is a key development booster but comes with long lags in impact. In 2019, the adult population of low-income Africa had, on average, 4.4 years of education, set to increase to 6.1 years in 2043. In the Education scenario, the mean years of education of low-income Africa would increase to 6.5 years. While the mean years of male education was 5.1 years in 2019, for females it was 3.8 years — a gap of 1.3 years. In the Education scenario, the gap in mean years of male and female education is forecast to modestly decline to 0.8 years by 2043, as gender inequality improves. Niger will experience the largest increase in education years of 0.7 years and Guinea of 0.6 years.
Education quality is as important, if not more important, than access to education. In 2019, the average test score for primary learners was 27.7, set to increase to 30.6 in 2043. The Education scenario will increase average primary test scores to 35.6.
Secondary education quality in the Current Path forecast ranges from 35.8 years in 2019 to 37.8 in the 2043 Current Path forecast, which increases to 44.8 in the Education scenario.
The impact of the Education scenario on GDP per capita is an average improvement for low-income Africa of US$138 in the Current Path forecast to US$3 923 in 2043. The impact is the largest in Malawi of US$214 and Guinea of US$210 compared to the Current Path forecast for that year. The impact is lowest in Burundi — only US$37 above the Current Path forecast for 2043.
The Education scenario will lift 19.4 million more people from extreme poverty in 2043 compared to the Current Path forecast, with most coming from the DR Congo (5.6 million people) and Uganda (1.5 million people). With much lower levels of extreme poverty, the impact of the Education scenario is lowest in The Gambia.
In the Education scenario, extreme poverty would be 1.9 percentage points lower by 2043 compared to the Current Path forecast for that year. Viewed as a percentage point reduction in rates of extreme poverty from the Current Path forecast, the DR Congo will experience the largest decline of 3 percentage points, whereas Ethiopia and The Gambia will see the smallest decline in extreme poverty due to the Education scenario in 2043. In the case of Ethiopia, this is the result of a rapid decline in extreme poverty in the Current Path forecast.
The Manufacturing/Transfers scenario represents reasonable but ambitious manufacturing growth through greater investment in the economy, investments in research and development, and promotion of the export of manufactured goods. It is accompanied by an increase in welfare transfers (social grants) to moderate the initial increases in inequality that are typically associated with a manufacturing transition. To this end, the scenario improves tax administration and increases government revenues.
The intervention is explained here in the thematic part of the website.
Chart 30 should be read with Chart 8 that presents a stacked area graph on the contribution to GDP and size, in billion US$, of the Current Path economy for each of the sectors.
Because of its forward and backward linkages to other sectors, the manufacturing sector is unique in its contribution to productivity improvements in most economies. In 2019, the service sector represented 47% of GDP in low-income Africa, agriculture 28%, manufacturing 13%, energy 4.2%, ICT 4% and materials 3.4%. By 2043, the percentage contributions to GDP in the Current Path forecast are agriculture 9.4%, manufacturing 19.5%, energy 2.9%, ICT 6.2% and materials 5.5%.
The increased contribution from manufacturing peaks by 0.53 percentage points above the Current Path forecast by 2037 before modestly declining to 0.27 in 2043. Increases in services’ contribution is set to reach 0.44 in 2043. The relative contribution of agriculture generally declines, reaching −0.65 in 2043, ICT’s contribution declines to a low of −0.19 in 2036 before improving to 0.07 in 2043. Energy and materials largely remain stable. The dynamics differ across countries. In the DR Congo, services’ relative contribution increases consistently across the 2043 forecast horizon, while agriculture’s contribution fell continuously. In Madagascar, the contribution of manufacturing peaks in 2036 at 0.52 before falling to −0.10 in 2043 in the Manufacturing/Transfers scenario compared to the Current Path forecast.
All sectors increase in absolute size in the Manufacturing/Transfers scenario compared to the Current Path forecast. The service sector is, by 2043, US$103.6 billion larger than the Current Path forecast for that year, followed by the manufacturing sector which is US$38 billion larger; ICT is US$11.8 larger. Materials increases by US$10.1 billion. The increases in size for the agriculture and energy sectors are marginal.
Efforts to use welfare transfers to unskilled workers offset the increase in poverty/inequality that is often associated with investments in manufacturing. Whereas low-income Africa countries transferred US$7.4 billion in welfare transfers in 2019, the 2043 amount in the Manufacturing/Transfers scenario, at US$129.4 billion, is US$56.4 billion more than in the Current Path forecast. Without these transfers, extreme poverty would be significantly higher. Because of the size of their economies, Uganda, Ethiopia and the DR Congo have the largest transfers in the Manufacturing/Transfers scenario compared to the Current Path forecast. Uganda will add US$17.1 billion more to transfers, Ethiopia US$11.7 billion more, and the DR Congo will add US$6.9 billion.
Instead of a 2043 GDP per capita of US$3 790 in 2043, low-income Africa could have a GDP per capita of US$4 005 in the Manufacturing/Transfers scenario. In dollar values, the scenario has the most positive impact on Uganda where GDP per capita in 2043 is US$475 higher than the Current Path forecast for that year, followed by Malawi (US$418) and Mali (US$302). Burundi (US$71) and South Sudan (US$44) benefit the least.
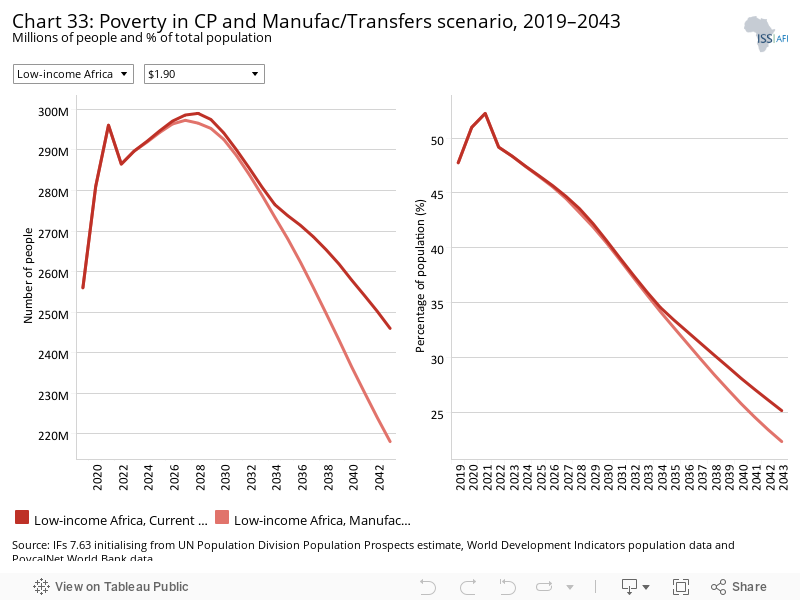
In the Manufacturing/Transfers scenario, low-income Africa would have 218.1 million extremely poor people in 2043 (using US$1.90) instead of 246 million, a difference of 27.8 million people. Given its large population, most of that decline (9 million people in 2043) is in the DR Congo, followed by Uganda (2.9 million less in 2043).
In the Manufacturing/Transfers scenario, low-income Africa would have 22.3% extremely poor people (using US$1.90) in 2043 instead of 25.2% in the Current Path forecast. Much of the decline is in Malawi (6.1 percentage point decline) and Somalia (5.9 percentage points).
The Leapfrogging scenario represents a reasonable but ambitious adoption of and investment in renewable energy technologies, resulting in better access to electricity in urban and rural areas. The scenario includes accelerated access to mobile and fixed broadband and the adoption of modern technology that improves government efficiency and allows for the more rapid formalisation of the informal sector.
The intervention is explained here in the thematic part of the website.
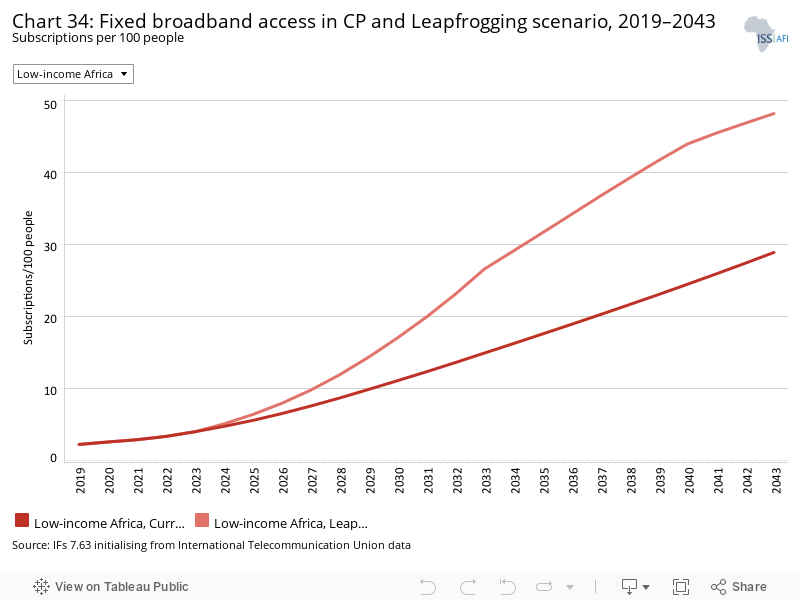
Fixed broadband includes cable modem Internet connections, DSL Internet connections of at least 256 KB/s, fibre and other fixed broadband technology connections (such as satellite broadband Internet, ethernet local area networks, fixed-wireless access, wireless local area networks, WiMAX, etc.).
In 2019, fixed broadband access per 100 people in low-income Africa was at 2.3 and is set to increase to 28.4 in the Current Path forecast by 2043. In the Leapfrogging scenario, that rate almost doubles to 48.3 with large country to country variations.
Subscriptions per 100 people will increase by more than 20 in eleven countries ranging from Chad and Uganda to Sudan and South Sudan in the 2043 Leapfrogging scenario compared to the Current Path forecast, with the least growth in The Gambia (4) and CAR (0.9).
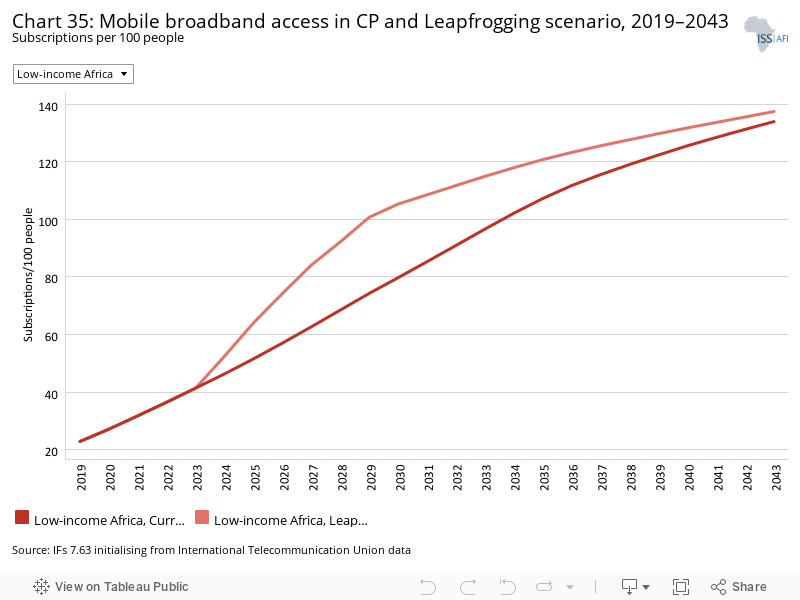
Mobile broadband refers to wireless Internet access delivered through cellular towers to computers and other digital devices.
Even more rapid than increased subscriptions to fixed broadband is the improved access to mobile broadband, which may be reaching saturation levels. In 2019, 23 out of every 100 persons in low-income Africa were connected to mobile broadband. In the Current Path forecast, that ratio quickly gets to more than 100 in 2034 and to 134 by 2043. In the Leapfrogging scenario, it will get 100 in 2029 and to 137.4 by 2043.
The Leapfrogging scenario accelerates the already aggressive forecasts on mobile broadband access within IFs. In 2043, the greatest growth will occur in Somalia (11.8) of additional subscriptions compared to the Current Path forecast, followed by Liberia (10.8). Due to its very high number of subscriptions in the Current Path, the least growth will occur in Burkina Faso of 0.075 subscriptions per 100 people.
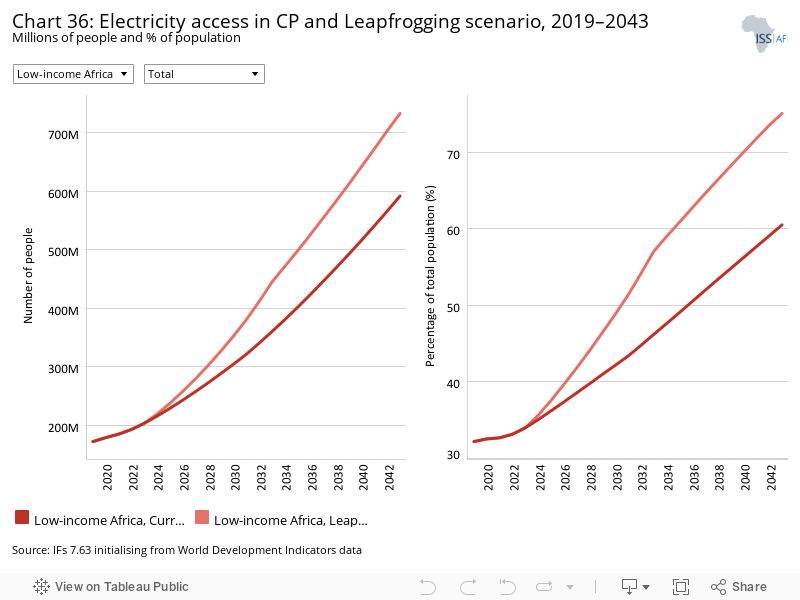
The SDG target for 2030 (Indicator 7.1.1) is 98% electricity access. Due to their low development levels, none of low-income Africa countries have reached the 2030 SDG target of 98% electricity access. In 2019, the low-income Africa average was 32.2%, forecast to increase to 42% in 2030 and to 60.5% by 2043 in the Current Path forecast. In the Leapfrogging scenario, the average for the group improves to 48.7% in 2030 and to 75.2% by 2043. Uganda has the largest improvement at 21 percentage points above the Current Path forecast by 2043, followed by Rwanda (20) and Malawi (18). CAR will be the country that yields the least impact of the Leapfrogging scenario at 4.6 percentage points in 2043.
The average urban electrification rate in low-income Africa was 61.3% in 2019 and is forecast to improve to 68.7% in 2030 and to 80.8% in 2043 in the Current Path forecast. In the Leapfrogging scenario, urban electricity access improves to 86.7% in 2043. Madagascar is forecast to improve most at 9.8 percentage points in 2043, followed by Somalia at 9.8. Togo will see no improvement in urban access to electricity because of reaching 100% in 2038, while Ethiopia will only make 0.042 improvement to get it to 100%.
The rural–urban gap in electricity access is high in low-income Africa at more than 40 percentage points in 2019. Electricity access in rural low-income Africa is set to increase to 44.8% in 2043 (in the Current Path forecast) and 64.5% in Leapfrogging scenario. The impact of the Leapfrogging scenario on rural electrification is highest in Uganda at 29.4 percentage points above the Current Path forecast, followed by Eritrea at 27.1 percentage points. South Sudan and CAR, which will see the least benefit, will have 8.9 and 4.7 percentage points improvement in rural electricity access due to the Leapfrogging scenario in 2043.
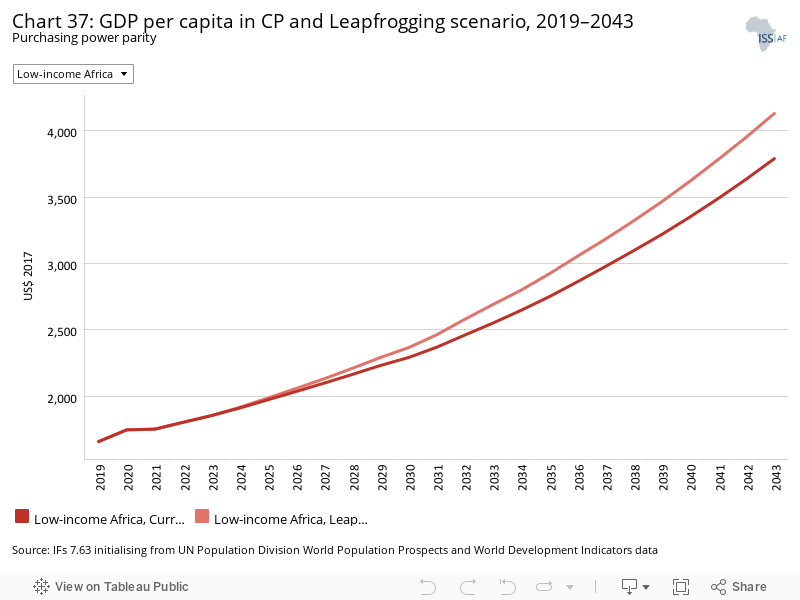
In 2019, GDP per capita was at US$1 660 and is forecast to increase to US$3 790 by 2043 in the Current Path. In the Leapfrogging scenario, GDP per capita will increase by US$340 to US$4 130 in 2043, compared to the Current Path forecast. The largest increase is forecast for Uganda at US$632, followed by Madagascar (US$602), Malawi (US$549) and Mali (US$484) compared to the Current Path forecast. The countries with the least improvement are Burundi, CAR and Liberia (all less than US$160).
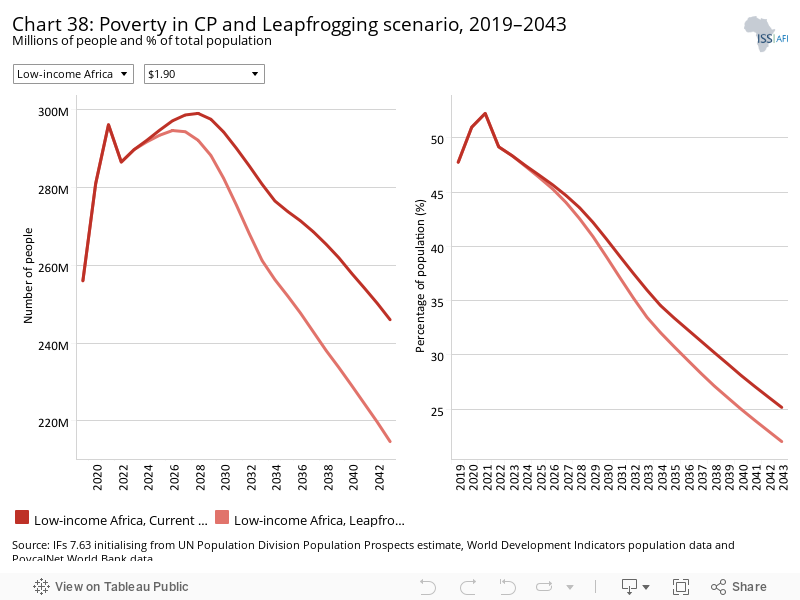
In the Leapfrogging scenario, Madagascar will experience the largest decline in the number of extremely poor people (using US$1.90) among the low-income Africa countries by 2043, compared to the Current Path forecast. It will reduce extreme poverty by 13 percentage points in 2043 as a result of the Leapfrogging scenario interventions, compared to the Current Path forecast. This reduces extreme poverty by 5.3 percentage points for Mali and 5.2 for the DR Congo. Ethiopia, The Gambia and Sudan will register the least impact on poverty as a result of the Leapfrogging scenario mainly due to their already high rates of Internet connectivity.
Instead of 81.9 million extremely poor people in 2043, the DR Congo will have 72.7 million, a difference of 9.2 million people; in 2030, the difference will be 3.3 million people. Madagascar, the country that will experience the second highest impact, will only reduce poverty by 5.9 million people in 2043 compared to the Current Path forecast for that year. Whereas low-income Africa was forecast to have 246 million extremely poor people in 2043, that number would only be 214.7 million in the Leapfrogging scenario.
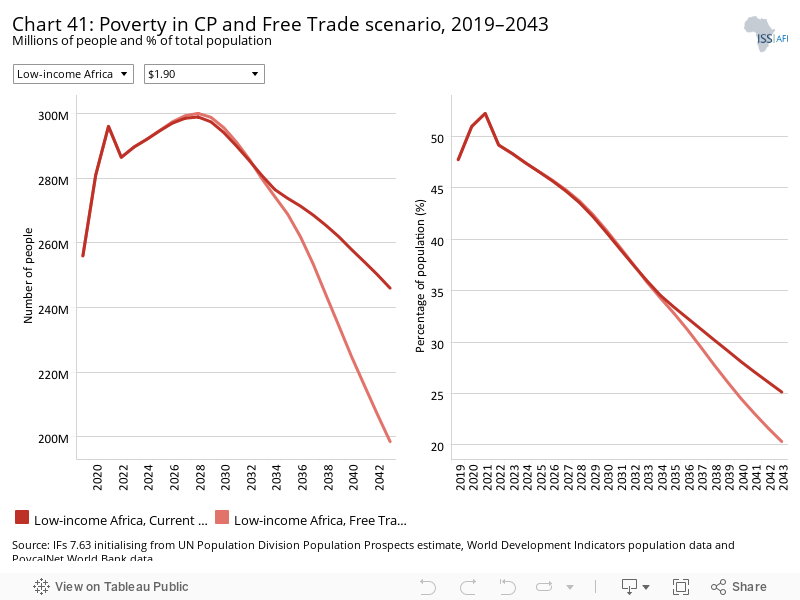
The Free Trade scenario represents the impact of the full implementation of the African Continental Free Trade Area (AfCFTA) by 2034 through increases in exports, improved productivity and increased trade and economic freedom.
The intervention is explained here in the thematic part of the website.
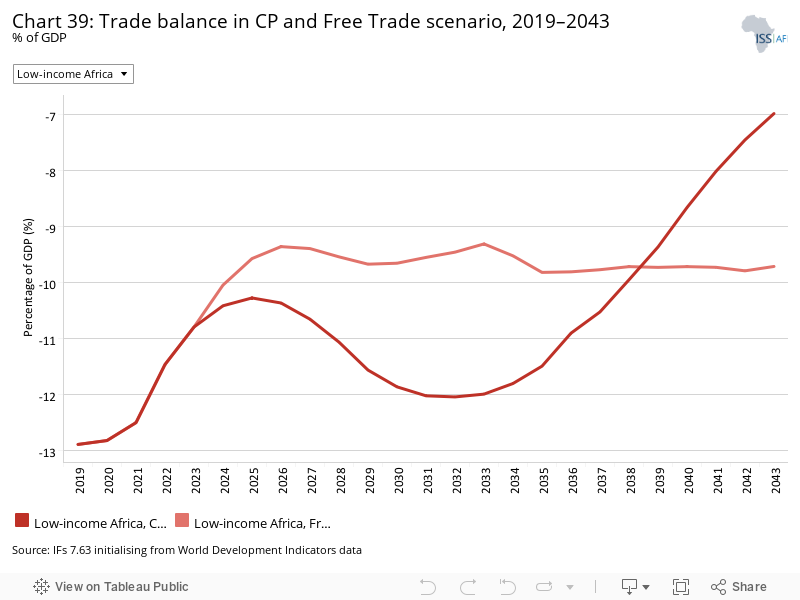
The trade balance is the difference between the value of a country's exports and its imports. A country that imports more goods and services than it exports in terms of value has a trade deficit, while a country that exports more goods and services than it imports has a trade surplus.
In 2019, low-income Africa had a negative trade balance of −13% of GDP, expected marginally to improve to −7% in 2043. The impact of the Free Trade scenario is set to increase this negative trade balance to −9.7%, although the rate fluctuates over time. By 2043, low-income Africa, in the Free Trade scenario, would be exporting to the value of US$889 billion instead of US$573 billion in the Current Path forecast and importing to the value of US$1 076 billion instead of US$676 billion.
Compared to the Current Path forecast, low-income Africa countries will decrease their imports measured as a per cent of GDP in the Current Path forecast, and only increases in the Free Trade scenario starting in 2028, increasing in 2038 at 37% and getting to 35% of GDP in 2043, 12.3 percentage points above the Current Path forecast for that year. By 2043, the growth in imports due to the Free Trade scenario will be largest in Togo (21 percentage points), followed by Burkina Faso (20), Mali (19.7) and Sierra Leone (19.2). The impact of the Free Trade scenario on exports will be most in Burundi (185%), Ethiopia (103%) and The Gambia (87%), and least in Guinea, Chad and South Sudan (16%).
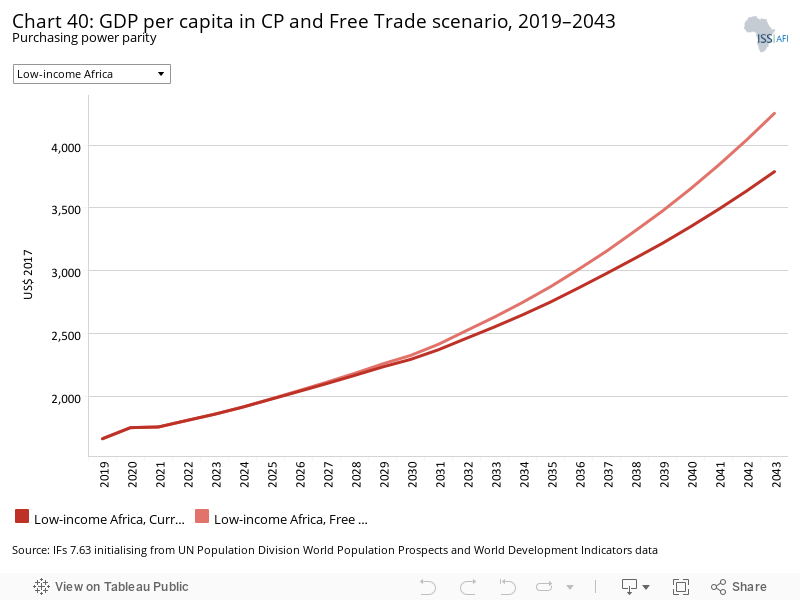
GDP per capita for low-income Africa is US$1 660 in 2019 and is set to increase to US$3 790 in the Current Path forecast. In the Free Trade scenario, this will increase to US$4 255 in 2043, a difference of US$465.
In the Current Path forecast, rates of extreme poverty (using US$1.90) in low-income Africa are set to decline from 47.8% in 2019 to 40.7% in 2030 and to 25.2% in 2043. In the Free Trade scenario, rates of extreme poverty start to decline from 2021 to 20.3% in 2043, 4.8 percentage points above the Current Path forecast. While the DR Congo will see the largest decline of 12.6 percentage points (compared to the Current Path), Madagascar experiences a decline of 11.7 percentage points by 2043.
In 2019, 256 million people were considered to live on less than US$1.90 per person per day in the group. In the Current Path forecast that will increase to 246 million in 2043. In the Free Trade scenario, extreme poverty numbers will decline to 198.5 in 2043. This means that the impact of the Free Trade scenario lifts additional 47.5 million people out of extreme poverty. The DR Congo, with its large poor population, will see the greatest improvement at 21.9 million people, followed by Madagascar at 5.3 million people.
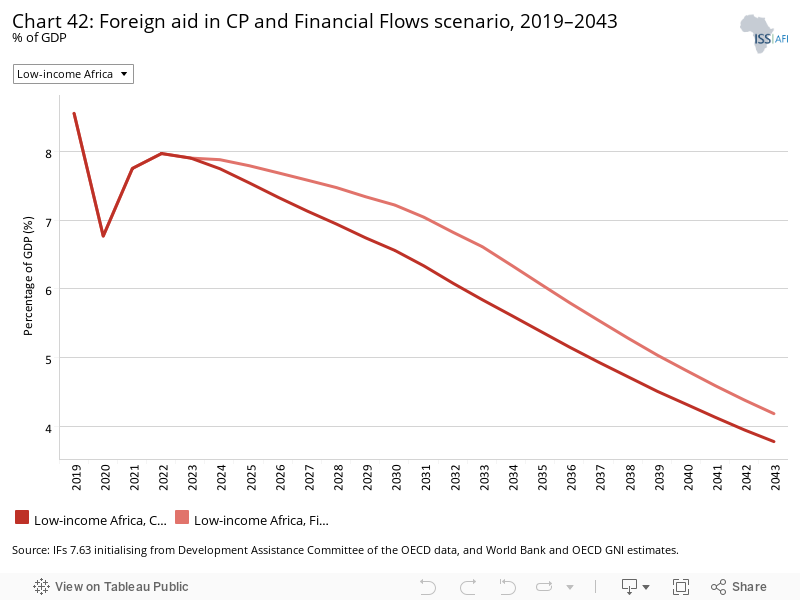
The Financial Flows scenario represents a reasonable but ambitious increase in worker remittances and aid flows to poor countries, and an increase in the stock of foreign direct investment (FDI) and additional portfolio investment inflows to middle-income countries. We also reduced outward financial flows to emulate a reduction in illicit financial outflows.
The intervention is explained here in the thematic part of the website.
Most aid goes to low-income and fragile states, while aid to upper middle-income countries has declined significantly. In 2019, the low-income Africa group received US$35.7 billion net aid that would continually increase to US$73.2 billion in 2043 in the Current Path forecast. However, as a per cent of GDP, aid continually reduces from 8.6% of GDP in 2019 to 6.5% in 2030 and to 3.8% in 2043. This is because the increase in aid does not keep up with the pace of economic growth within the group. The impact of the Financial Flows scenario on low-income Africa is an increase in aid as a percentage of GDP by 0.41 percentage points compared to the Current Path forecast in 2043 to 4.2% of GDP.
As a percentage of GDP, aid is highest in the small, fragile low-income African countries of South Sudan, CAR, Liberia and Malawi — mainly because of the relatively small size of their economies.
As a result, in the Financial Flows scenario, the reduction in aid as a per cent of GDP is slower than in the Current Path. By 2030, aid constitutes 6.6% of GDP and is at 3.8% of GDP in 2043. In 2030, low-income Africa will receive US$5.2 billion more aid in the Financial Flows scenario than in the Current Path forecast and US$10.1 billion more in 2043.
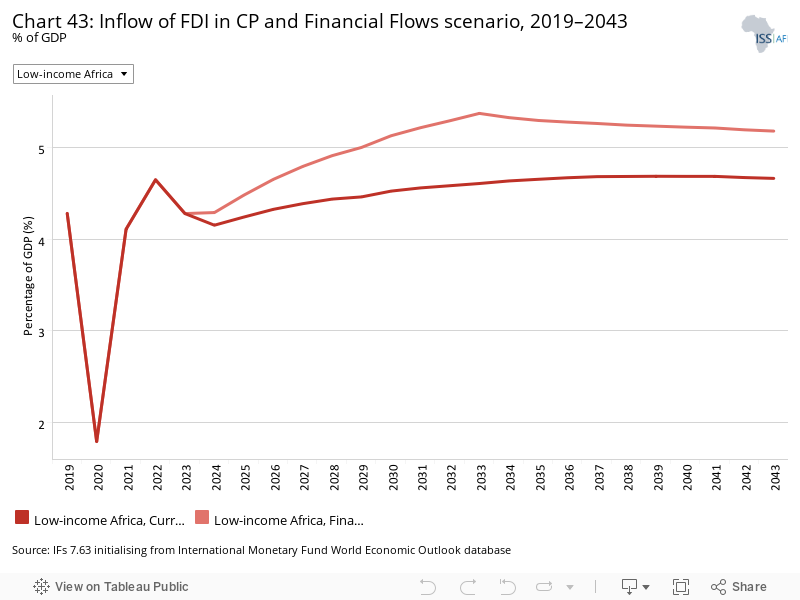
FDI typically goes to middle- and high-income countries rather than low-income countries. In 2019, Liberia, Mozambique and Sierra Leone receive the largest FDI inflows of >7% of GDP of low-income Africa. Burundi and South Sudan receive the least FDI of low-income Africa countries, perhaps due to the instability in those countries. The impact of the Financial Flows scenario will be the greatest in Liberia where it will boost FDI by additional 2.2 percentage points compared to the Current Path, followed by Mozambique (1.5) and Sierra Leone (0.94). Within the low-income Africa group, FDI inflows will increase to 4.7% in 2043 from 4.3% in 2019 in the Current Path forecast. The Financial Flows scenario will increase FDI inflows to 5.2% of GDP in 2043.
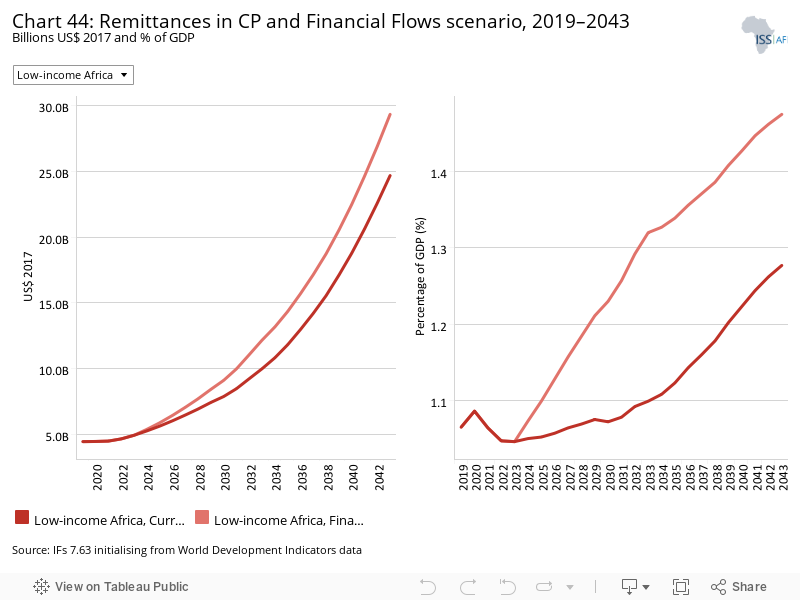
Low-income Africa is a net receiver of remittances at US$4.5 billion in 2019, set to increase to US$24.7 billion in 2043, and in the Financial Flows scenario this will further rise to US$29.3 billion in 2043. In 2019, 15 out of 23 countries were net receivers of remittance, with Ethiopia topping the list at US$1.7 billion, followed by Uganda at US$871 million. The following countries are considered to be net remittance senders: Eritrea, Chad, Sudan, Rwanda, CAR, Niger, Mozambique and the DR Congo. By 2043, Ethiopia will benefit most from Financial Flows scenario by boosting remittances receipt by an additional US$1.6 billion, followed by Uganda at US$1.2 billion.
In 2019, the GDP per capita in low-income Africa was US$1 660. In the Current Path forecast, GDP per capita would come to US$3 790 in 2043. Instead, in the Financial Flows scenario, it comes to US$3 864, a difference of US$74. Compared to the Current Path forecast, Malawi receives the largest increase at US$266 in 2043, followed by Liberia and Rwanda. Somalia, CAR and Burundi achieve the smallest improvement at less than US$28 per person.
Trade openness will reduce poverty in the long term after initially increasing it due to the redistributive effects of trade. Most African countries export primary commodities and low-tech manufacturing products, and therefore a continental free trade agreement (AfCFTA) that reduces tariffs and non-tariff barriers across Africa will increase competition among countries in primary commodities and low-tech manufacturing exports. Countries with inefficient, high-cost manufacturing sectors might be displaced as the AfCFTA is implemented, thereby pushing up poverty rates. In the long term, as the economy adjusts and produces and exports its comparatively advantaged (lower relative cost) goods and services, poverty rates will decline.
The difference between the Current Path forecast and the Financial Flows scenario is equivalent to 5.2 million fewer extremely poor people in 2030 and 11.8 million fewer in 2043. The largest decline is in the DR Congo (2.7 million people) and Madagascar (1.5 million).
The extreme poverty rate in 2019 (at US$1.90) was 47.8%, which is likely to decline to 40.7% in 2030 and 25.2% in 2043. In the Financial Flows scenario, the rate of extreme poverty marginally declines to 24% in 2043.
The Infrastructure scenario represents a reasonable but ambitious increase in infrastructure spending across Africa, focusing on basic infrastructure (roads, water, sanitation, electricity access and ICT) in low-income countries and increasing emphasis on advanced infrastructure (such as ports, airports, railway and electricity generation) in higher-income countries.
Note that health and sanitation infrastructure is included as part of the Health/WaSH scenario and that ICT infrastructure and more rapid uptake of renewables are part of the Leapfrogging scenario. The interventions there push directly on outcomes, whereas those modelled in this scenario increase infrastructure spending, indirectly boosting other forms of infrastructure, including those supporting health, sanitation and ICT.
The intervention is explained here in the thematic part of the website.
In 2019, electricity access in low-income Africa stood at 32.2%, in 2030 it will increase to 42.1%, and in 2043 Current Path forecast it reaches 60.5%. The Infrastructure scenario has the effect of boosting electricity access across member countries by an average of 5.3 percentage points in 2043 compared to the Current Path forecast, of which 2.5 percentage points pertains to people living in urban areas. Sierra Leone and South Sudan will see the greatest boost in access to electricity due to the Infrastructure scenario of 17.5 and 14.8 percentage points in 2043. At the same time, Ethiopia and Chad will see the least improvements.
Indicator 9.1.1 in the Sustainable Development Goals refers to the proportion of the rural population who live within 2 km of an all-season road and is captured in the Rural Access Index.
In 2019, 43% of the population in rural areas in low-income Africa lived within 2 km from an all-weather road. The Current Path forecast is that this will improve to 45.7% by 2030 and to 51% by 2043, and to 53.5% in the Infrastructure scenario. The low-income Africa countries with the best access in 2019 were Sierra Leone (69%) and Sudan (68.5%). The worst performing countries were Mali (17.5%) and Chad (16.1%). Rwanda gains most from the Infrastructure scenario, improving access by 5.8 percentage points above the Current Path forecast by 2043, followed by The Gambia. In the conflict-ridden states of South Sudan and Burundi, the Infrastructure scenario has the least impact on rural access to all-weather roads of less than 0.6 percentage points.
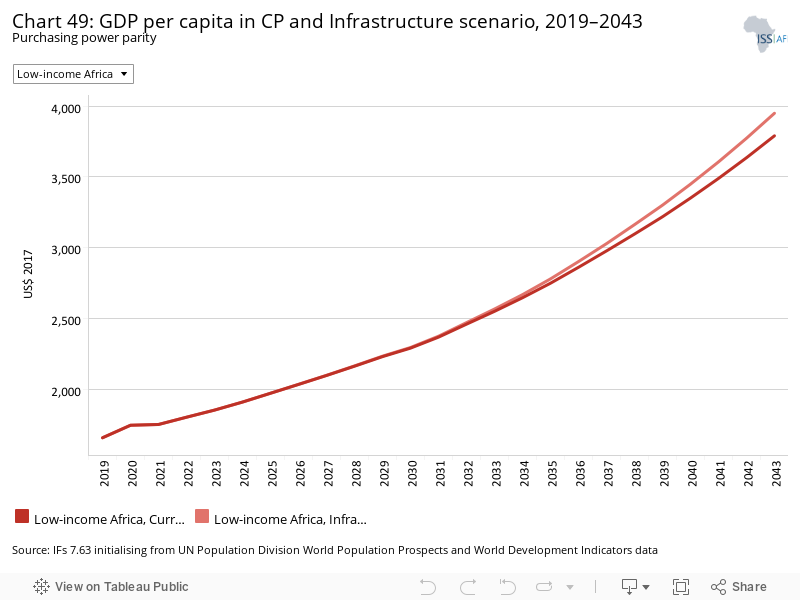
The GDP per capita for low-income Africa was US$1 660 in 2019 and is set to increase to US$3 790 in the Current Path forecast compared to US$3 949 in the Infrastructure scenario by 2043. Guinea gains the most in GDP per capita and increases US$335 above the Current Path forecast by 2043, followed by Uganda (US$288). Burundi, which benefits the least, will only add US$21 per person by 2043 from the Infrastructure scenario.
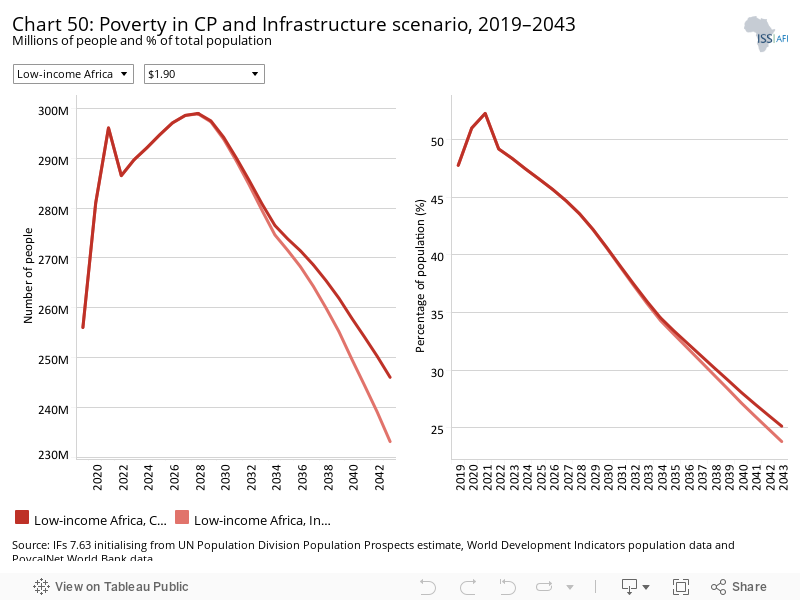
The Current Path forecast is that extreme poverty in low-income Africa (using US$1.90) will increase from 256 million people (47.8% of the population) in 2019 to 294 million in 2030 (or 40.6%), before decreasing to 246 million (or 25.2% of the population) in 2043. The number of extremely poor people in the Infrastructure scenario in 2030 is 293.8 million and 233 million in 2043. These numbers represent 40.7% and 40.6% of the total population, respectively. The decline in poverty is most significant in Madagascar and Guinea with 3.3 and 3.2 percentage points less in the poverty rates in 2043 compared to the Current Path forecast.
The Governance scenario represents a reasonable but ambitious improvement in accountability and reduces corruption, and hence improves the quality of service delivery by government.
The intervention is explained here in the thematic part of the website.
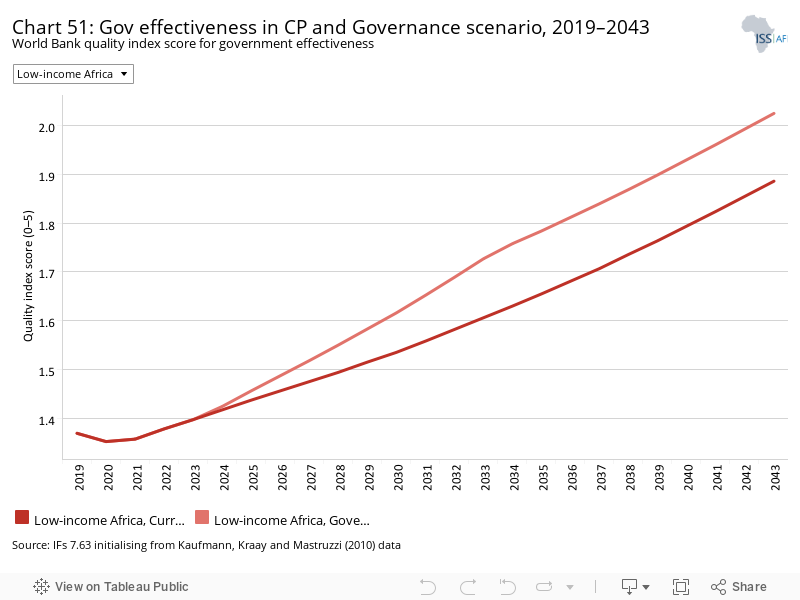
As defined by the World Bank, government effectiveness ‘captures perceptions of the quality of public services, the quality of the civil service and the degree of its independence from political pressures, the quality of policy formulation and implementation, and the credibility of the government’s commitment to such policies’.
Chart 51 presents the impact of the interventions in the Governance scenario on government effectiveness.
The Governance scenario improves government effectiveness by 0.14 (or 7%) in 2043 above the Current Path forecast in low-income Africa. Eritrea improves the most at 16.8% and Madagascar the least at 2%.
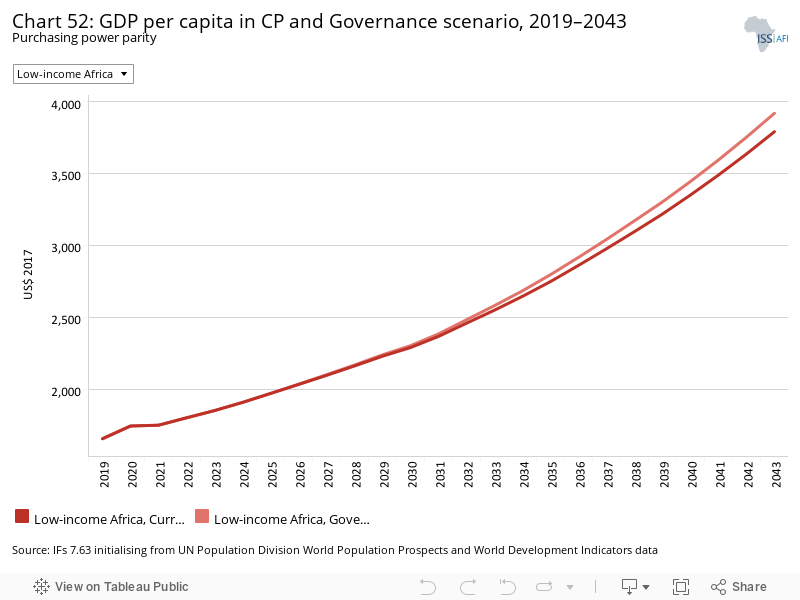
In 2019, GDP per capita in low-income Africa was US$1 660 and is set to improve to US$3 790 in 2043. In the Governance scenario, GDP per capita increases to US$3 917. Sudan will gain the most in the Governance scenario compared to the Current Path forecast at US$219. Somalia will gain the least at a meagre US$41 above the Current Path forecast for 2043.
The rate of extreme poverty (using US$1.90) was 47.7 % in low-income Africa in 2019, equivalent to 256 million people. In the Governance scenario, extreme poverty will decline to 24% (234.1 million people) by 2043, compared to 25.2% (246 million people) in the Current Path forecast. Extreme poverty in Madagascar and Mali will decline by 2.3 and 2.2 percentage points in 2043 compared to the Current Path forecast. The Governance scenario has the least impact on Ethiopia and The Gambia, where extreme poverty will decline the least.
This section presents projections for carbon emissions in the Current Path for low-income Africa and the 11 scenarios. Note that IFs uses carbon equivalents rather than CO2 equivalents.
In 2019, the low-income Africa group released only 28 million tons of carbon of which 69% was released by only three countries (Egypt, Algeria and Nigeria). In the Current Path forecast, low-income Africa will release 154 million tons of carbon in 2043 as a result of greater economic activity and increased population growth.
The Free Trade scenario is the most carbon-intensive scenario (at 174 million tons), followed by agriculture (at 167 million tons), while in the Demographic scenario, carbon emissions in 2043 will be below the Current Path forecast at 150 million tons.
The Combined Agenda 2063 scenario consists of the combination of all 11 sectoral scenarios presented above, namely the Stability, Demographic, Health/WaSH, Agriculture, Education, Manufacturing/Transfers, Leapfrogging, Free Trade, Financial Flows, Infrastructure and Governance scenarios. The cumulative impact of better education, health, infrastructure, etc. means that countries get an additional benefit in the integrated IFs forecasting platform that we refer to as the synergistic effect. Chart 55 presents the contribution of each of these 12 components to GDP per capita in the Combined Agenda 2063 scenario as a stacked area graph.
In 2019, average GDP per capita in low-income Africa was US$1 660. In the Current Path forecast, this will increase to US$3 790 in 2043.
By 2033, the end of the second ten-year implementation plan of the Combined Agenda 2063, the Agriculture scenario provides the largest increase in GDP per capita, followed by the Leapfrogging and Free Trade scenarios. By 2043, the Free Trade scenario provides the largest increase in GDP per capita, followed by the Leapfrogging scenario.
Whereas Chart 55 presents a stacked area graph on the contribution of each scenario to GDP per capita as well as the additional benefit or synergistic effect, Chart 56 presents only the GDP per capita in the Current Path forecast and the Combined Agenda 2063 scenario.
The Combined Agenda 2063 scenario has a substantial impact on incomes in the low-income Africa group. The GDP per capita for low-income Africa was US$1 660 in 2019 and is set to increase to US$3 790 in 2043 in the Current Path forecast. In the Combined Agenda 2063 scenario, the average GDP per capita for low-income Africa will be US$6 502, an increase of 77.6% in the Current Path forecast for that year.
Malawi gains most in GDP per capita improvements in the Combined Agenda 2063 within the group with an increase of US$5 449 by 2043 compared to the Current Path forecast, followed by Uganda with US$4 791. Burundi only gains US$878 as a result of the Combined Agenda 2063 scenario in 2043.
In 2019, extreme poverty at US$1.90 affected 47.8% in low-income Africa in 2019, equivalent to 256 million people. In the Combined Agenda 2063 forecast, the per cent of extremely poor people could decline to 6.7% (60.8 million people) by 2043, instead of 25.2% (246 million) in the Current Path forecast.
Madagascar will experience the largest decline in extreme poverty, namely 50.3 percentage points (from 29.9 million to 7.3 million people in 2043), followed by Burundi and the DR Congo. Ethiopia and The Gambia would register less than three percentage point improvement.
See Chart 8 to view the Current Path forecast of the sectoral composition of the economy.
All sectors increase in value when comparing the 2043 Current Path forecast with the Combined Agenda 2063 scenario although the relative contribution shifts.
In 2019, the service sector represented 47% of the low-income Africa economy. Instead of 56.5% in 2043 (the Current Path forecast), in the Combined Agenda 2063 scenario, it would represent 61%. The service sector will expand particularly rapidly in Egypt and Comoros.
The changes in the sectoral composition of low-income Africa by 2043 will consist of a decline of the contribution of the energy, manufacturing, agriculture and materials sectors and increases in the services and ICT sectors. By 2043, agriculture will increase most in Guinea Bissau (2.3 percentage points) and Mozambique (1.5 percentage points), and decline by 6.1 percentage points in Sierra Leone.
In 2019, Sudan had the largest economy in low-income Africa at US$72.7 billion, followed by Ethiopia at US$70.6 billion. In 2043, Ethiopia will benefit most from the Combined Agenda 2063 scenario by adding US$397 billion, making it the largest of the 23 low-income economies, followed by Uganda at US$298 billion. CAR and The Gambia will add the least to their economies as a result of the Combined Agenda 2063 scenario.
The combined GDP of Africa’s 23 low-income countries will increase from US$418.6 billion in 2019 to US$3 716.9 billion in 2043 instead of US$1 932.6 billion on the Current Path forecast.
In the Combined Agenda 2063 scenario, low-income Africa will release 223 million tons of carbon in 2043 compared to 154 million tons in the Current Path forecast. In 2019, low-income Africa released only 28 million tons of carbon. Uganda will release additional 13 million tons in the Combined Agenda 2063 compared to the Current Path forecast in 2043, and the DR Congo 12 million tons.
Page information
Contact at AFI team is Mustapha Jobarteh
This entry was last updated on 13 December 2023 using IFs v7.63.
Donors and sponsors


Reuse our work
- All visualizations, data, and text produced by African Futures are completely open access under the Creative Commons BY license. You have the permission to use, distribute, and reproduce these in any medium, provided the source and authors are credited.
- The data produced by third parties and made available by African Futures is subject to the license terms from the original third-party authors. We will always indicate the original source of the data in our documentation, so you should always check the license of any such third-party data before use and redistribution.
- All of our charts can be embedded in any site.
Cite this research
Mustapha Jobarteh (2025) Low-income Africa. Published online at futures.issafrica.org. Retrieved from https://futures.issafrica.org/geographic/income-groups/low-income-africa/ [Online Resource] Updated 13 December 2023.