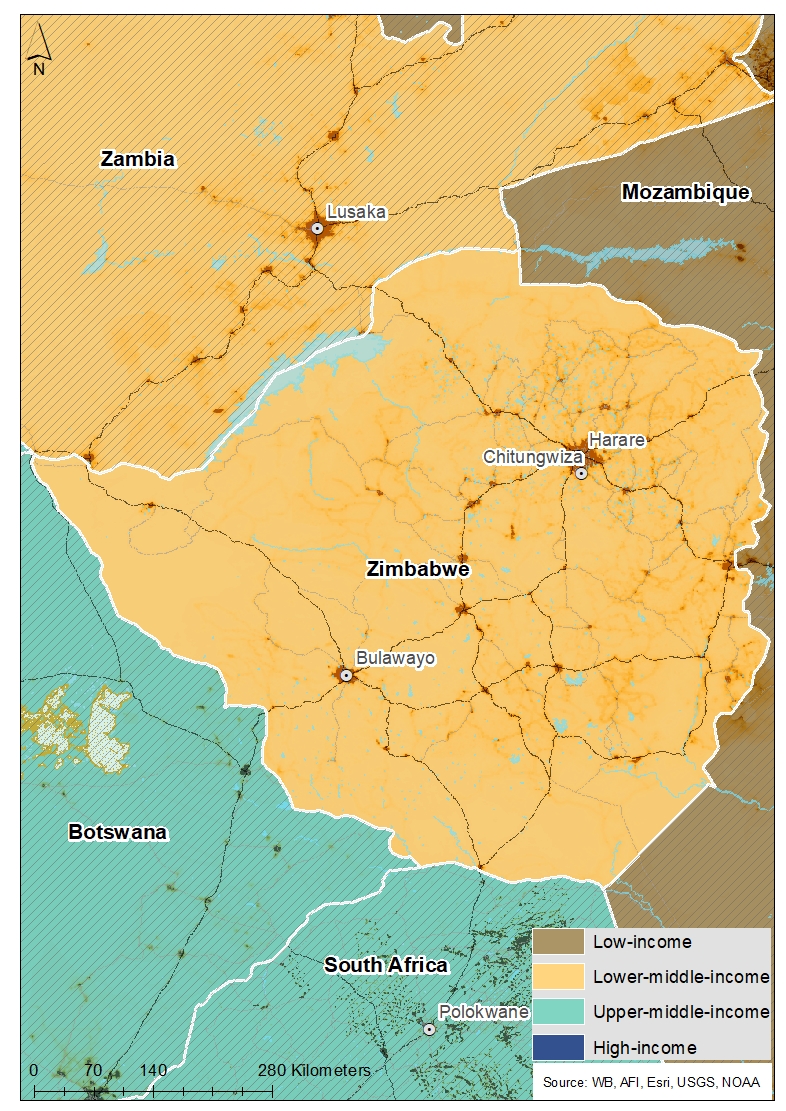
 Zimbabwe
Feedback welcome
Our aim is to use the best data to inform our analysis. See our About page for information on the IFs forecasting platform. We appreciate your help and references for improvements via our feedback form.
In this entry, we first describe the Current Path forecast for Zimbabwe as it is expected to unfold to 2043, the end of the third ten-year implementation plan of the African Union’s Agenda 2063 long-term vision for Africa. The Current Path in the International Futures (IFs) forecasting model initialises from country-level data that is drawn from a range of data providers. We prioritise data from national sources.
The Current Path forecast is divided into summaries on demographics, economics, poverty, health/WaSH and climate change/energy. A second section then presents a single positive scenario for potential improvements in stability, demographics, health/WaSH, agriculture, education, manufacturing/transfers, leapfrogging, free trade, financial flows, infrastructure, governance and the impact of various scenarios on carbon emissions. With the individual impact of these sectors and dimensions having been considered, a final section presents the impact of the Combined Agenda 2063 scenario.
We generally review the impact of each scenario and the Combined Agenda 2063 scenario on gross domestic product (GDP) per person and extreme poverty except for Health/WaSH that uses life expectancy and infant mortality.
The information is presented graphically and supported by brief interpretive text.
All US$ numbers are in 2017 values.
Summary
- Current Path forecast
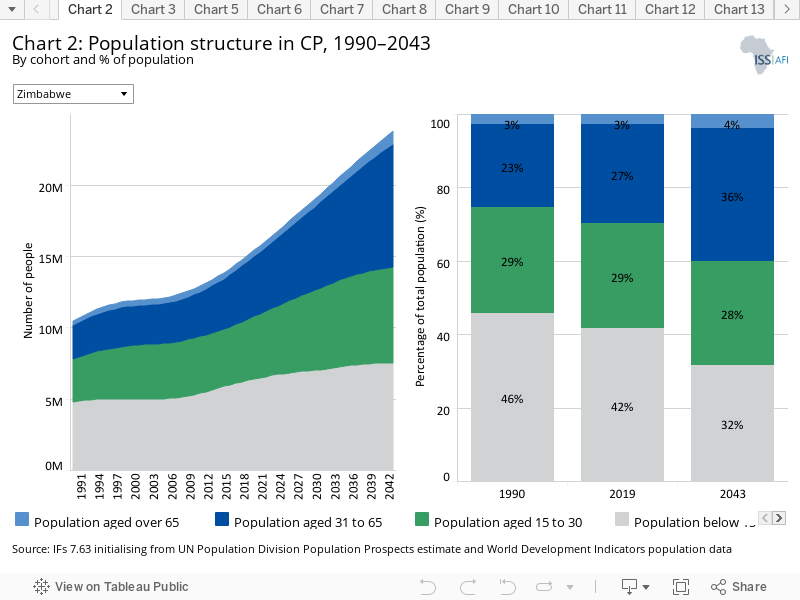
- Home to just over 15 million people in 2019, Zimbabwe’s population is nearly as large as that of neighbouring Zambia (estimated at 17.6 million) and less than one-third the size of South Africa (estimated at 57 million). Zimbabwe’s population is projected to reach nearly 24 million by 2043. Jump to Demographics: Current Path
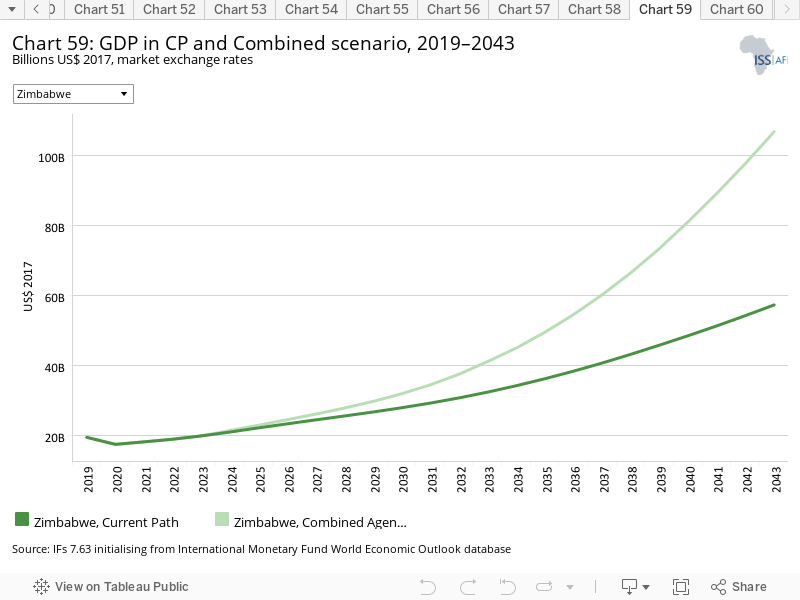
- Zimbabwe’s economy has suffered a series of intense and prolonged economic crises that have been among the worst in Africa’s recent history. GDP has slowly recovered to an estimated US$19.4 billion in 2019 and is projected to reach US$57.3 billion by 2043. Jump to Economics: Current Path
- Roughly two out of five Zimbabweans (6.7 million people) were living in extreme poverty (using US$3.20) in 2019. Although this poverty rate of nearly 45% is projected to decline to 20% by 2043, 4.7 million Zimbabweans will be living in extreme poverty on the Current Path. Jump to Poverty: Current Path
- In 2019, Zimbabwe emitted an estimated 3.8 million tons of carbon – less than the country emitted in the mid-1990s, when emissions reached nearly 5 million tons. On the Current Path, population growth and economic growth will contribute to modest increases in emissions. Jump to Carbon emissions/Energy: Current Path
- Sectoral scenarios
- The ambitious but achievable improvements modelled in the Stability scenario result in only modest average income growth over the long term compared to the Current Path. Jump to Stability scenario
- Zimbabwe has 13 working-age persons (aged 15–64) for every ten dependants — fairly average for Southern Africa. This low ratio is, however, improving. In addition to access to modern contraceptives and basic healthcare, accessibility to and quality of education for girls and women is critical to ensuring that the demographic dividend will bring about economic growth. Jump to Demographic scenario
- In 2019, infant mortality was 45 per 1 000 live births in Zimbabwe — among the 30 highest infant mortality rates in the world. In the Health/WaSH scenario, infant mortality declines slightly more rapidly than on the Current Path, but remains high, showing that a whole-of-government approach is necessary to improve this critical indicator of a society’s health. Jump to Health/WaSH scenario
- The dramatic impact of the Agriculture scenario on poverty reflects how interconnected the Zimbabwean economy is with the agriculture sector and the extent to which Zimbabwe’s most vulnerable populations depend on subsistence agriculture. Jump to Agriculture scenario
- Education offers bright but fragile hope for Zimbabwe’s development. The Education scenario positively impacts livelihoods in Zimbabwe but is not sufficient to dramatically reduce poverty in the country; consequently, it is an urgent task the Zimbabwean government needs to pursue immediately. Jump to Education scenario
- The modest impact of the Manufacturing/Transfers scenario on livelihoods in Zimbabwe reflects, among other issues, the dire state of the Zimbabwean economy. Even in this scenario, the average Zimbabwean earns approximately half of his or her average counterpart in lower middle-income Africa. Jump to Manufacturing/Transfers scenario
- The greater electricity access modelled in the Leapfrogging scenario has the potential to improve livelihoods only modestly in Zimbabwe. More than improvements to renewable energy, electrical, and Internet infrastructure are needed to significantly alleviate poverty. Jump to Leapfrogging scenario
- Among all of the scenarios explored, the Free Trade scenario has the largest impact on economic livelihood, reflecting the benefits that participation in the African Continental Free Trade Agreement and increased economic freedom would have on the country. Jump to Free Trade scenario
- The increased inward remittances and aid and foreign direct investment flows modelled in the Financial Flows scenario only slightly impact poverty levels in Zimbabwe. Clearly, improvements in inward flows of money to the country alone are insufficient to alleviate poverty in Zimbabwe. Jump to Financial Flows scenario
- The Infrastructure scenario shows that while infrastructure is critical to improving livelihoods — particularly outside of cities, where vulnerable populations are often isolated from critical resources and services — it alone is incapable of dramatically improving incomes in a country facing complex developmental challenges. Jump to Infrastructure scenario
- Improvements in governance alone are insufficient to improve livelihoods in Zimbabwe. The improvement in average incomes in Zimbabwe in the Governance scenario is negligible when compared to the Current Path, underscoring the need for a multi-faceted approach to improving livelihoods in the country. Jump to Governance scenario
- On the Current Path, Zimbabwe’s carbon emissions will increase from the 2019 estimate of 4 million tons to nearly 10 million tons in 2043. The Free Trade scenario has the largest impact in increased carbon emissions over the Current Path forecast. Conversely, the Demographic scenario, owing to slower population growth, causes the most significant decrease in carbon emissions. Jump to Impact of scenarios on carbon emissions
- Combined Agenda 2063 scenario
- The dramatic impact of the Combined Agenda 2063 scenario on poverty in Zimbabwe speaks to the beneficial effect of concerted, cross-cutting government approaches to seemingly intractable problems such as extreme poverty. Jump to Combined Agenda 2063 scenario
All charts for Zimbabwe
- Chart 1: Political map of Zimbabwe
- Chart 2: Population structure in CP, 1990–2043
- Chart 3: Urban and rural population in CP, 1990–2043
- Chart 4: Population density map for 2019
- Chart 5: GDP in CP, 1990–2043
- Chart 6: GDP per capita in CP, 1990–2043
- Chart 7: Informal sector value in CP, 2015–2043
- Chart 8: Value added by sector in CP, 2015–2043
- Chart 9: Agriculture production/demand in CP, 1990–2043
- Chart 10: Poverty in CP, 2015–2043
- Chart 11: Energy production by type in CP, 1990–2043
- Chart 12: Carbon emissions in CP, 1990–2043
- Chart 13: Governance security in CP and Stability scenario, 2019–2043
- Chart 14: GDP per capita in CP and Stability scenario, 2019–2043
- Chart 15: Poverty in CP and Stability scenario, 2019–2043
- Chart 16: Demographic dividend in CP and Demog scenario, 2019–2043
- Chart 17: Infant mortality in CP and Demog scenario, 2019–2043
- Chart 18: GDP per capita in CP and Demog scenario, 2019–2043
- Chart 19: Poverty in CP and Demog scenario, 2019–2043
- Chart 20: Life expectancy in CP and Health/WaSH scenario, 2019–2043
- Chart 21: Infant mortality in CP and Health/WaSH scenario, 2019–2043
- Chart 22: Yield/hectare in CP and Agric scenario, 2019–2043
- Chart 23: Agriculture imports in CP and Agric scenario, 2019–2043
- Chart 24: GDP per capita in the CP and Agric scenario, 2019–2043
- Chart 25: Poverty in CP and Agric scenario, 2019–2043
- Chart 26: Mean years of education in CP and Educ scenario, 2019–2043
- Chart 27: Education quality in CP and Educ scenario, 2019–2043
- Chart 28: GDP per capita in CP and Educ scenario, 2019–2043
- Chart 29: Poverty in CP and Educ scenario, 2019–2043
- Chart 30: Value added by sector in CP and Manufac/Transfers scenario, 2019–2043
- Chart 31: Gov welfare transfers in CP and Manufac/Transfers scenario, 2019–2043
- Chart 32: GDP per capita in CP and Manufac/Transfers scenario, 2019–2043
- Chart 33: Poverty in CP and Manufac/Transfers scenario, 2019–2043
- Chart 34: Fixed broadband access in CP and Leapfrogging scenario, 2019–2043
- Chart 35: Mobile broadband access in CP and Leapfrogging scenario, 2019–2043
- Chart 36: Electricity access in CP and Leapfrogging scenario, 2019–2043
- Chart 37: GDP per capita in CP and Leapfrogging scenario, 2019–2043
- Chart 38: Poverty in CP and Leapfrogging scenario, 2019–2043
- Chart 39: Trade balance in CP and Free Trade scenario, 2019–2043
- Chart 40: GDP per capita in CP and Free Trade scenario, 2019–2043
- Chart 41: Poverty in CP and Free Trade scenario, 2019–2043
- Chart 42: Foreign aid in CP and Financial Flows scenario, 2019–2043
- Chart 43: Inflow of FDI in CP and Financial Flows scenario, 2019–2043
- Chart 44: Remittances in CP and Financial Flows scenario, 2019–2043
- Chart 45: GDP per capita in CP and Financial Flows scenario, 2019–2043
- Chart 46: Poverty in CP and Financial Flows scenario, 2019–2043
- Chart 47: Electricity access in CP and Infrastructure scenario, 2019–2043
- Chart 48: Rural road access in CP and Infrastructure scenario, 2019–2043
- Chart 49: GDP per capita in CP and Infrastructure scenario, 2019–2043
- Chart 50: Poverty in CP and Infrastructure scenario, 2019–2043
- Chart 51: Gov effectiveness in CP and Governance scenario, 2019–2043
- Chart 52: GDP per capita in CP and Governance scenario, 2019–2043
- Chart 53: Poverty in CP and Governance scenario, 2019–2043
- Chart 54: Carbon emissions in CP and scenarios, 2019–2043
- Chart 55: GDP per capita in CP and scenarios, 2019–2043
- Chart 56: GDP per capita in CP and Combined scenario, 2019–2043
- Chart 57: Poverty in CP and Combined scenario, 2019–2043
- Chart 58: Value added by sector in CP and Combined scenario, 2019–2043
- Chart 59: GDP in CP and Combined scenario, 2019–2043
- Chart 60: Carbon emissions in CP and Combined scenario, 2019–2043
This page provides an overview of the key characteristics of Zimbabwe along its likely (or Current Path) development trajectory. The Current Path forecast from the International Futures forecasting (IFs) platform is a dynamic scenario that imitates the continuation of current policies and environmental conditions. The Current Path is therefore in congruence with historical patterns and produces a series of dynamic forecasts endogenised in relationships across crucial global systems. We use 2019 as a standard reference year and the forecasts generally extend to 2043 to coincide with the end of the third ten-year implementation plan of the African Union’s Agenda 2063 long-term development vision.
Until the early 1990s, Zimbabwe was a leader of a loose coalition of southern African countries known as the Frontline States that became the Southern African Development Coordination Conference (SADCC) in 1980 and, in 1992, was transformed into the Southern African Development Community (SADC). Zimbabwe is also a member of the Common Market for Eastern and Southern Africa (COMESA). It withdrew from the Commonwealth in 2003 and has recently applied to rejoin.
In 2019, the World Bank changed Zimbabwe’s classification from low-income to low middle-income, now one of 23 in Africa.
Zimbabweans have suffered recurring economic and political crises and a dramatic deterioration of livelihoods that have intensified sharply since the turn of the century. These crises have been catastrophic for human development and have triggered humanitarian emergencies in many parts of the country. This deterioration was not generally foreseen. After achieving independence in 1980, the Government of Zimbabwe introduced a minimum wage and tripled spending on education and health. Expenditure on public sector employment increased exponentially, however, as the size of the civil service (and debt) steadily ballooned, it squeezed out more productive investments.
The Government of Zimbabwe eventually embarked on a poorly designed and executed Economic Structural Adjustment Programme that included a 40% devaluation of the Zimbabwean dollar and the removal of price and wage controls and introduced fees for previously free education and health services.
Greater austerity had mixed results: inflation remained high as did the budget deficit. More competition (particularly from South Africa) forced many businesses to close and Zimbabwe’s manufacturing sector to contract. During three years of severe drought (1992, 1993 and 1995), average growth rates were some four percentage points below 1991, 1994 and 1996, while a global recession in 1991 and 1992 reduced raw material prices and export demand.
In November 1997, the Government of Zimbabwe agreed to a massive unbudgeted payout to war veterans, causing the Zimbabwean dollar to plunge by 70% and inflation to spiral. The following year, the Zimbabwean army entered the war in the Democratic Republic of the Congo (DR Congo), placing additional strain on an already burgeoning budget deficit.
Amid a deteriorating situation, the 2008 parliamentary and presidential elections precipitated a political and economic crisis when Morgan Tsvangirai, from the Movement for Democratic Change (MDC), won the first round but was forced to withdraw ahead of the second round, thus ceding victory to Robert Mugabe and the Zimbabwe African National Union-Patriotic Front (ZANU-PF), which had governed since 1980.
Shortly after, hyperinflation forced the government to abandon the Zimbabwean dollar. Foreign currencies – particularly the US dollar and the South African rand – were now to be used as legal tender. The termination of the government of national unity in 2013 sparked yet another economic crisis. Government debt surged and the ZANU-PF government introduced a ‘new Zimbabwean dollar’ pegged against the US dollar. With limited reserves, it almost immediately started trading at a significant discount to the US dollar. Money supply exploded and inflation increased to a monthly rate of 77%. Monetary stability has yet to be achieved.
In November 2017, then vice president Emmerson Mnangagwa assumed the presidency in a surprise ousting of Mugabe and has since championed that Zimbabwe is now ‘open for business’. In spite of the raft of painful reforms that followed, Zimbabwe is still in the throes of an economic and developmental crisis.
The Government of Zimbabwe has put forth various development plans, all of which are based on the headline Zimbabwe Vision 2030 goal of transforming Zimbabwe into an upper middle-income economy by 2030. The latest is the National Development Strategy 1, which runs from January 2021 to December 2025. The strategy aims to strengthen economic stability and achieve inclusive, sustainable, and equitable economic growth.
Home to just over 15 million people in 2019, Zimbabwe’s population is nearly as large as that of neighbouring Zambia (estimated at 17.6 million) and less than one-third the size of South Africa (estimated at 57 million). Its population has grown more than five-fold since 1950, from only 2.8 million people.
Zimbabwe’s population is projected to reach nearly 24 million by 2043. Zambia and Malawi are projected to grow slightly more rapidly, while Angola and Mozambique are expected to continue experiencing dramatic population growth. On the Current Path, the respective populations of Mozambique and Angola will each be more than double that of Zimbabwe by 2040.
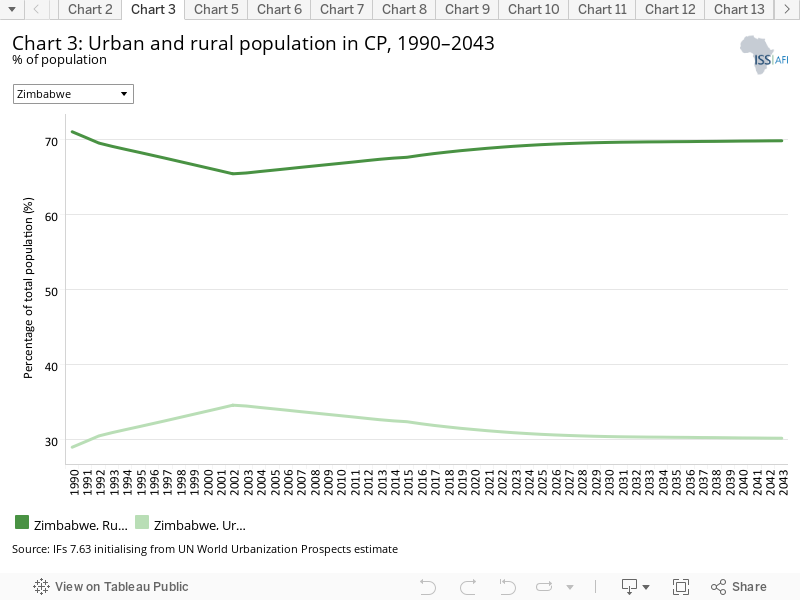
Zimbabwe is expected to remain a predominantly rural country to 2043 and beyond. At present, an estimated seven out of ten Zimbabweans live in rural areas – roughly five percentage points more rural than would be expected based on its level of development (measured as GDP per capita). In fact, Zimbabwe appears to have abruptly stopped urbanising just after the turn of the century, when about two-thirds of the population lived in rural areas.
The counter-urbanisation trend reflected in this chart, however, simplifies multiple interacting dynamics. Urban–rural migration has indeed taken place in Zimbabwe, notably as a result of disruptive policies such as the 2000 Fast Track Land Reform Programme and Operation Murambatsvina five years later. However, some researchers attribute the scale of Zimbabwe’s stalled urbanisation to the continued use of old delineations of urban, peri-urban and rural areas, asserting that sprawling populations around cities, currently classified as rural, should be considered urban.
Thus, ‘boundaries in Zimbabwe have remained static while urban sprawl and urban populations in rural jurisdictions have expanded’.
Urbanisation, if deliberate and planned, could provide Zimbabwe with many benefits including the potentially more rapid (and less costly) roll-out of services such as healthcare. However, urban infrastructure urgently needs to be upgraded given the health risks that arise from these relatively densely populated areas.
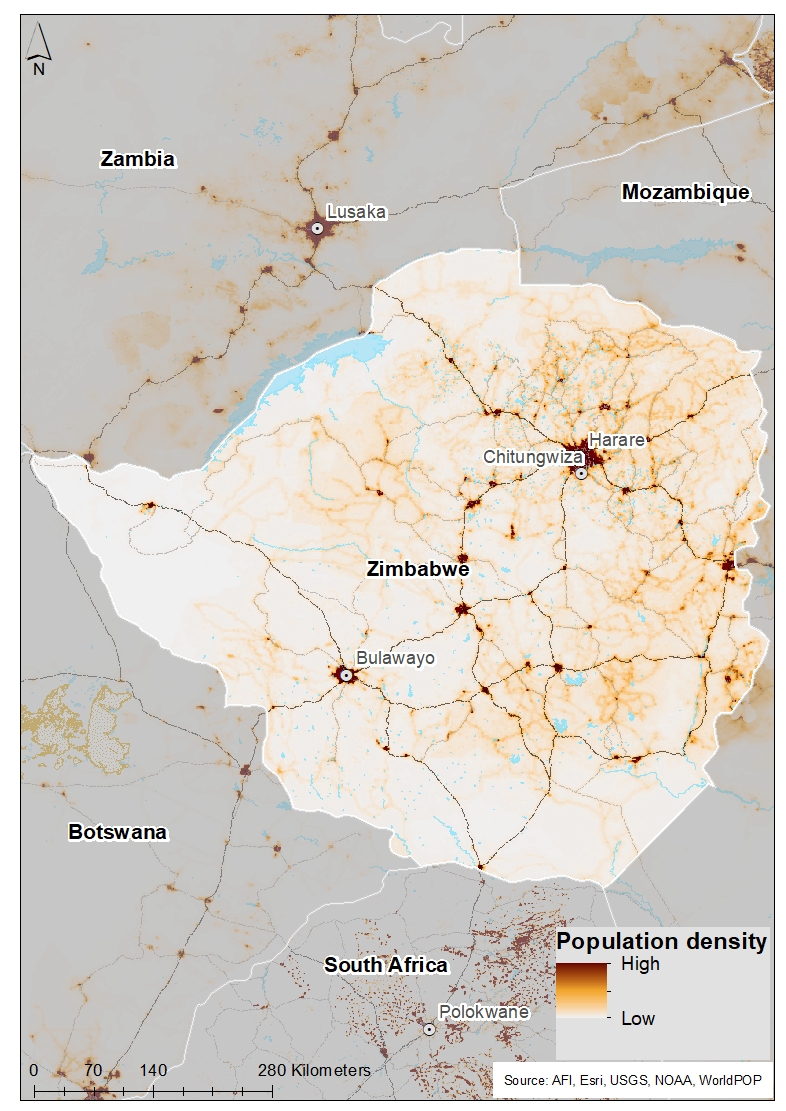
With roughly 38 people per square kilometre of land area in Zimbabwe, the nation is, on average, more sparsely populated than the average of sub-Saharan Africa (48 people per square kilometre).
The majority of Zimbabweans live in Harare and Bulawayo, the country’s largest cities. While the nation’s capital city Harare, located in the north-east, is the nation’s economic and cultural hub, Bulawayo to the south-west is Zimbabwe’s industrial centre. The Zimbabwean government estimates Harare’s population to be around 2.1 million and the smaller city of Bulawayo’s to be around 653 000.
Zimbabwe’s economy has suffered a series of intense and prolonged economic crises that have been among the worst in Africa’s recent history. Recurrent runaway inflation, dollarisation, re-dollarisation and the emergence of multiple parallel exchange rates have severely distorted the economy. At present, the country is in the midst of a monetary crisis brought about by the misuse of the real-time gross settlement (RTGS) platform that started in 2016 and the Zimbabwean government’s 2019 decision to make the RTGS dollar the sole legal tender. From March 2020 multiple foreign currencies were allowed again.
The current crisis is a far cry from the state of the economy at independence. From 1980 to 2004, Zimbabwe had the fourth largest economy in Southern Africa (South Africa, Angola and Zambia claimed the top three spots). Zimbabwe’s economy peaked in size in 1998 at US$18.6 billion before plummeting to roughly half of that (US$9.3 billion) by 2008.
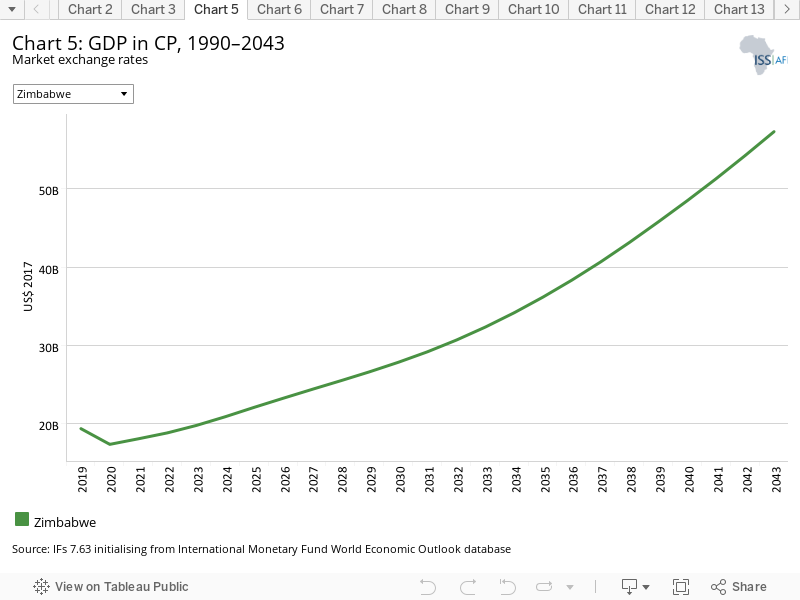
Zimbabwe also has protracted arrears with official creditors, including the World Bank, effectively blocking access to international financial support. According to data from the International Monetary Fund and the Government of Zimbabwe, the nation’s consolidated public sector debt amounted to 66.3% of GDP in 2020. Meanwhile, public and publicly guaranteed external debt equalled 64.2% of GDP. Generally, a debt level of less than 40% of GDP is considered manageable; at 60% or higher, countries head for trouble.
GDP has slowly recovered to an estimated US$19.4 billion in 2019 and will reach US$57.3 billion by 2043.
Although many of the charts in the sectoral scenarios also include GDP per capita, this overview is an essential point of departure for interpreting the general economic outlook of Zimbabwe.
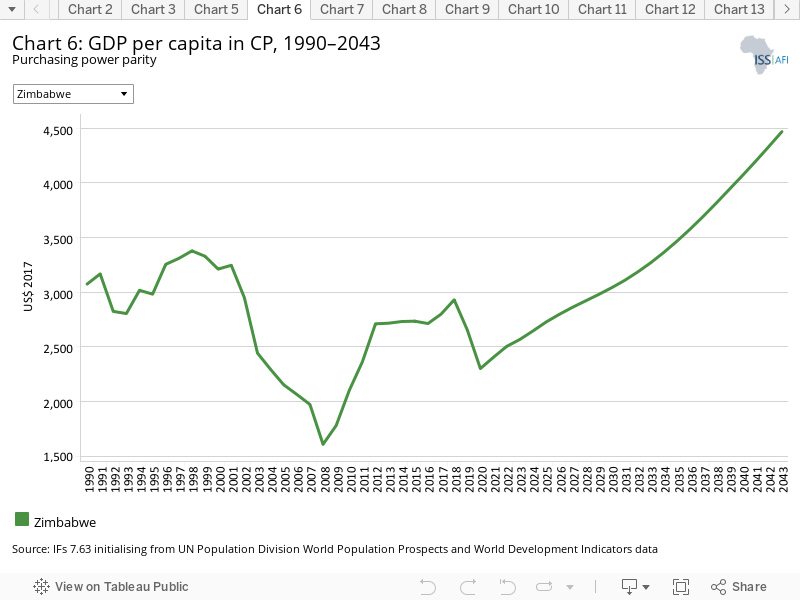
Although average incomes in Zimbabwe have been relatively stagnant for decades, they were higher than in Zambia from the mid-1980s to 2002. But from 1998 to 2008, Zimbabwe’s GDP per capita more than halved from US$3 100 to US$1 365. GDP per capita has since grown significantly to US$2 655 in 2019 but remains very low compared to regional peers. Average incomes in Zambia, for example, are now almost double than those in Zimbabwe. Meanwhile, the average income in all of lower middle-income Africa is estimated at US$6 989 in 2019 and projected to reach US$9 142 by 2043.
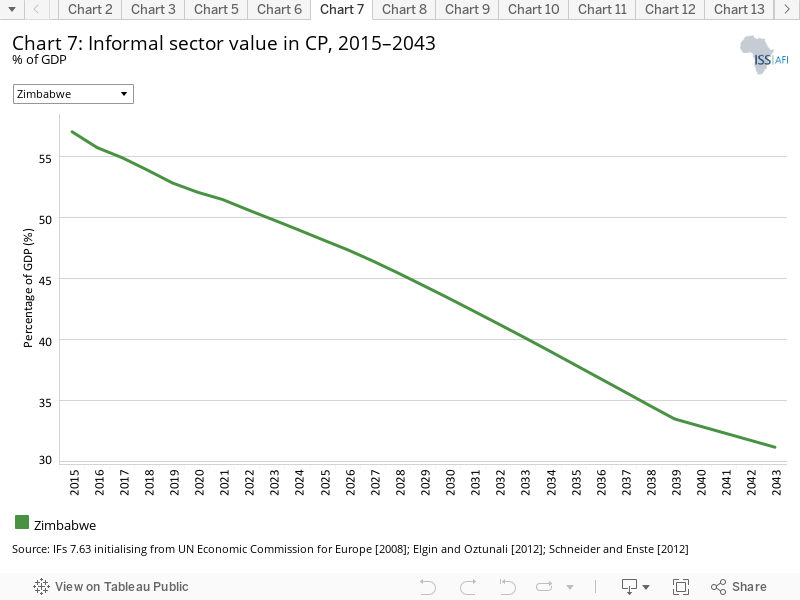
During the 2018 rebasing of the economy, Zimbabwe’s 2016 GDP increased by 40%. Finance Minister Ncube attributed the increase to the inclusion of the informal economy, a reflection of the extent to which the economy has regressed since the early 2000s.
Although many Zimbabweans eke out a living in the informal sector, generally a large informal economy reflects a stagnant or declining formal sector, which provides job security and employment benefits and contributes to government revenues through taxation. A 2018 IMF working paper suggests that Zimbabwe’s informal sector contributed an average of 61% to GDP between 1991 and 2015 and 67% in 2015 – second only to Bolivia globally. In 2019, the informal sector in Zimbabwe contributed 53% of GDP within IFs, the largest among Africa’s 23 lower middle-income countries. On the Current Path, Zimbabwe’s informal sector as a share of GDP is projected to decline to roughly 31% by 2043. However, it is important to note that data and projections on informal sectors are notoriously difficult to obtain and calculate accurately.
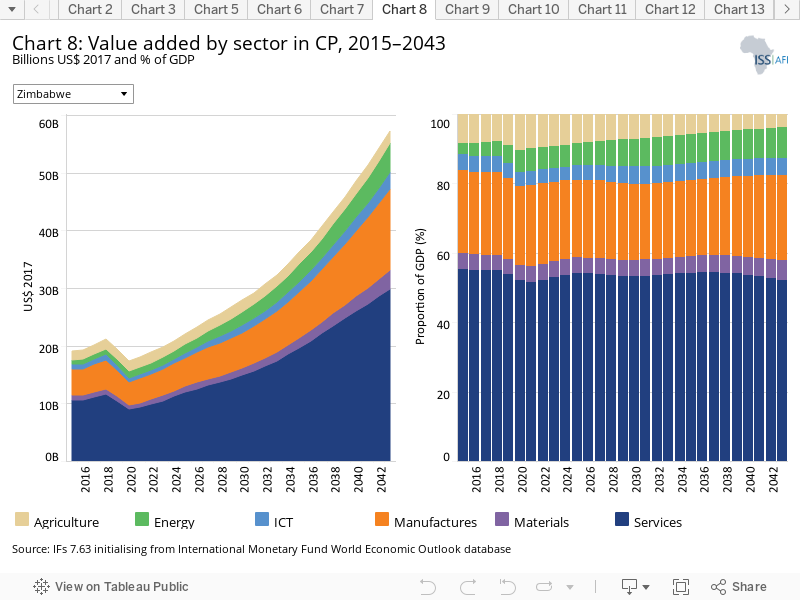
The IFs platform uses data from the Global Trade and Analysis Project (GTAP) to classify economic activity into six sectors: agriculture, energy, materials (including mining), manufactures, services and information and communication technologies (ICT). Most other sources use a threefold distinction between only agriculture, industry and services with the result that data may differ.
In 2019, services were the source of more than half (54%) of the Zimbabwean economy. Manufactures followed at just over 23%, with agriculture contributing 8.9%. Energy, ICT, and materials each contributed 5% or less to the economy. Over the forecast horizon, the contributions of energy will increase to 8.8% by 2043 with others projected to remain stable, except for agriculture’s share that is expected to contract to 3.8% by 2043. However, in absolute terms, the contributions of all sectors to the economy will grow, particularly services, from US$10.5 billion in 2019 to US$29.9 billion in 2043. The manufacturing sector will increase from US$4.5 billion in 2019 to US$14 billion. In spite of its large potential the agriculture sector was estimated at only US$1.7 billion in 2019 (8.9% of GDP). By 2043 it will constitute US$2.2 billion (3.8% of GDP).
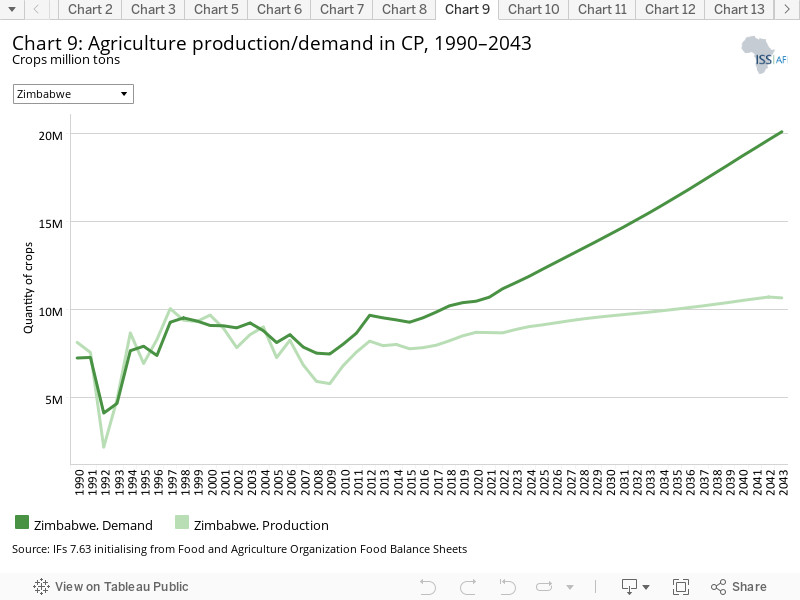
The data on agricultural production and demand in the IFs forecasting platform initialises from data provided on food balances by the Food and Agriculture Organization (FAO). IFs contains data on numerous types of agriculture but aggregates its forecast into crops, meat and fish, presented in million metric tons. Chart 9 shows agricultural production and demand as a total of all three categories.
Zimbabwe’s agriculture sector, the mainstay of the economy, has suffered decreasing productivity since the late 1970s, when it boasted yields twice the average of low-income Africa. As from 1990, yields in Zimbabwe were below the average of low middle-income Africa and, as from 2006, even below the average of low-income Africa. On the Current Path, this trend will extend into the coming decades, warning of increasing food insecurity. Poor and worsening macroeconomic conditions have further aggravated food insecurity by impeding the availability and affordability of staple foods like maize meal. By 2043, yields in Zimbabwe will be only 66% of the average of low-income Africa, and only 38% of low middle-income Africa.
Zimbabwe already relies heavily on crop imports from neighbours, with an estimated 20% of demand being met by imports. Within Southern Africa, only Botswana, Lesotho and Namibia depend more on agricultural imports.
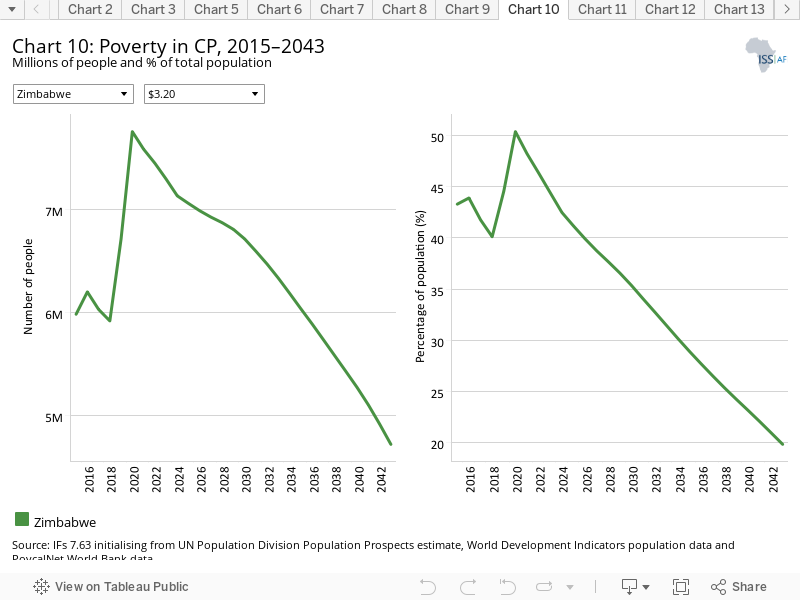
There are numerous methodologies for and approaches to defining poverty. We measure income poverty and use GDP per capita as a proxy. In 2015, the World Bank adopted the measure of US$1.90 per person per day (in 2011 international prices), also used to measure progress towards the achievement of Sustainable Development Goal (SDG) 1 of eradicating extreme poverty. To account for extreme poverty in richer countries occurring at slightly higher levels of income than in poor countries, the World Bank introduced three additional poverty lines in 2017:
- US$3.20 for lower middle-income countries
- US$5.50 for upper middle-income countries
- US$22.70 for high-income countries.
IFs estimates that nearly one out of three Zimbabweans (4.4 million people) live on less than the international extreme poverty line of US$1.90 per day. Roughly two out of five Zimbabweans (6.7 million people) are living on less than US$3.20, the extreme poverty line for lower middle-income countries. Although this poverty rate of nearly 45% will decline to 20% by 2043, 4.7 million Zimbabweans will be living in extreme poverty by 2043 on the Current Path.
A 2015 study using a nationalised household consumption-based poverty measure found that of all the provinces, Matabeleland North had the highest poverty rate of 85.7%, while in the other rural provinces it ranged from 65% to 76%.
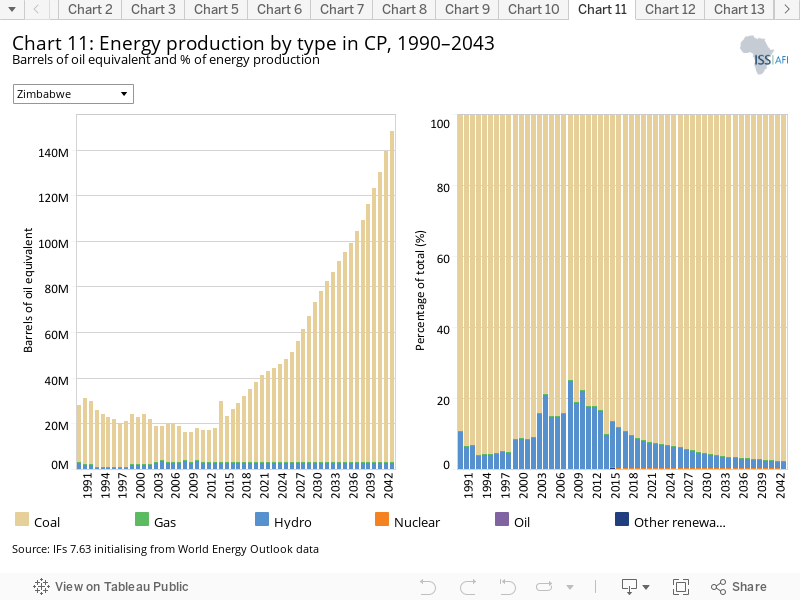
The IFs platform forecasts six types of energy, namely oil, gas, coal, hydro, nuclear and other renewables. To allow comparisons between different types of energy, the data is converted into billion barrels of oil equivalent (BBOE). The energy contained in a barrel of oil is approximately 5.8 million British thermal units (MBTUs) or 1 700 kilowatt-hours (kWh) of energy.
Total energy supply in Zimbabwe is dominated by wood, biofuels and waste, upon which the majority of the population depend for cooking and heating. However, in terms of generation by source, Zimbabwe depends on coal for 90% of its energy production and hydro for the remainder. Only about 19% of Zimbabwe’s hydropower potential has been exploited.
In 2019, Zimbabwe produced an estimated 32 million barrels of oil equivalent (MBOE) in coal, increasing to 145 MBOE (98% of energy production) in 2043. Bowing to domestic and international pressure, in 2021 China abandoned a plan to finance the US$3 billion Sengwa coal-fired power plant in Zimbabwe.
Zimbabweans also depend on hydroelectricity, particularly from the Kariba Dam on the powerful Zambezi river.
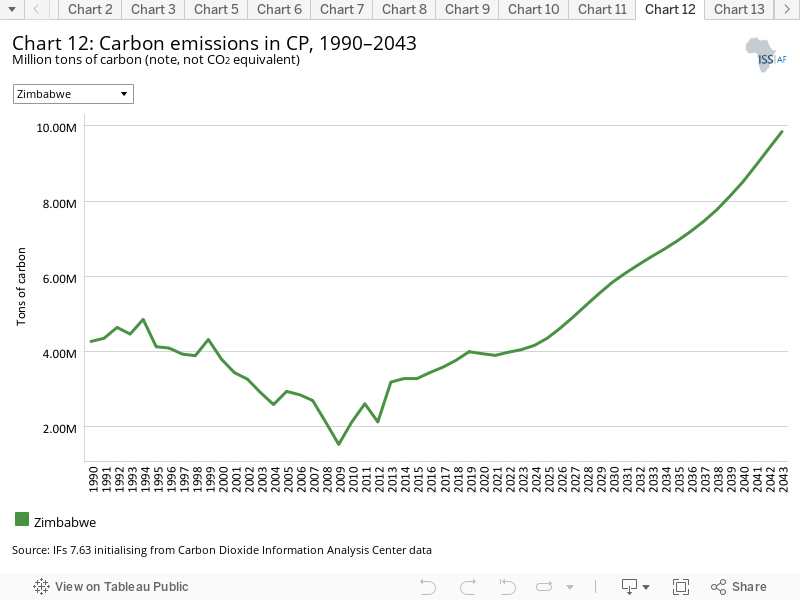
Carbon is released in many ways, but the three most important contributors to greenhouse gases are carbon dioxide (CO2), carbon monoxide (CO) and methane (CH4). Since each has a different molecular weight, IFs uses carbon. Many other sites and calculations use CO2 equivalent.
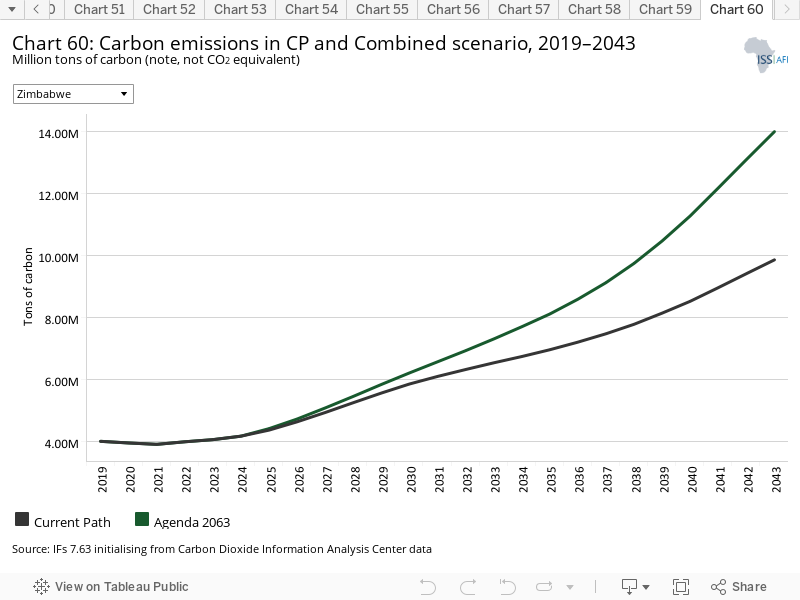
Carbon emissions in Zimbabwe peaked in 1993 at approximately 4.9 million tons and declined thereafter as economic activity declined before again starting to increase as from 2009. In 2019, Zimbabwe emitted an estimated 3.8 million tons of carbon. On the Current Path, population growth and economic growth are expected to contribute to modest increases in emissions, reaching nearly 10 million tons in 2043. However, Zimbabwe releases significantly more carbon than expected given the small size of its economy. Its emissions are on par with much larger economies such as Kenya and Côte d’Ivoire, implying significant potential for emission reductions.
Sectoral Scenarios for Zimbabwe
Download to pdfThe Stability scenario represents reasonable but ambitious reductions in risk of regime instability and lower levels of internal conflict. Stability is generally a prerequisite for other aspects of development and this would encourage inflows of foreign direct investment (FDI) and improve business confidence. Better governance through the accountability that follows substantive democracy is modelled separately.
The intervention is explained here in the thematic part of the website.
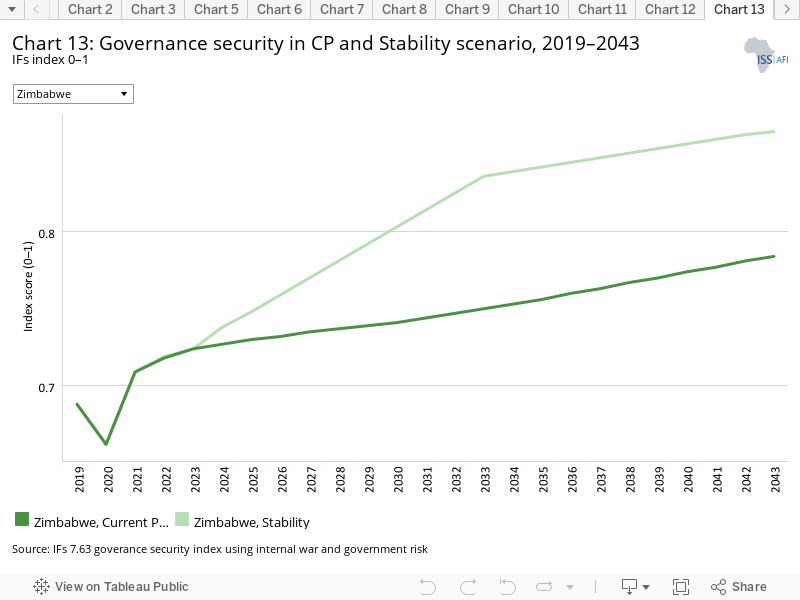
The governance security index captures the probability of internal war and vulnerability to conflict. Zimbabwe scores similarly to the average of lower middle-income Africa on this index, reflecting the country’s struggle to consolidate its democracy as it progresses from its history of state-centric command and control approach to governance.
In the Stability scenario, Zimbabwe’s score on the governance security index improves dramatically over the next decade, which would increase the country’s levels of government capacity and societal inclusion, creating a foundation for peace and economic prosperity. Conversely, on the Current Path, Zimbabwe’s score increases only modestly.
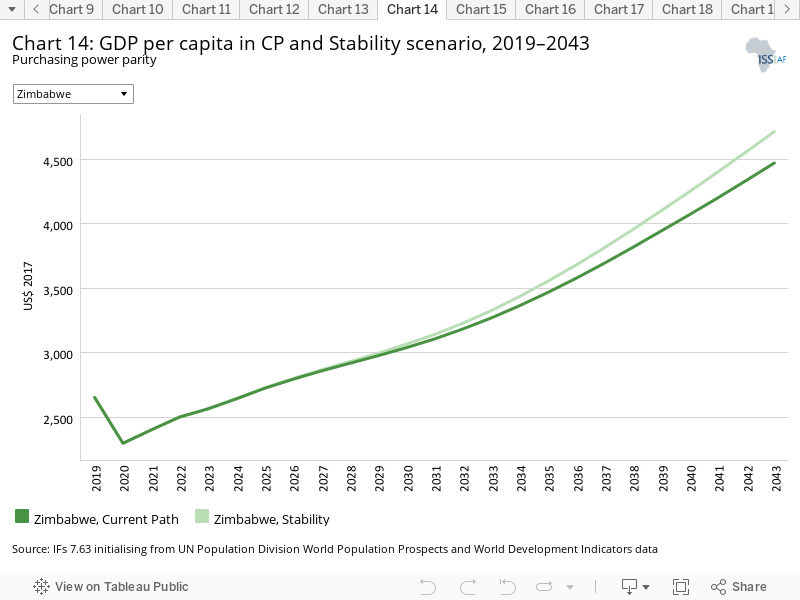
The ambitious but achievable improvements modelled in the Stability scenario result in only modest average income growth over the long term compared to the Current Path forecast. Measured using GDP per capita, average incomes reach US$4 712 by 2043 in the Stability scenario. In the Current Path forecast, average incomes only reach US$4 469.
Thus, in the Stability scenario, average incomes are US$243 greater in 2043 than on the Current Path, reflecting the modest yet positive effect of greater stability. An important reason for these limited improvements is that the FDI flows that follow more stability come from a very low base in Zimbabwe. For perspective, even in the Stability scenario, the average income in lower middle-income Africa remains more than twice that of Zimbabwe over the forecast horizon. Clearly, more than improvements in governance will be necessary to grow incomes in the country.
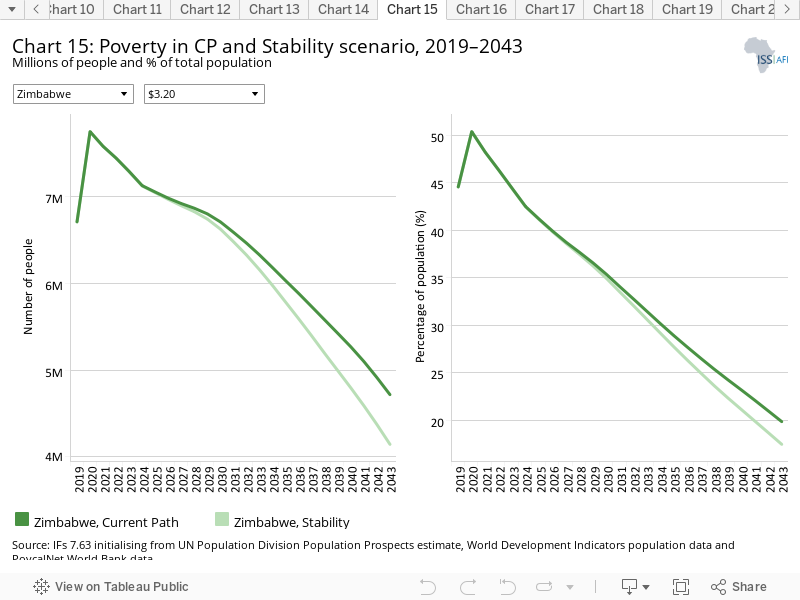
Poverty remains a critical issue across Zimbabwe, particularly in rural areas. In the Current Path forecast, both the absolute number of Zimbabweans living below the lower middle-income poverty line of US$3.20 per day and the poverty rate are projected to decrease. However, one out of five Zimbabweans (nearly 5 million people) are projected to be living in poverty by 2043 on the Current Path.
In the Stability scenario, poverty in Zimbabwe decreases slightly more rapidly to approximately 17% in 2043, or to nearly 4 million people.
As a multidimensional and extremely challenging issue, addressing poverty will require concerted efforts from the Zimbabwean government, the private sector, and international actors.
This section presents the impact of a Demographic scenario that aims to hasten and increase the demographic dividend through reasonable but ambitious reductions in the communicable-disease burden for children under five, the maternal mortality ratio and increased access to modern contraception.
The intervention is explained here in the thematic part of the website.
Demographers typically differentiate between a first, second and even a third demographic dividend. We focus here on the contribution of the size of the labour force (between 15 and 64 years of age) relative to dependants (children and the elderly) as part of the first dividend. A window of opportunity opens when the ratio of the working-age population to dependants is equal to or surpasses 1.7.
However, the existence of a favourable age structure does not automatically generate economic growth. People must also have access to clean water and sanitation facilities, sufficient food and quality education and jobs.
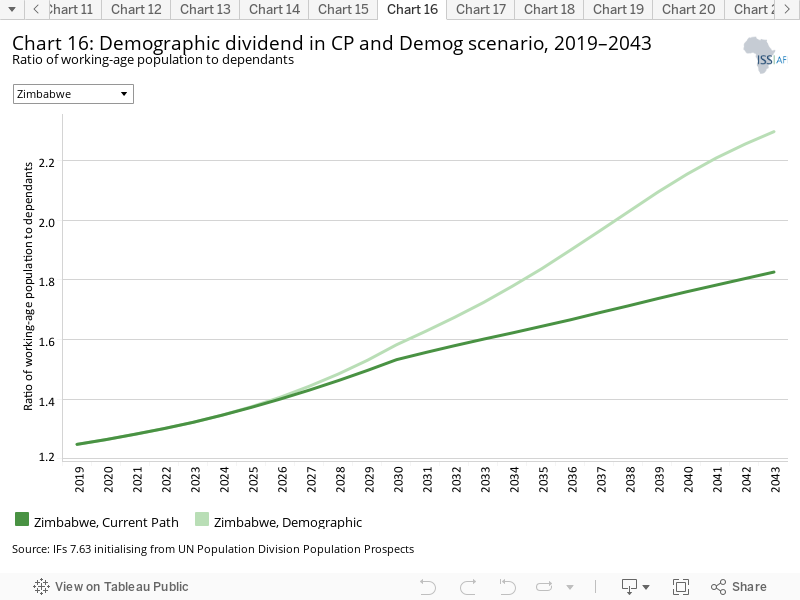
Presently, half of Zimbabwe’s population is under the age of 19, while 45% of the population is under the age of 15.
This translates into only 1.3 working-age persons (aged 15–64) for every dependant, which is fairly average for Southern Africa. This low ratio is, however, improving. By 2043, Zimbabwe is projected to have nearly 1.8 working-age persons for every dependant in the Current Path forecast. This ratio is expected to peak in 2060 at 2.2 working-age persons for every dependant – several years ahead of the average of Africa’s low-income and lower middle-income countries.
In the Demographic scenario, Zimbabwe will reach a ratio of 1.7 working-age persons for every dependant by the early 2030s — roughly five years earlier than on the Current Path.
The state of Zimbabwe’s healthcare system, infrastructure and economy suggest that in the Current Path forecast, Zimbabwe may not benefit from the economic benefits of its demographic dividend. Chronic food insecurity has resulted in high rates of hunger and malnutrition, and rather than more rapid growth, Zimbabwe may reap only the negative consequences of its youthful population structure such as the instability often associated with a large youth bulge.
In addition to access to modern contraceptives and improved basic healthcare, improving the accessibility and quality of education for girls and women is among the most widely cited strategies in countries with large dependant youth populations to accelerate the demographic transition. This is because the higher a woman’s level of educational attainment, the fewer children she is likely to have. And, in general, fewer children per woman and delayed childbearing and marriage translates into more resources available for education and health per child.
The infant mortality rate is the number of infant deaths per 1 000 live births and is an important marker of the overall quality of the health system in a country.
The HIV/AIDS epidemic has had devastating consequences for health in Zimbabwe, its impact clear across most health indicators, including infant mortality. Because the effects of the epidemic are long term, the effect is visible when comparing trends in Zimbabwe with its regional and income peers that were less affected by the epidemic.
Historically, Zimbabwe has had lower infant mortality rates than its regional and income peers, suggesting a healthier population, but has steadily been losing ground. From 1960 to 1990, the infant mortality rate declined from 100 to 59 deaths per 1 000 live births, coinciding with a reduction in the global average infant mortality rate over this period. Over this same period, the average infant mortality rates in the rest of Southern Africa and in other lower middle-income African countries were substantially higher, though also declining.
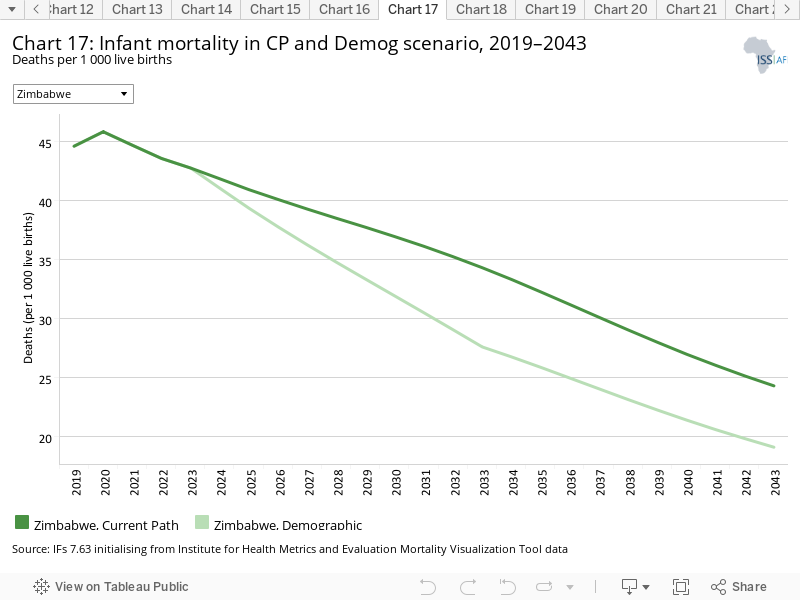
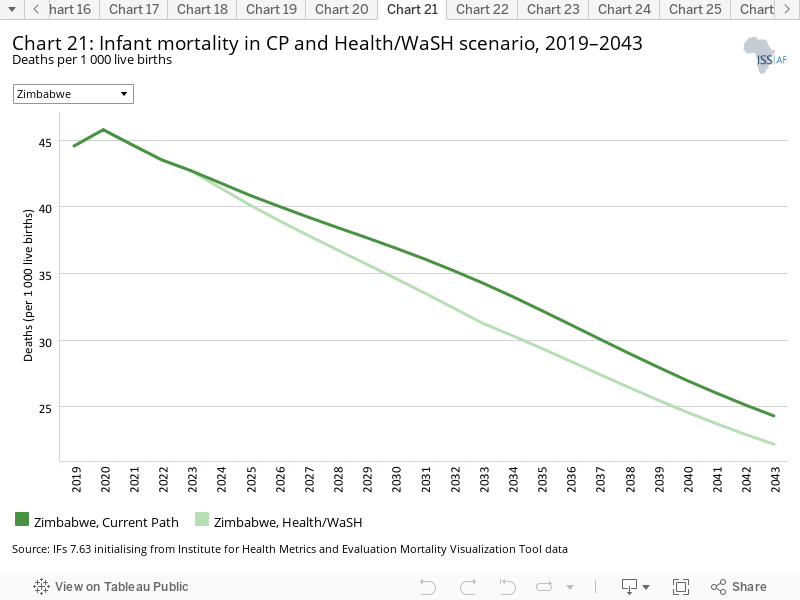
But from 1990 until 2000, Zimbabwe’s infant mortality rate rose to 66 deaths per 1 000 live births before beginning to improve again slowly. In 2019, infant mortality was 45 per 1 000 live births – among the 30 highest infant mortality rates in the world. By 2043, infant mortality in Zimbabwe is projected to decline to 24 deaths per 1 000 live births (roughly the same as in low-income and lower middle-income Africa).
In the Demographic scenario, Zimbabwe’s infant mortality rate decreases more rapidly to 19 deaths per 1 000 live births, indicating the progress that could be achieved with lower child and maternal mortality and increased contraceptive use.
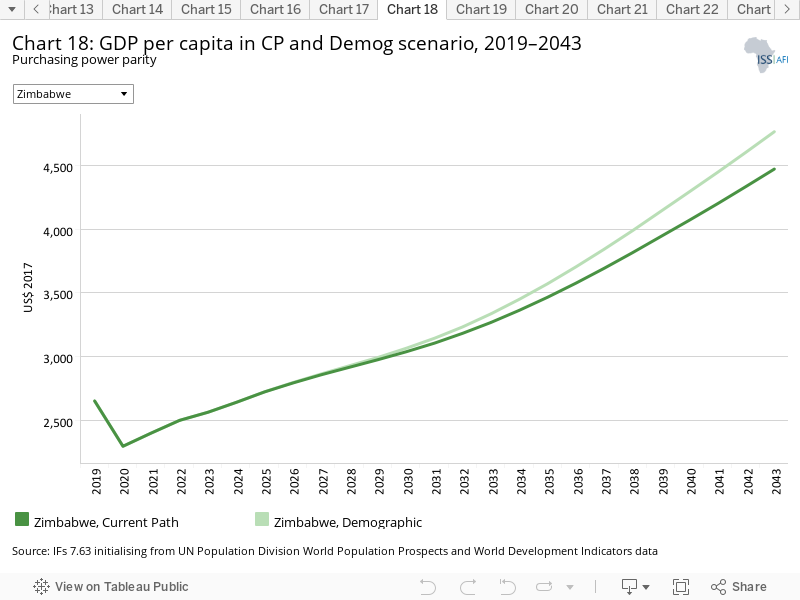
Average incomes in Zimbabwe are far lower than the average in lower middle-income Africa. On the Current Path, the average income in Zimbabwe will reach US$4 469 by 2043 — still far below its income peers.
GDP per capita in Zimbabwe grows more rapidly in the Demographic scenario, but only slightly. By 2043, GDP per capita reaches US$4 761 in the Demographic scenario — only US$292 greater than the Current Path forecast for that year. Indeed, Zimbabwe’s ailing economy and widespread poverty require dramatic interventions that span across sectors; changes in healthcare policy and infrastructure alone will not suffice but are a good starting point.
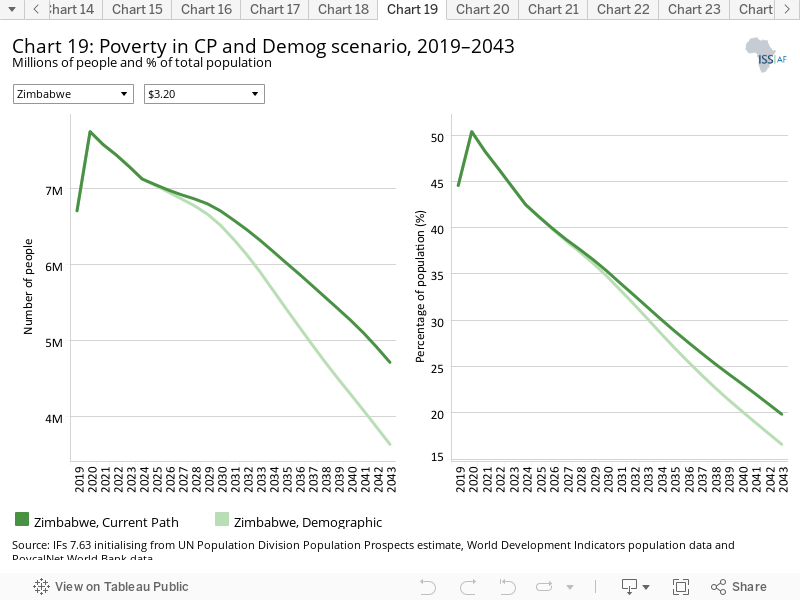
More than four out of every five Zimbabweans (6.7 million people) live below the lower middle-income poverty line of US$3.20 per day. On the Current Path, the number of poor Zimbabweans will fall to 4.7 million by 2043, or one out of every five people.
In the Demographic scenario, poverty falls more rapidly to 3.6 million people by 2043 — approximately 17% of the population. While any amount of poverty warrants concern and immediate action, it is not insignificant that there are one million fewer Zimbabweans living in poverty by 2043 in the Demographic scenario than on the Current Path. Improving access to healthcare (particularly reproductive healthcare) and reducing the communicable-disease burden — which is significant in Zimbabwe — is an effective starting point to address poverty.
This section presents reasonable but ambitious improvements in the Health/WaSH scenario, which include reductions in the mortality rate associated with both communicable diseases (e.g. AIDS, diarrhoea, malaria and respiratory infections) and non-communicable diseases (NCDs) (e.g. diabetes), as well as improvements in access to safe water and better sanitation. The acronym WaSH stands for water, sanitation and hygiene.
The intervention is explained here in the thematic part of the website.
The HIV/AIDS epidemic has had devastating consequences for health in Zimbabwe, and its impact is most evident in Zimbabwe’s historical life expectancy. In 1980, Zimbabwe’s life expectancy of 59 years ranked eighth highest in Africa, above even countries such as Egypt and Algeria. By 2019, Zimbabwe’s life expectancy had fallen to the 46th highest in Africa, although AIDS-related death rates peaked in 2003/04 and have come down rapidly thereafter.
From the beginning of the epidemic in the mid-1980s to 2000, Zimbabwe suffered the highest HIV/AIDS death rate in the world. In 1985, average life expectancy began to decline, reaching a low of 46 years (among the lowest in the world) in 2000 before beginning to recover, thanks in part to the establishment of HIV counselling centres in 1999.
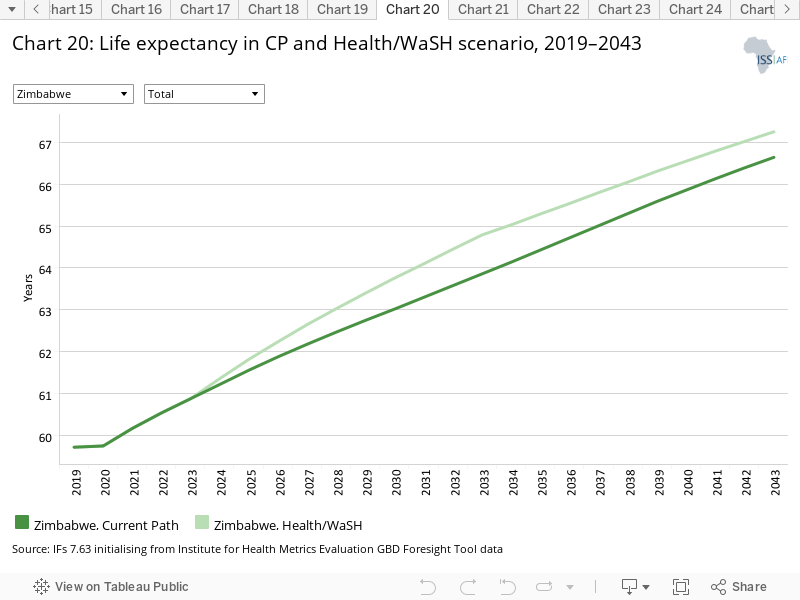
Zimbabwe’s 2019 estimated life expectancy of 59.7was four years below the average for low-income and almost eight years below the average for lower middle-income countries in Africa.
On the Current Path, life expectancy in Zimbabwe is projected to improve at a similar rate to low-income and lower middle-income Africa in the coming decades, reaching 66 years by 2043 compared to 71 years average for low and 73 years for low middle-income African countries. The improved health outcomes and basic infrastructure in the Health/WaSH scenario have a negligible impact on life expectancy in Zimbabwe, evidencing the need for a more comprehensive approach to addressing health issues in the country.
Infant mortality is a critical indicator of the health of a society. In 2019, infant mortality was 45 per 1 000 live births in Zimbabwe – ranking it at 19th highest globally. In the Current Path forecast, infant mortality in Zimbabwe is projected to decline to 22 deaths per 1 000 live births by 2043 (slightly above the Current Path forecast for low-income Africa at 21 deaths but below the average of low middle-income countries in Africa at 30 deaths). In the Health/WaSH scenario, infant mortality declines by two deaths in 2043 compared to the Current Path forecast for that year but remains high. For example, Zimbabwe’s infant mortality rate only falls to the 2019 average rate for upper middle-income Africa (30 deaths per 1 000 live births) by 2037 in the Health/WaSH scenario.
The Agriculture scenario represents reasonable but ambitious increases in yields per hectare (reflecting better management and seed and fertiliser technology), increased land under irrigation and reduced loss and waste. Where appropriate, it includes an increase in calorie consumption, reflecting the prioritisation of food self-sufficiency above food exports as a desirable policy objective.
The intervention is explained here in the thematic part of the website.
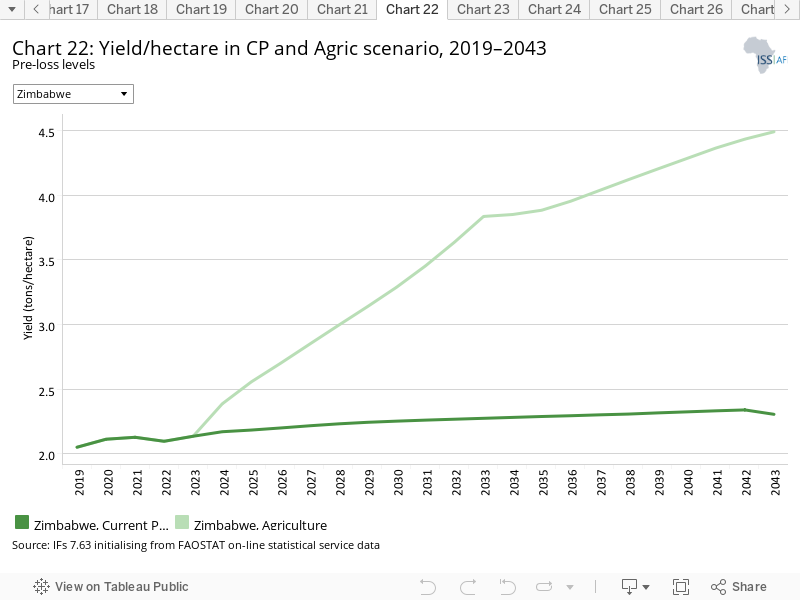
The data on yield per hectare (in metric tons) is for crops but does not distinguish between different categories of crops.
At an estimated 2.05 metric tons per hectare in 2019, Zimbabwe’s yields are among the lowest in Africa and have been below the average of low-income Africa since 2005. Average yields in other lower middle-income countries in Africa are more than double that in Zimbabwe. In the Current Path forecast, yields are projected to remain stagnant to 2043 and beyond, although droughts will continue to cause sharp fluctuations in both yield and total agricultural production.
In the Agriculture scenario, Zimbabwe’s average yields double by the late-2030s, and reach 4.5 metric tons per hectare by 2043. While this marks a substantial improvement over the Current Path forecast, it remains lower than the average of lower middle-income Africa throughout the forecast horizon. The impact on total agricultural production is, however, substantial. Instead of 10.6 million metric tons of crops, meat and fish, Zimbabwe will produce 19.4 million tons. Instead of an agriculture sector that contributes US$2.2 billion to the economy in 2043, the contribution will be US$4 billion.
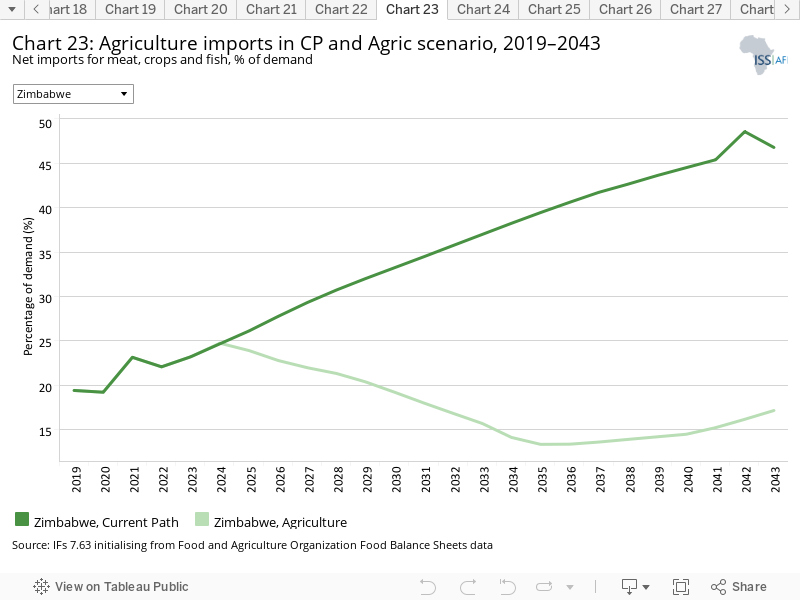
Zimbabwe relies on 20% of demand being met by food imports from neighbours to meet demand. Within Southern Africa, only Botswana, Lesotho and Namibia depend more on agricultural imports. And the Current Path forecast is alarming: as the Zimbabwean population continues to grow, agricultural production stagnates and climate change negatively affects crop production. As a result, Zimbabwe will rely increasingly on imported food. On the Current Path, by 2045, Zimbabwe will need to import food to meet half of demand — this from a country once considered the breadbasket of the region.
Conversely, in the Agriculture scenario, Zimbabwe’s agricultural import dependence decreases, falling to approximately 13% in 2034 before rising slightly to 17% by 2043. This significant decrease in agricultural import dependence shows that focusing on revitalising the agriculture sector and meeting the food needs of Zimbabweans is well worth it.
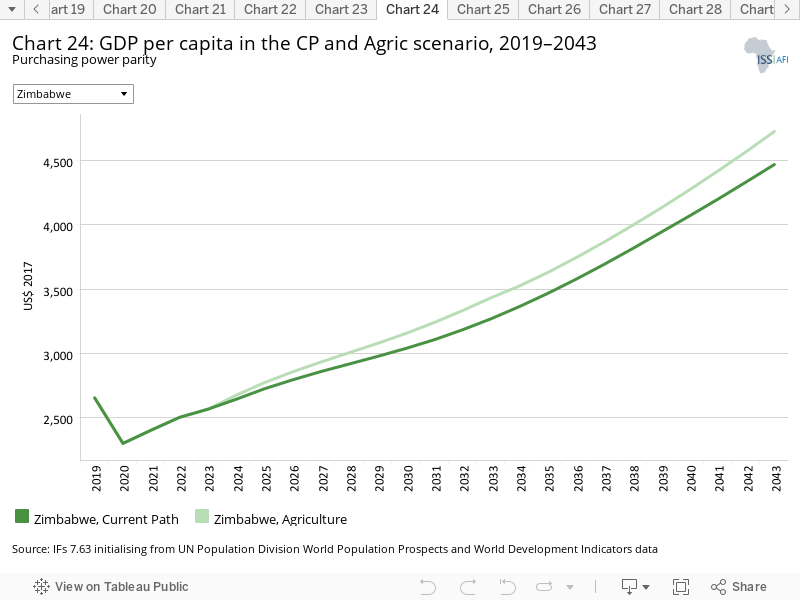
In the Current Path forecast, average incomes in Zimbabwe grow from their 2019 estimate of US$2 655 to US$4 469 by 2043. Because Zimbabwe has such a large informal sector, the impact of the Agriculture scenario on GDP per capita in Zimbabwe is modest — it increases only to US$4 725 by 2043 — or US$256 (6% above the 2043 Current Path forecast). This represents a minor improvement over the Current Path, and, compared to the average of lower middle-income Africa, which comes off a much higher base, is modest. With an average GDP per capita of US$6 989 in 2019, average incomes in lower middle-income Africa are significantly higher than those in Zimbabwe and the impact of the Agriculture scenario larger.
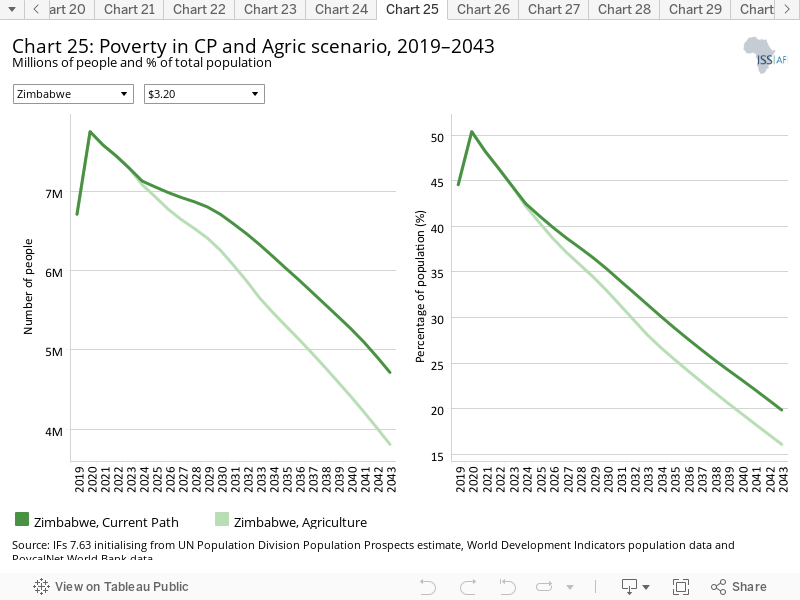
Poverty remains a widespread phenomenon in Zimbabwe, especially outside of the few main cities. On the Current Path, Zimbabwe’s 2019 poverty rate of 45% will decline to 35% by 2030 and 20% by 2043. In the Agriculture scenario, the poverty rate falls more quickly, reaching 16% by 2043. This translates into approximately 400 000 fewer Zimbabweans living on less than US$3.20 per day in 2030, and almost a million fewer Zimbabweans in 2043. The dramatic impact of this scenario on poverty reflects how interconnected the Zimbabwean economy is with the agriculture sector, and the extent to which Zimbabwe’s most vulnerable populations depend on subsistence agriculture.
The Education scenario represents reasonable but ambitious improved intake, transition and graduation rates from primary to tertiary levels and better quality of education. It also models substantive progress towards gender parity at all levels, additional vocational training at secondary school level and increases in the share of science and engineering graduates.
The intervention is explained here in the thematic part of the website.
For many years, relatively high levels of education offered a bright but fragile hope for Zimbabwe’s development. That hope has faded in recent years, although, in 2019, the average Zimbabwean adult (15 years and older) had completed eight years of education — 1.4 years more than his/her counterpart in other lower middle-income African countries.
Additionally, Zimbabwe has achieved gender parity in primary and secondary enrolment, marking a dramatic improvement since the 1980, when male learners far outnumbered female learners, particularly in secondary and tertiary school.
In the Southern African Development Community (SADC), only Botswana, South Africa, the Seychelles and Mauritius (all upper middle-income or high-income economies with GDP per capita between six and 14 times larger than that of Zimbabwe) currently have more educated populations. Globally, other countries with roughly eight years of education in the adult population include Portugal and Turkey, where GDP per capita is roughly 14 and 12 times higher, respectively, although the quality of education provided is much higher.
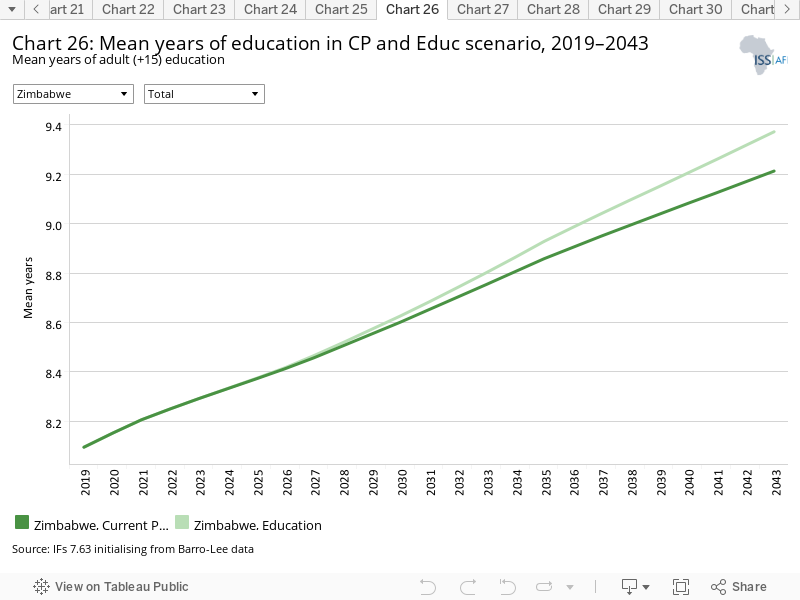
Current Path forecasts of educational attainment are positive. The average number of years of education among the population 15 years and older is expected to increase from eight years in 2019 to 8.6 years in 2030 and just over nine years in 2043. And overall, a greater portion of Zimbabweans will attain higher levels of education in 2043 than in 2019.
In the Education scenario, the average Zimbabwean adult will have attained 9.4 years of education by 2043, marking only a minor improvement over the Current Path forecast. More than improved educational outcomes will be needed to dramatically impact education levels in the country, including better basic infrastructure for schools and universities and greater food and economic security to enable young learners to attend school.
Following the introduction of free compulsory primary and secondary education after independence in 1980, Zimbabwe’s education system has been a source of pride, but has endured multiple challenges owing to economic, political and monetary crises, and now appears to be on a downward trend.
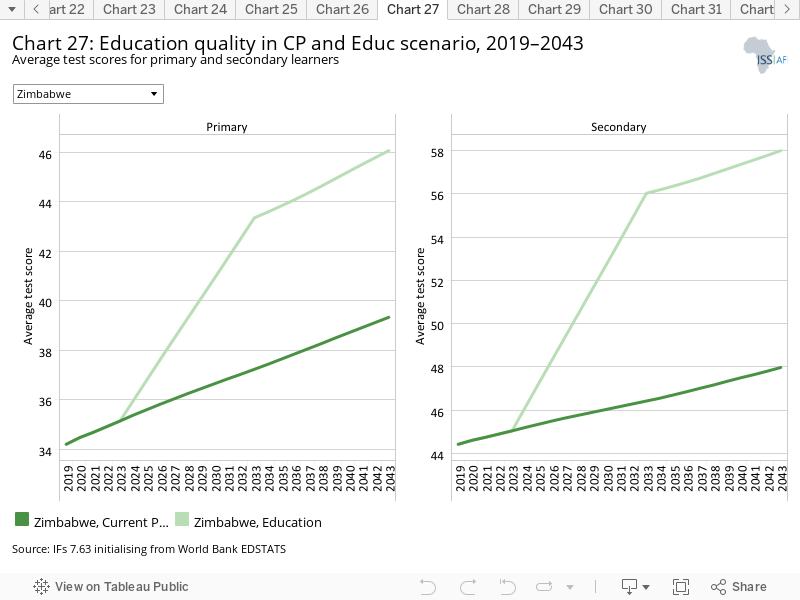
Average test scores for primary and secondary learners in Zimbabwe are, however, still above the average of lower middle-income Africa. On the Current Path, these test scores will improve only slightly out to 2043. Conversely, they increase significantly in the Education scenario (by 17% above the Current Path forecast in 2043 for primary and 21% for secondary).
Indeed, Zimbabwe performs well in education compared to its income peers — and even compared to the global standard. The Zimbabwe National Statistics Agency (ZimStat) estimates that Zimbabwe had a literacy rate of 94% in 2017 — a bit higher than the IFs estimate of 90%, which would make it the sixth highest in Africa and markedly higher than the average of upper middle-income Africa (86%). About 12% of Zimbabwe’s population of 15 years and older has either no education or incomplete primary education, which is excellent when compared to other lower middle-income Africa (30%).
However Zimbabwe’s education system faces many difficulties. For example, many parents cannot afford the fees needed for secondary school. Additionally, with high levels of skilled outward migration, Zimbabwe’s ratio of qualified teachers to learners has steadily declined over time, an important contributor to the recent decline in the quality of education outcomes in the country. The trend is compounded by underinvestment, poor infrastructure, corruption and low morale.
After the 2008 economic crisis, teachers went on strike for an entire year; 94% of rural schools closed and those that remained open had an average 20% attendance rate. Absenteeism is rife and according to the Progressive Teachers Union of Zimbabwe, many teachers have left the country, emigrating mostly to Botswana, South Africa and Namibia. The crisis continues since Zimbabwe’s cash shortage has plunged the country into financial disarray and teachers are demanding pay in US dollars. Beginning in February 2022, after long months of school closures owing to the COVID-19 pandemic, teachers across the country went on strike again. As of early March 2022, the Government of Zimbabwe had not come to a resolution with the multiple teachers unions demanding a living wage and basic rights such as running water at schools.
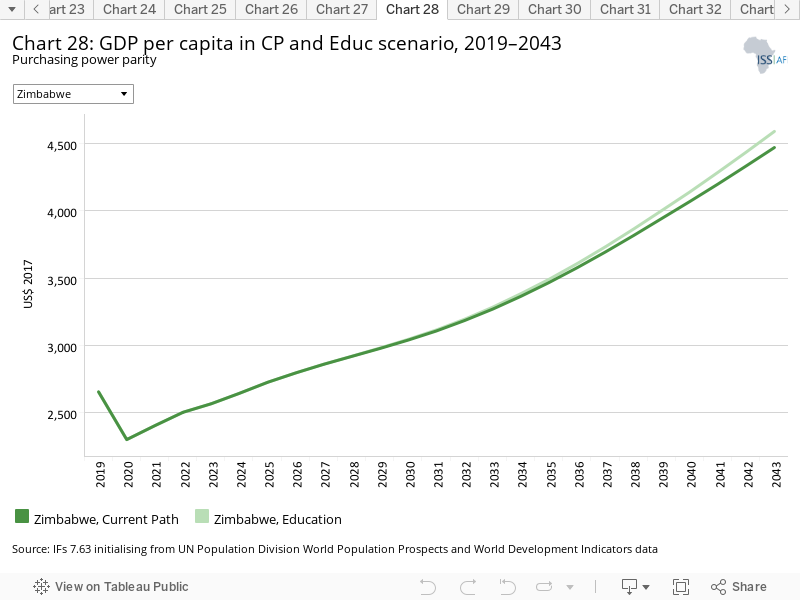
On the Current Path, the average GDP per capita in Zimbabwe rises from the 2019 estimated average of US$2 655 to US$3 040 by 2030 and US$4 469 by 2043. In the Education scenario, average incomes in Zimbabwe increase but negligibly given the inertia in the system. Even by 2043, the average Zimbabwean would only be earning US$120 more in the Education scenario than on the Current Path. Clearly, a cross-sectoral approach to improving livelihoods in Zimbabwe is necessary.
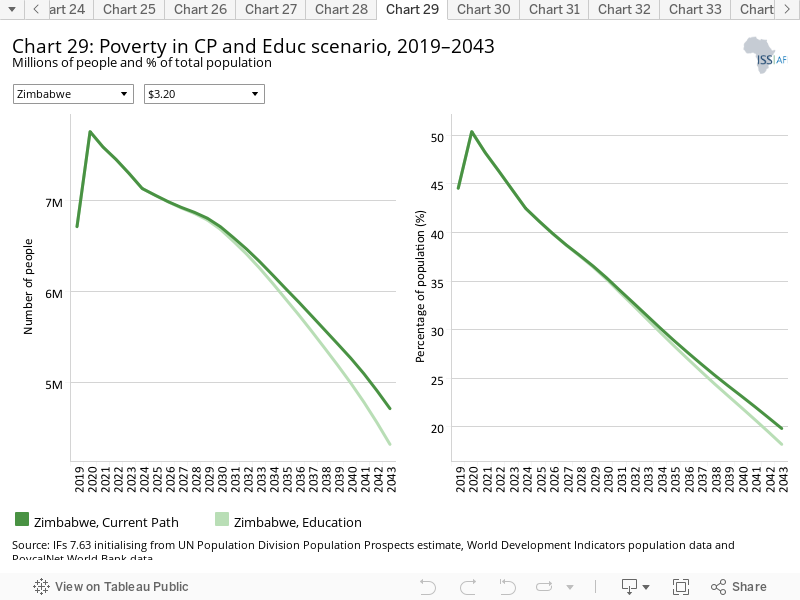
Dire poverty, particularly outside of the cities, is among Zimbabwe’s most pressing and complex challenges. In 2019, approximately 45% of the Zimbabwean population lived below the poverty line for lower middle-income countries (US$3.20 per day). On the Current Path, this rate falls to 20% — one out of every five people — by 2043.
The improved educational outcomes modelled in the Education scenario help to accelerate poverty reduction, but only over the long term. By 2043, the poverty rate falls to roughly 18% by 2043 in the Education scenario — about two percentage points lower than the Current Path. This means that, in 2043, there would be approximately 400 million fewer people living below the poverty line in Zimbabwe. The Education scenario thus positively impacts livelihoods in Zimbabwe but is not sufficient to dramatically reduce poverty in the country.
The Manufacturing/Transfers scenario represents reasonable but ambitious manufacturing growth through greater investment in the economy, investments in research and development, and promotion of the export of manufactured goods. It is accompanied by an increase in welfare transfers (social grants) to moderate the initial increases in inequality that are typically associated with a manufacturing transition. To this end, the scenario improves tax administration and increases government revenues.
The intervention is explained here in the thematic part of the website.
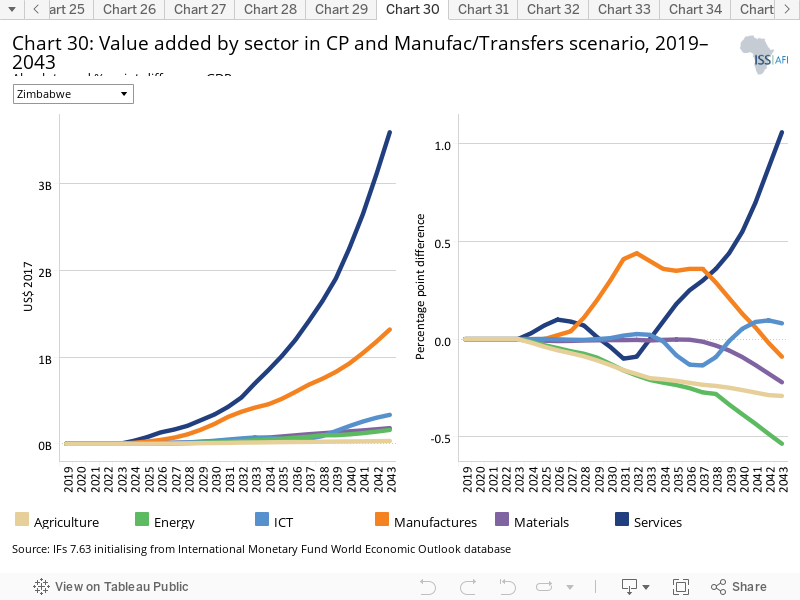
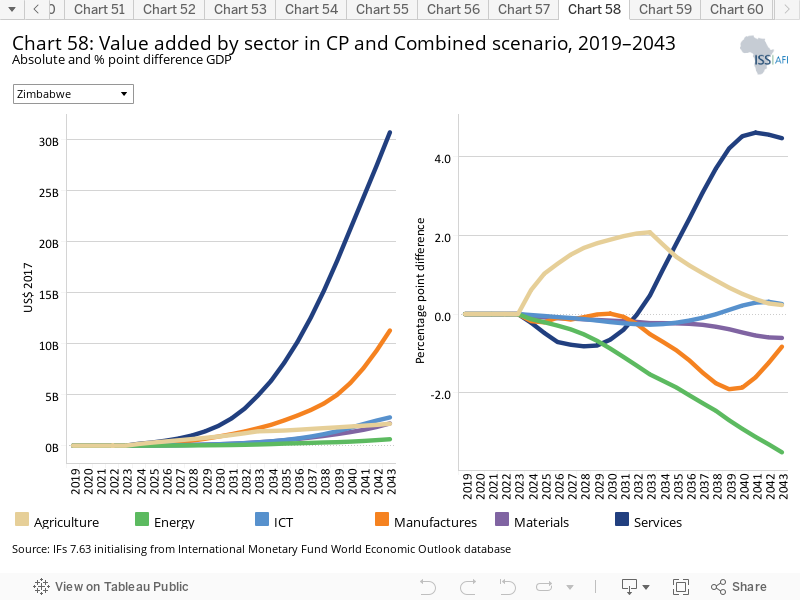
Chart 30 should be read with Chart 8 that presents a stacked area graph on the contribution to GDP and size, in billion US$, of the Current Path economy for each of the sectors.
In the Manufacturing/Transfers scenario, the contribution of manufacturing to GDP grows the most relative to the Current Path forecast: by the early 2030s, manufacturing contribute roughly half of a percentage point more (US$300 million) to the economy than on the Current Path. However, in the long term, the contribution of services to GDP grows the most, experiencing the biggest leap from the late-2030s onward: by 2043, services contribute approximately one percentage point more (US$3.6 billion) to the economy than on the Current Path. Conversely, the value added of Zimbabwe’s agriculture and energy sectors falls by a quarter of a percentage point and a half of a percentage point, respectively, in the Manufacturing/Transfers scenario compared to the Current Path.
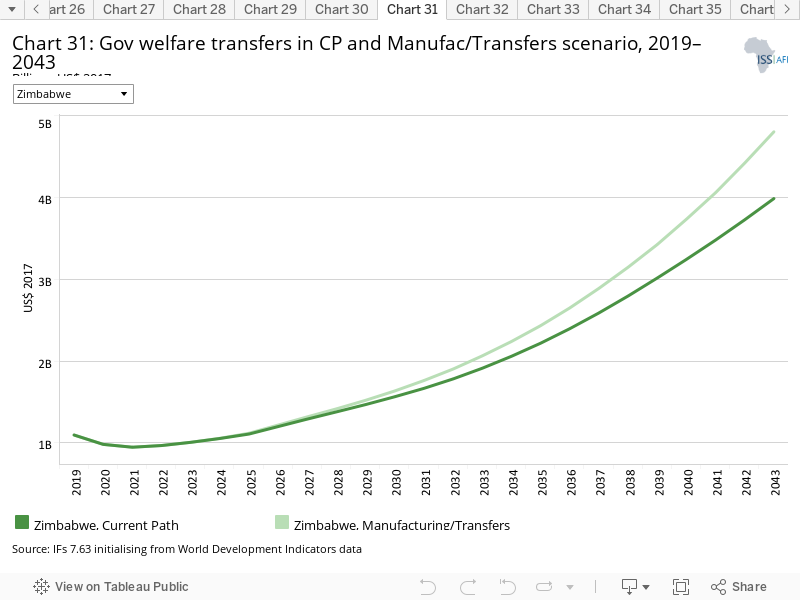
A substantial body of literature evidences the efficacy of cash transfer programmes to combat poverty. In the Manufacturing/Transfers scenario, cash transfers from the Zimbabwean government to vulnerable populations grow from roughly U$1.1 billion in 2019 to US$1.6 billion in 2030 and US$4.8 billion in 2043. Conversely, on the Current Path, transfers reach a maximum of only US$4 billion.
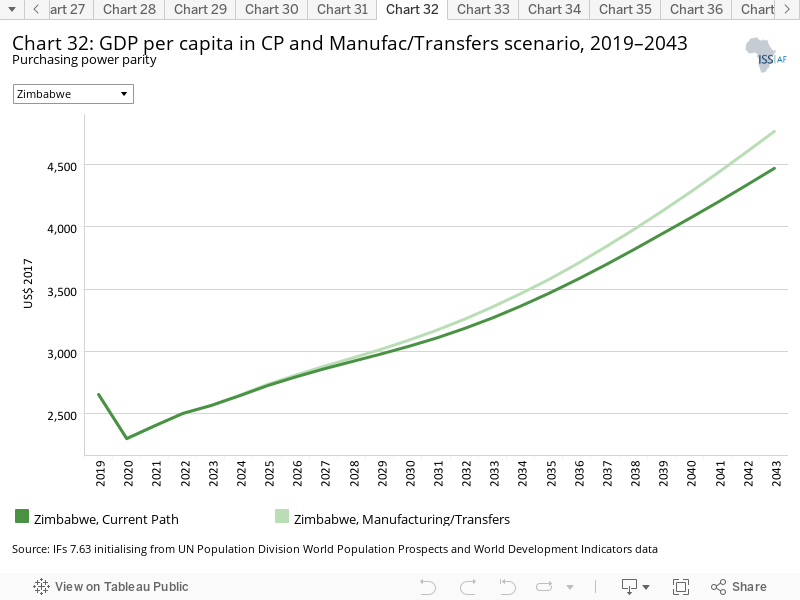
In the Current Path, Zimbabwe’s average incomes reach US$3 040 by 2030 and US$4 469 by 2043. In the Manufacturing/Transfers scenario, average incomes in Zimbabwe increase more rapidly than on the Current Path, reaching US$3 089 by 2030 and US$4 765 by 2043 — roughly US$300 greater than the Current Path forecast for that year.
The modest impact of the Manufacturing/Transfers scenario on livelihoods in Zimbabwe reflects, among other issues, the dire state of the Zimbabwean economy, including the challenge of improving productivity in an economy dominated by the informal service sector in urban areas and subsistence farming. Indeed, even in the Manufacturing/Transfers scenario, the average Zimbabwean earns approximately half of his/her average counterpart in lower middle-income Africa.
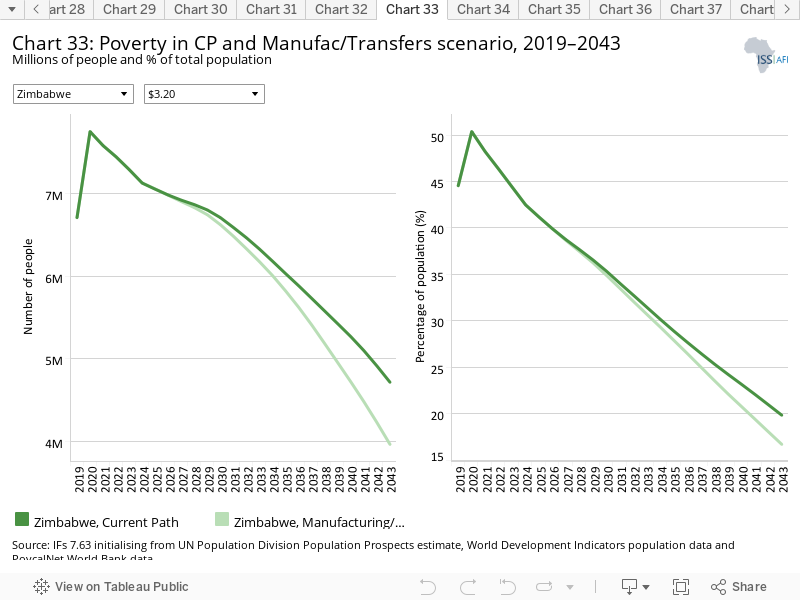
On the Current Path, Zimbabwe’s 2019 estimated poverty rate of 45% will decrease slowly to 20% by 2043. In the Manufacturing/Transfers scenario, the number of people in Zimbabwe living on less than US$3.20 per day — the poverty rate for lower middle-income countries — falls more rapidly, decreasing to approximately 4 million people (17%) by 2043, compared to the Current Path forecast of 4.7 million people for that year.
While the Manufacturing/Transfers scenario helps to alleviate poverty in Zimbabwe, a more concerted, whole-of-government approach to addressing poverty in Zimbabwe is necessary.
The Leapfrogging scenario represents a reasonable but ambitious adoption of and investment in renewable energy technologies, resulting in better access to electricity in urban and rural areas. The scenario includes accelerated access to mobile and fixed broadband and the adoption of modern technology that improves government efficiency and allows for the more rapid formalisation of the informal sector.
The intervention is explained here in the thematic part of the website.
Fixed broadband includes cable modem Internet connections, DSL Internet connections of at least 256 KB/s, fibre and other fixed broadband technology connections (such as satellite broadband Internet, ethernet local area networks, fixed-wireless access, wireless local area networks, WiMAX, etc.).
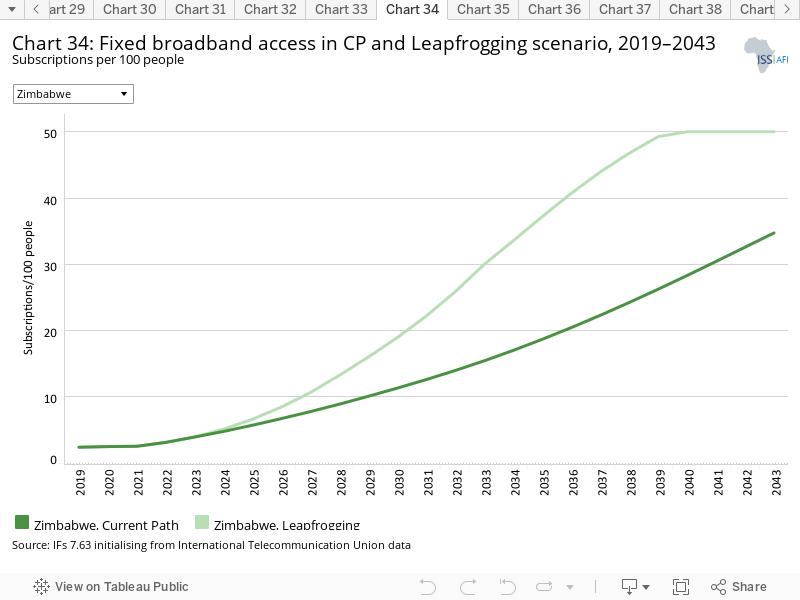
Broadband subscriptions are critical for economic growth, regional integration, and human development more broadly. In Zimbabwe, they are quite limited, with approximately 2.5 fixed broadband subscriptions per every 100 Zimbabweans in 2019. Lower middle-income African countries, meanwhile, had an average of 3.7 fixed broadband subscriptions per every 100 people. Subscription rates in neighbouring Zambia only slightly exceeded Zimbabwe’s at 2.8 subscriptions per every 100 people. In Zimbabwe, subscriptions increase only modestly on the Current Path, reaching 35 subscriptions for every 100 people by 2043. The Leapfrogging scenario features a much more rapid uptake of this technology, with 19 subscriptions for every 100 people in 2030 and 50 by 2040.
Mobile broadband refers to wireless Internet access delivered through cellular towers to computers and other digital devices.
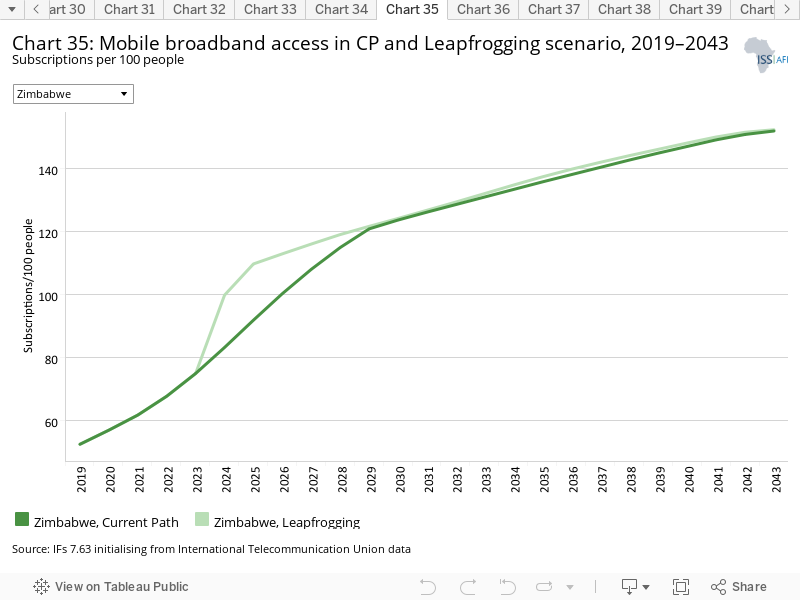
With an estimated 53 mobile broadband subscriptions per 100 people in 2019, Zimbabwe is on par with the average of lower middle-income countries in Africa. Mobile broadband subscriptions have the potential to improve the quality of life of vulnerable or marginalised populations who have little access to health, educational, and economic resources. On the Current Path, mobile broadband subscriptions increase fairly rapidly in Zimbabwe — a reflection of the generally rapid uptake of technology in many developing countries. In the Leapfrogging scenario, mobile broadband subscriptions increase dramatically in the short term before levelling off at saturation levels as rates get to above 120 subscriptions per 100 people.
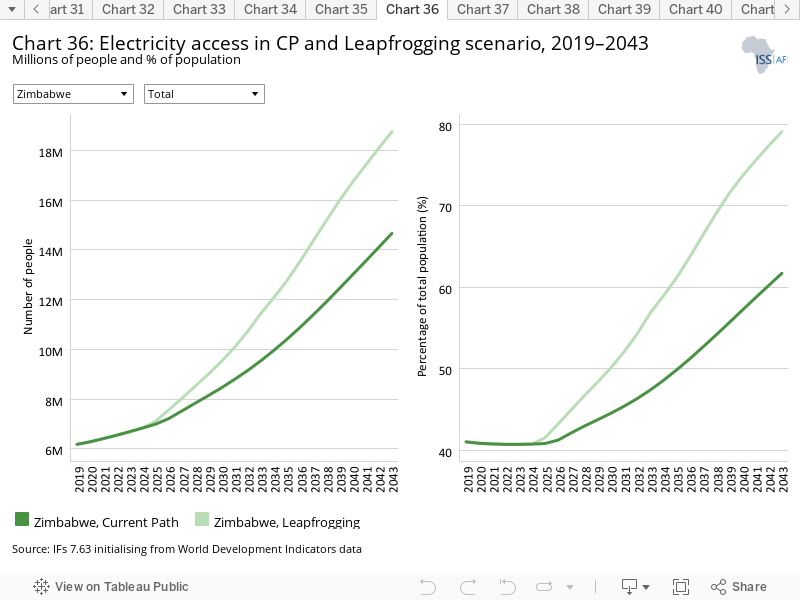
Zimbabwe has significant backbone infrastructure, but successive political and economic crises since the 1990s have left energy, water, sanitation and road infrastructure in varying states of disrepair. In 2019, an estimated two out of five Zimbabweans had access to electricity. This figure has barely budged since 1990. Meanwhile, two out of three people in lower middle-income Africa had access to electricity. Because the government struggles to generate and distribute uninterrupted electricity, residents and businesses rely heavily on petrol or diesel generators.
Around half of Zimbabweans are expected to have access to electricity by the late-2030s on the Current Path, which is still lower than the current average of roughly 66% in lower middle-income Africa. By 2043, three out of five Zimbabweans will have electricity access on the Current Path. In the Leapfrogging scenario, the electricity access rate increases much more rapidly to 80% by 2043.
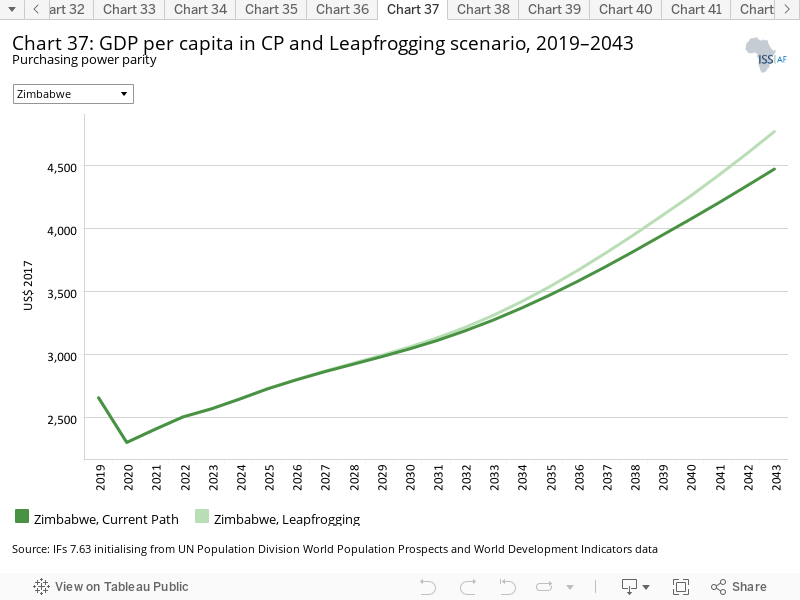
On the Current Path, average incomes in Zimbabwe will remain far below the average of lower middle-income Africa, reaching only US$4 469 by 2043. The average of lower middle-income Africa is projected to reach nearly double that figure (US$9 142) by that year.
Owing to the expanded access to electricity in both rural and urban areas modelled in the Leapfrogging scenario, average incomes grow slightly more quickly than on the Current Path, but only over the long term. In the Leapfrogging scenario, average incomes reach US$4 767 by 2043 — approximately US$300 greater than the Current Path forecast for that year and still far behind lower middle-income Africa. The greater electricity access of the Leapfrogging scenario has the potential to only modestly improve livelihoods in Zimbabwe.
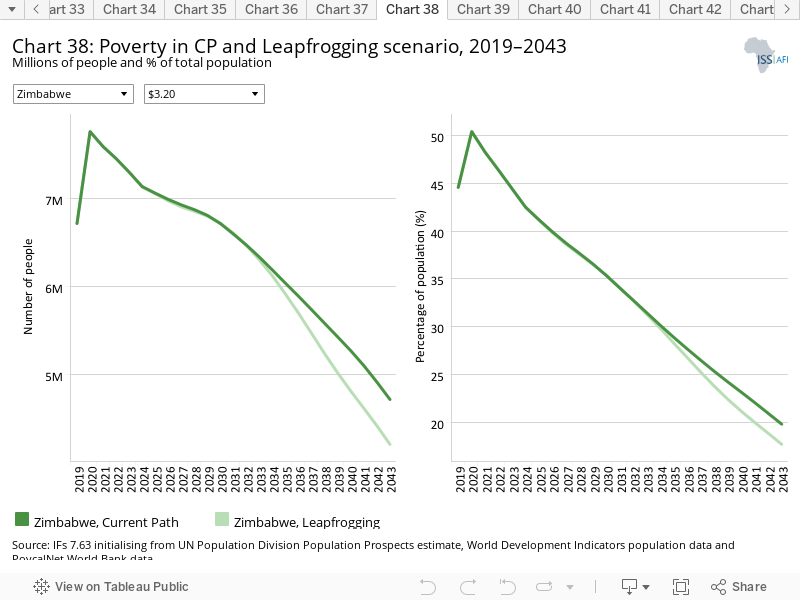
In 2019, an estimated 45% of Zimbabweans lived below the poverty line of US$3.20 for lower middle-income countries — an alarming estimate that calls for urgent action. On the Current Path, this rate is projected to fall steadily to approximately 20% — one out of five people — by 2043.
In the Leapfrogging scenario, the poverty rate decreases only slightly more rapidly to 18% by 2043. This means that in 2043 in the Leapfrogging scenario, 4.2 million Zimbabweans will be living in poverty, rather than the Current Path forecast of approximately 4.7 million people. Indeed, more than improvements to renewable energy, electrical, and Internet infrastructure are needed to significantly alleviate poverty.
The Free Trade scenario represents the impact of the full implementation of the African Continental Free Trade Area (AfCFTA) by 2034 through increases in exports, improved productivity and increased trade and economic freedom.
The intervention is explained here in the thematic part of the website.
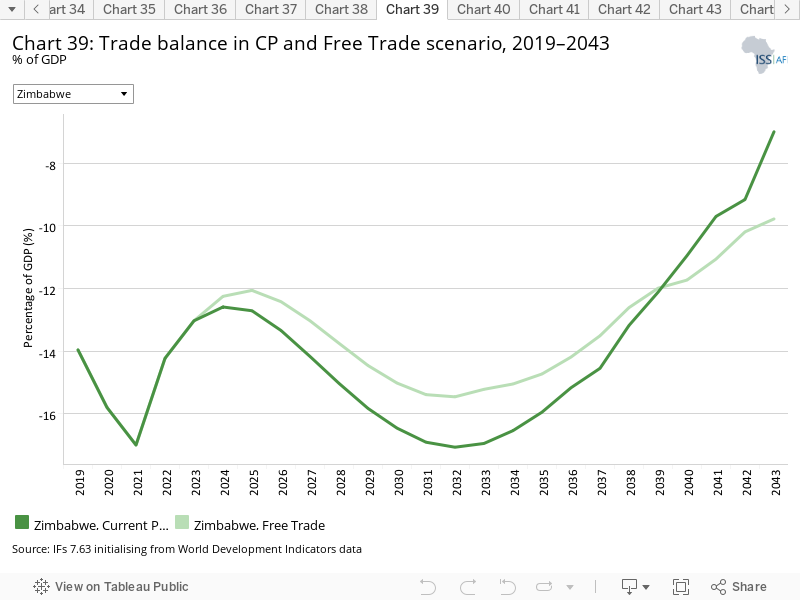
The trade balance is the difference between the value of a country's exports and its imports. A country that imports more goods and services than it exports in terms of value has a trade deficit, while a country that exports more goods and services than it imports has a trade surplus.
The Zimbabwean economy relies heavily on a few commodity exports, particularly tobacco, gold, diamonds and platinum, rendering the country exposed to fluctuations in commodity prices. Per the Observatory of Economic Complexity, Zimbabwe’s top exports in 2020 (ranked by value) were gold, raw tobacco, nickel ore, diamonds, and ferroalloys.
In fact, Zimbabwe is the largest tobacco producer in Africa and the sixth largest globally. But the sector is struggling owing to difficult climate conditions and the negative impacts of unregulated tree cutting to cure tobacco. The government will need to direct its attention to diversifying its export earnings to avoid greater economic volatility.
In 2020, the majority of Zimbabwe’s exports went to the United Arab Emirates, South Africa, Mozambique, Uganda, and Africa. Zimbabwe’s imports profile is similarly restricted, with 45% of imports coming from South Africa. Zimbabwe has long been a net importer of goods and services. At present, Zimbabwe runs a significant trade deficit and will continue to do so on the Current Path. In the Free Trade scenario, Zimbabwe continues to run a trade deficit, but this deficit is smaller than on the Current Path.
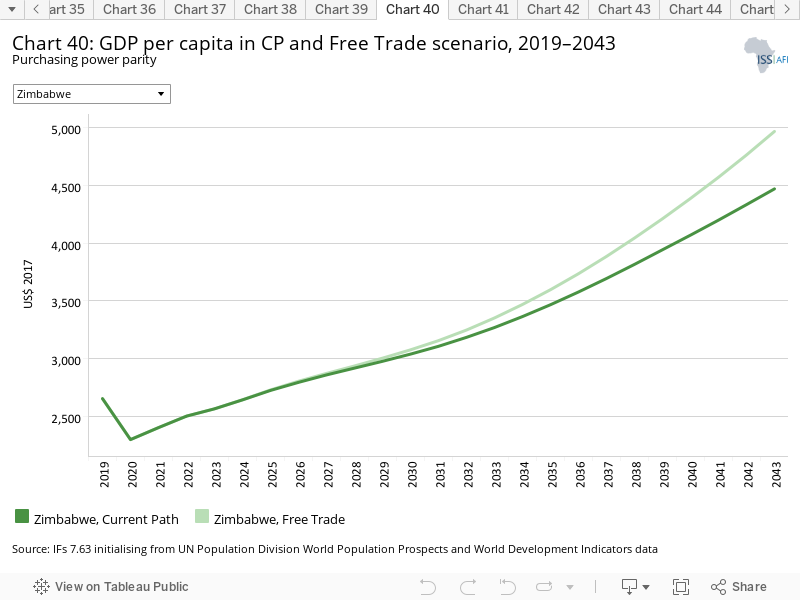
On the Current Path, average incomes in Zimbabwe will remain far below those of other lower middle-income Africa, reaching only US$4 469 by 2043.
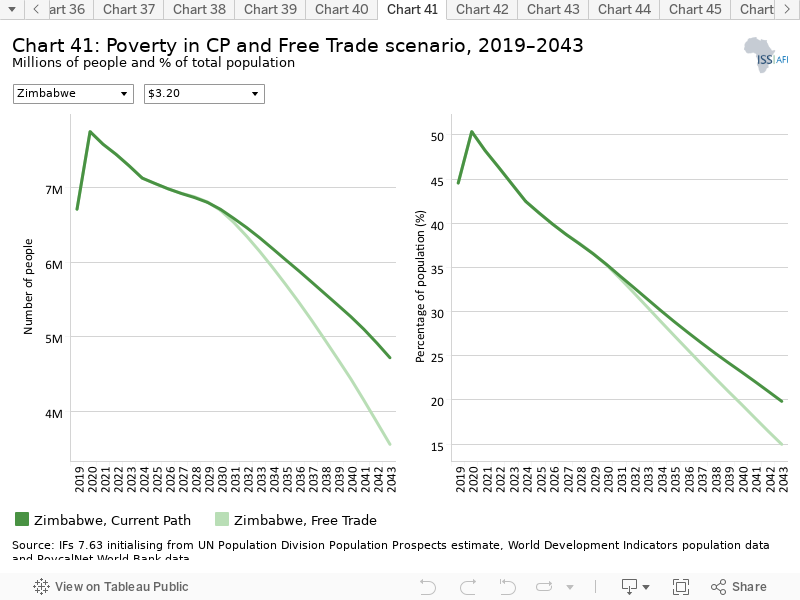
In the Free Trade scenario, the average Zimbabwean earns more than on the Current Path, but only over the long term (from the mid-2030s onward). In 2043, he/she would be earning US$4 966 — approximately US$500 more than on the Current Path. Among all of the scenarios explored, the Free Trade scenario has the largest impact on economic livelihood, reflecting the benefits that an improved trade balance and increased economic activity and economic freedom would have on the country.
In 2019, an estimated 45% of Zimbabweans lived below the poverty line of US$3.20 for lower middle-income countries — an alarming estimate that calls for urgent action. On the Current Path, this rate is projected to fall steadily to approximately 20% — one out of five people — by 2043.
In the Free Trade scenario, Zimbabwe’s poverty rate decreases at a faster rate to 15% by 2043. This relatively rapid improvement in the poverty rate would dramatically reduce the number of Zimbabweans living in poverty. In 2030, there would be approximately 800 000 fewer people living in poverty; in 2043, roughly 2.1 million fewer people.
The Financial Flows scenario represents a reasonable but ambitious increase in worker remittances and aid flows to poor countries, and an increase in the stock of foreign direct investment (FDI) and additional portfolio investment inflows to middle-income countries. We also reduced outward financial flows to emulate a reduction in illicit financial outflows.
The intervention is explained here in the thematic part of the website.
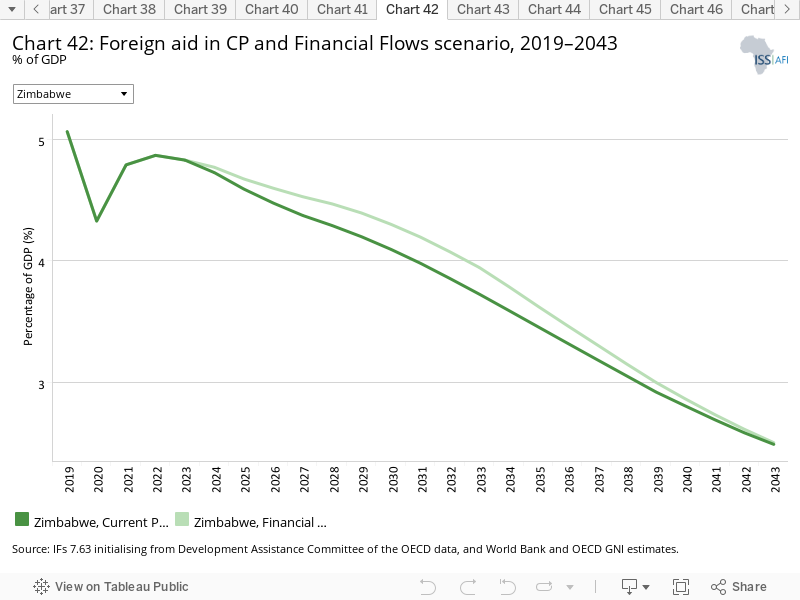
Throughout Zimbabwe’s recent economic crises, the country has received little aid relative to its income peers. In 2019, Zimbabwe received foreign aid valued at approximately 5% of GDP. Contributing to these low levels are Zimbabwe’s disputes with large and influential nations like the United Kingdom, which has publicly criticised President Emmerson Mngangagwa for his military takeover of the Zimbabwean government in 2017 and broader human rights violations committed by the Zimbabwean government.
On the Current Path, foreign aid as a share of GDP falls steadily to approximately 2.5% in 2043. In the Financial Flows scenario, foreign aid increases only slightly over the medium term before converging with the Current Path forecast by 2040.
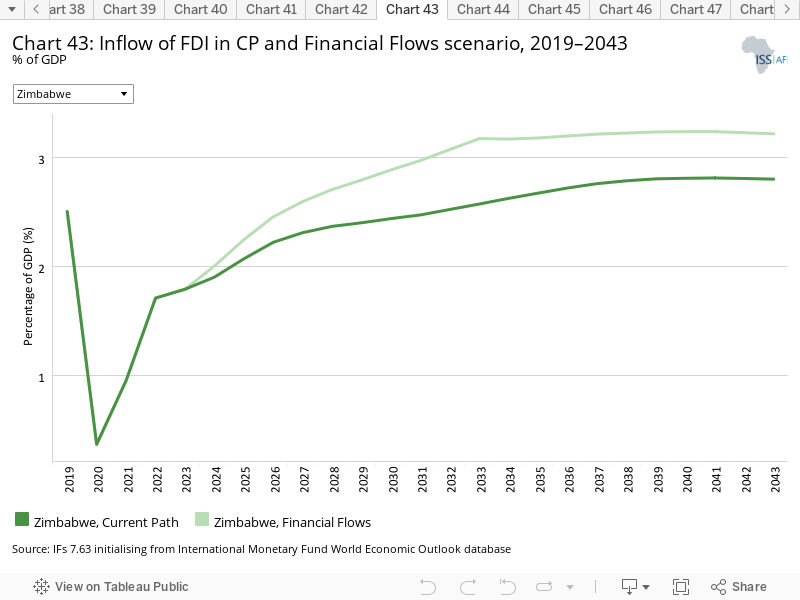
Over the past 40 years, FDI inflows to Zimbabwe have fluctuated between virtually nothing to a peak of approximately 7% of GDP in the late-1990s. In 2019, FDI inflows reached an estimated 2.5% of GDP. On the Current Path, FDI will peak at 2.8% of GDP over the forecast horizon. In the Financial Flows scenario, FDI reaches a maximum of 3.2% in Zimbabwe and 4.1% in lower middle-income Africa.
Although there is clearly considerable scope for increases in both aid and FDI, more FDI would require a substantial change in current levels of business and investor confidence. Zimbabwe currently has the eighth and 11th lowest scores globally in the World Bank’s regulatory quality and governance effectiveness indices, respectively; the 25th worst score globally on Transparency International’s Corruption Perceptions Index; and the 18th lowest score globally on the Fraser Institute’s index of economic freedom, which lists excessive bureaucratic costs and administrative requirements for business and government control over the movement of capital as the most severe issues. Even China, which has long been Zimbabwe’s largest foreign donor, has voiced criticism of the southern African nation’s difficult business environment.
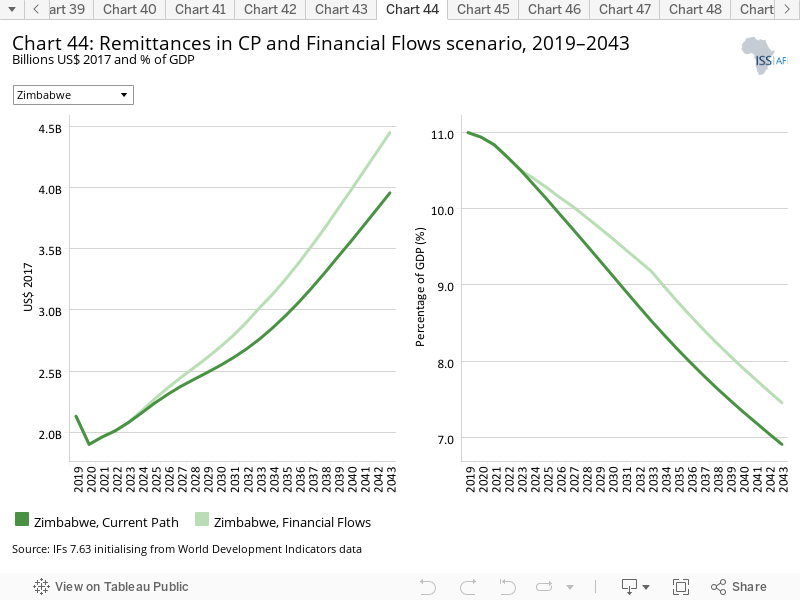
Zimbabwe has suffered very high levels of outward migration, estimated at between 0.4% and 0.2% of its population annually since the turn of the century. This migration has resulted in a large diaspora and significant remittance inflows, which have played a central role in steadying the Zimbabwean economy. According to the Government of Zimbabwe, remittances are the second largest source of income, with exports coming in first. In 2015, remittances through the formal channels recorded by the Reserve Bank of Zimbabwe are estimated to have reached US$1 billion – more than double the amount of net FDI received by Zimbabwe during the same period. The World Bank estimates that remittances actually exceeded US$2 billion in 2015 before falling slightly to US$1.8 billion in 2020 in current US dollars. However, this high outward migration has also harmed human capital by stripping the country of much of its better-educated workforce.
Remittances from South Africa account for approximately one-third of the total diaspora remittances to Zimbabwe. Although remittances are usually made in cash transfers, shortages of basic commodities in Zimbabwe encourage migrants to purchase goods such as foodstuffs abroad and bring them home or send them through relatives, friends, taxi or bus. [1The Migration and Remittances Survey, Southern African Migration Project.]
On the Current Path, remittances will fall as a per cent of GDP but increase in absolute terms to approximately US$4 billion (6.9% of GDP) by 2034. Meanwhile, in the Financial Flows scenario, remittances decrease to 7.5% of GDP by 2043. In absolute terms, this means that, in the Financial Flows scenario, Zimbabwe would receive US$4.5 billion in remittances in 2043.
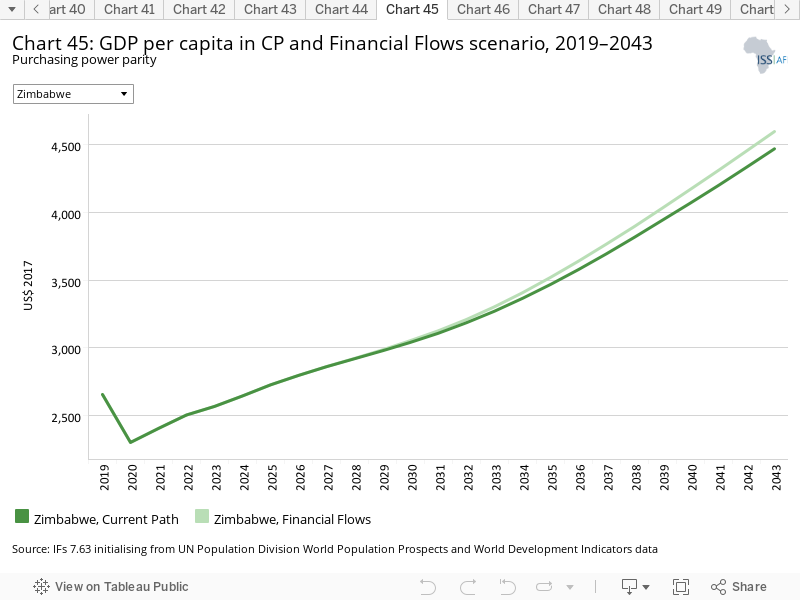
On the Current Path, average incomes in Zimbabwe will remain far below those of other lower middle-income Africa, reaching only US$4 469 by 2043.
In the Financial Flows scenario, average incomes in Zimbabwe experience only a minor improvement over the Current Path. In 2043, the average Zimbabwean would be earning US$4 597 — only approximately US$130 more than the Current Path forecast for that year. A more holistic approach to improving livelihoods in Zimbabwe is necessary to meaningfully impact incomes.
Trade openness will reduce poverty in the long term after initially increasing it due to the redistributive effects of trade. Most African countries export primary commodities and low-tech manufacturing products, and therefore a continental free trade agreement (AfCFTA) that reduces tariffs and non-tariff barriers across Africa will increase competition among countries in primary commodities and low-tech manufacturing exports. Countries with inefficient, high-cost manufacturing sectors might be displaced as the AfCFTA is implemented, thereby pushing up poverty rates.
In the long term, as the economy adjusts and produces and exports its comparatively advantaged (lower relative cost) goods and services, poverty rates will decline.
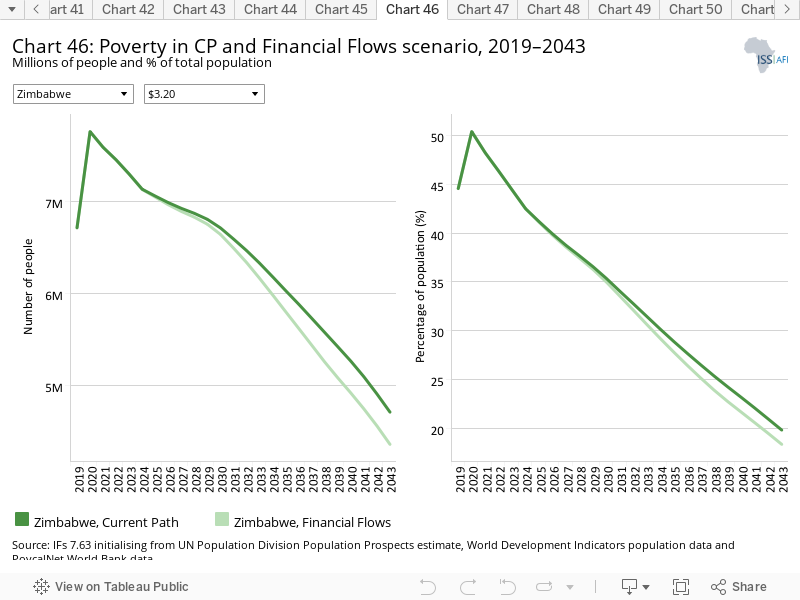
In 2019, an estimated 45% of Zimbabweans lived below the poverty line of US$3.20 for lower middle-income countries — an alarming estimate that calls for urgent action. On the Current Path, this rate is projected to fall steadily to approximately 20% — one out of five people — by 2043.
The increased inward remittances and aid and FDI flows modelled in the Financial Flows scenario only modestly impact poverty levels in Zimbabwe. By 2043, Zimbabwe’s poverty rate falls just over 18%, representing an approximately 1.4 percentage point improvement over the Current Path forecast for that year.
Clearly, improvements in the balance of inward and outward flows of money to the country alone are insufficient to alleviate poverty in Zimbabwe.
The Infrastructure scenario represents a reasonable but ambitious increase in infrastructure spending across Africa, focusing on basic infrastructure (roads, water, sanitation, electricity access and ICT) in low-income countries and increasing emphasis on advanced infrastructure (such as ports, airports, railway and electricity generation) in higher-income countries.
Note that health and sanitation infrastructure is included as part of the Health/WaSH scenario and that ICT infrastructure and more rapid uptake of renewables are part of the Leapfrogging scenario. The interventions there push directly on outcomes, whereas those modelled in this scenario increase infrastructure spending, indirectly boosting other forms of infrastructure, including that supporting health, sanitation and ICT.
The intervention is explained here in the thematic part of the website.
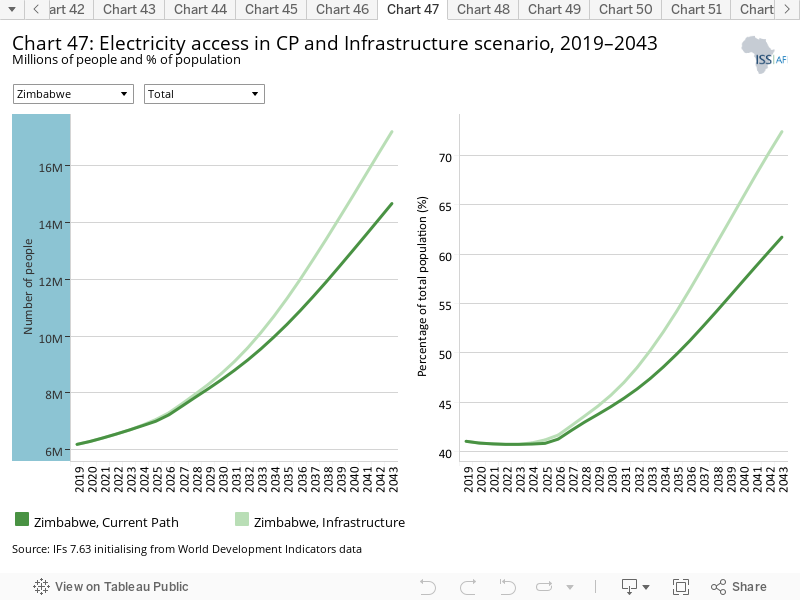
Zimbabwe has significant backbone infrastructure, but successive political and economic crises since the 1990s have left energy, water, sanitation and road infrastructure in varying states of disrepair. In 2019, an estimated two out of five Zimbabweans had access to electricity. This figure has barely budged since 1990. Because the government struggles to generate and distribute uninterrupted electricity, residents and businesses rely heavily on petrol or diesel generators. Across lower middle-income Africa, an average of two out of every three people have access to electricity.
Around half of Zimbabweans are expected to have access to electricity by the late-2030s on the Current Path. By 2043, three out of five Zimbabweans will have electricity access on the Current Path. In the Infrastructure scenario, this rate increases dramatically to 72% by 2043, translating to an additional 2.5 million Zimbabweans with access to electricity that year compared to the Current Path.
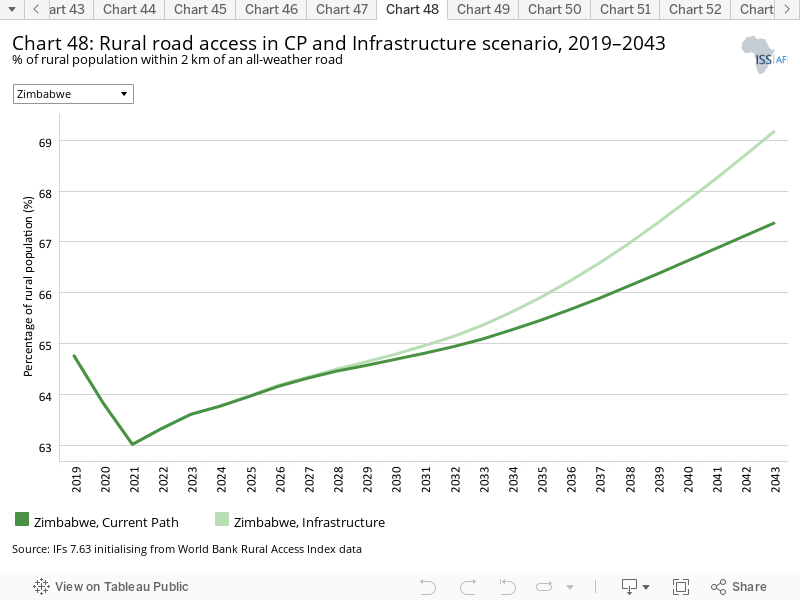
Indicator 9.1.1 in the Sustainable Development Goals refers to the proportion of the rural population who live within 2 km of an all-season road and is captured in the Rural Access Index.
In 2019, an estimated 65% of rural Zimbabweans had access to an all-weather road within 2 km. Although there is significant room for improvement in transportation infrastructure in rural Zimbabwe, lower middle-income Africa, on average, performs worse on this critical indicator. On the Current Path, the share of the rural population within 2 km of an all-weather road will increase to 68% by 2043. In the Infrastructure scenario, this rate increases dramatically to nearly 70% by 2043.
All-weather roads are critical for many reasons, including reliable access to emergency goods and services and economic opportunities such as the transfer of agricultural goods to market.
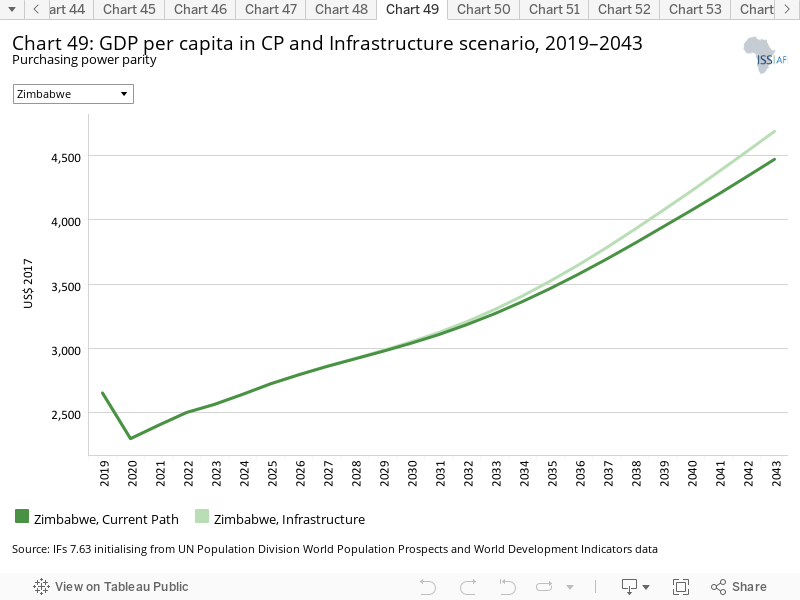
On the Current Path, average incomes in Zimbabwe will remain far below those of other lower middle-income Africa, reaching only US$4 469 by 2043.
Meanwhile, the improved infrastructure modelled in the Infrastructure scenario only barely improves livelihoods in the country, and only over the long term (by the mid-2030s and beyond). By 2043, the average Zimbabwean earns US$4 686 in the Infrastructure scenario, marking an improvement of approximately US$220 over the Current Path forecast.
While infrastructure is critical to improving livelihoods — particularly outside of cities, where vulnerable populations are often isolated from critical resources and services — it alone is incapable of dramatically improving incomes in a country facing complex developmental challenges.
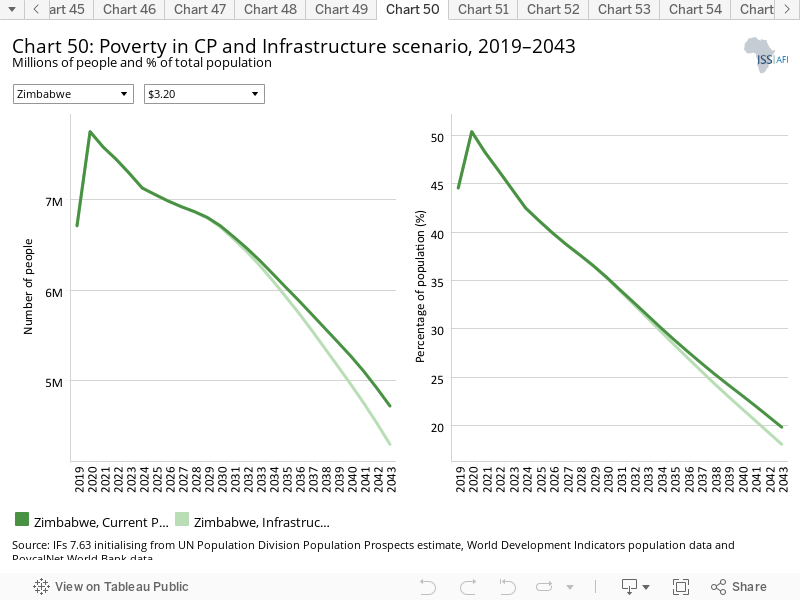
In 2019, an estimated 45% of Zimbabweans lived below the poverty line of US$3.20 for lower middle-income countries — an alarming estimate that calls for urgent action. On the Current Path, this rate is projected to fall steadily to approximately 20% — one out of five people — by 2043.
By 2043, the improved basic infrastructure modelled in the Infrastructure scenario only results in a two percentage point reduction in Zimbabwe’s poverty rate. In other words, roughly 400 000 fewer people in the country would be suffering from poverty in 2043 in the Infrastructure scenario than on the Current Path. Infrastructure alone is insufficient to alleviate poverty in Zimbabwe; a concerted and multi-faceted approach to lifting Zimbabweans out of poverty is necessary.
The Governance scenario represents a reasonable but ambitious improvement in accountability and reduces corruption, and hence improves the quality of service delivery by government.
The intervention is explained here in the thematic part of the website.
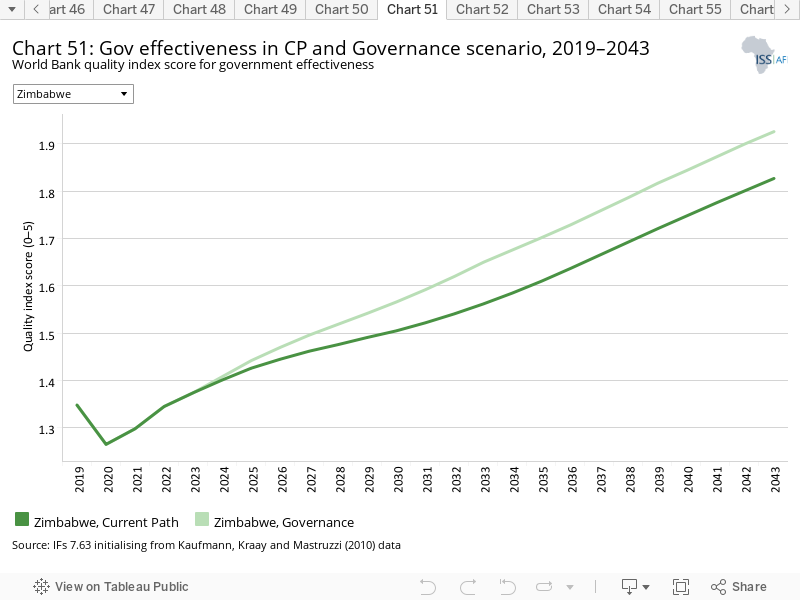
As defined by the World Bank, government effectiveness ‘captures perceptions of the quality of public services, the quality of the civil service and the degree of its independence from political pressures, the quality of policy formulation and implementation, and the credibility of the government’s commitment to such policies’.
Chart 51 presents the impact of the interventions in the Governance scenario on government effectiveness.
The Government of Zimbabwe has historically taken a centralist, control and command approach to governance characterised by regime volatility and opaque election processes. In fact, in 2018, Zimbabwe ranked 175th globally in the government effectiveness index.
In both the Current Path forecast and the Governance scenario, Zimbabwe’s government effectiveness score remains below the average of lower middle-income Africa, reflecting the urgent need for dramatic governance reform in Zimbabwe.
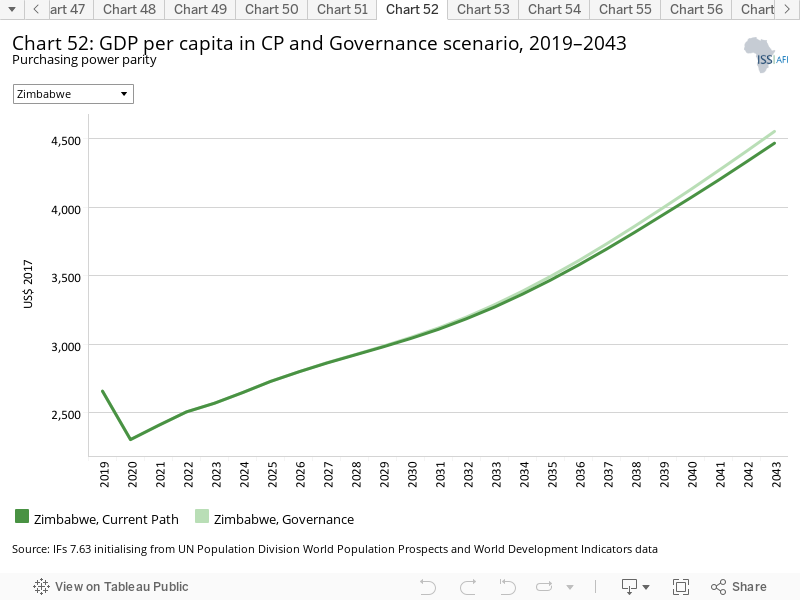
On the Current Path, average incomes in Zimbabwe will remain far below those of other lower middle-income Africa, reaching only US$4 469 by 2043.
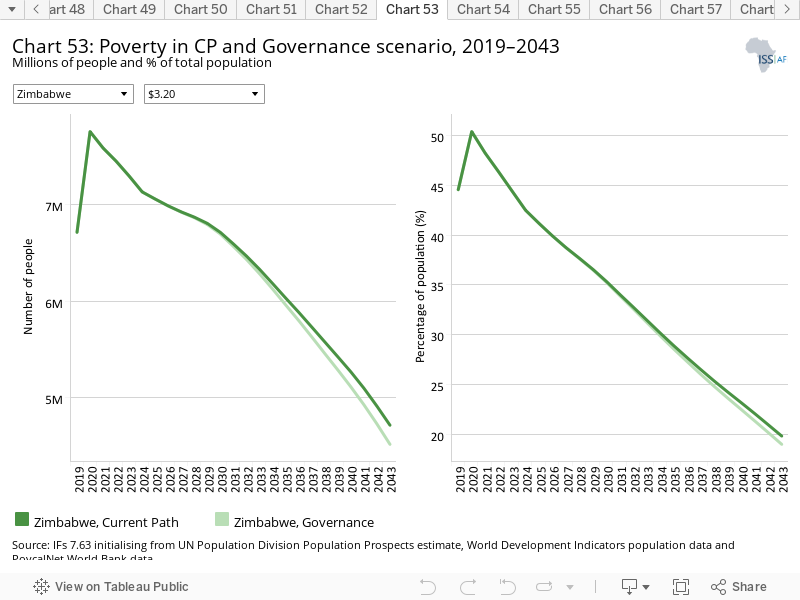
Clearly, improvements in governance alone are insufficient to improve livelihoods in Zimbabwe. The improvement in average incomes in Zimbabwe in the Governance scenario is negligible when compared to the Current Path, underscoring the need for a multi-faceted approach to improving livelihoods in the country.
An estimated 45% of Zimbabweans lived below the poverty line of US$3.20 for lower middle-income countries in 2019 — an alarming estimate that calls for urgent action. On the Current Path, this rate is projected to fall steadily to approximately 20% — one out of five people — by 2043.
As the Governance scenario has a negligible impact on average incomes in Zimbabwe, it is to be expected that the improved governance modelled in the scenario only modestly affects poverty rates compared to the Current Path. In fact, in the Governance scenario, the poverty rate by 2043 is less than a percentage point below the Current Path forecast for that year of 20%. While accountable governance and effective service delivery are critical to improving livelihoods, economic growth is necessary to raise average incomes and in turn reduce poverty.
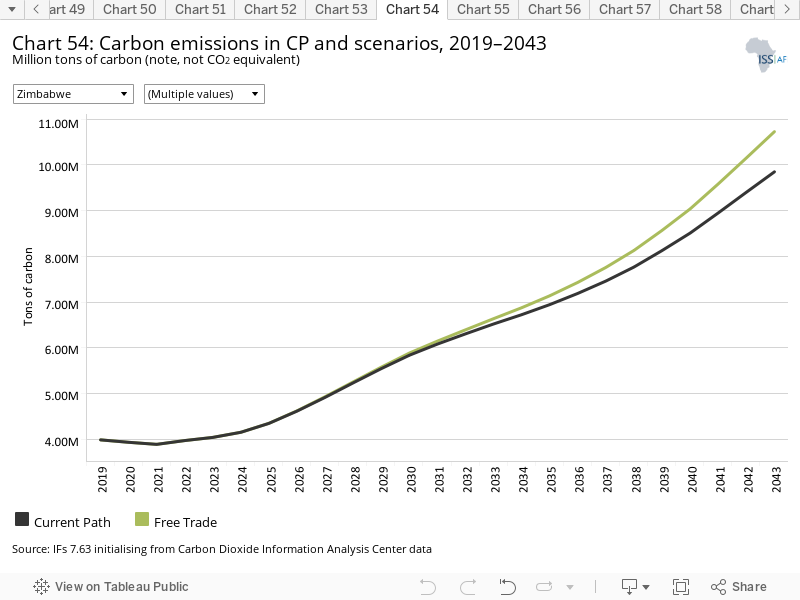
This section presents projections for carbon emissions in the Current Path for Zimbabwe and the 11 scenarios. Note that IFs uses carbon equivalents rather than CO2 equivalents.
On the Current Path, Zimbabwe’s carbon emissions will increase from the 2019 estimate of 4 million tons to nearly 10 million tons in 2043.
The Free Trade scenario increases Zimbabwe’s carbon emissions most dramatically over the Current Path, with emissions reaching 10.7 million tons by 2043 in that scenario. Conversely, the Demographic scenario, owing to slower population growth, causes a decrease in carbon emissions.
When weighing the effects of the scenarios on development, considering the impact on carbon emissions is crucial. Indeed, Zimbabweans are generally extremely vulnerable to the effects of climate change, particularly on agriculture. Climate change will cause Zimbabwe to become on average warmer and dryer. Droughts are likely to become more intense and frequent, and rain increasingly variable. Climate change – in addition to natural climatic cycles like El Niño – also intensifies the severity of major weather events like cyclones.
Because of the country’s high percentage of rural people, livelihoods in Zimbabwe are intimately connected with the rhythm of the seasons, the quality of the country’s natural resources and the preservation of its fragile ecosystems and biodiversity.
The impacts of climate change are threatening these resources and contributing to extreme weather patterns. In March 2019, Cyclone Idai devastated Zimbabwe, Mozambique, and Malawi, affecting hundreds of thousands of Zimbabweans.
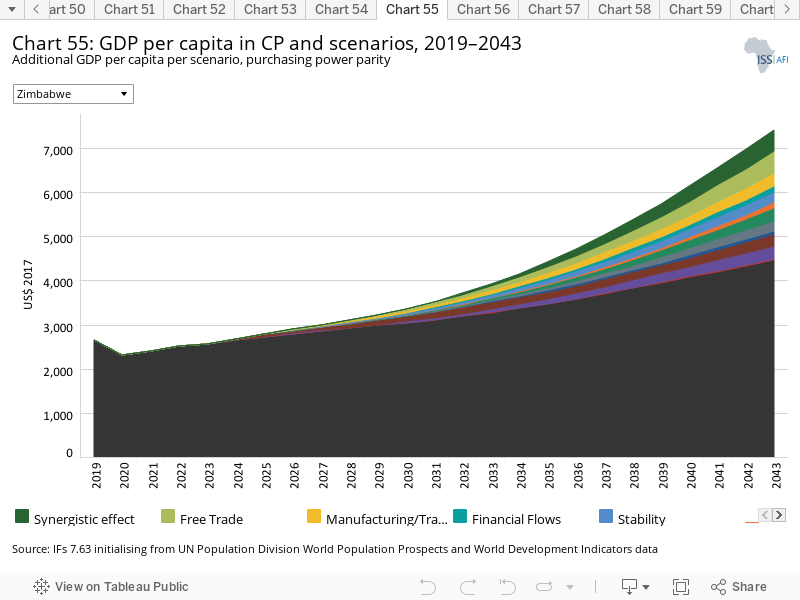
The Combined Agenda 2063 scenario consists of the combination of all 11 sectoral scenarios presented above, namely the Stability, Demographic, Health/WaSH, Agriculture, Education, Manufacturing/Transfers, Leapfrogging, Free Trade, Financial Flows, Infrastructure and Governance scenarios. The cumulative impact of better education, health, infrastructure, etc. means that countries get an additional benefit in the integrated IFs forecasting platform that we refer to as the synergistic effect. Chart 55 presents the contribution of each of these 12 components to GDP per capita in the Combined Agenda 2063 scenario as a stacked area graph.
Each scenario explored thus far impacts average incomes in Zimbabwe to different degrees. Of all of the scenarios, Free Trade increases GDP per capita the most dramatically, raising average incomes by approximately US$500 in 2043. In the Stability scenario, incomes also grow substantially more quickly than on the Current Path.
As is to be expected, the aggregate impact of all the scenarios together is dramatically greater than each of the scenarios individually. Additionally, the synergistic effect of the combined scenarios is projected to add an additional US$112 to the average Zimbabwean’s income in 2035 and US$470 in 2043. This finding speaks to the beneficial effect of concerted, cross-cutting government approaches to seemingly intractable problems such as extreme poverty.
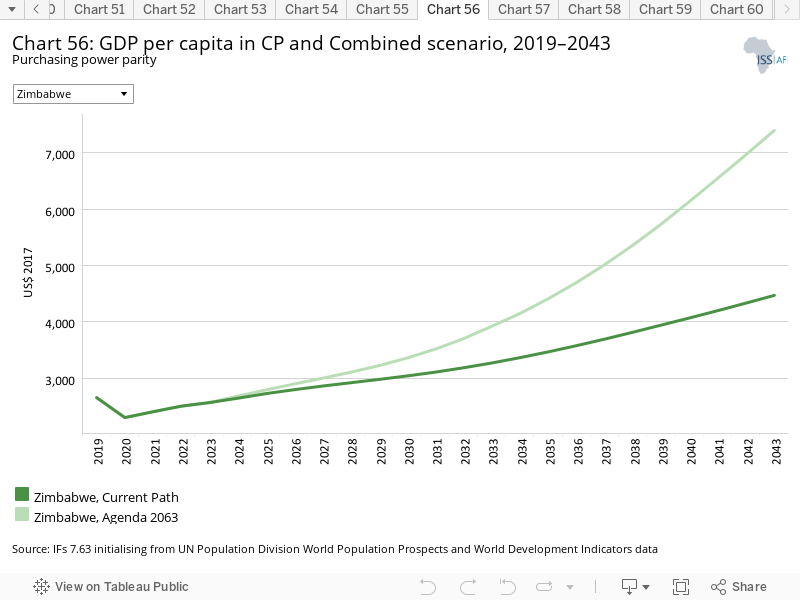
Whereas Chart 55 presents a stacked area graph on the contribution of each scenario to GDP per capita as well as the additional benefit or synergistic effect, Chart 56 presents only the GDP per capita in the Current Path forecast and the Combined Agenda 2063 scenario.
Average incomes increase dramatically in the Combined Agenda 2063 scenario, whereas they grow fairly slowly on the Current Path. In the Combined Agenda 2063 scenario, average incomes in Zimbabwe increase to US$3 358 by 2030, representing an improvement of more than US$300over the Current Path forecast for that year.
By 2043, average incomes reach US$7 397 — a 66% increase over the Current Path forecast for that year.
Such a dramatic improvement in average incomes in Zimbabwe would transform livelihoods and the quality of life of people across the country.
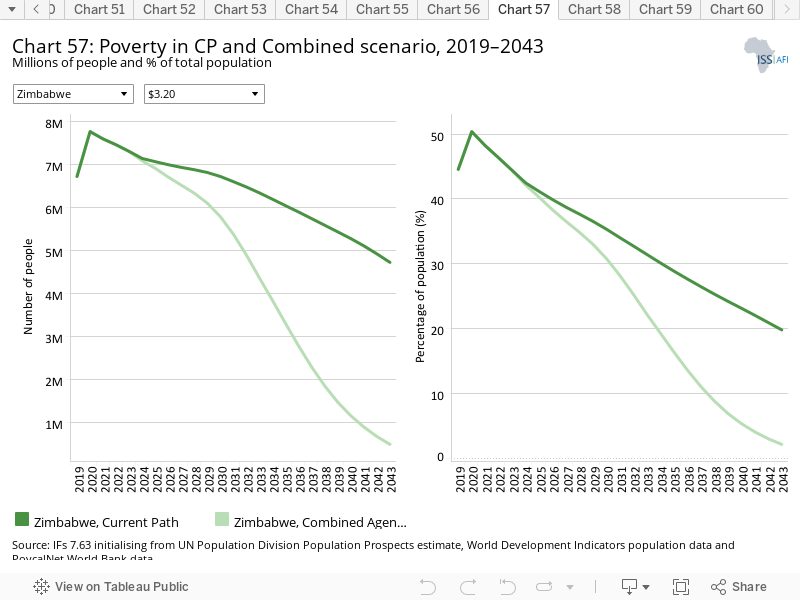
Roughly two out of five Zimbabweans (6.7 million people) lived on less than US$3.20, the extreme poverty line for lower middle-income countries, in 2019. Although this poverty rate of nearly 45% is projected to decline to 20% by 2043, 4.7 million Zimbabweans will be living in extreme poverty by 2040 on the Current Path.
Conversely, poverty reduces dramatically in the Combined Agenda 2063 scenario, evidencing the profound impact of cross-sectoral, whole-of-government solutions to problems as complex as poverty. In the Combined Agenda 2063 scenario, Zimbabwe’s poverty rate falls below 3% by the early-2040s. From a different perspective — there would be more than 4 million fewer Zimbabweans living in poverty in 2043 in the Combined Agenda 2063 scenario combined to the Current Path forecast.
See Chart 8 to view the Current Path forecast of the sectoral composition of the economy.
The value added of the sectors of Zimbabwe’s economy varies between the Current Path and the Combined Agenda 2063 scenarios. The two primary methods of measuring differences in sectors’ contribution to GDP are in 1) percentage points and 2) absolute value (dollars).
From the perspective of percentage points, agriculture experiences the greatest increase over the medium term, while services jumps substantially by over four percentage points over the forecast horizon. In absolute terms, services experience the greatest increase, contributing an additional US$31 billion in 2043 to the Zimbabwean economy compared to the Current Path. Conversely, the contributions of the energy, manufactures, and materials sectors in the Combined Agenda 2063 scenario decline over the forecast horizon when compared to the Current Path.
In absolute terms, all sectors increase in size in the Combined Agenda 2063 scenario compared to the Current Path.
After a series of prolonged economic crises, the Zimbabwean economy slowly recovered to an estimated US$19.4 billion in size in 2019 and is projected to reach US$57.3 billion by 2043. The Combined Agenda 2063 scenario paints a far more optimistic future: by 2030, GDP would be US$4 billion greater than the Current Path forecast for that year; by 2043, approximately US$50 billion greater. At that accelerated rate, Zimbabwe’s economy would overtake Zambia’s Current Path forecast by the early 2040s.
In 2019, Zimbabwe was the 13th largest carbon emitter in Africa, although its economy was only the 25th largest, reflecting its dependence on coal for much of its electricity generation and a carbon-inefficient economy.
On its current trajectory, Zimbabwe’s carbon emissions will more than double from the 2019 estimate of 4 million tons to 10 million tons in 2043. In the Combined Agenda 2063 scenario, carbon emissions reach 14 million tons by 2043, marking a dramatic 40% increase over the Current Path forecast for that year and 350% increase over the 2019 estimate. While the improved economic activity and performance modelled in the Combined Agenda 2063 scenario would bring about significant improvements in the livelihoods of most Zimbabweans, their impact on carbon emissions must be considered. That said, Zimbabwe’s emissions, even in the Combined Agenda 2063 scenario, remain a mere fraction of more developed countries. Neighbouring South Africa, for example, produced an estimated 135 million tons of carbon emissions in 2019. These disparities raise critical questions around environmental inequality and the responsibility of highly industrialised nations to compensate less developed countries for the devastating impacts of climate change.
Endnotes
The Migration and Remittances Survey, Southern African Migration Project.
Page information
Contact at AFI team is Jakkie Cilliers
This entry was last updated on 3 October 2024 using IFs v7.63.
Donors and sponsors


Reuse our work
- All visualizations, data, and text produced by African Futures are completely open access under the Creative Commons BY license. You have the permission to use, distribute, and reproduce these in any medium, provided the source and authors are credited.
- The data produced by third parties and made available by African Futures is subject to the license terms from the original third-party authors. We will always indicate the original source of the data in our documentation, so you should always check the license of any such third-party data before use and redistribution.
- All of our charts can be embedded in any site.
Cite this research
Jakkie Cilliers (2025) Zimbabwe. Published online at futures.issafrica.org. Retrieved from https://futures.issafrica.org/geographic/countries/zimbabwe/ [Online Resource] Updated 3 October 2024.