 Zambia
Feedback welcome
Our aim is to use the best data to inform our analysis. See our Technical page for information on the IFs forecasting platform. We appreciate your help and references for improvements via our feedback form.
Please note: This country report was developed using African Futures’ previous analytical framework, which organised the assessment across 11 sectoral scenarios. We have since updated and streamlined the analytical architecture to 8 sectoral scenarios. While the two frameworks remain broadly aligned, the current structure improves consistency, comparability and integration across themes and geographic studies. This page will therefore be updated to the current framework in due course. Read more about our analytical framework on the Technical Page.
In this entry, we first describe the Current Path forecast for Zambia as it is expected to unfold to 2043, the end of the third ten-year implementation plan of the African Union’s Agenda 2063 long-term vision for Africa. The Current Path in the International Futures (IFs) forecasting model initialises from country-level data that is drawn from a range of data providers. We prioritise data from national sources.
The Current Path forecast is divided into summaries on demographics, economics, poverty, health/WaSH and climate change/energy. A second section then presents a single positive scenario for potential improvements in stability, demographics, health/WaSH, agriculture, education, manufacturing/transfers, leapfrogging, free trade, financial flows, infrastructure, governance and the impact of various scenarios on carbon emissions. With the individual impact of these sectors and dimensions having been considered, a final section presents the impact of the Combined Agenda 2063 scenario.
We generally review the impact of each scenario and the Combined Agenda 2063 scenario on gross domestic product (GDP) per person and extreme poverty except for Health/WaSH, which uses life expectancy and infant mortality.
The information is presented graphically and supported by brief interpretive text.
All US$ numbers are in 2017 values.
Executive Summary
- Current Path forecast
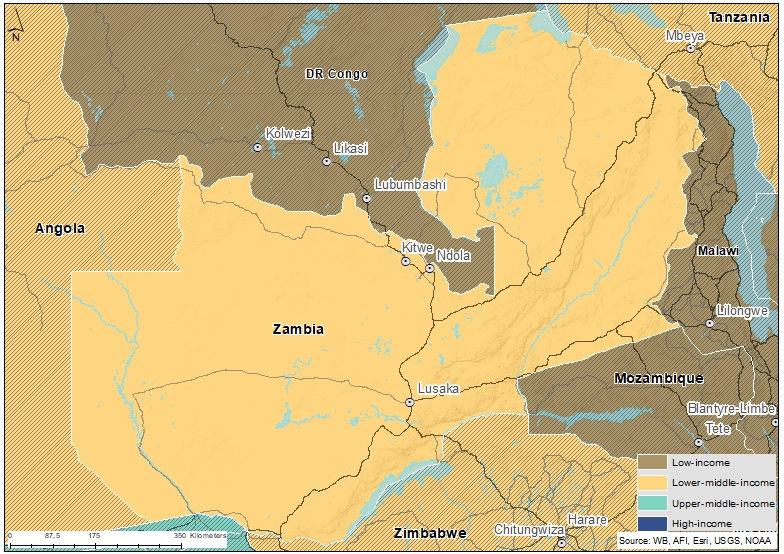
- Zambia was classified as a lower-middle income country in 2011 and houses the secretariat of the Common Market for Eastern and Southern Africa (COMESA). It is also a member of the Southern African Development Community (SADC). Jump to forecast: Current Path
- Zambia’s very young, predominantly rural population numbered 17.86 million in 2019, forecast to grow to 32.70 million in 2043. Jump to Demographics: Current Path
- Zambia should recover to its pre-COVID-19 income levels by 2023 and subsequently improve rapidly. By 2043, GDP per capita is forecast to be at US$5 467, which is 35% above the 2019 value of US$4 036. Jump to Economics: Current Path
- Zambia has some of the highest levels of poverty and inequality globally, particularly in rural areas where female-headed households are disproportionately affected. Using the US$3.20 poverty line for lower middle-income countries, the 2019 poverty rate was 74.4% (13.2 million). This decreases to 67.3% in 2043 (22 million). Jump to Poverty: Current Path
- In 2019, total energy production in Zambia amounted to 24.2 million barrels of oil equivalent (MBOE), forecast to increase to 91.5 MBOE by 2043. Carbon emissions come off a very low base and emissions will peak at 4.4 million tons in 2036, and then decline to 2.5 million tons by 2043. Jump to Carbon emissions/Energy: Current Path
- Sectoral scenarios
- Zambia has a reputation as an island of stability. The Stability scenario improves the Government Security Index in IFs by 12% above the Current Path forecast. As a result, GDP per capita increases almost 5% above the Current Path forecast for 2043. Jump to Stability scenario
- The Demographic scenario has a strong and positive impact on Zambia’s population profile and advances Zambia’s demographic dividend entry by a decade, to 2041. Jump to Demographic scenario
- Largely owing to the lingering impact of HIV/AIDS, life expectancy in Zambia is very low: 59.7 years in 2019. By 2043, the Health/WaSH scenario improves life expectancy in Zambia by almost one year above the Current Path forecast. Jump to Health/WaSH scenario
- Despite its large agricultural potential, Zambia suffers from significant food insecurity and high malnutrition rates. In the Agriculture scenario crop yields improve to 6.5 tons per hectare in 2043, and the area of irrigated land increases to 442 000 hectares instead of the of 157 000 hectares expected by 2043 in Current Path forecast. Jump to Agriculture scenario
- Zambia’s education system is plagued by inadequate resources, poor quality and low progression rates. Although primary enrolment and completion rates are high, lower secondary and upper secondary enrolment rates were, respectively, 11 and 14 percentage points below the averages of lower middle-income African countries in 2019. Jump to Education scenario
- Zambia has a small manufacturing sector, which was roughly 11 percentage points smaller than the average portion of GDP in lower middle-income Africa in 2019. In the Manufacturing/Transfers scenario, the contribution from manufactures increases by 0.4 percentage points above the Current Path forecast, equivalent to a manufacturing sector that is US$1.1 billion larger by 2043. Despite this improvement, it still reflects poor industrial growth by comparative African standards Jump to Manufacturing/Transfers scenario
- In 2019, just more than a third of Zambians had electricity access. In the Current Path forecast, the rate will improve to 57.4% in 2043 and to 69.3% in the Leapfrogging scenario. However, rural rates are extremely low – less than 10% in 2019. Jump to Leapfrogging scenario
- Zambia stands to benefit greatly from the interventions proposed in the Free Trade scenario. In the Current Path, GDP per capita will be at US$5 467 in 2043, while in the Free Trade scenario it gets to US$6 204 – almost 14% (US$737) above the Current Path forecast. This reflects the potential of the African Continental Free Trade Area for improving livelihoods in Zambia Jump to Free Trade scenario
- Zambia receives substantial foreign direct investment (FDI) by comparative African standards, but most of it goes to the extractive sector, contributing little to the structural transformation of the country’s economy. In the Financial Flows scenario, Zambia’s stock of FDI grows by 16% to US$87.5 billion in 2043 compared with US$75.3 billion in the Current Path forecast Jump to Financial Flows scenario
- Rural infrastructure in Zambia is poor, but the country stands to benefit from the interventions proposed in the Infrastructure scenario. On the Current Path, GDP per capita will be US$5 467 in 2043 and US$5 865 in the Infrastructure scenario, a difference of 7% (US$398). Jump to Infrastructure scenario
- In the Governance scenario, government effectiveness improves by 2% from the Current Path forecast in 2043. Jump to Governance scenario
- Because it has the largest positive impact on the size of Zambia’s economy, the Free Trade scenario releases more carbon than any other scenario (at 3.77 million tons) in 2043. Jump to Impact of scenarios on carbon emissions
- Combined Agenda 2063 scenario
- Extreme poverty declines to 42.1% (12.6 million people), using the US$3.20 threshold. The Combined Agenda 2063 scenario therefore has the potential to lift an additional 9.4 million Zambians out of extreme poverty by 2043. Jump to Combined Agenda 2063 scenario
All charts for Zambia Development Futures
- Chart 1: Political map of Zambia
- Chart 2: Population structure in CP, 1990–2043
- Chart 3: Urban and rural population in CP, 1990–2043
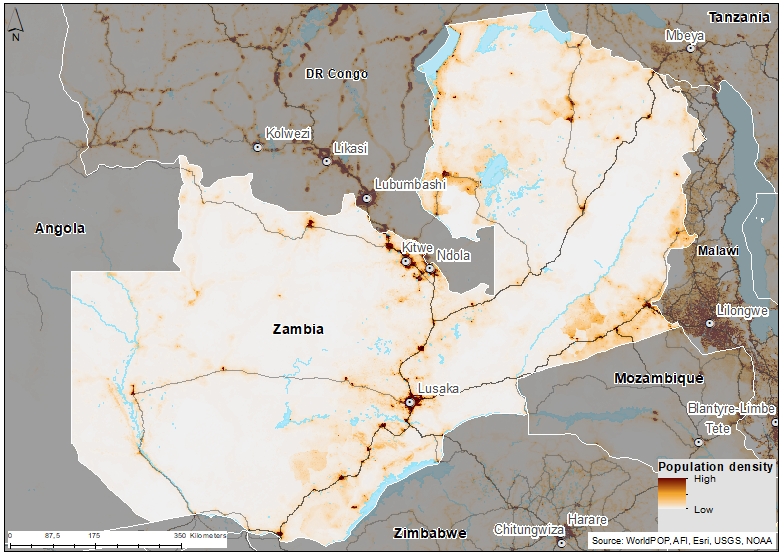
- Chart 4: Population density map for 2019
- Chart 5: GDP in CP, 1990–2043
- Chart 6: GDP per capita in CP, 1990–2043
- Chart 7: Informal sector value in CP, 2015–2043
- Chart 8: Value added by sector in CP, 2015–2043
- Chart 9: Agriculture production/demand in CP, 1990–2043
- Chart 10: Poverty in CP, 2015–2043
- Chart 11: Energy production by type in CP, 1990–2043
- Chart 12: Carbon emissions in CP, 1990–2043
- Chart 13: Governance security in CP and Stability scenario, 2019–2043
- Chart 14: GDP per capita in CP and Stability scenario, 2019–2043
- Chart 15: Poverty in CP and Stability scenario, 2019–2043
- Chart 16: Demographic dividend in CP and Demog scenario, 2019–2043
- Chart 17: Infant mortality in CP and Demog scenario, 2019–2043
- Chart 18: GDP per capita in CP and Demog scenario, 2019–2043
- Chart 19: Poverty in CP and Demog scenario, 2019–2043
- Chart 20: Life expectancy in CP and Health/WaSH scenario, 2019–2043
- Chart 21: Infant mortality in CP and Health/WaSH scenario, 2019–2043
- Chart 22: Yield/hectare in CP and Agric scenario, 2019–2043
- Chart 23: Agriculture imports in CP and Agric scenario, 2019–2043
- Chart 24: GDP per capita in the CP and Agric scenario, 2019–2043
- Chart 25: Poverty in CP and Agric scenario, 2019–2043
- Chart 26: Mean years of education in CP and Educ scenario, 2019–2043
- Chart 27: Education quality in CP and Educ scenario, 2019–2043
- Chart 28: GDP per capita in CP and Educ scenario, 2019–2043
- Chart 29: Poverty in CP and Educ scenario, 2019–2043
- Chart 30: Value added by sector in CP and Manufac/Transfers scenario, 2019–2043
- Chart 31: Gov welfare transfers in CP and Manufac/Transfers scenario, 2019–2043
- Chart 32: GDP per capita in CP and Manufac/Transfers scenario, 2019–2043
- Chart 33: Poverty in CP and Manufac/Transfers scenario, 2019–2043
- Chart 34: Fixed broadband access in CP and Leapfrogging scenario, 2019–2043
- Chart 35: Mobile broadband access in CP and Leapfrogging scenario, 2019–2043
- Chart 36: Electricity access in CP and Leapfrogging scenario, 2019–2043
- Chart 37: GDP per capita in CP and Leapfrogging scenario, 2019–2043
- Chart 38: Poverty in CP and Leapfrogging scenario, 2019–2043
- Chart 39: Trade balance in CP and Free Trade scenario, 2019–2043
- Chart 40: GDP per capita in CP and Free Trade scenario, 2019–2043
- Chart 41: Poverty in CP and Free Trade scenario, 2019–2043
- Chart 42: Foreign aid in CP and Financial Flows scenario, 2019–2043
- Chart 43: Inflow of FDI in CP and Financial Flows scenario, 2019–2043
- Chart 44: Remittances in CP and Financial Flows scenario, 2019–2043
- Chart 45: GDP per capita in CP and Financial Flows scenario, 2019–2043
- Chart 46: Poverty in CP and Financial Flows scenario, 2019–2043
- Chart 47: Electricity access in CP and Infrastructure scenario, 2019–2043
- Chart 48: Rural road access in CP and Infrastructure scenario, 2019–2043
- Chart 49: GDP per capita in CP and Infrastructure scenario, 2019–2043
- Chart 50: Poverty in CP and Infrastructure scenario, 2019–2043
- Chart 51: Gov effectiveness in CP and Governance scenario, 2019–2043
- Chart 52: GDP per capita in CP and Governance scenario, 2019–2043
- Chart 53: Poverty in CP and Governance scenario, 2019–2043
- Chart 54: Carbon emissions in CP and scenarios, 2019–2043
- Chart 55: GDP per capita in CP and scenarios, 2019–2043
- Chart 56: GDP per capita in CP and Combined scenario, 2019–2043
- Chart 57: Poverty in CP and Combined scenario, 2019–2043
- Chart 58: Value added by sector in CP and Combined scenario, 2019–2043
- Chart 59: GDP in CP and Combined scenario, 2019–2043
- Chart 60: Carbon emissions in CP and Combined scenario, 2019–2043


Zambia Development Futures: Current Path
Download to pdfThis page provides an overview of Zambia's critical characteristics along its likely (or Current Path) development trajectory. The Current Path forecast from the International Futures forecasting (IFs) platform is a dynamic scenario that imitates the continuation of current policies and environmental conditions. The Current Path is, therefore, in congruence with historical patterns and produces a series of dynamic forecasts endogenised in relationships across crucial global systems. We use 2019 as a standard reference year, and the forecasts start in 2024 and generally extend to 2043 to coincide with the end of the third ten-year implementation plan of the African Union’s Agenda 2063 long-term development vision.
Formerly Northern Rhodesia, the Republic of Zambia gained independence from the United Kingdom in 1964. It is a landlocked country in Southern Africa and shares borders with eight others, namely the Democratic Republic of the Congo (DR Congo), Tanzania, Malawi, Mozambique, Zimbabwe, Botswana, Namibia and Angola.
With the Mulungushi Declaration in 1968 and its implementation in 1972, Zambia embarked on an inward-looking approach to development, with a significant role for the state. These policies, a collapse in the copper price and conflict in the region resulted in slow growth. With the victory of Frederick Chiluba of the Movement for Multi-Party Democracy (MMD) in 1991, Zambia embarked on a period of socio-economic development, government decentralisation and democratisation. Hakainde Hichilema of the United Party for National Development was elected president in August 2021 after defeating the incumbent Edgar Lungu of the Patriotic Front but inherited an economy in debt distress. Total debt stood at US$ 11 billion. In 2020, Lungu's government requested that its debt payments be frozen under the G20-led Debt Service Suspension Initiative (DSSI). Then, in November, the government missed a US$42.5 million settlement on one of its international bonds, triggering Africa's first COVID-19 sovereign default.
In June 2022, the countries that had lent to Zambia formed an Official Creditor Committee (OCC) to start work on debt restructuring formally. In June 2023, the government announced that the Paris Club of creditor nations and China had agreed to restructure US$6.3 billion of loans (of which US$4 billion was to China). Later that year the government announced an in-principle agreement with private creditors who were owed an additional US$3 billion, but the agreement was subsequently rejected by the OCC on the basis that they were carrying the lion's share of relief.
Zambia is a member of the Southern African Development Community (SADC) and hosts the secretariat of the Common Market for Eastern and Southern Africa (COMESA).
The World Bank changed Zambia’s classification from low-income to lower middle-income in 2011, but it remains one of the United Nations’ 46 least developing countries.
Zambia’s economy is built on its mineral wealth. It boasts significant resources, including copper, cobalt, silver, and coal, extensive forests, and important agricultural land and water resources that could propel sustainable growth.
The country needs better human resource characteristics and is weighed down by debt.
Climatically, Zambia experiences subtropical weather, with annual average rainfall varying from 600 mm in the south to 1 300 mm in the north. Zambia is vulnerable to the impacts of climate change, given its high reliance on subsistence agriculture.
In 2019, Zambia’s population numbered 17.9 million, forecast to grow to 32.7 million in 2043. The population is very young. In 2019, the median age was just over 17 years and, in the Current Path forecast, this is set to increase to just above 21 years by 2043. The only other African countries with younger populations in 2019 were Burundi, the DR Congo, Uganda, Angola, Chad, Mali, Niger and Somalia.
Fertility rates have substantially decreased in Zambia, down from 7.4 births per woman in 1975 to 4.7 births per woman in 2019 (fifth highest in lower middle-income Africa). Fertility rates are set to decrease further in the Current Path forecast and will reach 3.4 births per woman by 2043. At that time, Zambia will have the third highest fertility rate in lower middle-income Africa, implying that rates in comparable countries are declining more rapidly. As its large youthful population enters the job market, it will place significant pressure on the country and its economy.
Zambia’s population is still predominantly rural (56% in 2019), the eighth highest for lower middle-income Africa. The population is expected to be predominantly urban by 2030, nine years later than the average for lower middle-income Africa. By 2043, 56.2% (or 18.4 million) of Zambia’s population are expected to live in urban areas, almost three percentage points lower than the average for lower middle-income Africa.
Zambia is sparsely populated, with less than 0.24 persons per hectare in 2019, forecast to increase to 0.45 by 2043. Population density is particularly high around the cities of Lusaka, Kitwe and Mufalira. The country has an estimated 10 cities with populations over 100 000, with Lusaka having an estimated 3 million residents. Much of Zambia’s development has taken place along the railway lines that link Zambia to the port of Dar es Salaam in Tanzania and southward to the Southern Africa network. However, the lines have not been maintained well and most bulk imports and exports (as well as domestic cargo) are transported by road.
In December 2006 Zambia, published its Vision 2030 ambition, to be ‘a prosperous middle-income nation by 2030’. By 2019, Zambia’s economy had grown from US$17.2 billion in 2006 to US$35.4 billion. Although the country graduated from low-income to lower middle-income status in 2011, it is a long way off from achieving upper middle-income status. The country aspires ‘to attain and sustain annual real growth of 6% (2006–2010), 8% (2011–2015), 9% (2016–2020), and 10% between 2021 and 2030’, although actual growth rates have been at 5.9% from 2006 to 2019. The IFs growth forecast is that Zambia will grow at an average of 4.1% per annum from 2020 to 2030.
In 2019 Zambia was the 12th largest economy in lower middle-income Africa and fifth largest within SADC.
Evident from Chart 5 is the impact of the COVID-19 pandemic, which saw the Zambian economy contract by 4.8% in 2020 after growing by 4% in 2018 and 1.7% in 2019. Zambia’s overreliance on copper has made it vulnerable to fluctuations in commodity prices. The mining sector is dominated by copper mining, responsible for 70% of foreign currency earnings and 14% of GDP. Although the recovery in international demand for copper has been positive, the economy is weighed down by Zambia’s large stock of public debt. In November 2020, Zambia defaulted on a Eurobond debt repayment and subsequently on a number of other commercial loans with foreign creditors.
Because of its rapidly growing population, the Zambian economy is forecast to increase to US$92.8 billion by 2043.
Although many of the charts in the sectoral scenarios also include GDP per capita, this overview is an essential point of departure for interpreting the general economic outlook of Zambia.
By 1995, GDP per capita in Zambia had declined by almost half from what it was at independence in 1964 owing to a collapse in the copper price, inward-looking economic policies and regional instability. However, with the election of the MMD government in 1991, Zambia embarked on wide-scale economic reform. Income growth has been strong since, but recovered to independence levels only by 2011. Income growth plateaued from 2014 to 2019 as copper prices declined and sparse rainfall also saw poor agricultural outputs. The impact of the COVID-19 pandemic has also negatively affected incomes. On the Current Path, Zambia should recover to its pre-pandemic level of GDP per capita sometime in 2023 and then improve rapidly. By 2043, GDP per capita is forecast to be at US$5 467, which is 35% above its level of US$4 036 in 2019.
Similar to many other African countries the majority of the labour force is informally employed: 69.25% in 2019 and accounting for 33.7% of GDP. At 29.2%, Zambia’s informal sector contributes more to its economy than the average for lower middle-income Africa.
Owing to its youthful population structure, Zambia’s labour force is set to increase rapidly, going from 7.5 million people in 2019 to 15.9 million in 2043. These figures represent 53.4% of its population in 2019, and 60.2% in 2043. As a result, in the Current Path forecast, the portion of the labour force employed in the informal sector will slightly decline (to 69.8%), in 2043. This will represent 30.2% of GDP, compared with the average of 26.4% for lower middle-income African countries.
Detailed analysis for the International Labour Organization (ILO) gives a higher estimate of the informal sector in Zambia. For example, a 2019 study found that in 2015 ‘88.7% of the employed Zambian population work informally. Informality rates are highest (virtually 100%) among contributing family workers and own-account workers, resulting in more variation in working conditions amongst employees. Informality rates are generally higher in rural areas, though they still exceed 50% for urban employees. Virtually all workers in the primary sector (defined as working in the farming, fishing and forestry industries) are informally employed.’
The IFs platform uses data from the Global Trade and Analysis Project (GTAP) to classify economic activity into six sectors: agriculture, energy, materials (including mining), manufacturing, services and information and communications technology (ICT). Most other sources use a threefold distinction between only agriculture, industry and services, with the result that data may differ.
Copper mining dominates the Zambian economy and is included as part of the contribution from the materials sector in the IFs sectoral economic composition. Zambia is Africa’s second largest copper producer (after neighbouring DR Congo), but the country has not been able to increase local content and maximise in-country value from its copper and gold mining despite these activities dominating government revenues.
Other sectors have suffered as productivity in mining has fallen and input costs, particularly for reliable electricity, have increased. In 2019, materials contributed 13.6% of GDP (US$4.8 billion) with a slight increase expected in the Current Path forecast to 2043, when it will contribute 18.5% to GDP (US$17.1 billion). In 2019, manufacturing contributed 10.5% to GDP (US$3.7 billion), ICT 5.5% (US$1.9 billion) and agriculture 5.8% (US$2 billion).
The 2019 size of Zambia’s services sector, contributing 62.2% to GDP, was almost 14 percentage points larger than the average for lower middle-income countries in Africa, much of that consisting of low-end services. Zambia’s agricultural sector is also smaller – by almost 12 percentage points – while the contribution from manufactures is almost nine percentage points lower than the average for lower middle-income countries in Africa. With a relatively small agricultural and manufacturing sector compared to its peers, Zambia has a particularly low-productivity, low-employment economy, which translates to very high levels of extreme poverty, malnourishment/food insecurity, and a large, unproductive informal sector.
Looking ahead to 2043, the contribution from the agriculture sector will decline from 5.8% in 2019 to 3.5% in 2043, and manufacturing will modestly increase from 10.5% to 12.1%. While Zambia’s ICT sector’s contribution is on par with the average for lower middle-income countries in Africa, it grows more slowly, reflecting a less dynamic economy.
The data on agricultural production and demand in the IFs forecasting platform initialises from data provided on food balances by the Food and Agriculture Organization (FAO). IFs contains data on numerous types of agriculture but aggregates its forecast into crops, meat and fish, presented in million metric tons. Chart 9 shows agricultural production and demand as a total of all three categories.
Agriculture contributed 5.8% to Zambia’s GDP in 2019 (equivalent to US$2 billion) and is set to decline to 3.4% of GDP in the Current Path forecast, with its value increasing to US$3.2 billion by 2043. Because IFs uses a sixfold sectoral categorisation of the structure of the economy, the number is significantly below what is often quoted in other sources that suggest agriculture contributes up to 20% of GDP – see Chart 8.
In 2019, agricultural production stood at 14 million metric tons, above the estimated demand of 13.4 million metric tons. This positive picture is expected to decline in the Current Path forecast and by 2043 the demand will outstrip supply by 7.2 million metric tons. This forecasted shortfall paints a picture of growing food insecurity.
There are numerous methodologies and approaches to defining poverty. We measure income poverty and use GDP per capita as a proxy. In 2015, the World Bank adopted the measure of US$1.90 per person a day (in 2011 international prices), also used to measure progress towards the achievement of Sustainable Development Goal 1 of eradicating extreme poverty. To account for extreme poverty in richer countries occurring at slightly higher levels of income than in poor countries, the World Bank introduced three additional poverty lines in 2017:
- US$3.20 for lower middle-income countries
- US$5.50 for upper middle-income countries
- US$22.70 for high-income countries.
According to Zambia’s Vision 2030 ambition, the country aims ‘to reduce national poverty headcount to less than 20% of the population; to reduce income inequalities measured by a Gini coefficient of less than 40; to provide secure access to safe potable water sources and improved sanitation facilities to 100% of the population in both urban and rural areas; to attain education for all; and, to provide equitable access to quality health care to all by 2030’.
These ambitions are not on track. Zambia still has some of the highest levels of poverty and inequality globally, particularly in rural areas where female-headed households are disproportionately affected.
Rates of poverty peaked in 2010, when more than 65% of the country’s population lived below the US$1.90 threshold, a rate that declined to 55% in 2019 and which will, in the Current Path forecast, decline to 45.7% by 2043. Using the US$3.20 poverty threshold for lower middle-income countries, the 2019 rate was 74.4% (13.2 million) and is expected to decrease to 67.3% by 2043 (22 million) in the Current Path forecast. In 2019, Zambia’s poverty rates were 24 percentage points above the average for lower middle-income Africa and the poverty gap is expected to increase, with Zambia’s poverty rates being 29 percentage points higher than its income peers.
According to the World Bank, more than 616 000 households, representing 3 million Zambians (20% of the population), were registered to receive social grants in 2020 – a relatively small portion given the levels of extreme poverty. Much of the money comes from international development partners and the intention is to expand coverage to 30% of the total population and 50% of the country’s poor citizens by 2022.
The IFs platform forecasts six types of energy, namely oil, gas, coal, hydro, nuclear and other renewables. To allow comparisons between different types of energy, the data is converted into billion barrels of oil equivalent (BBOE). The energy contained in a barrel of oil is approximately 5.8 million British thermal units (MBTUs) or 1 700 kilowatt-hours (kWh).
Investment in power generation has not kept pace with demand. Most of Zambia’s installed electricity generation capacity (85% equivalent to 2.393 GW) comes from hydropower, particularly from the Kariba Dam (1.6 GW) and the recently completed 750 MW Kafue Gorge Lower hydro-electric power project. From 2000 to 2014, variable rainfall impacted on electricity generation from hydropower as well as negatively affected agricultural outputs, resulting in dampened economic growth.
In 2019 total energy production in Zambia amounted to 24.2 MBOE, forecast to increase to 91.5MBOE by 2043. In IFs, coal contributes 1.7 MBOE (9%) , hydropower 22 MBOE (90%), and wind/solar energy 0.39 MBOE (<1%).
Carbon is released in many ways, but the three most important contributors to greenhouse gases are carbon dioxide (CO2), carbon monoxide (CO) and methane (CH4). Since each has a different molecular weight, IFs uses carbon. Many other sites and calculations use CO2 equivalent.
Carbon emissions in Zambia come from a very low level. In 2019, Zambia emitted 1.3 million tons of carbon. It is forecast that carbon emissions will peak at 4.4 million tons in 2036, before declining to 2.5 million tons by 2043. This is as a result of more hydroelectricity capacity being brought online and a reduction in coal dependency.
Sectoral Scenarios for Zambia Development Futures
Download to pdfThe Stability scenario represents reasonable but ambitious reductions in risk of regime instability and lower levels of internal conflict. Stability is generally a prerequisite for other aspects of development and this would encourage inflows of foreign direct investment (FDI) and improve business confidence. Better governance through the accountability that follows substantive democracy is modelled separately.
The intervention is explained in here in the thematic part of the website.
Unlike many of its neighbours, Zambia avoided the instability that accompanied decolonisation and liberation, earning itself a reputation for stability. The country has held successful democratic elections every five years since 1990. However, Zambia has the largest youth bulge (adults aged 15–29 years) in Southern Africa (and about 8 percentage points higher than the average for Africa’s 23 lower middle-income countries), which could, on top of slow growth and lack of opportunities, increase social turbulence. In 2019, the portion of its youth bulge was 52% of the total adult population, set to decline only slowly to 44% by 2043.
The Stability scenario improves Zambia’s score on the IFs Government Security Index by 12% above the Current Path forecast in 2043.
On the Current Path, GDP per capita will be at US$5 467 in 2043, which is 35% above its level of US$4 036 in 2019. In the Stability scenario it gets to US$5 715 in 2043 – an increase of almost 5% above the Current Path forecast. Income levels will remain substantially below the average for lower middle-income Africa throughout the forecast horizon.
In 2019, 13.2 million people (or 74.4% of Zambia’s total population) lived in extreme poverty (using US$3.20). The number of extremely poor people will increase to 22 million by 2043 in the Current Path forecast, representing a modest reduction to 67.3% of the population. The Stability scenario reduces poverty by 700 000 persons (2.1%) by 2043.
This section presents the impact of a Demographic scenario that aims to hasten and increase the demographic dividend through reasonable but ambitious reductions in the communicable-disease burden for children under five, the maternal mortality ratio and increased access to modern contraception.
The intervention is explained in here in the thematic part of the website.
Demographers typically differentiate between a first, second and even a third demographic dividend. We focus here on the contribution of the size of the labour force (between 15 and 64 years of age) relative to dependants (children and the elderly) as part of the first dividend. A window of opportunity opens when the ratio of the working-age population to dependants is equal to or surpasses 1.7.
In 2019, the ratio of working-age persons to dependants in Zambia was less than 1.2 and set to get to 1.7 only by 2053, at which point Zambia could start benefiting from a demographic dividend. Because Zambia has such a young population, the average ratio in 2019 for lower middle-income countries in Africa was slightly higher at 1.3.
The Demographic scenario has a strong and positive impact on Zambia’s population profile, to the extent that it advances Zambia’s demographic dividend entry by a decade. In the Demographic scenario Zambia enters its potential demographic dividend in 2041, with positive impacts on a range of other measures such as funds available to spend on education, health, etc.
The infant mortality rate is the number of infant deaths per 1 000 live births and is an important marker of the overall quality of the health system in a country.
In 2019 the rate of infant mortality in Zambia was 42.3 deaths per 1 000 live births, compared with the average rate of 46.8 for Africa and 46.4 for Africa’s 23 lower middle-income countries. On the Current Path, Zambia’s rate is set to decline to 28.5 in 2043, still below the average for lower middle-income Africa (at 29.7) but above the continental average then forecast to have declined to 25.6 deaths. According to UNICEF ‘inadequate infrastructure, access to services and quality of care are the key factors hindering stronger progress for the health of women and children. Despite improvements, neonatal and maternal mortality rates remain high in Zambia.’
In the Demographic scenario, Zambia’s infant mortality rate will decline to 22.9, a reduction of 5.6 deaths per 1 000 compared with the average reduction of 4.8 for Africa in this scenario. Zambia will therefore close some of the gap between its average rate and that for Africa.
On the Current Path, GDP per capita will be at US$5 467 in 2043. In the Demographic scenario, per capita income is forecast to be US$5 724 in 2043, almost 5% (US$257) above the Current Path forecast for that year. Because population structures change slowly, the effect of the scenario is marginal at first. Its impact accelerates over time and adds a powerful gearing to other sectors such as education. For example, a reduction in population numbers, especially youth, reduces the number of children that enter schooling and thus reducing the requirement for teachers, schools and other capital-intensive resources.
In 2019, 13.2 million people (or 74.4% of Zambia’s total population) lived in extreme poverty (using US$3.20), a number that is set to increase to 22 million by 2043 in the Current Path forecast, although representing a modest reduction to 67.3% of the population. In the Demographic scenario poverty rates decline by 2.2 percentage points to 65.1%, lifting an additional 2.1 million Zambians out of poverty. Eventually, together with improvements in agriculture, education and health, the Demographic scenario becomes a powerful lever with positive impacts on general wellbeing.
This section presents reasonable but ambitious improvements in the Health/WaSH scenario, which include reductions in the mortality rate associated with both communicable diseases (e.g. AIDS, diarrhoea, malaria and respiratory infections) and non-communicable diseases (NCDs) (e.g. diabetes), as well as improvements in access to safe water and better sanitation. The acronym WaSH stands for water, sanitation and hygiene.
The intervention is explained in here in the thematic part of the website.
According to Zambia’s Vision 2030 ambition, the country aims ‘to provide secure access to safe potable water sources and improved sanitation facilities to 100% of the population in both urban and rural areas; to attain education for all; and, to provide equitable access to quality health care to all by 2030’.
Life expectancy in Zambia is low – even by comparable African and lower middle-income standards – largely owing to the lingering impact of HIV/AIDS. In 2019, the average life expectancy in Zambia was 59.7 years, eighth lowest in Africa and third lowest among its African income peers. In the Current Path forecast, life expectancy is set to increase to 66.4 years by 2043. Zambia will then have the second lowest life expectancy in lower middle-income Africa, above only Lesotho. The Health/WaSH scenario improves life expectancy in Zambia by almost one year, to 67.4 years, in 2043. By then the average life expectancy in Africa in the Current Path forecast would be 72.1 years and 73.3 years for lower middle-income Africa.
In 2019 the rate of infant mortality in Zambia was 42.3 deaths per 1 000 live births, which is better than the average of 46.4 deaths for lower middle-income Africa. Infant mortality rates are high as a result of poor access to improved sanitation and water. The situation in rural areas is of particular concern.
On the Current Path, the rate of infant mortality is set to decline to 28.5 by 2043. As the average for lower middle-income Africa would have declined to 29.7 deaths per 1 000 by that time, Zambia will experience slower progress.
In the Health/WaSH scenario, Zambia’s infant mortality rate declines to 24.2 by 2043 as infrastructure improves and preventable communicable disease death rates decline. In this scenario, Zambia makes more rapid progress than many other countries and will improve its ranking significantly, performing 1.7 percentage points better than the average for lower middle-income Africa by 2043.
The Agriculture scenario represents reasonable but ambitious increases in yields per hectare (reflecting better management and seed and fertiliser technology), increased land under irrigation and reduced loss and waste. Where appropriate, it includes an increase in calorie consumption, reflecting the prioritisation of food self-sufficiency above food exports as a desirable policy objective.
The intervention is explained in here in the thematic part of the website.
The data on yield per hectare (in metric tons) is for crops but does not distinguish between different categories of crops.
Despite its large agricultural potential with sufficient water resources and a more favourable climate, Zambia suffers from significant levels of food insecurity and malnutrition rates are very high. Less than 6% of Zambia's total land area (74.3 million hectares) is used for crop production, 27% for grazing and 65% is covered by forests.
There are many reasons for poor yields and low levels of food production, including low levels of investment in irrigation systems and rural infrastructure, land use and tenure patterns. In IFs, only 155 700 hectares of farmland was irrigated in 2019 and the majority of farmers depend on rainfall, which is becoming increasingly variable.
Agriculture contributed 5.8% to Zambia’s GDP in 2019 (equivalent to US$2 billion) and is set to decline to 3.4% of GDP by 2043 in the Current Path forecast, although its value increases to US$3.2 billion. Because IFs uses a sixfold sectoral categorisation of the economy, the contribution of agriculture to GDP in Zambia is significantly below what is often quoted in other sources, which consider agriculture contributing up to 20% of GDP – see Chart 8. In the Agriculture scenario, the 2043 contribution to GDP is expected to be 5.3% (equivalent to US$5.1 billion).
Domestic food production consists of crops such as maize, sorghum, millet and cassava, while exports include sugar, soybeans, coffee, groundnuts, rice and cotton, as well as horticultural produce.
In the Current Path forecast crop yields increase from 3.4 tons per hectare in 2019 to 3.9 tons in 2043, significantly below yields for lower middle-income Africa (6.1 tons per hectare). In the Agriculture scenario, crop yields improve to 6.5 tons per hectare in 2043, and the area of irrigated land increases to 442 500 hectares instead of the 2043 Current Path forecast of 157 00 hectares.
In 2019, Zambia produced 14 million metric tons (MMT) of crops, mostly maize. Annual food production routinely exceeds domestic demand yet malnutrition rates are among the highest in the world. According to the World Food Programme (WFP) ‘while food production at the national level routinely exceeds domestic requirements, the availability of and access to adequate nutritious food remains a challenge for many poor households, which is compounded by the country’s over-reliance on maize. Overweight and obesity, especially among women, is a growing problem attributed to high consumption of unhealthy diets.’
The Current Path forecast is for crop production to increase to 22.7 MMT in 2043. In the Agriculture scenario crop production is 62% larger (35 MMT) in 2043. As a result, the number of calories available per capita in this scenario increases from 2 117 in 2019 to 2 840, compared with 2 450 by 2043 on the Current Path. However, the distribution of calories is unequal. According to the WFP, 48% of Zambia’s population is unable to meet their minimum calorie requirement and more than one-third of children under five years stunted.
In 2019, Zambia’s crop production exceeded demand by just more than 2%. In the Current Path forecast, the country will import 24.3% of its crop requirements in 2043. In the Agriculture scenario, domestic production exceeds demand by nearly 5%, pointing to Zambia’s potential and the benefits of improving the efficiency of the agricultural sector.
On the Current Path, GDP per capita will be at US$5 467 in 2043, which is 35% above its level of US$4 036 in 2019. In the Agriculture scenario, per capita income increases to US$5 627 in 2043 – an improvement of US$160 (or 3%) above the Current Path forecast. The modest increase reflects the large portion of Zambians active in the informal sector and the high levels of extreme poverty.
In 2019, 13.2 million people (or 74.4% of Zambia’s total population) lived in extreme poverty (using US$3.20), a number that is set to increase to 22 million by 2043 in the Current Path forecast, although representing a modest reduction to 67.3% of the population. In the Agriculture scenario, the number of extremely poor people declines to 20.8 million in 2043 (63.6% of the population), equivalent to a 4% reduction compared with the Current Path forecast.
The Education scenario represents reasonable but ambitious improved intake, transition and graduation rates from primary to tertiary levels and better quality of education. It also models substantive progress towards gender parity at all levels, additional vocational training at secondary school level and increases in the share of science and engineering graduates.
The intervention is explained in here in the thematic part of the website.
In 2019, the Zambian government's expenditure on education was 6.7% of GDP, more than half a percentage point higher than the average for lower middle-income countries in Africa. The Current Path forecast is that it will modestly decline to 6.2% by 2043, while the average for lower middle-income countries will decline by almost a percentage point. As a result, mean years of adult education (7.8 years in 2019) is forecast to increase to 8.4 years in 2043. In the Education scenario, it increases to 8.8 years and government expenditure is 0.2 percentage points higher in 2043. However, while mean years of adult education in Zambia in 2019 was almost half a year higher than the average for lower middle-income Africa, it will be slightly lower on the Current Path by 2043 – implying that most other countries at similar levels of development are doing better.
Despite significant improvement in access, the education system is plagued by inadequate resources, poor education quality and low progression rates. Although primary enrolment and completion rates are high, lower secondary and upper secondary enrolment was 11 and 14 percentage points below the averages of lower middle-income African countries in 2019, respectively. Lower and upper secondary completion rates were both 10 percentage points below the average for lower middle-income Africa.
In summary, Zambia does well on primary education but its secondary education system does very poorly on almost every measure.
In the Current Path forecast, the percentage of Zambian adults who have achieved secondary graduation will remain roughly 11 percentage points below the average for lower middle-income Africa by 2043, although improving from 18% in 2019 to 26% in 2043.
Education quality in Zambia is low. In 2019 the average total test score for primary school learners was 3.4% below the average for lower middle-income countries, with marginal prospects for improvement on the Current Path. Primary test scores in the Education scenario improves from 30.2 in 2019 to 37 by 2043, nearly 15 percentage points higher than in the Current Path forecast. Zambia does better on secondary test scores and its 2019 average is comparable to the average for lower middle-income Africa, perhaps because of the large drop in Zambia’s enrolment numbers after primary school. By 2043, secondary test scores in the Education scenario are expected to have improved by almost 17% above the Current Path forecast.
Education quality is particularly low in rural Zambia owing to poor access, long distances and higher rates of poverty.
On the Current Path, GDP per capita will be at US$5 467 in 2043. The Education scenario improves per capita income by 4% (or US$209) above the Current Path forecast in 2043. The modest contribution of education to incomes probably reflects the fact that most Zambians are active in the informal services sector, where additional educational attainment makes a limited contribution to productivity.
In 2019, 13.2 million people (or 74.4% of Zambia’s total population) lived in extreme poverty (using US$3.20), a number that is set to increase to 22 million by 2043 in the Current Path forecast, although representing a modest reduction to 67.3% of the population. The impact of the Education scenario is to reduce extreme poverty by 2.3 percentage points, equivalent to 818 000 people. The modest contribution of better education to reducing extreme poverty is similar to its effect on GDP per capita.
The Manufacturing/Transfers scenario represents reasonable but ambitious manufacturing growth through greater investment in the economy, investments in research and development, and promotion of the export of manufactured goods. It is accompanied by an increase in welfare transfers (social grants) to moderate the initial increases in inequality that are typically associated with a manufacturing transition. To this end, the scenario improves tax administration and increases government revenues.
The intervention is explained in here in the thematic part of the website.
Chart 31 should be read with Chart 8, which presents a stacked area graph on the contribution to GDP and size, in billion US$, of the Current Path economy for each of the sectors.
IFs uses a sixfold sectoral composition of the economy according to which manufactures contributed 10.5% to GDP in Zambia in 2019 (equivalent to US$3.7 billion). This is set to decline to 8.8% of GDP by 2032 before increasing to 12.1% by 2043 (US$11.2 billion). In the Manufacturing/Transfers scenario the contribution from manufactures increases by 0.4 percentage points above the Current Path forecast, reflecting an additional US$1.1 billion by 2043.
To date, Zambia's efforts to promote and facilitate industrial growth have been unsuccessful. The efforts in the 1980s to put the state in control of the industrial sector were followed by efforts to increase the role of the private sector, with similarly dismal results. The failure is reflected in the fact that the contribution from the sector was more than eight percentage points below the average for Africa’s 23 lower middle-income economies in 2019. In both the Current Path forecast and the Manufacturing/Transfers scenario, the gap increases to 11 percentage points by 2043, reflecting poor industrial growth even by comparative African standards.
In addition to inappropriate policy and poor implementation, the reasons for slow growth can largely be found in the country’s poor human capital endowment and lack of infrastructure.
In 2019, government welfare transfers amounted to US$2.05 billion, increasing to US$5.77 billion by 2043 in the Current Path forecast. In the Manufacturing/Transfers scenario, welfare transfers increase to US$8 billion. Most of the current funding is from donors as part of the Social Cash Transfer Program. For example, in 2020, financing by the World Bank and UK and Swedish governments benefited 370 000 households, with plans being to increase the number of beneficiaries to 994 000 by 2022.
On the Current Path, GDP per capita will be at US$5 467 in 2043, which is 35% above its level of US$4 036 in 2019. By 2043, it improves by 5% (equivalent to US$249) in the Manufacturing/Transfer scenario, reaching US$5 716. Zambia benefits less from the interventions proposed under the Manufacturing/Transfers scenario than the average for lower middle-income Africa.
In 2019, 13.2 million people (or 74.4% of Zambia’s total population) lived in extreme poverty (using US$3.20), a number that is set to increase to 22 million by 2043 on the Current Path, although representing a modest reduction to 67.3% of the population. The Manufacturing/Transfers scenario results in a reduction of 2.4% (820 000) fewer people living in extreme poverty by 2043.
The Leapfrogging scenario represents a reasonable but ambitious adoption of and investment in renewable energy technologies, resulting in better access to electricity in urban and rural areas. The scenario includes accelerated access to mobile and fixed broadband and the adoption of modern technology that improves government efficiency and allows for the more rapid formalisation of the informal sector.
The intervention is explained in here in the thematic part of the website.
Fixed broadband includes cable modem Internet connections, DSL Internet connections of at least 256 KB/s, fibre and other fixed broadband technology connections (such as satellite broadband Internet, ethernet local area networks, fixed-wireless access, wireless local area networks, WiMAX, etc.).
Zambia, and Africa more generally, is moving rapidly towards high rates of access to mobile broadband (Chart 35) although fixed broadband subscriptions are also increasing. Statistics from the Zambia Information and Communications Technology Authority show that about 56% of Zambians have Internet service, with less than 1% connecting through PCs. Most people access the Internet using smartphones, with the majority using feature phones.
In 2019, the number of fixed broadband subscriptions per 100 people in Zambia was less than 3, roughly in line with the average for lower middle-income Africa. In the Current Path forecast, rates will increase to above 23 by 2043 – slightly below the average of 26.5 for Africa’s lower middle-income countries. In the Leapfrogging scenario, the number of subscriptions per 100 people increase to 48 by 2043, which is more than double the Current Path forecast and on par with the average for lower middle-income Africa.
Mobile broadband refers to wireless Internet access delivered through cellular towers to computers and other digital devices.
In 2019, the number of mobile broadband subscriptions per 100 people in Zambia was 85, significantly above the 49 for lower middle-income Africa. In 2043, subscriptions are forecast to increase to 144.2, with the rate of increase slowing down as rates reach saturation. Because of the rapid increase in the Current Path, the impact of the Leapfrogging scenario is quite modest – with subscriptions increasing to 146 by 2043 – although the scenario pushes up the rate of increase quite rapidly during the early years.
In 2019, just more than a third of Zambians had electricity access (34.5%). In the Current Path forecast, the rate will improve to 57.4% by 2043 and to 69.3% in the Leapfrogging scenario. Rural rates are, however, extremely low, below 10% in 2019 and forecast to improve to only 22.2% by 2043, when 14.4 million Zambians will still be living in rural areas. In the Leapfrogging scenario, rates improve to 36.9%. These rates are significantly below the average for Africa and African lower middle-income countries.
Zambia stands to benefit greatly from the interventions proposed in the Leapfrogging scenario. On the Current Path, GDP per capita will be at US$5 467 in 2043, whereas in the Leapfrogging scenario it gets to US$5 949 – 9% above the Current Path forecast.
In 2019, 13.2 million people (or 74.4% of Zambia’s total population) lived in extreme poverty (using US$3.20), a number that is set to increase to 22 million by 2043 in the Current Path forecast, although representing a modest reduction to 67.3% of the population. The Leapfrogging scenario reduces the number of people living in extreme poverty in 2043 by 957 000, a 3% reduction.
The Free Trade scenario represents the impact of the full implementation of the African Continental Free Trade Area (AfCFTA) by 2034 through increases in exports, improved productivity and increased trade and economic freedom.
The intervention is explained in here in the thematic part of the website.
The trade balance is the difference between the value of a country's exports and its imports. A country that imports more goods and services than it exports in terms of value has a trade deficit, while a country that exports more goods and services than it imports has a trade surplus.
In 2019, Zambia ran a trade deficit equivalent to 6.7% of GDP, set to change to a small surplus in 2043 on the Current Path forecast. The impact of the Free Trade scenario is to increase exports and imports and, by 2043, Zambia is forecast to run a trade deficit equivalent to 4.1% of GDP. In 2019, exports were valued at US$11.6 billion, increasing to US$38.6 billion on the Current Path by 2043. In the Free Trade scenario, the 2043 value of exports will increase to US$55 billion – a difference of US$16.4 billion. Imports are set to increase from US$14.1 billion in 2019 to US$59.7 billion in 2043 in the Free Trade scenario.
Zambia stands to benefit greatly from the interventions proposed in the Free Trade scenario. On the Current Path, GDP per capita will be at US$5 467 in 2043, whereas in the Free Trade scenario it gets to US$6 204 – almost 14% (US$737) above the Current Path forecast. This reflects the huge potential of the AfCFTA for improving livelihoods in Zambia.
In 2019, 13.2 million people (or 74.4% of Zambia’s total population) lived in extreme poverty (using U$3.20), a number that is set to increase to 22 million by 2043 on the Current Path forecast, although representing a modest reduction to 67.3% of the population. The Free Trade scenario will lift an additional 2.4 million people out of poverty by 2043 compared with the Current Path forecast. This is equivalent to a 7.3% poverty reduction, resulting in a 60% poverty rate by 2043.
The Financial Flows scenario represents a reasonable but ambitious increase in worker remittances and aid flows to poor countries, and an increase in the stock of foreign direct investment (FDI) and additional portfolio investment inflows to middle-income countries. We also reduced outward financial flows to emulate a reduction in illicit financial outflows.
The intervention is explained in here in the thematic part of the website.
In 2019, Zambia received US$1.79 billion dollars in net foreign aid. In the Financial Flows scenario net aid decreases to US$2.96 billion in 2043 compared with US$2.80 billion on the Current Path, representing an increase of 6%. Given the steady growth in the Zambian economy, aid, as a portion of GDP, declines from 5.1% in 2019 to 3% in the Current Path forecast and to 3.1% in the Financial Flows scenario.
FDI inflows to Zambia increased considerably when its economy opened in the 1990s, although largely on the back of an ambitious privatisation programme from 1994 to 2001, investments in copper and cobalt extraction, horticulture, floriculture and tourism. In 2019, Zambia received 7.1% of GDP in FDI inflows, among the highest rates in Africa, although rates fluctuate significantly from year to year. Most, if not all, of that investment went into the mining sector (materials within IFs) and little to more productive sectors that could contribute to the structural transformation of the Zambian economy, such as manufactures. By 2043, the rate declines to 5.7% of GDP in the Current Path forecast and 6.5% in the Financial Flows scenario. In the Financial Flows scenario, the stock of FDI in Zambia grows from US$28.8 billion in 2019 to US$87.5 billion in 2043. In the Current Path forecast it is set to be US$75.3 billion. Zambia’s stock of FDI, therefore, improves by 16%. According to a 2021 Investment Climate Statement from the US Department of State: ‘Cumbersome administrative procedures and unpredictable legal and regulatory changes inhibit Zambia’s immense potential for private sector investment. This is compounded by insufficient transparency in government contracting, ongoing lack of reliable electricity, and the high cost of doing business due to poor infrastructure, the high cost of capital, and lack of skilled labour.’
In 2019 Zambia registered a net outflow of US$66 million in remittances within IFs. In the Current Path forecast, the size of the outflow increases to US$205 million. The Financial Flows scenario has a negligible impact on remittances.
The Financial Flows scenario has a modest impact on GDP per capita in Zambia. On the Current Path, income levels will be at US$5 467 in 2043. In the Financial Flows scenario, per capita income improves by only 1% (US$78) compared with the Current Path forecast.
In 2019, 13.2 million people (or 74.4% of Zambia’s total population) lived in extreme poverty, a number that is set to increase to 22 million by 2043 in the Current Path forecast, although this represents a modest reduction to 67.3% of the population. The Financial Flows scenario has a small impact on poverty, reducing the number of Zambians living below US$3.20 per day by 107 000 by 2043, an improvement of 0.3 percentage points above the Current Path forecast.
The Infrastructure scenario represents a reasonable but ambitious increase in infrastructure spending across Africa, focusing on basic infrastructure (roads, water, sanitation, electricity access and ICT) in low-income countries and increasing emphasis on advanced infrastructure (such as ports, airports, railway and electricity generation) in higher-income countries.
Note that health and sanitation infrastructure is included as part of the Health/WaSH scenario and that ICT infrastructure and more rapid uptake of renewables are part of the Leapfrogging scenario. The interventions there push directly on outcomes, whereas those modelled in this scenario increase infrastructure spending, indirectly boosting other forms of infrastructure, including that supporting health, sanitation and ICT.
The intervention is explained in here in the thematic part of the website.
At 35%, total electricity access in Zambia was dismally low in 2019, improving to 57% by 2043. In 2019, total access was 32 percentage points below the average for lower middle-income Africa. Electricity access in rural areas is even worse, having reached only 10% in 2019 and set to improve to only 22.2% in the Current Path forecast by 2043. In the Infrastructure scenario, this climbs to 42%, an improvement of 88%. Urban access rates are much higher: 66% in 2019 and set to increase to 85.3% in 2043 on the Current Path and 89.3% in the Infrastructure scenario.
Indicator 9.1.1 in the Sustainable Development Goals refers to the proportion of the rural population who live within 2 km of an all-season road and is captured in the Rural Access Index.
An analysis by the Southern African Regional Poverty Network notes that 'problems with transport and communications help keep Zambia poor. Whether by rail or road, transport is expensive and unreliable … tarmac roads do not even reach every district, and nearly 80% of gazetted roads are made of gravel or earth. The quality of most roads is very bad – a result of many years of poor maintenance. This has a direct effect on the rural poor, isolating them from markets and services ... There is almost no way of communicating with most rural places, which helps to maintain poverty.’
In 2019, less than 72% of Zambia’s rural population stayed within 2 km of an all-season road, compared with the African average of 53%. By 2043, the average for Zambia is unchanged in the Current Path forecast, but it increases to 73% in the Infrastructure scenario. The effect of the Infrastructure scenario is modest, increasing total road length in Zambia by only 4 733 km above the Current Path forecast in 2043.
Zambia stands to benefit from the interventions proposed in the Infrastructure scenario. On the Current Path, GDP per capita will be at US$5 467 in 2043 and US$5 865 on the Infrastructure scenario, a difference of 7% (or US$398).
In 2019, 13.2 million people (or 74.4% of Zambia’s total population) lived in extreme poverty, a number that is set to increase to 22 million by 2043 in the Current Path forecast. In the Infrastructure scenario, the number of extremely poor Zambians reduces by 1.1 million by 2043 compared with the Current Path forecast, an improvement of 3.2 percentage points.
The Governance scenario represents a reasonable but ambitious improvement in accountability and reduces corruption, and hence improves the quality of service delivery by government.
The intervention is explained in here in the thematic part of the website.
As defined by the World Bank, government effectiveness ‘captures perceptions of the quality of public services, the quality of the civil service and the degree of its independence from political pressures, the quality of policy formulation and implementation, and the credibility of the government’s commitment to such policies’.
Zambia does slightly better on governance effectiveness (around 4%) than the average for lower middle-income countries in Africa. In 2019, the World Bank scored it at just below 2 (out of 5). However, the Current Path forecast is for Zambia to improve more slowly and hence converge to the extent that, in 2043, the scores for Zambia and the average for lower middle-income African countries are similar. In the Governance scenario, government effectiveness improves by 2% above the Current Path forecast in 2043.
On the Current Path, GDP per capita will be at US$5 467 in 2043, which is 35% above its level of US$4 036 in 2019. In the Governance scenario, GDP per capita increases to US$5 619, which is US$152 (3%) above the Current Path forecast.
In 2019, 13.2 million people (or 74.4% of Zambia’s total population) lived in extreme poverty, a number that is set to increase to 22 million by 2043 in the Current Path forecast, although this represents a modest reduction to 67.3% of the population. The effect of the Governance scenario is to reduce extreme poverty by 402 000 people in 2043, an improvement of 1.2 percentage points compared with the Current Path forecast.
This section presents projections for carbon emissions in the Current Path for Zambia and the 11 scenarios. Note that IFs uses carbon equivalents rather than CO2 equivalents.
The 2043 Current Path forecast is that Zambia will emit 2.53 million tons of carbon. At 3.77 million tons, the Free Trade scenario emits more carbon than any other scenario by 2043 – perhaps at no surprise because it has the largest positive impact on the size of Zambia’s economy. Carbon emissions in the Free Trade scenario are followed by the Leapfrogging scenario, at 3.36 million tons. Because Zambia has a slightly smaller population in the Demographic scenario, carbon emissions in this scenario is 300 000 tons less than in the Current Path forecast.
The Combined Agenda 2063 scenario consists of the combination of all 11 sectoral scenarios presented above, namely the Stability, Demographic, Health/WaSH, Agriculture, Education, Manufacturing/Transfers, Leapfrogging, Free Trade, Financial Flows, Infrastructure and Governance scenarios. The cumulative impact of better education, health, infrastructure, etc. means that countries get an additional benefit in the integrated IFs forecasting platform, which we refer to as the synergistic effect. Chart 55 presents the contribution of each of these 12 components to GDP per capita in the Combined Agenda 2063 scenario.
On the Current Path, GDP per capita will be at US$5 467 in 2043, up from US$4 036 in 2019. In the Combined Agenda 2063 scenario, per capita income will be US$8 244 in 2043, which is US$2 776 more than in the Current Path forecast, an improvement of 51%. The Free Trade scenario has the largest impact on per capita income by 2043, followed by the Leapfrogging and Infrastructure scenarios. The Financial Flows scenario has the smallest impact, followed by the Health/WaSH scenario.
Chart 55 presents a stacked area graph on the contribution of each scenario to GDP per capita as well as the additional benefit or synergistic effect, whereas Chart 56 presents only GDP per capita in the Current Path forecast and the Combined Agenda 2063 scenario.
On the Current Path, GDP per capita will be at US$5 467 in 2043, which is 35% above its level of US$4 036 in 2019. In the Combined Agenda 2063 scenario, per capita income gets to US$8 244 – a difference of US$2 776, or 51%. This shows the potential value of the interventions in the 11 sectoral scenarios for economic growth.
Zambia’s Vision 2030 aims ‘to reduce national poverty headcount to less than 20 per cent of the population; to reduce income inequalities measured by a Gini coefficient of less than 40; to provide secure access to safe potable water sources and improved sanitation facilities to 100 per cent of the population in both urban and rural areas; to attain education for all; and, to provide equitable access to quality health care to all by 2030’.
In 2019, poverty levels in Zambia – 74.7% of the population (13.2 million people) – were significantly higher than the average of 50.1% for lower middle-income Africa (using US$3.20 as threshold). In the Current Path forecast, poverty is set to modestly decrease, to 67.3% (22 million people), by 2043. In the Combined Agenda 2063 scenario, extreme poverty declines to 42.1% (12.6 million people). The Combined Agenda 2063 scenario therefore has the potential to lift an additional 9.4 million Zambians out of extreme poverty by 2043.
See Chart 8 to view the Current Path forecast of the sectoral composition of the economy.
Zambia has a large services sector (much of which is of an informal nature) and the impact of the Combined Agenda 2063 scenario is that it increases by 4.8 percentage points in its contribution to GDP in 2043 (equivalent to US$44.6 billion) compared with the Current Path forecast. The ICT sector also grows marginally (by 0.7 percentage points) while materials, energy and manufactures decline in their contribution to GDP. All sectors are larger in 2043 owing to a larger economy under the Combined Agenda 2063 scenario.
The structure of Zambia’s economy likely constrains rapid improvements in GDP per capita given the small size of its primary and secondary sectors. Even when comparing Zambia to the average for lower middle-income countries in Africa in the Combined Agenda 2063 scenario, the small size of its agriculture and manufacturing sectors remain significantly below averages for its income peers.
In 2019, the size of the Zambian economy was US$35.4 billion, set to increase to US$92.8 billion by 2043 in the Current Path forecast. At US$157.5 billion, Zambia’s Combined Agenda 2063 economy is forecast to be 70% larger in 2043. IFs does not forecast significant shifts in the sectoral composition of Zambia’s economy, meaning that the services sector dominates, while manufacturing and agriculture contribute less to GDP than in most other lower middle-income African countries. The services sector is particularly large given Zambia’s development status. In the Current Path forecast the contribution from the services sector declines to 57.4% of GDP, while, in the Combined Agenda 2063 scenario, it increases to 62.1%.
In 2019 Zambia emitted 1.31 million tons of carbon into the atmosphere. In the Agenda 2063 scenario, carbon emissions will increase by 140% above the Current Path forecast, resulting in emissions of 6 million tons of carbon. However, carbon emissions in Zambia come from a very low base. This increase reflects an economy that, in 2043, is 70% larger.
Page information
Contact at AFI team is Jakkie Cilliers
This entry was last updated on 15 June 2026 using IFs v7.63.
Donors and sponsors


Reuse our work
- All visualizations, data, and text produced by African Futures are completely open access under the Creative Commons BY license. You have the permission to use, distribute, and reproduce these in any medium, provided the source and authors are credited.
- The data produced by third parties and made available by African Futures is subject to the license terms from the original third-party authors. We will always indicate the original source of the data in our documentation, so you should always check the license of any such third-party data before use and redistribution.
- All of our charts can be embedded in any site.
Cite this research
Jakkie Cilliers (2026) Zambia Development Futures. Published online at futures.issafrica.org. Retrieved from https://futures.issafrica.org/geographic/countries/zambia/ [Online Resource] Updated 15 June 2026.