 Uganda
Feedback welcome
Our aim is to use the best data to inform our analysis. See our Technical page for information on the IFs forecasting platform. We appreciate your help and references for improvements via our feedback form.
This report examines Uganda's current and projected future development. It presents eight sectoral scenarios to forecast progress by 2040, including demographic, economic, and infrastructure-related outcomes. The analysis also considers the implications of the Agenda 2063 goals, aiming to offer insights into policy actions that could enhance Uganda's developmental trajectory and guide the country towards a more prosperous future. The 2040 target year is in line with the Uganda Vision 2040 which is in Chart 2.
For more information about the International Futures modelling platform that we use for the development of the various scenarios, please see About this Site.
Executive Summary
We begin this page with an introductory assessment of Uganda’s context looking at the current population distribution and structure, climate and topography. We also provide an overview of the national development plan.
Uganda, a landlocked East African country on the equator, is bordered by Kenya, South Sudan, Rwanda, Tanzania and DR Congo. Despite political instability since 1962, it has a multiparty democracy with an independent judiciary and a 556-member unicameral parliament. The climate is tropical and the country has rich natural resources, including significant oil reserves, but faces challenges such as poverty, governance issues and infrastructure development.
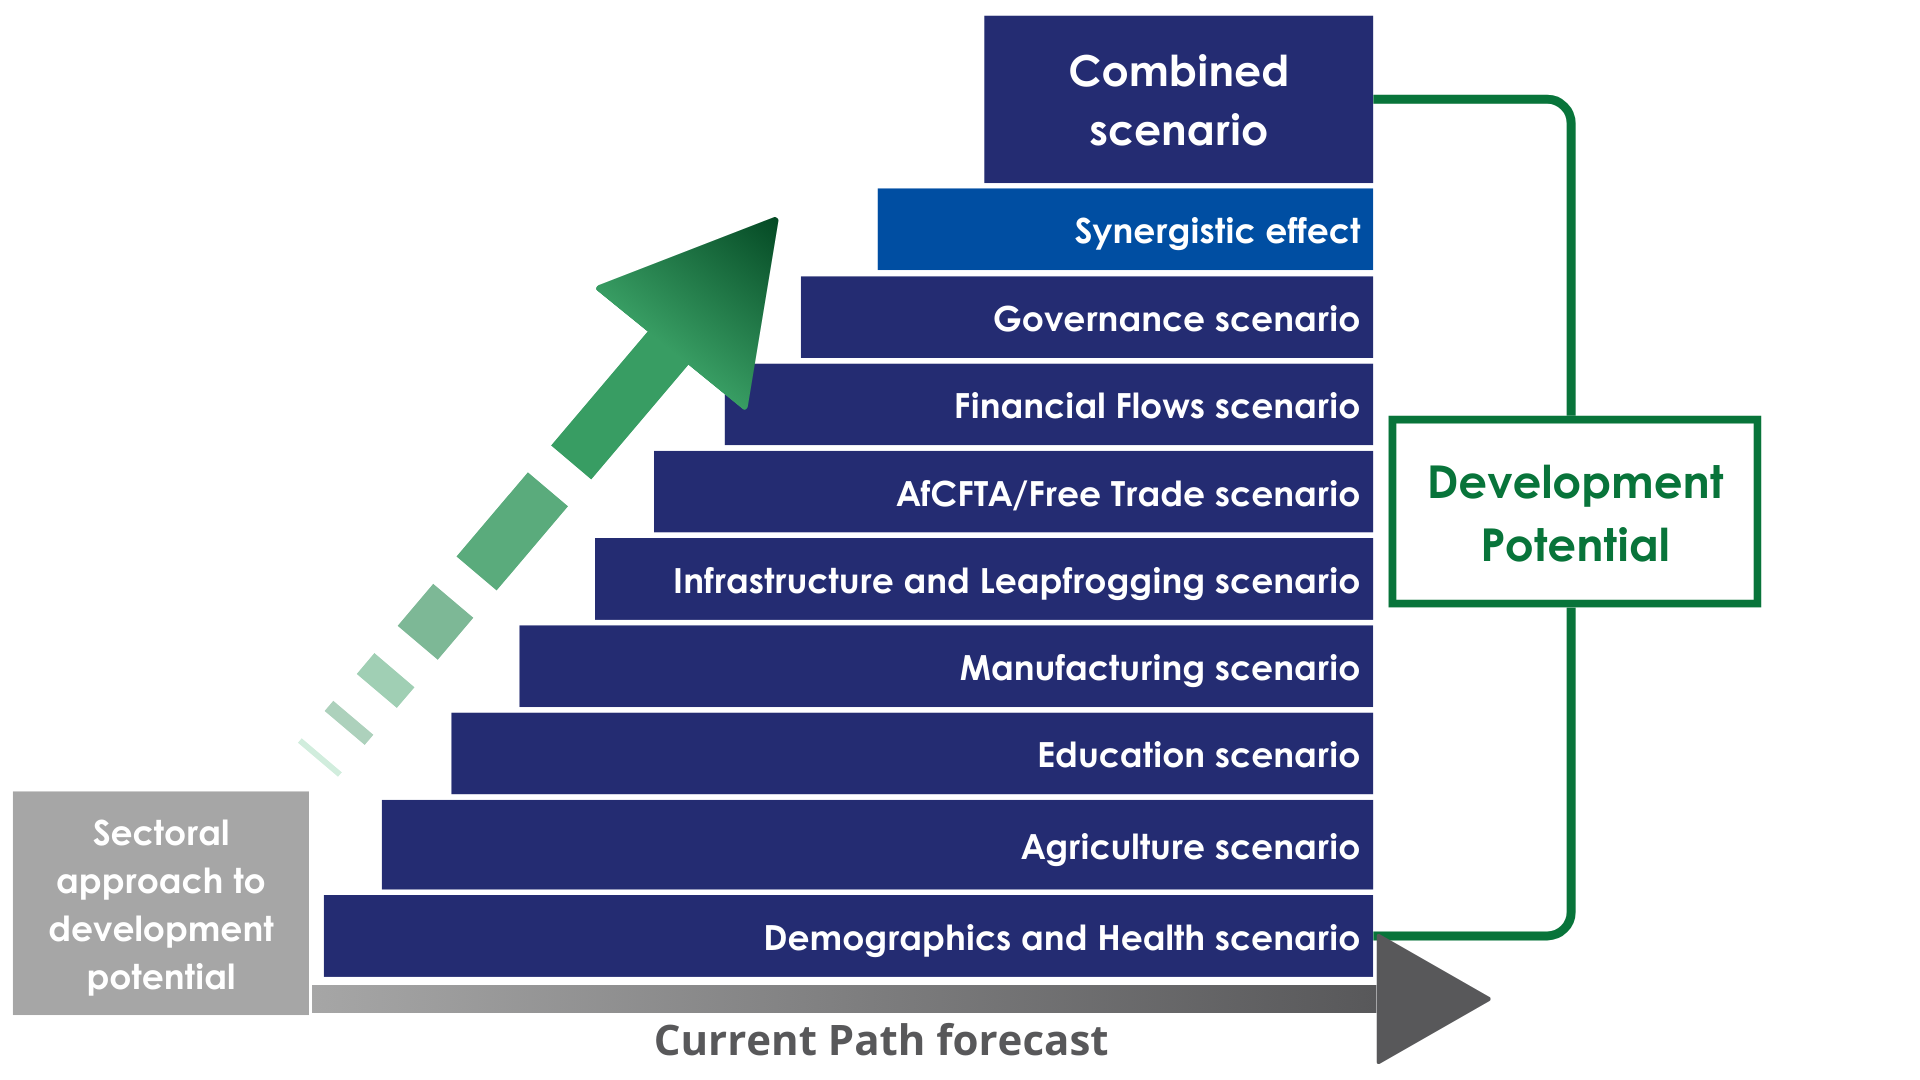
This section is followed by an analysis of the Current Path forecast for Uganda which informs the country’s likely current development trajectory to 2040. It is based on current geopolitical trends and assumes that no major shocks would occur in a ‘business as usual’ future. This section compares progress on the Current Path with eight sectoral scenarios. These are Demographics and Health; Agriculture; Education; Manufacturing; the African Continental Free Trade Area (AfCFTA); Large Infrastructure and Leapfrogging; Financial Flows; and Governance. Each scenario is benchmarked to present an ambitious but reasonable aspiration in that sector.
- Uganda has a large youthful population, with a youth bulge of 53% in 2019. If concerted efforts are not made to accelerate the demographic transition, Uganda will only enter a potential demographic window of opportunity in 2052 as opposed to 2040 in the Demographics and Health scenario.
- The universal primary/secondary enrolment rate has had a significant impact on enrolment rates in Uganda. Yet, education quality is modest due to continued challenges in teaching space and materials, the number of teachers and the disbursement of government funds. The Education scenario will push average test scores 6.3 points above the continental average for low-income countries by 2040.
- Uganda’s infrastructure sector faces a number of challenges: lack of paved and rural roads, limited rural electrification and the need for greater fixed broadband connectivity. The Large Infrastructure and Leapfrogging scenario improves the electricity access rate by 21 percentage points, increases fixed broadband connections by 5.6 per 100 people and boosts the use of modern fuel stoves by 24 percentage points above the Current Path by 2040.
- Agriculture is an integral part of the Ugandan economy: it contributed 21% of GDP and 46% of export earnings and employed 55% of the labour force in 2019. By 2040, the effect of the Agriculture scenario is to reduce Uganda’s dependency on importing crops by 64.4% and meat by 2% below the Current Path.
- The manufacturing sector is important in Uganda, contributing 15.5% of GDP and employing 14.5% of the labour force in 2019. However, it lacks appropriate infrastructure, has weak small- to medium-sized enterprises (SMEs) and struggles with limited access to finance and high costs of doing business. The Manufacturing scenario raises the contribution of manufacturing to GDP by 5 percentage points above the Current Path by 2040.
- Despite being a member of many bilateral and multilateral regional trading blocs, trade has not increased significantly in Uganda due to its landlocked nature, low agricultural productivity and negligible manufacturing activity to support exports and reduce imports. The full implementation of the AfCFTA will benefit Uganda and dramatically improve its trade balance by 2040.
- In the Financial Flows scenario, foreign aid receipts increase to US$7.2 billion – above the US$5.9 billion in the Current Path for 2040. Furthermore, it will increase FDI inflows to 5.4% in the Financial Flows scenario by 2040, compared to 4.7% in the Current Path.
- The Ugandan government lacks the capacity to effectively mobilise government revenue, reduce corruption, improve regulatory quality and economic freedom and enhance government effectiveness. This is reflected in its governance capacity score being below the average for low-income African countries. In the Governance scenario, Uganda will improve its score by 11.7% above the Current Path by 2040.
The third section compares the impact of each of the eight sectoral scenarios on key indicators (economy, poverty and inequality, carbon emissions). It then proceeds with a Combined Agenda 2063 scenario analysis (the sum effect of all eight scenarios).
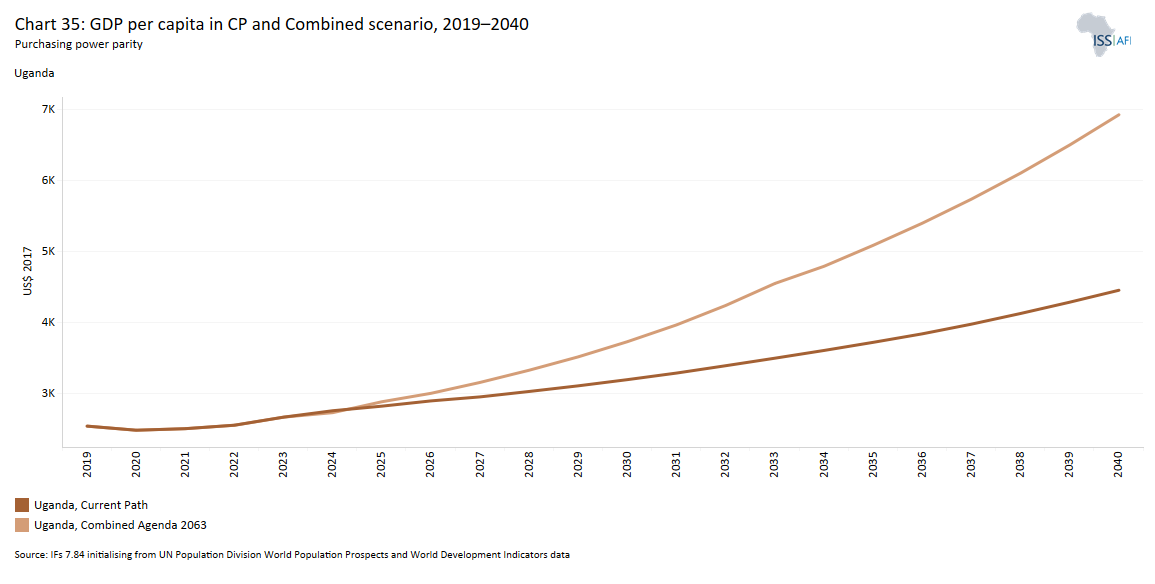
- To realise the aspirations in its Vision 2040 long-term development plan, the Ugandan authorities should make an integrated effort across all sectors as represented in the Combined scenario, which is forecast to improve GDP per capita by an additional US$2 472 above the Current Path in 2040.
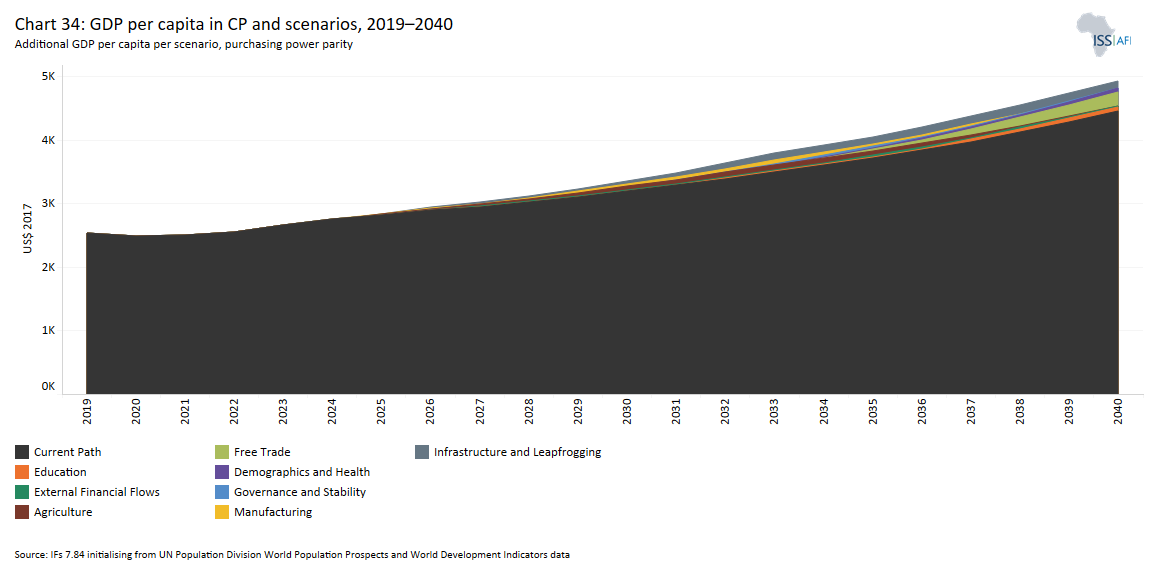
- The scenario with the greatest impact on GDP per capita by 2040 is the Large Infrastructure and Leapfrogging scenario, followed by Governance, Demographics and Health, and Manufacturing. This suggests that these sectors should be supported to unlock more rapid economic growth in the long term.
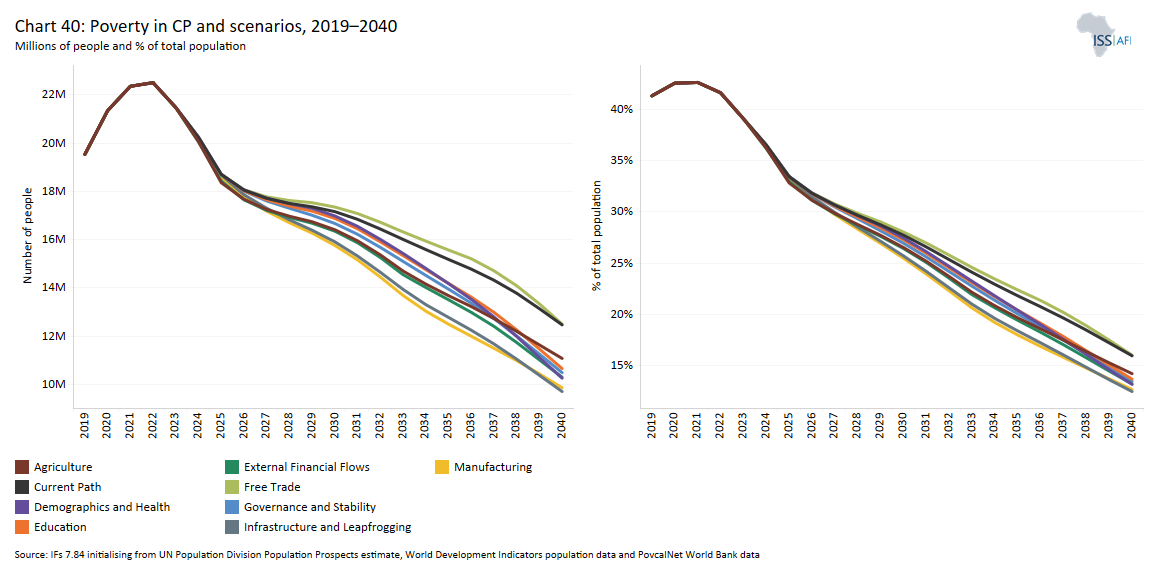
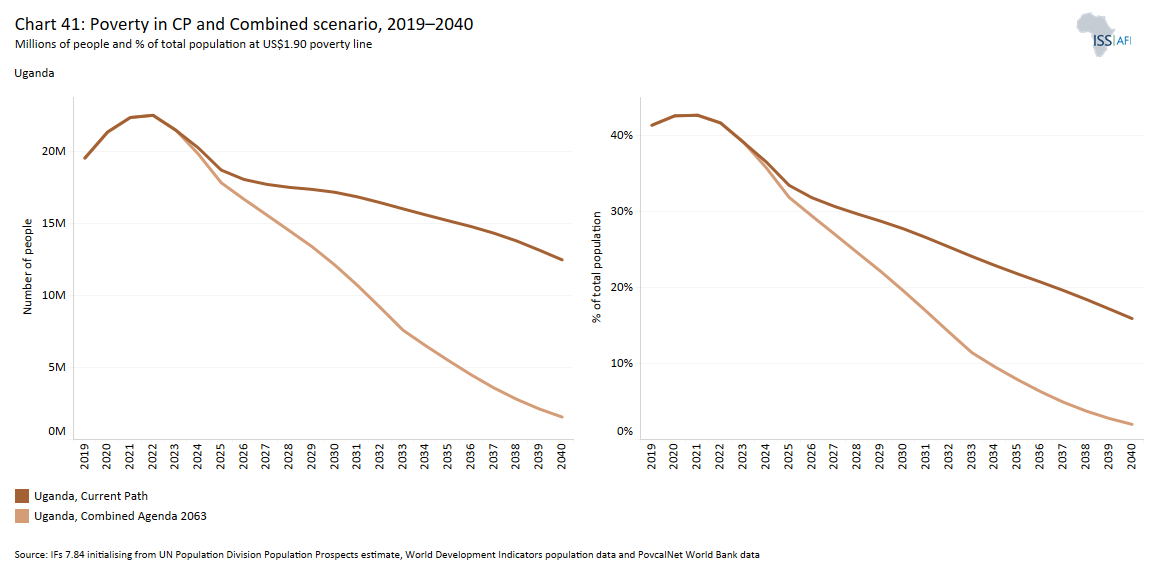
- The interventions will collectively take 11.03 million more people out of poverty (at US $1.90) by 2040, equivalent to a decline of 13.9 percentage points compared to the Current Path for 2040. However, the Large Infrastructure and Leapfrogging scenario, followed by the Manufacturing scenario and then the Demographics and Health scenario have the greatest potential to reduce poverty in Uganda by 2040, so greater emphasis should be placed on these sectors in the fight against poverty in Uganda.
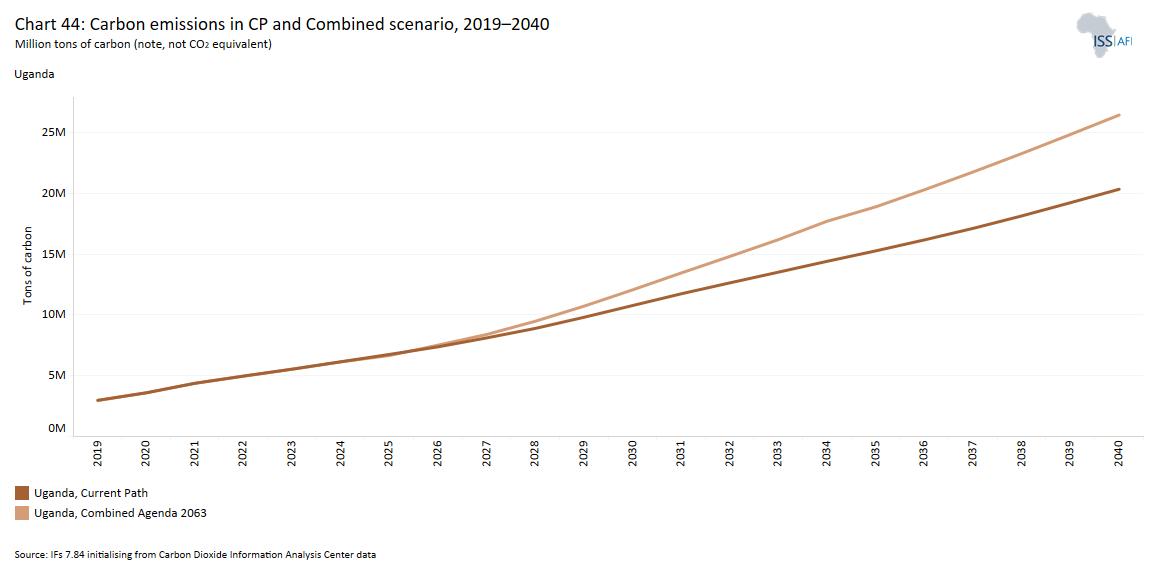
- The effect of the Combined scenario is to further push carbon emissions to 26 million tons by 2040, representing a 30% increase above the Current Path. The additional 6 million tons mainly stem from the Manufacturing and Governance scenarios.
We end this page with a summarising conclusion offering key recommendations for decision-making. Despite significant achievements in education, infrastructure, and foreign capital attraction, Uganda must implement rigorous socio-economic policies to achieve its Vision 2040 aspirations and address persistent challenges.
All charts for Uganda Development Futures
- Chart 1: Political map of Uganda
- Chart 2: National development plan of Uganda
- Chart 3: Diagram of Current Path and sectoral scenarios
- Chart 4: Population structure in CP, 1990–2040
- Chart 5: Population distribution map, 2022
- Chart 6: Urban and rural population in CP, 1990–2043
- Chart 7: Demographic and Health scenario diagram
- Chart 8: Demographic dividend in CP and Demog and Health scenario, 2019–2040
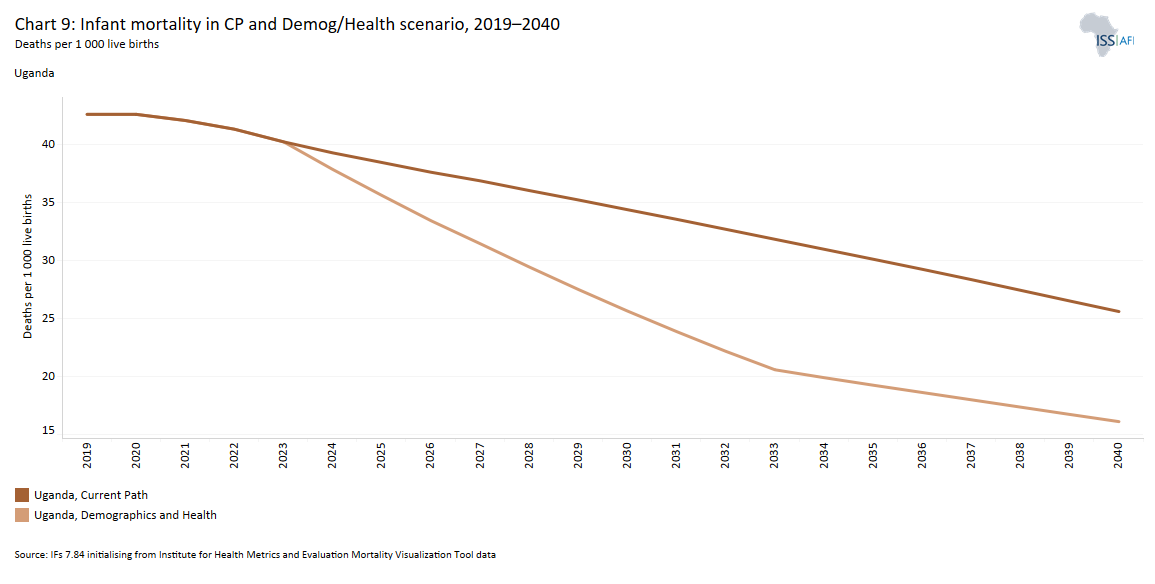
- Chart 9: Infant mortality in CP and Demog and Health scenario, 2019 –2040
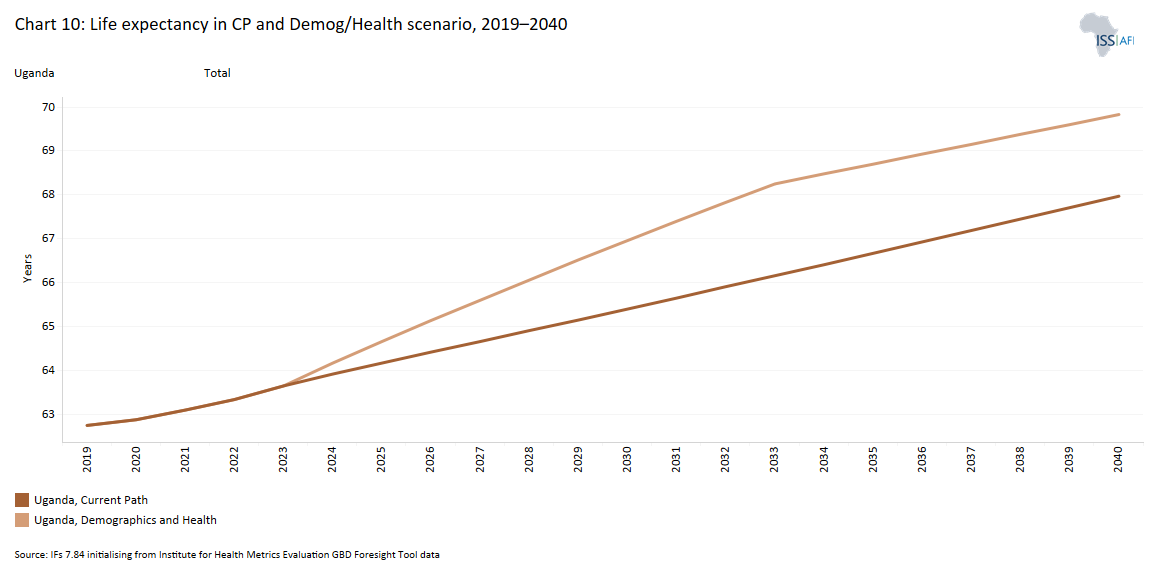
- Chart 10: Life expectancy in CP and Demog/Health scenario, 2019–2040
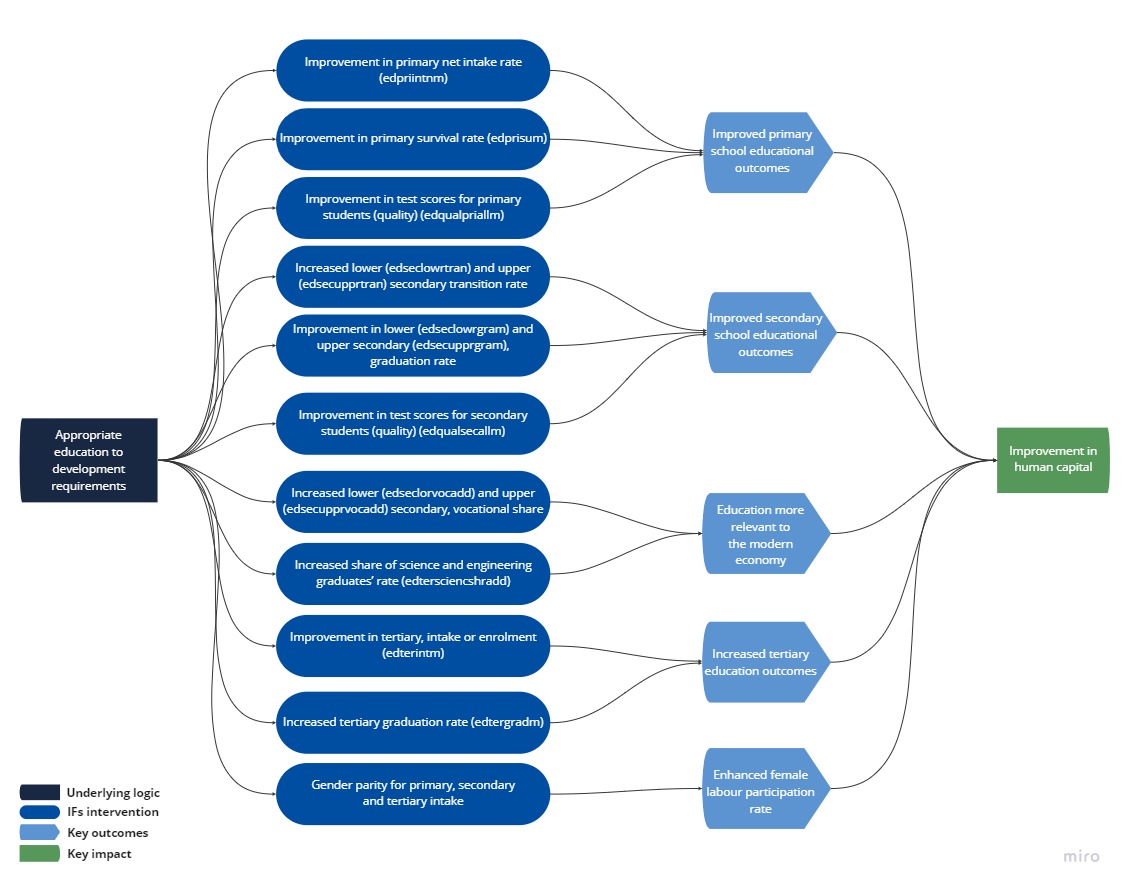
- Chart 11: Education scenario diagram
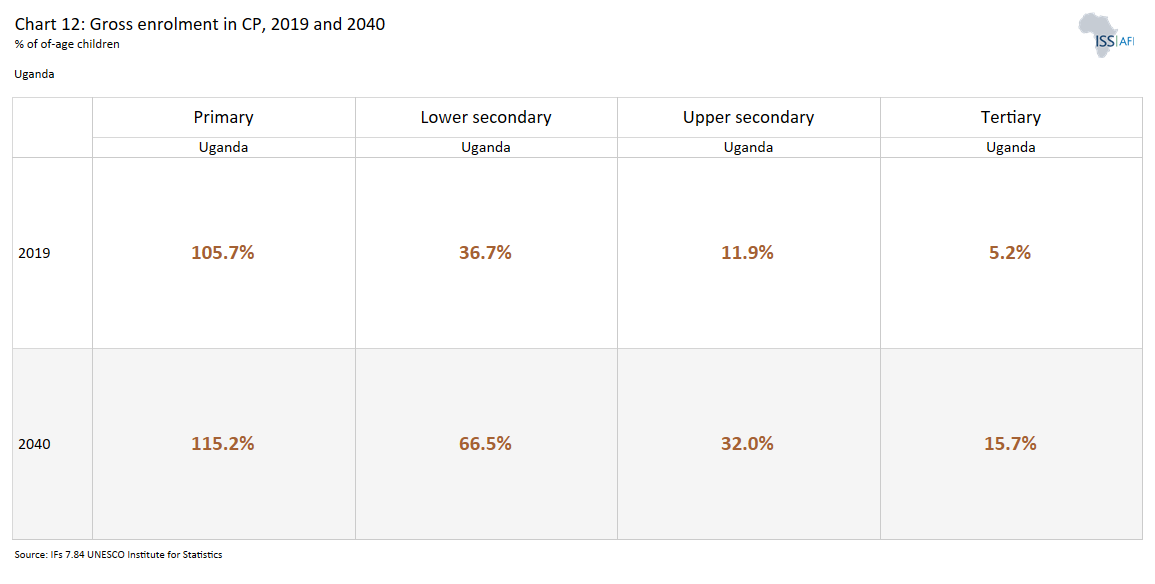
- Chart 12: Gross enrolment in CP, 2019 and 2040
- Chart 13: Gross completion rates in CP, 2019 and 2040
- Chart 14: Mean years of education in CP and Educ scenario, 2019–2040
- Chart 15: Education quality in CP and Educ scenario, 2019–2043
- Chart 16: Large Infrastructure and Leapfrogging scenario diagram
- Chart 17: Electricity access in CP and Large Infra/Leapfrogging scenario, 2019–2040
- Chart 18: Broadband access in CP and Large Infra/Leapfrogging scenario, 2019–2040
- Chart 19: Cookstove usage by type CP and Large Infra/Leapfrogging scenario, 2019 and 2040
- Chart 20: Agriculture scenario diagram
- Chart 21: Agriculture production/demand in CP and Agric scenario, 2019–2040
- Chart 22: Manufacturing scenario diagram
- Chart 23: Value added by sector in CP and Manufacturing scenario, 2019–2040
- Chart 24: AfCFTA scenario diagram
- Chart 25: Trade balance in CP and AfCFTA scenario, 2019–2043
- Chart 26: Trade openness in CP and AfCFTA scenario, 2019–2040
- Chart 27: Financial Flows scenario diagram
- Chart 28: Foreign aid in CP and Financial Flows scenario, 2019–2040
- Chart 29: Inflow of FDI in CP and Financial Flows scenario, 2019–2040
- Chart 30: Remittance in CP and Financial Flows scenario, 2019–2040
- Chart 31: Governance scenario
- Chart 32: Composite governance index in CP and Governance scenario, 2019 and 2040
- Chart 33: Goverment effectiveness in CP and Governance scenario, 2019–2040
- Chart 34: GDP per capita in CP and scenarios, 2019–2040
- Chart 35: GDP per capita in CP and Combined scenario, 2019–2040
- Chart 36: Informal sector value in CP and Combined scenario, 2019–2040
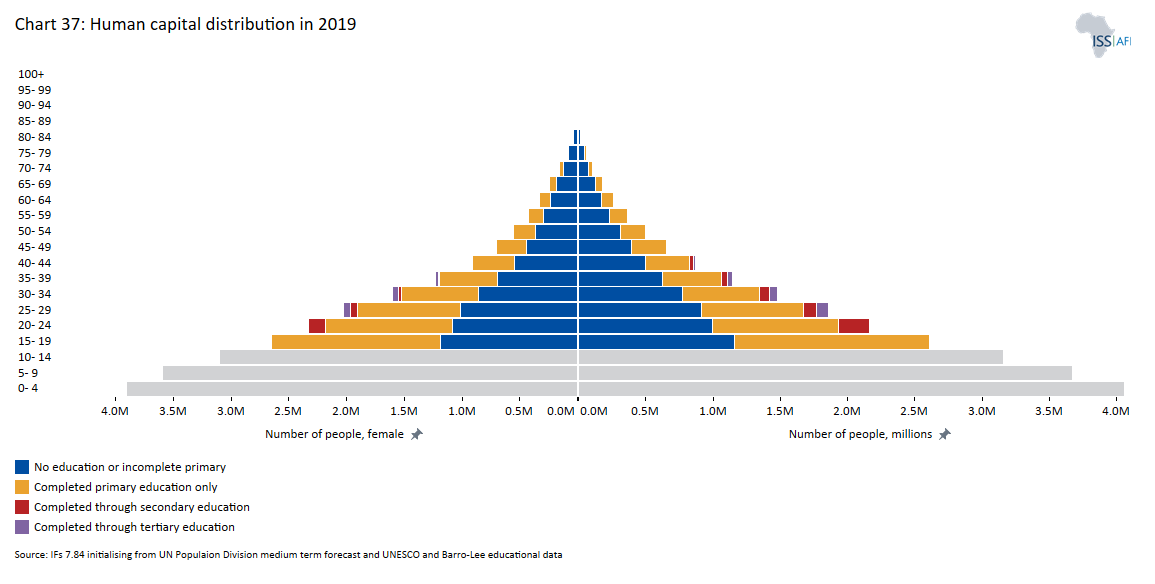
- Chart 37: Human capital distribution in 2019
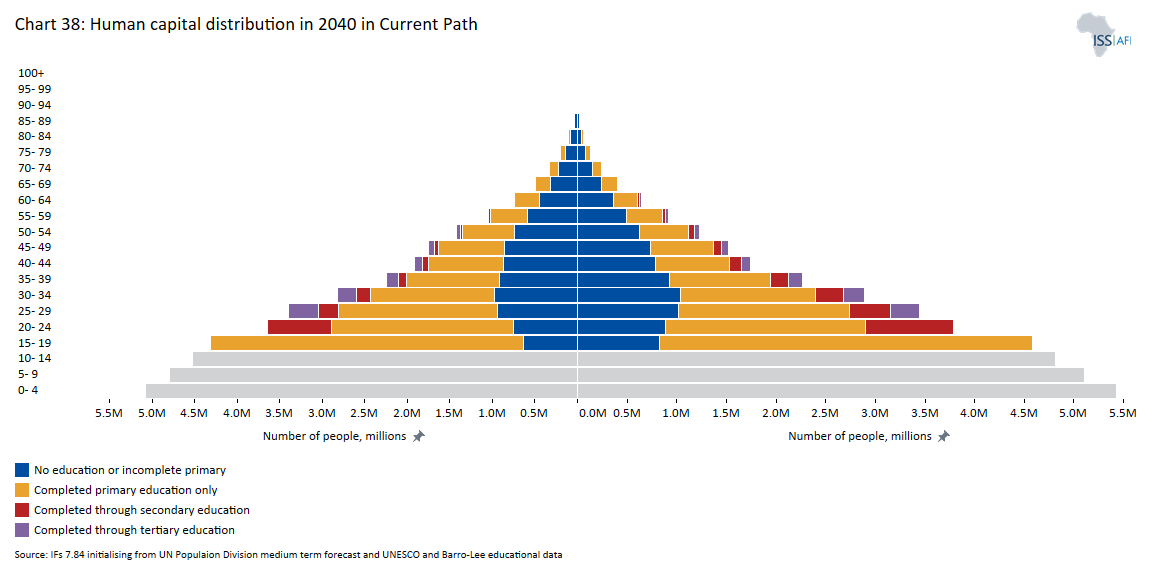
- Chart 38: Human capital distribution in 2040 in Current Path
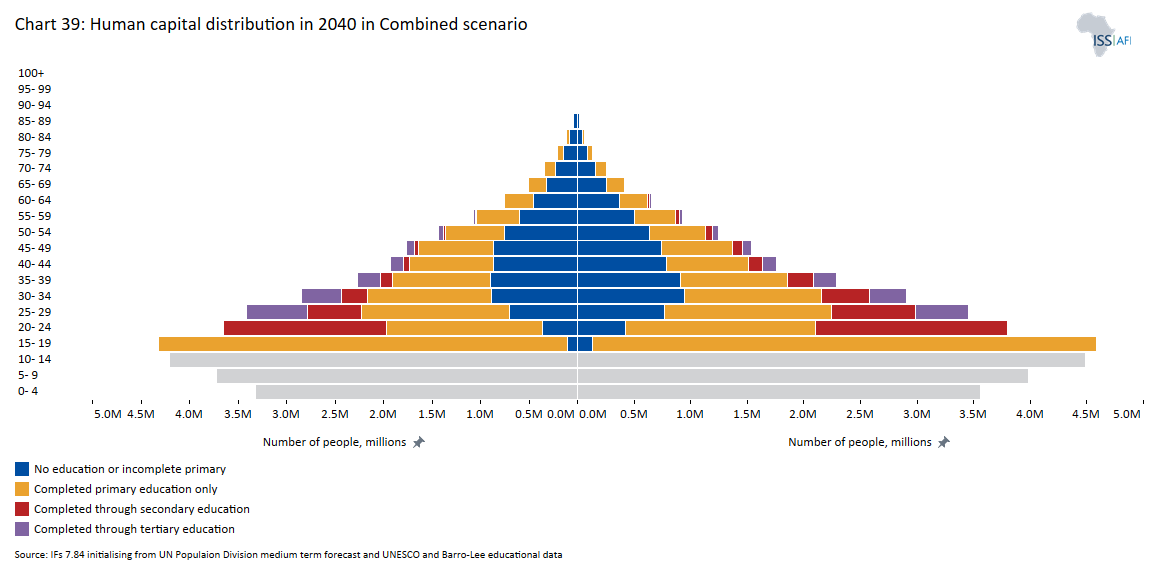
- Chart 39: Human capital distribution in 2040 in Combined scenario
- Chart 40: Poverty in CP and scenarios, 2019–2040
- Chart 41: Poverty in CP and Combined scenario, 2019–2040
- Chart 42: Domestic Gini index score in CP and Combined scenario, 2019–2040
- Chart 43: Carbon emissions in CP and scenarios, 2019–2040
- Chart 44: Carbon emissions in CP and Combined scenario, 2019–2040
- Chart 45: Recommendations
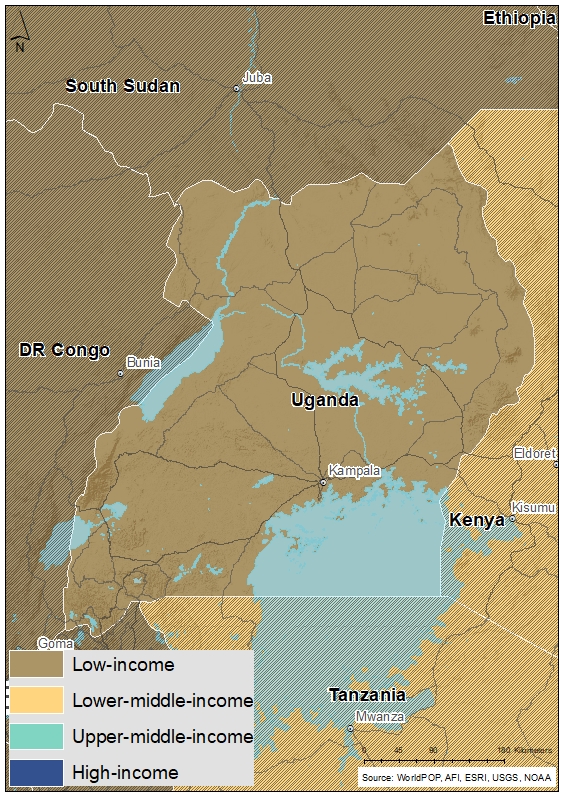
Uganda is a landlocked East African country situated on the equator, and derives its name from the kingdom of Buganda, which was one of the many large, centralised kingdoms that were formed on the land as early as 1200. Neighbouring countries are Kenya to the east, South Sudan to the north, Rwanda and Tanzania to the south, and the Democratic Republic of the Congo (DR Congo) to the west. Uganda has a low-income economy, and it is a member of the East African Community (EAC), the Intergovernmental Authority on Development (IGAD), and the Common Market for Eastern and Southern Africa (COMESA).
Uganda is considered a democracy although its journey has been marred by military coups, political instability and unstable regimes since the abrogation of the 1962 constitution. The 2005 constitutional amendment marked the beginning of multiparty democracy which replaced the ‘movement system’, where a candidate stands as an individual to be elected on personal merits and not as a member of a political party.
The country has an independent judiciary provided for by the constitution, with the Supreme Court as the constitutional and final court of appeal. Accorded limited jurisprudence on criminal and civil matters, the Magistrate Courts appeal to the High Court and the High Court to the Supreme Court. The current unicameral parliament consists of 556 members, of which there are 353 constituency representatives, 146 women representatives, 28 ex-officio members — who do not vote — and five representatives each for youth, workers, older persons and persons with disabilities. The Uganda Peoples’ Defence Force has 10 seats.
The country has a total land area of 241 038 km2 with large freshwater bodies and wetlands. Its lakes include Lakes Victoria, Edward, Albert Kwania, Kygo, Kwania, Kojweri and Murlu. Uganda’s tropical climate means that average temperatures are warm and pleasant all year round, averaging 18°C to 28°C. The country has abundant natural resources and a variety of flora and fauna. In 2006, oil reserves were discovered on Lake Albert along Uganda’s western border with DR Congo. Efforts to explore the reserves are bearing fruit, with the French company TotalEnergies and the China National Offshore Oil Corporation signing a US$10-billion agreement to develop the oilfields and ship the crude oil through a 1 400 km pipeline to the Tanga port in Tanzania. The crude oil will be transported through the massive East African Crude Oil Pipeline Project (EACOP). However, efforts are being hindered as the European Union Parliament told France’s TotalEnergies to halt activities due to environmental concerns in 2022.
To attain long-term growth and development, the government of Uganda has pursued long-term economic planning since independence. During the first 10 years of independence (1962–1971) Uganda developed two medium-term plans which were interrupted by the ‘economic war’ plan in the 1970s. In the 1980s, the World Bank pioneered the Structural Adjustment Program and later the Economic Recovery Program in 1987. Between 1997 and 2008, the long-term planning framework for the government was the Poverty Eradication Action Plan.
Furthermore, in 1997 Vision 2025 was developed (Prosperous people, harmonious nation, beautiful country), followed by a draft Vision 2035 in 2007, which served as the county’s long-term development perspective plans. However, neither were operationalised due to the lack of appropriate institutional frameworks, and legal and policy matters. The Comprehensive National Development Planning Framework (CNDPF) was approved in 2007 and it laid the foundation for the development of a 30-year development plan that will be implemented through three ten-year implementation plans, six national development plans, local government plans, annual work plans and budgets.
These efforts culminated in the development of Vision 2040. The tagline of Vision 2040 is ‘A transformed Ugandan society from a peasant to a modern and prosperous country within 30 years,’ with the goal of achieving upper-middle-income status by 2040 with a GDP per capita target of US$9 500. Anchored on the principles of independence and sovereignty, democracy and the rule of law, knowledge and skills, and an effective regional partnership, the strategy for attaining Vision 2040 is based on harnessing the opportunities that exist in an ‘abundant labour force, minerals, oil and gas, agriculture, tourism, knowledge and ICT [information and communications technology], industrialisation, water resources, geographical location and trade to strengthen the fundamentals of human resources, transport infrastructure and services, energy, science, technology, engineering and innovation, urban development, land, and peace, security and defence.’ Vision 2040 is complemented by the Uganda Vision 2040 Spatial Framework.
The country is now implementing its third National Development Plan (NDPIII), which aims to increase household incomes and improve the quality of life of Ugandans by means of resource-led industrialisation that boosts value addition in key growth opportunity areas of agriculture, tourism and minerals. The NDPIII (2020/21–2024/25) seeks to attain industrialisation by expanding manufactured value and the share of total export as well as increasing locally produced manufactured goods. Private sector development and human capital development are key areas of intervention to build the educated, skilful and productive labour force that is to drive the industrialisation process.
The NDPIII builds on the successes of the previous NDPI and NDPII, such as sustained peace, security and macroeconomic stability, more than doubling the GDP between the financial year 2010/11 and the financial year 2018/19, and increasing per capita GDP of US$70, despite the large population growth between 2015/16 and 2018/19. Uganda’s domestic revenue collection tripled between 2010/11 and 2018/19, and there was an increase electricity access, paved roads, remittances and exports during the same period. Similarly, the social sectors of education and health registered significant improvements during the implementation of NDPI and NDPII as is evident from the increased enrolment in business, technical and vocational training from 25 262 to 129 000 students between 2008 and 2017, and increased access and use of health services.
Despite the progress registered, key challenges remain such as a large subsistence economy estimated to constitute 68.9% of households, a large youth bulge at 78%, coupled with a mismatch between the skills required for labour markets and knowledge produced by training institutions. Uganda struggles with a high cost of electricity, limited access to and high cost of capital, wide regional disparities in poverty, low capacity and high prevalence of corruption, low educational quality, and the increase in non-communicable diseases. These development challenges are all recognised by NDPIII. Moreover, slow project implementation is a key concern as 20 of 42 NDPII projects were still at the feasibility stage or had not been started when the NDPIII was drawn up. The World Bank recognises that a less supportive external environment, reduced momentum for reforms, exogenous shocks such as drought, and a debt-financed public spending that crowds out the private sectors are key challenges to the Ugandan economy. The invasion of Ukraine has affected Uganda, just like many African economies, causing rising commodity and food prices and the increased cost of fertiliser. As a result, real GDP growth is projected at 4.4%, which is below the recovery path of 4.7% in 2022.
![]()
Current Path Forecast and Sectoral Scenarios
Download to pdf- Brief
- Demographics and Health: Current Path vs scenario
- Education: Current Path vs scenario
- Large Infrastructure/Leapfrogging: Current Path vs scenario
- Agriculture: Current Path vs scenario
- Manufacturing: Current Path vs scenario
- AfCFTA: Current Path vs scenario
- Financial Flows: Current Path vs scenario
- Governance: Current Path vs scenario
This section provides an overview of the key characteristics of Uganda along its likely (Current Path) development trajectory and the impact of a single positive scenario in eight separate sectors.
The Current Path forecast from the International Futures forecasting (IFs) platform is a dynamic scenario that imitates the continuation of current policies and environmental conditions. The Current Path is, therefore in congruence with historical patterns and produces a series of dynamic forecasts endogenised in relationships across crucial global systems.
The eight sectoral scenarios are on: Governance and Stability, Demographics and Health, Education, Infrastructure/Leapfrogging (consisting of the impact of renewables, ICT and the more rapid formalisation of the informal sector), Agriculture, Manufacturing, Free Trade (the implementation of the African Continental Free Trade Area), and External Financial Flows (consisting of aid, foreign direct investment, remittances and a proxy on illicit financial flows). The interventions in each scenario are benchmarked to present an ambitious but reasonable aspiration for countries at similar levels of development.
This section presents the Current Path in demographics and health for Uganda and the impact of a scenario that aims to improve health and hasten and increase the size of the demographic dividend.
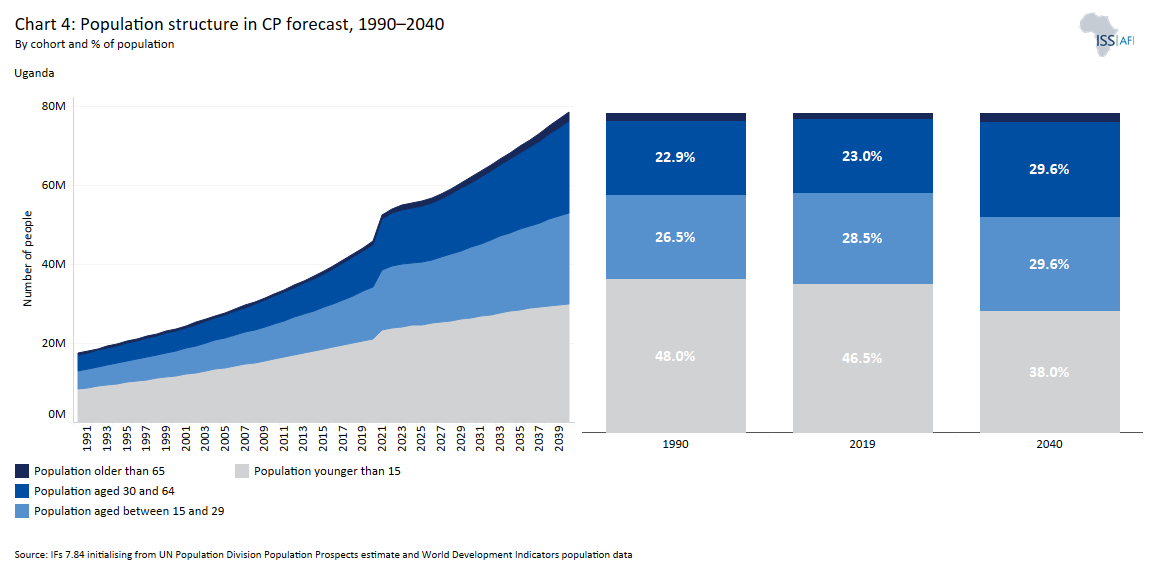
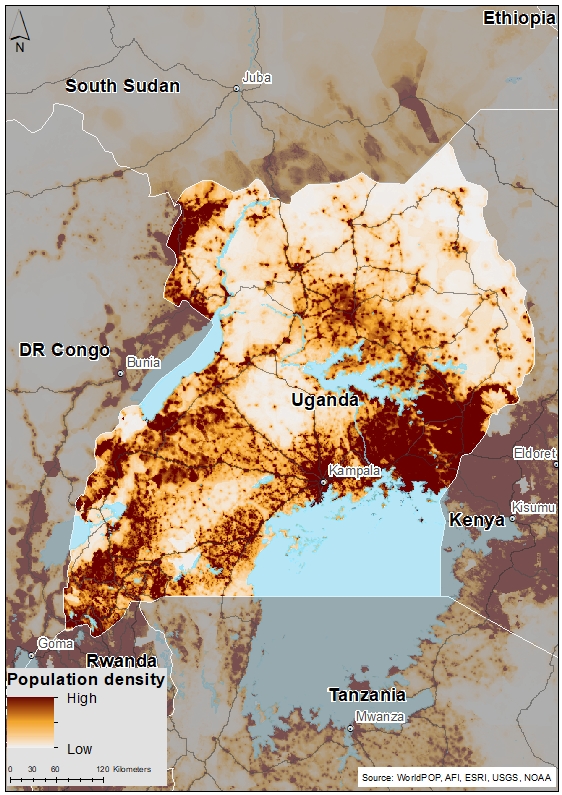
Uganda’s population has grown significantly from 17.35 million people in 1990 to 47.22 million in 2019 — the third highest among low-income Africa countries after Ethiopia and DR Congo. Kampala is the only city with a population of over a million people, followed by Gulu and Lira which in 2016 measured populations of a little over 100 000 people. Between 1990 and 2019, the population grew at an average rate of 3.5% annually. The population density increased to 2.4 people per hectare in 2019, up from 0.87 in 1990, second only to Rwanda and Burundi among low-income African countries.
The demographic dividend refers to a situation where a country has a ratio of 1.7 income-generating adults to one dependant (defined as children and elderly people) or more. It leads to accelerated economic growth as the age structure of a country transitions from high birth and death rates to low birth and death rates. Robust investment in human capital, a good health delivery system, and sustained political commitment to leveraging the opportunity are necessary to realise a demographic dividend.
On the Current Path, Uganda’s population will grow to 61.9 million people by 2030 and to 78.3 million by 2040. By then it will have the third largest population among its income peers under the Current Path assumption of the other countries. In contrast, the population growth rate will decline from 6.1% in 2019 to only 2.3% by 2040, on par with the average for the low-income Africa by 2040. Declining growth rates follow from the projected increase in the uptake of modern contraceptives and declining birth rates. The use of modern contraceptives will increase from 39% in 2019 to 56.8 % among women of child-bearing age by 2040. Fertility rates have also declined from seven live births per woman in 1990 to 4.8 in 2019, and in the Current Path it will further decline to 3.5 by 2040. In the meantime, as total fertility rates (TFR) decline over time in Uganda, the under-15 age group portion of the population declines and the working-age share of the population increases, pushing Uganda towards a demographic dividend. Between 1990 and 2019, the share of elderly people of the population increased, the under-15 share declined, and the share of working-age people increased from 49% in 1990 to 52% in 2019 and will reach 59% in 2040, on par with the average for low-income African countries. However, without significant intervention, Uganda will only enter a potential demographic dividend from 2052 when the ratio of working-age persons to dependants reaches 1.7 to 1. Measures to reduce TFR can advance the point at which Uganda achieves a potential dividend with positive impacts on incomes and reductions in poverty.
The median age in Uganda at 15.9 years in 1990 slightly increased to 16.9 in 2019, and in the Current Path, the median age of the population will increase to 20.3 by 2040. Uganda has a large youthful population concentration as measured by a youth bulge, which is the ratio of people in the 15–29 years old age group to the total adult population. In 1990, the youth bulge was 50%, meaning that one in two adult Ugandans was considered a youth. This ratio increased marginally to 53% in 2019, a little above the average for the low-income African countries at 50%. On the Current Path, the youth bulge will decline to 48%, reflecting the reduced TFR discussed above. The NDPIII recognises the challenges that the country faces as a result of the large youth bulge, which can be harnessed to achieve a demographic dividend and to avoid social unrest. This is particularly concerning given the mismatch between the skills required by the labour market and the knowledge produced by training institutions. Hence, both Vision 2040 and the NDPIII have emphasised human capital development as a key factor of the realisation of Uganda’s development aspirations.
Urbanisation can boost development according to modernisation theorists as it provides a better environment to promote positive social and economic change compared to rural communities. Specifically, urbanisation attracts industrialisation with the large pool of cheap labour associated with it. Cities encourage the emergence of a new entrepreneurial middle class with modern lifestyles and make it easier for the government to provide social services, such as healthcare and education, than in sparsely populated, rural areas. Rapid urbanisation comes with challenges, however, as it puts pressure on limited urban infrastructure and may create urban slums and unhealthy congestion.
Vision 2040 recognises urbanisation as a fundamental pillar of the vision that needs to be strengthened to harness the opportunities that industrialisation, ICT business, an abundant labour force, geographical location and trade provide. Chapter 15 of the NDPIII addresses planning for sustainable urbanisation and housing in Uganda. It recognises the potential of urbanisation for economic transformation towards middle-income status for Uganda if certain obstacles are overcome. These obstacles include inadequate urban planning, complex land tenure systems, overcrowding, poor infrastructure and insufficient social services especially in the Greater Kampala Metropolitan Area. The NDPIII therefore commits the government to: 1) increasing economic opportunities in cities and urban areas; 2) promoting the urban housing market and providing decent housing for all; 3) promoting green and inclusive cities and urban areas; 4) enabling balanced and productive national urban systems; and 5) strengthening urban policies, planning and finance.[1ibid]
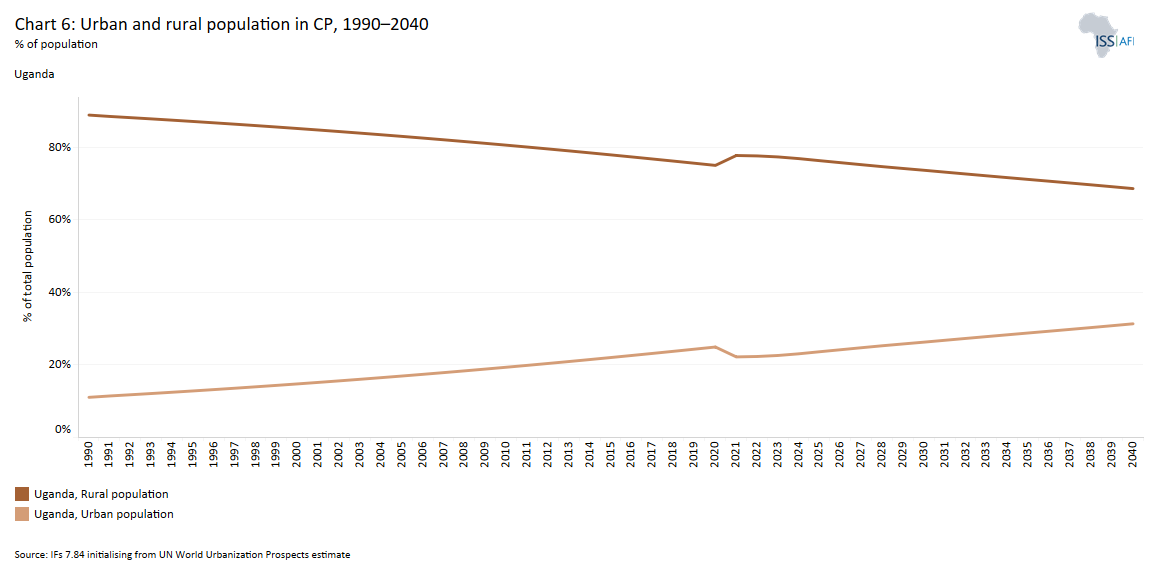
Of Uganda’s 17.35 million people in 1990 only 1.9 million people lived in urban areas, equivalently to 11% of the population. By 2019, the urban population had increased to 24 % of the total population as more people migrated from rural areas to urban centres on top of natural urban population growth. Uganda is predominantly a rural country with 75.6% of its population living rural areas in 2019, compared to 69% of an average low-income African country. Kampala is the capital city and the largest in Uganda with a population of over 1.5 million people by 2021 estimates. On the Current Path, Uganda will increase the portion of its urban population to 31.4% by 2040, below the 39.8% for low-income African countries.
Good health and longevity are fundamental goals of every human being. Healthy people are more active, vibrant and have a more positive outlook on life, translating into positive influence on social infrastructure and economic development. Health promotes economic growth directly through its labour productivity effects where better health leads to increases in output per unit of labour[2D Acemoglu and S Johnson, Disease and Development: The Effect of Life Expectancy on Economic Growth, Journal of Political Economy, 115:6, 2007, 925–985.]. Health indirectly affects economic growth through its positive effect on education. A healthy educated workforce live longer to reap the benefits of education in terms of higher skilled wages.
Globally, the Sustainable Development Goal (SDG) 3 aims for ensuring good health and well-being for citizens by 2030, targeting reduction in maternal mortality, neonatal and under-5 (child) mortality among others. In 2019, maternal mortality in Uganda was 349 per 100 000 live births, below the average for Africa and low-income African countries at 442.5 and 449.5 per 100 000 live births respectively. At the same time, it has reduced its infant mortality rate from 98 per 1 000 live births in 1990 to 42.6 in 2019, lower than the average for peers at 47.4 per 1 000 live births. Neonatal mortality stood at 18.5 per 1 000 live births in 2019, which is lower than the average for low-income African countries at 26.5. Uganda provides free antenatal services in most of the health facilities, which boosted antenatal care (ANC) visits from 44% in 2011 to 60% in 2016 and at the same time increased hospital deliveries from 57% in 2011 to 73% in 2016.
The scenario uses the International Classification of Disease (ICD) to differentiate between three broad categories of diseases: communicable, non-communicable and injuries as well as fifteen sub-categories of mortality and morbidity. In 1990, death from non-communicable diseases (NCDs) was 50 000 people and by 2019 it has climbed to 120 000 people, representing a more than 100% increase over the 20-year horizon. The rate of death from NCDs will increase from 2.5 per 1 000 in 2019 to 2.6 by 2030 and 2.8 by 2040.
Uganda has reduced death from communicable diseases. In 2019, communicable diseases caused about 181 000 deaths or 3.8 deaths per 1 000 people, compared to 232 000 in 1990. On the Current Path, death rates from communicable disease will further decline to 2.7 deaths per 1 000 by 2030 and 1.8 by 2040. Despite the declining trend in death from communicable diseases in Uganda, it will continue to be the main cause of death until 2030 – the end of the second 10-year implementation of the Vision 2040. Other communicable diseases, such as Ebola and dengue fever, constituted the highest cause of death in Uganda in 2019 at 87 000 people, while non-communicable diseases such as malignant neoplasms at 31 000 and then cardio vascular diseases at 30 000 people constituted the next two highest causes of death. Cauuse of death resulting from injuries is forecast to increase over the years from 0.54 per 1 000 people in 019 to 0.64 deaths per 1 000 by 2040.
Poor water and sanitation infrastructure are major causes for the spread of communicable diseases. In 2019, 36.4 million Ugandans, representing 82% of the population, had access to improved water. Of these, 26.5 million people had access to piped water and only 9.8 million had access to other improved water connections. However, access to improved sanitation is low in Uganda at 19.6% in 2019, with 17% and 63% using shared and other unimproved sanitation respectively.
The decline in mortality rates since 1990 and improvements in water and sanitation access has improved life expectancy over the years. In 2019, life expectancy in Uganda was 62.8 years, up from 49 years in 1990. This is however below the average for Africa at 65.8 and that of low-income Africa at 63.6 in 2019. On average, in 2019, women lived 5.1 years longer than their male counterparts in Uganda in 2019. This gender gap in life expectancy will persist. In 2040, it will have widened to 5.6 years.
Despite the progress made, Uganda’s health sector suffers from headwinds such as focus on a facility-based health service delivery as opposed to a household-based health service delivery system, leading to the slow improvement in health outcomes. The Vision 2040 therefore seeks to make a paradigm shift to a household-based service delivery system, improve nutrition status of the population (especially for the young and women in reproductive age), encourage private-public partnership in health, and the creation of specialised treatment centres for non-communicable diseases at sub-district level.
Over the course of the NDP III implementation, Uganda aims to reduce the prevalence of under 5 stunting from 28.9% in 2019 to 24% by 2025, (ii) reduce under 5 mortality from 64/100 000 live births to 52/1 000, (iii) reduce the maternal mortality rate (MMR) from 336/100 000 to 299/100 000, (iv) increase life expectancy of the population from 63 to 70 years, (v) increase access to safe water supply from 70% to 85% in rural areas and 74% to 100% in urban areas, (vi) increase access to basic sanitation from 19% to 40%, and (vii) increase the proportion of the population accessing universal health care from 44% in 2018 to 60% in 2025.
In the Current Path, Uganda will further reduce mortality rates and increase life expectancy but will miss the 2025 NDP III targets. Life expectancy will increase to 64.2 and 68 years by 2025 and 2040 when NDPIII and Vision 2040 expire respectively. This will be below the average for Africa at 71 years by 2040 and for low-income African countries at 69.6 years. Hence, without further intervention Uganda is not on track to realise the NDP III target for life expectancy, even by 2040.
Infant mortality will further decline to 25.6 deaths per 1 000 live births in 2040, maternal mortality will reduce to 139 deaths per 100 000 live births, neonatal mortality will decline to 10.4 deaths per 1 000 live births, and deaths from communicable diseases will decline to 226 000 people. By 2040, other communicable diseases will be the leading cause of death, followed by cancer related diseases. The portion of the population with access to improved water connection will increase to 84.9% - 66.5 million people – by 2040, of which 32% represent access to piped water connection. Access to improved sanitation will also increase to 42% by 2040, representing 43.6 million people. Improved access to water and sanitation could help to reduce the burden of communicable diseases.
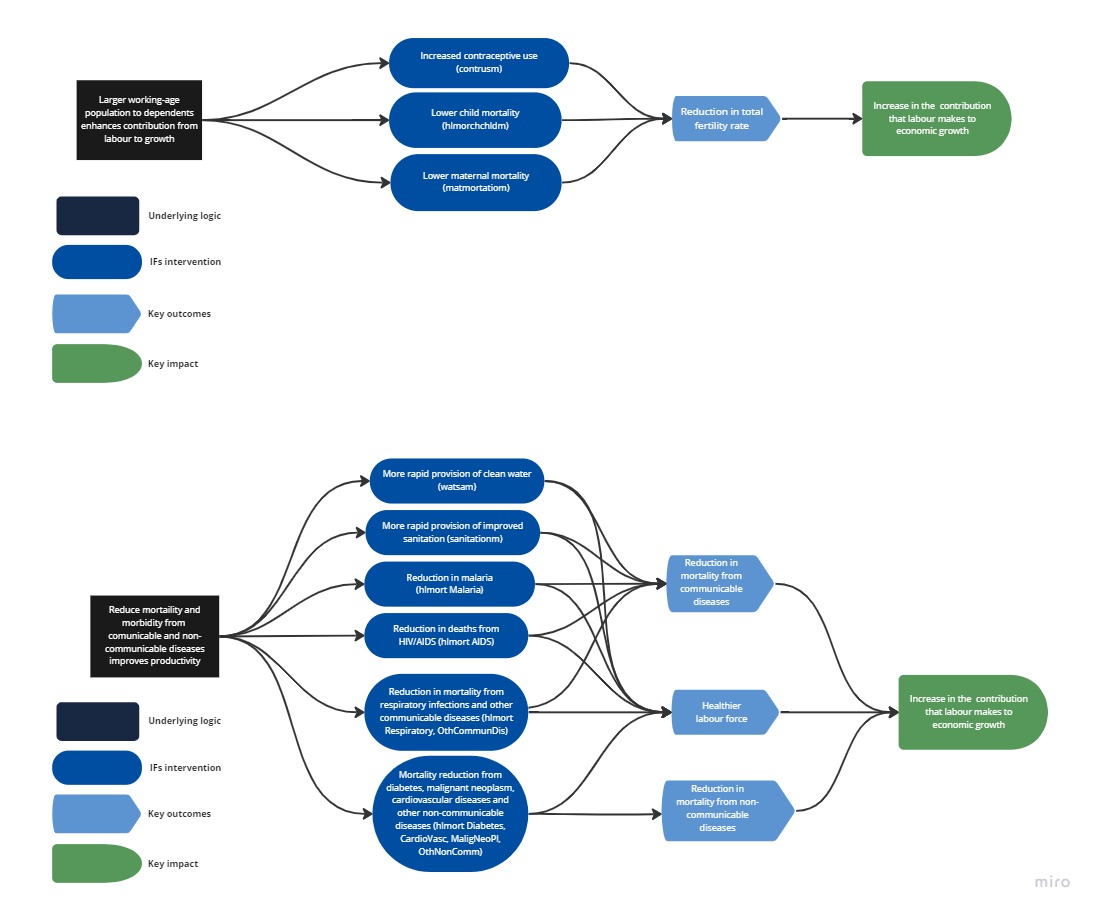
Uganda has made progress in demographic and health as pointed to by the above analysis. However, the country needs to accelerate its demographic transition, reduce reverse the increasing trend in death from non-communicable diseases, improve access to sanitation, and boost health outcomes for Ugandans. The Demographics and Health scenario include reasonable, but ambitious reductions in communicable and non-communicable diseases mortality, the under-five mortality rate, the maternal mortality ratio, provides for increased access to modern contraception, as well as improvements in access to safe water and better sanitation. The scenario is benchmarked against historical progress made by Uganda or other low-income countries to reflect an ambitious but reasonable rate of improvement.
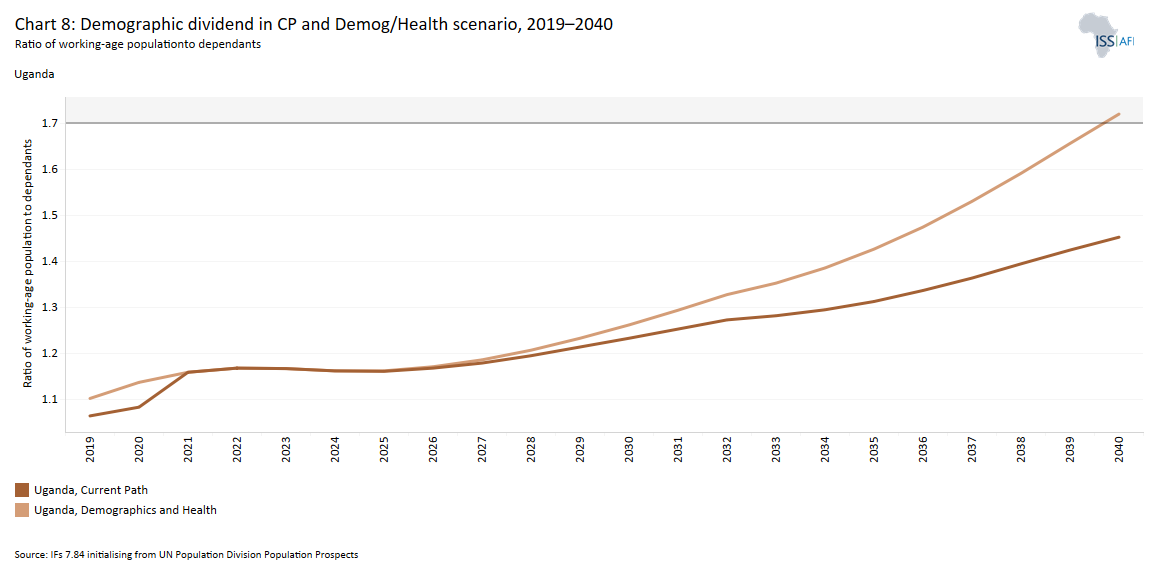
Demographers typically differentiate between a first, second and even third demographic dividend. We focus here on the first dividend, namely the contribution of the size and quality of the labour force to incomes. It refers to a window of opportunity when the ratio of the working-age population (between 15 and 64 years of age) to dependants (children and the elderly) reaches 1.7.
In the Demographics and Health scenario, Uganda is set to achieve the demographic dividend ratio of 1.7 to 1 by 2040 compared to 1.45 to 1 in the Current Path in the same period. This represents an 18% increase over the Current Path for the same year. In the scenario, Uganda’s ratio will be 17.9% higher than the average for low-income countries in Africa by 2040. This has the potential to usher Uganda into a period of higher economic growth, provided the growing working-age population is healthy, educated and productively integrated in the economy.
The infant mortality rate is the number of infant deaths per 1 000 live births and is an important marker of the overall quality of the health system in a country.
In the Demographics and Health scenario, Uganda will further reduce the infant mortality rate to 16.1 deaths per 1 000 live births by 2040, 9.5 deaths fewer than the Current Path. Compared to the Current Path figure of 14.6 deaths, in the Demographics and Health scenario, Uganda will record a neonatal mortality rate of 9.8 by 2030, below the SDG 3.2 target of reducing neonatal mortality to as low as 12 deaths per 1 000 live births. In the scenario, the under-5 mortality rate is set to reduce from 59.2 deaths per 1 000 live births in 2019 to 34.1 in 2030, slightly above the SDG target of 25 per 1 000 live births by that time. By 2040, the under-5 mortality rate will reduce to 22.3 deaths per 1 000 live births, 12.8 deaths lower than in the Current Path.
The average life expectancy at birth in Uganda was 62.7 years in 2019, slightly below the average of 63.5 years for low-income African countries. Women in Uganda generally live five years longer than men. In both the Current Path and the Demographics and Health scenario, women will continue to have approximately five years higher life expectancy than men by 2040. By 2040, total life expectancy in the Demographics and Health scenario will be 1.7 years larger than in the Current Path.
Education is indispensable for long-term economic growth and development. World Bank research shows that an additional year of schooling is associated with a 10% increase in earnings a year, higher than returns to investment in treasury bills, bonds, housing and physical assets. Returns on tertiary education are even higher. Gary Becker, in his human capital theory, shows that investment in education has a higher payoff in terms of higher wages and returns.
Since the 1960s, the education system in Uganda has been based on a 7-6-3 structure, where learners have seven years of primary education, six years of secondary education (divided into four years of lower secondary leading to the O-levels certificate and two years of upper secondary leading the A-level certificate) and three years of post-secondary education. Ten years after having instituted universal primary education (UPE), in 2007 Uganda became the first sub-Saharan African country to introduce universal secondary education (USE). This has boosted enrolment rates at primary and secondary level, although the USE has had a modest impact on enrolment at lower secondary level, a positive trend further reinforced by increased government expenditure on education by building more schools and employing more teachers. The number of secondary schools increased to 3 000 in 2017 from 2 373 in 2007, with most of the growth coming from private schools during the same period. Furthermore, the number of public technical and vocational education and training (TVET) schools has increased from 126 in 2012 to 152 in 2018, while the number of degree-awarding institutions and universities increased from 34 in 2011 to 60 in 2017, with university enrolment rising to 162 299 from 139 683 over the same period.
|
Box 1: Definitions in Education Gross enrolment rate: The number of learners enrolled at a given level of education, regardless of age, expressed as a percentage of the official school-age population corresponding to the same level of education. Rates can therefore be above 100%. Net enrolment rate: The number of students of the official age group for a given level of education who are enrolled in any level of education, expressed as a percentage of the corresponding population. Transition rate to secondary education: New entrants to the first grade of secondary education in a given year, expressed as a percentage of the number of pupils enrolled in the final grade of primary education in the previous year. Completion rate: The number of people in the relevant age group who have completed the last grade of the given level of education, as a percentage of the population at the theoretical graduation age for the given level of education. Source: UNESCO |
The Education scenario represents reasonable but ambitious improvements in the intake, transition and graduation rates from primary to tertiary levels of schooling and increases in the quality of education. It also models substantive progress towards gender parity at all levels, additional vocational training at secondary school level and increases in the share of science and engineering graduates.
By 2019, the gross primary enrolment rates had jumped from 70.6% in 1996 to 105.7%, on par with the average for low-income Africa and higher than the average for Africa at 102.4%. Gross secondary enrolment rates for Uganda increased from 11% in 1990 to 29% in 2019, 12 years after the USE was introduced. Gross tertiary enrolment rates have modestly increased from 1.1% in 1990 to 5.2% in 2019. In 2019, the ratio of female to male primary net enrolment was 1.03 to 1, while the ratio of female to male gross enrolment stood at 0.93 for lower secondary and 0.69 for upper secondary.
Gross enrolment and completion rates at all three levels of education will increase appreciably between 2019 and 2040. In the Current Path, the primary gross enrolment rate for of-age children will increase to 117.9% by 2030 and to 115.2% by 2040, while the tertiary enrolment rate will increase to 9.9% and to 15.7% during the same period. The secondary enrolment rate will be pushed to 44.4% by 2030 and to 56.4% by 2040.
The transition rate from primary to lower secondary increased from 54% in 2000 to 63.8% in 2019, while transition rates from lower secondary to upper secondary declined from 66% in 2000 to 43% in 2019. The decline in transition rates from lower secondary to upper secondary indicates the failure of the USE programme at upper secondary level.
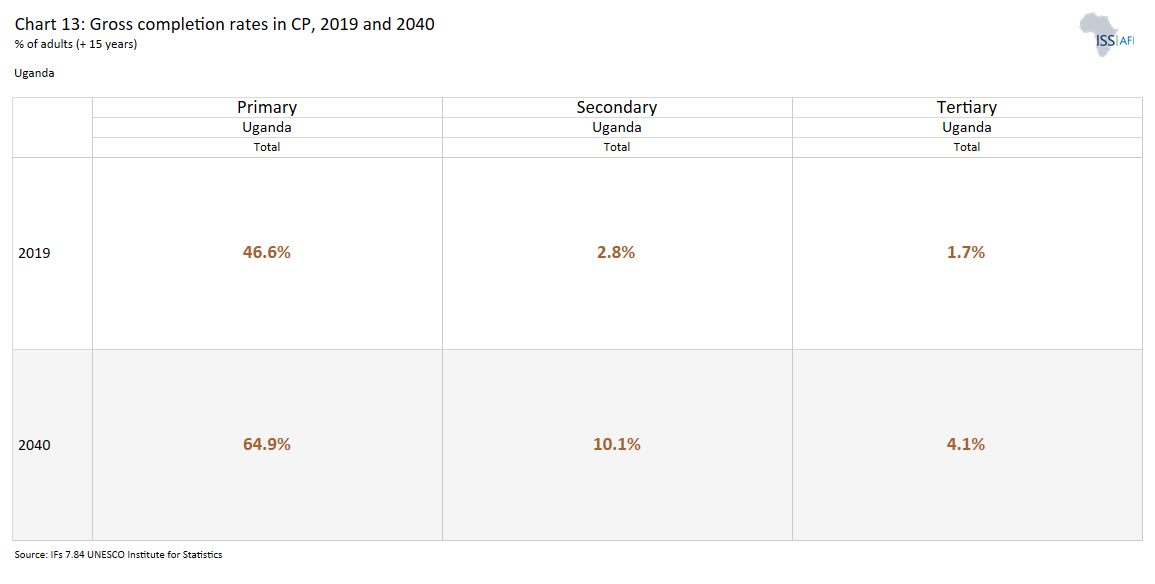
Between 1990 and 2019, primary education completion rates for adults in Uganda increased from 30% to 46.6%, ranking Uganda 14th highest among the 23 low-income African countries in 2019. However, this is lower than the average for the group at 53% in 2019. Tertiary completion rates were very low in 1990 at 0.19%, which only increased to 1.23% in 2010 and to 1.7% by 2019. In the Current Path, primary completion rates will increase to 55.3% by 2030 and to 65.1% by 2040, while secondary completion rates will be pushed to 5.9% and to 10.2% over the same period. Tertiary completion rates are low compared to primary and secondary completion rates, and will increase to 2.6% and to 4.3% by 2030 and 2040, respectively, in the Current Path.
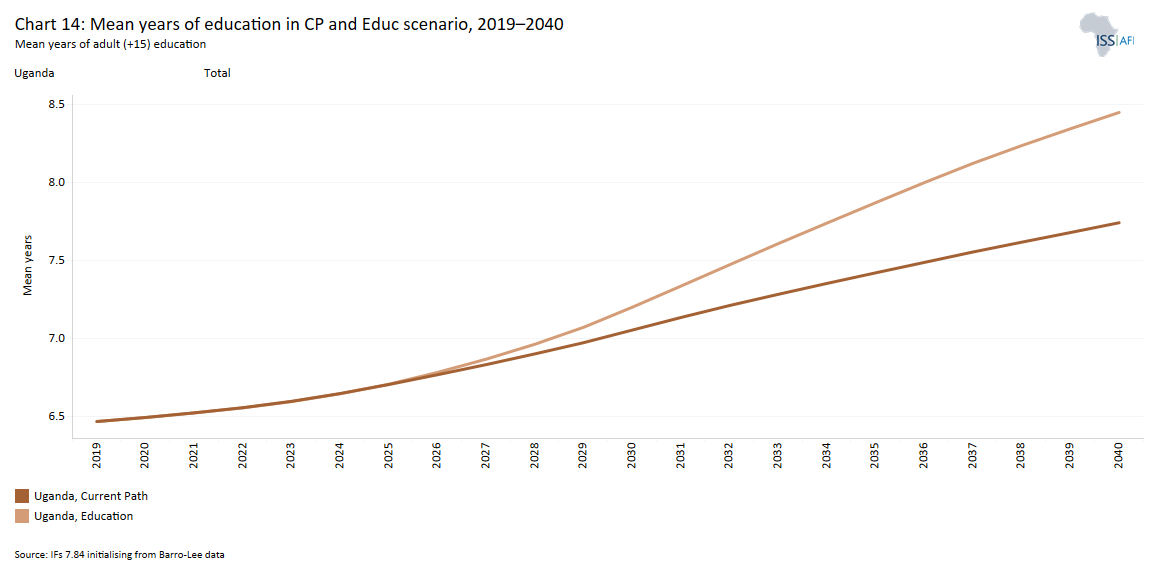
Mean years of education depict the average number of completed years of education by a country’s adult population aged 15 years and older. In 2019, Uganda’s mean years of adult education stood at 6.5 years, above the average of 4.6 years for low-income countries on the continent. In terms of gender, the mean years of education for males (6.8 years) was 0.7 years more than females’ average of 6.1 years. This gap in favour of men for mean years of adult education in Uganda is below the average of 1.2 years for low-income countries in Africa.
By 2040, in the Education scenario, the mean years of adult education will rise to 8.5 years, which will be 0.8 years more than the Current Path estimate and 2.6 years more than the average for low-income countries in Africa. Also, based on the Education scenario, the gender gap regarding mean years of adult education will close to 0.5 years by 2040.
While the mean years of education gives an indication of the level of educational attainment in a country, it does not reflect the quality of education. A standard measure used to assess the quality of education is the average test performance of students. Progress on education quality, the focus of SDG 4, seems to be modest due to continued challenges in teaching space and materials, the number of teachers and the disbursement of government funds.
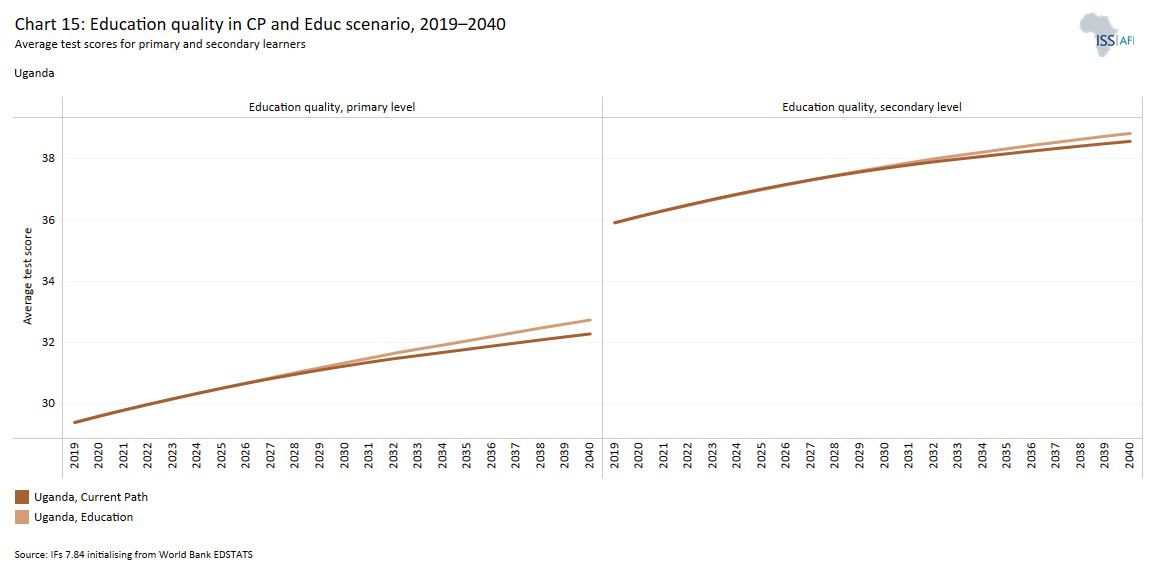
Uganda's adult primary test score stood at 29.4% in 2019, higher than the average for Africa at 25.6% and low-income African countries at 22.2%. In the Current Path, adult primary test scores will reach 32.2% by 2040. Uganda’s secondary adult test score of 35.9% in 2019 is above the 33.9% average for Africa and 33.1% for low-income African countries. The science and engineering share of tertiary graduates in Uganda stood at 16.6% in 1999 but fell to 10% by 2004, and in the Current Path, it is set to rise to 14.8% by 2040, which is below the average for low-income African countries of 16.8%.
The Education scenario will marginally increase the average test scores for primary learners to 35.8 in 2040, compared to the Current Path estimate of 34.4. Also, the average test score in the Education scenario for 2040 will be 6.3 points more than the continental average for low-income countries. By 2040, the average test score for secondary learners in the Education scenario will rise to 40.9, which is above the Current Path estimate of 40.3% and the average of 37.4% for low-income countries in Africa. This suggests that Uganda performs relatively better than its income group peers, both at primary and secondary levels.
UPE in Uganda has had a significant impact on enrolment rates at primary level. However, the USE did not translate into the same at secondary level, and on the contrary, transition rates from lower secondary to upper secondary has declined. Consequently, completion rates at tertiary level are significantly low in Uganda, while education quality as well as the science and engineering share of tertiary graduates are modest.
Sound infrastructure can improve productivity, augment quality of life and boost educational outcomes by facilitating access and government effectiveness. Physical infrastructure, such as roads and railways, is a critical driver of economic growth and an important component of development. It facilitates the movement of people, goods and services and promotes intra-country trade, serving also to connect outlying rural areas with urban centres and the higher quality services they provide. Infrastructure generally serves as an enabler of the provision of social services such as education and health.
The role of infrastructure development is recognised in the long-term development of countries and regions as evident by its inclusion in Agenda 2063 as goal 10 and the EAC Vision 2050 as its first pillar. Uganda’s Vision 2040 seeks to provide world-class infrastructure and modern technology to enhance productivity and growth. As Uganda is a landlocked county, the quality of its physical infrastructure will determine its regional and international competitiveness. Virtually every sector of the economy will benefit from good transportation, water, power and ICT infrastructure. The NDPIII recognises the importance of basic physical infrastructure through special programmes on integrated transport and services and digital transformation during the 2020/21 to 2024/25 period, with the goal of developing a seamless, safe, inclusive and sustainable multimodal transport system. Currently, the country uses four modes of transport – road, rail, air and water – with road transport accounting for more than 90% of freight and passenger traffic during the financial year 2018/19.[3ibid]
Of the total road network in 2018, 20 854 km were national roads, 38 603 km were district roads, 19 959 km of roads were urban and 79 947 km were community access roads. Paved roads accounted for a mere 4 971 km (23.83%) of national roads, 145 km (0.38%) of district roads and 1 188 km (5.95%) of urban roads. Despite the improvements in paved roads over the years, the country did not meet the NDPII target of 6 000 km of paved roads at national level. The portion of the national road network in fair to good condition is 93% and 75% for paved and unpaved roads, respectively.
In 2019, Uganda had 74 291 km of total road network, 24% of which is paved, meaning 76% of all roads are unpaved. By 2040, the Current Path is that total road network in Uganda will be 102 382 km of which 56.8% will be paved and the remaining 43.2% unpaved. Indicator 9.1.1 in the SDGs refers to the proportion of the rural population who live within 2 km of an all-season road and is captured in the Rural Access Index. Access to rural areas is essential for improving the integration of and interaction between rural and urban economies, which is important for spurring local economic development. In 2019, 33.9% of the rural population in Uganda had access to all-season roads, which will rise to 43.6% by 2040 but still below the average for its income group peers of 50.6%.
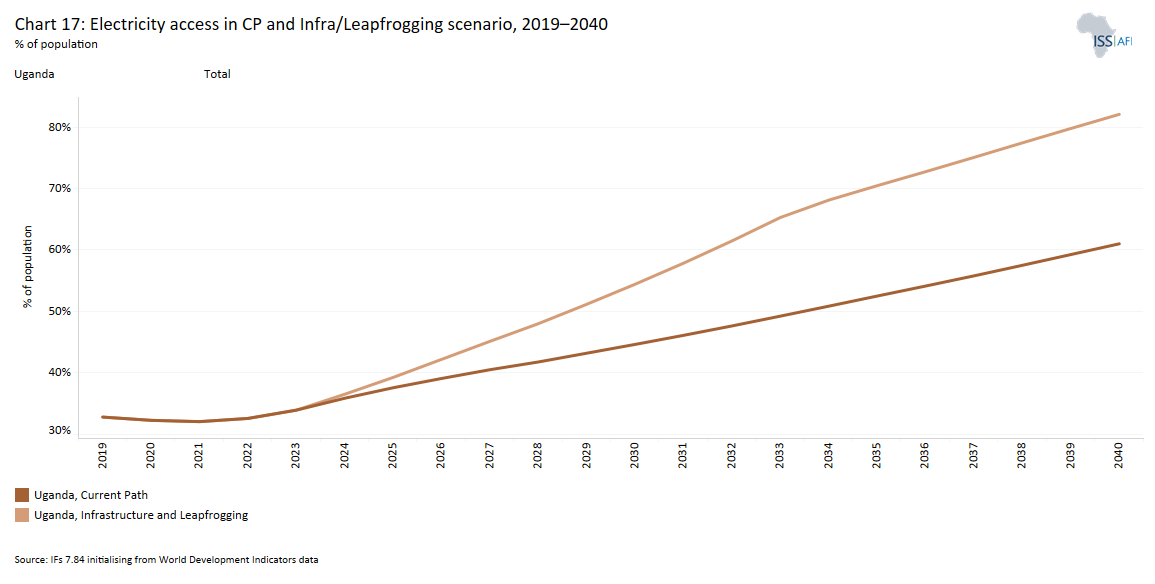
In 2019, 41.3% of Ugandans had access to electricity, of which 70% resided in urban areas. This is above the average for low-income Africa at 33% but below the average for Africa at 54%. In the Current Path, total electricity access in Uganda will be 60.9% by 2040. Only 31.8% of the rural population had access to electricity. The urban–rural electricity access gap has increased from 31 percentage points in 1990 to 39 percentage points in 2019. On the Current Path, access to electricity will reach 61% of the population by 2040. The disparity in electricity access in favour of urban residents will continue largely unchanged as 80.5% of urban dwellers will have access to electricity compared to the 52% for rural dwellers by 2040.
Electricity is generated mainly from hydropower, supplemented by heavy fuel oil and biomass cogeneration power plants. The 250 MW-Bujagali hydroelectric power plant is the largest since it was commissioned in 2012. It is operated by the government of Uganda and three private partners — investment firm Blackstone, Sithe Global Power, and the Aga Khan Fund for Economic Development. Since 2001, Uganda has liberalised its energy market, separating electricity generation and transmission. The Uganda Electricity Transmission Company Limited (UETCL) and the Uganda Electricity Generation Company Limited (UEGCL) are separate enterprises responsible for the transmission and generation of electricity, respectively. The primary transmission network consists of 132 kV lines to various load centres. Although power is available in Uganda — and it exports electricity to neighbouring Tanzania, Kenya and Rwanda — many communities, homes and businesses do not have access to electricity due to expensive grid connection fees and high house wiring costs.
To remedy these challenges and increase rural electrification, the government, through the Rural Electrification Agency (REA), instituted the Electricity Connection Policy (ECP), operationalised in 2018. However, to implement this the REA requires financial support to buy the many poles and connection wires required.
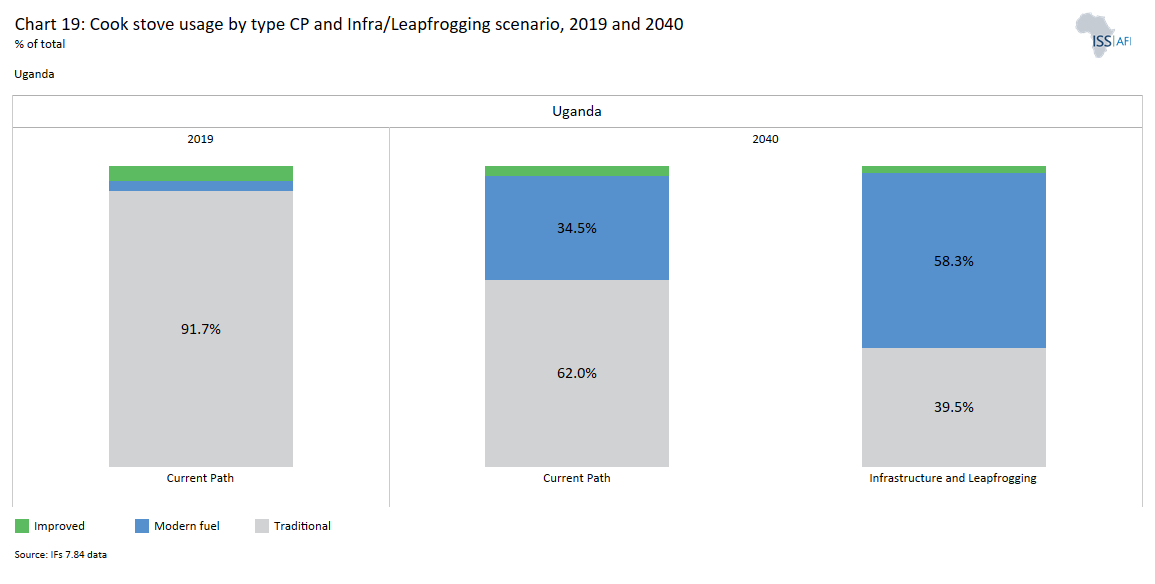
Like electricity access, as the economy grows and access to modern energy increases, more households are switching from traditional cookstoves, such as wood-burning stoves and coal stoves, to improved and modern fuel stoves, such as electric and gas cookers. In 2019, an overwhelming majority of households (91%) used traditional cookstoves [4The IFs model distinguishes between three types of cooking stoves: traditional, improved and modern stoves.] while only 5.1% used improved cookstoves. An insignificant proportion of households in Uganda (3.1%) uses modern fuel for cooking. The proportion of households using traditional cookstoves reflects the predominantly rural nature of the country. Traditional cookstoves pose a risk to the environment due to the acceleration of deforestation associated with them. They can also cause respiratory infections, and limit study hours for students because the daily collection of firewood, which is sometimes the job of young girls, may deprive them of time that could be devoted to education. In the Current Path, by 2040 the proportion of households projected to use traditional cookstoves will decline to 62%, while only 3.4% will be using improved cookstoves. Consequently, the proportion of households using modern fuel stoves will rise to 34.5% (from just 3.1% in 2019).
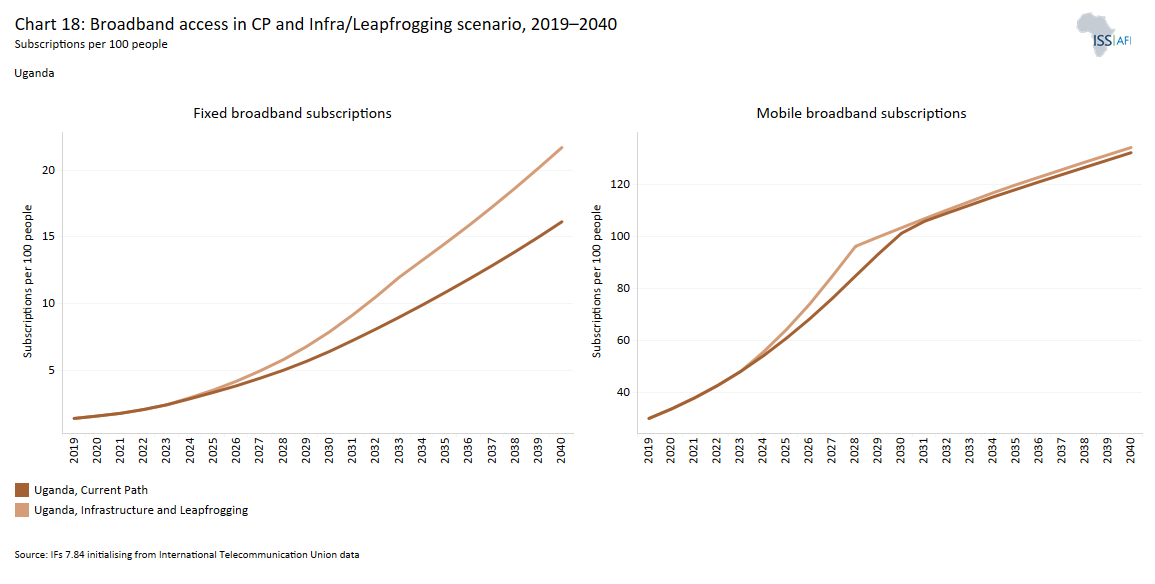
In addition to physical infrastructure, improvement in ICT infrastructure is indispensable for economic growth and development. Advancement in ICT reduces average cost of production, facilitates the formation of increasing returns to scale industries, and enhances productivity. The NDPIII that runs from 2020/21 to 2024/25 seeks to usher in a digital transformation by increasing ICT penetration and the use of ICT services for social and economic development. ICT penetration comes either through fixed broadband or mobile broadband connectivity.[5Fixed broadband includes cable modem Internet connections, DSL Internet connections of at least 256 KB/s, fibre and other fixed broadband technology connections (such as satellite broadband Internet, ethernet local area networks, fixed-wireless access, wireless local area networks, WiMAX, etc.). Mobile broadband on the other hand refers to wireless Internet access delivered through cellular towers to computers and other digital devices.] Unlike fixed broadband connection, mobile broadband penetration rates are much more impressive. In 2019, mobile broadband subscription in Uganda stood at 29.8 subscriptions per 100 people, above the 18.6 rate for its low-income peers in Africa. In the Current Path, this will rise to 132.1 by 2040, which is above the 119.6 for an average low-income African country.
While Uganda has made progress in road connectivity and improved broadband connectivity, the country still faces challenges in the infrastructure sector. More paved roads, more and better rural roads to connect markets with the rural areas, and a push on rural electrification, while building the infrastructure for fixed broadband connectivity, are key challenges to the sector.
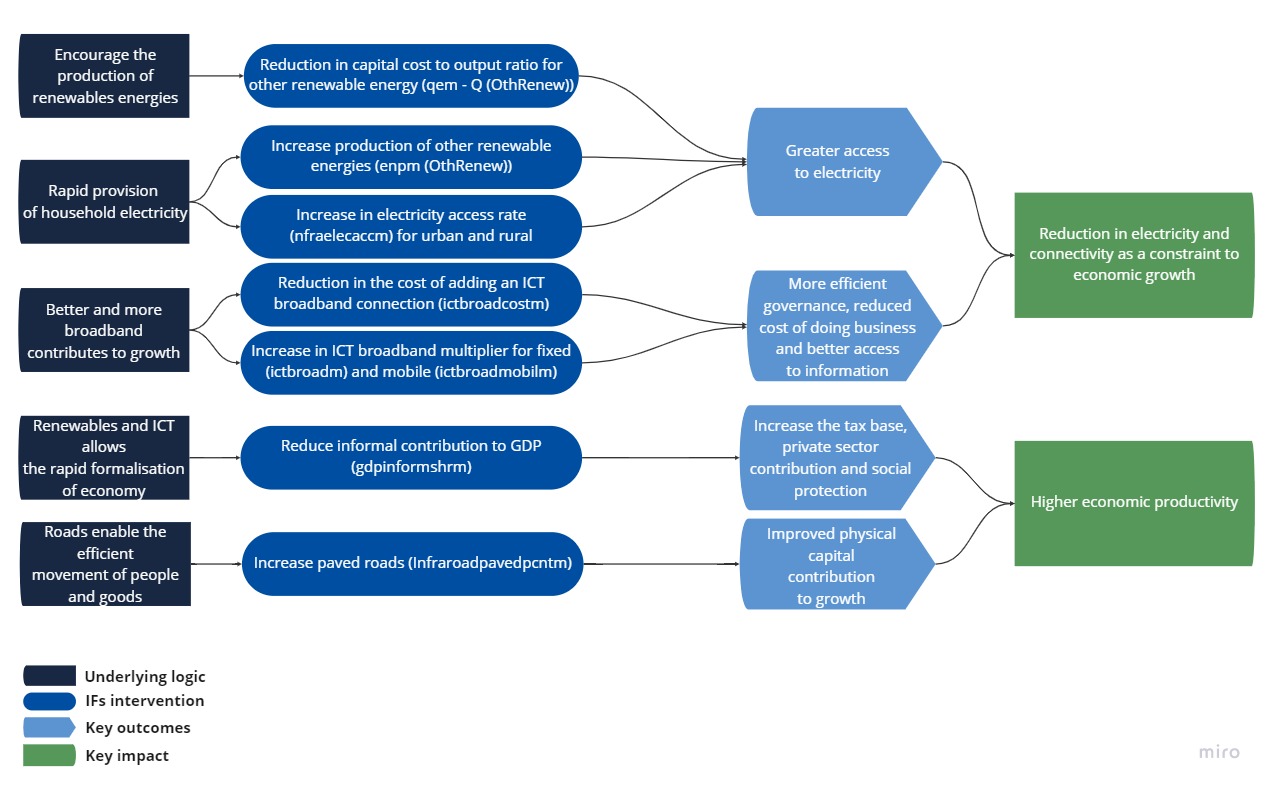
The Large Infrastructure and Leapfrogging scenario represents reasonable but ambitious investment in renewable energy technologies, resulting in better access to electricity in urban and rural areas. The scenario also includes accelerated access to mobile and fixed broadband and the adoption of modern technology that improves government efficiency and allows for the more rapid formalisation of the informal sector.
The Large Infrastructure and Leapfrogging scenario will improve electricity access to 82% of the population, above the Current Path of 60.9% by 2040. Regarding the urban–rural divide in electricity access, the Large Infrastructure and Leapfrogging scenario will push urban electricity access to 98.9% and rural electricity access to 74.6%, compared to 80.4% and 52.3%, respectively, in the Current Path.
In 2019, fixed broadband subscription in Uganda was 1.4 subscriptions per 100 people, which is lower than the average for low-income Africa at 1.5 subscriptions per 100 people. On the Current Path, fixed broadband subscription will rise to 16.1 by 2040. In the Large Infrastructure and Leapfrogging scenario, fixed broadband subscription increases to 21.7 by 2040, slightly above the average for Uganda’s low-income peers in Africa.
Because of the already aggressive Current Path of improved rates of mobile broadband subscription, the Large Infrastructure and Leapfrogging scenario will increase subscriptions marginally above the Current Path by 2040.
By 2040, the Large Infrastructure and Leapfrogging scenario will further improve the situation by reducing traditional and improved stove usage by 22.5 and 1.2 percentage points compared to the Current Path. It will then increase the use of modern fuel stoves by 23.8 percentage points to 58.3% compared to the Current Path. In the Large Infrastructure and Leapfrogging scenario, the proportion of people using improved cookstoves will rise marginally above the Current Path to 43.8% by 2040.
Agriculture is an integral part of the Ugandan economy: it contributed 21% of GDP and 46% of export earnings, and employed 55% of the labour force in 2019. The NDPIII recognises agriculture as a priority area that will be harnessed to intensify resource-led industrialisation, given that most of the export earnings are from unprocessed raw material. Agricultural land as a percentage of total land in Uganda accounted 80% in 2022; however, only 35% of land is cultivated. Most of the arable land is under permanent crops and pastures.
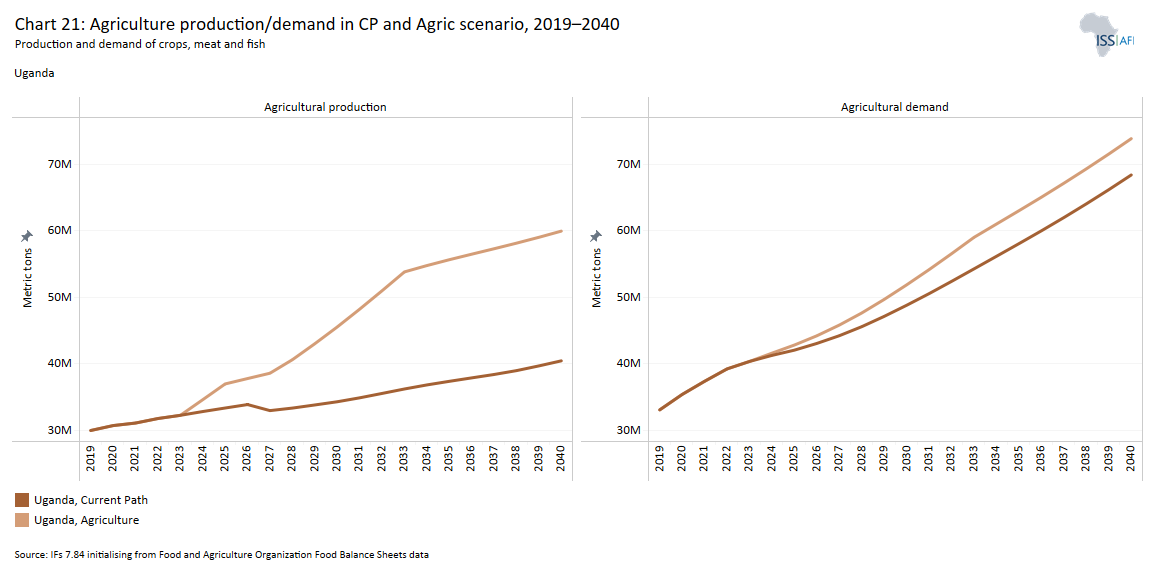
The data on agricultural production and demand in our modelling initialises from data provided on food balances by the Food and Agriculture Organization (FAO). The model contains data on numerous types of agriculture, but aggregates its forecast into crops, meat and fish, presented in million metric tons. Total agriculture production in 2019 stood at 33.1 million metric tons. Out of this, 29.8 million metric tons were crops, 2.7 million metric tons were meat production, and the remainder constituted fish production. Total agricultural production in 2019 fell short of domestic demand by 3.1 million metric tons, meaning that Uganda is not food self-sufficient. According to the Current Path, the country will suffer from food insecurity as agricultural production falls short of domestic demand by 27.9 million metric tons by 2040. Hence, there is a need to revamp the agriculture sector and increase domestic production to avoid the risk of future food shortages. Some of the agricultural commodities produced in Uganda include cotton, coffee, tea, coffee, sugar, tobacco and groundnuts. Smallholder agriculture constitutes the bulk of the food production and mainly operates at subsistence level. The government’s efforts at modernising smallholder farming include providing extension services and making efforts to change mindsets by providing agricultural education, value addition, and seeds and fertilisers.
Data on yield per hectare (in metric tons) is for crops but does not distinguish between different categories of crops. In 1990, the average crop yield per hectare in Uganda was 3.25 tons — significantly higher than the average for low-income African countries at 1.2 tons. Between 1990 and 2019, crop yield increased by 27% to 4.14 tons per hectare as a result of efforts to mechanise agriculture through the policy on small-scale agricultural farmers. Climate change and other supply side shocks that affect agricultural production are becoming more frequent, however. In the Current Path, crop yields in Uganda will decline to 3.6 tons per hectare by 2040, below the average for its income peers of 3.7 tons.
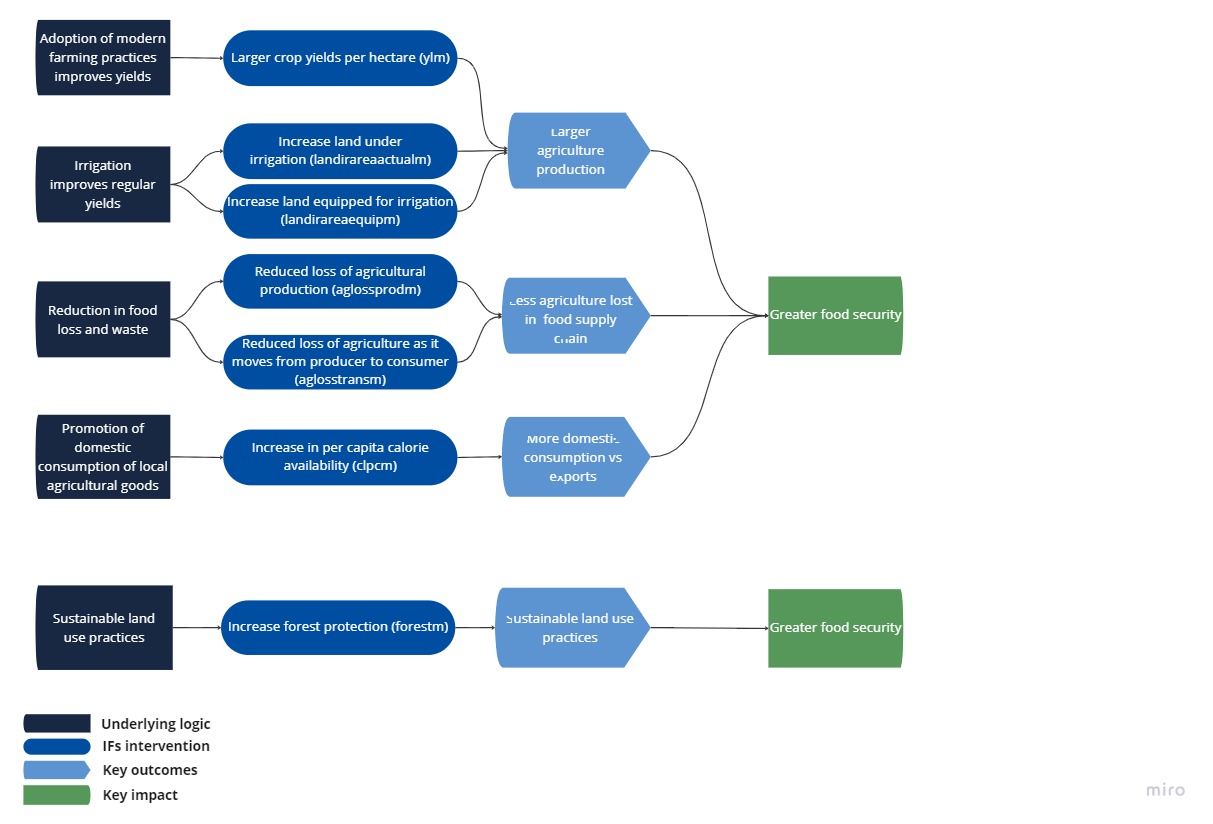
The Agriculture scenario represents reasonable but ambitious increases in yields per hectare (reflecting better management and seed and fertiliser technology), increased land under irrigation, and reduced loss and waste. It includes an increase in calorie consumption, reflecting the prioritisation of food self-sufficiency above food exports as a desirable policy objective.
In the Agriculture scenario, crop yield is projected to rise by 51.9% above the Current Path forecast to 5.7 tons per hectare by 2040. Alongside the improvement in crop yield, crop production in Uganda increased from 20.2 million metric tons in 1990 to 34.2 million metric ton in 2019. In the Current Path forecast, crop production is projected to slightly decline to 32.4 million metric tons by 2040. The Agriculture scenario is set to increase crop production to 51.9 million metric tons by 2040, 60% above the Current Path forecast of 32.4 million metric tons. In the same vein, meat production jumped from 0.68 million metric tons in 1990 to 2.3 million metric tons in 2019. By 2040, the forecast for meat production in the Agriculture scenario is 100 000 tons above the Current Path forecast of 6.9 million metric tons.
By 2040, the effect of the Agriculture scenario is to reduce Uganda’s dependency on importing crops by 64.4% and meat by 2% below the Current Path forecast. Import dependence for fish in the Agriculture scenario is set to increase by 1.6% above the Current Path forecast by 2040. While in the Current Path forecast, agricultural yields and production are projected to decline by 2040, the effect of the Agriculture scenario is to reverse this trend and increase yields and production above the 2019 values, and also to reduce significantly import dependence for crops and meat.
The manufacturing sector is historically a key job creator, output and export promotion sector and allows for the structural transformation of economies towards higher productivity, with spillover effects on other sectors. The sector is key in achieving economic development due to its backward and forward linkages with other sectors such as the agriculture and service sectors. In 2019, manufacturing contributed 15.5% of GDP and employed 14.5% of the labour force in Uganda. Manufacturing activities in Uganda consist mainly of end-product assembly and material processing from imported intermediate and capital goods. There is little addition to raw materials such as petroleum goods, iron and steel, and sugar and sugar preparations. The impact of the sector is generally small and runs on basic technology, hence its low contribution to jobs and value addition.
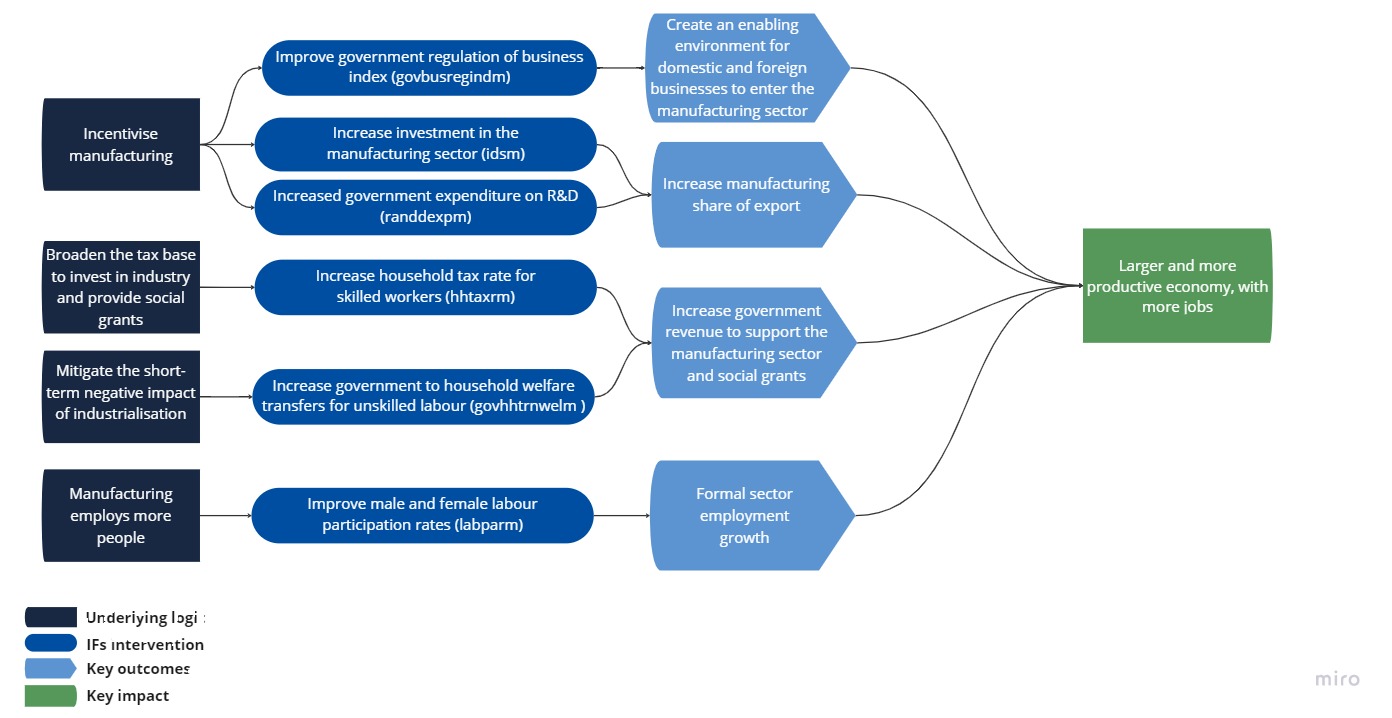
The NDPIII recognises the bottleneck that the manufacturing sector faces including the lack of appropriate infrastructure, weak small- to medium-sized enterprise (SMEs), limited access to finance, the poor linkages between trade and industrial development, low labour productivity, and high costs of doing business. The Manufacturing scenario represents reasonable but ambitious manufacturing growth through greater investment in the manufacturing sector, investments in research and development (R&D), and promotion of the export of manufactured goods. It is accompanied by an increase in welfare transfers (social grants) to mitigate the potential tension between inequality and structural transformation (the Kuznetsian tension). To fund investment in the manufacturing sector and welfare transfers, the scenario broadens the tax base and increases government revenues.
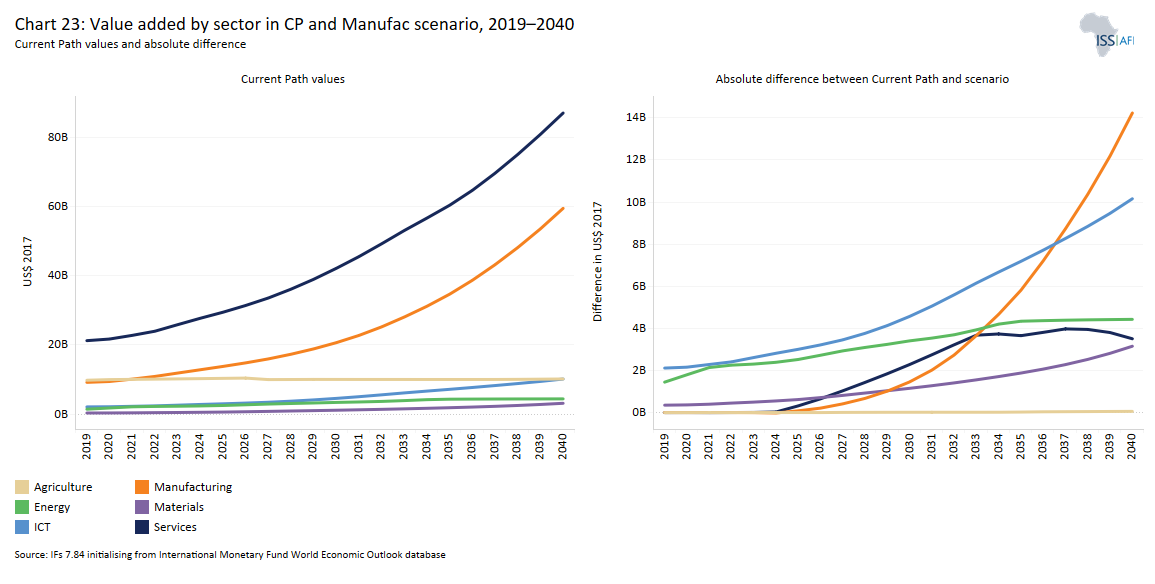
Unlike the conventional three-sector classification of economic activity, our modelling draws on GTAP data to classify economic activity into services, agriculture, manufacturing, materials, energy and ICT. In 2019, services, manufacturing and agriculture were the greatest contributors to the GDP in Uganda, while materials, ICT and energy were the least. Nearly half of the GDP (48.1%) came from services, followed by agriculture at 22.2% and manufacturing at 20.8%. Energy and ICT contributed 3.2% and 4.7%, respectively, while materials’ share of GDP was negligible at 0.79%. In the Current Path, services, manufacturing and ICT will increase to 53.6%, 29% and 6.1%, respectively. On the other hand, the share of agriculture and energy of GDP will decline to 6.4 and 2.8%, respectively.
In the Manufacturing scenario, the contribution of manufacturing to GDP will increase by an additional US$12.6 billion by 2040. In addition, the value of the contribution of all other sectors will increase above the Current Path, except for energy. Compared to the Current Path, the value of the contribution of services will increase by US$2.2 billion in the Manufacturing scenario and energy will decline by US$31 million by 2040.
In 2019, welfare transfers to households in Uganda amounted to US$3 billion. In the Manufacturing scenario, welfare transfers increase to US$18.6 billion by 2040, representing an increase of US$3 billion above the Current Path. As the Manufacturing scenario improves economic activity in the manufacturing sector, more manufacturing jobs will be created leading to more jobs in this sector. In 2019, the number of people employed in the manufacturing sector was 2.5 million people. The Manufacturing scenario will increase this figure to 7.5 million by 2040; this constitutes 1.8 million additional jobs compared to the Current Path for the same year. It means that the Manufacturing scenario can increase employment in the manufacturing sector by about 31% compared to the Current Path.
The contribution of manufacturing to GDP will increase by five percentage points above the Current Path by 2040. Consequently, the percentage point difference in the contribution of all other sectors to GDP will fall below the Current Path in 2040. Services will decline by almost 4 percentage points while all other sectors each will decline by a half-percentage point or less compared to the Current Path.
The benefit of trade is to enable countries to specialise in the production of commodities that they have a comparative advantage in and export them, while importing those that are relatively costly to produce in their home countries. Trade also opens up factors of production to be distributed in a more efficient manner and increases the total factor productivity of firms through competition. Trade openness measures the extent to which a country is a participant in the global trading system. This is calculated using the sum of total exports and total import over total GDP. A higher ratio depicts higher influence of trade on domestic activities while a lower ratio represents a country that trades less in the global system.
Uganda has steadily opened up to international markets, increasing its openness from 26.6% in 1990 to 39.3% in 2019, but this is still below the average for low-income African countries at 47.1%. Despite being a member of many bilateral and multilateral regional trading blocs, such as the EAC, the African Continental Free Trade Area (AfCFTA), the Forum on China–Africa Cooperation (FOCAC) and the EU’s Everything but Arms scheme (EBA), trade has not increased significantly.
In 2019, Uganda’s total exports comprised 15% of GDP, which was below the average of 20% for low-income countries in Africa. Most of the country’s exports come from the agriculture and service sectors, with total export values from these sectors equivalent to 5% and 5.7% of GDP, respectively. Export from the manufacturing sector was valued at 3.8% of GDP in 2019. Exports from Uganda include gold, cocoa beans, raw sugar, coffee and tea to Kenya, the United Arab Emirates, DR Congo, South Sudan and Italy, among other countries.
Uganda, like many African economies, is basically a net importer of goods and services. In 2019, the country’s trade deficit represented about 5.1% of GDP, which was below the average of 10.3% for its income peers on the continent. This deficit is mainly due to the large imports of refined petroleum, gold, palm oil, pharmaceutical products and capital goods from China, Kenya, India, the United Arab Emirates and Tanzania.
Trade in Uganda is hindered by a multitude of factors including access to ports, given its landlocked nature, low agricultural productivity and negligible manufacturing activity to support export and reduce imports. Uganda is a non-coastal country that imports and exports its goods mainly through the Mombasa port in Kenya. As a result, in the Current Path, Uganda will see its trade deficit increasing to 8.8% of GDP and openness stagnating at 39% of GDP by 2040.
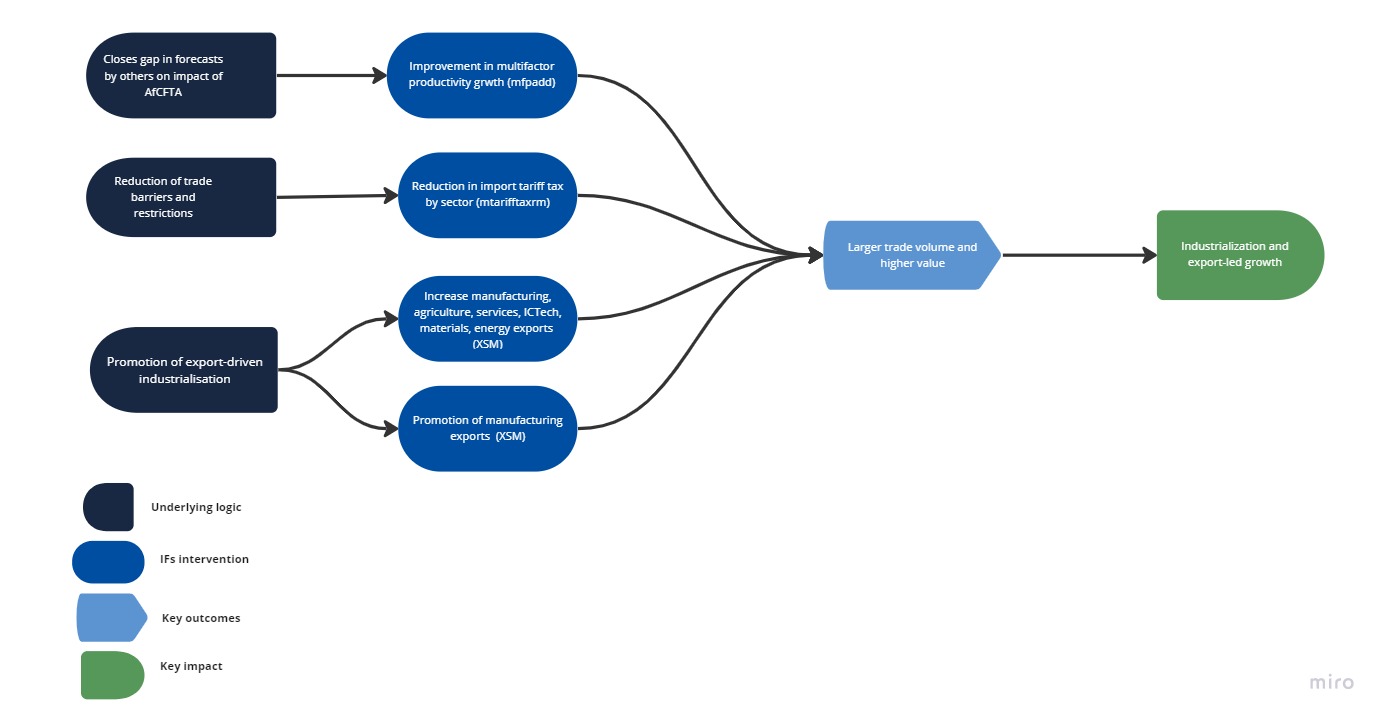
The AfCFTA scenario represents the impact of the full implementation of the AfCFTA by 2040 through increases in exports, improved productivity, increased trade and reduced tariffs.
By 2040, the AfCFTA scenario will improve the export value of Uganda to 27% of GDP compared to the Current Path of 15.5%. Uganda’s total import value in 2019 was equivalent to 23% of GDP, which was below the value of 31.6% for its income peers in Africa. By 2040, Uganda’s imports will increase to 29.3% of GDP in the AfCFTA scenario compared to 24.3% of GDP on the Current Path and the average of 35.9% of GDP projected for low-income countries in Africa. In the AfCFTA scenario, imports of manufactures will increase by almost 4 percentage points above the Current Path, whereas the import share of GDP of services, materials and ICT increases marginally above the Current Path by 2040. However, imports of energy and agriculture will decline compared to the Current Path by the same time.
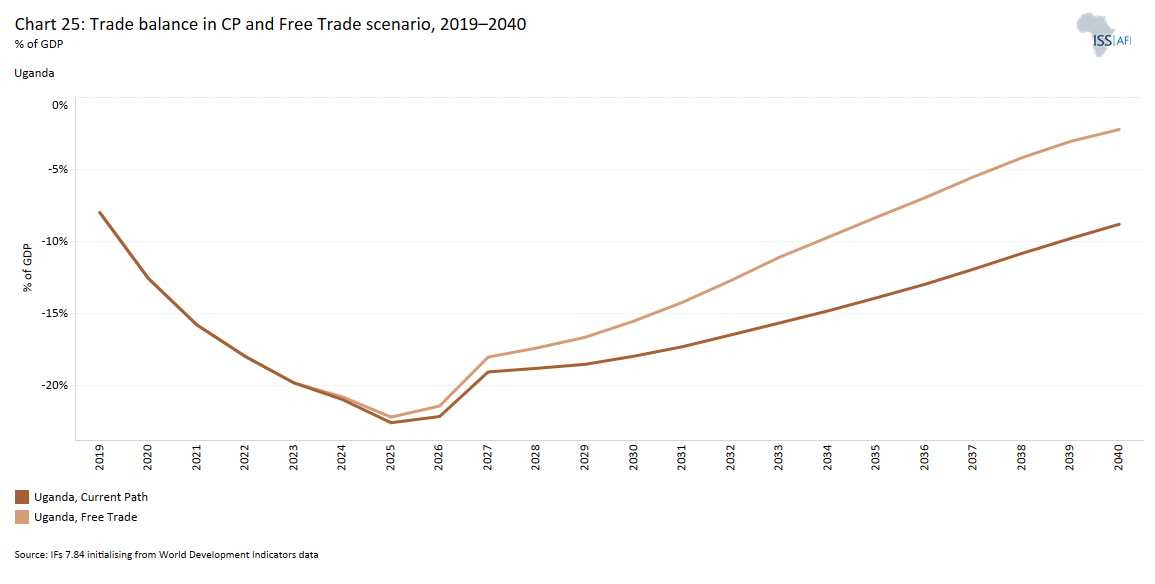
In the short term, the trade balance of Uganda will worsen, peaking at a deficit of 22.6% and 22.2% of GDP in the Current Path and the AfCFTA scenario, respectively, by 2025. Thereafter, Uganda will witness an improvement in its trade balance in both the Current Path and the AfCFTA scenario, although the improvement is much quicker in the latter. By 2040, the projected trade deficit will be 8.8% of GDP on the Current Path. In the AfCFTA scenario, the trade deficit declines further to 2.2% of GDP by 2040.
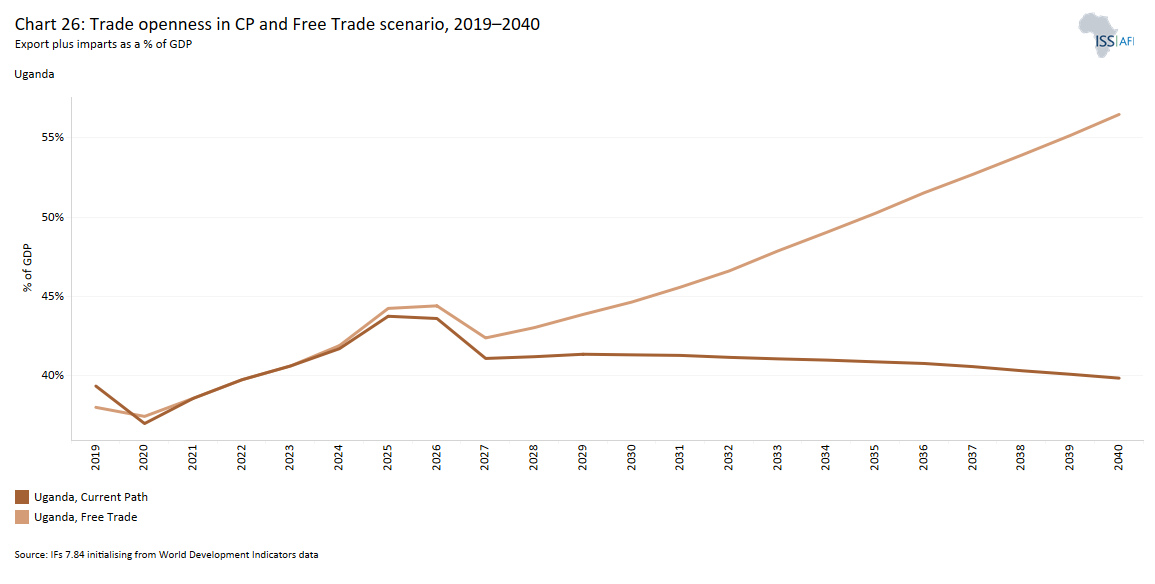
In the Current Path, trade openness will marginally increase to 40% by 2040. However, the AfCFTA scenario will boost openness to 56.4% by 2040, 16.5 percentage points above the Current Path. The full implementation of the AfCFTA will benefit Uganda and dramatically improve its trade balance over the period. Also, Uganda’s trade balance in both the Current Path and this scenario will be far above the trade deficit of 10.8% of GDP for its income peers on the continent by 2040.
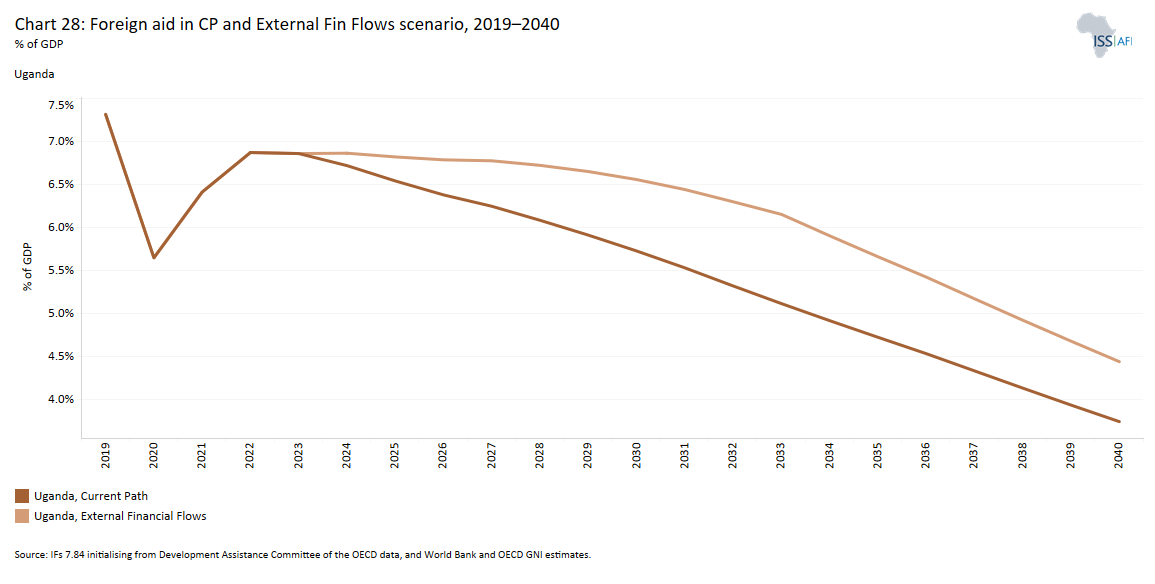
External capital to a country enters either as aid from donors, remittance from nationals outside, or as short-term portfolio investments or long-term foreign direct investment (FDI) seeking business opportunities and profit. As a low-income country, Uganda receives more aid as a per cent of GDP than FDI inflows or remittance from abroad. In 2019, while aid accounted for 7.3% of GDP, FDI inflows and remittances accounted for 3.6% and 2.4%, respectively. Historically, aid receipt has been declining since 1982 when it stood at 10%. In 1990, Uganda received US$1 billion in foreign aid, equivalent to 15.6% of GDP. Between 1990 and 2019, foreign aid to Uganda increased to nearly US$3 billion although its share of GDP declined to 7.3% — more than two percentage points below the 9% average for low-income African countries. Foreign aid to Uganda goes to humanitarian assistance, and the agriculture and health sectors.
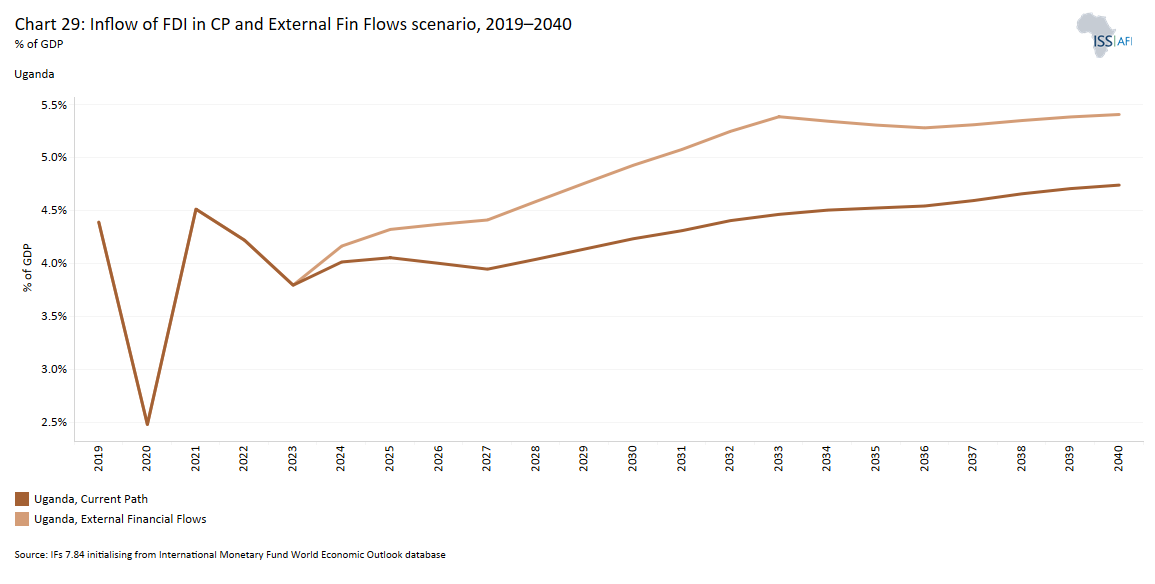
FDI in Uganda mainly goes to the mining and coffee sectors where Kenya, Germany and Belgium are the main investors. The EACOP that seeks to build 1 400 km pipeline from Uganda to Tanzania’s Tanga seaport will provide a great boost to FDI stock in Uganda. In the 2020 Doing Business report, Uganda ranked 116th out of 190 countries, indicating that it needs to improve its business environment to attract more FDI. The total amount of FDI received by Uganda in 2019 amounted to 3.6% of GDP, almost at par with the average for low-income countries. While the inflow of FDI to Uganda is very low, the stock in 2019 amounted to 45.3% of GDP, and in the Current Path it will grow to marginally decline to 43.4% by 2040. This reflects the already low FDI inflows which will only get to 4.7% by 2040.
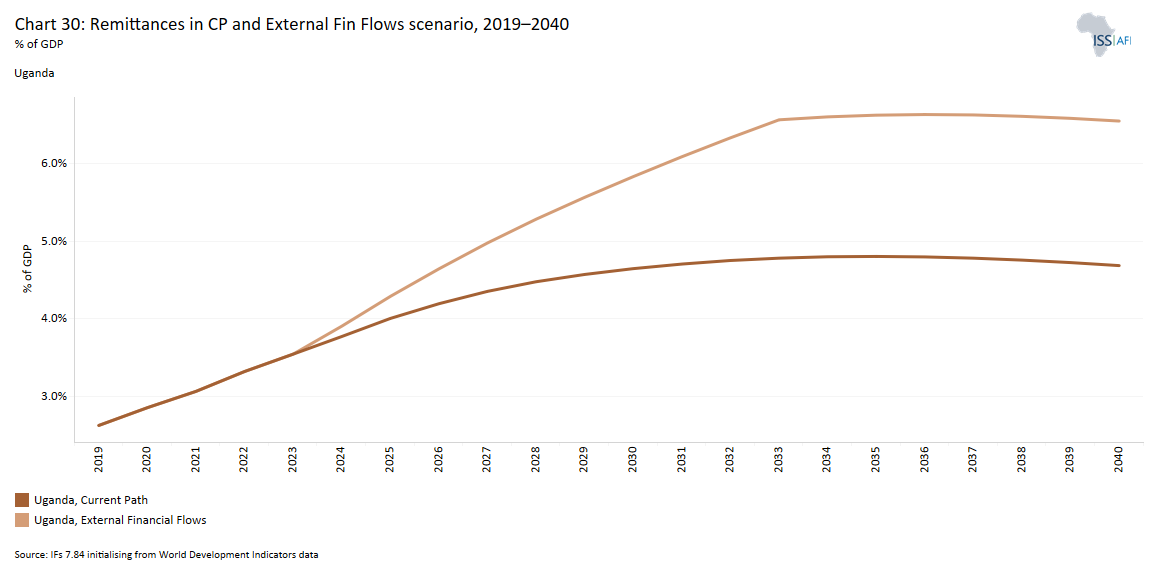
Uganda moved from being a net remittance sender to the rest of the world of US$125.4 million in 2000 (0.99% of GDP) to a significant net receiver of remittance of US$1.1 billion (2.4% of GDP) in 2019. Due to the effect of the COVID-19 pandemic on job security, remittance to Uganda declined in absolute values in 2020, but it ranked sixth among its income peers in receipt of remittance in 2019. The country leverages its integrated mobile money to boost remittance receipt. The system allows for wallet-to-wallet transfers to six countries in sub-Saharan Africa and at the same time receives from four countries. Another challenge to remittance inflow to Uganda is the high cost of sending remittance at 8.7%, which is higher than the SDGs target of 3.7%. In the Current Path, remittance receipts will increase to US$7.3 billion (or 4.6% of GDP) by 2040.
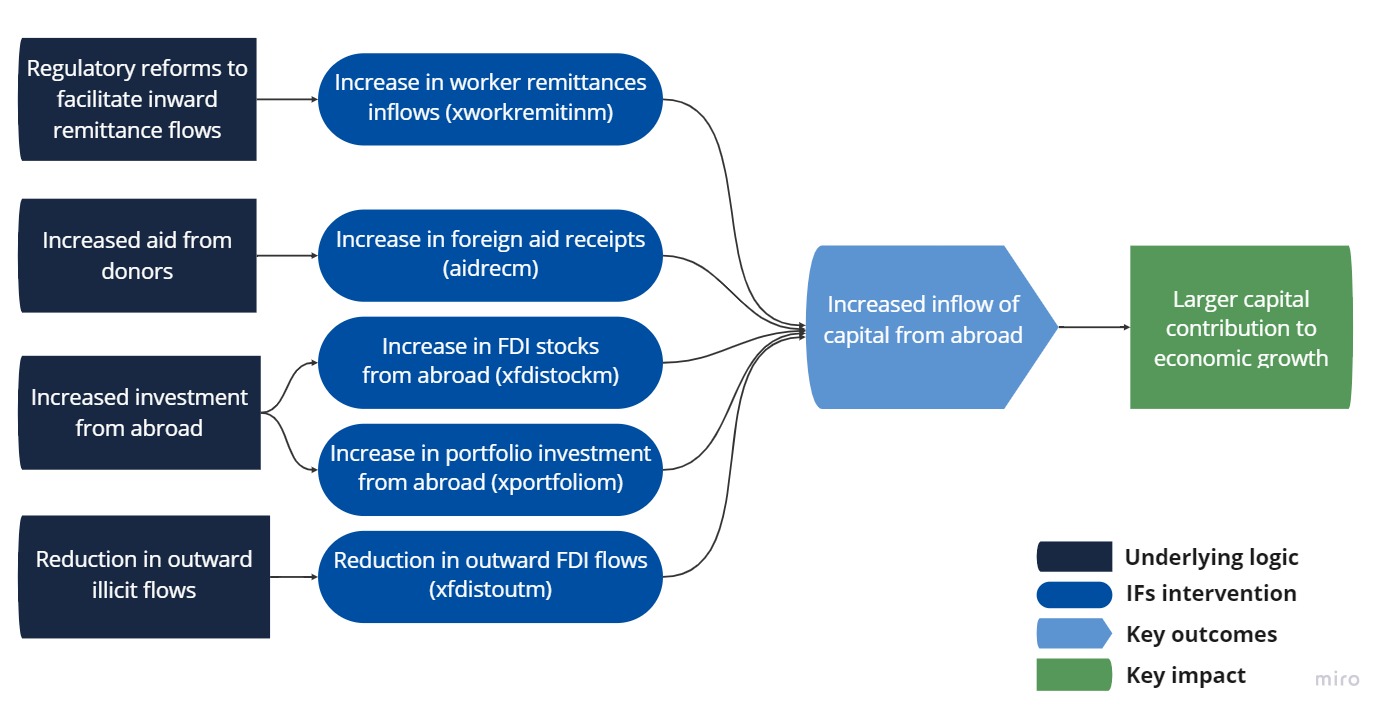
The Financial Flows scenario represents a reasonable but ambitious increase in worker remittances and aid flows to poor countries, an increase in the stock of FDI and additional portfolio investment inflows as well as a decline in outward investment to emulate a reduction in illicit financial outflows.
In the Financial Flows scenario, Uganda will increase its foreign aid receipt to US$7.2 billion – above the US$5.9 billion in the Current Path in 2040. This represents 4.4% of GDP of Uganda and is 0.8 percentage points below the 2040 average for low-income African countries.
In the Current Path, Uganda will increase FDI inflows to 4.7% of GDP which further increases to 5.4% in the Financial Flows scenario by 2040. This will represent an extra 0.2 percentage points of FDI inflows compared to the Current Path for low-income peers by the same year.
Stability and better governance are important for a host of reasons including the fact that they enable the development of stronger institutions, enhance inclusion, improve accountability and, over time, allow for a reduction in defence expenditure. Good governance therefore leads to more effective delivery of all aspects of public and private sector services, lower corruption, greater democratisation and inclusion, and reduced risk of conflict. It could also attract secondary benefits like larger FDI inflows.
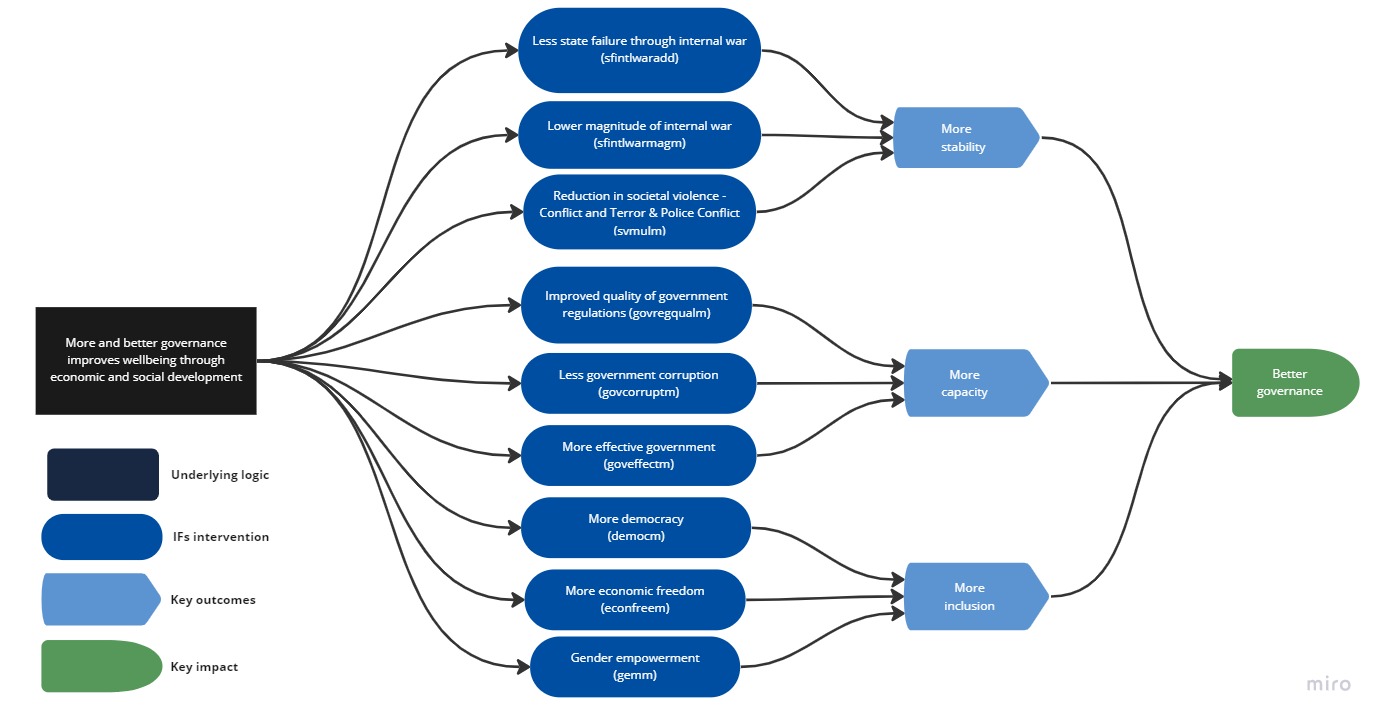
In our modelling, governance is conceptualised along three dimensions — security, capacity and inclusion — that reflect the three core characteristics of governments globally. The security dimension measures the probability of intra-state conflict and the general level of risk. Capacity, the second dimension, is related to government revenue, corruption, regulatory quality, economic freedom and government effectiveness. Inclusiveness, the third dimension, measures the level of democracy and includes gender. The three dimensions reflect the sequential evolution of the Westphalian state. Africa’s history reflects the deleterious impact of imposed statehood, but African states need to improve their scores on all three, although in a compressed time period and simultaneously.
Uganda’s post-independence history is characterised by instability, frequent coups and civil war. On independence, the country inherited a multiparty system of governance but was soon turned into a one-party state in 1966 by President Milton Obote. General Idi Amin deposed Obote in 1971 establishing one of Africa’s most brutal dictatorships, characterised by high levels of corruption and the forced emigration of the Indian business community. As a result, the economy suffered. However, it was not long before Amin was removed by a Tanzania-backed rebel army in 1979 leading to the return of Obote. President Obote’s return led to more armed resistance and he was again deposed in a coup in 1985, which was later defeated by the National Resistance Army in 1986 under the leadership of Yoweri Museveni. Since then, Uganda has been relatively stable, although armed conflict continues in Northern Uganda.
Shortly after its ascension to power in 1986, the National Resistance Movement (NRM) introduced the movement system, otherwise called the no-party system, where a candidate stands as an individual to be elected on personal merits and not as a member of a political party. In 2005, NRM re-introduced a multiparty system.
Although widely touted as an authoritarian state where the quality of democracy is poor, the NRM government originally instituted a number of reforms aimed at consolidating democracy. In May 1986, the NRM government established a commission of inquiry into violations of human rights since independence. The 700-page report of the commission proposed how to build a permanent human rights culture in Uganda, include human rights in educational curricula, and punish preparators. It recommended the establishment of a permanent human rights commission, which was amplified by the Odoki Constitutional Commission. The proposals were adopted in the 1995 constitutional amendment, leading to its operationalisation in November 1996 and the Human Rights Commission Act of 1997. In 2019, Uganda scored 0.68 on the governance security index, slightly above the average for low-income African countries at 0.64. In the Current Path, Uganda’s score will increase to 0.76 by 2040, which is above the Current Path average for low-income African countries of 0.70.
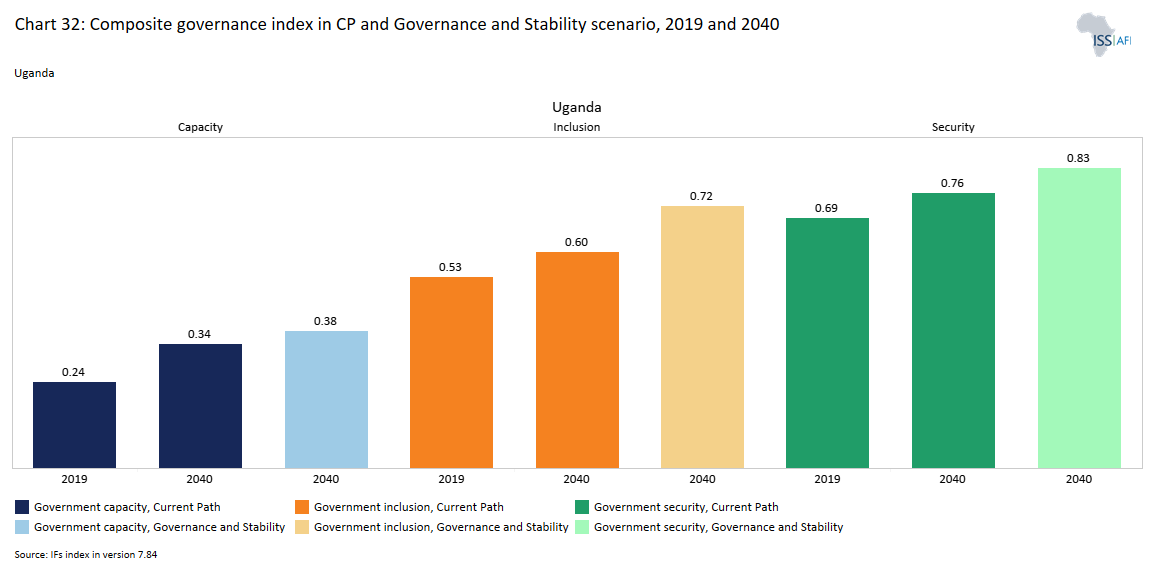
The Ugandan government’s capacity in mobilising government revenue, reducing corruption, improving the regulatory quality and economic freedom, and enhancing government effectiveness is marred with challenges. In 2019, government’s revenue as per cent of GDP of 16.3% fell short of the average for its peer income group in Africa of 17%. Similarly, the transparency level in Uganda was very low at 2.7 out of 10 in 2019; however, it was on par with the average for low-income Africa. Consequently, Uganda scored lower than the average for low-income African countries in governance capacity in 2019. Its score of 0.23 is below the 0.24 score for low-income African countries.
Government inclusion measures the level of democracy and reflects gender parity in governance issues. Because of the nature of Uganda’s military government, Ugandan democracy has much to improve on. The terms system does not exist in Uganda and the current president has been in office for more than 30 years, since 1986. Certainly, with regime changes and more female participation in leadership positions, the country stands to benefit from its current level of government inclusion.
To model this, the Governance scenario uses a multiplier on the Polity IV democracy index that reflects higher levels of democracy, improves gender empowerment using the gender-empowerment measure, reduces corruption (using the index from Transparency International), reduces the risk of interstate conflict and levels of internal conflict from the Political Instability Task Force, and increases investment in the economy including from foreign sources. These factors impact positively on capital contributions to growth, meaning that more government revenue can be allocated to the provision of healthcare, education and other services, even as levels of economic growth accelerate.
In the Governance scenario, the governance security index will increase above the Current Path by 9.6% by 2040. By that time, the score will be 0.83 in the scenario. Uganda will improve its governance capacity score to 0.38 in the Governance scenario, which is above the Current Path of 0.34 in 2040. This represents an 11.7% improvement on the Current Path by 2040. Regarding governance inclusion, Uganda will improve its score from 0.52 to 0.59 between 2019 and 2040; and in the Governance scenario, the country will further improve its score by 22% to 0.73 by the same year. Uganda ranked seventh out of the 23 low-income African countries on governance inclusion in 2019.
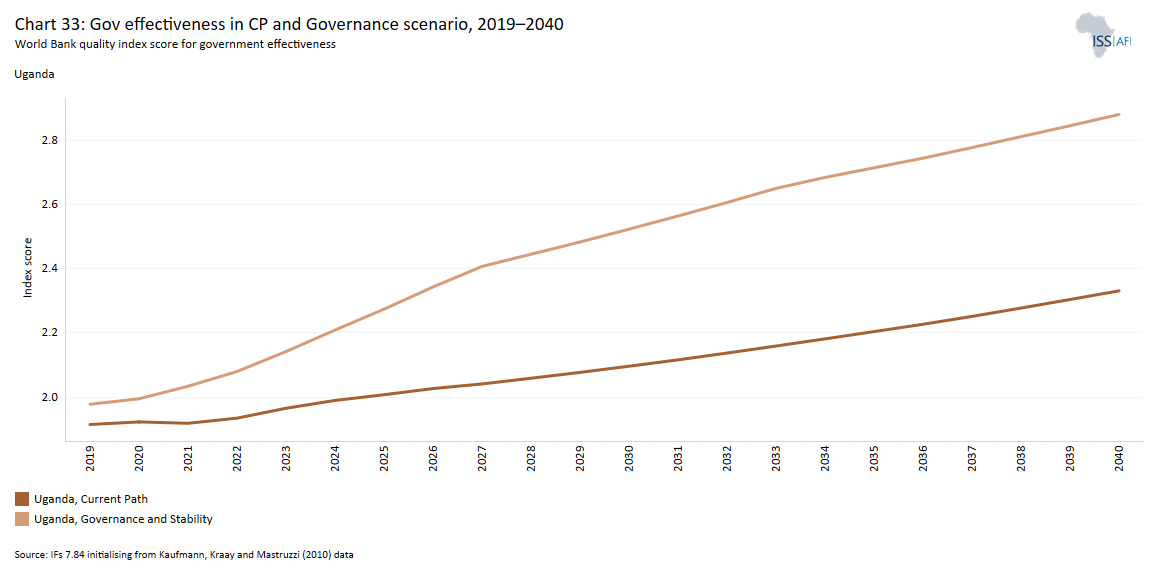
Government effectiveness, as defined by the World Bank, ‘captures perceptions of the quality of public services, the quality of the civil service and the degree of its independence from political pressures, the quality of policy formulation and implementation, and the credibility of the government’s commitment to such policies.’ In the Current Path, Uganda will improve its effectiveness score to 2.3 by 2030 and further to 2.8 by 2040 in the Governance scenario, reflecting the impact that better security, capacity and inclusion will have.
Impact of sectoral scenarios on key indicators
Download to pdfThis section first examines the impact of the individual sectoral scenarios on GDP per capita, poverty and inequality as well as carbon emissions. It then proceeds to discuss the impact of a Combined Agenda 2063 scenario on these variables as well. The Combined Agenda 2063 scenario consists of the combination of all eight sectoral scenarios presented above, namely the Demographics and Health, Education, Infrastructure and Leapfrogging, Agriculture, Manufacturing/Transfers, Free Trade, External Financial Flows and Governance and Stability scenarios.
Uganda experienced impressive economic growth immediately after independence with the size of its GDP increasing from US$2.6 billion in 1962 to US$4.4 billion in 1972. Economic progress during this period was directed by the two medium-term plans that the country pursued and was interrupted by the ‘economic war’ plan in the 1970s. Poor governance in the 1970s and the civil war during the first half of the 1980s then plunged the country into a deep recession. Since 1986, the country has embarked on a reform agenda when it started implementing the Structural Adjustment Program and other economic policies and programmes such as the Economy Recovery Program (ERP), Medium Term Expenditure framework, Plan for Modernisation of Agriculture, and the Poverty Eradication Action Plan.
The result is that between 1990 and 2010, Uganda became one of the fastest growing economies in Africa with an average GDP growth rate of 7.3% per annum, significantly above the sub-Saharan Africa average of 2.1% and only slightly below the average for East Asian countries at 7.9% during the same period. Since 2010, the country has implemented a series of national development plans, leading to GDP increasing from US$27.7 billion in 2010 to US$44.2 billion in 2019. However, growth has been mostly unstable and averaged only 4.6% per annum between 2010 and 2015 due to reliance on external finance and a few tradable commodities such as coffee, flowers and fish.
Economic growth has slowed considerably since 2011, barely passing the high population growth rate that averaged above 3% across much of this time period. This is due to reduced reform momentum, a less supportive external environment and exogenous shocks, such as droughts, leading to real per capita GDP growth slowing to 1.1 % per annum during the five years prior to the COVID-19 crisis. Going forward, structural transformation will be key to transforming Uganda into the modern, prosperous economy that it aspires to in Vision 2040. However, efforts will be met with obstacles as much of the workforce remains in low productivity jobs and declining total factor productivity. Besides which the large share of low skill informal jobs and majority of poor people are in agriculture which is susceptible to climate change and weather shocks.
The current long-term planning framework for the government, Vision 2040, seeks to transform the country from a peasant to a modern, prosperous economy with a per capita GDP of US$9 500 by 2040. NDPI and NDPII have already been implemented under this Vision with some measured success such as an increase in GDP per capita from US$844 in 2011 to US$878 in 2018, sustained peace and security, increased paved road networks, more electricity access, and greater access to social services in health and education. However, there are still challenges such as large informal sectors, the high cost of electricity, limited access to and the high cost of capital, widening inequality, low capacity in civil service and the prevalence of corruption.
While GDP measures the size of the economy, GDP per capita is generally used to measure the standard of living. Although it is often criticised for its simplicity, it is still the most widely used and accepted index used to compare welfare between countries. From 1990 to 2019, Uganda's GDP per capita increased by 58%, from US$1 134 to US$2 707. This reflects the average growth in GDP of about 6.5% over the period, which exceeded population growth of about 3.5% in that time. Uganda’s GDP per capita has grown faster than the average for low-income African countries, which increased from US$1 118 in 1990 to US$1 708 in 2019. Whereas the GDP per capita of Uganda was 93% of the average for low-income African countries in 1990, it increased to 222% in 2019. With the projected increase in GDP and the reduction in population growth, GDP per capita is set to reach US$4 453 by 2040, which is significantly higher than the 2040 average for low-income African countries.
In the Governance and Stability scenario, Uganda’s GDP per capita is set to increase to US$4 813 by 2040, equivalent to an extra US$360 addition to the Current Path forecast for 2040. This represents an 8% increase above the Current Path forecast for Uganda. Regime stability and good governance in the form of adherence to the rule of law, reduced corruption and improved transparency and accountability lead to more rapid economic growth. In the Demographics and Health scenario, GDP per capita is projected to increase to US$4 811, which is US$358 above the Current Path forecast value of US$4 453 in the same year. The gain is associated with the expected decline in fertility rates, which will cause a reduction in population growth and an increase in the ratio of working-age persons to dependants, translating to a demographic dividend. Together with the anticipated economic growth, the dividend increases GDP per capita.
In the Agriculture scenario, the GDP per capita for Uganda will slightly increase above the Current Path forecast to US$4 536 in 2040. The Education scenario will marginally increase GDP per capita above the Current Path forecast by US$71, representing only 1.5% above the Current Path forecast for that year. The modest impact of the Education scenario reflects the already significant progress made in access to education in Uganda, although some quality gaps exist, and the lag of investment in education impacts economic growth and development.
GDP per capita in the Manufacturing/Transfers scenario will reach US$4 773 in 2040. This is 7.2% (or US$320) higher than in the Current Path forecast for that year. Historically, the manufacturing sector is the largest provider of jobs and it allows for the structural transformation of economies towards higher productivity and knowledge, with spillover effects on other sectors. It is, therefore, not surprising that the Manufacturing/Transfers scenario leads to such an improvement in GDP per capita. In the Free Trade scenario, GDP per capita will increase to US$4 761 by 2040, which represents an increase of US$208 (or 4.5%) compared to the projections on the Current Path in 2040.
In the Infrastructure and Leapfrogging scenario, Uganda’s GDP per capita is estimated to increase to US$4 933 by 2040 — an increase of US$480 (10.8%) compared to the Current Path forecast of US$4 453 for 2040. Broadband accessibility has the potential to increase GDP through its effect on reducing transaction costs for businesses. It can also help firms adopt efficient technologies, which can improve productivity and ultimately lead to growth. Thus, this scenario is projected to make the most significant impact on the income level of Uganda by 2040.
Uganda’s GDP per capita will increase to US$4 540 in the External Financial Flows scenario, which represents an increase of US$87 (or 2%) above the Current Path forecast. Remittances, aid and FDI inflows are positively associated with economic growth effects on businesses and household expenditure.
Thus, the scenario with the greatest impact on GDP per capita by 2040 is Infrastructure and Leapfrogging, followed by Governance and Stability, Demographics and Health, then Manufacturing/Transfers. This suggests that these sectors should be supported to unlock more rapid economic growth in the long-term. The scenarios with the least positive impact on GDP per capita compared to the Current Path forecast by 2040 are Education, Agriculture and External Financial Flows.
GDP per capita is projected to rise to US$6 925 by 2040 in the Combined Agenda 2063 scenario, representing an additional US$2 472 to the Current Path forecast in 2040. This means that the aspirations of the Ugandan people articulated in Vision 2040 in transforming Uganda from a peasant to a prosperous, modern economy with per capita GDP of US$9 500 is attainable by 2045. The Vision 2040 target is projected to materialise five years later in 2045 when the projected GDP per capita (in 2017 purchasing power parity values) rises to US$9 568, above the target of US$9 500.
A persistent, large informal sector is one of the challenges that the economy of Uganda faces, as indicated in NDPIII. The size of Uganda’s informal sector amounted to US$14.8 billion in 2019, equivalent to 33.6% of GDP. At this rate, Uganda's informal sector contribution to GDP is above the average for low-income African countries at 31.1%. Given the large share of the informal sector in the economy and its contribution to employment, the government should focus on facilitating operations in other sectors by reducing obstacles such as access to finance, crime, theft and disorder, electricity access, water, taxes, burdensome inspections and informal gifts that hinder informal business operations in Uganda. Informality leads to lower tax revenues and impedes the ability of governments to provide investment and social safety nets. The informal economy is characterised by low productivity, low income and limited access to government benefits.
On the Current Path, Uganda will make progress in reducing the proportion of the informal economy to 29.8% by 2040, while its size will increase to US$46.9 billion. The declining share of the informal sector to GDP will be accompanied by a decline in informal labour as the number of people employed by the informal sector as a percentage of total labour will decline from 84.7% in 2019 to 75.6% in 2040.
Human capital refers to the stock of knowledge, skills and other personal features embodied in people that makes them productive. Higher investment in human capital in the form of more and quality education, training and improved health outcomes increase the stock of human capital formation of a country which leads to skilled and productive labour. In 2019, 13.4 million people or 52.5% of adult population had no formal education in Uganda in 2019. However, the level of literacy in Uganda was 77.2%, higher than the average for low income African countries at 58.3%. Similarly, 46.6% of adults completed primary education in Uganda, compared to 2.8% for secondary education and 1.7% for tertiary education. The high rate of educational attainment as a result of the pro-educational policies such as the universal free secondary education (USE)[6D Chapman, L Burton and J Werner, Universal Secondary Education in Uganda: The Head Teachers’ Dilemma, International Journal of Educational Development, 30:1, 2010, 77–82.] and the universal primary education which was initiated under the 1992 Uganda’s Government White Paper with the objective of achieving human development.
On the Current Path, it is projected that the proportion of adults (15 years and older) who had no formal education will significantly reduce to 34.5%, equivalent to 16.7 million people, by 2040. At the same time, 26.3 million people, representing 54.3% of the adult population, will have attained primary education, while 7.2% and 3.8% will have completed secondary and tertiary education, respectively, by 2040. Almost all (97.7%) of adults aged 15 to 19 would have completed primary education by 2040.
In the Combined Agenda 2063 scenario, it is projected that the number of adults (15 years and older) who had no formal education will significantly reduce to 14 million, representing 29.5% of adults, by 2040. At the same time, 25.6 million people, representing 52.5% of the adult population, will have attained primary education, while 6.2 million and 2.8 million people will have completed secondary and tertiary education, respectively, by 2040. In addition, by 2040, almost all (97.3%) of adults aged 15 to 19 would have completed primary education.
There are numerous methodologies and approaches to defining poverty. The study measures income poverty and uses GDP per capita as a proxy. In 2015, the World Bank adopted the measure of US$1.90 per person per day (in 2011 international prices), also used to measure progress towards the achievement of SDG 1 of eradicating extreme poverty. To account for extreme poverty in richer countries occurring at slightly higher levels of income than in poor countries, the World Bank introduced three additional poverty lines in 2017: US$3.20 for lower-middle-income countries; US$5.50 for upper-middle-income countries; and US$22.70 for high-income countries.[7In May 2022, the World Bank announced that it would be using US$2.15 in 2017 prices as the new international poverty line (to measure progress towards the SDGs) instead of US$1.90. Instead of the previous US$3.20 for low-middle-income countries, the adjusted poverty line is now $3.65, and $6.85 for upper-middle-income countries (instead of $5.50 in 2011 prices). The World Bank has not yet announced the new poverty line for high-income countries, previously set at $22.70 in 2011 prices. The World Bank intends to release the associated poverty estimates in 2023. In the meanwhile, this site continues to use the US$1.90, US$3.20, US$5.50 and US$22.70 poverty lines.]
In 2019, 18.1 million Ugandans, equivalent to 41.4% of the population, lived below the US$1.90 poverty threshold, on par with the average for low-income African countries. The high levels of poverty in the country have been attributed to limited social safety net programmes, high disease burden, low agricultural productivity and low skill content of labour in Uganda. In the Current Path forecast, by 2040, the number of people in extreme poverty in Uganda is projected to decline to 12.5 million, constituting 15.9% of the population, about five percentage points lower than the average for low-income African countries.
Therefore, the Infrastructure and Leapfrogging scenario, followed by the Manufacturing scenario and then the Demographics and Health scenario have the greatest potential in reducing poverty in Uganda by 2040. Infrastructure development reduces transaction costs and increases productivity and growth in economic sectors, which reduces poverty. Similarly, Uganda can reduce poverty by pursuing a low-end manufacturing growth path. However, such a growth path will need to be accompanied by increases in welfare transfers to reduce consumption inequality.
In the same vein, the Agriculture scenario is set to take the least number of people from poverty of 1.4 million, or 1.7 percentage points, compared to the Current Path forecast by 2040. It is interesting to note that the Agriculture scenario has a more positive impact on poverty in the short term than all other scenarios. In 2025, for example, the Agriculture scenario will lead to the lowest poverty rate in Uganda of 18.3%, and by 2030 and 2035 it is projected to have the fourth highest poverty rate among all scenarios. This shows that if Uganda follows an agricultural revolution as modelled in the scenario, it will quickly reduce poverty, although the longer-term impact is marginal.
The Free Trade scenario leads to an increase in poverty of 36 000 people (or 0.06 percentage point above the Current Path forecast) by 2040. Compared to the Current Path forecast, the Free Trade scenario is projected to increase poverty the most in 2036 when it pushes 429 000 more people into poverty, but by 2045, the Free Trade scenario will lift 1.3 million more people out of poverty. Free trade will reduce poverty in the long term after initially increasing it due to the redistributive effects of trade. Most African countries export primary commodities and low-tech manufacturing products, and therefore a continental free trade agreement that reduces tariffs and non-tariff barriers across Africa will increase competition among countries in primary commodities and low-tech manufacturing exports.
Countries with inefficient, high-cost manufacturing sectors might be displaced as the AfCFTA is implemented, thereby pushing up poverty rates. In the long term, as the economy adjusts and produces and exports its comparatively advantaged (lower relative cost) goods and services, poverty rates will decline.
In the Combined Agenda 2063 scenario, both the number and proportion of poor people in Uganda will significantly decline. By 2040, about 1.4 million people in the country, equivalent to 1.9% of the population, will be living in extreme poverty. This means that, compared to the Current Path forecast, 11.03 million more people could be lifted out of poverty by 2040 in the Combined Agenda 2063 scenario. This is equivalent to a decline of 13.9 percentage points compared to the Current Path forecast for 2040.
The benefit of economic growth may not be evenly distributed in a country due to inequality. High inequality in a country can lead to a breakdown of social structure and cohesion which can result in instability. Although Uganda has recorded progress in economic growth and reducing poverty, inequality is widening and land allocation, use and management is considered to be the main driver. The Gini coefficient is the standard measure of the level of inequality in a country. A higher score depicts more inequality while a lower Gini score shows a more equal country. In 1992, Uganda’s Gini score was 0.44, compared to the score of 0.40 for the average low-income African countries. By 2019, the Gini score had moderately improved to 0.43 (compared to an average of 0.4 for low-income Africa) and is projected to improve further reaching 0.40 by 2040.
The Combined Agenda 2063 scenario will reduce inequality in Uganda from a Gini coefficient of 0.48 in 2019 to 0.35 in 2040. This will represent a 13.2% improvement over the Current Path forecast for 2040 of 0.40 and an 11.4% improvement over the average for low-income African countries in the same year. Under the Current Path assumption of its peers, Uganda will rank fifth lowest (out of the 23 low-income countries) in inequality in the Combined Agenda 2063 scenario by 2040, below Somalia, Burundi, Guinea and Sudan.
The IFs platform forecasts six types of energy, namely oil, gas, coal, hydropower, nuclear and other renewables. To allow comparisons between different types of energy, the data is converted into billion barrels of oil equivalent (BOE). The energy contained in a barrel of oil is approximately 5.8 million British thermal units (MBtus) or 1 700 kilowatt-hours (kWh) of energy.
About 84% of Uganda’s electricity comes from hydro power generation, but the main source of primary energy consumption is from biomass (i.e. firewood, charcoal and crop residues). The country has discovered a commercially viable petroleum reserve around Lake Albert in the Western Rift Valley, and efforts to explore the area are getting into high gear as Uganda prepares to join the league of oil producing countries. However, it brings with it potential environmental risks. Approximately 1.4 billion of Uganda’s 6.5 billion barrels of proven oil reserves are estimated to be economically recoverable. Developing the oil sector will require several billions of dollars of infrastructure investment to build and support a refinery, two central processing facilities, and the 1 400 km EACOP to the port of Tanga in Tanzania, which is the world’s longest heated pipeline. Nevertheless, it is facing stiff resistance from environmental groups.
In 2019, oil and gas constituted 48.5% and 45.3% of energy production in Uganda, equivalent to 26 million and 24 million BOE, respectively. Hydro and other renewable sources of energy represent 4.6% and 1.6%, respectively, equivalent to 2 million and 1 million BOE. On the Current Path, it is projected that by 2040, oil production will increase to 110 million BOE, representing 68.6% of total production. Other renewable energies will constitute about 15% of total energy production, which will correspond to 24 million BOE. This will be complemented by a projected 13 million BOE of hydropower and gas produced in the same year, representing 8% of energy production each.
In 2005, Uganda released about 1 million tons of carbon, and by 2019 this had increased to 3 million, reflecting the low levels of emissions in the country. Even at this low rate in 2019, Uganda was the third largest emitter of carbon among low-income African countries. The agriculture sector is the leading source of carbon emissions, contributing about 48% of total emissions. It is followed by the change in land use and forestry, contributing 38% of emissions. In the Current Path forecast, carbon emissions are projected to increase considerably to 20 million tons by 2040.
Compared to the Current Path forecast, the Manufacturing/Transfers scenario will make the greatest addition to carbon emissions, followed by the Governance and Stability, Free Trade, and Infrastructure and Leapfrogging scenarios, respectively, by 2040. The Demographics and Health and Education scenarios are projected to make the least additions to Current Path forecast value of carbon emissions by 2040.
The Combined Agenda 2063 scenario consists of the combination of all eight sectoral scenarios presented above, namely the Demographics and Health, Education, Infrastructure and Leapfrogging, Agriculture, Manufacturing/Transfers, Free Trade, External Financial Flows and Governance and Stability scenarios. In the Combined Agenda 2063 scenario, GDP is projected to rise to US$500 billion, representing a 1 034% increase over the 2019 GDP value of US$44.1 billion and a 43.4% increase over the Current Path forecast of 2040. Thus, the combined effect of all the scenarios is to increase GDP by US$151.1 billion by 2040. The effect of the Combined Agenda 2063 scenario further pushes carbon emissions to 26 million tons by 2040, representing a 30% increase above the Current Path forecast. The additional 6 million tons that come with the Combined Agenda 2063 scenario will mainly come from the Manufacturing/Transfers and Governance and Stability scenarios.
This report seeks to model Uganda’s future by examining the current development trajectory (Current Path) and developing sectoral scenarios for the 2040 forecast horizon. It shows that while Uganda faces many development challenges, it has made progress in key areas such as educational attainment, basic infrastructure and attracting foreign capital. However, progress is slow, and on its current trajectory, Uganda will not achieve its aspiration of graduating to middle-income status by 2040. Thus, more rigorous and targeted socio-economic policy interventions are needed to improve the country's current development path.
With the right set of policy interventions, Uganda can advance significantly in human and economic development. The implementation of the eight sectoral interventions can raise Uganda’s GDP per capita to US$6 925, although this will be below the Vision 2040 target of US$9 500. However, under the Combined Agenda 2063 scenario, Uganda will attain a GDP per capita of US$9 568 by 2045. This scenario also envisions a substantial reduction in the extreme poverty rate from 41.3% in 2019 to only 1.9% by 2040, lifting 11 million more people out of poverty compared to the Current Path forecast.
Demographic projections indicate a population increase to 78.3 million by 2040, with strategic investments in health and education potentially yielding a potential demographic dividend by 2052. However, youth unemployment, skills mismatches and urban infrastructure deficits require continued focus. Educational improvements have led to higher enrolment rates but tertiary transitions remain low. Enhancing education quality, especially in STEM fields, is essential to meet future labour market demands.
Infrastructure development is pivotal, with significant advancements in paved roads, electricity access, and broadband connectivity projected by 2040. In addition, rural access to electricity is critical. Agriculture, which contributes significantly to GDP and employment, faces modernisation challenges and climate change impacts. Increased crop yields and reduced food insecurity are expected by 2040, lessening import dependency.
Manufacturing is set to boost GDP and employment through investment and R&D, while trade openness is expected to rise with the AfCFTA, enhancing Uganda’s trade balance and resilience. Governance improvements are crucial for sustained growth, with expected enhancements in security, capacity and inclusion by 2040. These changes will foster better economic growth and service provision, leading to a more stable and democratic society.
In conclusion, Uganda’s strategic focus on industrialisation, human capital, infrastructure and governance reforms provides a robust foundation for achieving Vision 2040’s goals. However, achieving these targets will require concerted and sustained efforts to address existing challenges and capitalise on emerging opportunities. With comprehensive and well-implemented policies, Uganda can make significant strides towards becoming a prosperous, middle-income country while mitigating environmental impacts through a full transition to renewable energies.
Key Recommendations for Policymakers in Uganda:
- Improve the quality of education, particularly in STEM fields, and increase transitions from secondary to tertiary education. Expand access to education in rural areas and address the skills mismatch to better align with labour market demands.
- Focus on expanding and improving transportation networks, electricity access and broadband connectivity, particularly in rural areas. Prioritise projects that enhance productivity and quality of life.
- Develop comprehensive urban planning strategies to manage the rapid urbanisation process. Invest in urban infrastructure to support sustainable growth and reduce the strain on existing resources.
- Support smallholder farmers through education, extension services and improved access to inputs. Implement climate-resilient agricultural practices to increase crop yields and reduce food insecurity.
- Invest in research and development, enhance support for SMEs and improve trade-industry linkages. Focus on reducing business costs and improving infrastructure to make manufacturing more competitive.
- Continue to improve governance through reforms that enhance security, institutional capacity and inclusiveness. Promote transparency and reduce corruption to build a stable and democratic society.
- Fully implement the AfCFTA to increase trade openness and improve Uganda’s trade balance. Focus on enhancing agricultural productivity and diversifying exports to reduce dependency on imports.
- Invest in healthcare infrastructure and services to reduce maternal and child mortality, combat non-communicable diseases and improve overall life expectancy. Ensure access to clean water and sanitation to prevent communicable diseases.
- Invest in renewable energy sources to reduce dependency on fossil fuels. Implement policies that encourage the adoption of modern cooking technologies and increase rural access to clean energy solutions.
- Develop and execute targeted policies that address youth unemployment, support human capital development and foster private sector growth. Ensure that these policies are inclusive and equitable to reduce poverty and inequality.
By focusing on these strategic areas, policymakers in Uganda can create a robust foundation for sustainable economic growth, improve living standards and move closer to achieving the Vision 2040 goals.
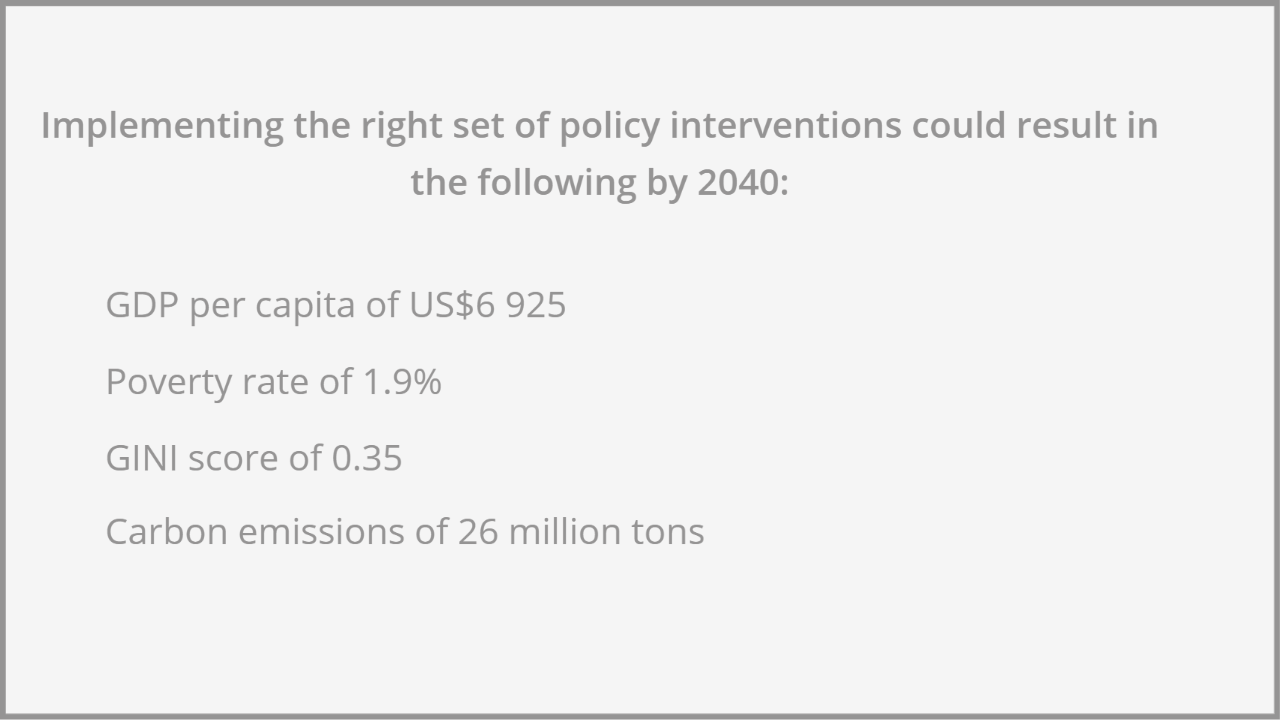
Endnotes
ibid
D Acemoglu and S Johnson, Disease and Development: The Effect of Life Expectancy on Economic Growth, Journal of Political Economy, 115:6, 2007, 925–985.
ibid
The IFs model distinguishes between three types of cooking stoves: traditional, improved and modern stoves.
Fixed broadband includes cable modem Internet connections, DSL Internet connections of at least 256 KB/s, fibre and other fixed broadband technology connections (such as satellite broadband Internet, ethernet local area networks, fixed-wireless access, wireless local area networks, WiMAX, etc.). Mobile broadband on the other hand refers to wireless Internet access delivered through cellular towers to computers and other digital devices.
D Chapman, L Burton and J Werner, Universal Secondary Education in Uganda: The Head Teachers’ Dilemma, International Journal of Educational Development, 30:1, 2010, 77–82.
In May 2022, the World Bank announced that it would be using US$2.15 in 2017 prices as the new international poverty line (to measure progress towards the SDGs) instead of US$1.90. Instead of the previous US$3.20 for low-middle-income countries, the adjusted poverty line is now $3.65, and $6.85 for upper-middle-income countries (instead of $5.50 in 2011 prices). The World Bank has not yet announced the new poverty line for high-income countries, previously set at $22.70 in 2011 prices. The World Bank intends to release the associated poverty estimates in 2023. In the meanwhile, this site continues to use the US$1.90, US$3.20, US$5.50 and US$22.70 poverty lines.
Page information
Contact at AFI team is Mustapha Jobarteh
This entry was last updated on 15 June 2026 using IFs v7.63.
Donors and sponsors


Reuse our work
- All visualizations, data, and text produced by African Futures are completely open access under the Creative Commons BY license. You have the permission to use, distribute, and reproduce these in any medium, provided the source and authors are credited.
- The data produced by third parties and made available by African Futures is subject to the license terms from the original third-party authors. We will always indicate the original source of the data in our documentation, so you should always check the license of any such third-party data before use and redistribution.
- All of our charts can be embedded in any site.
Cite this research
Mustapha Jobarteh (2026) Uganda Development Futures. Published online at futures.issafrica.org. Retrieved from https://futures.issafrica.org/geographic/countries/uganda/ [Online Resource] Updated 15 June 2026.