 Togo
Togo
Feedback welcome
Our aim is to use the best data to inform our analysis. See our Technical page for information on the IFs forecasting platform. We appreciate your help and references for improvements via our feedback form.
Please note: This country report was developed using African Futures’ previous analytical framework, which organised the assessment across 11 sectoral scenarios. We have since updated and streamlined the analytical architecture to 8 sectoral scenarios. While the two frameworks remain broadly aligned, the current structure improves consistency, comparability and integration across themes and geographic studies. This page will therefore be updated to the current framework in due course. Read more about our analytical framework on the Technical Page.
In this entry, we first describe the Current Path forecast for Togo as it is expected to unfold to 2043, the end of the third ten-year implementation plan of the African Union’s Agenda 2063 long-term vision for Africa. The Current Path in the International Futures (IFs) forecasting model initialises from country-level data that is drawn from a range of data providers. We prioritise data from national sources.
The Current Path forecast is divided into summaries on demographics, economics, poverty, health/WaSH and climate change/energy. A second section then presents a single positive scenario for potential improvements in stability, demographics, health/WaSH, agriculture, education, manufacturing/transfers, leapfrogging, free trade, financial flows, infrastructure, governance and the impact of various scenarios on carbon emissions. With the individual impact of these sectors and dimensions having been considered, a final section presents the impact of the Combined Agenda 2063 scenario.
We generally review the impact of each scenario and the Combined Agenda 2063 scenario on gross domestic product (GDP) per person and extreme poverty except for Health/WaSH that uses life expectancy and infant mortality.
The information is presented graphically and supported by brief interpretive text.
All US$ numbers are in 2017 values.
Executive Summary
- Current Path forecast
- Togo is a low-income country in Africa with a population of 8.5 million people. It is a coastal nation and home to the only deep-water port in West Africa. Life expectancy in Togo is 63.6 years, with a high disease burden from both communicable and non-communicable diseases. As Togo is currently one of the poorest countries in the world, GDP per capita in 2019 stood at US$1 733, and almost half of the population (4 million people) live below the benchmark poverty line of US$1.90 for low-income countries. Jump to forecast: Current Path
- The population is set to increase from an estimated 8.1 million people in 2019 to 13.8 million people in 2043. The country will witness growth in urbanisation, such that by 2043, 53% of the population will reside in urban areas while 47% will live in rural areas. Jump to Demographics: Current Path
- By 2043, Togo will experience significant growth in GDP, reaching US$25.8 billion, and experience an increase in GDP per capita to US$3 524. Its level of informality will be reduced, with a decrease in the size of the informal sector’s contribution to GDP from 28.6% to 23.9% in 2043. The country will continue to rely heavily on the service sector for job creation, with an increase in its contribution to GDP to US$12.7 billion (49.3% of GDP). Jump to Economy: Current Path
- The country will continue to struggle with a poverty rate of 4.6 million people (33.1% of the population) living below the poverty line of US$1.90 in 2043. Jump to Poverty: Current Path
- Togo will see a change in the dominant energy types produced in 2043, such that solar energy will constitute 80% of energy, and increase its carbon emissions to 3 million tons in 2043 from 1 million tons in 2019. Jump to Carbon emissions/Energy: Current Path
- Sectoral Scenarios
- The Stability scenario will improve Togo’s score on the government security index to 0.96 in 2043 and simultaneously increase the GDP per capita to US$3 830, reducing the proportion of people living below the poverty line to 30% of the population. Jump to Stability scenario
- In the Demographic scenario, Togo can reach the demographic dividend by 2039, three years earlier than the average low-income country in Africa. Jump to Demographic scenario
- The Health/WaSH scenario will increase life expectancy to 71 years by 2043 and reduce infant mortality per 1000 live births to 18. Jump to Health/WaSH scenario
- In the Agriculture scenario, Togo can grow from being food import-dependent to becoming a net exporter of agricultural products with a balance of 12.7% of total agricultural demand by 2043. Jump to Agriculture scenario
- The Education scenario will result in a higher GDP per capita of US$3 610 by 2043, although the number of poor people in Togo will decline only marginally. Jump to Education scenario
- In the Manufacturing/Transfers scenario, government welfare transfer to unskilled workers will increase to US$0.74 billion in 2043. Jump to Manufacturing/Transfers scenario
- The Leapfrogging scenario will increase mobile broadband subscriptions per 100 people from 34.7 in 2019 to 152.8 in 2043 and also enable access to electricity to 80% of the population. Jump to Leapfrogging scenario
- In the Free Trade scenario, there will be an increase in GDP per capita to US$3 860 by 2043 and a reduction in the proportion of poor people in Togo to 27.3% of the population. Jump to Free Trade scenario
- The Financial Flows scenario will increase the contribution of FDI to Togo’s economy to 5.6% in 2043. Jump to Financial Flow scenario
- The Infrastructure scenario will increase the percentage of the rural population living within 2 km of all-weather roads to 64% by 2043. Jump to Infrastructure scenario
- The Governance scenario will increase GDP per capita to US$3 660 in 2043. Jump to Governance scenario
- While Togo’s carbon emissions are projected to increase in all the scenarios, the Agriculture scenario will have the greatest effect resulting in emissions of 3.8 million tons of carbon in 2043. Jump to Impact of scenarios on carbon emissions
- Combined Agenda 2063 scenario
- In the Combined Agenda scenario, Togo could see an increase in GDP per capita by US$2 450 in 2043 and aggressive growth of the economy to US$51 billion in 2043 compared to projections of US$25.8 billion in the Current Path forecast. Jump to Combined Agenda 2063 scenario
- The number of people living below the poverty line could be significantly reduced to 1.56 million people (12.1% of population). Jump to Combined Agenda 2063 scenario
- The increase in carbon emissions to 5 million tons by 2043 due to the Combined Agenda 2063 scenario is significant. Jump to Combined Agenda 2063 scenario
All charts for Togo Development Futures
-
Chart 1: Political map of Togo
Chart 1: Political map of Togo
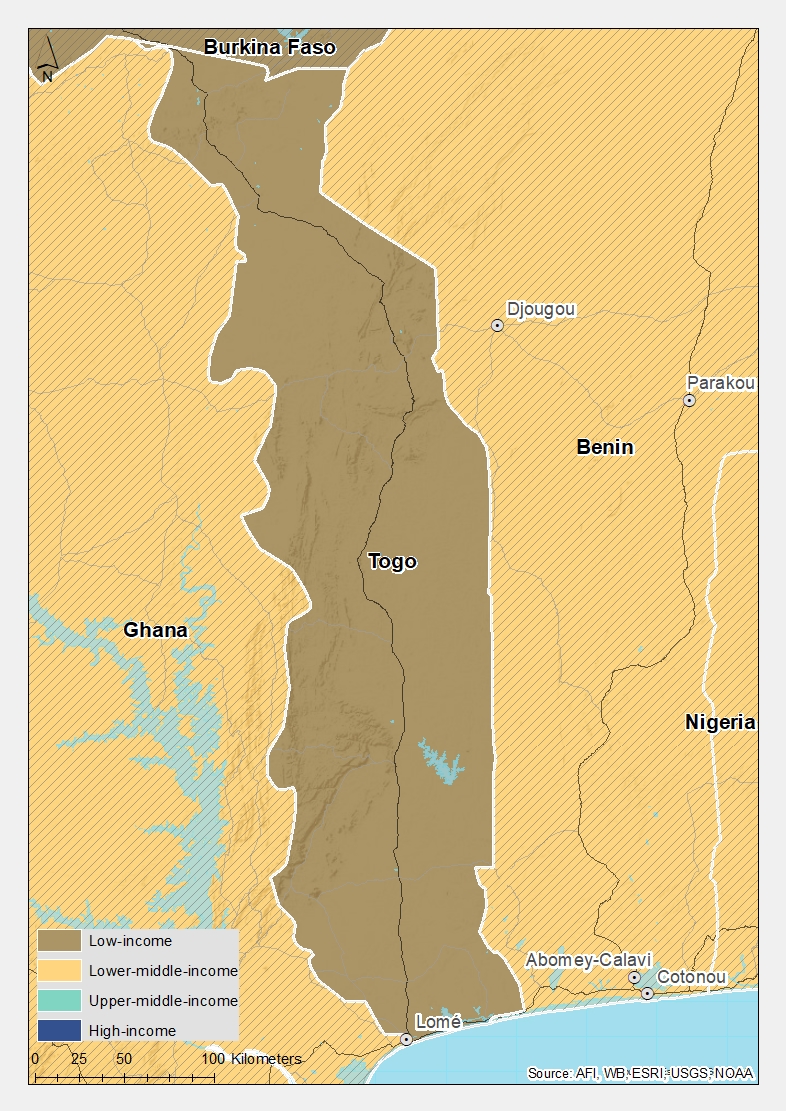 Source: ArcGIS online (www.arcgis.com)
 - Chart 2: Population structure in CP, 1990–2043
- Chart 3: Urban and rural population in CP, 1990–2043
-
Chart 4: Population density map for 2019
Chart 4: Population density map for 2019
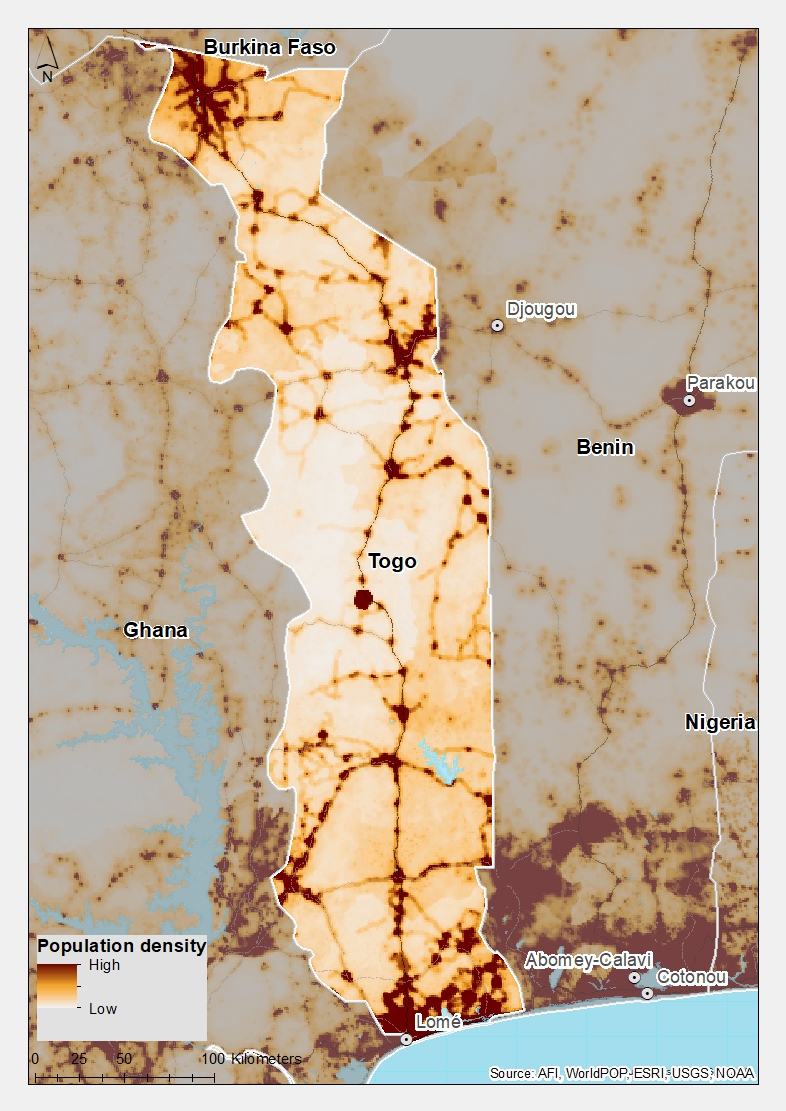 Source: ArcGIS online (www.arcgis.com), Worldpop (www.worldpop.org)
 - Chart 5: GDP in CP, 1990–2043
- Chart 6: GDP per capita in CP, 1990–2043
- Chart 7: Informal sector value in CP, 2015–2043
- Chart 8: Value added by sector in CP, 2015–2043
- Chart 9: Agriculture production/demand in CP, 1990–2043
- Chart 10: Poverty in CP, 2015–2043
- Chart 11: Energy production by type in CP, 1990–2043
- Chart 12: Carbon emissions in CP, 1990–2043
- Chart 13: Governance security in CP and Stability scenario, 2019–2043
- Chart 14: GDP per capita in CP and Stability scenario, 2019–2043
- Chart 15: Poverty in CP and Stability scenario, 2019–2043
- Chart 16: Demographic dividend in CP and Demog scenario, 2019–2043
- Chart 17: Infant mortality in CP and Demog scenario, 2019–2043
- Chart 18: GDP per capita in CP and Demog scenario, 2019–2043
- Chart 19: Poverty in CP and Demog scenario, 2019–2043
- Chart 20: Life expectancy in CP and Health/WaSH scenario, 2019–2043
- Chart 21: Infant mortality in CP and Health/WaSH scenario, 2019–2043
- Chart 22: Yield/hectare in CP and Agric scenario, 2019–2043
- Chart 23: Agriculture imports in CP and Agric scenario, 2019–2043
- Chart 24: GDP per capita in the CP and Agric scenario, 2019–2043
- Chart 25: Poverty in CP and Agric scenario, 2019–2043
- Chart 26: Mean years of education in CP and Educ scenario, 2019–2043
- Chart 27: Education quality in CP and Educ scenario, 2019–2043
- Chart 28: GDP per capita in CP and Educ scenario, 2019–2043
- Chart 29: Poverty in CP and Educ scenario, 2019–2043
- Chart 30: Value added by sector in CP and Manufac/Transfers scenario, 2019–2043
- Chart 31: Gov welfare transfers in CP and Manufac/Transfers scenario, 2019–2043
- Chart 32: GDP per capita in CP and Manufac/Transfers scenario, 2019–2043
- Chart 33: Poverty in CP and Manufac/Transfers scenario, 2019–2043
- Chart 34: Fixed broadband access in CP and Leapfrogging scenario, 2019–2043
- Chart 35: Mobile broadband access in CP and Leapfrogging scenario, 2019–2043
- Chart 36: Electricity access in CP and Leapfrogging scenario, 2019–2043
- Chart 37: GDP per capita in CP and Leapfrogging scenario, 2019–2043
- Chart 38: Poverty in CP and Leapfrogging scenario, 2019–2043
- Chart 39: Trade balance in CP and Free Trade scenario, 2019–2043
- Chart 40: GDP per capita in CP and Free Trade scenario, 2019–2043
- Chart 41: Poverty in CP and Free Trade scenario, 2019–2043
- Chart 42: Foreign aid in CP and Financial Flows scenario, 2019–2043
- Chart 43: Inflow of FDI in CP and Financial Flows scenario, 2019–2043
- Chart 44: Remittances in CP and Financial Flows scenario, 2019–2043
- Chart 45: GDP per capita in CP and Financial Flows scenario, 2019–2043
- Chart 46: Poverty in CP and Financial Flows scenario, 2019–2043
- Chart 47: Electricity access in CP and Infrastructure scenario, 2019–2043
- Chart 48: Rural road access in CP and Infrastructure scenario, 2019–2043
- Chart 49: GDP per capita in CP and Infrastructure scenario, 2019–2043
- Chart 50: Poverty in CP and Infrastructure scenario, 2019–2043
- Chart 51: Gov effectiveness in CP and Governance scenario, 2019–2043
- Chart 52: GDP per capita in CP and Governance scenario, 2019–2043
- Chart 53: Poverty in CP and Governance scenario, 2019–2043
- Chart 54: Carbon emissions in CP and scenarios, 2019–2043
- Chart 55: GDP per capita in CP and scenarios, 2019–2043
- Chart 56: GDP per capita in CP and Combined scenario, 2019–2043
- Chart 57: Poverty in CP and Combined scenario, 2019–2043
- Chart 58: Value added by sector in CP and Combined scenario, 2019–2043
- Chart 59: GDP in CP and Combined scenario, 2019–2043
- Chart 60: Carbon emissions in CP and Combined scenario, 2019–2043


This page provides an overview of the key characteristics of Togo along its likely (or Current Path) development trajectory. The Current Path forecast from the International Futures forecasting (IFs) platform is a dynamic scenario that imitates the continuation of current policies and environmental conditions. The Current Path is therefore in congruence with historical patterns and produces a series of dynamic forecasts endogenised in relationships across crucial global systems. We use 2019 as a standard reference year and the forecasts generally extend to 2043 to coincide with the end of the third ten-year implementation plan of the African Union’s Agenda 2063 long-term development vision.
Chart 1 shows the political map of Togo, one of 23 low-income countries in Africa. Togo is located in West Africa along the Gulf of Guinea. It is bordered by Ghana to the west, Benin to the east and Burkina Faso to the north, and it is a member of the Economic Community of West African States (ECOWAS). As one of the smallest countries in Africa, Togo has a total area of 57 000 km² and is only about 115 km wide. The climate is generally that of a tropical savanna, like in the neighbouring countries, with two seasons of rain within a year. In the south, the geography of Togo is characterised by savanna and woodland, yielding to the coast approaching the Gulf of Guinea with accompanying sandy beaches and lagoons. The northernmost part of the country is also savanna, while the central section features hillier ground. Administratively, Togo is divided into five regions that are subdivided in turn into 30 prefectures. From north to south, the regions are Savanes, Kara, Centrale, Plateaux and Maritime. The capital and largest city of the country is Lomé, located in the Maritime region of southern Togo. The most populated region by far is the Maritime region, followed by the Plateaux, Savanes, Kara, and then Centrale regions respectively. The current estimate of the total population of Togo is around 8.5 million people. Togo is a leading producer of phosphates, and phosphate mining accounts for up to 8% of the country's GDP. The nation also boasts some agricultural produce, with national exports of cotton, coffee, cocoa and groundnuts. The autonomous Port of Lomé is the only deep-water port in West Africa, serving the landlocked countries of Burkina Faso, Niger and Mali.
Togo is the tenth most populous country in West Africa and the 33rd most populous in Africa, with an estimated population of 8.1 million in 2019, up from 3.8 million in 1990. This represents an increase of 113% in the country’s population over the past 29 years. In the Current Path forecast, the population of Togo is projected to increase to 13.8 million by 2043, representing an approximate increase of 70.4% within the 23-year period. The relatively slower increase in the population growth rate can be attributed to the adoption of improved birth control options such as the use of contraceptives. Togo has a large youthful population with a youth bulge of 46.3% and a median age of 19.2 years in 2019. The youth bulge, defined as the ratio of the population between the ages of 15 and 29 to the total adult population, will remain above 40% in the Current Path forecast horizon. While this large youth bulge can usher in youth activism and positive political changes in a country, it can also increase the likelihood of conflicts and instability, mainly when the needs of the youth, such as employment, cannot be met.
In addition, 40.8% of the population is below the age of 15 years and 27.4% under the age of 30 years. The relatively large cohort of children under the age of 15 constrains the materialisation of the demographic dividend. With the expected decline in the fertility rate from 4.3 births per woman in 2019 to 2.9 births in 2043, it is projected that the proportion of people below the age of 15 years will fall to 32.8% over the next 24 years. This signals the likelihood of a more adult population, increasing the share of people under the age of 64 years from 28.8% in 2019 to 35.1% in 2043. The average life expectancy in Togo was 63.6 years in 2019 but is estimated to increase to 70.6 years in 2043. The relatively low life expectancy is mainly due to a high disease burden emanating from both communicable and non-communicable diseases. With an expected decline in communicable diseases over the period, life expectancy is also projected to increase within the same period.
In 1990, the majority of the Togolese population resided in rural areas. However, over the past 29 years, the proportion of people that reside in rural areas has steadily declined by 13.4 percentage points from 71.4% in 1990 to 58% in 2019, suggesting an increase in the urban population. Between 2036 and 2037, the country is expected to achieve parity in urban–rural settlement such that by 2043, about 53% of the Togolese population is projected to live in the urban areas. Rural–urban migration from other areas mainly to the national capital Lomé in search of greener pastures significantly accounts for the high rate of urbanisation in Togo. The country has a relatively high rate of urbanisation compared to other low-income countries in Africa. Considering the associated problems of a high urbanisation rate, in 2017 the country signed a memorandum of understanding with UN-Habitat to promote sustainable and green urbanisation in order to enhance the quality of life of citizens.
Chart 4 illustrates a map of the population distribution in Togo. Togo is the 11th most densely populated country in Africa with a population density of 152 people per square kilometre. The majority of the Togolese population lives along the coast, along which the capital and the largest city, Lomé, is also located. The majority of Togolese live in rural areas that are scattered along the coastal region. This is mainly due to the presence of the port and the economic activity that takes place along the coast, such as the export of commodities such as cocoa, coffee, cotton, phosphates and palm oil. Other densely populated areas in the country include Tsévié and Tabligbo in the lowland plateau; Kpalimé, Atakpamé, Sokodé, Bassar (Bassari) and Kara (Lama-Kara) at the base of the Togo Mountains; and Sansanné-Mango (Mango) and Dapaong in the far north. By 2043, the rural population is projected to increase by an additional 1.8 million people based on the Current Path forecast.
Between 1990 and 2019, the GDP of Togo increased by nearly US$4 billion from US$2.6 billion in 1990 to US$6.5 billion in 2019, representing an increase of 154% over the 29-year period. The country has had unstable growth in the past mainly due to political and social crises that led to severe restrictions in development cooperation such as the suspension of aid by donor agencies and countries since 1992. This led to low government revenue and reduced public investment within that period. GDP growth picked up from 2008 following the ratification and implementation of poverty reduction and growth facility and other internationally assisted programmes that led to debt relief. These produced results leading to a consistent GDP growth of above 5% from 2009 until 2020 before the COVID-19 pandemic began to negatively impact the economy. Over the next 22 years, Togo’s GDP is estimated to almost quadruple to US$25.8 billion from the current figure. The increase in GDP reflects the higher economic growth expected to occur within the next 22 years as compared to previous years.
Although many of the charts in the sectoral scenarios also include GDP per capita, this overview is an essential point of departure for interpreting the general economic outlook of Togo.
The GDP per capita over time has seen a steady increase despite the country’s rapid population growth. The country increased its GDP per capita by 22.5% from US$1 415 in 1990 to US$1 733 in 2019. The marginal increase in GDP per capita reflects the relatively high GDP growth as compared to population over the period. With an expected increase in GDP and decline in fertility rates, it is projected that GDP per capita will rise, such that by 2043, the GDP per capita will more than double to US$3 524. Although Togo’s GDP per capita in 1990 was relatively higher than the average for low-income countries in Africa, the trend had reversed by 2006 so that by 2019, Togo’s GDP per capita was US$87 lower than the average for low-income countries in Africa. This gap is expected to widen to US$266 by 2043, suggesting that Togo either has a higher population growth rate or slower economic growth compared to the average low-income country in Africa.
The size of the informal sector in Togo was equivalent to 28.6% of GDP in 2019. This is expected to decline to 23.9% by 2043, constituting a 4.7 percentage-point decrease over the 22-year period. In 2019, the total number of people employed by the informal economy constituted 55.1% of the total labour force, though this is expected to decline to 41.5% in 2043. It is therefore not surprising that the level of informality will also decline within the same period. The informal sector in Togo accounts for about 90% of all jobs in the private sector and is mainly driven by the country’s trade sector. This is partly due to the high taxes and social charges associated with operating within the formal sector. Throughout the period under consideration, the size of the informal sector in Togo is lower than the average for low-income African countries. This suggests that Togo has performed relatively better in formalising its economy compared to other African countries within its income group. Some of the efforts aimed at formalising the economy over the years have included launching digital campaigns to identify and formalise key players of the informal sector, improving the process of starting a business and access to public procurement, as well as adopting tax reform measures and inclusive finance.
The IFs platform uses data from the Global Trade and Analysis Project (GTAP) to classify economic activity into six sectors: agriculture, energy, materials (including mining), manufacturers, services and information and communications technology (ICT). Most other sources use a threefold distinction between only agriculture, industry and services with the result that data may differ.
The three largest contributors to GDP in Togo are services, agriculture and manufacturing respectively. In 2019, the service sector’s contribution to GDP was about US$2.7 billion, representing 41.1% of GDP. This is not surprising given that the service sector employs about half of the total labour force in the country. This is expected to increase to US$12.7 billion by 2043, representing 49.3% of GDP. The agricultural sector, which employs about 33% of the total labour force, is currently the second largest contributor to GDP with a share of 30%, constituting about US$2 billion in 2019. Manufacturing is the third most significant contributor to GDP with a share of 18.5%. However, it is expected that by 2030, the manufacturing sector will overtake the agricultural sector as the second largest contributor to GDP so that by 2043 the manufacturing sector will contribute 13.7 percentage points more to GDP than agriculture. While this development is consistent with the structural transformation of an economy, the slow pace of growth of the manufacturing sector, which is key to broader economic transformation and to creating decent and sustainable jobs, suggests that the country may still rely quite heavily on the service sector for job creation in coming years.
The data on agricultural production and demand in the IFs forecasting platform initialises from data provided on food balances by the Food and Agriculture Organization (FAO). IFs contains data on numerous types of agriculture but aggregates its forecast into crops, meat and fish, presented in million metric tons. Chart 9 shows agricultural production and demand as a total of all three categories.
The average crop yield for 2019 was 1.6 metric tons per hectare. In 1990, Togo’s demand for agricultural products outstripped domestic production by 0.22 million metric tons; this increased to 0.6 million metric tons in 2019 and can partly be attributed to the declining interest in the agricultural sector reflected in the share of total employment. Between 1990 and 2019, the sector’s share of total employment reduced significantly from 50.4% to 32.4%. The yield per hectare for crops is expected to increase from 1.6 metric tons per hectare in 2019 to 2 metric tons per hectare in 2043, and the gap between demand and production will widen. By 2043, demand will outstrip domestic production by about 3.5 million metric tons, representing a 475% increase over the period. This raises concerns about food security in the country within the next 22 years.
There are numerous methodologies and approaches to defining poverty. We measure income poverty and use GDP per capita as a proxy. In 2015, the World Bank adopted the measure of US$1.90 per person per day (in 2011 international prices), also used to measure progress towards the achievement of Sustainable Development Goal 1 of eradicating extreme poverty. To account for extreme poverty in richer countries occurring at slightly higher levels of income than in poor countries, the World Bank introduced three additional poverty lines in 2017:
- US$3.20 for lower middle-income countries
- US$5.50 for upper middle-income countries
- US$22.70 for high-income countries.
As a low-income country, Togo uses the US$1.90 per person per day benchmark. The country is one of the poorest in Africa and in the world. As of 2019, there were still over four million people (constituting nearly half of the Togolese population) living on less than US$1.90 per day. This is expected to increase to 4.8 million people (constituting 56.3%) in 2021, probably due the COVID-19 pandemic and its associated economic crisis, before declining marginally to 4.7 million people (50.9%) in 2024. Thereafter, it continues an upward trend until 2030 where it will peak with five million people living on less than US$1.90 per day. By 2043, there will still be 4.6 million people (33.1% of the population) living on less than US$1.90 per day. This means that although the proportion of the extremely poor population will reduce by 16.5 percentage points, the absolute number of poor people in the country will be 0.6 million people more than its level in 2019 due to the population growth rate that is outpacing development progress. Throughout the period under consideration, the proportion of poor people in Togo is higher than the average for low-income countries in Africa such that by 2043, the extreme poverty rate in Togo is 9.0 percentage points above the projected average for low-income countries in Africa. Poverty in Togo is predominantly a rural phenomenon due to concentrated economic growth in the modern sectors and limited access to quality services.
The IFs platform forecasts six types of energy, namely oil, gas, coal, hydro, nuclear and other renewables. To allow comparisons between different types of energy, the data is converted into billion barrels of oil equivalent (BBOE). The energy contained in a barrel of oil is approximately 5.8 million British thermal units (MBTUs) or 1 700 kilowatt-hours (kWh) of energy.
Between 1990 and 2020, hydro was the sole energy produced by the country, with a total production of 0.1 million BOE in 2019. Although the country produces some of its electricity needs, it also imports the majority of its electricity consumption from Nigeria and Ghana. However, from 2021 it was expected that the country would begin production of other renewables such as solar and wind energies, so that it would constitute half of total energy production. The country has begun discussion on promoting the use of renewable energy: from 2034, solar energy is projected to be the dominant energy type with an estimated quantity of 0.2 million BOE representing 66.7% in 2034, and 0.4 million BOE constituting 80% by 2043.
Carbon is released in many ways, but the three most important contributors to greenhouse gases are carbon dioxide (CO2), carbon monoxide (CO) and methane (CH4). Since each has a different molecular weight, IFs uses carbon. Many other sites and calculations use CO2 equivalent.
Togo is one of the countries in Africa with significantly low levels of carbon emissions which can partly be attributed to the low industrial activity and reliance on solar as the only energy produced in the country. Regardless, carbon emissions increased steadily from nearly zero carbon in 1990 to 1 million tons of carbon in 2019. On the Current Path, carbon emissions are forecast to increase to 3 million tons by 2043. It is interesting to note that while the country is shifting to renewable energy such as solar, carbon emissions will continue to increase. This may be as a result of the projected increase in industrial activity in coming years.
Sectoral Scenarios for Togo Development Futures
Download to pdfThe Stability scenario represents reasonable but ambitious reductions in risk of regime instability and lower levels of internal conflict. Stability is generally a prerequisite for other aspects of development and this would encourage inflows of foreign direct investment (FDI) and improve business confidence. Better governance through the accountability that follows substantive democracy is modelled separately.
The intervention is explained here in the thematic part of the website.
The Stability scenario generally signifies increased political stability, reduced internal conflict, high FDI inflows, improved accountable governance and low levels of corruption in the country. In 2019, Togo’s score on the governance security index was 0.69 out of 1.0. The return of constitutional rule in 1992 and subsequent multiparty elections in 2005 showed remarkable progress in democracy despite accusations of fraud amidst civil protest. The imposition of a term limit also created political stability in the country; however, the constitutional amendment in 2019 that extended the term limit has eroded this gain. Compared to the average for low-income countries in Africa, Togo has a high level on the governance security index. In fact, the gap is expected to minimise in the long run so that by 2043, Togo’s score will be 0.11 more than the average for low-income countries in Africa. Using the Stability scenario, the score of Togo on the government security index is projected to rise to 0.82 in 2043 which is 0.1 points above the Current Path forecast in the same year.
The GDP per capita for Togo in 2019 was US$1 764, which is US$104 less than the average for low-income countries in Africa. In the Stability scenario, the GDP per capita is projected to increase to US$3 830 by 2043. This will be US$306 more than the Current Path forecast and US$40 above the average for low-income countries in Africa. Regime stability and a peaceful environment inspire investors' confidence and attract FDI into the country with a positive effect on economic growth.
With Togo being a low-income country, it uses the global benchmark of US$1.90 per person per day. In 2019, the number of poor people living on less than US$1.90 was around 4 million, equivalent to about 50% of the population. The Stability scenario will reduce the portion of people living below the poverty line to 30% by 2043, which is 3.1 percentage points below the Current Path forecast but 4.9 percentage points above the average for low-income countries in Africa. Nonetheless, the number of poor people will rise marginally from 4 million people in 2019 to 4.1 million people in 2043 in the Stability scenario. This means that the materialisation of the Stability scenario could lead to 0.43 million fewer poor people than the Current Path in 2043.
This section presents the impact of a Demographic scenario that aims to hasten and increase the demographic dividend through reasonable but ambitious reductions in the communicable-disease burden for children under five, the maternal mortality ratio and increased access to modern contraception.
The intervention is explained here in the thematic part of the website.
Demographers typically differentiate between a first, second and even a third demographic dividend. We focus here on the contribution of the size of the labour force (between 15 and 64 years of age) relative to dependants (children and the elderly) as part of the first dividend. A window of opportunity opens when the ratio of the working-age population to dependants is equal to or surpasses 1.7.
In 2019, the ratio of the working-age population to dependants was 1.3, meaning that there were 1.3 working-age persons for each dependant in the country. This is greater than the average of 1.2 for lower middle-income countries in Africa. Generally, the demographic dividend materialises when the country reaches a minimum ratio of 1.7 working-age persons for each dependant. While the country will not reach its demographic dividend by 2043 in the Current Path forecast, in the Demographic scenario, Togo is expected to reach this minimum ratio by 2039. This is three years earlier than the average for low-income countries in Africa, and the situation continues to improve thereafter. The materialisation of the demographic dividend in the Demographic scenario can be explained by increased access to modern contraceptives which will lead to a decline in fertility rates. In the Demographic scenario, fertility rates are expected to decline to 2.2 births per woman in 2043 compared to 2.9 births per woman in the Current Path forecast within the same period. By 2043, the ratio of the working-age population to dependants for Togo will be 0.34 more than the average for low-income countries in Africa.
The infant mortality rate is the number of infant deaths per 1 000 live births and is an important marker of the overall quality of the health system in a country.
The infant mortality rate in Togo in 2019 was 42 deaths per 1 000 live births, meaning that for every 1 000 infants that were born, about 42 died. Although this figure is high, it is relatively lower than the average of 48.5 for low-income countries in Africa.. By 2043, the Demographic scenario will lead to a decline in infant mortality to 14.4 deaths per 1 000 live births, which is 4.2 lower than the Current Path forecast and 6.8 lower than the average for low-income countries in Africa.
In 2019, the GDP per capita for Togo was US$1 764, which is US$104 lower than the average for low-income African countries. By 2043, it is estimated that based on the Demographic scenario, the GDP per capita will increase to US$3 632, which is US$108 more than the projected US$3 524 on the Current Path in the same year. However, this will still be significantly below the US$3 790 average for low-income countries in Africa. The additional increase in GDP per capita as a result of the Demographic scenario can partly be attributed to the reduction in population growth as a result of the decline in fertility rates emanating from improved access to contraceptives. It can also be attributed to economic growth arising from the materialisation of the demographic dividend.
As noted earlier, the number of people in Togo living below the poverty line of US$1.90 in 2019 was 4 million. Based on the Demographic scenario, this number will steadily rise to 5 million in 2030 after which it begins to decline to 4.2 million in 2043, which will be 0.4 million less than in the Current Path forecast. Similarly, the proportion of the poor population can be reduced to 31.7% in the Demographic scenario, which is about 1.4 percentage points lower than the Current Path forecast but 6.5 percentage points higher than the average for low-income countries in Africa in 2043. The decline in both the number and the portion of poor people based on the Demographic scenario reflects the decline in population as a result of modern contraceptives use that reduce fertility rates. The reduction of the size of the cohort of children under the age of 15 allows households and the government to invest more in each child in terms of education and healthcare with positive implications for human capital formation and poverty reduction.
This section presents reasonable but ambitious improvements in the Health/WaSH scenario, which include reductions in the mortality rate associated with both communicable diseases (e.g. AIDS, diarrhoea, malaria and respiratory infections) and non-communicable diseases (NCDs) (e.g. diabetes), as well as improvements in access to safe water and better sanitation. The acronym WaSH stands for water, sanitation and hygiene.
The intervention is explained here in the thematic part of the website.
The increase in life expectancy can be sourced from reduction in mortality that is caused by communicable and non-communicable diseases. It can also be achieved through improved sanitation and access to safe water. The life expectancy at birth for the average Togolese was 63.4 years in 2019, which was slightly below the average of 63.8 for low-income countries in Africa. On average, females have a higher life expectancy at birth of 66.2 years than males at 62.3. Based on the Health/WaSH scenario, life expectancy is estimated to increase to about 71 years by 2043, which is an increase of six months above the Current Path forecast of 70.6 and the average of 70.9 for low-income African countries. This increased life expectancy in the country can be attributed to the expected improvement in access to safe water (nearly 100% of population) and sanitation, as well as a reduction in mortality from communicable diseases. However, death from non-communicable diseases continues to be a problem. Females will continue to have a higher life expectancy than males with a difference of over four years by 2043.
The Agriculture scenario represents reasonable but ambitious increases in yields per hectare (reflecting better management and seed and fertilizer technology), increased land under irrigation and reduced loss and waste. Where appropriate, it includes an increase in calorie consumption, reflecting the prioritisation of food self-sufficiency above food exports as a desirable policy objective.
The intervention is explained here in the thematic part of the website.
The data on yield per hectare (in metric tons) is for crops but does not distinguish between different categories of crops.
In 2019, the average yield per hectare for crops was 1.6 metric tons, which was below the average of 2.7 metric tons per hectare for low-income countries in Africa. Based on the Current Path forecast, this is projected to increase to 2 metric tons per hectare by 2043. In the Agriculture scenario, the average yield will be 3.7 metric tons per hectare. This means that if the country is able to adopt modern methods of farming including the application of fertiliser and usage of improved seeds, there will be a resulting increase of an extra 1.7 metric tons per hectare compared to the Current Path forecast in 2043. This will also be 0.22 metric tons more compared to the average for low-income countries in Africa.
In 2019, the net agricultural import was 15.2% of agricultural demand in the country, which was above the average for low-income countries in Africa. A structural problem common in most African economies is the dependence on imports. Togo is no exception to this phenomenon despite its youthful population. Three key barriers to agriculture improvement in Togo include the lack of provision of inputs such as seeds and fertilizers, underdeveloped agricultural goods market and the lack of adequate technological and transportation infrastructure. Consequently, the country has always had a net positive import dependence as a per cent of total demand. The Current Path forecast is that import dependence will grow to 34.5% of total demand. The situation is reversed in the Agriculture scenario such that by 2043, the country will be a net exporter of agricultural products with a balance of 12.7% of total agricultural demand. This balance will be higher than the average for low-income countries by about 45 percentage points, suggesting that there is a lot of potential that is yet to be tapped in terms of agriculture production. As part of an effort to increase yields, reduce food deficit and revitalise the agriculture sector, the country, assisted by the World Bank, implemented the Togo Agriculture Sector Support Project in 2017 which consisted of a US$9 million project. The purpose was to ensure increased agricultural output and investment. This translated into an increase in crop yields, among others. Therefore, if prudent agricultural policies that increase yield per hectare and reduce loss and waste are implemented, the country will be able to move from being food import-dependent to a net exporter of agricultural products from 2032.
The Agriculture scenario is expected to lead to an increase in GDP per capita over the years. By 2043, GDP per capita as a result of the Agriculture scenario will increase from US$1 764 in 2019 to US$3 903, constituting about 125% increase over the period. These estimates will be greater than the projections in the Current Path forecast so that by 2043 the additional gains from GDP per capita as a result of the Agriculture scenario will be US$379. In the Agriculture scenario, Togo’s GDP per capita will slightly be above the average for low-income countries in Africa.
Implementing good agricultural policies that will result in increased yield per hectare and reduction in waste appear to have a significant impact on poverty reduction in the country. Based on the Current Path forecast, 4.6 million people, representing 33.1% of the population, are projected to be extremely poor by 2043. However, based on the Agriculture scenario, the number of people below the poverty line of US$1.90 will be reduced to 3 million, constituting 21.8% of the population. This means that 1.6 million additional Togolese people can be lifted out of extreme poverty primarily by focusing on agricultural growth. This is not surprising since the majority of the poor population in Togo is employed within the agricultural sector. Throughout the period, in the Agriculture scenario, the proportion of people living in extreme poverty in Togo will be higher than the average for low-income countries in Africa although the gap closes. By 2043, the poverty rate in Togo in the Agriculture scenario will be 3.3 percentage points below the average for low-income countries in Africa.
The Education scenario represents reasonable but ambitious improved intake, transition and graduation rates from primary to tertiary levels and better quality of education. It also models substantive progress towards gender parity at all levels, additional vocational training at secondary school level and increases in the share of science and engineering graduates.
The intervention is explained here in the thematic part of the website.
Some of the challenges facing the educational sector in Togo include inequitable access to education particularly for girls as well as child marriage and labour. In 2019, Togo’s mean years of education was 7.0 which is far above the average of 4.4 for low-income countries on the continent. In terms of gender, the mean years of education for males is 8.2, which is 2.4 years more than females’ average of 5.8. This means that on average men are more likely to attain higher education than women. This gap in favour of men for mean years of education in Togo is higher than the average of 1.3 years for low-income countries in Africa. By 2043, in the Education scenario, it is expected that the mean years of education will rise to 8.6 years, which will be 0.3 years more than the Current Path estimates and 2.5 years more than the average for low-income countries in Africa. Also, based on the Education scenario forecast, the gender gap regarding mean years of education will close by 1 year by 2043 while the gender gap closes by 0.5 years for the average low-income countries in Africa within the same period.
Chart 27 displays the average test scores for primary and secondary learners in the Current Path forecast and the Education scenario. The average test score for primary learners in Togo for 2019 was 35.5%, which is higher than the 27.7% for the average for low-income countries in Africa, signifying relatively higher performance in this regard. The Education scenario will increase the average test scores for primary learners to 45.9%, compared to the Current Path forecast estimated at 39%. Also, the Education scenario for 2043 will result in 15.3 percentage points more than the continental average for low-income countries.
In 2019, the average secondary learner test score for Togo was 40.4% which is above the average of 35.8% for lower-income African countries. This suggests that Togo performs relatively better at the secondary level than at the primary level. However, the country’s performance for its primary learner score is better than the average for low-income African countries. By 2043, the average test score for secondary learners is projected to rise to 53.8%, which is above the Current Path estimates of 44.3% and the average of 37.8% for low-income countries in Africa.
By 2043, the increase in GDP per capita as a result of the Education scenario is estimated to be US$87 more than the projected US$3 524 in the Current Path forecast. This will still be US$179 less than the average of US$3 790 for low-income countries in Africa. Investing in education is a powerful way to improve productivity, growth and the income prospects of poor people. However, it takes time to yield results as it would take more than a decade for a child enrolled today in primary school to make meaningful contributions to the economy.
By 2043, in the Education scenario, it is projected that the number of poor people will be 4.3 million, representing 31.7% of the population. This means that the Education scenario will contribute to reducing the number of poor people by 203 000 people in 2043 compared to the Current Path forecast. This suggests that whereas education is a powerful tool to reduce poverty, it however takes time, often decades, to produce the expected results. Also, the proportion of poor people based on the Education scenario in Togo will be 6.5 percentage points higher than the average for low-income countries in Africa.
The Manufacturing/Transfers scenario represents reasonable but ambitious manufacturing growth through greater investment in the economy, investments in research and development, and promotion of the export of manufactured goods. It is accompanied by an increase in welfare transfers (social grants) to moderate the initial increases in inequality that are typically associated with a manufacturing transition. To this end, the scenario improves tax administration and increases government revenues.
The intervention is explained here in the thematic part of the website.
Chart 30 should be read with Chart 8 that presents a stacked area graph on the contribution to GDP and size, in billion US$, of the Current Path economy for each of the sectors.
Based on the Manufacturing/Transfers scenario, the service sector will be the largest contributor to the GDP with an absolute contribution of US$1.3 billion more by 2043 compared to the Current Path. The rate of contribution to the GDP by the service sector will increase until it peaks at a 0.76 percentage-point difference and marginally declines to 0.58 percentage points in 2043. The manufacturing sector, which is the second largest contributor, is also projected to contribute an additional US$0.5 billion to the GDP by 2043 although its rate of contribution declines significantly from 0.54% in 2035 to -0.28% to GDP based on the Manufacturing/Transfers scenario. Although the third contributor to the GDP in Togo is materials with a contribution of US$0.18 billion, ICT will overtake it by 2042, such that by 2043 ICT contributes US$0.06 billion more than materials to GDP based on the differences in the Manufacturing/Transfers scenario and Current Path forecast. It is significant to note that the rate of the contribution of ICT to the GDP based on the difference between the Manufacturing/Transfers scenario and the Current Path forecast improves from -1.06% in 2034 to 0.43% in 2043. While the decline in the share of agricultural contribution to the GDP can be attributed to structural transformation of the economy, its underperformance is a concern for food security in the country; likewise is the underperformance of the manufacturing sector which is supposed to create sustainable employment.
The Togolese government’s welfare transfer to unskilled workers is significantly low. In 2019, welfare transfer to unskilled workers was US$0.06 billion and is projected to increase to US$0.74 billion by 2043 in the Manufacturing/Transfers scenario, far more than the US$0.40 billion estimated for 2043 based on the Current Path forecast. This suggests that the Manufacturing/Transfers scenario can lead to an improvement in government welfare transfer by an additional US$0.34 billion compared to the Current Path forecast in 2043. However, the gap between Togo and its income group peers in terms of government welfare transfer is expected to widen in the Manufacturing/Transfers scenario.
By 2043, it is estimated that the GDP per capita will rise to US$3 741, which is US$217 more than projections in the Current Path forecast. The GDP per capita for Togo by 2043 in the Manufacturing/Transfers scenario will however still be below the average of US$3 790 for low-income countries in Africa.
Between 2024 and 2040, the Current Path forecast leads to a quicker reduction in the absolute number of poor people compared to the Manufacturing/Transfers scenario. However, after 2040, the Manufacturing/Transfers scenario overtakes the Current Path forecast such that by 2043 an estimated 170 000 people, constituting about 1.2% of the population, can be lifted above the poverty line of US$1.90 as a result of the Manufacturing/Transfers scenario. This means that if the country embarks on policies such as investment in the economy, research and development, as well as export promotion, the absolute number of poor people will likely be 170 000 fewer than on the Current Path in 2043. Nonetheless, the proportion of poor people in Togo based on the Manufacturing/Transfers scenario in 2043 will be about 6.8 percentage points above the average for low-income countries in Africa.
The Leapfrogging scenario represents a reasonable but ambitious adoption of and investment in renewable energy technologies, resulting in better access to electricity in urban and rural areas. The scenario includes accelerated access to mobile and fixed broadband and the adoption of modern technology that improves government efficiency and allows for the more rapid formalisation of the informal sector.
The intervention is explained here in the thematic part of the website.
Fixed broadband includes cable modem Internet connections, DSL Internet connections of at least 256 KB/s, fibre and other fixed broadband technology connections (such as satellite broadband Internet, ethernet local area networks, fixed-wireless access, wireless local area networks, WiMAX, etc.).
In 2019, the total number of fixed broadband subscriptions was 2.6 per 100 people, which was slightly above the average for low-income countries in Africa. In the Current Path forecast, fixed broadband subscriptions are expected to rise to 35.3 per 100 people. The Leapfrogging scenario will lead to a much greater increase in fixed broadband subscriptions compared to the Current Path forecast, with a difference of almost 15 subscriptions per 100 people by 2043. This means that the additional fixed broadband subscriptions as a result of the Leapfrogging scenario is 15 subscriptions per 100 people in 2043. Across the forecast horizon, the fixed broadband subscription in Togo is expected to be higher than the average for low-income African countries.
Mobile broadband refers to wireless Internet access delivered through cellular towers to computers and other digital devices.
Togo had mobile broadband subscriptions of 34.7 per 100 people in 2019, which was more than the average of 22.9 for low-income countries on the continent. Although between 2024 and 2028, mobile broadband subscriptions in the Leapfrogging scenario rise above the Current Path, in the long run, the Leapfrogging scenario and Current Path forecast converge. By 2043, mobile broadband subscriptions in the Current Path forecast and in the Leapfrogging scenario increase to 152.8 per 100 people, above the average of 133.9 for Africa low-income countries.
The number of Togolese people who had access to electricity in 2019 was 3.8 million people, representing 47.1% of the total population. This is above the average of 32.2% for low-income countries in Africa. The country has a large rural–urban disparity in terms of access to electricity. In 2019, about 84.1% of people in urban centres had access to electricity compared to the paltry 20.8% of those in the rural areas. Based on the Leapfrogging scenario, it is projected that by 2043, about 80% of Togolese people (about 11 million), will have access to electricity. This is above the projected average of 60.5% for low-income countries. It is also higher than the 71% (about 9.8 million) people projected in the Current Path forecast, signifying that the Leapfrogging scenario can provide access to electricity to an additional 1.2 million people. From 2037, all urban dwellers in Togo will have access to electricity in both the Current Path forecast and the Leapfrogging scenario. However, in the case of rural dwellers, 42.3% and 60.9% will not have access to electricity by 2043 based on the Leapfrogging scenario and the Current Path forecast respectively.
Togo’s GDP per capita is projected to increase from US$1 764 in 2019 to US$3 749 in 2043 based on the Leapfrogging scenario. This represents an increase of US$225 compared to the Current Path forecast in 2043. However, this still falls below the average of US$3 790 for low-income countries in Africa.
Based on the Leapfrogging scenario, the number of poor people in 2043 is projected to be 4.3 million, representing 31.2% of the population. This projection is lower than the 4.6 million estimated in the Current Path forecast in the same year, which suggests that the number of poor people in the Leapfrogging scenario is about 300 000 fewer than the Current Path forecast in 2043. The number of poor people projected in the Leapfrogging scenario is 6.1 percentage points higher than the average for low-income African countries.
The Free Trade scenario represents the impact of the full implementation of the African Continental Free Trade Area (AfCFTA) by 2034 through increases in exports, improved productivity and increased trade and economic freedom.
The intervention is explained here in the thematic part of the website.
The trade balance is the difference between the value of a country's exports and its imports. A country that imports more goods and services than it exports in terms of value has a trade deficit, while a country that exports more goods and services than it imports has a trade surplus.
Togo, like many African economies, is basically a net importer of goods and services. In 2019, Togo’s trade deficit represented 12.7% of the GDP. This large deficit is mainly due to the large import of oil and natural gas to respond to domestic energy demand as well as the demand for imported food to supplement local demand. Togo will begin to see an improvement in its trade balance in both the Current Path forecast and the Free Trade scenario, although the improvement is much quicker in the latter. This upward trend will continue until it reaches a peak of a deficit of about 5% of GDP in 2027 in the Free Trade scenario. However, these gains will begin to decline, so that by 2043, the projected trade deficit will be 11.3% of GDP in the Free Trade scenario in 2043 which is much higher than the projected 4.1% of GDP on the Current Path forecast. This suggests that the full implementation of the AfCFTA can improve the trade balance of Togo in the short-term. However, in the long term, intense competition from other African countries will reduce Togo’s exports while imports will increase as a result of free trade. Although Togo’s trade deficit as a percentage of GDP is lower than the average for low-income African countries, from 2040 the situation will reverse in the Free Trade scenario, so that by 2043 Togo’s trade deficit will be 4.4 percentage points of GDP higher than the average for low-income African countries.
The GDP per capita for Togo is estimated to increase to US$3 864 by 2043 in the Free Trade scenario, which is US$340 more than the projections in the Current Path forecast in 2043. This means that if Togo takes advantage of the AfCTA to increase trade and productivity, it can achieve an extra US$340 increase in the GDP per capita compared to the Current Path forecast in 2043. Also, this is slightly higher than the average GDP per capita of US$3 790 for low-income African countries.
The Current Path forecast leads to a much quicker reduction in poverty compared to the Free Trade scenario between 2026 and 2034. However, from 2035 the Free Trade scenario will lead to a greater reduction in the number of poor people compared to the Current Path forecast. By 2043, the number of people living below the poverty line of US$1.90 will be about 3.8 million, representing 27.3% of the population. This is 5.8 percentage points lower than the Current Path forecast, meaning that the Free Trade scenario has 800 000 fewer poor people than the Current Path by 2043. The proportion of the poor people projected in the Free Trade scenario is still higher than the average for low-income countries in Africa.
The Financial Flows scenario represents a reasonable but ambitious increase in worker remittances and aid flows to poor countries, and an increase in the stock of foreign direct investment (FDI) and additional portfolio investment inflows to middle-income countries. We also reduced outward financial flows to emulate a reduction in illicit financial outflows.
The intervention is explained here in the thematic part of the website.
Generally, the total foreign aid received by Togo has been quite low, mainly due to the political and social crises that lead to impositions of restrictions by donor agencies. Other sources of external financing have been through either bilateral and multilateral loans, debt financing or FDI. The total foreign aid received by Togo in 2019 was 6.2% of the GDP, which is below the average of 8.6% for low-income countries in Africa. Although foreign aid to Togo in absolute terms is projected to rise, as a percentage of the GDP it is expected to decline further such that by 2043, the total foreign aid received by the country is projected to be 3.2% of the GDP in the Financial Flows scenario and 2.9% of the GDP in the Current Path forecast. This suggests that in the Financial Flow scenario, foreign aid as a percentage of the GDP is lower than in the Current Path forecast in 2043. Further, these projections are still below the average for a low-income African country. The decline in foreign aid is expected given that projected growth and expansion is anticipated to occur in the future resulting in a higher GDP that automatically disqualifies the country from certain aid packages. It may also be that the GDP outgrows foreign aid in the country.
Togo’s total FDI in 2019 amounted to 5.1% of the GDP, which is slightly higher than the average of 4.3% for low-income African countries. The increase in FDI flows to the country can be explained by the exploration of reserves of limestone, marble and phosphate in the country. The financial service sector and building materials sector among others are the leading recipients of FDI projects in Togo. By 2043, it is projected that the total FDI to the country will be about 5.1% of GDP in the Current Path forecast. In the Financial Flows scenario, FDI is projected to be around 5.6% of GDP in 2043, which is also above the average for low-income countries on the continent.
In 2019, the total value of remittances that Togo received amounted to US$0.23 billion, which constituted about 3.5% of GDP. This is significantly lower than the average of 1.1% of GDP for low-income African countries. While the absolute value of remittances is projected to increase over the period, remittances as a percentage of the GDP will fall. In the Financial Flow scenario, remittance is projected to increase to US$0.45 billion, representing 1.7% of the GDP which will be higher than the average of 1.3% of the GDP for low-income African countries. Remittances will decline quicker in the Current Path forecast, so that by 2043, the total value of remittances in the country will be about US$0.29 billion, representing 1.1% of GDP.
Togo’s GDP per capita is estimated to increase to US$3 632 by 2043 in the Financial Flows scenario. This represents an increase of US$108 over the Current Path projection in the same year. The US$3 632 estimate is also below the average for low-income countries in Africa, which is projected to be US$3 790 by 2043.
Trade openness will reduce poverty in the long term after initially increasing it due to the redistributive effects of trade. Most African countries export primary commodities and low-tech manufacturing products, and therefore a continental free trade agreement (AfCFTA) that reduces tariffs and non-tariff barriers across Africa will increase competition among countries in primary commodities and low-tech manufacturing exports. Countries with inefficient, high-cost manufacturing sectors might be displaced as the AfCFTA is implemented, thereby pushing up poverty rates. In the long term, as the economy adjusts and produces and exports its comparatively advantaged (lower relative cost) goods and services, poverty rates will decline.
Based on the Financial Flows scenario, the total number of people projected to live below the poverty line of US$1.90 will decline to 4.4 million in 2043, representing 32% of the total population. This estimate constitutes a reduction of about 200 000 people compared to the Current Path in the same year. It is also higher than the average of 25.2% of the total population for low-income countries in Africa.
The Infrastructure scenario represents a reasonable but ambitious increase in infrastructure spending across Africa, focusing on basic infrastructure (roads, water, sanitation, electricity access and ICT) in low-income countries and increasing emphasis on advanced infrastructure (such as ports, airports, railway and electricity generation) in higher-income countries.
Note that health and sanitation infrastructure is included as part of the Health/WaSH scenario and that ICT infrastructure and more rapid uptake of renewables are part of the Leapfrogging scenario. The interventions there push directly on outcomes, whereas those modelled in this scenario increase infrastructure spending, indirectly boosting other forms of infrastructure, including that supporting health, sanitation and ICT.
The intervention is explained here in the thematic part of the website.
The total number of people with access to electricity in Togo is 3.8 million, representing 47.1% of the population. This is expected to increase to 11.6 million (84.4% of the population) in 2043 in the Infrastructure scenario. This increase exceeds the projected value of 9.8 million people (71% of the population) in the Current Path forecast. In terms of rural–urban dichotomy, by 2037, it is projected that all urban dwellers will have access to electricity in both the Current Path forecast and the Infrastructure scenario. However, only 67.3% and 39.1% of rural dwellers in the Infrastructure scenario and the Current Path forecast respectively will have access to electricity in 2043, indicating a disparity in access to electricity between urban and rural dwellers in both the Current Path forecast and the Infrastructure scenario.
Indicator 9.1.1 in the Sustainable Development Goals refers to the proportion of the rural population who live within 2 km of an all-season road and is captured in the Rural Access Index.
Accessibility to rural areas is important in spurring the socio-economic development of a country and improving the living standards of rural dwellers. It enables rural dwellers to enjoy amenities from nearby urban areas while allowing urban centres to benefit more easily from the agricultural products supplied by rural areas. In 2019, 52.6% of all rural dwellers in Togo resided within 2 km from an all-weather road, which was higher than the average of 43% for low-income African countries. In the Infrastructure scenario, this is expected to rise to 64.0% by 2043, higher than the 59.1% projected in the Current Path forecast and the average of 51% for low-income countries in Africa.
Togo’s GDP per capita is estimated to rise to US$3 685 by 2043 in the Infrastructure scenario. This is US$161 more than the projection in the Current Path forecast in the same year but below the average of US$3 790 for low-income countries in Africa.
By 2043, the proportion of the poor population is expected to decline from 49.6% in 2019 to 31.6% in 2043 in the Infrastructure scenario. This amounts to 4.3 million people who will live below the poverty line in 2043. Comparing this with the projections on the Current Path suggests that there will be 210 000 fewer poor people in the Infrastructure scenario than in the Current Path forecast for the same year. This will however be higher than the estimated average of 25.2% for low-income countries in Africa.
The Governance scenario represents a reasonable but ambitious improvement in accountability and reduces corruption, and hence improves the quality of service delivery by government.
Togo has been run by the same family for several decades. President Faure Gnassingbé took control of Togo in 2005 when his father, Gnassinge Eyadéma died after ruling the country for almost 40 years. In March 2024 the government of introduced a new constitution that provides for a parliamentary system of government and created the role of the president of the council of ministers with extensive authority to manage the affairs of the state. The following month the ruling Union for the Republic Party (UNIR) won a sweeping majority (108 out of 113 seats in parliament) in the country's legislative elections. The amendment to the constitution allow President Gnassingbé to extend his rule since he would previously only have been able to run for president one more time.
The intervention is explained here in the thematic part of the website.
As defined by the World Bank, government effectiveness ‘captures perceptions of the quality of public services, the quality of the civil service and the degree of its independence from political pressures, the quality of policy formulation and implementation, and the credibility of the government’s commitment to such policies’.
Chart 51 presents the impact of the interventions in the Governance scenario on government effectiveness.
In both the Current Path forecast and the Governance scenario, government effectiveness is estimated to increase over the period, although the increase in the Governance scenario is higher than the increase in the Current Path forecast. The projected score for government effectiveness in the Governance scenario by 2043 is 2.17 which is 0.23 more than projected score in the Current Path forecast. Also, Togo has a higher score in government effectiveness compared to the average of low-income countries in Africa.
In the Governance scenario, Togo’s GDP per capita is projected to increase to US$3 662 in 2043, which is US$138 more than the estimates in the Current Path forecast but lower than the average for low-income countries on the continent in the same year. This suggests that good governance in the forms of reducing corruption, improvement in quality of service delivery and accountability can lead to an additional US$138 in GDP per capita compared to the Current Path forecast in 2043.
The proportion of people living below the poverty line of US$1.90 per day is expected to decline to 31.7% in 2043 in the Governance scenario, which is higher than the 25.2% average for low-income African countries. It also corresponds to about 190 000 fewer people than the 4.6 million poor people projected in the Current Path forecast for 2043.
This section presents projections for carbon emissions in the Current Path for [Togo] and the 11 scenarios. Note that IFs uses carbon equivalents rather than CO2 equivalents.
The total quantity of carbon emitted by Togo in 2019 was 0.94 million tons. Togo’s carbon emissions are projected to increase in all the scenarios so that by 2043, the total carbon emissions will be about 43 million tons of carbon. The intervention with the greatest impact on carbon emissions is the Agriculture scenario, which will lead to an increase in Togo’s carbon emissions by 3.8 million tons in 2043. This is followed by the Free Trade and Leapfrogging scenarios with a projected increase in carbon emissions of 3.74 million and 3.65 million tons respectively by 2043.
The Combined Agenda 2063 scenario consists of the combination of all 11 sectoral scenarios presented above, namely the Stability, Demographic, Health/WaSH, Agriculture, Education, Manufacturing/Transfers, Leapfrogging, Free Trade, Financial Flows, Infrastructure and Governance scenarios. The cumulative impact of better education, health, infrastructure, etc. means that countries get an additional benefit in the integrated IFs forecasting platform that we refer to as the synergistic effect. Chart 55 presents the contribution of each of these 12 components to GDP per capita in the Combined Agenda 2063 scenario as a stacked area graph.
The synergistic effect of all the scenarios on the GDP per capita is estimated to be about US$366.20 in 2043. The scenario with the greatest impact on the GDP per capita by 2043 is the Agriculture scenario followed by the Free Trade scenario, while the scenarios with the least impact on the GDP per capita are Health/WaSH and Education. This suggests that in the long run, the Agriculture and Free Trade scenarios have the greatest potential to improve human and economic development in Togo.
Whereas Chart 55 presents a stacked area graph on the contribution of each scenario to GDP per capita as well as the additional benefit or synergistic effect, Chart 56 presents only the GDP per capita in the Current Path forecast and the Combined Agenda 2063 scenario.
Togo’s GDP per capita is estimated to increase to US$5 969 in 2043 in the Combined Agenda 2063 scenario. This is US$2 445 more than the projection based on the Current Path forecast, meaning that the Combined Agenda 2063 scenario will lead to an additional increase of US$2 445 in the GDP per capita in 2043 compared to the Current Path. Also, Togo’s GDP per capita in the Combined Agenda 2063 scenario will be US$2 179 higher than the average for low-income countries in Africa in 2063.
In the Combined Agenda 2063 scenario, the number of poor people will significantly decline such that by 2043, only 1.56 million Togolese people (12.1% of the population) will be living below the poverty line. This means that, compared to the Current Path, an additional 3 million Togolese people can be lifted out of extreme poverty in the Combined Agenda 2063 scenario. Likewise, the projections for the proportion of poor people in the Combined Agenda 2063 scenario will be lower than the average for low-income African countries by 2043.
See Chart 8 to view the Current Path forecast of the sectoral composition of the economy.
In the Combined Agenda 2063 scenario, the biggest contributors to the GDP in the long run are the service, manufacturing and agriculture sectors. By 2043, the service sector will contribute an additional 2.2 percentage points to the GDP, which corresponds to US$13.6 billion. Although manufacturing and agriculture contribute US$5.8 billion and US$2.3 billion respectively, in terms of percentage points, their contributions correspond to -0.59% and -0.83 respectively. ICT contributes 0.94 percentage points to GDP by 2043 which is equivalent to around US$2.1 billion.
The estimated GDP (MER) in the Combined Agenda 2063 scenario in 2043 will be US$51 billion, which is higher than the Current Path estimates of US$25.8 billion. This suggests that compared to the Current Path forecast, the size of the economy will almost double in the Combined Agenda 2063 scenario by 2043.
The total amount of carbon emitted in 2019 in Togo was 0.94 million tons. In the Combined Agenda 2063 scenario, the total carbon emitted is projected to rise to 5 million tons by 2043. This is higher than the estimates of 3.5 million tons in the Current Path forecast for 2043, meaning that the Combined Agenda 2063 scenario leads to much greater carbon emissions than the Current Path.
Page information
Contact at AFI team is Enoch Randy Aikins
This entry was last updated on 15 June 2026 using IFs v7.63.
Donors and sponsors


Reuse our work
- All visualizations, data, and text produced by African Futures are completely open access under the Creative Commons BY license. You have the permission to use, distribute, and reproduce these in any medium, provided the source and authors are credited.
- The data produced by third parties and made available by African Futures is subject to the license terms from the original third-party authors. We will always indicate the original source of the data in our documentation, so you should always check the license of any such third-party data before use and redistribution.
- All of our charts can be embedded in any site.
Cite this research
Enoch Randy Aikins (2026) Togo Development Futures. Published online at futures.issafrica.org. Retrieved from https://futures.issafrica.org/geographic/countries/togo/ [Online Resource] Updated 15 June 2026.