 Sierra Leone
Feedback welcome
Our aim is to use the best data to inform our analysis. See our Technical page for information on the IFs forecasting platform. We appreciate your help and references for improvements via our feedback form.
Please note: This country report was developed using African Futures’ previous analytical framework, which organised the assessment across 11 sectoral scenarios. We have since updated and streamlined the analytical architecture to 8 sectoral scenarios. While the two frameworks remain broadly aligned, the current structure improves consistency, comparability and integration across themes and geographic studies. This page will therefore be updated to the current framework in due course. Read more about our analytical framework on the Technical Page.
In this entry, we first describe the Current Path forecast for Sierra Leone as it is expected to unfold to 2043, the end of the third ten-year implementation plan of the African Union’s Agenda 2063 long-term vision for Africa. The Current Path in the International Futures (IFs) forecasting model initialises from country-level data that is drawn from a range of data providers. We prioritise data from national sources.
The Current Path forecast is divided into summaries on demographics, economics, poverty, health/WaSH and climate change/energy. A second section then presents a single positive scenario for potential improvements in stability, demographics, health/WaSH, agriculture, education, manufacturing and transfers, leapfrogging, free trade, financial flows, infrastructure, governance and the impact of various scenarios on carbon emissions. With the individual impact of these sectors and dimensions having been considered, a final section presents the impact of the Combined Agenda 2063 scenario.
We generally review the impact of each scenario and the Combined Agenda 2063 scenario on gross domestic product per person and extreme poverty, except for Health/WaSH that uses life expectancy and infant mortality.
The information is presented graphically and supported by brief interpretive text.
All US$ numbers are in 2017 values.
Executive Summary
- Current Path forecast
- Sierra Leone is a low-income country in sub-Saharan Africa with a population of about 7.9 million people. Despite having some of the greatest mineral deposits in the world, Sierra Leone has been forced to be aid dependent for several years as a result of the challenges of civil war. Jump to forecast: Current Path
- In the Current Path forecast, the population of Sierra Leone is estimated to increase from 7.9 million people in 2019 to 13.1 million people in 2043. The country misses rural–urban parity by a small margin, such that by 2043, 49% of the population will reside in urban areas and 51% in rural areas. Jump to Demographics: Current Path
- Sierra Leone experiences significant growth in GDP, reaching US$12.8 billion in 2043 in the Current Path forecast, as well as an increase in GDP per capita to US$2 464 in 2043, though this will be much lower than the average for its income peer group. Jump to Economy: Current Path
- In the Current Path forecast, the country continues to struggle with poverty rates with 5.5 million people (42.2% of the population) living below the poverty line of US$1.90 per day in 2043. Jump to Poverty: Current Path
- Gas will be the dominant energy type (92.7%) while hydro and solar energy production decline by 2043 in the Current Path forecast. Sierra Leone increases its carbon emissions to 2 million tons in 2043. Jump to Carbon emissions/Energy: Current Path
- Sectoral scenarios
- The Stability scenario will improve Sierra Leone’s score on the governance security index to 0.98 in 2043 and simultaneously increase the GDP per capita to US$2 568, reducing the proportion of people living below the poverty line to 39.3% of the population. Jump to Stability scenario
- Sierra Leone will reach the demographic dividend by 2039 as the population is managed through a reduction of fertility rates to 2.4 births per woman in the Demographic scenario. Jump to Demographic scenario
- The Health/WaSH scenario will increase life expectancy to 70.7 years by 2043 as 100% of the population gains access to safe water and sanitation. Infant mortality will still be greater than the SDG target of 25 by 2043. Jump to Health/WaSH scenario
- In the Agriculture scenario, Sierra Leone will increase its yield per hectare to 6.8 metric tons, reduce its net agricultural imports to 7.5% by 2043 and gain an additional US$381 in GDP per capita. More importantly, the country can reduce its proportion of poor people living below the poverty line of US$1.90 per day to 27.5%. Jump to Agriculture scenario
- The Education scenario will result in a higher GDP per capita of US$2 535 by 2043, although the resulting number of poor people in Sierra Leone will decline only marginally. Jump to Education scenario
- Government welfare transfers to households will increase to US$0.78 billion in 2043, and the GDP per capita will increase to US$2 615 in the Manufacturing/Transfers scenario. Jump to Manufacturing/Transfers scenario
- The Leapfrogging scenario will increase mobile broadband subscriptions per 100 people from 28.6 in 2019 to 154.7 in 2043 as well as increase access to electricity to 56.8% of the population, although the rural–urban disparity in access to electricity will remain notable. Jump to Leapfrogging scenario
- There will be an increase in the GDP per capita to US$2 756 by 2043 and a reduction in the proportion of poor people in Sierra Leone to 32.1% of the population in the Free Trade scenario. Jump to Free Trade scenario
- The Financial Flows scenario will result in a significant reduction in the contribution of foreign direct investment to Sierra Leone’s GDP in 2043 (from 20.8% in 2019 to 14% in 2043) even as the economy expands. Jump to Financial Flow scenario
- The Infrastructure scenario will increase the percentage of the rural population living within 2 km of all-weather roads to 76.2% by 2043. Jump to Infrastructure scenario
- The GDP per capita is increased to US$2 524 in 2043 in the Governance scenario. Jump to Governance scenario
- While Sierra Leone’s carbon emissions are projected to increase in all the scenarios, the Demographic scenario will have the least impact on carbon emissions whereas the Agriculture scenario will have the highest with 2.5 million tons of carbon by 2043. Jump to Impact of scenarios on carbon emissions
- Combined Agenda 2063 scenario
- In the Combined Agenda 2063 scenario, there is a US$1 840 increase in the GDP per capita in 2043 as a result of the synergistic effect of all the scenarios, although the Agriculture scenario has the greatest potential to increase the GDP per capita. Jump to Combined Agenda 2063 scenario
- Sierra Leone’s economy grows to US$27.5 billion in 2043, compared to the projection of US$12.8 billion in the Current Path. The country sees a significant reduction in the number of people living below the poverty line to 1.3 million people (10.3% of population) in the Combined Agenda scenario. Jump to Combined Agenda 2063 scenario
All charts for Sierra Leone Development Futures
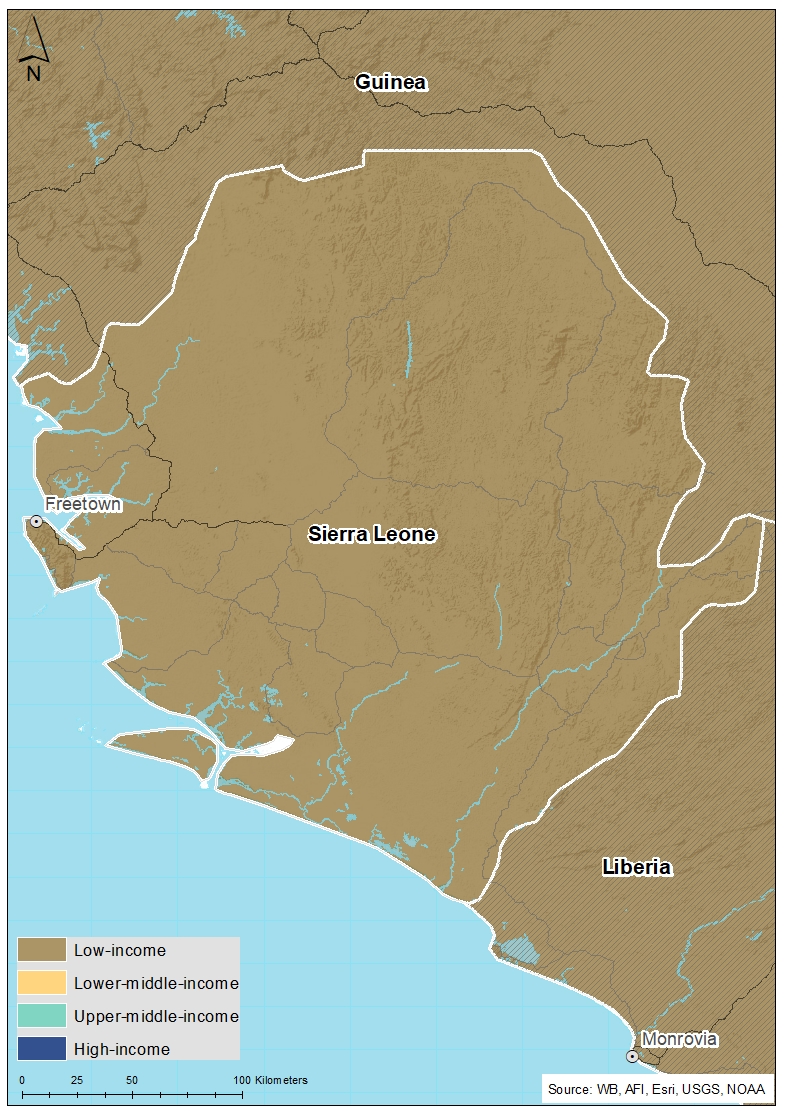
- Chart 1: Political map of Sierra Leone
- Chart 2: Population structure in CP, 1990–2043
- Chart 3: Urban and rural population in CP, 1990–2043
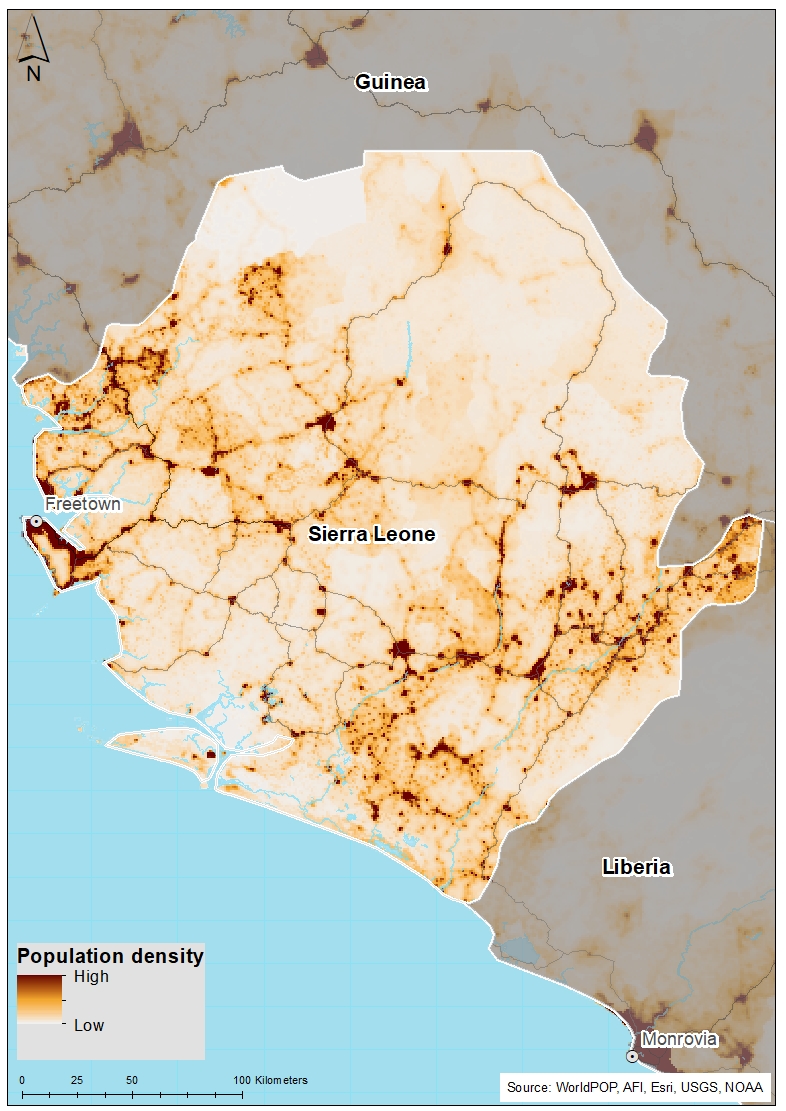
- Chart 4: Population density map for 2019
- Chart 5: GDP in CP, 1990–2043
- Chart 6: GDP per capita in CP, 1990–2043
- Chart 7: Informal sector value in CP, 2015–2043
- Chart 8: Value added by sector in CP, 2015–2043
- Chart 9: Agriculture production/demand in CP, 1990–2043
- Chart 10: Poverty in CP, 2015–2043
- Chart 11: Energy production by type in CP, 1990–2043
- Chart 12: Carbon emissions in CP, 1990–2043
- Chart 13: Governance security in CP and Stability scenario, 2019–2043
- Chart 14: GDP per capita in CP and Stability scenario, 2019–2043
- Chart 15: Poverty in CP and Stability scenario, 2019–2043
- Chart 16: Demographic dividend in CP and Demog scenario, 2019–2043
- Chart 17: Infant mortality in CP and Demog scenario, 2019–2043
- Chart 18: GDP per capita in CP and Demog scenario, 2019–2043
- Chart 19: Poverty in CP and Demog scenario, 2019–2043
- Chart 20: Life expectancy in CP and Health/WaSH scenario, 2019–2043
- Chart 21: Infant mortality in CP and Health/WaSH scenario, 2019–2043
- Chart 22: Yield/hectare in CP and Agric scenario, 2019–2043
- Chart 23: Agriculture imports in CP and Agric scenario, 2019–2043
- Chart 24: GDP per capita in the CP and Agric scenario, 2019–2043
- Chart 25: Poverty in CP and Agric scenario, 2019–2043
- Chart 26: Mean years of education in CP and Educ scenario, 2019–2043
- Chart 27: Education quality in CP and Educ scenario, 2019–2043
- Chart 28: GDP per capita in CP and Educ scenario, 2019–2043
- Chart 29: Poverty in CP and Educ scenario, 2019–2043
- Chart 30: Value added by sector in CP and Manufac/Transfers scenario, 2019–2043
- Chart 31: Gov welfare transfers in CP and Manufac/Transfers scenario, 2019–2043
- Chart 32: GDP per capita in CP and Manufac/Transfers scenario, 2019–2043
- Chart 33: Poverty in CP and Manufac/Transfers scenario, 2019–2043
- Chart 34: Fixed broadband access in CP and Leapfrogging scenario, 2019–2043
- Chart 35: Mobile broadband access in CP and Leapfrogging scenario, 2019–2043
- Chart 36: Electricity access in CP and Leapfrogging scenario, 2019–2043
- Chart 37: GDP per capita in CP and Leapfrogging scenario, 2019–2043
- Chart 38: Poverty in CP and Leapfrogging scenario, 2019–2043
- Chart 39: Trade balance in CP and Free Trade scenario, 2019–2043
- Chart 40: GDP per capita in CP and Free Trade scenario, 2019–2043
- Chart 41: Poverty in CP and Free Trade scenario, 2019–2043
- Chart 42: Foreign aid in CP and Financial Flows scenario, 2019–2043
- Chart 43: Inflow of FDI in CP and Financial Flows scenario, 2019–2043
- Chart 44: Remittances in CP and Financial Flows scenario, 2019–2043
- Chart 45: GDP per capita in CP and Financial Flows scenario, 2019–2043
- Chart 46: Poverty in CP and Financial Flows scenario, 2019–2043
- Chart 47: Electricity access in CP and Infrastructure scenario, 2019–2043
- Chart 48: Rural road access in CP and Infrastructure scenario, 2019–2043
- Chart 49: GDP per capita in CP and Infrastructure scenario, 2019–2043
- Chart 50: Poverty in CP and Infrastructure scenario, 2019–2043
- Chart 51: Gov effectiveness in CP and Governance scenario, 2019–2043
- Chart 52: GDP per capita in CP and Governance scenario, 2019–2043
- Chart 53: Poverty in CP and Governance scenario, 2019–2043
- Chart 54: Carbon emissions in CP and scenarios, 2019–2043
- Chart 55: GDP per capita in CP and scenarios, 2019–2043
- Chart 56: GDP per capita in CP and Combined scenario, 2019–2043
- Chart 57: Poverty in CP and Combined scenario, 2019–2043
- Chart 58: Value added by sector in CP and Combined scenario, 2019–2043
- Chart 59: GDP in CP and Combined scenario, 2019–2043
- Chart 60: Carbon emissions in CP and Combined scenario, 2019–2043


Sierra Leone Development Futures: Current Path
Download to pdfThis page provides an overview of the key characteristics of Sierra Leone along its likely (or Current Path) development trajectory. The Current Path forecast from the International Futures forecasting (IFs) platform is a dynamic scenario that imitates the continuation of current policies and environmental conditions. The Current Path is therefore in congruence with historical patterns and produces a series of dynamic forecasts endogenised in relationships across crucial global systems. We use 2019 as a standard reference year and the forecasts generally extend to 2043 to coincide with the end of the third ten-year implementation plan of the African Union’s Agenda 2063 long-term development vision.
Located in sub-Saharan Africa, Sierra Leone is bordered by Liberia and Guinea to the south-east and north-east, respectively, and the Atlantic Ocean on its western border. The nation belongs to the Economic Community of West African States (ECOWAS). The official language of the country is English, although Krio is the most common indigenous language spoken by the majority of the population.
Geographically, the country covers a total area of 71 740km2 and has a tropical climate that features a range of ecoregions from savannah to rainforests. There are two main seasons, as in many sub-Saharan African countries: the rainy season from May to November, and the dry harmattan season from December to May. Sierra Leone is divided into five administrative regions: the Northern Province, the North West Province, the Southern Province, the Eastern Province, and the Western Area. Four of the provinces are further divided into 14 districts, but the Western Area is divided into only two districts. Freetown, the capital city, is also the most populous in the nation. The country is rich in natural resources and earns a significant amount from its mineral deposits, especially diamonds, gold, bauxite and aluminium. Sierra Leone also has the largest natural harbour on the African continent.
Until the outbreak of Ebola in 2014, Sierra Leone was seeking to attain middle-income status by 2035, but the country still carries its post-conflict attributes of high youth unemployment, corruption and weak governance. The country continues to face the daunting challenge of enhancing transparency in managing its natural resources and creating fiscal space for development.
Sierra Leone is the 11th most populous country in West Africa and the 34th most populous in Africa. The country had an estimated population of 7.9 million in 2019, up from 4.3 million in 1990 — an 82.6% increase in the population size over the past 29 years. In the Current Path forecast, the population of Sierra Leone is forecast to increase to 13.1 million — an increase of 66.3% within the 23-year period to 2043. The relatively slower increase in the population growth rate can be attributed to the adoption of improved birth control methods such as the use of contraceptives.
Sierra Leone has a large youthful population with a youth bulge of 47.9% and a median age of 19.4 years in 2019. The youth bulge, defined as the ratio of the population between the ages of 15 and 29 to the total adult population, will remain above 40% in the Current Path forecast. The large youth bulge raises concern about youth unemployment in the country that together with underemployment stands at about 70%. This poses an existential threat to the peace and security of the country.
In addition, 40.3% of the population is below the age of 15 years and 28.6% under the age of 30 years. The relatively large cohort of children under the age of 15 constrains the materialisation of the demographic dividend. With an expected decline in the fertility rate from 4.3 births per woman in 2019 to 2.9 births in 2043, it is projected that the proportion of people below the age of 15 years will fall to 32.6% over the next 24 years. This signals the likelihood of a more adult population, increasing the share of people under the age of 64 years from 28% in 2019 to 35.7% in 2043. The average life expectancy in Sierra Leone was 60 years in 2019 but is estimated to increase to 70 years in 2043. The relatively low life expectancy is mainly due to a high disease burden emanating from communicable and non-communicable diseases. With an expected decline in communicable diseases over the period, life expectancy is also projected to increase within the same period.
Over 2.6 million people were displaced during the civil war (1991–2002). In 1990, the majority of the Sierra Leonean population (66.8% of the population) resided in rural areas. However, over the past 29 years, the proportion of people residing in rural areas has marginally declined by 8.8 percentage points from 66.8% in 1990 to 58.0% in 2019, suggesting an increase in urbanisation. A factor that explains rural–urban migration in the country is the search for employment and improved livelihoods in the mining towns. However, Sierra Leone has a lot of slums in the urban centres. In 2014, it was estimated that 75.6% of the total urban population resided in places classified as slums. In the Current Path forecast, this trend is projected to continue such that by 2043 almost 49% of the Sierra Leonean population will live in urban areas.
The total land area for Sierra Leone is approximately 71 740 km². In 2019, Sierra Leone was the 6th most densely populated country in West Africa and 15th most densely populated country in Africa. The population density of Sierra Leone was estimated to be about 1.09 people per hectare, which is higher than the average of 0.45 for Africa and 0.65 for West Africa. Generally, the Temne region in the north and the Mende region in the south are the most densely populated areas. The most densely populated city is the national capital Freetown, due to its role as the financial, cultural, political and educational centre of the country, followed by Bo and Kenema. Sparsely populated areas in the country are located within the north-east and south-west regions.
The GDP of Sierra Leone increased by nearly US$2.4 billion from 1990 to 2019, from US$2.1 billion in 1990 to US$4.5 billion in 2019, representing an increase of 114.3% over the 29-year period. The Sierra Leonean economy is mainly driven by agriculture and mineral production. Since the end of the civil war, which greatly destabilised the economy, the economy has rebounded and seen steady growth, peaking at 20.7% in 2013. This impressive growth was however disrupted by two major shocks to the economy: in late 2013 there was a decline in international prices of iron ore that Sierra Leone largely depends upon, and the outbreak of Ebola in 2014. The economy recovered in 2016, mainly as a result of international debt relief and donor assistance. The government has also launched the Medium-term National Development Plan (MTNDP, 2019–2023), which is aimed at transforming the economy. However, the country’s economy contracted by 2% as the COVID-19 pandemic led to a slowdown in all sectors following global supply chain disruptions and lockdown measures. By 2043, Sierra Leone’s GDP is estimated to nearly triple to US$12.8 billion from its level in 2019. The increase in GDP reflects the higher rate of economic growth expected to occur within the next 22 years compared to previous years.
Although many of the charts in the sectoral scenarios also include GDP per capita, this overview is an essential point of departure for interpreting the general economic outlook of Sierra Leone.
Sierra Leone has had an unstable GDP per capita over the past years. From 1990 to 2001, the GDP per capita declined from US$1 360 to US$895. The main factor accounting for this decline was the civil war that occurred during this period. After the civil war, the GDP per capita assumed an upward trend, increasing to peak at US$1 861 in 2014, reflecting higher growth mainly as a result of the resumption of mining production in the country. Afterwards, the GDP per capita started declining due to the twin shocks of the fall of commodity prices and the Ebola crisis on the international market. This caused the GDP per capita to decline to US$1 601 in 2019. The GDP per capita fell by 4% in 2020, reversing some of the recent gains in poverty reduction. However, with an expected increase in GDP and decline in fertility rates, it is projected that the GDP per capita will rise over the next 22 years, such that by 2043 the GDP per capita will have more than doubled to US$2 464. Although Sierra Leone’s GDP per capita in 1990 was slightly higher than the average for low-income countries in Africa, the trend reversed by 1997 so that in 2019 Sierra Leone’s GDP per capita was US$59 lower than the average for low-income countries in Africa. This gap is expected to widen to US$1 326 by 2043, suggesting that Sierra Leone either has a higher population growth rate or slower economic growth compared to the average low-income country in Africa.
The size of the informal sector in Sierra Leone was equivalent to 33.4% of GDP in 2019. This is expected to decline to 28% by 2043, constituting a 5.4 percentage point decrease over the 22-year period. In 2019, the number of people employed by the informal economy constituted 63.6% of the total labour force, though this is expected to decline to 54% in 2043, which is also consistent with the expected decline in the level of informality within the same period. Women make up a larger proportion of workers in the informal sector, constituting about 57%. There is also quite a significant number of children engaged in unpaid work in the informal sector. Informal sector workers are highly concentrated in the Northern Area and the rural areas of the country. Throughout the period under consideration, the size of the informal sector in Sierra Leone is higher than the average for low-income African countries. This suggests that Sierra Leone has performed poorly in formalising its economy compared to the average for other African countries within its income group.
The IFs platform uses data from the Global Trade and Analysis Project (GTAP) to classify economic activity into six sectors: agriculture, energy, materials (including mining), manufactures, services and information and communications technology (ICT). Most other sources use a threefold distinction between only agriculture, industry and services with the result that data may differ.
The three largest contributors to GDP in Sierra Leone are the agriculture, service and manufacturing sectors, respectively. In 2019, the agriculture sector’s contribution to GDP was about US$1.9 billion, representing 42.2% of GDP. However, the contribution of the agriculture sector is projected to decline over the period so that by 2043 the sector’s contribution to GDP will be 19.4%, indicating the structural transformation of the economy. The service sector is currently the second biggest contributor to GDP with a total contribution of US$1.7 billion, constituting 38% of GDP. In the Current Path forecast, it is projected that the service sector will increase its contribution to GDP and overtake agriculture as the largest contributor to GDP by 2027. By 2043, the contribution of the service sector to GDP is projected to be 49.4%, which will be 30 percentage points more than the contribution of the agriculture sector. The industrial sector, however, will steadily increase its contribution to GDP from 12.4% in 2019 to 21.3% by 2043, overtaking agriculture as the second largest contributor in 2042. Whereas these developments are consistent with the structural transformation and growth trajectory of an economy, the decline in agricultural contributions to the economy may be a concern for food security in the country.
The data on agricultural production and demand in the IFs forecasting platform initialises from data provided on food balances by the Food and Agriculture Organization (FAO). IFs contains data on numerous types of agriculture but aggregates its forecast into crops, meat and fish, presented in million metric tons. Chart 9 shows agricultural production and demand as a total of all three categories.
The average crop yield for 2019 was 5.1 metric tons per hectare. In 1990, Sierra Leone’s demand for agricultural products outstripped domestic production by 0.17 million metric tons; this increased to 0.95 million metric tons in 2019. This can partly be attributed to the declining interest in the agriculture sector reflected in the share of total employment, as the sector’s contribution to total employment declined from 71.9% in 1990 to 54.9% in 2019. Although the yield per hectare for crops is expected to increase from 5.1 metric tons per hectare in 2019 to 6.7 metric tons per hectare in 2043, the gap between demand and production will widen. By 2043, demand will outstrip domestic production by about 5.1 million metric tons, representing a 400% increase over the period. This raises concerns about food security in the country within the next 22 years. Many Sierra Leoneans engaged in agriculture do so on a subsistence basis, providing little or no value addition to agricultural products. Problems with agriculture in the country include the inability to add value to agricultural products due to the lack of modern processing equipment. Poor transportation networks linking farms to markets as well as the lack of access to credit facilities for farmers also inhibit agricultural growth in the country.
There are numerous methodologies for and approaches to defining poverty. We measure income poverty and use GDP per capita as a proxy. In 2015, the World Bank adopted the measure of US$1.90 per person per day (in 2011 international prices), also used to measure progress towards the achievement of Sustainable Development Goal 1 of eradicating extreme poverty. To account for extreme poverty in richer countries occurring at slightly higher levels of income than in poor countries, the World Bank introduced three additional poverty lines in 2017:
- US$3.20 for lower middle-income countries
- US$5.50 for upper middle-income countries
- US$22.70 for high-income countries.
As a low-income country, Sierra Leone uses the US$1.90 per person per day benchmark. The country is one of the poorest in Africa and the world. In 2019, 3.9 million people, constituting 49.7% of the Sierra Leone population, lived on less than US$1.90 per day. This increased to 4.8 million people (58.4%) in 2021 due to the COVID-19 pandemic and its associated economic crisis, before marginally declining to 4.7 million people (55.3%) in 2022. Thereafter, it continues an upward trend so that by 2043 there will still be 5.5 million people (42.2% of the population) living on less than US$1.90 per day. This means that although the proportion of the extremely poor population will reduce by 7.5 percentage points, the absolute number of poor people in the country will be 1.6 million people more than its level in 2019 due to the population growth. Throughout the period under consideration, the proportion of poor people in Sierra Leone is higher than the average for low-income countries in Africa, and the gap widens over time. By 2043, the extreme poverty rate in Sierra Leone is estimated to be 17 percentage points above the projected average for low-income countries in Africa. Poverty is widespread in Sierra Leone, with the majority of the population being multidimensionally poor. Much of the poor population resides in rural areas, with a quarter of them unable to afford a basic diet. Investment in agriculture remains one of the surest ways to reduce poverty in the country as most of the poor population is informally employed in this sector.
The IFs platform forecasts six types of energy, namely oil, gas, coal, hydro, nuclear and other renewables. To allow comparisons between different types of energy, the data is converted into billion barrels of oil equivalent (BBOE). The energy contained in a barrel of oil is approximately 5.8 million British thermal units (MBTUs) or 1 700 kilowatt-hours (kWh) of energy.
The most widely produced energy source in Sierra Leone is gas, followed by hydro and nuclear. In 2019, the total amount of gas produced in the country amounted to 0.5 million BOE, constituting 90.9% of total energy production. Hydropower accounts for 59% of installed grid-connected electricity generation capacity. By 2043, the total amount of gas produced is projected to increase to 9 million BOE, constituting 92.7% of total energy production in the country. Hydro production constituted 7.3% of total energy production in 2019 but is projected to decline to about 2% in 2043. Likewise, nuclear power, which in 2019 constituted about 2% of total production, is projected to decline to 0.5% by 2043. The country has potential for renewable energy through the use of biomass from agricultural waste and hydro and solar energy. Sierra Leone will begin the production of other renewable energies such as solar and wind energies, which will constitute about 5% of total energy production in 2043.
Carbon is released in many ways, but the three most important contributors to greenhouse gases are carbon dioxide (CO2), carbon monoxide (CO) and methane (CH4). Since each has a different molecular weight, IFs uses carbon. Many other sites and calculations use CO2 equivalent.
Sierra Leone is one of the countries in Africa with significantly low levels of carbon emissions. Regardless, carbon emissions have increased steadily from nearly zero in 1990 to 1 million tons of carbon in 2019. In the Current Path forecast, carbon emissions are projected to increase to 2 million tons by 2043.
Sectoral Scenarios for Sierra Leone Development Futures
Download to pdfThe Stability scenario represents reasonable but ambitious reductions in risk of regime instability and lower levels of internal conflict. Stability is generally a prerequisite for other aspects of development and this would encourage inflows of foreign direct investment (FDI) and improve business confidence. Better governance through the accountability that follows substantive democracy is modelled separately.
The intervention is explained here in the thematic part of the website.
The scenario generally signifies increased political stability, reduced internal conflict, high FDI inflows, improved and accountable governance and low levels of corruption in the country. Prior to the civil war, one political party — the All People’s Congress (APC) — had ruled the country since 1968. The civil war destabilised the country and its political systems, as the period of the conflict was largely characterised by military takeovers and rule. The post-civil war political situation in the country has been relatively peaceful and stable. The first post-war election was won by the Sierra Leone People’s Party (SLPP). However, the APC regained power in 2007 and won a second term in 2012. In the 2018 general elections, the SLPP was elected in a keenly contested election amidst violent confrontations.
Despite the progress in peace and stability, corruption continues to be endemic and public service delivery is poor with weak state institutions. In 2019, Sierra Leone's score in the governance security index was 0.69, which was higher than the average of 0.64 for low-income countries in Africa. In the Stability scenario, the country’s score on the governance security index is projected to rise from 0.69 to 0.85 in 2043, which is 0.09 points higher than the Current Path forecast in the same year. Compared to the average for low-income countries in Africa, Sierra Leone has a high level of governance security such that by 2043 Sierra Leone’s score will be 0.14 higher than the average for low-income countries in Africa.
In 2019, the GDP per capita for Sierra Leone was US$1 601, which is US$59 less than the average for low-income countries in Africa. In the Stability scenario, the GDP per capita is projected to increase to US$2 568 by 2043. This will be US$104 more than in the Current Path forecast but US$1 222 below the average for low-income countries in Africa. Political stability and a peaceful environment inspire investor confidence and attract FDI into the country yielding a positive effect on economic growth. The government should therefore accelerate the implementation of its Medium-term National Development Plan (MTNDP, 2019–2023), which maps out short- and long-term development goals and commitment to transform from a fragile state into a stable democracy.
As Sierra Leone is a low-income country, it uses the global benchmark of US$1.90 per day. In 2019, 3.9 million poor people (about 50% of the population) were living on less than US$1.90 per day. The Stability scenario reduces the portion of people living below the poverty line to 39.3% by 2043, which is 2.8 percentage points below the Current Path forecast. Nonetheless, the number of poor people will rise from 3.9 million people in 2019 to 5.2 million people in 2043 in the Stability scenario. This means that the materialisation of the Stability scenario could lead to 400 000 fewer poor people than in the Current Path forecast in 2043. Throughout the period, the proportion of poor people in Sierra Leone will be greater than the average for low-income African countries and the gap widens over time.
This section presents the impact of a Demographic scenario that aims to hasten and increase the demographic dividend through reasonable but ambitious reductions in the communicable-disease burden for children under five, the maternal mortality ratio and increased access to modern contraception.
The intervention is explained here in the thematic part of the website.
Demographers typically differentiate between a first, second and even a third demographic dividend. We focus here on the contribution of the size of the labour force (between 15 and 64 years of age) relative to dependants (children and the elderly) as part of the first dividend. A window of opportunity opens when the ratio of the working-age population to dependants is equal to or surpasses 1.7.
In 2019, the ratio of working-age people to dependants was 1.3:1, meaning that there were 1.3 working-age persons for each dependant in the country. This is greater than the average of 1.2 for low-income countries in Africa. Generally, the demographic dividend materialises when the country reaches a minimum ratio of 1.7 working-age persons for each dependant. While the country will not reach its demographic dividend by 2043 in the Current Path forecast, in the Demographic scenario, Sierra Leone is expected to reach this minimum ratio by 2039 so that by 2043 the ratio of working-age people to dependants will be 1.87:1. This will be higher than the average of 1.53 for low-income African countries. The materialisation of the demographic dividend in the Demographic scenario can be explained by increased access to modern contraceptives, which will lead to a decline in fertility rates. In the Demographic scenario, fertility rates are expected to decline to 2.4 births per woman in 2043 compared to 2.9 births per woman in the Current Path forecast within the same period.
The infant mortality rate is the number of infant deaths per 1 000 live births and is an important marker of the overall quality of the health system in a country.
Sierra Leone is one of the countries in Africa with a high infant mortality rate. The infant mortality rate in Sierra Leone in 2019 was 68.9 deaths per 1 000 live births, meaning that for every 1 000 infants born, about 69 died. This figure is far above the average of 48.5 deaths for low-income countries in Africa. The Demographic scenario will lead to a decline in infant mortality (23.3 deaths per 1 000 live births) by 2043, which is 6.3 deaths fewer than in the Current Path forecast and 2.1 deaths more than the average for low-income countries in Africa.
In 2019, the GDP per capita for Sierra Leone was US$1 601, which was slightly below the average for low-income African countries. By 2043, based on the Demographic scenario, the GDP per capita will increase to US$2 553, which is US$89 more than the projected US$2 464 in the Current Path forecast in the same year. However, this will still be significantly below the US$3 790 average for low-income countries in Africa. The additional increase in the GDP per capita as a result of the Demographic scenario may be attributed to the reduction in population growth as a result of the decline in fertility rates emanating from improved access to contraceptives, or economic growth arising from the materialisation of the demographic dividend.
As noted earlier, the number of people in Sierra Leone living below the poverty line of US$1.90 per day in 2019 was 3.9 million. In the Demographic scenario, this number will rise to 5 million people in 2043, which will be 500 000 fewer people than in the Current Path forecast. Similarly, the proportion of the poor population can be reduced to 39.7% in the Demographic scenario, which is about 2.5 percentage points lower than in the Current Path forecast, although it will be 15.5 percentage points higher than the average for low-income countries in Africa in 2043. The lower number and portion of poor people in the Demographic scenario reflect the decline in the population size as a result of modern contraceptive use which reduces fertility rates. The reduction of the size of the cohort of children under the age of 15 will allow households and the government to invest in child education more effectively, which has a positive effect on poverty reduction.
This section presents reasonable but ambitious improvements in the Health/WaSH scenario, which include reductions in the mortality rate associated with both communicable diseases (e.g. AIDS, diarrhoea, malaria and respiratory infections) and non-communicable diseases (NCDs) (e.g. diabetes), as well as improvements in access to safe water and better sanitation. The acronym WaSH stands for water, sanitation and hygiene.
The intervention is explained here in the thematic part of the website.
The efficacy of a country’s healthcare system can be gauged through indicators such as life expectancy, infant mortality and maternal mortality, among others. The decade-long civil war and the 2014 Ebola outbreak left Sierra Leone's healthcare system in a poor state, including inadequate infrastructure and a lack of staff. The life expectancy at birth for the average Sierra Leonean was 61 years in 2019, which was below the average of 63.8 for low-income countries in Africa. On average, females have a higher life expectancy at birth (62.2 years) than males (59.8 years). In the Health/WaSH scenario, life expectancy is estimated to increase to about 70.7 years by 2043, which is an increase of eight months above the Current Path forecast of 70 years and slightly below the average of 70.9 years for low-income African countries. This increased life expectancy in the country can be attributed to the expected improvement in access to safe water and sanitation (100% of the population by 2043) as well as a reduction in mortality from communicable diseases. However, deaths from non-communicable diseases continue to be a problem. Females will continue to have a higher life expectancy than males with a difference of over four years by 2043.
The infant mortality rate per 1 000 live births in 2019 was 68.9 deaths, which is much higher than the 48.5 for low income countries. By 2043, infant mortality per 1 000 live births in the country will be 26.8 in the Health/WaSH scenario and 29.6 in the Current Path forecast. Healthcare in Sierra Leone is an issue that is complicated by the nation’s high poverty rate, many endemic diseases and tumultuous political history. While shocking statistics, such as the country’s high infant mortality rates, paint a grim picture, there are signs of progress being made and there is potential for much more change on the horizon.
The Agriculture scenario represents reasonable but ambitious increases in yields per hectare (reflecting better management and seed and fertiliser technology), increased land under irrigation and reduced loss and waste. Where appropriate, it includes an increase in calorie consumption, reflecting the prioritisation of food self-sufficiency above food exports as a desirable policy objective.
The intervention is explained here in the thematic part of the website.
The data on yield per hectare (in metric tons) is for crops but does not distinguish between different categories of crops.
In 2019, the average yield per hectare for crops was 5.2 metric tons per hectare, which was above the average of 2.7 metric tons per hectare for low-income countries in Africa. In the Current Path forecast, this is projected to increase to 6.8 metric tons per hectare by 2043. In the Agriculture scenario, the average yield will be 9.5 metric tons per hectare by 2043. This means that if the country is able to adopt modern methods of farming including the use of fertiliser and improved seeds, there will be a significant improvement in agricultural production compared to the Current Path forecast in 2043. Across the forecast horizon, crop yields in Sierra Leone remain above the average for low-income African countries.
In 2019, the net agricultural import was 11% of agricultural demand in the country, which was above the average for low-income countries in Africa. A structural problem common in most African economies is the dependence on importation and Sierra Leone is no exception to this phenomenon despite having 5.4 million hectares of arable land of which about 75% remains uncultivated. One of the main constraints on the agriculture sector is the lack of improved modern technology and equipment for farming. As a result, the country has always had a net positive import dependence as a per cent of total demand.
It is estimated that 80% of all foodstuffs consumed domestically are imported. In 2018, the annual importation of rice alone was estimated to be around US$108 million. In the Current Path forecast, it is estimated that import dependence will grow to 34.2% of total demand. The situation is mitigated in the Agriculture scenario such that by 2043 the country’s net agricultural imports will reduce to 7.5%. This is lower than the average for low-income countries by about 24.8 percentage points, suggesting that there is a lot of potential that is yet to be tapped in terms of agriculture production.
The Agriculture scenario is expected to lead to an increase in the GDP per capita over the years. By 2043, the GDP per capita as a result of the Agriculture scenario will increase from US$1 601 in 2019 to US$2 845, constituting an increase of about 77.7% over the period. These estimates are greater than the projections in the Current Path forecast as, by 2043, the additional gains from the GDP per capita as a result of the Agriculture scenario will be US$381. In this scenario, Sierra Leone’s GDP per capita will still remain below the average of US3 790 for low-income countries in Africa. Indeed, the gap in GDP per capita between Sierra Leone and its peer group is projected to widen in the Agriculture scenario.
Implementing good agricultural policies that result in increased yield per hectare and a reduction in waste appear to have a significant impact on poverty reduction in the country. In the Current Path forecast, 5.5 million people (42.2% of the population) are projected to be extremely poor by 2043. However, in the Agriculture scenario, the number of people below the poverty line of US$1.90 per day will reduce to 3.6 million, constituting 27.5% of the population. This means that the Agriculture scenario has 1.9 million fewer poor people than in the Current Path forecast in 2043. This is not surprising since the majority of the poor population in Sierra Leone are employed within the agriculture sector. Throughout the period, in the Agriculture scenario, the proportion of people living in extreme poverty in Sierra Leone will be higher than the average for low-income countries in Africa. By 2043, the poverty rate in Sierra Leone in the scenario will be 2.3 percentage points above the average for low-income countries in Africa.
The Education scenario represents reasonable but ambitious improved intake, transition and graduation rates from primary to tertiary levels and better quality of education. It also models substantive progress towards gender parity at all levels, additional vocational training at secondary school level and increases in the share of science and engineering graduates.
The intervention is explained here in the thematic part of the website.
The long period of civil war had devastating effects on the educational sector. Currently, there is disparity in educational facilities across regions in Sierra Leone, with the Western Area having more educational facilities than the other areas. Common problems in the educational sector include the shortage of teaching materials, overcrowded classrooms and the delay in and underpayment of teachers’ salaries. The education system in Sierra Leone is under-resourced, with limited primary and secondary education. There is a high drop-out rate among secondary school learners, mainly due to expensive school fees and the cost of buying learning materials and school uniforms. Also, many secondary school learners drop out to make a living in the informal sector to support their households. In 2019, Sierra Leone’s mean years of education was 4.5, which is above the average of 4.4 for low-income countries on the continent. This was probably due to the free education programme introduced in 2018 which abolished school- and examination fees. The programme also included a school feeding component as well as the provision of teaching and learning materials.
In terms of gender, the mean years of education for males is 5, which is 1.1 years more than females’ average of 3.9. This means that on average, men are more likely to complete primary education than women. The gap in favour of men for mean years of education in Sierra Leone is lower than the average of 1.3 years for low-income countries in Africa. By 2043, in the Education scenario, the mean years of education will rise to 6.6 years — 0.2 years more than the Current Path estimates and 0.5 years more than the average for low-income countries in Africa. Technically, this means that most Sierra Leoneans will have at least primary education by 2043.
Also, in the Education scenario, the gender gap for mean years of education will close by 0.6 years by 2043, while the gender gap closes by 0.5 years for the average low-income countries in Africa within the same period.
The average test score for primary learners in Sierra Leone for 2019 was 24.5%, which was below the average of 27.7% for low-income countries in Africa, signifying a relatively poorer performance in this regard. The Education scenario increases the average test scores for primary learners to 36.1%, compared to the Current Path forecast estimate of 30.8%. Also, the Education scenario for 2043 will result in 5.5 percentage points higher scores than the continental average for low-income countries.
In 2019, the average test secondary learner score for Sierra Leone was 35.7%, which was only slightly below the average of 35.8% for low-income African countries. This suggests that Sierra Leone performs relatively better at the secondary level than at the primary level. By 2043, the average test score for secondary learners is projected to rise to 48.7%, which will be greater than the Current Path estimates of 40.4% and the average of 37.8% for low-income countries in Africa.
By 2043, the increase in GDP per capita as a result of the Education scenario is estimated to be US$71 more than the projected US$2 464 in the Current Path forecast. This will still be US$1 388 less than the average of US$3 790 for low-income countries in Africa. Although education is a powerful way to improve productivity, growth and the income prospects of the poor, it takes time to yield results.
By 2043, in the Education scenario, there will be 5.2 million more poor people (40.0% of the population). This means that the Education scenario contributes to reducing the number of poor people by 294 000 people in 2043, compared to the Current Path forecast. This tallies with the fact that although education is a powerful tool for reducing poverty, it takes time, often decades, to produce the expected results. The proportion of poor people in the Education scenario in Sierra Leone will be 14.8 percentage points higher than the average for low-income countries in Africa.
The Manufacturing/Transfers scenario represents reasonable but ambitious manufacturing growth through greater investment in the economy, investments in research and development, and promotion of the export of manufactured goods. It is accompanied by an increase in welfare transfers (social grants) to moderate the initial increases in inequality that are typically associated with a manufacturing transition. To this end, the scenario improves tax administration and increases government revenues.
The intervention is explained here in the thematic part of the website.
Chart 30 should be read with Chart 8 that presents a stacked area graph on the contribution to GDP and size, in billion US$, of the Current Path economy for each of the sectors.
In the Manufacturing/Transfers scenario, the absolute contribution of the service sector to GDP will experience the largest improvement compared to the Current Path in 2043. It is forecast to be US$0.73 billion larger than the Current Path forecast; this corresponds to 0.54% of GDP. The manufacturing sector, which is the second largest contributor, is also projected to contribute an additional US$0.27 billion to GDP compared to the Current Path in 2043, although its contribution as a share of GDP declines from 0.38 in 2037 to 0.148 percentage points above the Current Path forecast. Although the third largest contributor to GDP in Sierra Leone is ICT, with a contribution of US$0.10 billion more than the Current Path forecast in 2043, its contribution as a share of GDP will overtake manufacturing as the second largest contributor from 2040, such that by 2043 it will contribute 0.3 percentage points more to GDP than the manufacturing sector. It is important to note that in 2043 the share of agriculture in GDP is 1.53 percentage points of GDP below the Current Path forecast.
The Sierra Leonean government’s welfare transfers to households are significantly low. In 2019, the total welfare transfers to households were US$0.05 billion. This is projected to increase to US$0.78 billion by 2043 in the Manufacturing/Transfers scenario, constituting over a 1 000% increase over the period. This amount is far greater than the US$0.49 billion estimated for 2043 in the Current Path, suggesting that the Manufacturing/Transfers scenario can lead to an improvement in government welfare transfers by an additional US$0.29 billion compared to the Current Path in 2043.
By 2043, it is estimated that the GDP per capita will rise to US$2 615, which is US$151 more than projections in the Current Path forecast in the same year. The GDP per capita for Sierra Leone by 2043 in the Manufacturing/Transfers scenario will however still be below the average of US$3 790 for low-income countries in Africa. Indeed, the gap between Sierra Leone and its African income peer group in terms of GDP per capita is projected to widen from US$59 in 2019 to a whopping US$1 175 in 2043.
Within the period under consideration, the total number of poor people is projected to increase although the percentage of poor people is expected to decline. Compared to the Current Path forecast, the Manufacturing/Transfers scenario leads to a much quicker decline in poverty. The total number of poor people is projected to increase to 4.9 million (37.6% of the population) in 2043 in the Manufacturing/Transfers scenario. This suggests that the estimated number of people who can be lifted above the poverty line of US$1.90 as a result of the Manufacturing/Transfers scenario is 600 000, constituting about 10% of the population. This means that if the country embraces policies such as investment in the economy, research and development, as well as export promotion, the number of poor people below the Current Path forecast will be reduced. The proportion of poor people in Sierra Leone based on the Manufacturing/Transfers scenario in 2043 is about 12.4 percentage points above the average for low-income countries in Africa.
The Leapfrogging scenario represents a reasonable but ambitious adoption of and investment in renewable energy technologies, resulting in better access to electricity in urban and rural areas. The scenario includes accelerated access to mobile and fixed broadband and the adoption of modern technology that improves government efficiency and allows for the more rapid formalisation of the informal sector.
The intervention is explained here in the thematic part of the website.
Fixed broadband includes cable modem Internet connections, DSL Internet connections of at least 256 KB/s, fibre and other fixed broadband technology connections (such as satellite broadband Internet, ethernet local area networks, fixed-wireless access, wireless local area networks, WiMAX, etc.).
In 2019, the total number of fixed broadband subscriptions in Sierra Leone was 4.7 per 100 people, which was above the average of 2.3 for low-income countries in Africa. In the Current Path forecast, fixed broadband subscriptions are expected to rise to 42.5 per 100 people by 2043. The Leapfrogging scenario will lead to a greater increase in fixed broadband subscriptions compared to the Current Path forecast, with a difference of almost eight subscriptions per 100 people by 2043. The fixed broadband subscription in Sierra Leone will be higher than the average of 29 subscriptions for low-income African countries.
Mobile broadband refers to wireless Internet access delivered through cellular towers to computers and other digital devices.
Sierra Leone had mobile broadband subscriptions of 28.6 per 100 people in 2019 – greater than the average of 22.9 for low-income countries on the continent. Although between 2024 and 2028 mobile broadband subscriptions in the Leapfrogging scenario rise above the Current Path, in the long term, the Leapfrogging scenario and the Current Path forecast converge and the gap narrows. By 2043, mobile broadband subscriptions in the Leapfrogging scenario increase to 154.7 per 100 people, only 2.8 higher than in the Current Path forecast and above the average of 133.9 for African low-income countries.
In 2019, 1.8 million people in Sierra Leone (22.5% of the total population) had access to electricity. This is far below the average of 32.2% for low-income countries in Africa. The country has a rural–urban disparity in terms of access to electricity. About 44.3% of people in urban centres had access to electricity, compared to the paltry 6.9% of those in the rural areas in 2019. In the Leapfrogging scenario, it is projected that by 2043, about 56.8% of Sierra Leoneans (7.4 million people), will have access to electricity. This is below the projected average for low-income countries but higher than the 45.6% (reflecting 6 million people) projected on the Current Path forecast, signifying that the Leapfrogging scenario can provide access to electricity to an additional 1.5 million people. By 2043, 68.5% and 74.4% of urban dwellers in Sierra Leone will have access to electricity in the Current Path forecast and the Leapfrogging scenario, respectively. However, in the case of rural dwellers, 40.5% and 24.3% will have access to electricity by 2043 based on the Leapfrogging scenario and the Current Path forecast, respectively.
Sierra Leone’s GDP per capita is projected to increase from US$1 601 in 2019 to US$2 674 in 2043 in the Leapfrogging scenario. This represents an increase of US$210 compared to the Current Path forecast in 2043. However, this still falls below the average of US$3 790 for low-income countries in Africa.
In the Leapfrogging scenario, the number of poor people in 2043 is projected to be 5 million, representing 38.3% of the population. This projection is lower than the 5.5 million poor people estimated in the Current Path forecast in the same year, which suggests that the number of poor people in the Leapfrogging scenario is about 500 000 fewer than the Current Path forecast in 2043. The number of poor people projected in the Leapfrogging scenario is still 13.2 percentage points higher than the average for low-income African countries in 2043.
The Free Trade scenario represents the impact of the full implementation of the African Continental Free Trade Area (AfCFTA) by 2034 through increases in exports, improved productivity and increased trade and economic freedom.
The intervention is explained here in the thematic part of the website.
The trade balance is the difference between the value of a country's exports and its imports. A country that imports more goods and services than it exports in terms of value has a trade deficit, while a country that exports more goods and services than it imports has a trade surplus.
Sierra Leone, like many African economies, is a net importer of goods and services. In 2019, Sierra Leone’s trade deficit represented 24.5% of GDP, signifying that the country has a relatively high trade deficit. Main imports include machinery and transport equipment (representing about 50% of imports), fuel (representing about 50% of imports) and foodstuffs such as rice. The trade balance will improve until it peaks at 17.8% in 2023 after which it will start to decline. From 2024 to 2034, the Free Trade scenario leads to a much quicker improvement in the trade deficit compared to the Current Path forecast. However, the situation is reversed afterwards such that by 2043, the projected trade deficit of 33.3% in the Free Trade scenario is 4.1 percentage points higher than the estimated 29.2% in the Current Path forecast.
This suggests that the full implementation of the AfCFTA can improve the trade balance of Sierra Leone in the short term. However, in the long term, intense competition from other African countries will reduce Sierra Leone’s exports while imports will increase as a result of free trade. Throughout the forecast period, Sierra Leone’s trade deficit as a percentage of GDP is higher than the average for low-income African countries, and by 2043, Sierra Leone’s trade deficit will be 26.3 percentage points of GDP higher than the average for low-income African countries.
The GDP per capita for Sierra Leone is estimated to increase to US$2 756 by 2043 in the Free Trade scenario, which is US$292 more than the projections of the Current Path in 2043. This means that if Sierra Leone takes advantage of the AfCFTA to increase trade and productivity, it can raise its GDP per capita above the Current Path forecast in 2043. Nonetheless, the average GDP per capita of US$3 790 for low-income African countries is US$1 034 higher than the projected value for Sierra Leone in the Free Trade scenario.
By 2043, the number of people living below the poverty line of US$1.90 per day will be about 4.2 million people, representing 32.1% of the population. This is 10 percentage points lower than the Current Path forecast, meaning that the Free Trade scenario has 1.3 million fewer poor people than the Current Path forecast by 2043. The proportion of poor people projected in the Free Trade scenario is still higher than the average for low-income countries in Africa.
The Financial Flows scenario represents a reasonable but ambitious increase in worker remittances and aid flows to poor countries, and an increase in the stock of foreign direct investment (FDI) and additional portfolio investment inflows to middle-income countries. We also reduced outward financial flows to emulate a reduction in illicit financial outflows.
The intervention is explained here in the thematic part of the website.
Sierra Leone is one of the most aid-dependent countries in the world, with total aid accounting for 50% of government revenue. Top bilateral donors to Sierra Leone include the UK, the US, Germany and Japan, while multinational donors like the UNDP, the World Bank, the UK Department for International Development (DFID) and the US Agency for International Development also support the country. For instance, in November 2018, the country received an IMF Extended Credit Facility (ECF) totalling US$172.1 million. The total foreign aid received by Sierra Leone in 2019 was 20.8% of GDP, amounting to US$594.64 million — far greater than the average of 8.6% for low-income countries in Africa. Although foreign aid to Sierra Leone in absolute terms is projected to rise, foreign aid as a percentage of GDP is expected to decline such that by 2043, the total foreign aid received by the country is projected to be 14% of GDP in the Financial Flows scenario and 12.5% of GDP in the Current Path forecast. This suggests that in the Financial Flows scenario, foreign aid as a percentage of GDP is above the Current Path forecast in 2043. Notwithstanding, both of these projections are still higher than the average for low-income African countries.
Sierra Leone’s total FDI in 2019 amounted to about 8% of GDP, which is higher than the average of 4.3% for low-income African countries. However, the high cost of doing business in the country is impeding FDI inflows, as the country is ranked 163 out of 190 on the World Bank’s Ease of doing business, a drop from the 140 rank it obtained in 2015. There are also ongoing disputes with foreign investors especially in the energy, mining and financial sectors which are likely to affect FDI inflows. By 2043, it is projected that the total FDI to the country will be about 7.5% of GDP in the Current Path forecast. In the Financial Flows scenario, FDI is projected to be around 8.4% of GDP in 2043, both of which are above the average for low-income countries on the continent.
In 2019, the total value of remittances that Sierra Leone received amounted to US$0.05 billion, which constituted about 1% of GDP. This is significantly lower than the average for low-income African countries. Both the absolute value of remittance and remittances as a percentage of GDP are projected to increase over the period until 2043 in the Financial Flows scenario. Remittances are projected to increase to US$0.15 billion, representing 1.14% of GDP in 2043 in the Financial Flow scenario. This is below the projected average of 1.3% of GDP projected for low-income countries in Africa. Remittances will decline in the Current Path forecast, such that by 2043 the total value of remittances in the country will be about US$0.13 billion (0.99% of GDP).
Sierra Leone’s GDP per capita is estimated to increase to US$2 570 by 2043 in the Financial Flows scenario. This represents an increase of US$106 over the Current Path projection for the same year. The US$2 570 estimate is also far below the average for low-income countries in Africa, which is projected to be US$3 790 by 2043.
Trade openness will reduce poverty in the long term after initially increasing it due to the redistributive effects of trade. Most African countries export primary commodities and low-tech manufacturing products, and therefore a continental free trade agreement (AfCFTA) that reduces tariffs and non-tariff barriers across Africa will increase competition among countries in primary commodities and low-tech manufacturing exports. Countries with inefficient, high-cost manufacturing sectors might be displaced as the AfCFTA is implemented, thereby pushing up poverty rates. In the long term, as the economy adjusts and produces and exports its comparatively advantaged (lower relative cost) goods and services, poverty rates will decline.
In the Financial Flows scenario, the total number of people projected to live below the poverty line of US$1.90 per day will decline to 5.1 million in 2043, representing 38.6% of the total population. This estimate constitutes a reduction of about 400 000 poor people compared to the Current Path in the same year. However, it is still much higher than the average of 25.2% of the total population for low-income countries in Africa.
The Infrastructure scenario represents a reasonable but ambitious increase in infrastructure spending across Africa, focusing on basic infrastructure (roads, water, sanitation, electricity access and ICT) in low-income countries and increasing emphasis on advanced infrastructure (such as ports, airports, railway and electricity generation) in higher-income countries.
Note that health and sanitation infrastructure is included as part of the Health/WaSH scenario and that ICT infrastructure and more rapid uptake of renewables are part of the Leapfrogging scenario. The interventions there push directly on outcomes, whereas those modelled in this scenario increase infrastructure spending, indirectly boosting other forms of infrastructure, including that supporting health, sanitation and ICT.
The intervention is explained here in the thematic part of the website.
The total number of people with access to electricity in Sierra Leone is 1.8 million (22.5% of the population) and is expected to increase to 8.3 million (63.2% of the population) in 2043 in the Infrastructure scenario. This increase exceeds the projected value of 6 million people (45.6% of the population) in the Current Path forecast. It is also above the projected average of 60.5% for low-income African countries. In terms of rural–urban dichotomy, by 2043, it is projected that 68.5% and 77.5% of urban dwellers will have access to electricity in the Current Path forecast and the Infrastructure scenario, respectively. However, only 49.8% and 24.3% of rural dwellers in the Infrastructure scenario and in the Current Path forecast respectively will have access to electricity in 2043, indicating a disparity in access to electricity between urban and rural dwellers in both the Current Path forecast and the Infrastructure scenario.
Indicator 9.1.1 in the Sustainable Development Goals refers to the proportion of the rural population who live within 2 km of an all-season road and is captured in the Rural Access Index.
Accessibility to rural areas is important in spurring the socio-economic development of a country and improving the living standards of rural dwellers. It enables rural dwellers to enjoy amenities from nearby urban areas while allowing urban centres to also benefit from the agricultural products supplied by rural areas more easily. In 2019, 69.3% of all rural dwellers in Sierra Leone resided within 2 km from an all-weather road, which was higher than the average of 43% for low-income African countries. In the Infrastructure scenario, this is expected to rise to 76.2% by 2043, higher than the 72.5% projected in the Current Path forecast and the average of 51% for low-income countries in Africa.
Sierra Leone’s GDP per capita is estimated to rise to US$2 556 by 2043 in the Infrastructure scenario. This is US$92 more than the projection in the Current Path forecast in the same year, but below the average of US$3 790 for low-income countries in Africa.
By 2043, the proportion of the poor population is expected to decline from 49.7% in 2019 to 39.9% in the Infrastructure scenario. This corresponds to 5.2 million poor people in 2043 who will live below the poverty line. Comparing this with the projections in the Current Path suggests that there will be 290 000 fewer poor people in the Infrastructure scenario than in the Current Path forecast for the same year. This will however be higher than the estimated average of 25.2% for low-income countries in Africa.
The Governance scenario represents a reasonable but ambitious improvement in accountability and reduces corruption, and hence improves the quality of service delivery by government.
The intervention is explained here in the thematic part of the website.
As defined by the World Bank, government effectiveness ‘captures perceptions of the quality of public services, the quality of the civil service and the degree of its independence from political pressures, the quality of policy formulation and implementation, and the credibility of the government’s commitment to such policies’.
Chart 51 presents the impact of the interventions in the Governance scenario on government effectiveness.
In 2019, Sierra Leone’s score for government effectiveness quality was 1.3, which was below the average of 1.4 for low-income countries in Africa. In both the Current Path forecast and the Governance scenario, government effectiveness is estimated to improve over the period, although the increase in the Governance scenario is higher than the increase in the Current Path forecast. The projected score for government effectiveness in the Governance scenario by 2043 is 1.81, which is 0.04 more than the projected score in the Current Path forecast. However, this score is 0.08 less than the projected average of low-income countries in Africa.
In the Governance scenario, Sierra Leone’s GDP per capita is projected to increase to US$2 524 in 2043, which is US$60 more than the estimates in the Current Path forecast but lower than the average of US$3 790 for low-income countries on the continent in the same year. This suggests that good governance in the form of reducing corruption, improving the quality of service delivery and accountability can improve growth and income levels compared to the Current Path. Key determinants of growth depend on governance and institutional setting in a country. Authorities in Sierra Leone should improve governance to enhance economic growth and income levels.
The proportion of people living below the poverty line of US$1.90 per day is expected to decline to 40.5% in 2043 in the Governance scenario, though this is far higher than the 25.2% average for low-income African countries by then. It also corresponds to about 220 000 fewer people than the 5.5 million poor people projected in the Current Path forecast for 2043.
This section presents projections for carbon emissions in the Current Path for Sierra Leone and the 11 scenarios. Note that IFs uses carbon equivalents rather than CO2 equivalents.
The total amount of carbon emitted by Sierra Leone in 2019 was 0.52 million tons. The intervention with the greatest impact on carbon emissions is the Agriculture scenario, which will lead to Sierra Leone’s carbon emissions being 2.5 million tons of carbon in 2043. This is followed by the Free Trade and Leapfrogging scenarios with projected carbon emissions of 2.42 million tons and 2.34 million tons, respectively, by 2043. The intervention with the least impact on carbon emissions is the Demographic scenario.
The Combined Agenda 2063 scenario consists of the combination of all 11 sectoral scenarios presented above, namely the Stability, Demographic, Health/WaSH, Agriculture, Education, Manufacturing/Transfers, Leapfrogging, Free Trade, Financial Flows, Infrastructure and Governance scenarios. The cumulative impact of better education, health, infrastructure, etc. means that countries get an additional benefit in the integrated IFs forecasting platform that we refer to as the synergistic effect. Chart 55 presents the contribution of each of these 12 components to GDP per capita in the Combined Agenda 2063 scenario as a stacked area graph.
The synergistic effect of all the scenarios on GDP per capita is estimated to be about US$269.2 in 2043. The scenario with the greatest impact on GDP per capita by 2043 is the Agriculture scenario, followed by the Free Trade scenario, while the scenarios with the least impact on GDP per capita are Health/WaSH and Governance. This suggests that in the long term, the Agriculture and Free Trade scenarios have the greatest potential to improve human and economic development in Sierra Leone.
Whereas Chart 55 presents a stacked area graph on the contribution of each scenario to GDP per capita as well as the additional benefit or synergistic effect, Chart 56 presents only the GDP per capita in the Current Path forecast and the Combined Agenda 2063 scenario.
Sierra Leone’s GDP per capita is estimated to increase to US$4 304 in 2043 in the Combined Agenda 2063 scenario. This is US$1 840 more than the projection based on the Current Path forecast for 2043. Also, Sierra Leone’s GDP per capita in the Combined Agenda 2063 scenario will be US$514 above the average for low-income countries in Africa in 2043.
In the Combined Agenda 2063 scenario, the number of poor people will significantly decline such that by 2043, only 1.3 million Sierra Leoneans, representing 10.3% of the population, will be living below the poverty line. This means that, compared with the Current Path, an additional 3.9 million Sierra Leoneans can be lifted out of extreme poverty in the Combined Agenda 2063 scenario. The projected average poverty rate for low-income African countries by 2043 is higher than that of Sierra Leone in the Combined Agenda 2063 scenario. The proportion of poor people in the Combined Agenda scenario is 14.9 percentage points less than the average for low-income countries in Africa in 2043.
See Chart 8 to view the Current Path forecast of the sectoral composition of the economy.
In the Combined Agenda 2063 scenario, the biggest contributors to GDP in the long term are the service, manufacturing and ICT sectors. By 2043, the service sector will contribute an additional 3.6 percentage points to GDP, which corresponds to an extra US$8.2 billion compared to the Current Path forecast. Also, manufacturing and ICT will contribute an extra US$3.5 billion and US$1.4 billion, respectively; in terms of percentage points, their contribution corresponds to 1.5 and 3 percentage points larger than the Current Path forecast, respectively. The share of agriculture in GDP in the Combined Agenda 2063 is 6 percentage points of GDP lower than the Current Path forecast by 2043, which is equivalent to around US$1.2 billion.
The estimated GDP (MER) for 2043 in the Combined Agenda 2063 scenario in 2043 will be US$27.5 billion, which is higher than the Current Path estimates of US$12.8 billion. This suggests that the size of the Sierra Leone economy in the Combined Agenda 2063 scenario is 115% larger than the Current Path forecast in 2043. The Combined Agenda 2063 scenario shows that a policy push across all the sectors is necessary to achieve inclusive sustained growth and development in Sierra Leone.
The total amount of carbon emitted in Sierra Leone in 2019 was 0.52 million tons. In the Combined Agenda 2063 scenario, the total carbon emitted is projected to rise to 3.3 million tons by 2043. This is higher than the estimates of 2.2 million in the Current Path forecast for 2043, meaning that the Combined Agenda 2063 scenario leads to much greater carbon emissions than the Current Path.
Page information
Contact at AFI team is Enoch Randy Aikins
This entry was last updated on 15 June 2026 using IFs v7.63.
Donors and sponsors


Reuse our work
- All visualizations, data, and text produced by African Futures are completely open access under the Creative Commons BY license. You have the permission to use, distribute, and reproduce these in any medium, provided the source and authors are credited.
- The data produced by third parties and made available by African Futures is subject to the license terms from the original third-party authors. We will always indicate the original source of the data in our documentation, so you should always check the license of any such third-party data before use and redistribution.
- All of our charts can be embedded in any site.
Cite this research
Enoch Randy Aikins (2026) Sierra Leone Development Futures. Published online at futures.issafrica.org. Retrieved from https://futures.issafrica.org/geographic/countries/sierra-leone/ [Online Resource] Updated 15 June 2026.