 Mozambique
Feedback welcome
Our aim is to use the best data to inform our analysis. See our About page for information on the IFs forecasting platform. We appreciate your help and references for improvements via our feedback form.
In this entry, we first describe the Current Path forecast for Mozambique as it is expected to unfold to 2043, the end of the third ten-year implementation plan of the African Union’s Agenda 2063 long-term vision for Africa. The Current Path in the International Futures (IFs) forecasting model initialises from country-level data that is drawn from a range of data providers. We prioritise data from national sources.
The Current Path forecast is divided into summaries on demographics, economics, poverty, health/WaSH and climate change/energy. A second section then presents a single positive scenario for potential improvements in stability, demographics, health/WaSH, agriculture, education, manufacturing/transfers, leapfrogging, free trade, financial flows, infrastructure, governance and the impact of various scenarios on carbon emissions. With the individual impact of these sectors and dimensions having been considered, a final section presents the impact of the Combined Agenda 2063 scenario.
We generally review the impact of each scenario and the Combined Agenda 2063 scenario on gross domestic product (GDP) per person and extreme poverty except for Health/WaSH that uses life expectancy and infant mortality.
The information is presented graphically and supported by brief interpretive text.
All US$ numbers are in 2017 values.
Summary
- Current Path forecast
- Mozambique is classified as a low-income country according to the World Bank’s income classification. The country has significantly improved on many of its key development outcomes over the past two decades but still struggles to meet its human and social development goals. Jump to forecast: Current Path
- Mozambique’s population of 30.3 million makes it the fifth most populous country among its low-income peers. This figure is expected to grow by 24.5 million people in the Current Path forecast, reaching 58.4 million people by 2043. Jump to Demographics: Current Path
- The forecast for economic growth is optimistic: GDP per capita will increase to US$2 897 by 2043, this however remains US$893 per capita below its low-income peers. Jump to Economics: Current Path
- Over the past two decades, economic growth has not kept up with population growth, and the vast majority of the population has not benefited from this growth, resulting in very high poverty rates. With the significant boost to economic growth expected from increased natural gas production, the poverty rate is expected to decrease to 39.7% by 2043 (21.7 million people) below the poverty line. Jump to Poverty: Current Path
- Mozambique has the second largest energy resources in Africa, and its total energy production is expected to exceed 400 million barrels of oil equivalent by 2043. Jump to Carbon emissions/Energy: Current Path
- Sectoral Scenarios
- The Stability scenario will see Mozambique’s GDP per capita grow from US$1 402 in 2019 to US$3 114 in 2043, a US$217 increase over the Current Path forecast. Jump to Stability scenario
- In the Demographic scenario, Mozambique attains the benefits of a demographic dividend seven years earlier than in the Current Path forecast. This is the result of a smaller, ageing population, with 2.7 million fewer people by 2043. Jump to Demographics scenario
- The Health/WaSH scenario reduces infant deaths more quickly compared to the Current Path forecast, lowering the under-five mortality rate to 17 deaths per 1 000 live births by 2043. Jump to Health/WaSH scenario
- The Agriculture scenario will improve yield per hectare by 2043 with 5.6 metric tons compared to the Current Path In this scenario, Mozambique can achieve a production surplus by 2030 and produce 33.8 million metric tons more by 2043 compared to the Current Path forecast. Jump to Agriculture scenario
- By 2043, GDP per capita is expected to increase to US$2 998 in the Education scenario, compared to US$2 897 in the Current Path forecast. Mozambique would continue to lag behind its income peers, with the GDP per capita income gap growing throughout the forecast horizon. Jump to Education scenario
- In the Manufacturing/Transfers scenario, social welfare expenditure will increase to US$3 billion by 2043. This is 66.7% higher than in the Current Path forecast but still 10.6 percentage points lower than the increase its low-income peers will experience. Jump to Manufacturing/Transfers scenario
- In the Leapfrogging scenario, mobile broadband increases from 43.9 subscriptions per 100 people in 2019 to 125.4 by 2043. This is 2.7 subscriptions more than in the Current Path forecast but lower than the low-income Africa average of 137.4 subscriptions per 100 people. Jump to Leapfrogging scenario
- By 2043, the poverty rate will be 3.4 percentage points lower in the Free Trade scenario than in the Current Path forecast, lifting an additional 1.9 million people out of extreme poverty. Jump to Free Trade scenario
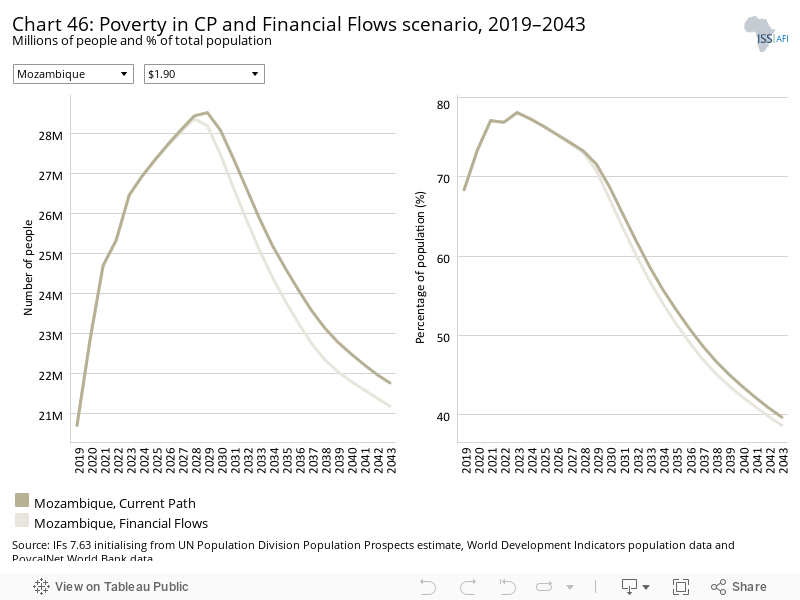
- By 2043, the poverty rate will drop by 1 percentage point from 39.7% in the Current Path forecast to 38.7% in the Financial Flows scenario, lifting an additional 580 000 people out of extreme poverty. Jump to Financial Flows scenario
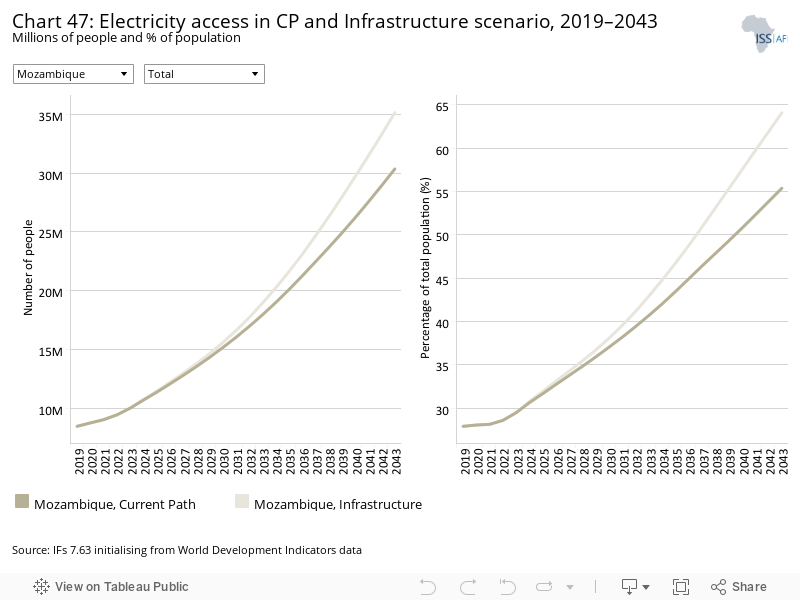
- Electricity access is projected to reach 64.1% by 2043 in the Infrastructure scenario, resulting in 35.2 million people having access to electricity. This scenario will result in an additional 4.8 million people gaining access to electricity compared to the Current Path forecast. Jump to Infrastructure scenario
- The Governance scenario has a very small impact on Mozambique’s GDP per capita, increasing it by US$57 by 2043 compared to the Current Path forecast. Jump to Governance scenario
- Mozambique’s carbon emissions are projected to increase most in the Agriculture scenario, emitting an additional 11.1 million tons of carbon by 2043 compared to 2019. Jump to Impact of scenarios on carbon emissions
- Combined Agenda 2063 scenario
- The Combined Agenda 2063 scenario has the potential to raise GDP per capita to US$4 734 by 2043, US$1 837 above the Current Path forecast. Jump to Combined Agenda 2063 scenario
- Mozambique’s carbon emissions were 3 million tons in 2019 and are projected to increase to 17.7 million tons by 2043 in the Combined Agenda 2063 scenario. This is an increase of 5 million tons above the Current Path forecast—the result of robust economic growth and a substantial increase in agricultural production. Jump to Combined Agenda 2063 scenario
All charts for Mozambique
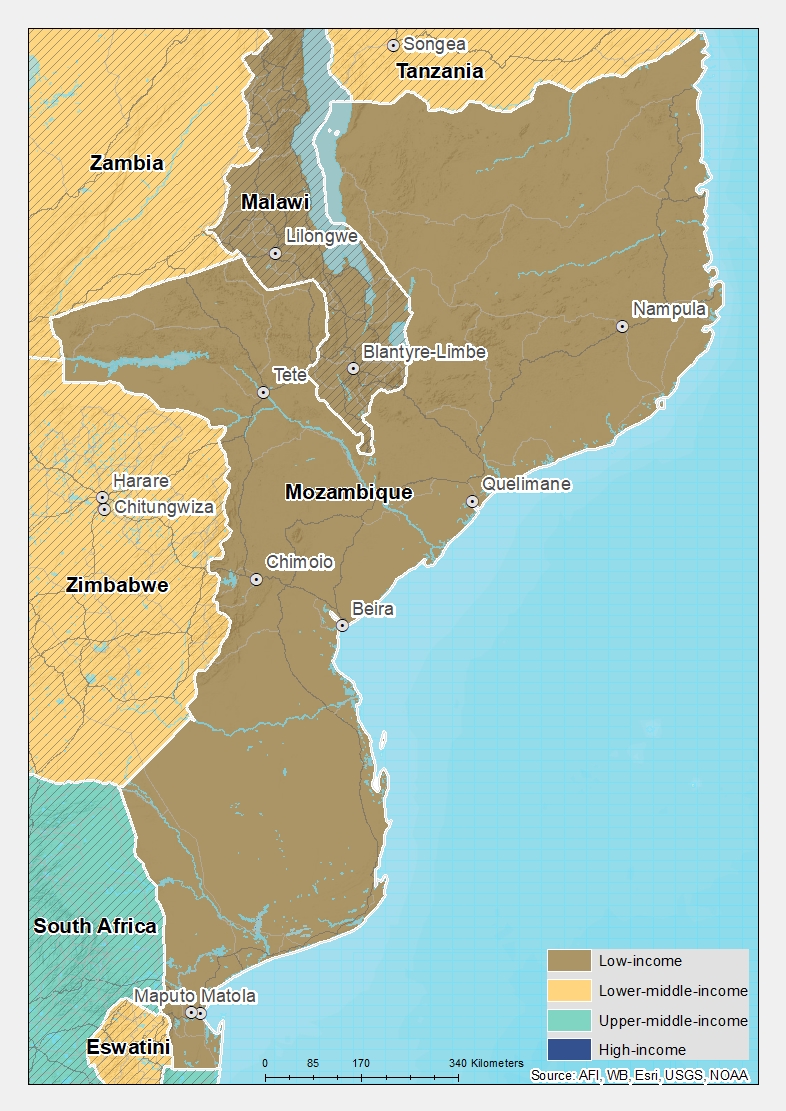
- Chart 1: Political map of Mozambique
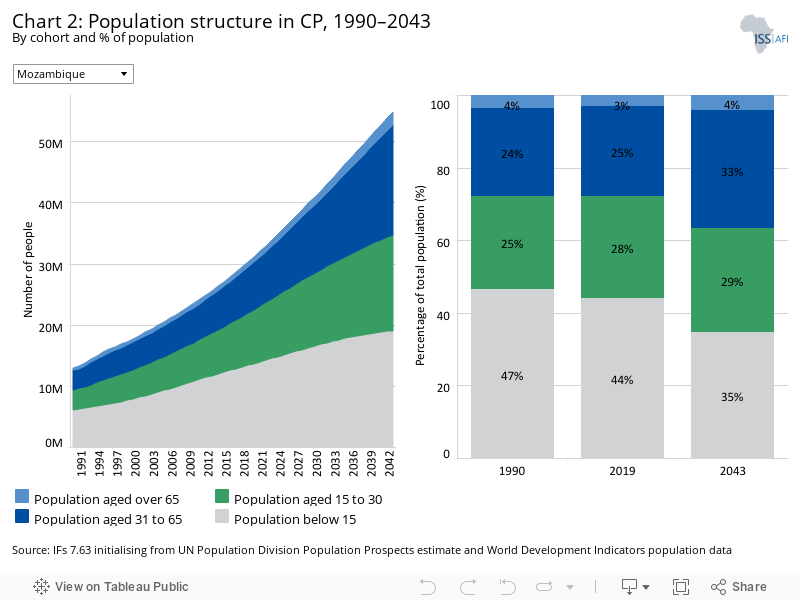
- Chart 2: Population structure in Current Path forecast, 1990 to 2043
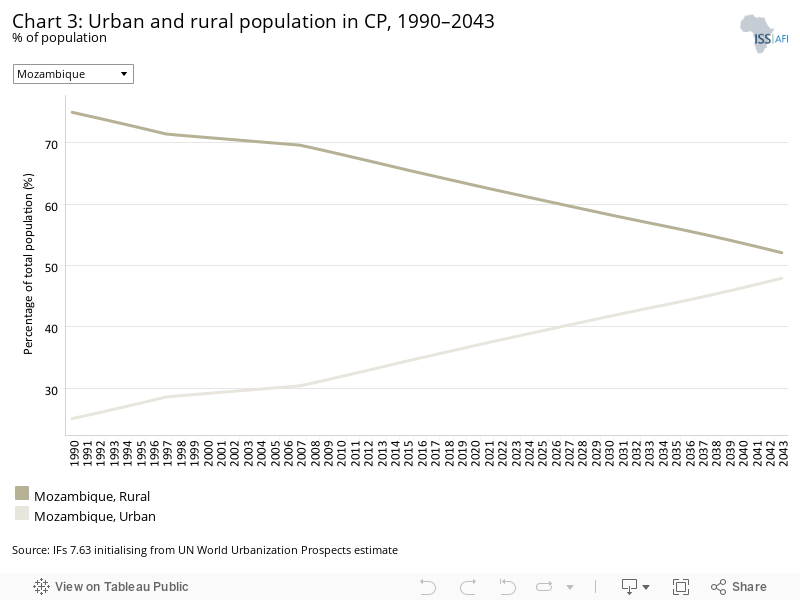
- Chart 3: Urban and rural population in Current Path forecast, 1990 to 2043
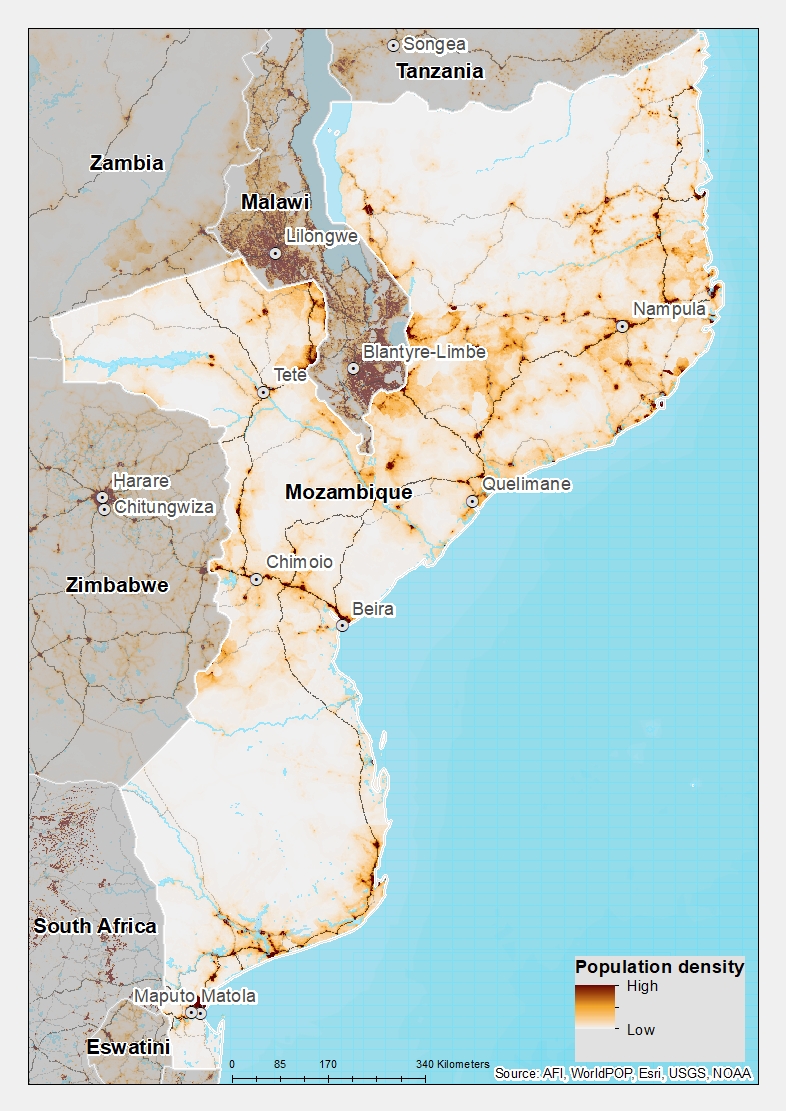
- Chart 4: Population density map for 2019
- Chart 5: GDP in Current Path forecast, 1990 to 2043
- Chart 6: GDP per capita in Current Path forecast, 1990 to 2043
- Chart 7: Informal sector value in Current Path forecast, 2015 to 2043
- Chart 8: Value added by sector in Current Path forecast, 2015 to 2043
- Chart 9: Agriculture production and demand in Current Path forecast, 1990 to 2043
- Chart 10: Poverty in Current Path forecast, 2015 to 2043
- Chart 11: Energy production by type in CP, 1990–2043
- Chart 12: Carbon emissions in CP, 1990–2043
- Chart 13: Governance security in CP and Stability scenario, 2019–2043
- Chart 14: GDP per capita in CP and Stability scenario, 2019–2043
- Chart 15: Poverty in CP and Stability scenario, 2019–2043
- Chart 16: Demographic dividend in CP and Demog scenario, 2019–2043
- Chart 17: Infant mortality in CP and Demog scenario, 2019–2043
- Chart 18: GDP per capita in CP and Demog scenario, 2019–2043
- Chart 19: Poverty in CP and Demog scenario, 2019–2043
- Chart 20: Life expectancy in CP and Health/WaSH scenario, 2019–2043
- Chart 21: Infant mortality in CP and Health/WaSH scenario, 2019–2043
- Chart 22: Yield/hectare in CP and Agric scenario, 2019–2043
- Chart 23: Agriculture imports in CP and Agric scenario, 2019–2043
- Chart 24: GDP per capita in the CP and Agric scenario, 2019–2043
- Chart 25: Poverty in CP and Agric scenario, 2019–2043
- Chart 26: Mean years of education in CP and Educ scenario, 2019–2043
- Chart 27: Education quality in CP and Educ scenario, 2019–2043
- Chart 28: GDP per capita in CP and Educ scenario, 2019–2043
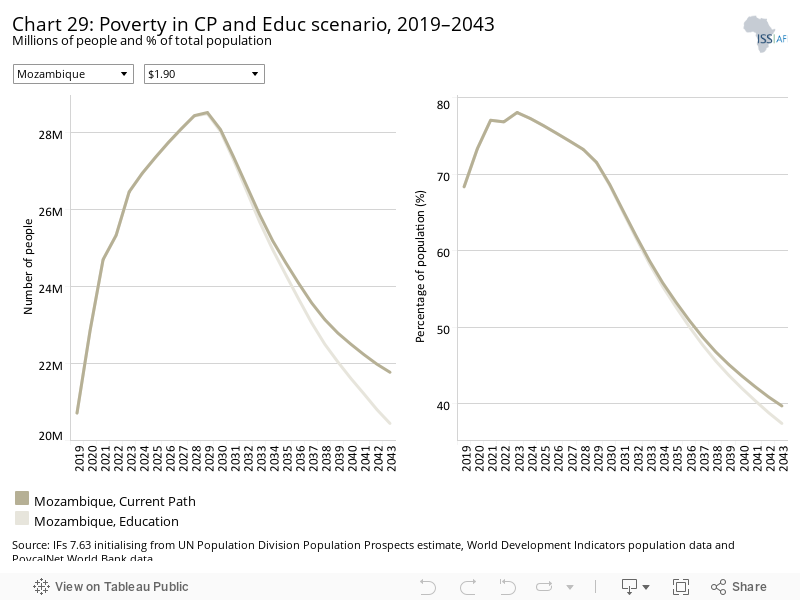
- Chart 29: Poverty in CP and Educ scenario, 2019–2043
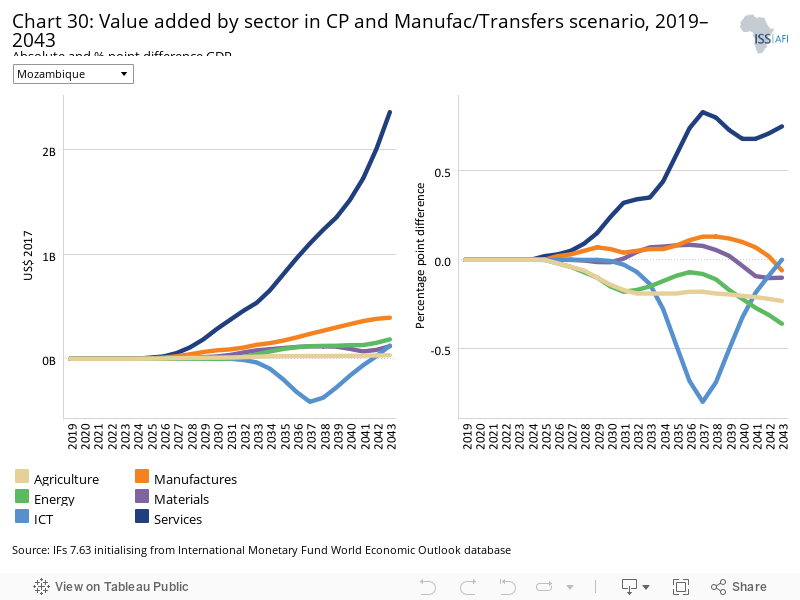
- Chart 30: Value added by sector in CP and Manufac/Transfers scenario, 2019–2043
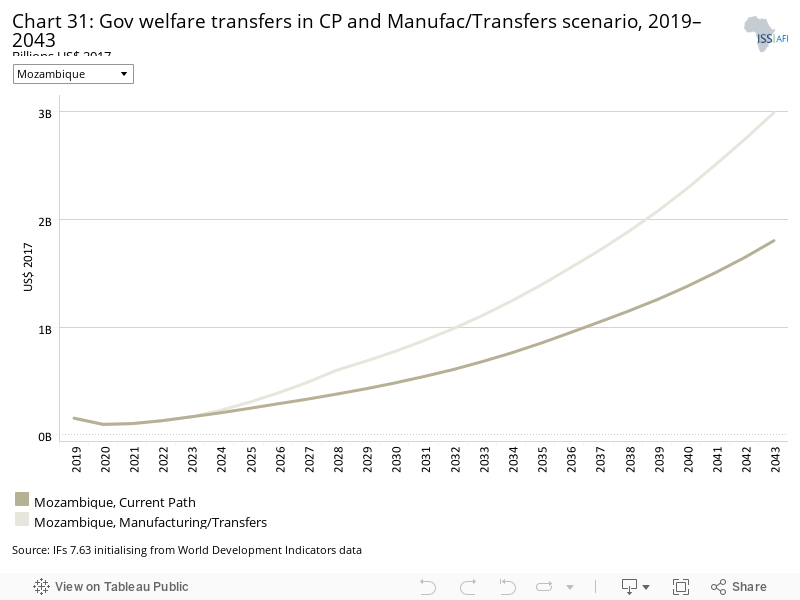
- Chart 31: Gov welfare transfers in CP and Manufac/Transfers scenario, 2019–2043
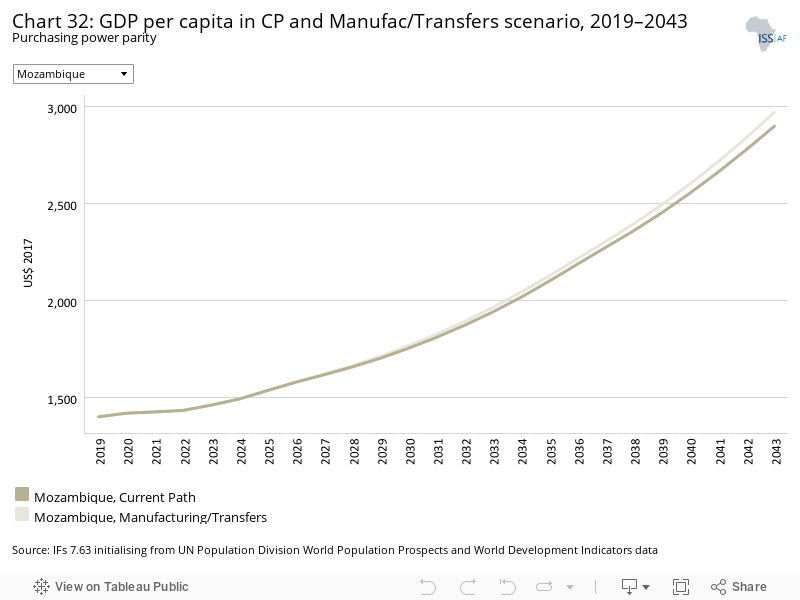
- Chart 32: GDP per capita in CP and Manufac/Transfers scenario, 2019–2043
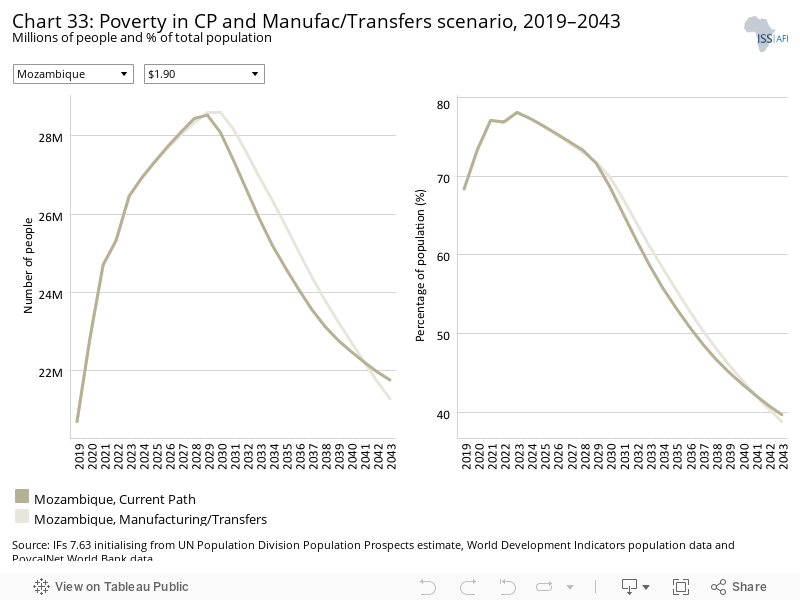
- Chart 33: Poverty in CP and Manufac/Transfers scenario, 2019–2043
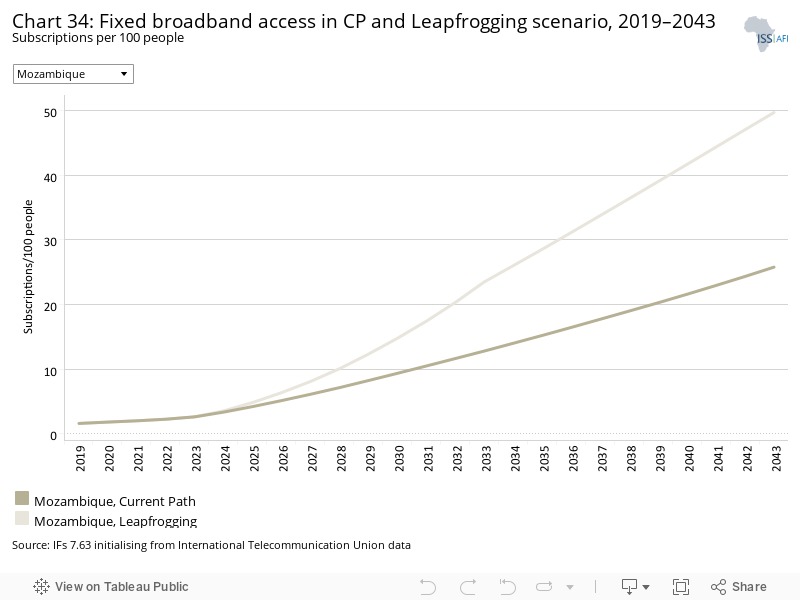
- Chart 34: Fixed broadband access in CP and Leapfrogging scenario, 2019–2043
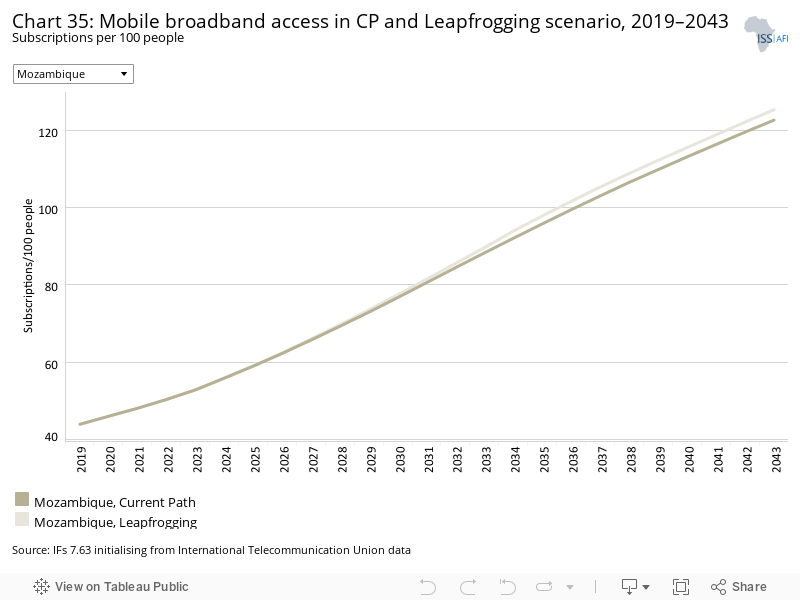
- Chart 35: Mobile broadband access in CP and Leapfrogging scenario, 2019–2043
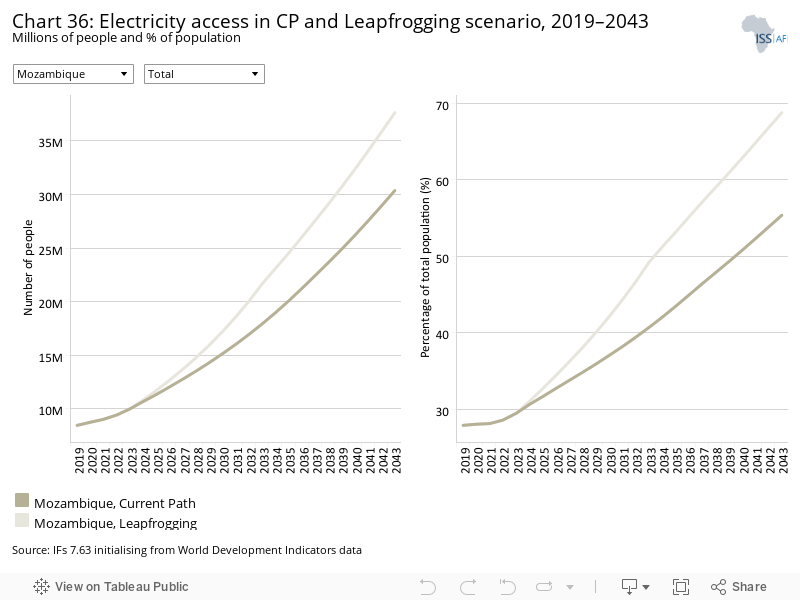
- Chart 36: Electricity access in CP and Leapfrogging scenario, 2019–2043
- Chart 37: GDP per capita in CP and Leapfrogging scenario, 2019–2043
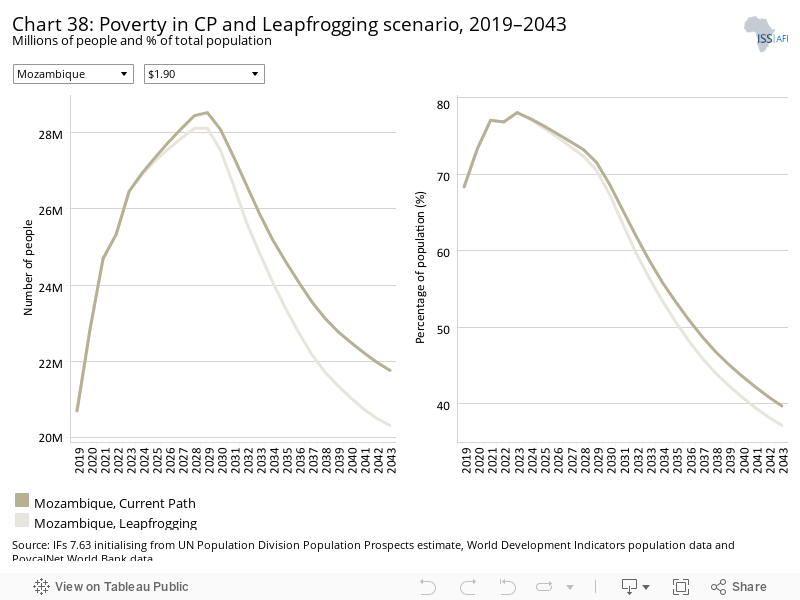
- Chart 38: Poverty in CP and Leapfrogging scenario, 2019–2043
- Chart 39: Trade balance in CP and Free Trade scenario, 2019–2043
- Chart 40: GDP per capita in CP and Free Trade scenario, 2019–2043
- Chart 41: Poverty in CP and Free Trade scenario, 2019–2043
- Chart 42: Foreign aid in CP and Financial Flows scenario, 2019–2043
- Chart 43: Inflow of FDI in CP and Financial Flows scenario, 2019–2043
- Chart 44: Remittances in CP and Financial Flows scenario, 2019–2043
- Chart 45: GDP per capita in CP and Financial Flows scenario, 2019–2043
- Chart 46: Poverty in CP and Financial Flows scenario, 2019–2043
- Chart 47: Electricity access in CP and Infrastructure scenario, 2019–2043
- Chart 48: Rural road access in CP and Infrastructure scenario, 2019–2043
- Chart 49: GDP per capita in CP and Infrastructure scenario, 2019–2043
- Chart 50: Poverty in CP and Infrastructure scenario, 2019–2043
- Chart 51: Gov effectiveness in CP and Governance scenario, 2019–2043
- Chart 52: GDP per capita in CP and Governance scenario, 2019–2043
- Chart 53: Poverty in CP and Governance scenario, 2019–2043
- Chart 54: Carbon emissions in CP and scenarios, 2019–2043
- Chart 55: GDP per capita in CP and scenarios, 2019–2043
- Chart 56: GDP per capita in CP and Combined scenario, 2019–2043
- Chart 57: Poverty in CP and Combined scenario, 2019–2043
- Chart 58: Value added by sector in CP and Combined scenario, 2019–2043
- Chart 59: GDP in CP and Combined scenario, 2019–2043
- Chart 60: Carbon emissions in CP and Combined scenario, 2019–2043
This page provides an overview of the key characteristics of Mozambique along its likely (or Current Path) development trajectory. The Current Path forecast from the International Futures forecasting (IFs) platform is a dynamic scenario that imitates the continuation of current policies and environmental conditions. The Current Path is therefore in congruence with historical patterns and produces a series of dynamic forecasts endogenised in relationships across crucial global systems. We use 2019 as a standard reference year and the forecasts generally extend to 2043 to coincide with the end of the third ten-year implementation plan of the African Union’s Agenda 2063 long-term development vision.
Mozambique is classified as a low-income country according to the World Bank’s income classification and is located in the subtropical climate of the east coast of southern Africa. The country borders Malawi, Tanzania, Zambia, Zimbabwe, South Africa and Eswatini (Chart 1) and is a member of the Southern African Development Community (SADC).
Mozambique has significantly improved on many of its key development outcomes over the past two decades. [1ISS Africa, Prospects and Challenges: Mozambique’s Growth and Human Development Outlook to 2040, 2017] Since the beginning of the century, agricultural production has more than doubled, infant mortality has halved, the children stunting rate has decreased by 10% and life expectancy has increased by nearly 11 years.
However, the country still struggles to reach its human and social development goals. While the country has seen steady economic growth, this has not translated to significantly better service accessibility. Mozambique has the highest incidences of infant and child mortality as well as the highest poverty rates among its neighbours.
The location of Mozambique next to the warm Indian ocean also subjects the country to intense weather-related hazards, such as cyclones and cyclic droughts. Flooding is a regular occurrence due to the draining of nine international river basins throughout its 2 500 km coastline. These international rivers contribute 50% of Mozambique’s total volume of water runoff. [2AfCAP, Climate Adaptation: Risk Management and Resilience Optimisation for Vulnerable Road Access in Africa, February 2019] Since 2000, the country has been subjected to 12 devastating tropical cyclones, nine severe droughts and 20 flooding disasters that have affected more than 19 million people. [3EM-DAT, 2021, www.emdat.be/] This abnormally high exposure to weather-related hazards, combined with 39% of the population living below 100 m elevation, [4CL Davis-Reddy and K Vincent, 2017, Climate Risk and Vulnerability: A Handbook for Southern Africa] makes this one of the most vulnerable and susceptible countries in the world to natural disasters.
Mozambique faces vast development challenges in the years ahead: key among these are chronic under development, mass migration and displacement, and the ongoing insurgency within its northern region. The country does however boast great potential with its large gas reserves and natural resource endowments. This will be unpacked in the subsequent sections.
Mozambique’s population of 30.3 million in 2019 makes it the fifth largest country among low-income countries in Africa. In the Current Path forecast, this figure is expected to reach 54.8 million people by 2043 (Chart 2)—growth of 24.5 million people in the next 24 years. The country has a very large youthful population with 44.1% of its population below the age of 15 years. This accounted for 13.4 million children in 2019.
The population growth rate is expected to gradually decrease from 2.8% in 2019, but the total fertility rate will remain above the 2.1 births per woman replacement level throughout the next two decades. While the median age is expected to increase from 17.5 years in 2019 to 22.4 by 2043, the large youth bulge will persist throughout, resulting in 19 million children (34.7% of the population) by 2043. Such a large youthful population in the absence of structured economic growth, combined with the current instability in the northern provinces and endemic poverty, can result in ongoing instability and contribute to further social and political conflict.
While the labour force is forecast to increase from 13 million people in 2019 to 28 million by 2043, the country is not expected to reap the benefits of a demographic dividend until closer to the middle of the century. Declining household sizes coupled with the country’s young and growing population will undoubtedly place significant pressure on land use and natural resource management. This rapid growth will test the government’s ability to provide critical basic infrastructure and human services in the decades to come. [5ISS Africa, Prospects and Challenges: Mozambique’s Growth and Human Development Outlook to 2040, 2017]
In 2019, there were 11 million people (36.4 % of the population) living in urban areas throughout Mozambique. This is 5.4 percentage points higher than the average for low-income Africa, placing it fourth among its peers. The 19.3 million people, 63.6% of the population, who live in underserved rural areas are largely dependent on rain-fed subsistence agriculture. Urbanisation is set to continue at a rapid rate and it is forecast that 47.9% of the population, 26.3 million people, will live in urban settlements by 2043 (Chart 3). The 15 million additional urban dwellers will place significant strain on resources, requiring authorities to plan for and provide enough safe land for the expansion of cities.
Rural communities in Mozambique struggle with endemic poverty, lack of access to basic services, poor infrastructure, isolation and frequent exposure to severe weather-related hazards. [6AfCAP, Climate Adaptation: Risk Management and Resilience Optimisation for Vulnerable Road Access in Africa, February 2019] Cities are thus perceived as safe and viable migration options as many people seek access to a higher quality of living. The expected growth in city size will have to be managed and planned for in a sustainable manner to avoid simultaneous growth in informal settlements.
Mozambique’s population distribution reflects a history of dependency on subsistence farming, as the majority of the rural population are concentrated on rich soil deposits from the various river basins draining into the Indian ocean—areas good for agriculture. The country’s population is settled on approximately 800 000 km2 of land translating to a density of 0.39 people per hectare.
Noticeable rural clusters are observed towards the south following a northerly direction along the coast, the central area next to accessible inland routes and perennial rivers, and the north central lowlands. The main urban areas of Maputo, Matola, Beira, Nampula, Chimoio, Nacala, Quelimane and Tete are connected by a sparse road network that is frequently affected by floods and tropical cyclones.
In the Current Path forecast, population density is likely to increase to 0.7 people per hectare by 2043, with 9.3 million more people living in dense clusters of rural spaces.
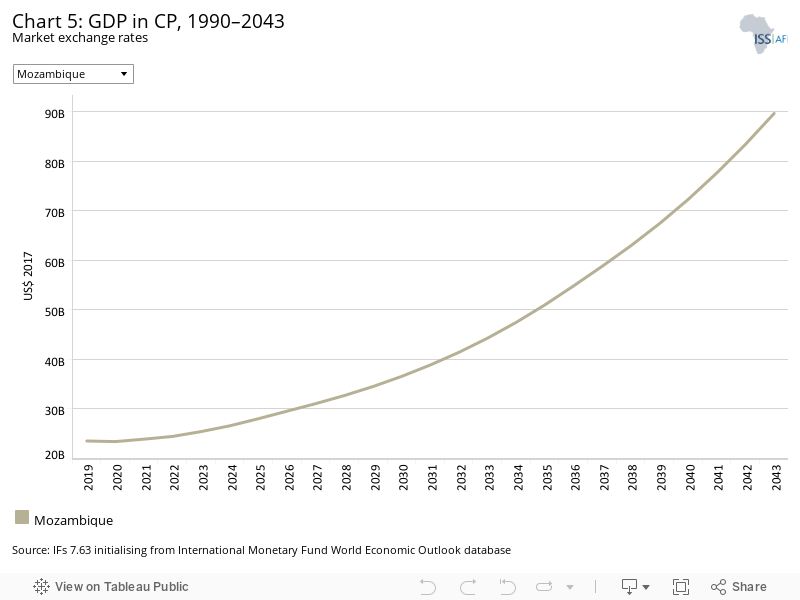
Mozambique averaged a GDP growth rate of 7% per annum between 1995 and 2015. [7ISS Africa, Prospects and Challenges: Mozambique’s Growth and Human Development Outlook to 2040, 2017] This growth measured two percentage points higher than the average for low-income African countries and was the highest among the region in this time period. The growth was stimulated by the recovery from the civil war, renewed resource exploitation, aluminium smelting, electricity production expansions and significant foreign aid inflows. The result was Mozambique’s GDP growing from US$3.7 billion in 1990 to US$23.5 billion in 2019 (Chart 5).
However, this growth did not benefit the vast majority of citizens and the country continues to battle with very low levels of human development, ranking third lowest in the world in the UN’s Human Development Index. [8ISS Africa, Prospects and Challenges: Mozambique’s Growth and Human Development Outlook to 2040, 2017] The COVID-19 pandemic adversely impacted economic activity with negative growth rates in 2020. This retraction came on the back of the country attempting to recover from its ‘hidden debt’ scandal exposed in 2016.
In the Current Path forecast, the growth rates are expected to recover and GDP is forecast to grow substantially to US$89.6 billion by 2043, with growth rates above 7% from 2033 onwards. This sustained growth rate will keep Mozambique’s GDP in fifth position among its low-income African peers throughout the forecast horizon.
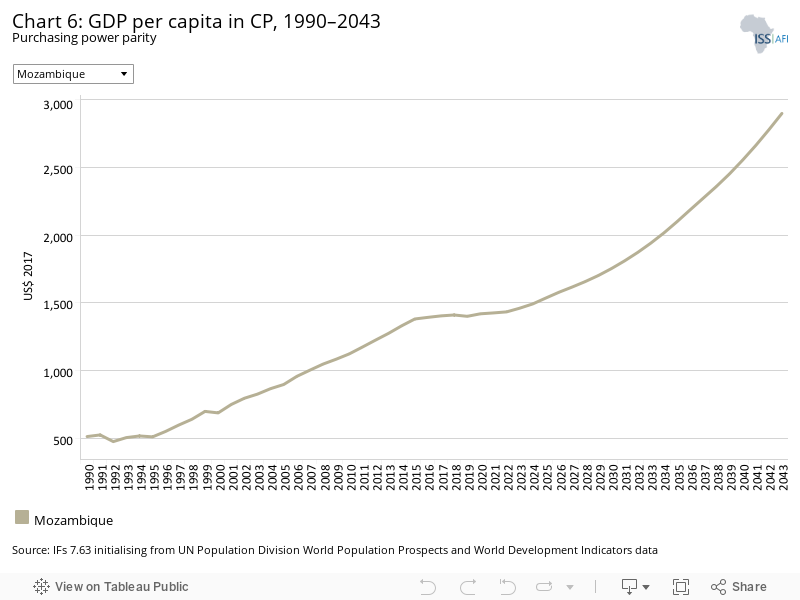
Although many of the charts in the sectoral scenarios also include GDP per capita, this overview is an essential point of departure for interpreting the general economic outlook of Mozambique.
In 1985, Mozambique ranked 21st in GDP per capita among its 23 low-income African peers. The country substantially improved this position, ranking 16th in 2019 with a value of US$1 402, but this is still US$258 below the average for its income peers. The gap has narrowed from US$617 in 1990 but remains a persistent problem.
In the Current Path forecast, the country is expected to rank 14th among low-income countries in Africa by 2043 with a GDP per capita of US$2 897 (Chart 6). Although the forecast for economic growth is optimistic, it will not keep up with projected population growth and the gap between Mozambique and the average for low-income Africa will grow to US$893 by 2043.
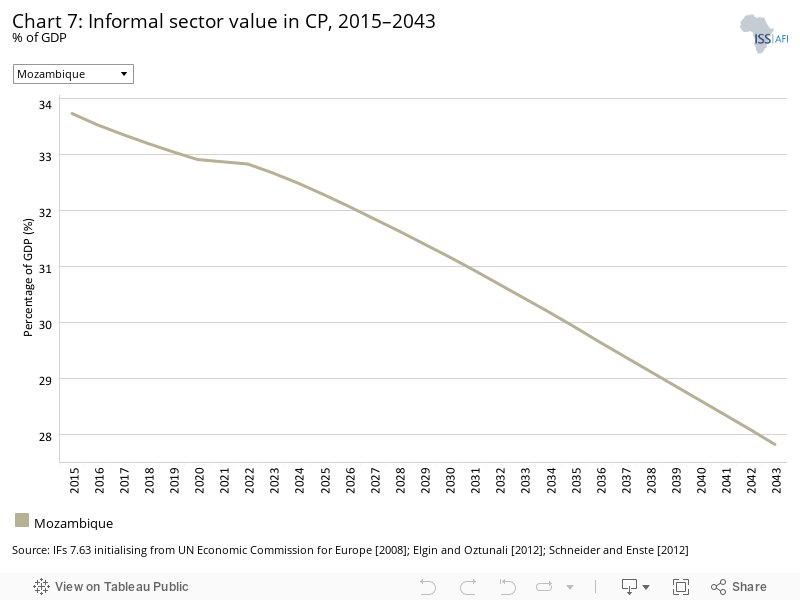
Mozambique, as with other low-income developing countries, has a very large informal sector. In 2019, the size of the informal economy was estimated at 33.1% of GDP, amounting to a value of US$7.2 billion. This is 3 percentage points higher than the average for low-income economies in Africa. In 2019, 65% of Mozambique’s labour force worked in the informal economy, accounting for 3.7 million people, most of whom worked in the agricultural sector.
In Current Path forecast, this value is likely to increase to 10 million informal workers by 2043. It is also forecast that the value of the informal sector as a per cent of GDP will decline to 27.8%, amounting to a value of US$22.8 billion, nearly 2 percentage points higher than its income peers.
Transitioning to a more formal economy is a priority for the government. This could go a long way in raising the quality of living through minimum wages, offering maternity protection and other social security measures. However, a study released by the World Bank Group in 2021 suggests that only high-performing informal firms with a high resemblance to the formal sector would benefit from formalisation, while others would benefit more from a diversified approach ranging from social protection policies and improvement of skills to other initiatives such as business practice training. [9G Aga et al., Informal Firms in Mozambique Status and Potential, June 2021]
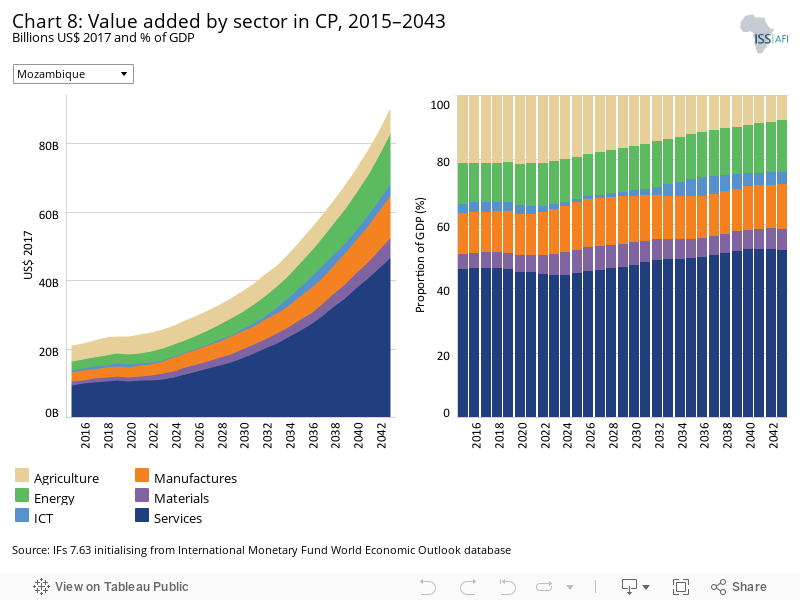
The IFs platform uses data from the Global Trade and Analysis Project (GTAP) to classify economic activity into six sectors: agriculture, energy, materials (including mining), manufactures, services and information and communications technology (ICT). Most other sources use a threefold distinction between only agriculture, industry and services with the result that data may differ.
Chart 8A displays the contribution of each sector as a per cent of GDP and Chart 8B displays the value-added contribution per sector in US$ for 2017.
At 46.1% in 2019 (US$11 billion), the service sector (typically low value-added services) makes up the largest percentage of GDP contribution by sector. The service sector is expected to remain the dominant contributor, growing to 51.8% (valued at US$46 billion) by 2043. This continued growth is in line with patterns observed through much of Africa’s low-income economies.
The agricultural sector (mostly subsistence agriculture) is currently the second largest contributor to the economy at 20.9% (valued at US$4.9 billion) in 2019 and is expected to decline to 7.8% (valued at US$7 billion) by 2043. This shift will signify the ongoing structural transformation of Mozambique’s economy. The manufacturing sector is expected to grow by 1 percentage point from 12.8% in 2019 to 13.8% by 2043, increasing the GDP contribution of this sector from US$3 billion to US$12 billion. The energy sector is likely to grow from 12.4% in 2019 to 16.1% by 2043.
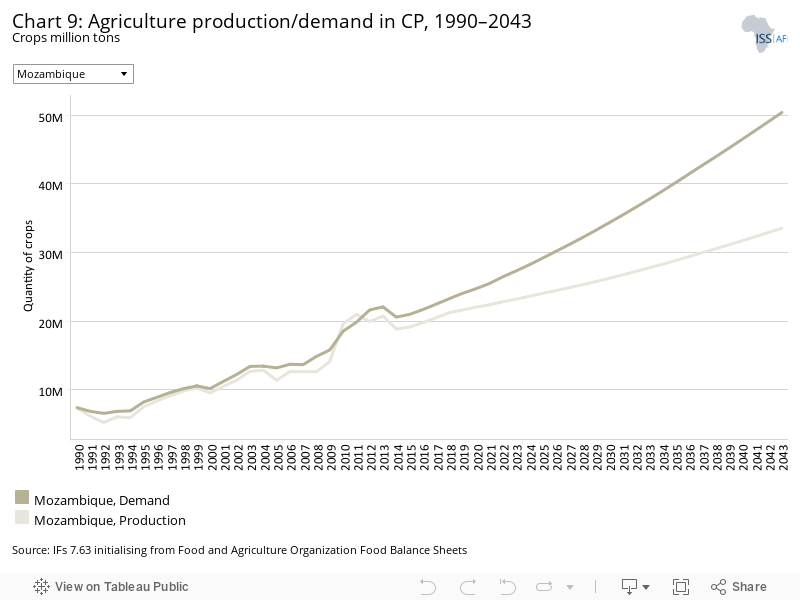
The data on agricultural production and demand in the IFs forecasting platform initialises from data provided on food balances by the Food and Agriculture Organization (FAO). IFs contains data on numerous types of agriculture but aggregates its forecast into crops, meat and fish, presented in million metric tons. Chart 9 shows agricultural production and demand as a total of all three categories.
Mozambique’s agricultural sector is dominated by subsistence rain-fed agriculture that is predominantly practised on smallholdings. At the end of the 1980s, agriculture contributed nearly half of the country’s GDP. Despite its gradual decline over the past three decades, the sector remains a vital source of income and subsistence to communities. More than half of Mozambique’s labour force is directly employed in the agricultural sector, with a fifth of GDP attributable to the sector.
Mozambique has great agricultural potential but the sector is plagued by low labour productivity and recurring droughts and flooding. In 2019, the country produced 21.6 million metric tons of agricultural produce, 94% of which were crops. Agricultural losses remain very high and an estimated 10% is lost due to poor processing and insufficient transport and storage infrastructure. Food security remains a great concern for the country.
The demand for agricultural produce exceeded production by 2.4 million metric tons in 2019. This production and demand gap is likely to persist in the Current Path forecast. By 2043, agricultural production is forecast to be 33.5 million metric tons and demand would exceed 50 million metric tons, translating to a 16.9-million- metric-ton shortfall. This paints a picture of growing food insecurity amidst a rapidly expanding population and is a similar pattern observed in other low-income countries across Africa.
There are numerous methodologies and approaches to defining poverty. We measure income poverty and use GDP per capita as a proxy. In 2015, the World Bank adopted the measure of US$1.90 per person a day (in 2011 international prices), also used to measure progress towards the achievement of Sustainable Development Goal 1 of eradicating extreme poverty. To account for extreme poverty in richer countries occurring at slightly higher levels of income than in poor countries, the World Bank introduced three additional poverty lines in 2017:
- US$3.20 for lower middle-income countries
- US$5.50 for upper middle-income countries
- US$22.70 for high-income countries.
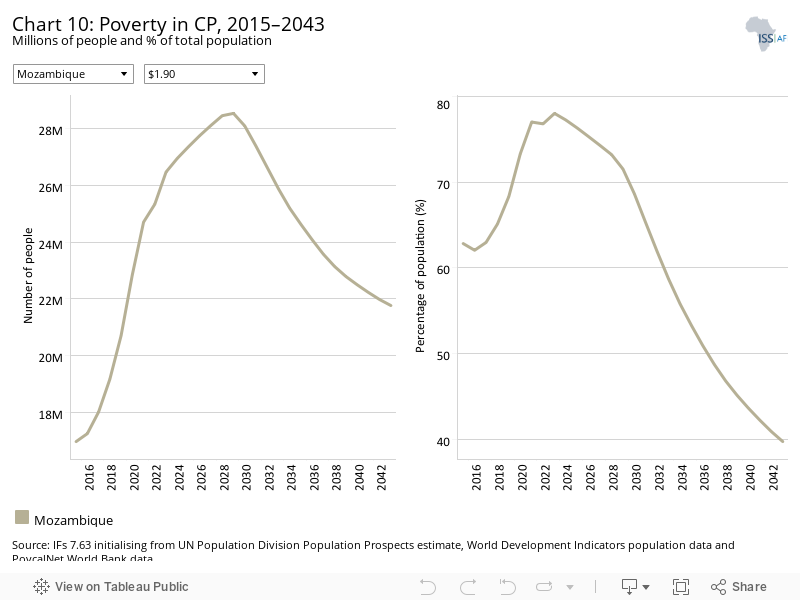
The sustained economic growth experienced in the country over the past two decades has not kept up with population growth and the vast majority of citizens have not benefited from it. Consequently, Mozambique has an extremely high poverty burden and the stunting rate among its population is among the worst performing globally. In 2019, 20.7 million people (68.4%) lived below the extreme poverty line of US$1.90 per person per day. This is 20.6 percentage points higher than the average for low-income countries in Africa (Chart 10B), the fifth highest prevalence of poverty in Africa.
Even with the significant boost to economic growth expected from natural gas production, Mozambique’s poor population will continue to grow as the revenue from natural resource extraction is unlikely to translate into improved development outcomes. While it is expected that extreme poverty rates will decrease to 39.7% by 2043, the number of poor people will still grow to 21.8 million (Chart 10A). This is largely due to rapid population growth and continued lack of access to basic services experienced in the country. [10ISS Africa, Prospects and Challenges: Mozambique’s Growth and Human Development Outlook to 2040, 2017]
In the Current Path forecast, poverty rates in Mozambique will remain above those of low-income economies in Africa and be 12.7 percentage points higher than the average for its low-income peers by 2043. Social welfare transfers from the government (government to household transfers) equated to only 0.7% of GDP in 2019 and are expected to increase to 2.6% of GDP by 2043.
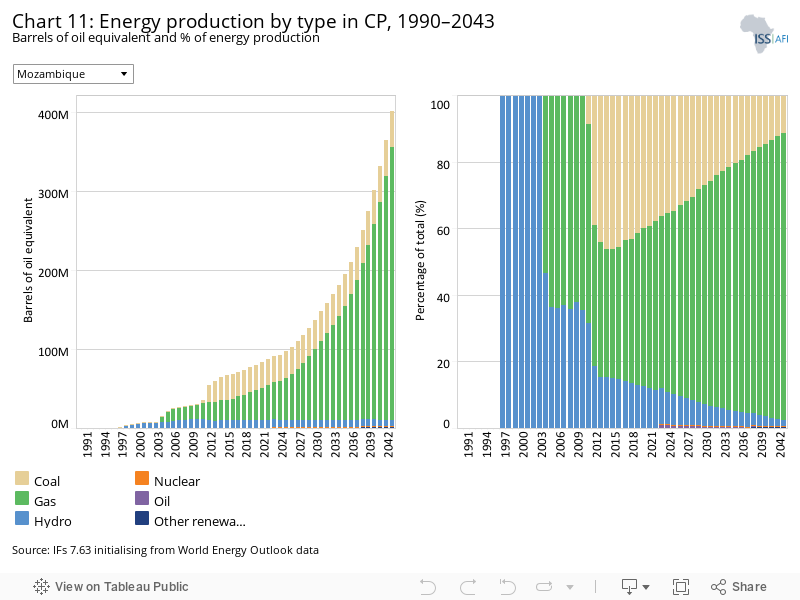
The IFs platform forecasts six types of energy, namely oil, gas, coal, hydro, nuclear and other renewables. To allow comparisons between different types of energy, the data is converted into billion barrels of oil equivalent (BBOE). The energy contained in a barrel of oil is approximately 5.8 million British thermal units (MBTUs) or 1 700 kilowatt-hours (kWh) of energy.
Mozambique has the second largest energy resources in Africa. Total energy resources are estimated at 167 billion barrels of oil equivalent. Coal resources are estimated at 106 billion barrels of oil equivalent while gas and oil are estimated at 37 and 16 billion barrels of oil equivalent respectively.
Mozambique had a total energy production of 77 million barrels of oil equivalent in 2019. The energy mix of the country is heavily reliant on fossil fuels, with 41.6% reliance on coal and 45.5% reliance on gas, followed by hydropower at 13% (Chart 11). The country is the fifth largest producer of hydropower in Africa, but despite the country’s electricity generation potential, less than 28% of the population had access to electricity in 2019.
If gas production develops in line with expectations after the recently discovered reserves of liquefied natural gas (LNG) in the northern off-shore area, the energy sector is likely to grow significantly. In the Current Path forecast, it is expected that by 2043 the country will have a total energy production exceeding 400 million barrels of oil equivalent. The energy mix will be heavily dependent on gas, constituting 86.1% thereof, the equivalent of 350 million barrels of oil, by 2043.
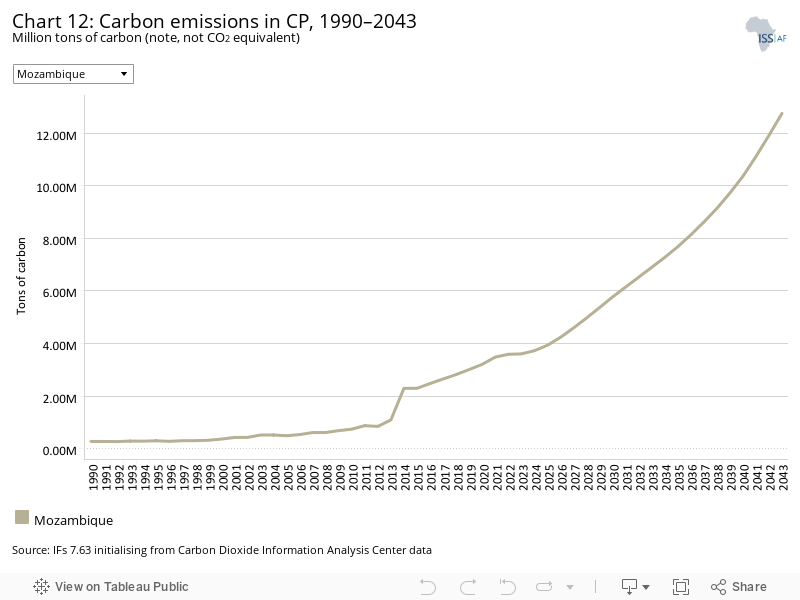
Carbon is released in many ways, but the three most important contributors to greenhouse gases are carbon dioxide (CO2), carbon monoxide (CO) and methane (CH4). Since each has a different molecular weight, IFs uses carbon. Many other sites and calculations use CO2 equivalent.
Mozambique is a low carbon emitter with carbon emissions of 3 million tons in 2019. Its emissions place it in 17th position in Africa and 103rd in the world, although among low-income countries in Africa it ranked second in 2019. In the Current Path forecast, carbon emissions are likely to increase to 13 million tons by 2043, moving it up by 31 positions globally. Mozambique remains a low emitter of carbon despite its heavy reliance on gas.
Sectoral Scenarios for Mozambique
Download to pdfThe Stability scenario represents reasonable but ambitious reductions in risk of regime instability and lower levels of internal conflict. Stability is generally a prerequisite for other aspects of development and this would encourage inflows of foreign direct investment (FDI) and improve business confidence. Better governance through the accountability that follows substantive democracy is modelled separately.
The intervention is explained here in the thematic part of the website.
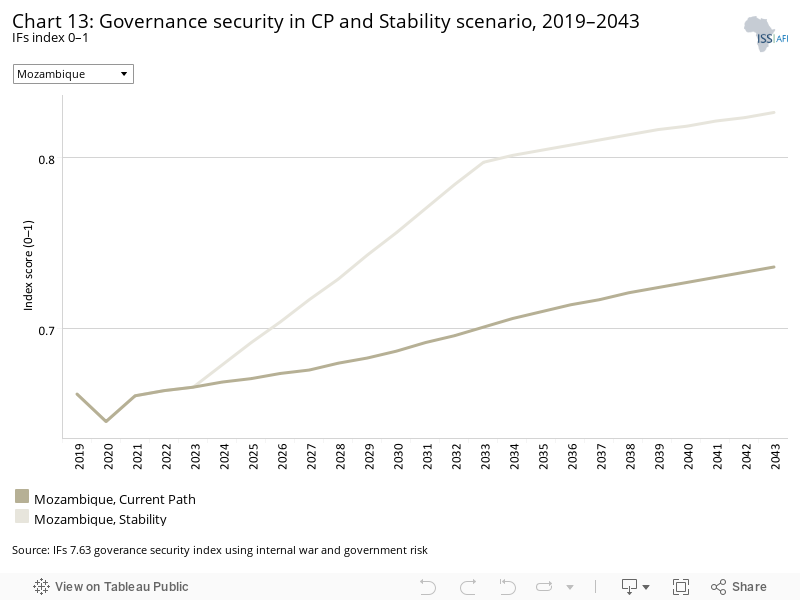
Mozambique has a higher level of governance security compared to the average for Africa’s low-income countries but falls below the average for all African countries (Chart 13). Mozambique enjoys more civil and political freedoms than the average low-income country in Africa although it has a history of violence and instability.
Shortly after Mozambique gained independence, the country was caught up in a civil war that lasted a decade and a half. The peace accord of 1992 started a two-decade period of rebuilding where greater political stability encouraged investment and much-needed development.
The balance between collaboration and hostility between RENAMO (Mozambique National Resistance) and the ruling FRELIMO (Front for the Liberation of Mozambique) party was again disturbed in 2013 when tensions resurfaced within the northern and central areas of the country. While a new peace agreement was signed in 2019, the splintering of RENAMO caused ongoing concerns.
Since 2017, a new threat from Islamist militants has emerged in the northern provinces of Mozambique. In April 2021 it was estimated that 745 000 people have been displaced in the northern provinces as a result of the ongoing insurgency. [11OCHA, Mozambique: Humanitarian Response Dashboard, January–September 2021] It remains a high priority for the government to provide stability within a region that has great economic growth potential. The government stands to benefit greatly from a more stable country, and in the Stability scenario governance security would result in a much more stable environment by 2033.
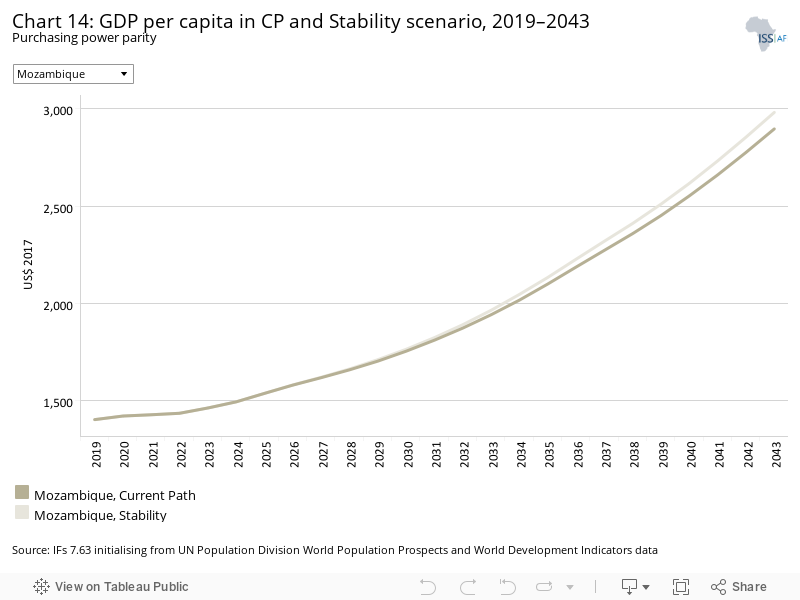
The Stability scenario will see Mozambique’s GDP per capita grow from US$1 402 in 2019 to US$3 114 by 2043, US$217 more than in the Current Path forecast for the same year. In both the Current Path forecast and the Stability scenario, GDP per capita remains below the average for low-income African countries. In 2019, Mozambique’s GDP per capita fell US$258 below the average for low-income countries and this gap is expected to grow to US$1 026 by 2043 in the Stability scenario.
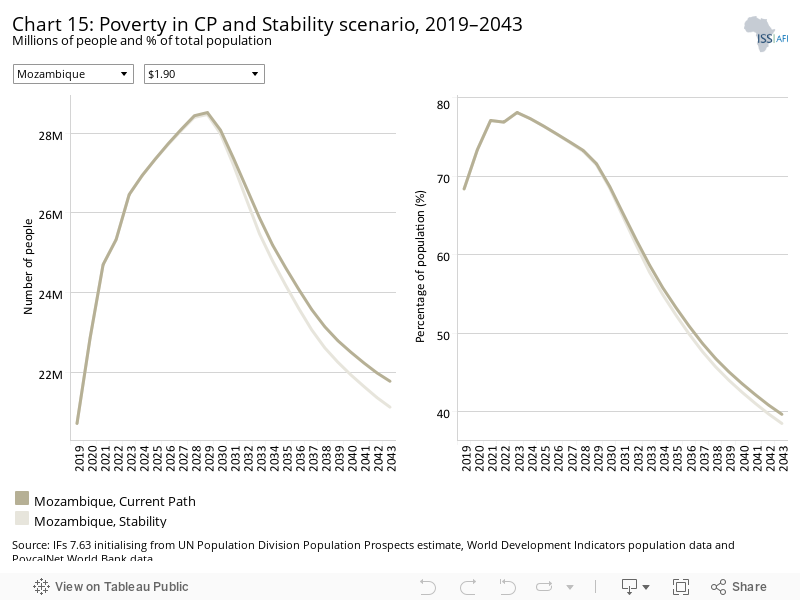
Increased stability has helped reduce poverty in Mozambique in the past. The stable period that followed the peace accord in 1992 saw poverty rates dropping from 85.9% to 62% in 2016. However, the debt crises unearthed in 2016 created an unstable investment period where investment temporality halted and poverty rates dramatically climbed to 68.4% by 2019.
The Stability scenario will have a positive impact on poverty rate reduction but will only benefit the country from 2030 onwards. Poverty rates in this scenario are likely to reach 36.9% by 2043, nearly 3 percentage points lower than in the Current Path forecast. This reduction will translate to 1.6 million people being lifted out of poverty by 2043, but 20.2 million people are still forecast to live below the US$1.90 extreme poverty line (Chart 15).
This section presents the impact of a Demographic scenario that aims to hasten and increase the demographic dividend through reasonable but ambitious reductions in the communicable-disease burden for children under five, the maternal mortality ratio and increased access to modern contraception.
The intervention is explained here in the thematic part of the website.
Demographers typically differentiate between a first, second and even a third demographic dividend. We focus here on the contribution of the size of the labour force (between 15 and 64 years of age) relative to dependants (children and the elderly) as part of the first dividend. A window of opportunity opens when the ratio of the working-age population to dependants is equal to or surpasses 1.7.
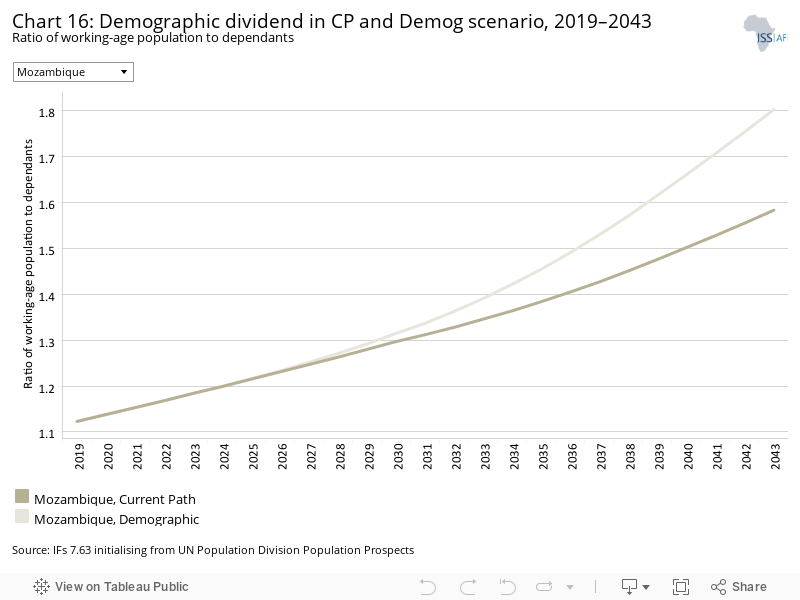
Mozambique has a low ratio of working-age population to dependants. In 2019, this ratio was 1.1, far below the desired value of 1.7 needed to reap the benefits of a demographic dividend. In the Demographic scenario, it is forecast that Mozambique’s dependency ratio will drop much quicker than in the Current Path forecast as more working-age people enter the labour market.
In the Demographic scenario, a rate of 1.7 working-age persons to dependants is expected in 2041 for Mozambique, the same time period projected for the African continent and a year earlier than its low-income peers.
The Demographic scenario will aid Mozambique in attaining the benefits of a larger working force seven years earlier than projected in the Current Path forecast (Chart 16). This is due to a smaller and ageing population that is estimated to be 2.7 million fewer by 2043.
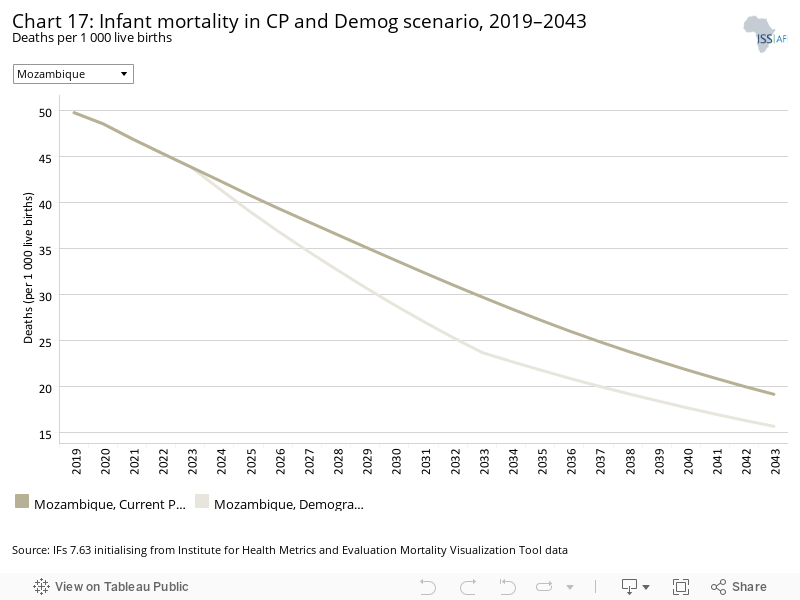
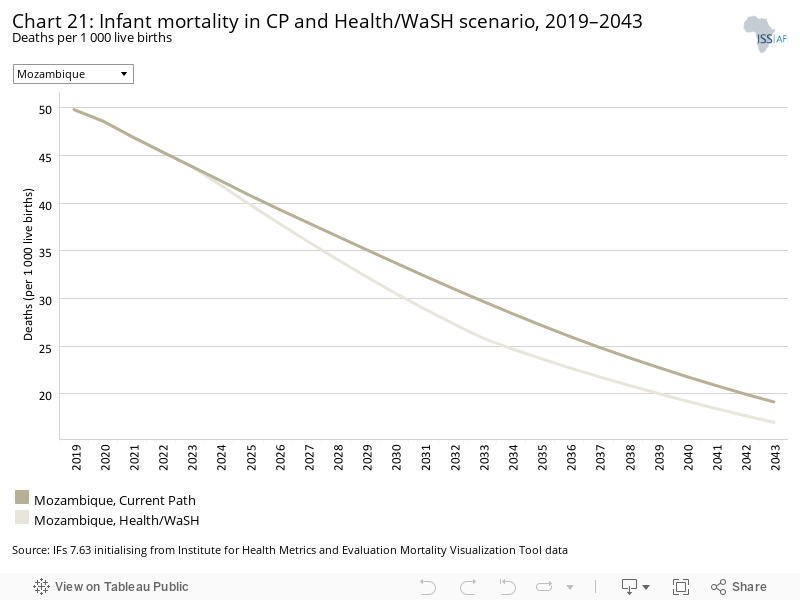
The infant mortality rate is the number of infant deaths per 1 000 live births and is an important marker of the overall quality of the health system in a country.
Infant mortality has substantially dropped in Mozambique over the past two decades and is less than half the figures observed at the beginning of the century. Mozambique’s infant mortality was, however, still extremely high at 49.8 deaths per 1 000 live births in 2019. This is three more deaths per 1 000 live births than the average for low-income countries in Africa. The downward trend is expected to continue in the Current Path forecast and is likely to drop to 19 deaths per 1 000 live births by 2043 (Chart 17). The interventions of the Demographic scenario see Mozambique’s infant mortality rate drop to 15.6 deaths per 1 000 live births by 2043.
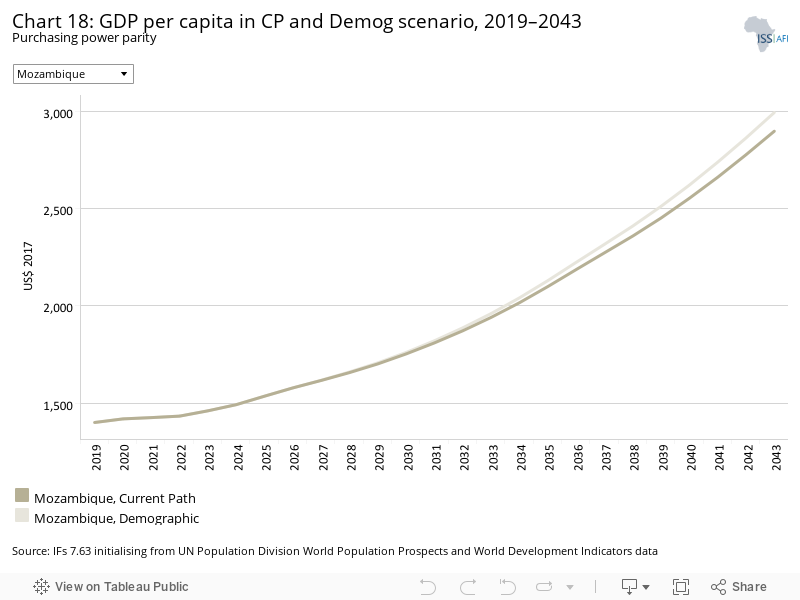
The Demographic scenario marginally increases GDP per capita. By 2043, Mozambique’s GDP per capita is expected to increase to US$2 897 and US$2 993 respectively in the Current Path forecast and the Demographic scenario (Chart 18). The GDP per capita gap between the average for low-income countries and Mozambique is forecast to widen to US$932 by 2043, US$674 more than in 2019.
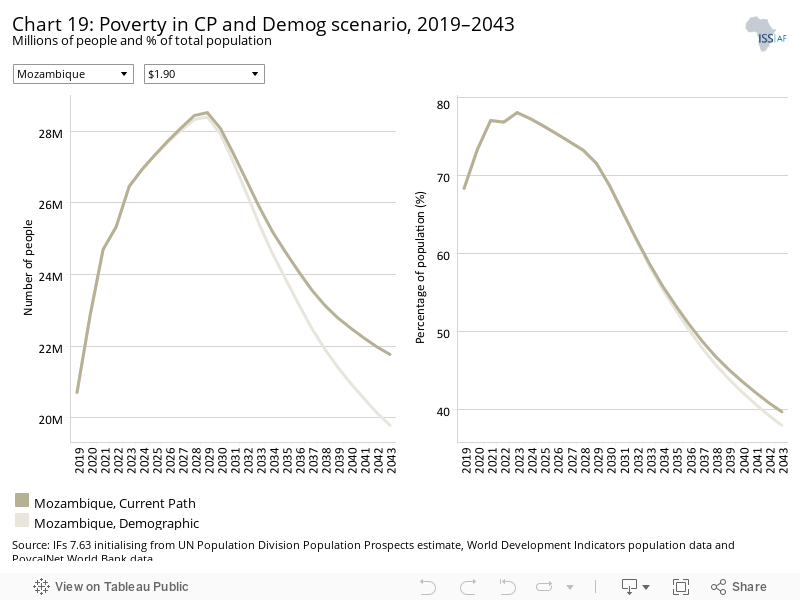
The Demographic scenario will have a positive impact on the poverty rate but only by a small margin of less than 2% (Chart 19). The Demographic scenario reduces the poverty rate to 38% by 2043, compared to 39.7% in the Current Path forecast. Even though the poverty rate only drops by 1.7 percentage points, the Demographic scenario reduces the amount of people living in extreme poverty by 1.98 million by 2043.
This section presents reasonable but ambitious improvements in the Health/WaSH scenario, which include reductions in the mortality rate associated with both communicable diseases (e.g. AIDS, diarrhoea, malaria and respiratory infections) and non-communicable diseases (NCDs) (e.g. diabetes), as well as improvements in access to safe water and better sanitation. The acronym WaSH stands for water, sanitation and hygiene.
The intervention is explained here in the thematic part of the website.
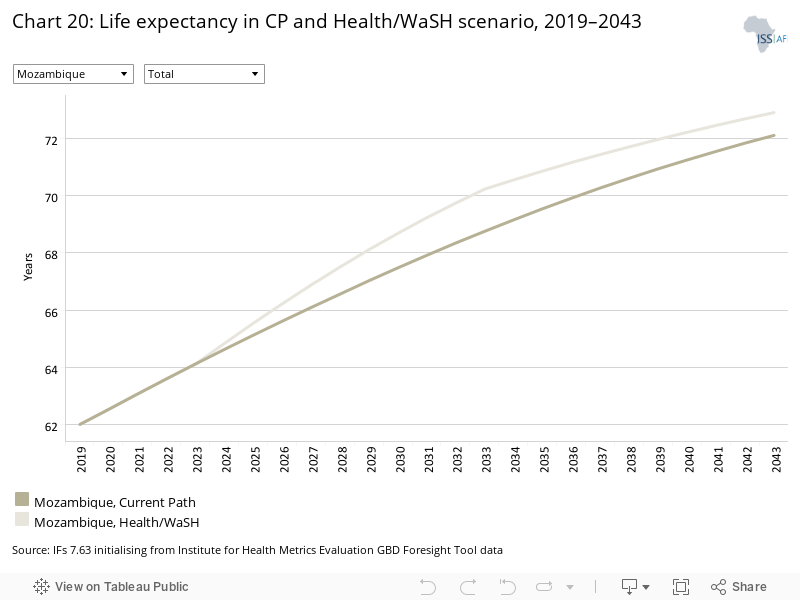
In 1985, when civil conflict peaked in the country, the life expectancy of Mozambique’s population was 41.9 years, among the lowest in the world. By 2019, this figure had improved to 62 years but still falls significantly behind the average for Africa by 3.8 years and falls behind the average for low-income countries by 1.8 years.
In the Current Path forecast, this figure is expected to improve by 10 years resulting in a life expectancy of 72.1 years by 2043, on par with the forecast for African countries and 1.3 years above the average for Africa’s low-income peers.
Basic sanitation and infrastructure improvements as suggested in the Health/WaSH scenario will impact life expectancy positively. Life expectancy is expected to reach 72.9 years by 2043, surpassing the average life expectancy for Africa and its low-income countries (Chart 20).
Chart 21 displays the impact of the Health/WaSH scenario on infant mortality rates (infant deaths per 1 000 live births). The Health/WaSH scenario will reduce infant deaths more quickly than the in Current Path forecast, lowering the under-five mortality rate to 17 deaths per 1 000 live births by 2043, compared to 19 for the Current Path forecast.
The Agriculture scenario represents reasonable but ambitious increases in yields per hectare (reflecting better management and seed and fertilizer technology), increased land under irrigation and reduced loss and waste. Where appropriate, it includes an increase in calorie consumption, reflecting the prioritisation of food self-sufficiency above food exports as a desirable policy objective.
The intervention is explained here in the thematic part of the website.
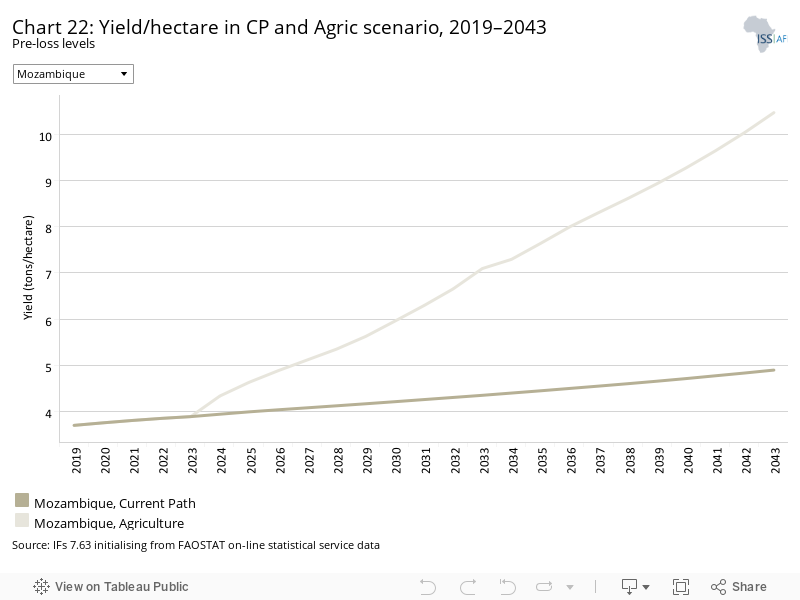
The data on yield per hectare (in metric tons) is for crops but does not distinguish between different categories of crops.
Agriculture forms a significant component of the Mozambique economy. In 2019, it was responsible for employing 7.2 million of Mozambique’s 12.9 million labour force and contributed 20.9% to the country’s GDP. In 2019, yields in Mozambique stood at 3.7 metric tons per hectare, 1 ton per hectare more than the average for low-income countries in Africa (Chart 22).
Nevertheless, yields remain low in comparison to the country’s agricultural potential. The ten agro-ecological zones of Mozambique offer the potential to support a wide variety of productive agricultural produce. However, low labour productivity, high post-harvest losses and recurring droughts and flooding have raised deep concerns for food security.
In the Agriculture scenario, it is forecast that yields will increase to 10.5 metric tons per hectare by 2043. The Agriculture scenario will improve yields with 5.6 metric tons per hectare compared to the Current Path forecast by 2043, a result of the underlying constraints to the sector being addressed.
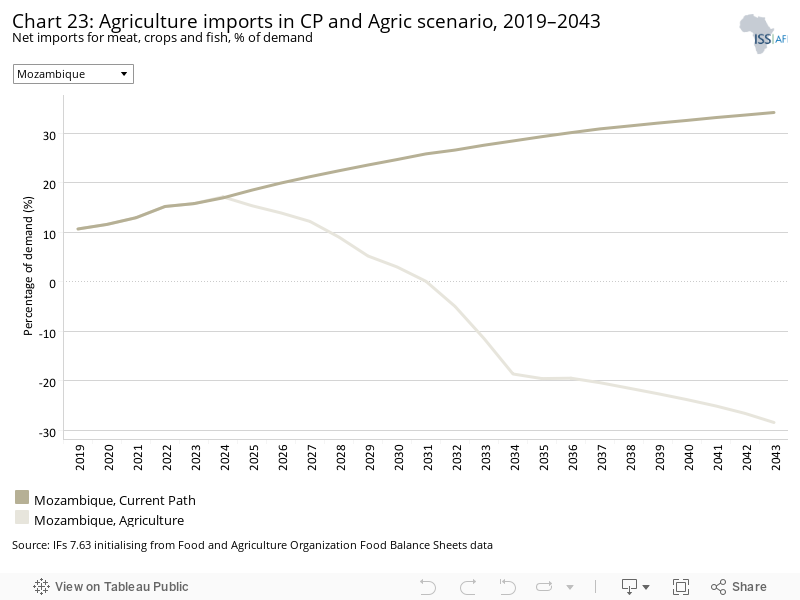
Mozambique’s rural communities are extremely vulnerable to food insecurity, in part due to the high frequency of droughts and flooding but also due to the subsistence nature of rain-fed agricultural practices. In 2019, total agricultural demand exceeded production by 2.4 million metric tons, accounting for a 10.7% import dependency. In the Current Path forecast, demand is predicted to exceed production in 2043 by 16.9 million metric tons, a significant import dependency of 34.2% (Chart 23).
The Agriculture scenario will benefit Mozambique greatly through increasing yields, reducing vulnerable rain-fed crops through irrigation schemes, reducing post-harvest losses and tapping into Mozambique’s agricultural potential. In this scenario, Mozambique can achieve a production surplus by 2030 and will produce 33.8 million metric tons more by 2043 than in the Current Path forecast.
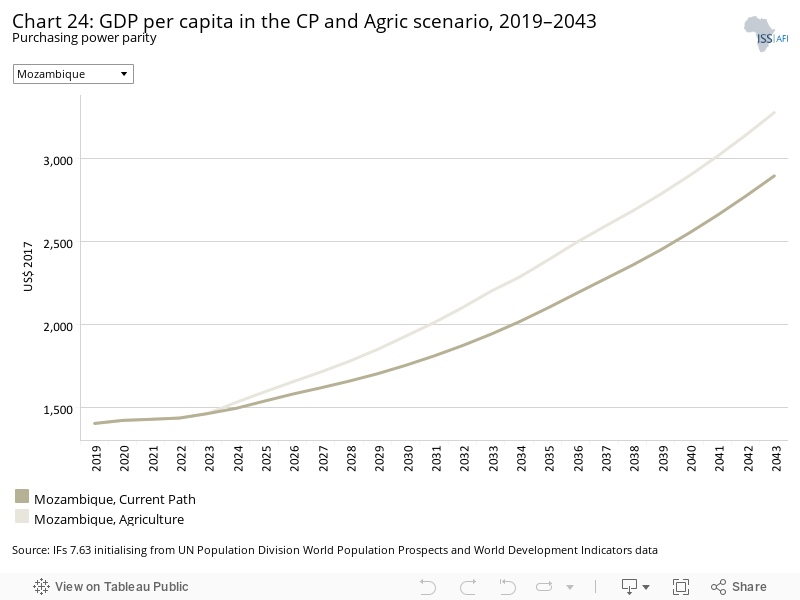
Chart 24 displays GDP per capita for Mozambique in the Current Path forecast and in the Agriculture scenario. The Agriculture scenario will have the biggest impact on GDP from all the scenarios proposed, increasing per capita income by US$383 over the Current Path forecast by 2043. GDP per capita will remain below the average for low-income countries in Africa in both scenarios.
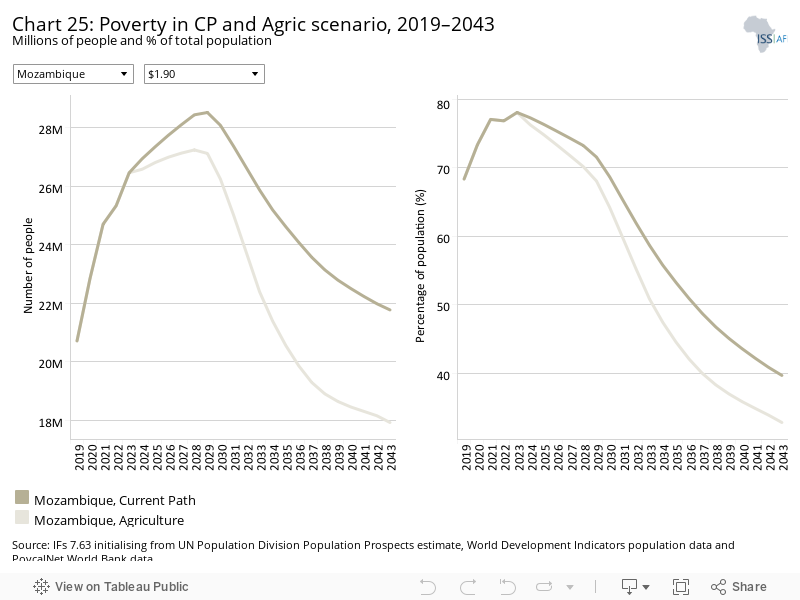
The Agriculture scenario is expected to reduce poverty the most in Mozambique of all the individual sectoral interventions proposed. In the Agriculture scenario, the poverty rate will decrease from 68.4% in 2019 to 32.8% by 2043 (Chart 25). Poverty rates will however still be above the average for low-income economies in Africa. The Agriculture scenario will result in 3.9 million fewer people in extreme poverty by 2043 compared to the Current Path forecast. The number of people living in extreme poverty in 2043 will remain high at 21.8 million and 17.9 million in the Current Path forecast and the Agriculture scenario respectively.
The Education scenario represents reasonable but ambitious improved intake, transition and graduation rates from primary to tertiary levels and better quality of education. It also models substantive progress towards gender parity at all levels, additional vocational training at secondary school level and increases in the share of science and engineering graduates.
The intervention is explained here in the thematic part of the website.
Mozambique spends 6.3% of GDP on Education, the third highest among low-income countries in Africa. However, the country is characterised by low socio-economic development, highlighting the long time it takes to reap the benefits of investment in education. Even though literacy rates have doubled since the 1980s, they remain low at 59% in 2019. In the Education scenario, literacy rates are forecast to reach 84.5% by 2043, 2.4 percentage points higher than in the Current Path forecast.
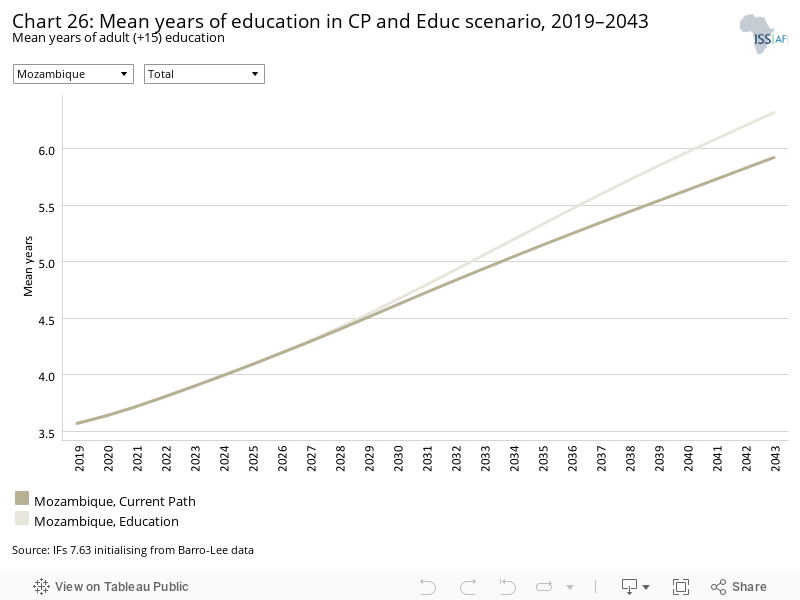
The mean years of education in Mozambique is very low at 3.6 years in 2019, 0.8 years less than the average for its low-income peers. Partly to blame are the low completion rates at both primary and lower secondary level, with the former being 58% and the latter being 24% in 2019. [12The World Bank, Primary completion rate, total (% of relevant age group) - Mozambique, 2021] The benefits of investment in education are more noticeable by 2043, when mean years of education improves to 6.3 years in the Education scenario, narrowing the gap between Mozambique and its income peers to 0.4 years (Chart 26).
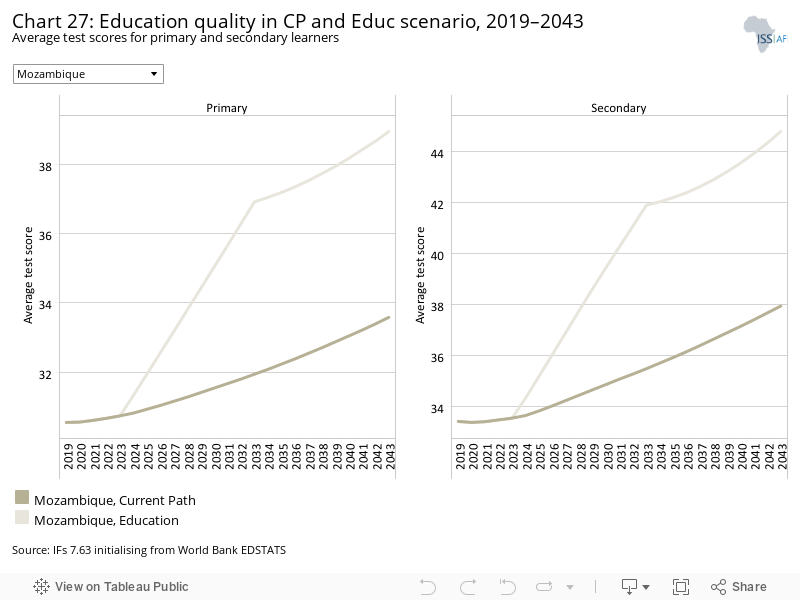
Chart 27A displays the average test scores for primary learners in Mozambique in the Current Path forecast and in the Education scenario. Mozambique’s primary test score in 2019 was 30.6%, and by 2043, it is expected to increase to 33.6% in the Current Path forecast. Mozambique is expected to benefit from the Education scenario and is forecast to attain average test scores for primary learners of 38.9% by 2043, 5.3 percentage points higher than in the Current Path forecast. Average test scores for primary learners remained higher than the average for low-income countries in Africa by 2043, reflecting the high spending on primary education in the country’s GDP expenditure.
Chart 27B displays the average test scores for secondary learners in Mozambique in the Current Path forecast and in the Education scenario. In the Education scenario, the test score at the secondary level is 44.8% in 2043, up from 33.4% in 2019. The Education scenario is expected to result in test scores for secondary learners to be 7 percentage points higher by 2043 than the Current Path forecast at 37.8%. While average test scores for secondary learners were behind the average for low-income countries in Africa in 2019, they catch up by 2043 in the Education scenario.
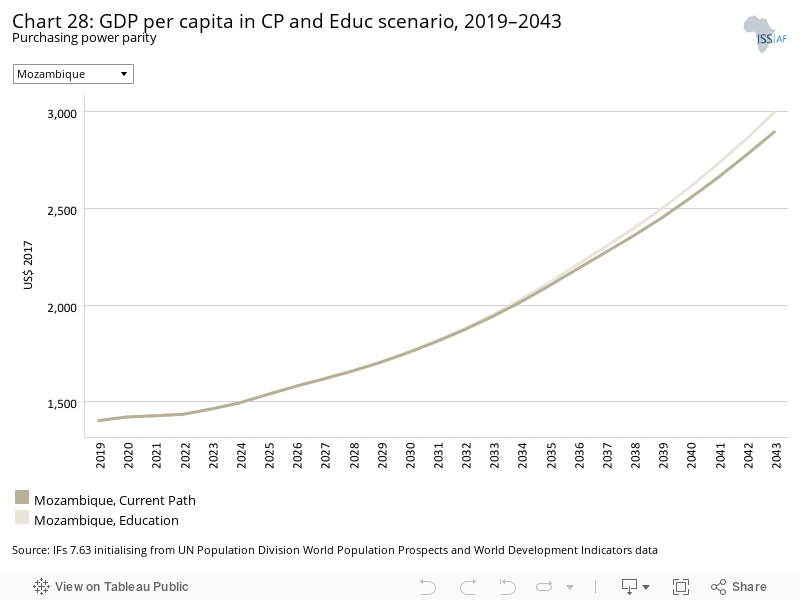
Chart 28 displays the marginal impact of the Education scenario on GDP per capita in Mozambique. By 2043, GDP per capita is expected to increase to US$2 998 in the Education scenario, compared to US$2 897 in the Current Path forecast (Chart 28). GDP per capita for Mozambique is expected to continue to lag behind its income peers, with a growing per capita income gap until 2043.
The Manufacturing/Transfers scenario represents reasonable but ambitious manufacturing growth through greater investment in the economy, investments in research and development, and promotion of the export of manufactured goods. It is accompanied by an increase in welfare transfers (social grants) to moderate the initial increases in inequality that are typically associated with a manufacturing transition. To this end, the scenario improves tax administration and increases government revenues.
The intervention is explained here in the thematic part of the website.
Chart 31 should be read with Chart 8 that presents a stacked area graph on the contribution to GDP and size, in billion US$, of the Current Path economy for each of the sectors.
In the Manufacturing/Transfers scenario, the service sectors will continue to be the largest contributor to the economy and will contribute an additional US$2.4 billion to the GDP by 2043, representing a 0.75 percentage-point improvement compared to the Current Path forecast.
The Manufacturing/Transfers scenario will not improve the contribution of the other sectors above the Current Path forecast. In fact, the scenario forecasts a decline in contributions compared to the Current Path forecast for the energy, manufacturing, agriculture and materials sectors (Chart 30). The manufacturing sector will however contribute US$390 million more to the economy than in the Current Path forecast.
In 2019, social welfare spending (government welfare transfers to unskilled workers) equated to US$0.15 billion. In the Manufacturing/Transfers scenario, social welfare expenditure will increase to US$3 billion, US$1.2 billion higher than in the Current Path forecast. These values are the 10th highest among low-income countries in Africa for 2043.
The Manufacturing/Transfers scenario will have a very small impact on the GDP per capita of Mozambique in 2043, increasing it by a mere US$72 above the Current Path forecast. The GDP per capita is expected to increase to US$2 969 in this scenario compared to US$2 897 in the Current Path forecast. Both the Current Path forecast’s and the Manufacturing/Transfers scenario’s GDP per capita will still be below the average for low-income countries in Africa by 2043.
The Manufacturing/Transfers scenario has a marginal impact on reducing the number of poor people in Mozambique. In this scenario, the poverty rate will be 38.8% by 2043 compared to 39.7% in the Current Path forecast. The scenario will therefore lift an additional 500 000 people out of extreme poverty above the Current Path forecast by 2043.
The Leapfrogging scenario represents a reasonable but ambitious adoption of and investment in renewable energy technologies, resulting in better access to electricity in urban and rural areas. The scenario includes accelerated access to mobile and fixed broadband and the adoption of modern technology that improves government efficiency and allows for the more rapid formalisation of the informal sector.
The intervention is explained here in the thematic part of the website.
Fixed broadband includes cable modem Internet connections, DSL Internet connections of at least 256 KB/s, fibre and other fixed broadband technology connections (such as satellite broadband Internet, ethernet local area networks, fixed-wireless access, wireless local area networks, WiMAX, etc.).
Chart 34 displays the fixed broadband subscriptions per 100 people in the Current Path forecast and in the Leapfrogging scenario. Mozambique’s fixed broadband subscriptions per 100 people in 2019 were lower than the average for low-income countries in Africa and for Africa as a whole. In the Leapfrogging scenario, fixed broadband subscriptions increase from 1.6 to 49.7 subscriptions per 100 people by 2043. This is 23.9 subscriptions more than in the Current Path forecast and higher than the average for low-income African countries.
Mobile broadband refers to wireless Internet access delivered through cellular towers to computers and other digital devices.
Chart 35 displays the mobile broadband subscriptions per 100 people in the Current Path forecast and in the Leapfrogging scenario. Mozambique had more mobile broadband subscriptions per 100 people in 2019 than the average for low-income countries in Africa and for Africa as a whole. In the Leapfrogging scenario, mobile broadband subscriptions will increase from 43.9 in 2019 to 125.4 subscriptions per 100 people by 2043. This is 2.7 subscriptions more than in the Current Path forecast but lower than the average for low-income African countries, which is estimated to reach 137.4 subscriptions per 100 people by 2043.
Electricity access in Mozambique is critically low: in total, only 27.9% of the country’s population had access to electricity in 2019. This is the result of ageing infrastructure, inadequate transmission and distribution lines, a rapidly growing population and extreme weather events (such as flooding and cyclones) that have damaged infrastructure in the past.
In the Current Path forecast, it is projected that 55.4% of Mozambique’s population will have access to electricity by 2043, translating to 30.4 million people. In the Leapfrogging scenario, electricity access is projected to reach 68.8% by 2043, resulting in 37.6 million people with electricity access (7.2 million additional to the Current Path forecast).
The projection indicates that in the Leapfrogging scenario rural electricity access will increase from a mere 8.7% in 2019 to 52.4% by 2043, 19.1 percentage points higher than in the Current Path forecast. For the population living in urban spaces, it is projected that in the Leapfrogging scenario, electricity access will increase from 62% in 2019 to 87% by 2043. In 2019, average electricity access for low-income African countries was 4.3% higher than Mozambique’s, a gap that will grow to 6.2% by 2043 (Chart 36).
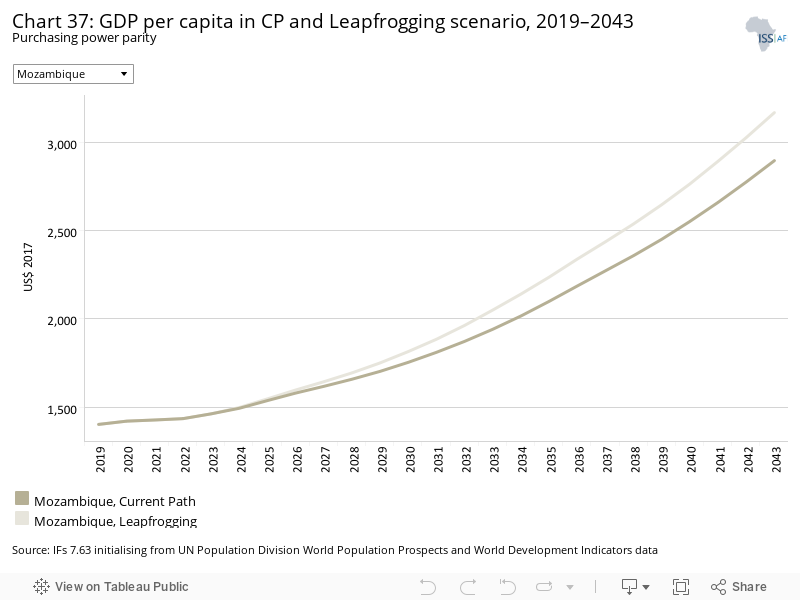
Chart 37 displays the impact of the Leapfrogging scenario on GDP per capita in Mozambique. By 2043, GDP per capita is expected to increase to US$3 170 in the Leapfrogging scenario, compared to US$2 897 in the Current Path forecast. GDP per capita for Mozambique is expected to continue to lag behind its income peers, with a growing per capita income gap throughout the forecast horizon.
The Free Trade scenario represents the impact of the full implementation of the African Continental Free Trade Area (AfCFTA) by 2034 through increases in exports, improved productivity and increased trade and economic freedom.
The intervention is explained here in the thematic part of the website.
The trade balance is the difference between the value of a country's exports and its imports. A country that imports more goods and services than it exports in terms of value has a trade deficit, while a country that exports more goods and services than it imports has a trade surplus.
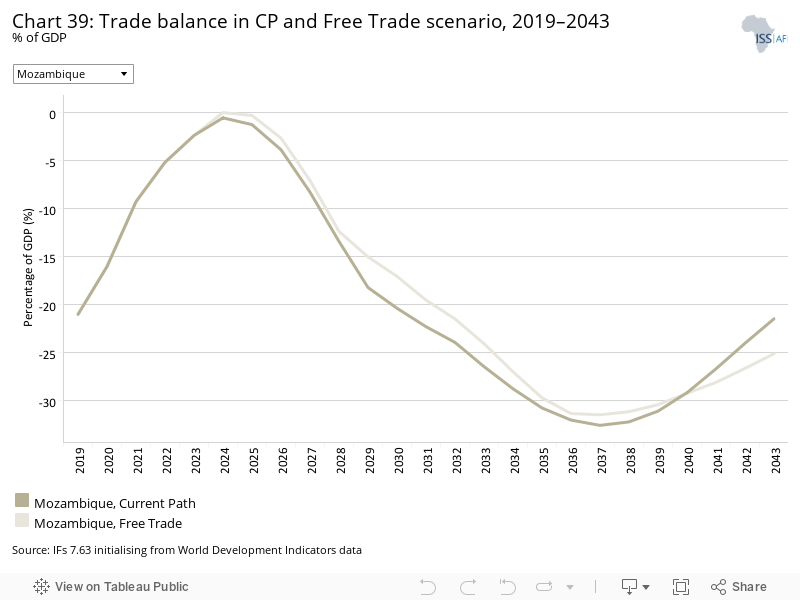
Chart 39 displays the trade balance as a per cent of GDP for the Current Path forecast and the Free Trade scenario. Mozambique’s trade deficit in 2019 stood at 21.1% of GDP. This is expected to improve significantly in the near future, peaking in 2024, as a result of revenues earned from its northern gas reserves. The longer-term forecast shows a growing import dependency and declining exports with a trade deficit peaking in 2036 at 31.4% before improving to 25.2% in 2043 in the Free Trade scenario.
The full implementation of the AfCFTA not only enables countries to export more easily but also opens them up to increased imports, endangering those sectors where they lack competitive advantage.
In the Free Trade scenario, Mozambique’s total trade increases as a per cent of GDP in materials, manufacturing and services but imports outstrip exports over the forecast horizon.
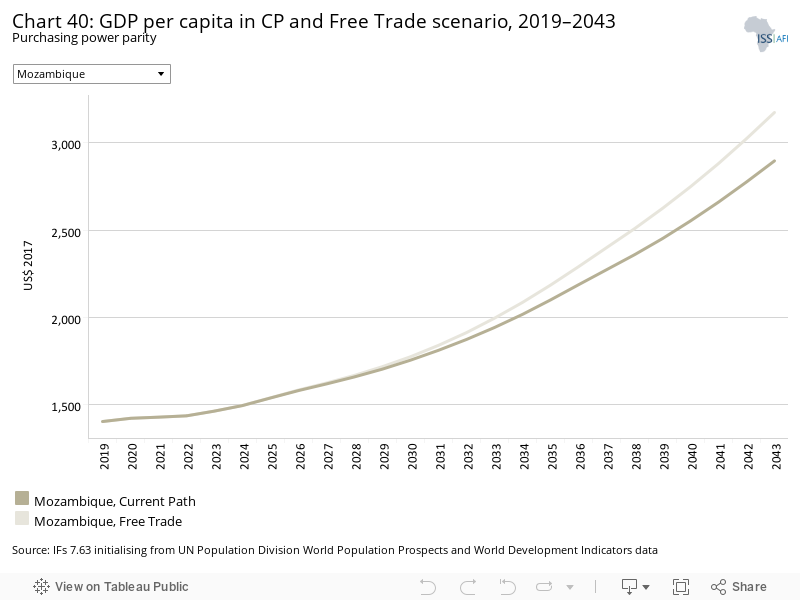
Chart 40 displays the modest impact of the Free Trade scenario on GDP per capita in Mozambique. By 2043, GDP per capita is expected to increase to US$3 175 in the Free Trade scenario, compared to US$2 897 in the Current Path forecast, an increase of US$278 per capita. GDP per capita for Mozambique is expected to continue to lag behind its income peers, with a growing per capita income gap throughout the forecast horizon.
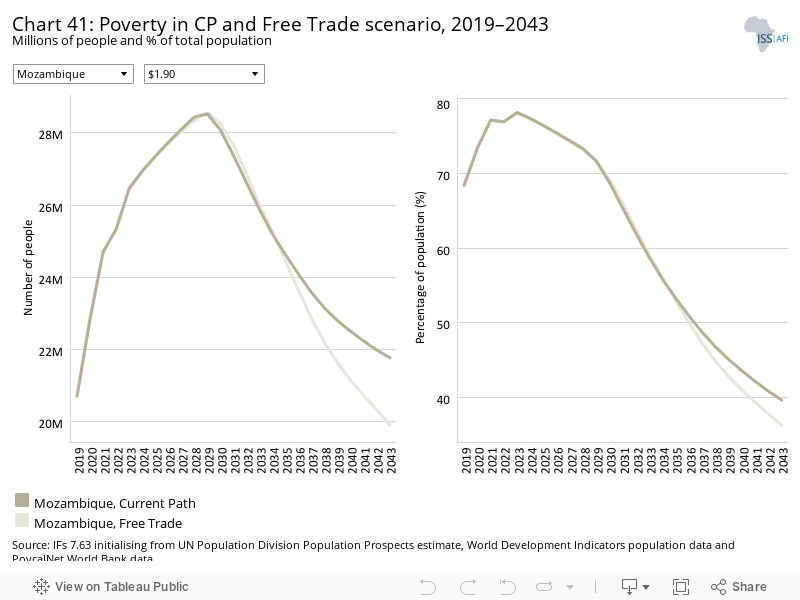
By 2043, poverty will drop from 39.7% in the Current Path forecast to 36.3% in the Free Trade scenario, lifting an additional 1.9 million people out of extreme poverty. This scenario therefore contributes a 3.4 percentage-point reduction in the poverty rate compared to the Current Path forecast. While poverty rates will drop from 68.4% in 2019 to 36.3% by 2043 in the Free Trade scenario, the absolute number of people living in extreme poverty will remain high at 19.9 million in 2043 (Chart 41).
The Financial Flows scenario represents a reasonable but ambitious increase in worker remittances and aid flows to poor countries, and an increase in the stock of foreign direct investment (FDI) and additional portfolio investment inflows to middle-income countries. We also reduced outward financial flows to emulate a reduction in illicit financial outflows.
The intervention is explained here in the thematic part of the website.
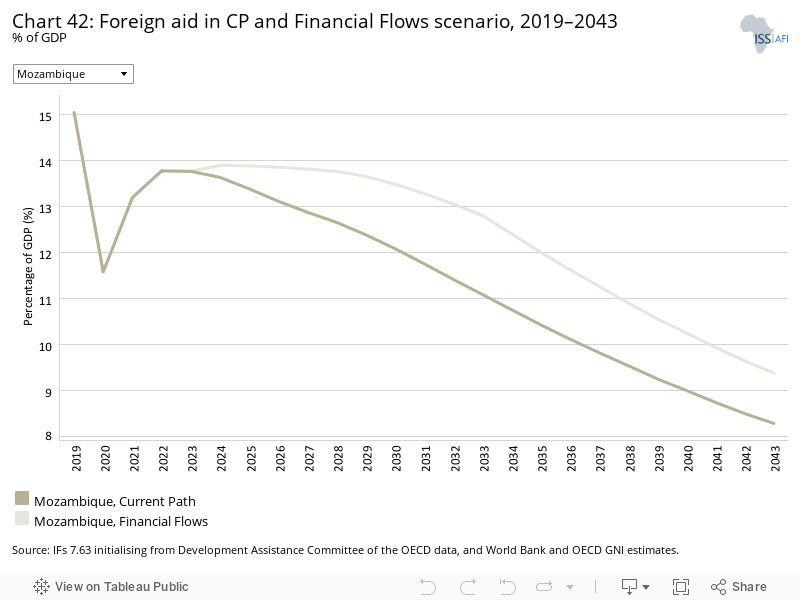
The economy of Mozambique benefited significantly from foreign direct investment after the civil war ended, leading to two decades of sustained economic growth. Nonetheless, Mozambique still struggles with endemic poverty and is highly dependent on foreign aid (Chart 42). Foreign aid plays a substantial role in ensuring the government provides the necessary social services and promotes human development outcomes. [13ISS Africa, Prospects and Challenges: Mozambique’s Growth and Human Development Outlook to 2040, 2017] Mozambique’s reliance on foreign aid is significantly above the average for low-income countries in Africa. Foreign aid flows are projected to decrease in both scenarios, equating to 9.4% in the Financial Flows scenario, compared to 8.3% for the Current Path forecast by 2043.
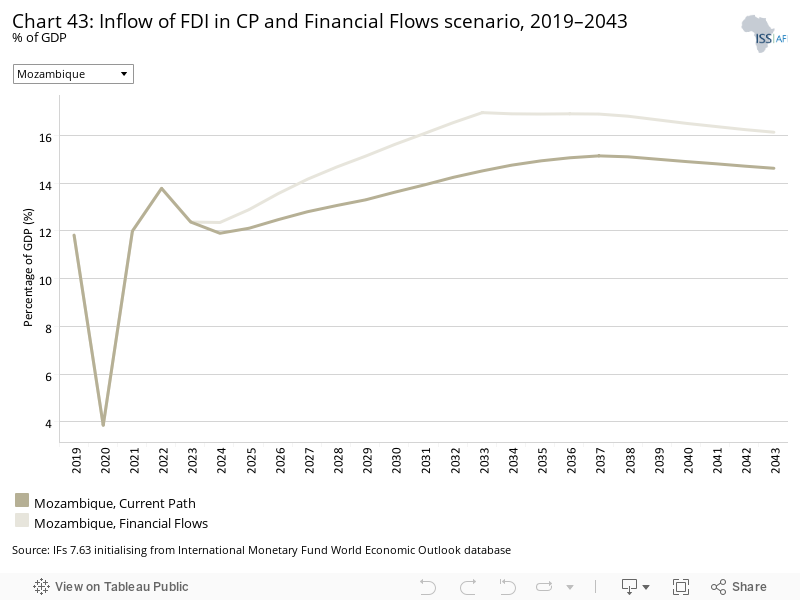
Foreign investment in Mozambique was high at 11.8% of GDP in 2019, ranking Mozambique second among low-income countries in Africa and is 7.5 percentage points higher than the average among its income peers. This is mainly due to Mozambique's vast natural resources, such as LNG. For example, even with an insurgency and a pandemic occurring, Total’s investment in LNG extraction in the Cabo Delgado region continued during 2020, although at a slower pace than before. [14UNCTAD, World Investment Report 2021, 2021] Indeed, the impact of the COVID-19 pandemic on FDI flows can be observed with a sharp decrease to 3.9% in 2020. In the Financial Flows scenario, FDI inflows increase from 2021 onwards and represent 16.3% of GDP by 2043, 1.7 percentage points higher than in the Current Path forecast.
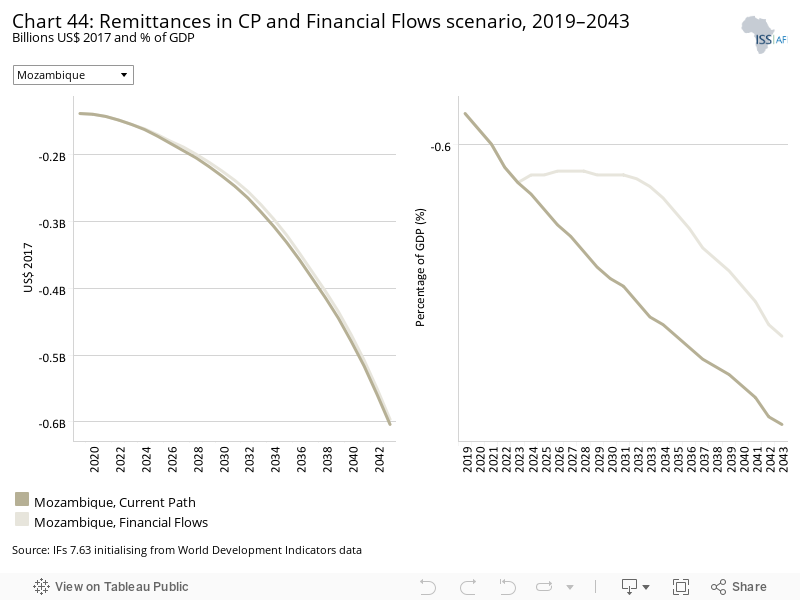
Mozambique does not receive large amounts of remittances and is a net sender of remittance money. In 2019, net remittances were -US$0.14 billion and are projected to decrease further, reaching -US$0.6 billion in 2043 in the Financial Flows scenario.
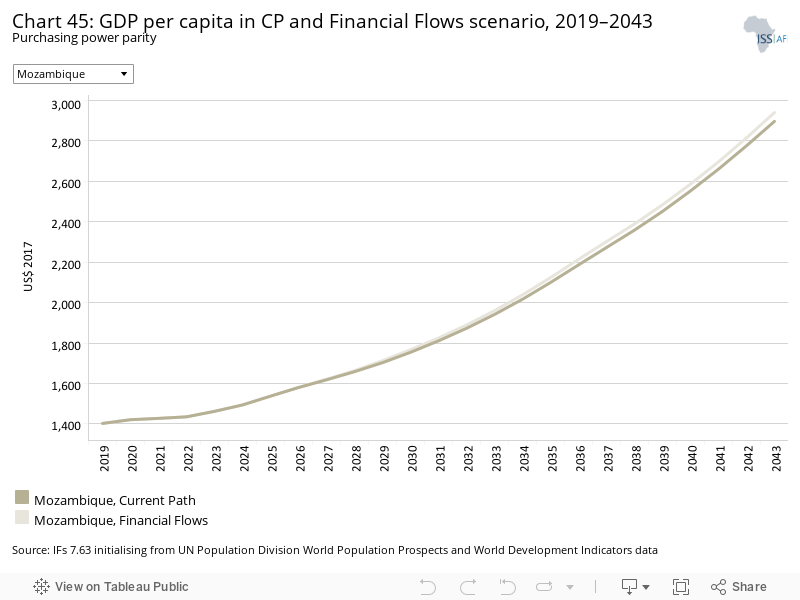
Chart 45 displays the very small impact that the Financial Flows scenario will have on GDP per capita in Mozambique. By 2043, the GDP per capita is expected to increase to US$2 941 in the Financial Flows scenario, compared to US$2 897 in the Current Path forecast, an increase of only US$44 per capita. GDP per capita for Mozambique is expected to continue to lag behind its income peers, with a growing per capita income gap throughout the forecast horizon.
The Infrastructure scenario represents a reasonable but ambitious increase in infrastructure spending across Africa, focusing on basic infrastructure (roads, water, sanitation, electricity access and ICT) in low-income countries and increasing emphasis on advanced infrastructure (such as ports, airports, railway and electricity generation) in higher-income countries.
Note that health and sanitation infrastructure is included as part of the Health/WaSH scenario and that ICT infrastructure and more rapid uptake of renewables are part of the Leapfrogging scenario. The interventions there push directly on outcomes, whereas those modelled in this scenario increase infrastructure spending, indirectly boosting other forms of infrastructure, including that supporting health, sanitation and ICT.
The intervention is explained here in the thematic part of the website.
Electricity access in Mozambique, as with other areas of infrastructure delivery, is critically low. In the Current Path forecast, it is projected that 55.4% of Mozambique’s population will have access to electricity by 2043, translating to 30.4 million people.
In the Infrastructure scenario, electricity access is projected to reach 64.1% by 2043, resulting in 35.2 million people having access to electricity, an increase of 4.8 million people compared to the Current Path forecast. The projection indicates that in the Infrastructure scenario, rural population electricity access will increase from a mere 8.7% in 2019 to 46.8% by 2043, 13.5 percentage points higher than in the Current Path forecast. For populations living in urban spaces, it is projected that in the Infrastructure scenario, electricity access will increase from 62% in 2019 to 83.4% by 2043.
Indicator 9.1.1 in the Sustainable Development Goals refers to the proportion of the rural population who live within 2 km of an all-season road and is captured in the Rural Access Index.
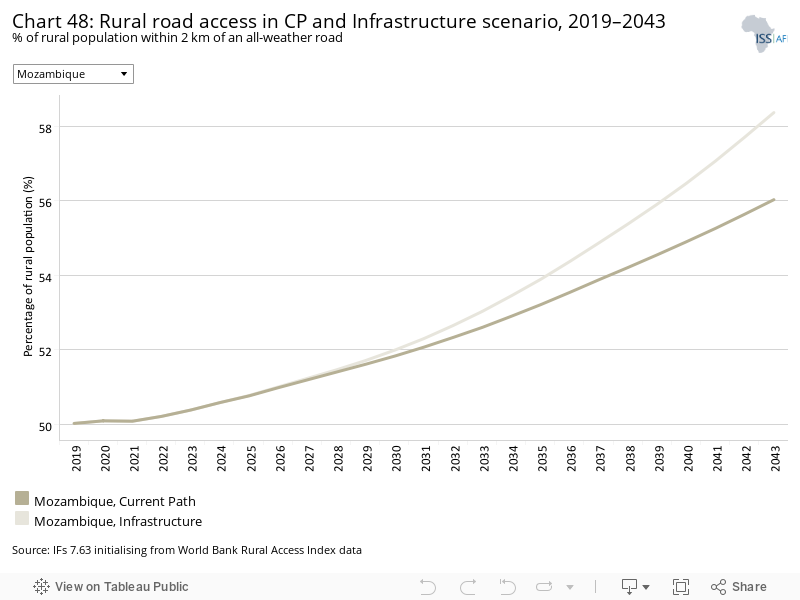
Measuring rural accessibility is a very important development indicator. The road network in Mozambique plays a vital role in the economy, given the nature of agriculture and the main modes of transportation. There is a strong link between investing in rural access roads and positive socio-economic impacts, such as improving rural income, reducing poverty, reducing maternal deaths, improving paediatric health and increased agricultural productivity. [15AfCAP, Climate Adaptation: Risk Management and Resilience Optimisation for Vulnerable Road Access in Africa, February 2019] Mozambique has a very low overall road network density, the 10th lowest in Africa, and this impacts the rural accessibility and poverty rates greatly. In 2019, 50% of Mozambique’s rural population had access to an all-weather road, compared to an average of 43% for low-income countries in Africa. The Infrastructure scenario will positively influence rural accessibility, and by 2043, it is projected that 58.4% of the rural population will have access to an all-weather road, compared to 56% for the Current Path forecast.
Even though Mozambique’s accessibility rates are above the average for low-income countries in Africa, a substantial portion of the road network is located in areas that are frequently subjected to floods and cyclones, and thus 30% of Mozambique’s road network is considered to be in a poor, very poor or impassable condition. [16AfCAP, Climate Adaptation: Risk Management and Resilience Optimisation for Vulnerable Road Access in Africa, February 2019]
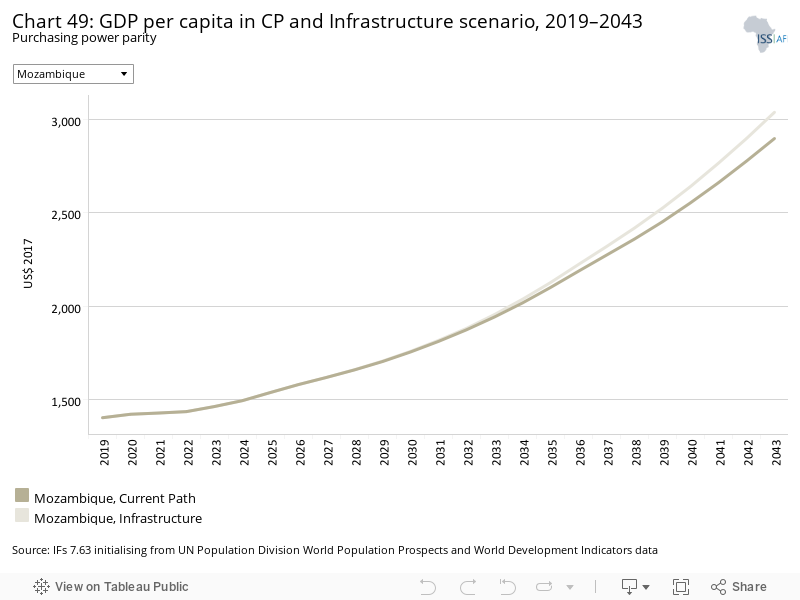
Chart 49 displays the impact that the Infrastructure scenario will have on GDP per capita in Mozambique. By 2043, the GDP per capita is expected to increase to US$3 038 in the Infrastructure scenario, compared to US$2 897 in the Current Path forecast, an increase of only US$141 per capita. GDP per capita for Mozambique is expected to continue to lag behind its income peers, with a growing per capita income gap throughout the forecast horizon.
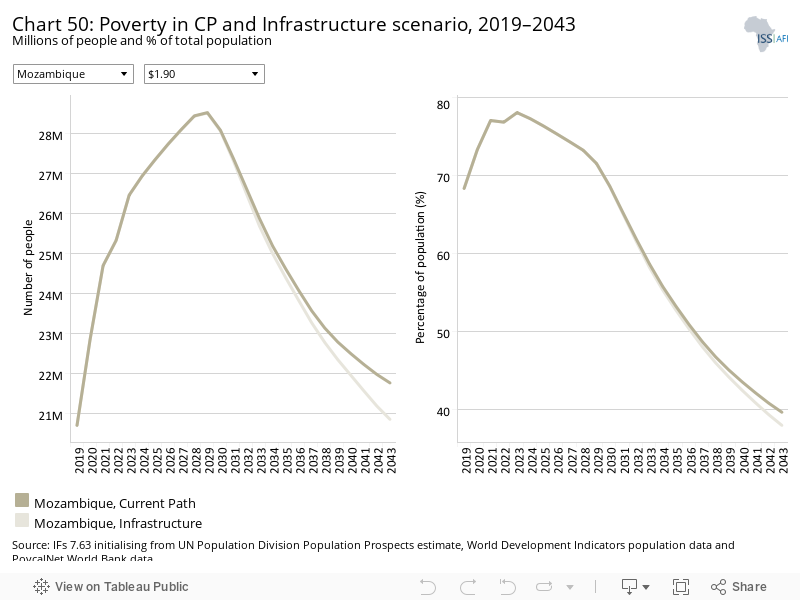
By 2043, poverty will drop marginally from 39.7% in the Current Path forecast to 38% in the Infrastructure scenario, lifting an additional 910 000 people out of extreme poverty. While poverty rates will drop from 68.4% in 2019 to 38% by 2043, the absolute number of people subjected to extreme poverty will remain unchanged at 20.9 million by 2043 (Chart 50).
The Governance scenario represents a reasonable but ambitious improvement in accountability and reduces corruption, and hence improves the quality of service delivery by government.
The intervention is explained here in the thematic part of the website.
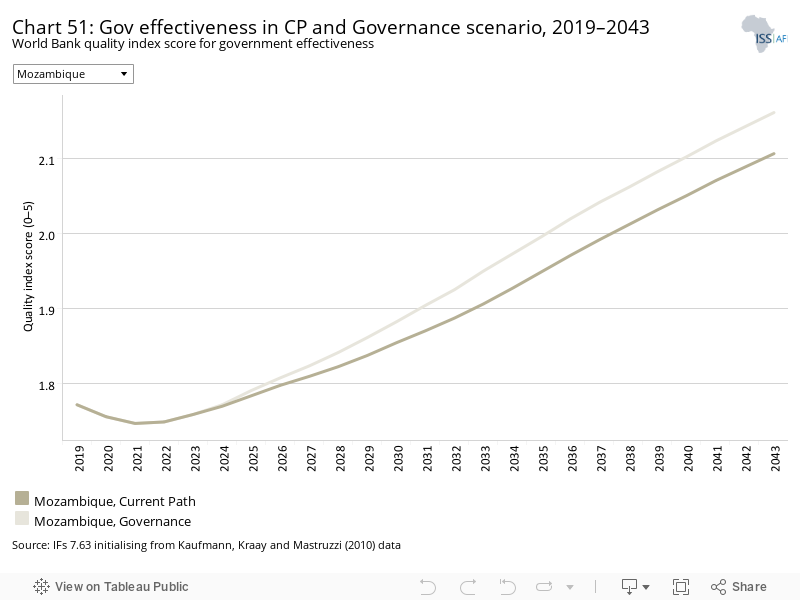
As defined by the World Bank, government effectiveness ‘captures perceptions of the quality of public services, the quality of the civil service and the degree of its independence from political pressures, the quality of policy formulation and implementation, and the credibility of the government’s commitment to such policies’.
Chart 51 displays the government effectiveness quality score for Mozambique compared to low-income countries in Africa in the Current Path forecast and in the Governance scenario. Mozambique scores higher than the average for low-income countries in Africa in both scenarios, and its score is projected to increase to 2.2 by 2043, compared to 2 in the Current Path forecast.
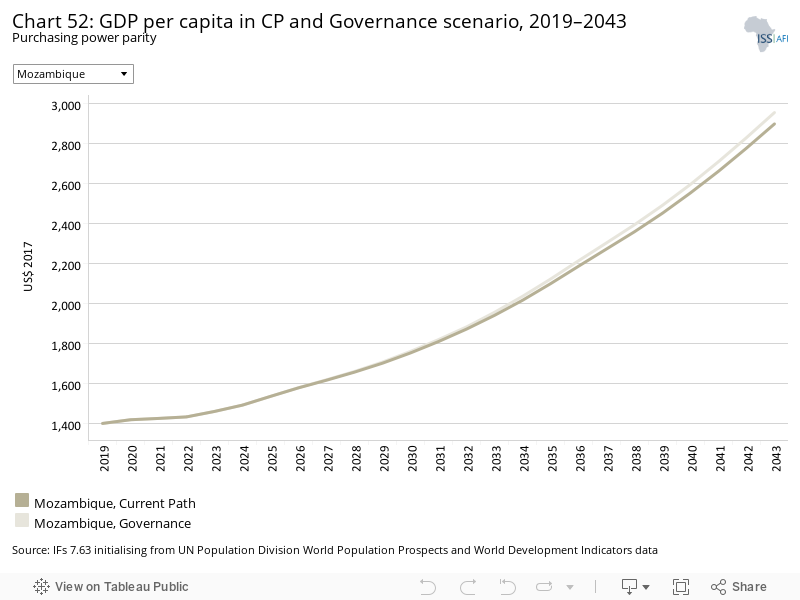
The Governance scenario has a very small impact on Mozambique’s GDP per capita, as displayed in Chart 52. GDP per capita is expected to increase to US$2 954 in this scenario compared to US$2 897 in the Current Path forecast for 2043.
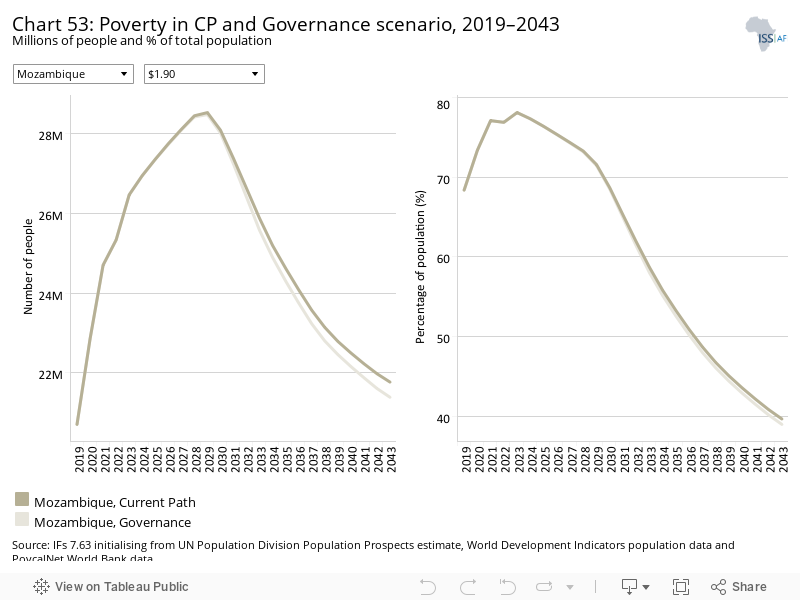
The Governance scenario will also have a small impact on alleviating poverty by 2043 and will reduce poverty by only 0.7 percentage points compared to the Current Path forecast by 2043. This scenario will lift an additional 380 000 people out of poverty by 2043. The poverty rate will remain very high at 39% and Mozambique will continue to be among the ten poorest countries in Africa throughout 2043.
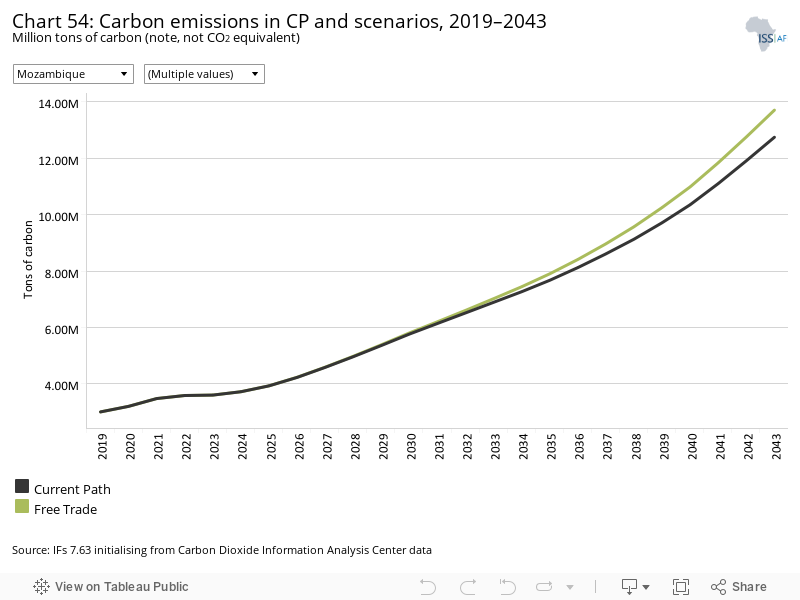
This section presents projections for carbon emissions in the Current Path for [Mozambique] and the 11 scenarios. Note that IFs uses carbon equivalents rather than CO2 equivalents.
Mozambique’s carbon emissions are projected to increase most in the Agriculture scenario, emitting an additional 11.1 million tons of carbon by 2043 compared to 2019, and 1.4 million tons of carbon more than in the Current Path forecast for 2043. This increase is brought about by the increased agricultural production associated with this scenario.
In the Demographic scenario, emissions are forecast to be the lowest. In 2043, emissions in the Demographic scenario are likely to be 0.2 million metric tons less than emissions in the Current Path forecast for the same year. This is largely the result of the population being smaller by 2.7 million people in the Demographic scenario compared to the Current Path forecast.
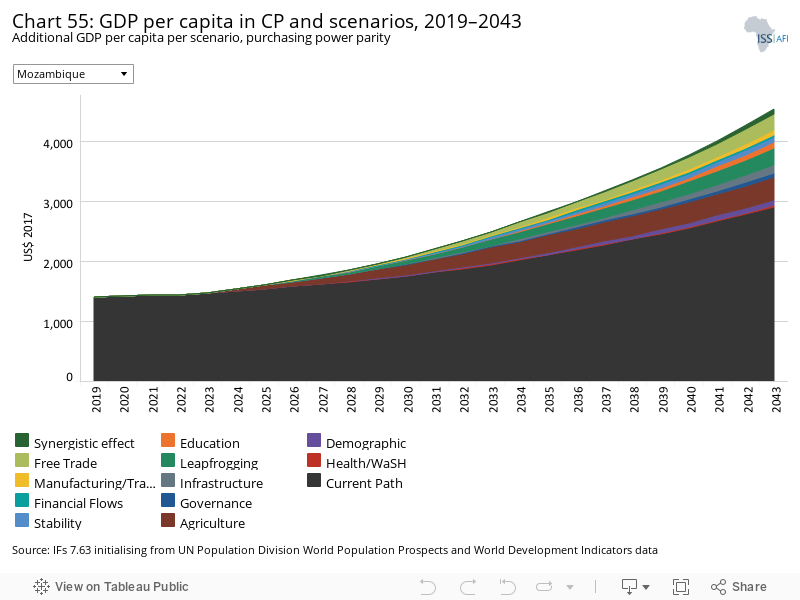
The Combined Agenda 2063 scenario consists of the combination of all 11 sectoral scenarios presented above, namely the Stability, Demographic, Health/WaSH, Agriculture, Education, Manufacturing/Transfers, Leapfrogging, Free Trade, Financial Flows, Infrastructure and Governance scenarios. The cumulative impact of better education, health, infrastructure, etc. means that countries get an additional benefit in the integrated IFs forecasting platform that we refer to as the synergistic effect. Chart 55 presents the contribution of each of these 12 components to GDP per capita in the Combined Agenda 2063 scenario as a stacked area graph.
Although Mozambique faces stark challenges as outlined in the previous sections, there are plenty of opportunities to improve the future of the country. Improving agricultural production and increasing yields will raise GDP per capita most by 2043 with an additional US$383 above the Current Path forecast. Increasing economic freedom through the full implementation of the AfCFTA will increase per capita income by US$278 while formalising the informal sector, increasing government efficiency and providing greater electricity access through leapfrogging could increase per capita income by US$273.
A more stable country can raise per capita income in 2043 by US$217 (Chart 55). The synergistic effect of the Combined Agenda 2063 scenario that assumes improvements are made in all 11 broad intervention areas, could add an additional US$146 in 2043 on top of the combined US$4 588 per capita.
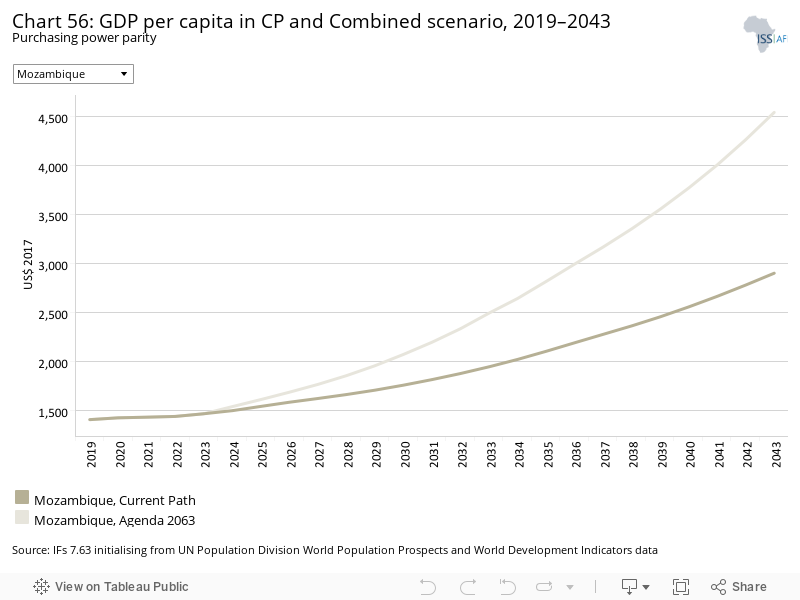
Chart 55 presented a stacked area graph on the contribution of each scenario to GDP per capita as well as the additional benefit or synergistic effect, whereas Chart 56 presents cumulative GDP per capita in the Current Path forecast and the Combined Agenda 2063 scenario.
The Combined Agenda 2063 scenario has the potential to raise GDP per capita to US$4 734 by 2043, US$1 837 above the Current Path forecast for the same year. The gap between Mozambique and the average for low-income countries in Africa is however expected to grow. In 2019 Mozambique’s per capita income was US$258 lower than its income peers; this gap is expected to grow to US$2 000 by 2043.
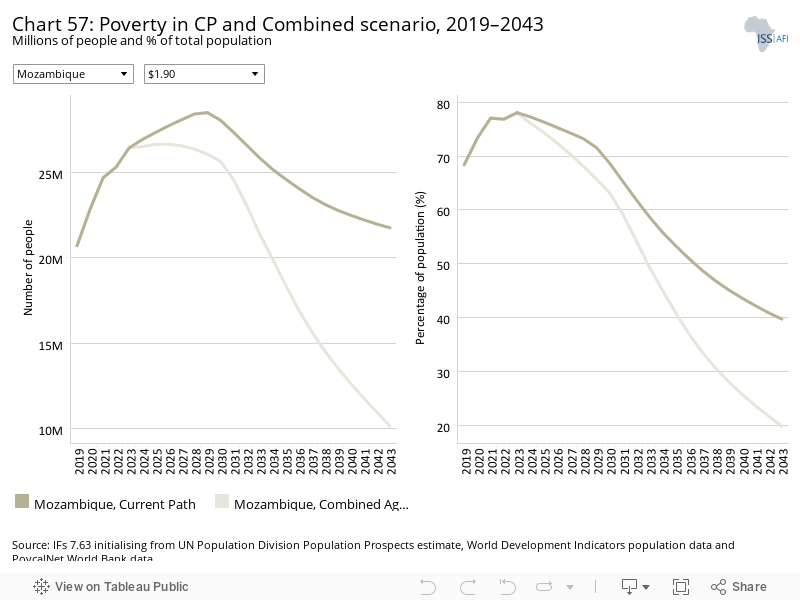
Mozambique’s natural resource potential and large gas reserves could significantly benefit the economic growth of the country. This however will require an improvement in stability, significant improvements in budget management and transparency, and rapid roll-out of basic service delivery. Without these measures and the interventions outlined above, Mozambique’s projected economic growth will do little to improve human development for the poorest and most vulnerable in the country. [17ISS Africa, Prospects and Challenges: Mozambique’s Growth and Human Development Outlook to 2040, 2017] If Mozambique can effectively implement measures as outlined in the Combined Agenda 2063, 12.2 million fewer people could be living in extreme poverty by 2043. Even in this optimistic scenario, 9.6 million people (18.7% of the population) will still live in extreme poverty in 2043 (Chart 57).
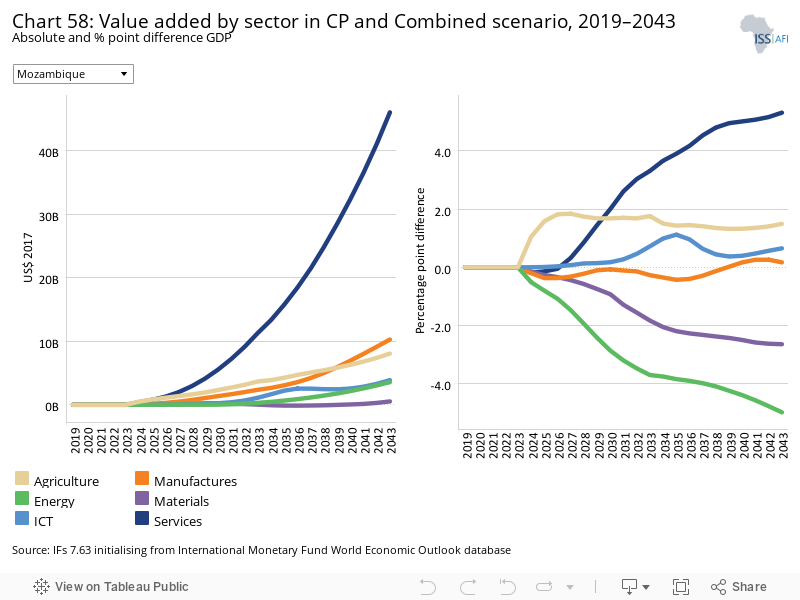
See Chart 8 to view the Current Path forecast of the sectoral composition of the economy.
Chart 58 displays the percentage-point difference and the value difference between the Current Path forecast and the Combined Agenda 2063 scenario for the six sectors of the economy modelled in IFs. The service sector will contribute 5.8 percentage points more to GDP in the Agenda 2063 scenario compared to the Current Path forecast, equivalent to a difference of US$51.5 billion by 2043. Agriculture will contribute 1.1 percentage points more, which will translate to a value of US$11.9 billion by 2043. ICT and manufacturing will respectively contribute 0.7 and 0.4 percentage points more to GDP in the Combined Agenda 2063 scenario.
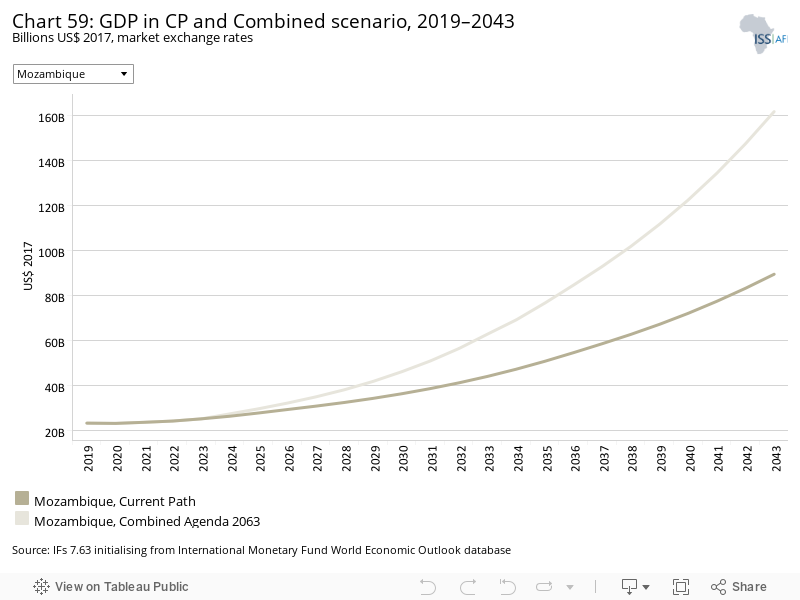
Chart 59 displays the projected GDP from 2019 to 2043 for both the Agenda 2063 scenario and the Current Path forecast. Mozambique’s GDP is forecast to grow substantially to US$170.2 billion by 2043, compared to US$89.6 in the Current Path forecast, an increase of 90%. This shows the value that the interventions in the 11 sectoral scenarios could have on economic growth. This economic growth will have to be invested in human development and basic infrastructure to ensure poverty is addressed and that quality of living is raised for citizens.
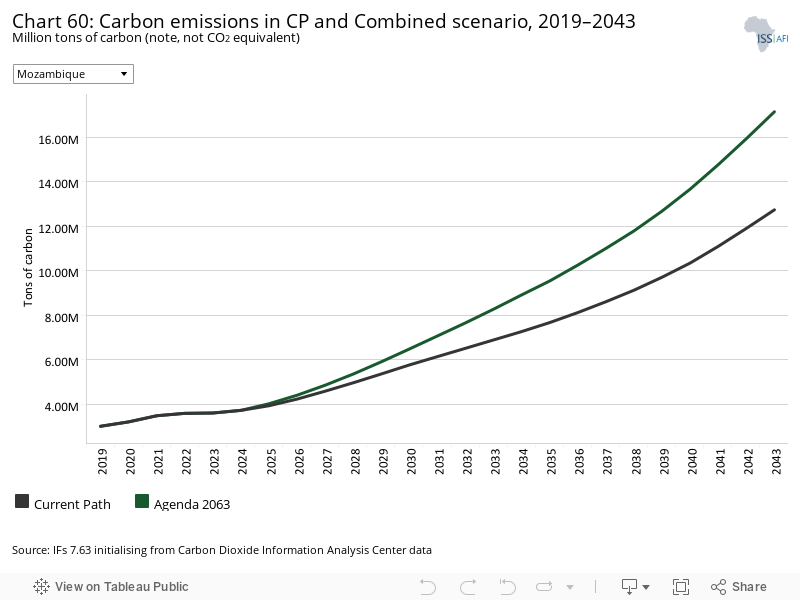
Chart 60 displays projected tons of carbon emission for Mozambique in the Agenda 2063 scenario and the Current Path forecast. In 2019, Mozambique’s carbon emissions were 3 million tons and are projected to increase to 17.7 million tons of carbon by 2043 in the Combined Agenda 2063 scenario, 5 million tons above the Current Path forecast for 2043. This is the result of aggressive economic growth and a substantial increase in agricultural production.
Endnotes
ISS Africa, Prospects and Challenges: Mozambique’s Growth and Human Development Outlook to 2040, 2017
EM-DAT, 2021, www.emdat.be/
CL Davis-Reddy and K Vincent, 2017, Climate Risk and Vulnerability: A Handbook for Southern Africa
ISS Africa, Prospects and Challenges: Mozambique’s Growth and Human Development Outlook to 2040, 2017
ISS Africa, Prospects and Challenges: Mozambique’s Growth and Human Development Outlook to 2040, 2017
ISS Africa, Prospects and Challenges: Mozambique’s Growth and Human Development Outlook to 2040, 2017
G Aga et al., Informal Firms in Mozambique Status and Potential, June 2021
ISS Africa, Prospects and Challenges: Mozambique’s Growth and Human Development Outlook to 2040, 2017
OCHA, Mozambique: Humanitarian Response Dashboard, January–September 2021
The World Bank, Primary completion rate, total (% of relevant age group) - Mozambique, 2021
ISS Africa, Prospects and Challenges: Mozambique’s Growth and Human Development Outlook to 2040, 2017
UNCTAD, World Investment Report 2021, 2021
AfCAP, Climate Adaptation: Risk Management and Resilience Optimisation for Vulnerable Road Access in Africa, February 2019
AfCAP, Climate Adaptation: Risk Management and Resilience Optimisation for Vulnerable Road Access in Africa, February 2019
ISS Africa, Prospects and Challenges: Mozambique’s Growth and Human Development Outlook to 2040, 2017
Page information
Contact at AFI team is Alize le Roux
This entry was last updated on 13 December 2023 using IFs v7.63.
Donors and sponsors


Reuse our work
- All visualizations, data, and text produced by African Futures are completely open access under the Creative Commons BY license. You have the permission to use, distribute, and reproduce these in any medium, provided the source and authors are credited.
- The data produced by third parties and made available by African Futures is subject to the license terms from the original third-party authors. We will always indicate the original source of the data in our documentation, so you should always check the license of any such third-party data before use and redistribution.
- All of our charts can be embedded in any site.
Cite this research
Alize le Roux (2024) Mozambique. Published online at futures.issafrica.org. Retrieved from https://futures.issafrica.org/geographic/countries/mozambique/ [Online Resource] Updated 13 December 2023.