 Mauritania
Feedback welcome
Our aim is to use the best data to inform our analysis. See our Technical page for information on the IFs forecasting platform. We appreciate your help and references for improvements via our feedback form.
In this entry, we first describe the Current Path (CP) forecast for Mauritania as it is expected to unfold to 2043, the end of the third ten-year implementation plan of the African Union’s Agenda 2063 long-term vision for Africa. The Current Path in the International Futures (IFs) forecasting model initialises from country-level data that is drawn from a range of data providers. We prioritise data from national sources.
The Current Path forecast is divided into summaries on demographics, economics, poverty, health/WaSH and climate change/energy. A second section then presents a single positive scenario for potential improvements in stability, demographics, health/WaSH, agriculture, education, manufacturing/transfers, leapfrogging, free trade, financial flows, infrastructure, governance and the impact of various scenarios on carbon emissions. With the individual impact of these sectors and dimensions having been considered, a final section presents the impact of the Combined Agenda 2063 scenario.
We generally review the impact of each scenario and the Combined Agenda 2063 scenario on gross domestic product (GDP) per person and extreme poverty except for Health/WaSH that uses life expectancy and infant mortality.
The information is presented graphically and supported by brief interpretive text.
Summary
- Current Path forecast
- Mauritania is the least populous country in North Africa with a population of 4.5 million people in 2019. With a GDP per capita of US$4 138, Mauritania is classified as a lower middle-income economy as per the World Bank 2021 ranking. In 2019, close to 1 million people, equivalent to 34.6% of the population, lived below the poverty line of US$3.20 per day. Jump to Current Path forecast
- In the Current Path forecast, Mauritania’s population will grow to 8 million people in 2043 — an increase of 76.4%. Such fast growth is due to relatively high birth rates, which currently stand at 2.4 births per woman, and expected increases in average life expectancy, which was 70.8 years in 2019. Jump to Current Path forecast
- Mauritania will continue to become even more urbanised with 68.8% of its population living in towns and cities by 2043, up from 54.6% in 2019. Jump to Demographics: Current Path
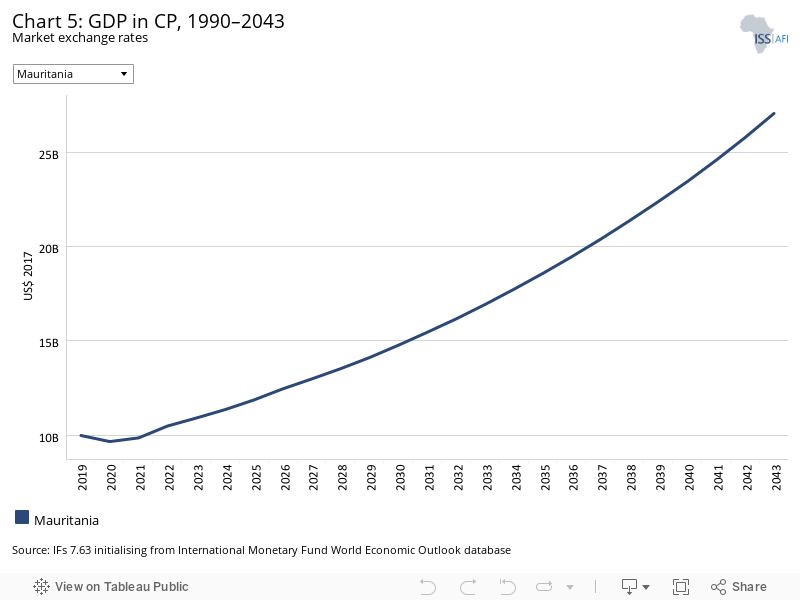
- Between 1990 and 2019, Mauritania’s GDP more than doubled from US$4 billion to US$10 billion. Until 2043, the country’s GDP will expand almost sevenfold to US$27.1 billion. The service sector will remain the most important contributor to Mauritania’s GDP by far. Its share is set to grow from 42.6% to 48.4% of GDP (valued at US$13.1 billion) by 2043. Jump to Economics: Current Path
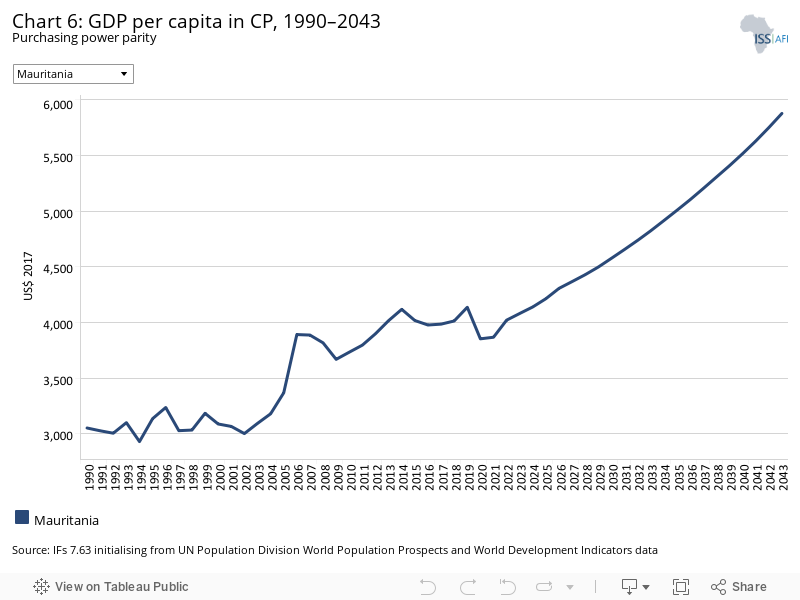
- By 2043, the country will grow its GDP per capita to US$5 879 from US$4 138 in 2019, and reduce the share of people living below the US$3.20 poverty line by 2.4 percentage points to 32.2% from 34.6% in 2019. Jump to Poverty: Current Path
- Sectoral scenarios
- The Stability scenario will accelerate poverty reduction and bring the share of the population living below US$3.20 per day down to 20.9% by 2043 versus 23.2% in the Current Path forecast. Jump to Stability scenario
- The Demographic scenario will ensure that Mauritania benefits from a greater demographic dividend than in the Current Path forecast. Jump to Demographic scenario
- In the Health/WaSH scenario, life expectancy for Mauritanians will increase from 70.8 years in 2019 to 74.1 years in 2043 compared to 73.1 years in the Current Path forecast. Jump to Health/WaSH scenario
- In the Agriculture scenario, GDP per capita will be US$753 higher than in the Current Path forecast. It will also do the most to reduce poverty. Jump to Agriculture scenario
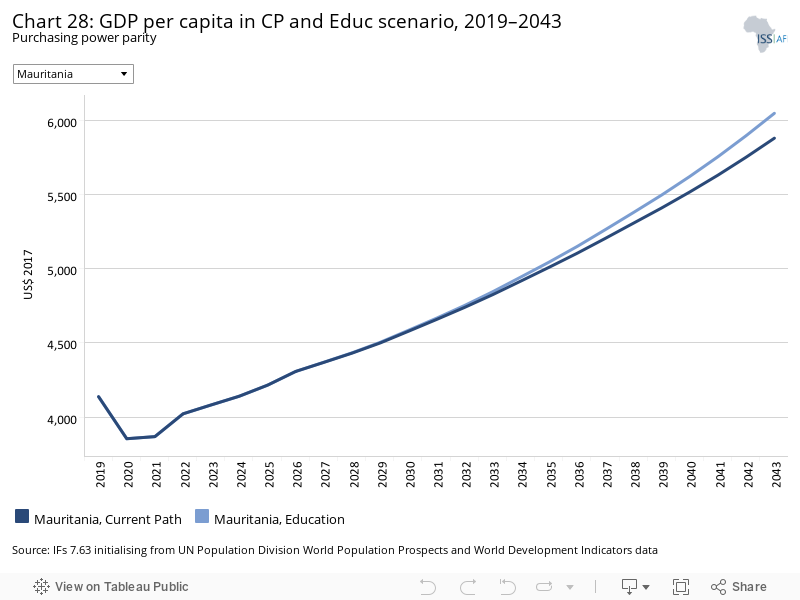
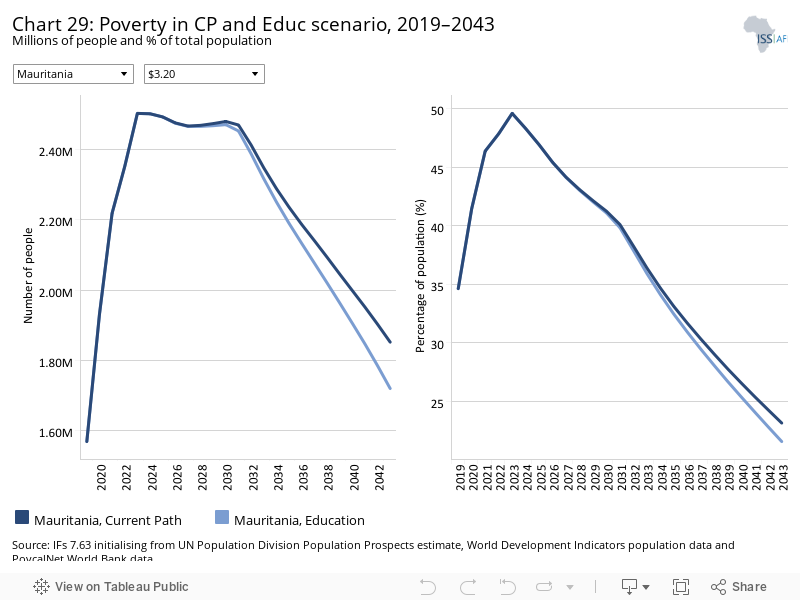
- Since an education system has a lot of inertia, the Education scenario only translates into a modest increase in the GDP per capita from US$4 138 in 2019 to US$5 969 compared to US$5 879 in the Current Path forecast. Jump to Education scenario
- In the Manufacturing/Transfers scenario, the service sector will experience the largest gain in terms of its relative contribution to GDP which is expected to increase by 0.52 percentage points in 2043. Jump to Manufacturing/Transfers scenario
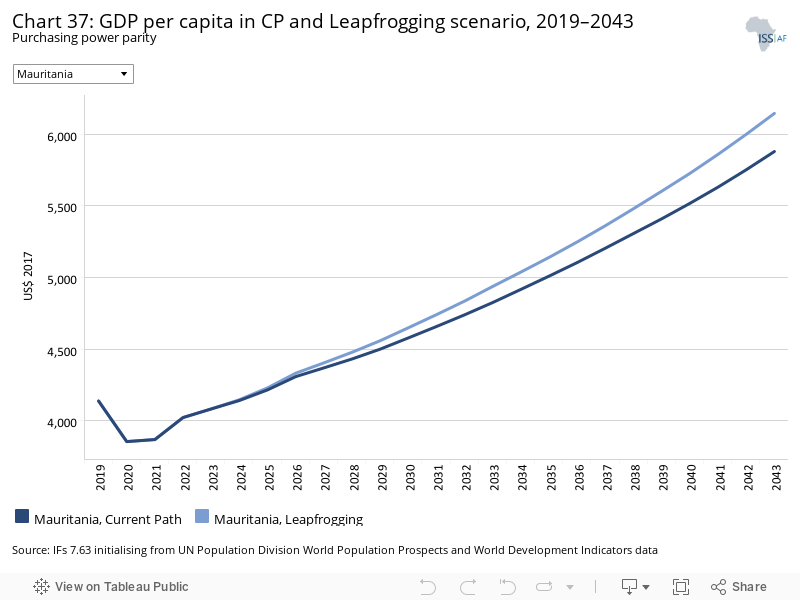
- In the Leapfrogging scenario, 80.5% of the population is expected to have access to electricity by 2043 compared to 72.3% in the Current Path forecast. Jump to Leapfrogging scenario
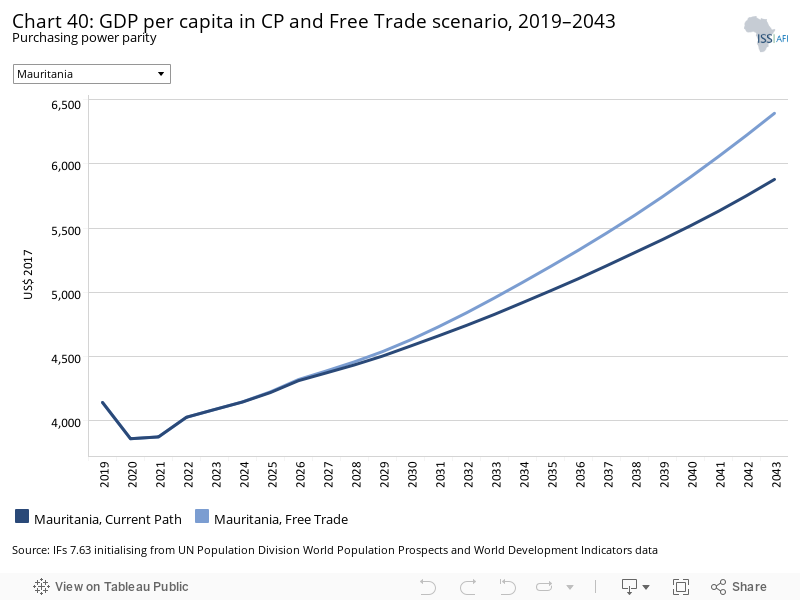
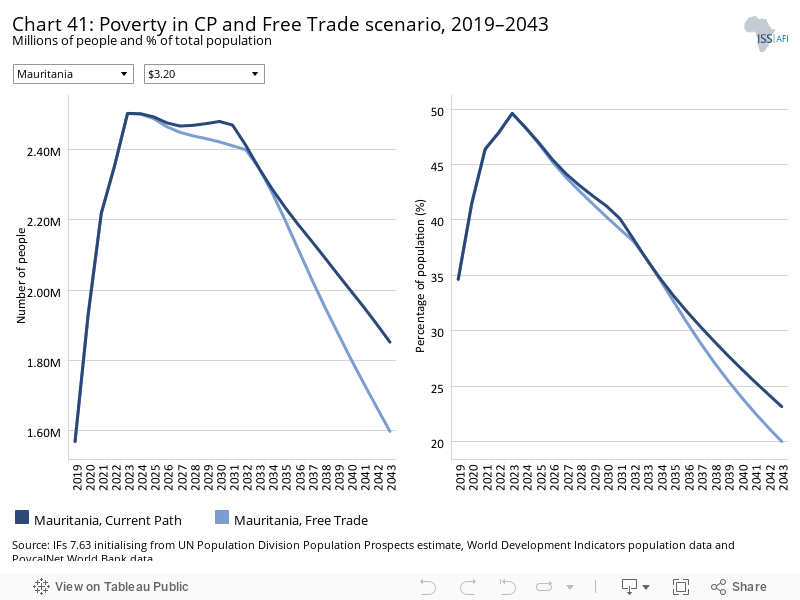
- In the Free Trade scenario, the GDP per capita will be US$517 higher than in the Current Path forecast. Jump to Free Trade scenario
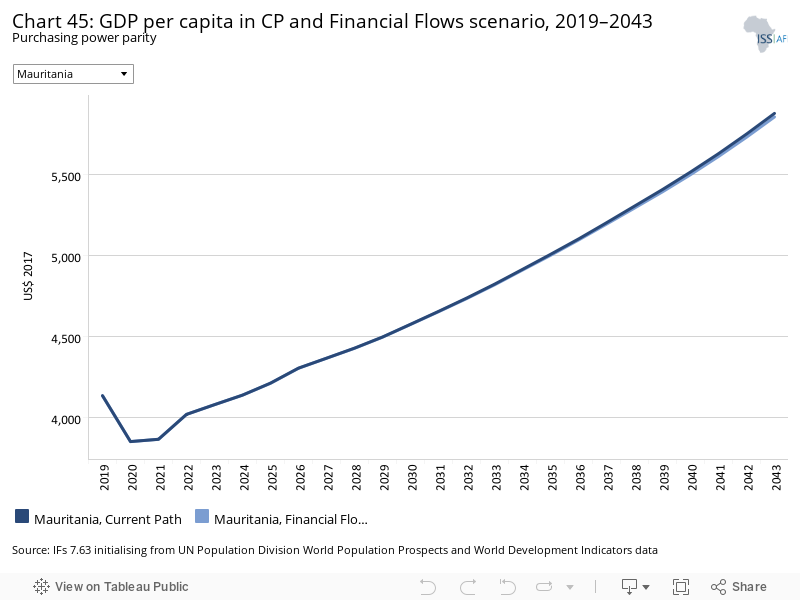
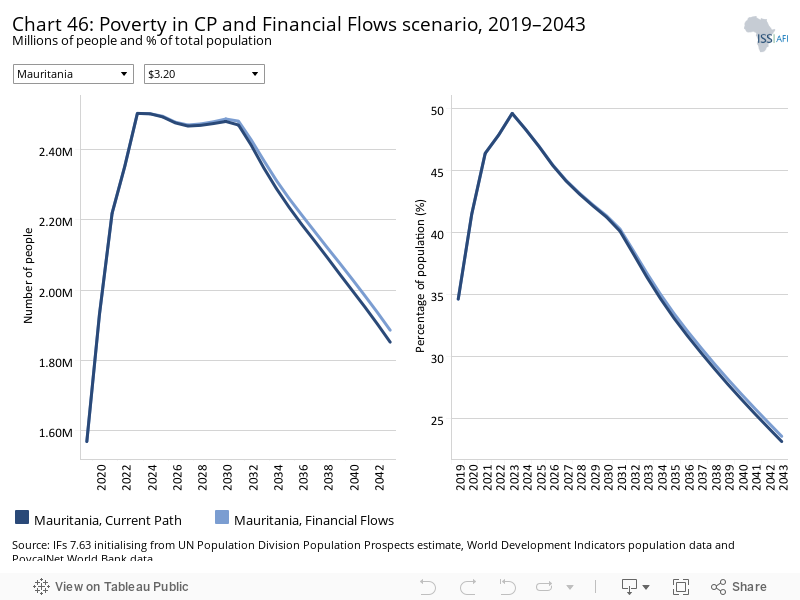
- In the Financial Flows scenario, foreign direct investment inflows will account for 10.3% of GDP, slightly less than in the Current Path forecast. Jump to Financial Flows scenario
- In the Governance scenario, the share of the population living below the poverty line will decline to 21.8% by 2043 versus 23.2% in the Current Path forecast. Jump to Governance scenario
- Combined Agenda 2063 scenario
- In the Combined Agenda 2063 scenario, Mauritania’s carbon emissions will increase more than fourfold to 3.9 million tons by 2043. The country will experience a significant increase in its GDP per capita in 2043 to US$8 808 at almost 50%, or US$2 929, higher than in the Current Path forecast (US$5 879). The country will see an economy that is valued at US$46.9 billion by 2043 compared to US$27.1 billion in the Current Path forecast. Jump to Combined Agenda 2063 scenario
All charts for Mauritania
- Chart 1: Political map of Mauritania
- Chart 2: Population structure in CP, 1990–2043
- Chart 3: Urban and rural population in CP, 1990–2043
- Chart 4: Population density map for 2019
- Chart 5: GDP in CP, 1990–2043
- Chart 6: GDP per capita in CP, 1990–2043
- Chart 7: Informal sector value in CP, 2015–2043
- Chart 8: Value added by sector in CP, 2015–2043
- Chart 9: Agriculture production/demand in CP, 1990–2043
- Chart 10: Poverty in CP, 2015–2043
- Chart 11: Energy production by type in CP, 1990–2043
- Chart 12: Carbon emissions in CP, 1990–2043
- Chart 13: Governance security in CP and Stability scenario, 2019–2043
- Chart 14: GDP per capita in CP and Stability scenario, 2019–2043
- Chart 15: Poverty in CP and Stability scenario, 2019–2043
- Chart 16: Demographic dividend in CP and Demog scenario, 2019–2043
- Chart 17: Infant mortality in CP and Demog scenario, 2019–2043
- Chart 18: GDP per capita in CP and Demog scenario, 2019–2043
- Chart 19: Poverty in CP and Demog scenario, 2019–2043
- Chart 20: Life expectancy in CP and Health/WaSH scenario, 2019–2043
- Chart 21: Infant mortality in CP and Health/WaSH scenario, 2019–2043
- Chart 22: Yield/hectare in CP and Agric scenario, 2019–2043
- Chart 23: Agriculture imports in CP and Agric scenario, 2019–2043
- Chart 24: GDP per capita in the CP and Agric scenario, 2019–2043
- Chart 25: Poverty in CP and Agric scenario, 2019–2043
- Chart 26: Mean years of education in CP and Educ scenario, 2019–2043
- Chart 27: Education quality in CP and Educ scenario, 2019–2043
- Chart 28: GDP per capita in CP and Educ scenario, 2019–2043
- Chart 29: Poverty in CP and Educ scenario, 2019–2043
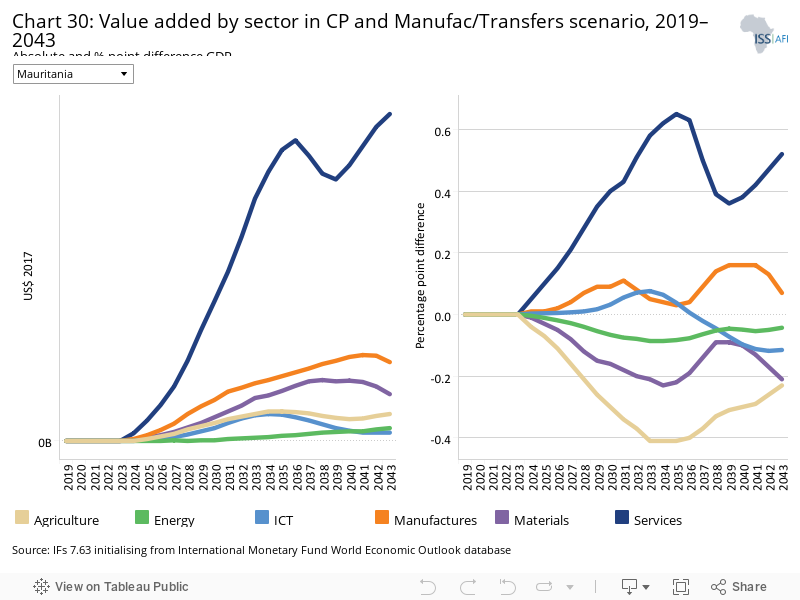
- Chart 30: Value added by sector in CP and Manufac/Transfers scenario, 2019–2043
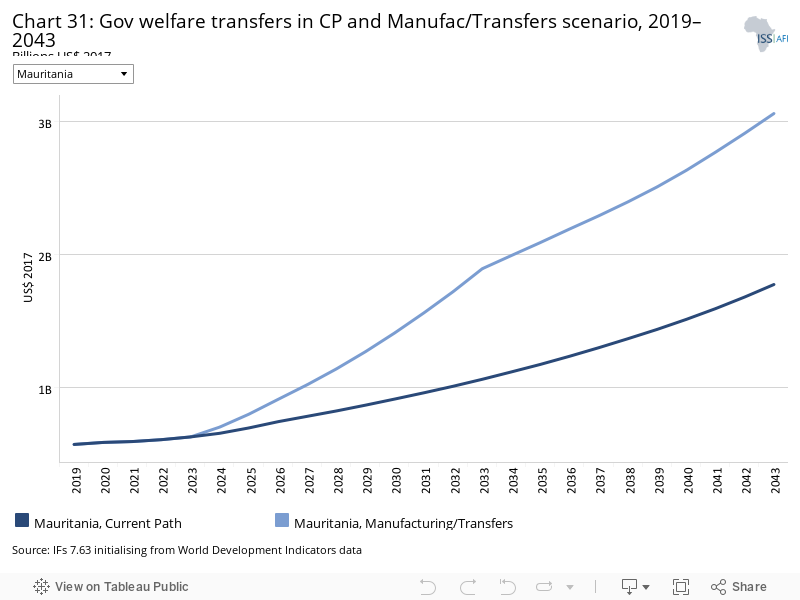
- Chart 31: Gov welfare transfers in CP and Manufac/Transfers scenario, 2019–2043
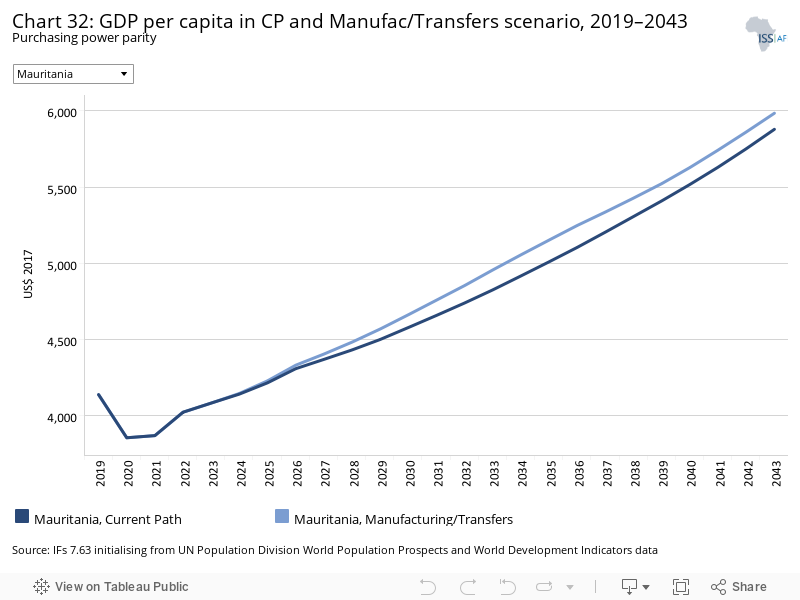
- Chart 32: GDP per capita in CP and Manufac/Transfers scenario, 2019–2043
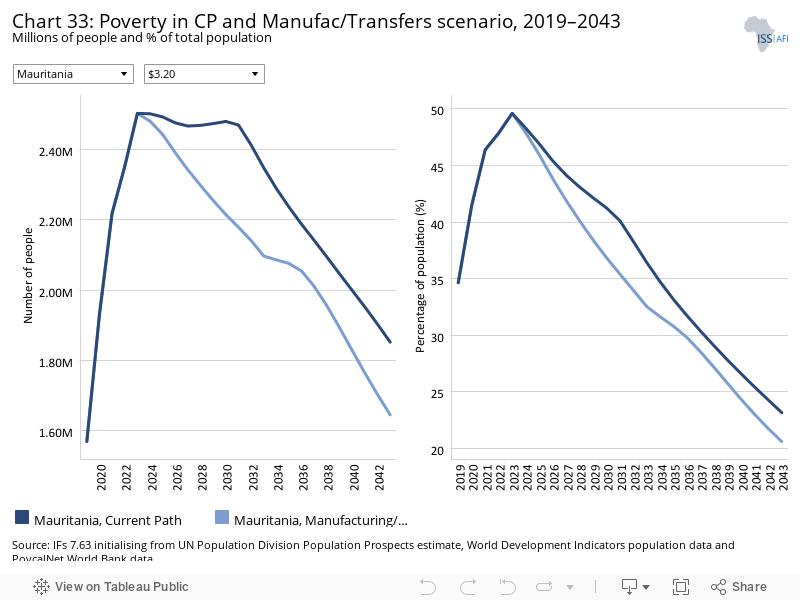
- Chart 33: Poverty in CP and Manufac/Transfers scenario, 2019–2043
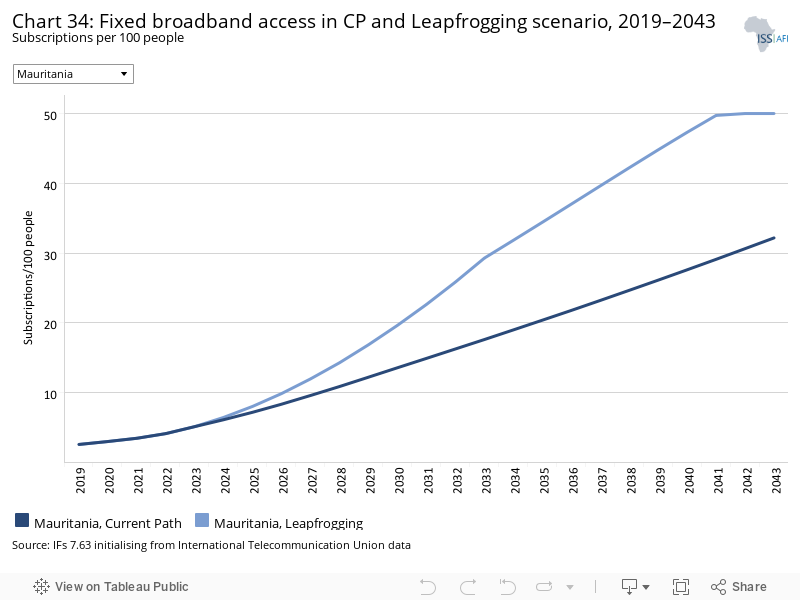
- Chart 34: Fixed broadband access in CP and Leapfrogging scenario, 2019–2043
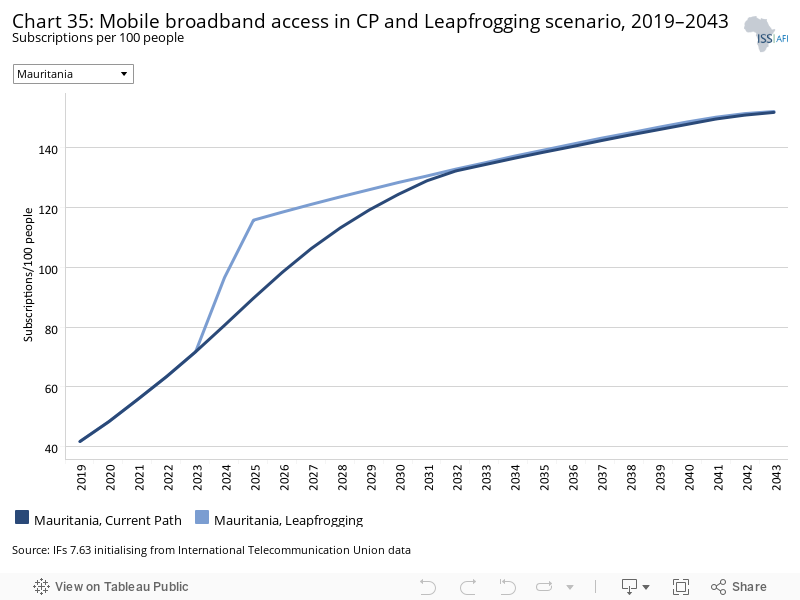
- Chart 35: Mobile broadband access in CP and Leapfrogging scenario, 2019–2043
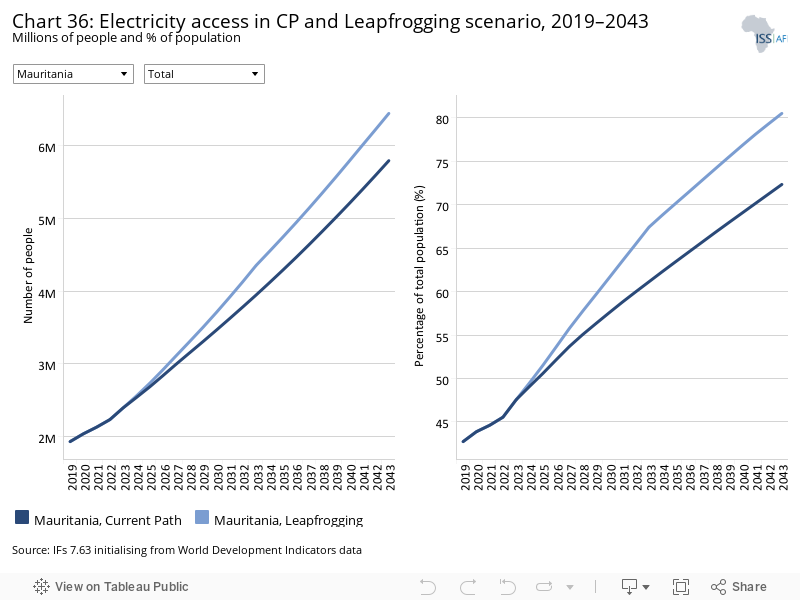
- Chart 36: Electricity access in CP and Leapfrogging scenario, 2019–2043
- Chart 37: GDP per capita in CP and Leapfrogging scenario, 2019–2043
- Chart 38: Poverty in CP and Leapfrogging scenario, 2019–2043
- Chart 39: Trade balance in CP and Free Trade scenario, 2019–2043
- Chart 40: GDP per capita in CP and Free Trade scenario, 2019–2043
- Chart 41: Poverty in CP and Free Trade scenario, 2019–2043
- Chart 42: Foreign aid in CP and Financial Flows scenario, 2019–2043
- Chart 43: Inflow of FDI in CP and Financial Flows scenario, 2019–2043
- Chart 44: Remittances in CP and Financial Flows scenario, 2019–2043
- Chart 45: GDP per capita in CP and Financial Flows scenario, 2019–2043
- Chart 46: Poverty in CP and Financial Flows scenario, 2019–2043
- Chart 47: Electricity access in CP and Infrastructure scenario, 2019–2043
- Chart 48: Rural road access in CP and Infrastructure scenario, 2019–2043
- Chart 49: GDP per capita in CP and Infrastructure scenario, 2019–2043
- Chart 50: Poverty in CP and Infrastructure scenario, 2019–2043
- Chart 51: Gov effectiveness in CP and Governance scenario, 2019–2043
- Chart 52: GDP per capita in CP and Governance scenario, 2019–2043
- Chart 53: Poverty in CP and Governance scenario, 2019–2043
- Chart 54: Carbon emissions in CP and scenarios, 2019–2043
- Chart 55: GDP per capita in CP and scenarios, 2019–2043
- Chart 56: GDP per capita in CP and Combined scenario, 2019–2043
- Chart 57: Poverty in CP and Combined scenario, 2019–2043
- Chart 58: Value added by sector in CP and Combined scenario, 2019–2043
- Chart 59: GDP in CP and Combined scenario, 2019–2043
- Chart 60: Carbon emissions in CP and Combined scenario, 2019–2043

This page provides an overview of the key characteristics of Mauritania along its likely (or Current Path) development trajectory. The Current Path forecast from the International Futures forecasting (IFs) platform is a dynamic scenario that imitates the continuation of current policies and environmental conditions. The Current Path is therefore in congruence with historical patterns and produces a series of dynamic forecasts endogenised in relationships across crucial global systems. We use 2019 as a standard reference year and the forecasts generally extend to 2043 to coincide with the end of the third ten-year implementation plan of the African Union’s Agenda 2063 long-term development vision.
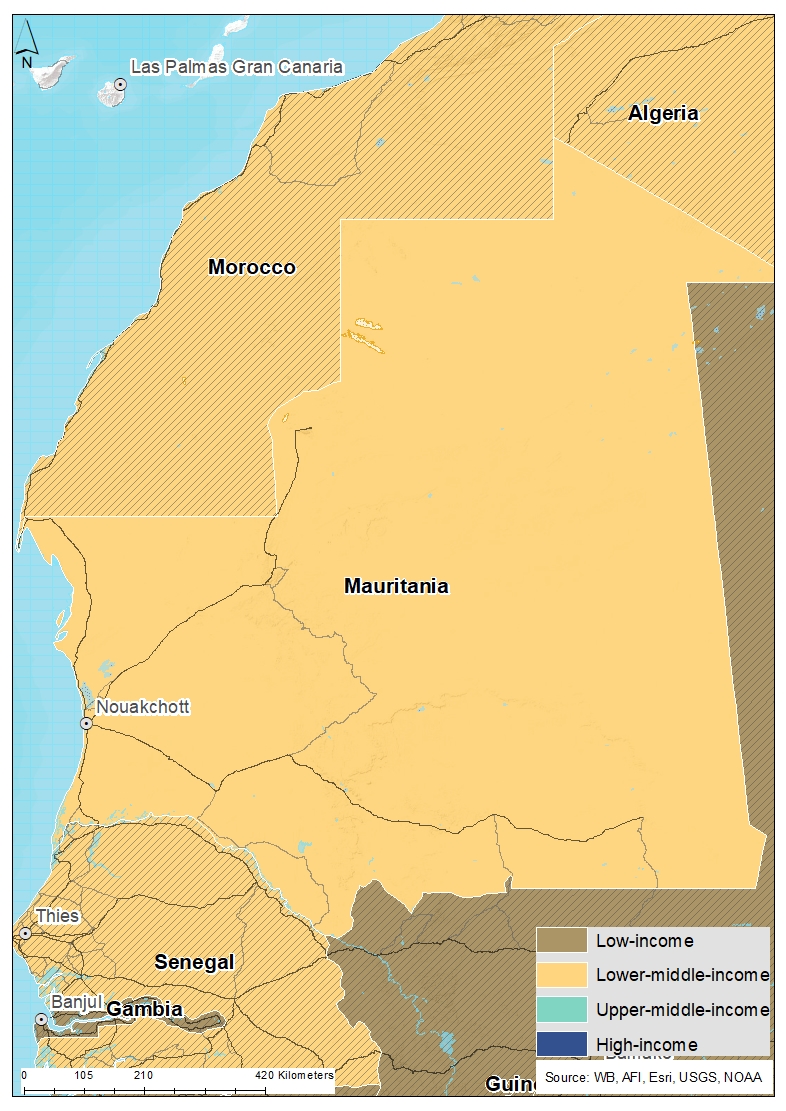
Mauritania, officially the Islamic Republic of Mauritania, is a country in north-west Africa. It is bordered by the Atlantic Ocean to the west, Western Sahara to the north and north-west, Algeria to the north-east, Mali to the east and south-east, and Senegal to the south-west. Mauritania is the eleventh largest country in Africa, and 90% of its territory is situated in the Sahara Desert. It is one of the least densely populated countries in the world, and only 0.5% of its land is arable. Most of its population of approximately 4.5 million people lives in the temperate south of the country with more than 54% of the population living in urban areas. Mauritania’s capital, largest city and population centre is Nouakchott, which is located on the Atlantic coast.
The name Mauritania goes back to the ancient Berber kingdom of Mauretania, located in what is today Morocco and Algeria. The Berber people occupied what is now Mauritania from the third century CE before Arabs conquered the area in the eighth century, bringing with them Islam, Arab culture and the Arabic language. In the early 20th century, France colonised Mauritania as part of French West Africa before the country became independent again in 1960.
Since independence, Mauritania has experienced recurrent coups and periods of military dictatorship. The most recent coup, in 2008, was led by General Mohamed Ould Abdel Aziz, who later won presidential elections in 2009 and 2014. He was succeeded by Mohamed Ould Ghazouani as a result of the 2019 elections, which were considered Mauritania's first peaceful transition of power since independence.
Mauritania is culturally and politically part of the Arab world. The country is a member of the Arab League and Arabic is the sole official language. Mauritania is a member of the United Nations, the African Union, and the Economic Community of West African States (ECOWAS).
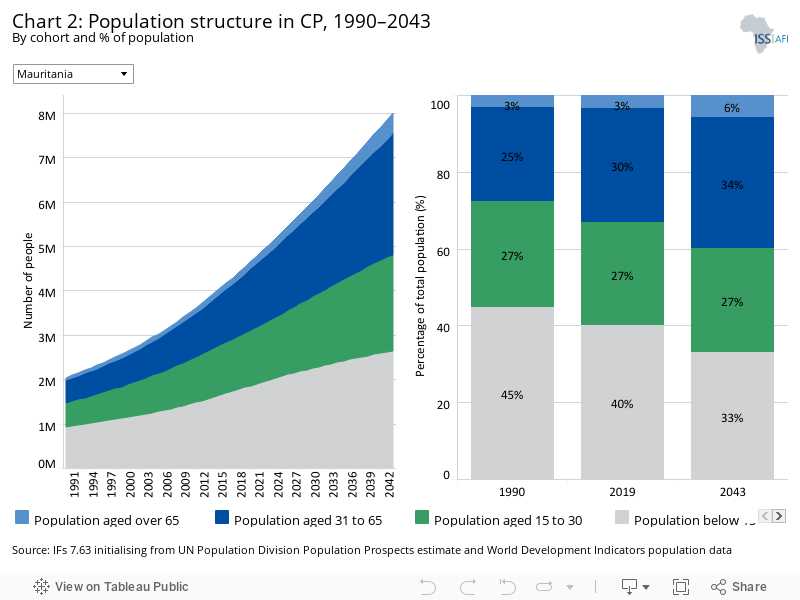
In 1990, Mauritania had a population of just over 2 million people. By 2019 it had more than doubled to 4.5 million. The country still has high birth rates that fuel rapid population growth. In 2019, Mauritania’s average total fertility was 4.6 births per woman, down from 6.1 births per woman in 1990. The current fertility rate is more than double replacement level fertility which is 2.1 births per woman. Mauritania will likely reach replacement level fertility only around 2066.
With a median age of 19.9 years, Mauritania is a very young country and the youngest in North Africa, followed by Egypt with a median age of 24.6 years. The average median age for North Africa is 26.7 years. Mauritania’s population structure is changing gradually. In 2019, 40% of the population was younger than 15 years, compared to 45% in 1990. By 2043, this figure is expected to drop to 33%. At the same time, the share of the population aged between 31 and 65 years is growing: from 25% in 1990 to 30% in 2019, and likely to 35% in 2043. In 2019, 56.6% of Mauritania’s population was of working age (between 15 and 65 years old), and its share is forecast to expand to 61.2% of the overall population.
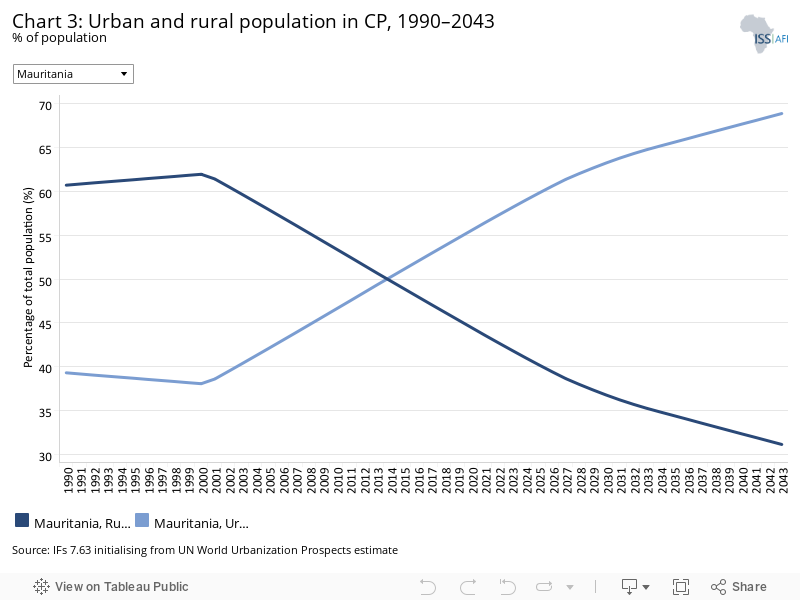
Mauritania already is a predominantly urban country: 54.6% of the population lives in cities and towns and only 45.4% inhabit rural areas. Primarily, this is the result of desertification. Several major droughts during the 1970s destroyed livestock and triggered mass rural to urban migration. The unmanaged urban growth happened primarily in the coastal cities of Nouakchott, Mauritania’s capital, and Nouadhibou. At independence in 1960, Nouakchott was a small town with a population of about 5 250 people. By 1990 it had expanded to 418 590 people — a phenomenal almost 80-fold increase. In 2019, Nouakchott had an average annual urban growth rate of 4.4% and an estimated population of 1.26 million people. This means that close to one-third of Mauritania’s population is concentrated in the capital city.
By 2043, the share of Mauritanians living in cities and towns will increase to 68.8%. This is significantly above the anticipated average rate of 59.4% for its lower middle-income peer group on the continent. In North Africa however, Libya, Algeria, Tunisia and Morocco are more urbanised than Mauritania. Egypt, on the other hand, is still predominantly rural with only 42.8% of its population living in urban areas.
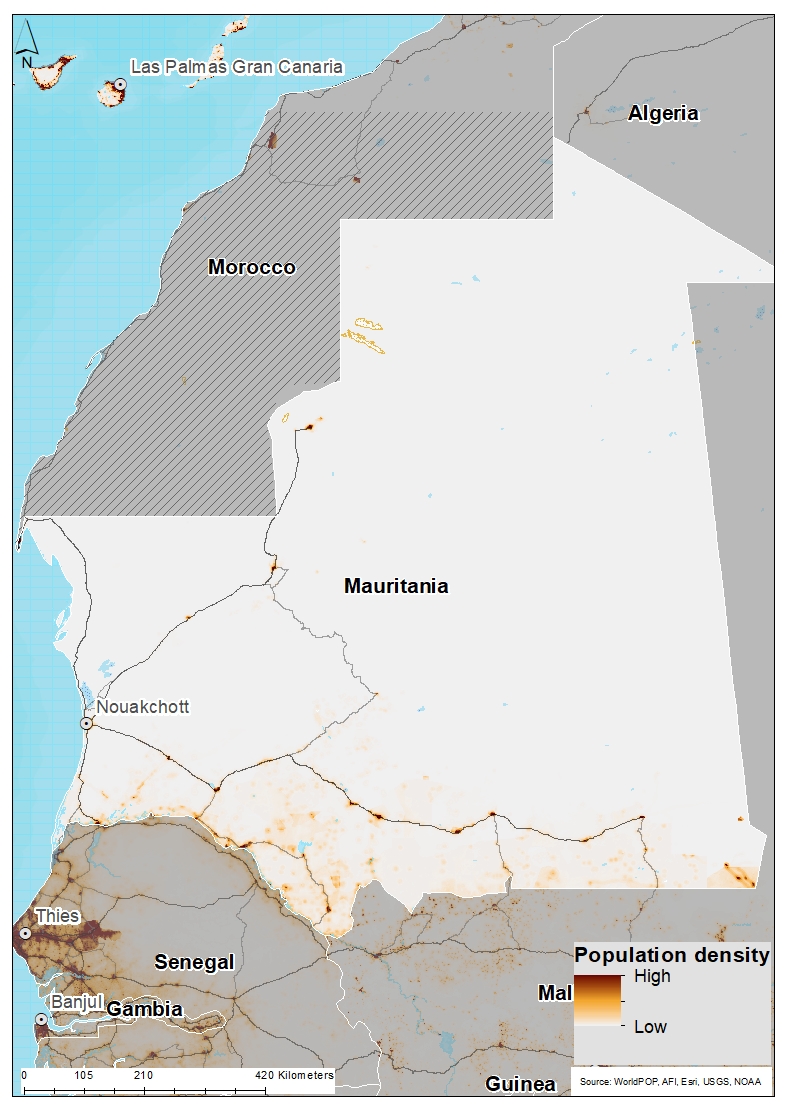
In North Africa, Mauritania is the second least densely populated country, followed by Libya. In 2019, population density was 0.4 people per hectare, which makes Mauritania comparable to countries like Botswana or Namibia in Southern Africa. Population density in Mauritania is set to increase to 0.8 people per hectare by 2043.
Mauritania’s main area of settlement is located along the border with neighbouring Senegal, a primarily agricultural region with high population densities. The area around the capital city Nouakchott is the second most densely populated population centre. The third most important population centre is related to iron ore mining in Zoueiratt and its export through the port of Nouadhibou.
Between 1990 and 2019, Mauritania’s GDP more than doubled from US$4 billion to US$10 billion. Until 2043, the country’s GDP will expand to US$27.1 billion.
Despite an abundance of natural resources, including iron ore and petroleum, Mauritania remains poor. Its economy is based primarily on agriculture, livestock and fishing. In 2019, Mauritania’s economy ranked 17th out of 23 lower middle-income economies in Africa.
Although many of the charts in the sectoral scenarios also include GDP per capita, this overview is an essential point of departure for interpreting the general economic outlook of Mauritania.
In 2019, Mauritania’s GDP per capita ranked sixth out of the 23 lower middle-income countries in Africa at a value of US$4 138 — significantly below the group’s average GDP per capita which stood at US$6 989. Mauritania’s per capita income will increase to US$5 879 by 2043, but it will continue to lag behind the group’s average GDP per capita which is forecast to be US$9 142 in 2043.
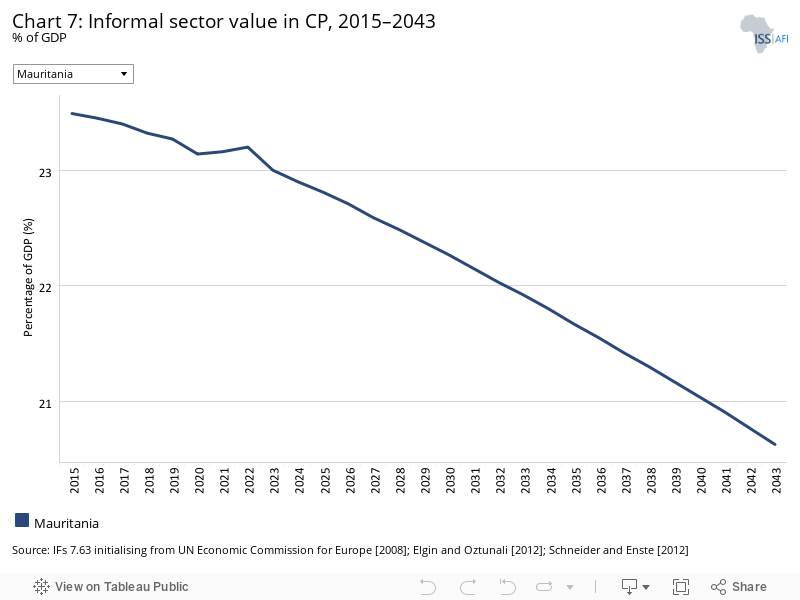
In 2019, Mauritania’s informal sector accounted for approximately 23.3% of GDP. Within IFs, Mauritania had the largest informal sector in North Africa, closely followed by Tunisia and Morocco. The average value for Africa’s lower middle-income economy in 2019 was 29%.
Mauritania’s informal sector is a burden on the formal economy because of low contributions to tax revenues and the subsequent negative impact on expenditure on public utilities. By 2043, the contribution of the informal sector to the country’s GDP is forecast to fall to 20.6%.
In 2019, 40.5% of Mauritania’s labour force worked in the informal sector, mostly in agriculture, including livestock. In North Africa, only Egypt has a larger share of the labour force working in the informal sector. Typically, those workers are vulnerable to lose their job/income and they lack pension or health insurance. The share of workers in the informal sector will drop to 32.1% over the coming decades.
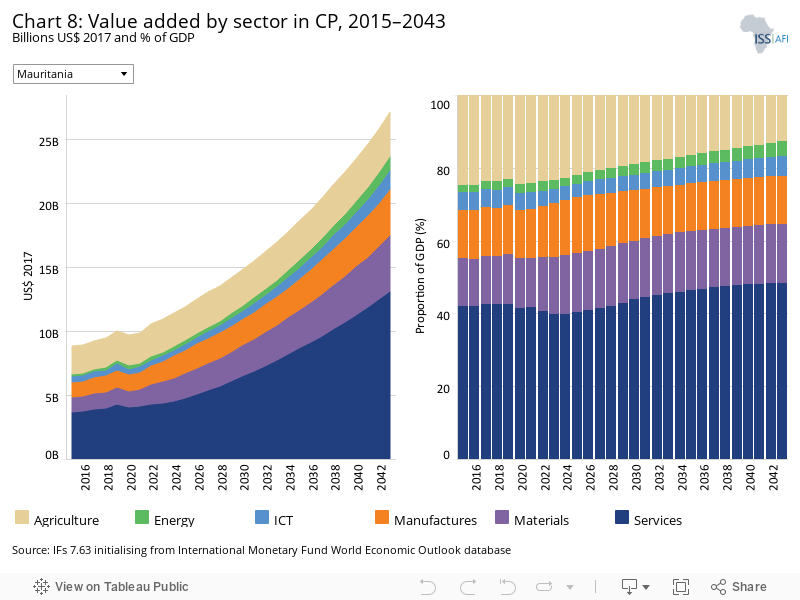
The IFs platform uses data from the Global Trade and Analysis Project (GTAP) to classify economic activity into six sectors: agriculture, energy, materials (including mining), manufacturing, services and information and communication technologies (ICT). Most other sources use a threefold distinction between only agriculture, industry and services with the result that data may differ.
In 2019, Mauritania’s service sector accounted for 42.6% of the country’s GDP (US$54.3 billion), followed by the agriculture sector which represented 23.1% (US$2.3 billion). The third largest sector, both in terms of its contribution to GDP as well as in absolute terms, was the materials sector, which accounted for 13.6% of GDP at a value of US$1.4 billion. The materials sector was closely followed by the manufacturing sector at US$1.3 billion. The ICT and energy sectors accounted for 4.9% and 2.3% of GDP, respectively.
The service sector will remain the most important contributor to Mauritania’s GDP by far. Its share is set to grow to 48.4% of GDP (valued at US$13.1 billion) by 2043. The materials sector is also set to increase to account for 16.3%. The contribution of the agriculture sector, on the other hand, will drop to 12.7% in 2043, although in absolute terms the sector will still experience growth and reach a value of US$3.4 billion. The contribution of the ICT sector will increase by 0.5 percentage points and increase in value to US$1.5 billion in 2043.
Mauritania’s expected trajectory roughly mirrors that of its lower middle-income peer group with the service sector representing both the current and future lion’s share of contribution to GDP.
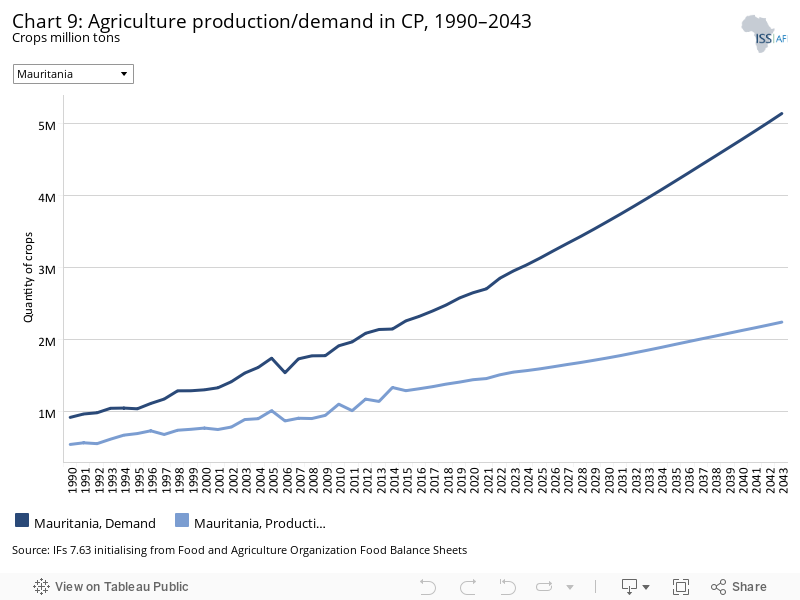
The data on agricultural production and demand in the IFs forecasting platform initialises from data provided on food balances by the Food and Agriculture Organization (FAO). IFs contains data on numerous types of agriculture but aggregates its forecast into crops, meat and fish, presented in million metric tons. Chart 9 shows agricultural production and demand as a total of all three categories.
In 2019, Mauritania’s agriculture sector accounted for 15.5% of GDP, less than in the average lower middle-income economy on the continent where agriculture represented about 17.7% of GDP. In 2019, crop yields were only 3.6 tons per hectare compared to the average of just over 5 tons for its African income peer group. In Egypt, for example, crop yields were 29.2 tons per hectare in 2019.
In Mauritania, many agriculture producers still rely on traditional technologies and have limited access to fertilisers, pesticides and mechanisation, which negatively impact productivity. In 2019, Mauritania’s agricultural production stood at 1.4 million metric tons, falling short of agricultural demand at 2.6 million metric tons. The forecast is for this gap to become larger, resulting in about 2.9 million metric tons of unmet demand in 2043 compared to 1.2 million metric tons in 2019.
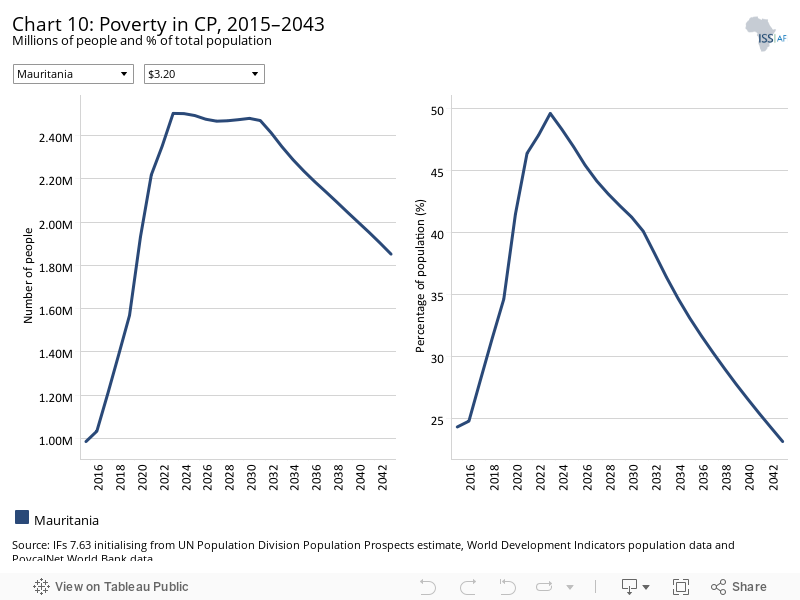
There are numerous methodologies for and approaches to defining poverty. We measure income poverty and use GDP per capita as a proxy. In 2015, the World Bank adopted the measure of US$1.90 per person per day (in 2011 international prices), also used to measure progress towards the achievement of Sustainable Development Goal (SDG) 1 of eradicating extreme poverty. To account for extreme poverty in richer countries occurring at slightly higher levels of income than in poor countries, the World Bank introduced three additional poverty lines in 2017:
- US$3.20 for lower middle-income countries
- US$5.50 for upper middle-income countries
- US$22.70 for high-income countries.
As a lower middle-income country, the World Bank uses the US$3.20 per day benchmark to define extreme poverty in Mauritania. The country’s poverty burden is significant. In 2019, close to 1 million Mauritanians lived below the poverty line; this equals 34.6% of the population, and is close to 3.7 percentage points below the average poverty rate for Africa’s lower middle-income economies which is 38.3%. Over time, the share of Mauritanians living in extreme poverty will further decrease but fast population growth means that the number of poor people is set to rise.
In the Current Path forecast, 1.85 million people, or 23.3% of the population, will live below the poverty line in 2043. In 2019, Mauritania had by far the highest poverty rate in Northern Africa, followed by Egypt.
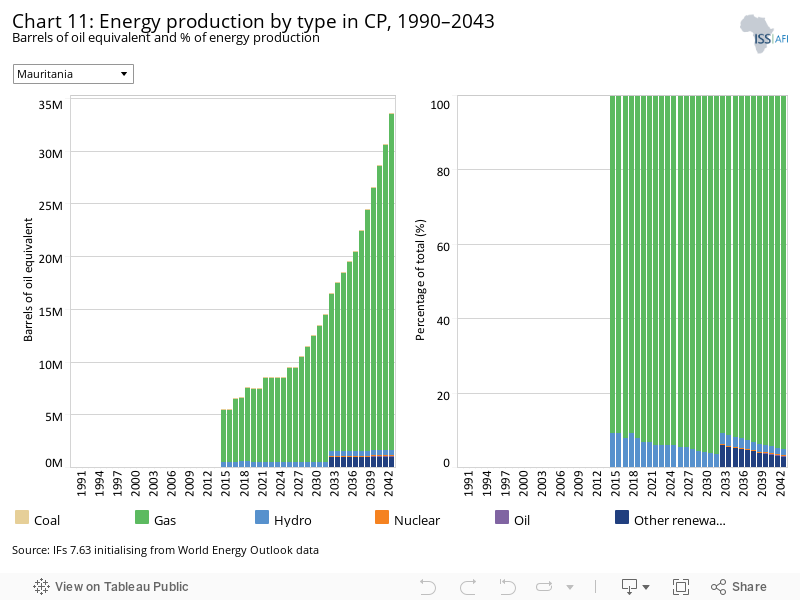
The IFs platform forecasts six types of energy, namely oil, gas, coal, hydro, nuclear and other renewables. To allow comparisons between different types of energy, the data is converted into billion barrels of oil equivalent (BBOE). The energy contained in a barrel of oil is approximately 5.8 million British thermal units (MBTUs) or 1 700 kilowatt-hours (kWh) of energy.
Mauritania's total energy production was equivalent to about 8 million barrels of oil in 2019. By 2043, it is estimated to increase more than fourfold to 34 million barrels of oil equivalent. The country’s energy mix is dominated by gas for 92% of total energy production in 2019, followed by hydro at 8%. By 2043, the country’s reliance on other renewables is set to grow significantly accounting for 3% of total production. In comparison, the contribution of renewables in the average African lower middle-income economies is forecast to stand at 8.1% of total energy production in 2019. In Mauritania, hydro will drop to 1% of total energy. Gas will remain dominant at 95% of total production by then.
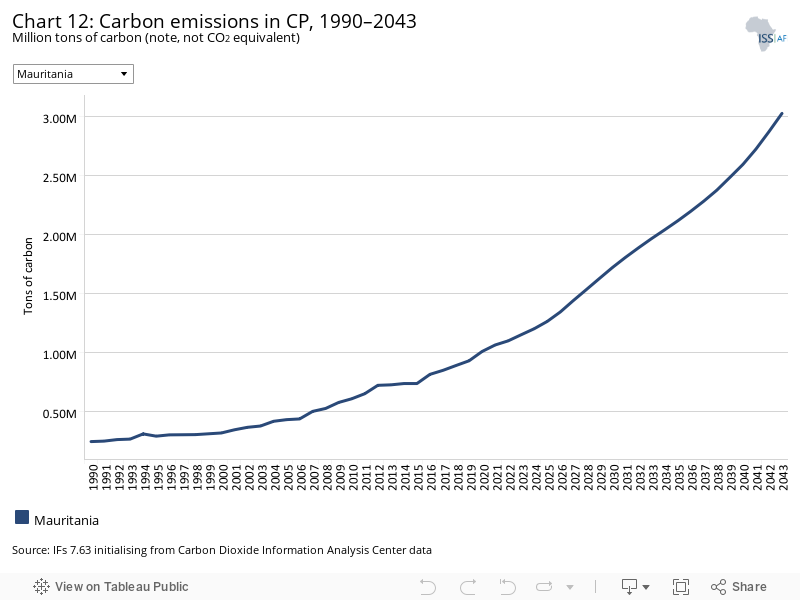
Carbon is released in many ways, but the three most important contributors to greenhouse gases are carbon dioxide (CO2), carbon monoxide (CO) and methane (CH4). Since each has a different molecular weight, IFs uses carbon. Many other sites and calculations use CO2 equivalent.
In 2019, Mauritania emitted only 0.9 million tons of carbon in 2019. Emissions will increase to 3 million tons of carbon by 2043. Mauritania ranks low on emissions within the group of lower middle-income economies in Africa.
Sectoral Scenarios for Mauritania
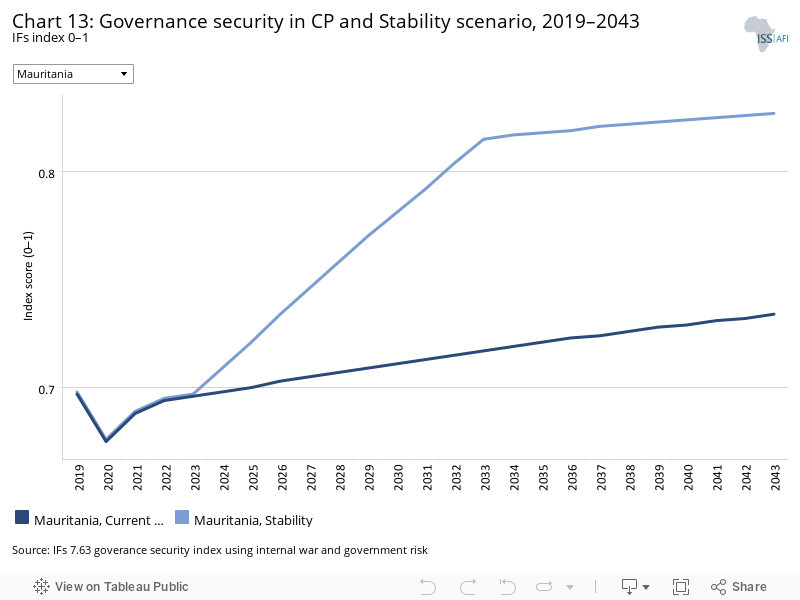
Download to pdfThe Stability scenario represents reasonable but ambitious reductions in the risk of regime instability and lower levels of internal conflict. Stability is generally a prerequisite for other aspects of development and this would encourage inflows of foreign direct investment (FDI) and improve business confidence. Better governance through the accountability that follows substantive democracy is modelled separately.
The intervention is explained here in the thematic part of the website.
Compared to Mali, Burkina Faso and Niger, Mauritania is somewhat of an exception in the Sahel. However, there are signs that armed groups might be operating very closely to the Mauritanian and Senegalese borders in the Malian region of Kayes. Trafficking on the eastern border with Mali is another challenge. To the north, the Polisario Front and Moroccan forces have been clashing near the border with Mauritania since November 2020. Algeria, which is in support of the Polisario Front, has deployed troops in the area, and the Mauritanian government created a Sensitive Defense Zone in the border area with Algeria to be able to monitor the movements of armed groups, traffickers and smugglers.
The Stability scenario reflects significant interventions in increasing regime stability, lowering levels of internal conflict, resulting in reduced military expenditure and larger inflows of FDI.
On the security dimensions of governance, Mauritania scores last in North Africa but around the average of Africa’s lower middle-income economies (0.7). In the Stability scenario, security in Mauritania will improve further to a score of 0.8 in 2043.
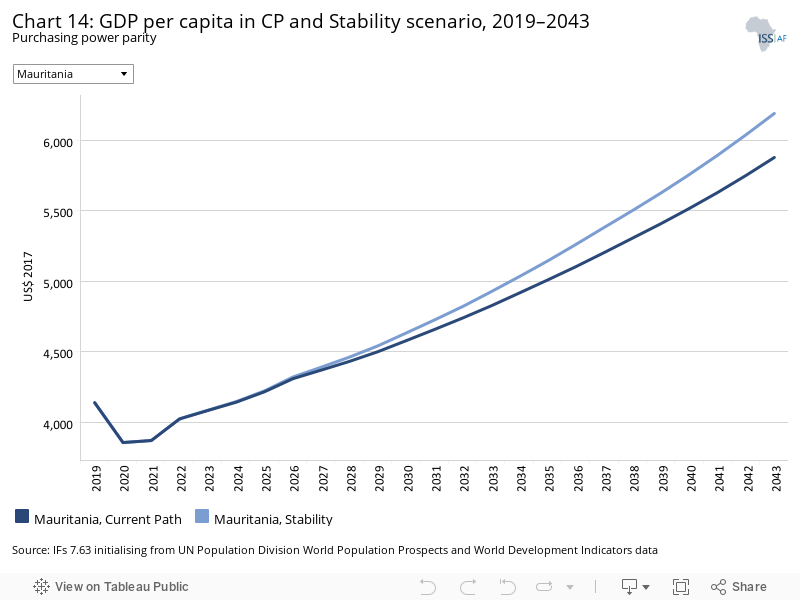
In 2019, Mauritania’s GDP per capita was US$4 138, almost US$1 000 above the average lower middle-income GDP per capita of US$3 056. In the Stability scenario, Mauritania’s GDP per capita will increase to US$6 192 by 2043 — an increase of US$313 compared to the Current Path forecast.
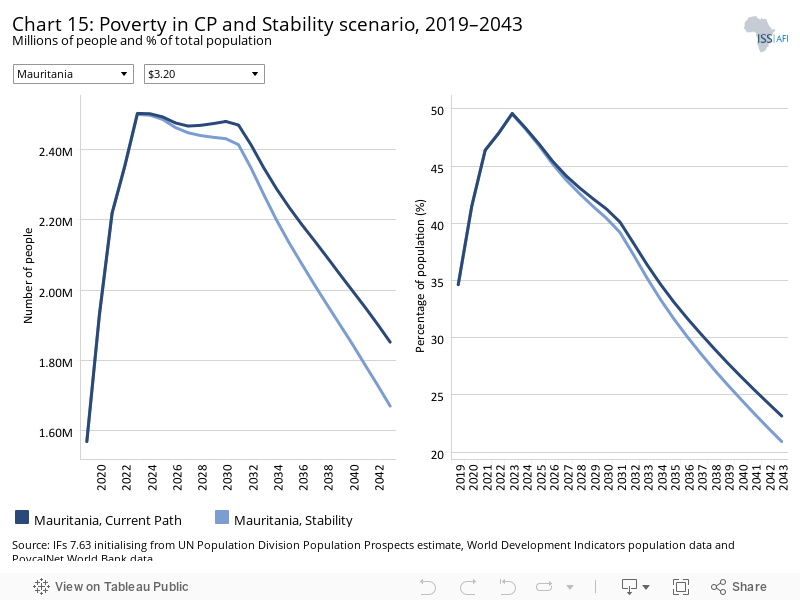
As a lower middle-income economy, the US$3.20 benchmark to define extreme poverty applies to Mauritania. In 2019, almost 1 million people were living below the US$3.20 poverty line, equivalent to 34.6% of the population. In the Stability scenario, about 1.67 million people will live in extreme poverty by 2043 compared to 1.85 million on the Current Path. Despite the increase in absolute terms, Mauritania would see the share of its population living in poverty drop to 20.9% compared to 23.2% on the Current Path.
This section presents the impact of a Demographic scenario that aims to hasten and increase the demographic dividend through reasonable but ambitious reductions in the communicable-disease burden for children under five, the maternal mortality ratio and increased access to modern contraception.
The intervention is explained here in the thematic part of the website.
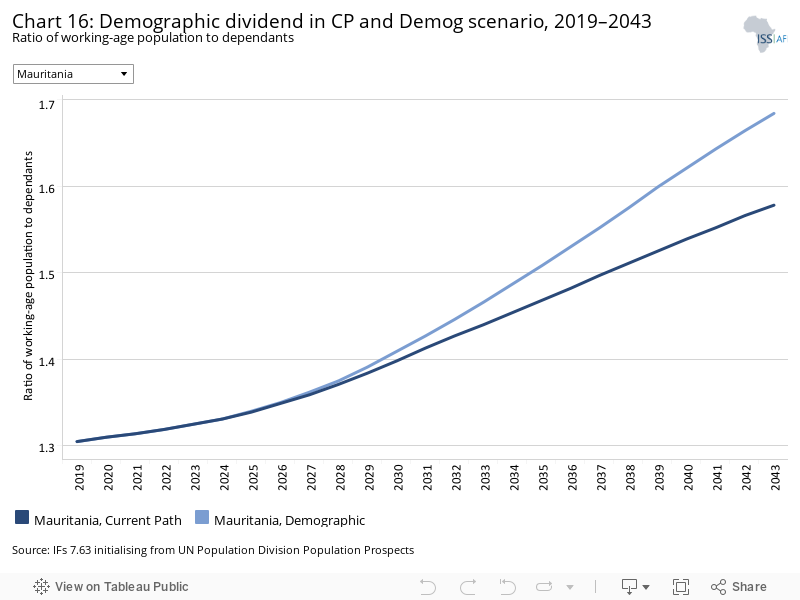
Demographers typically differentiate between a first, second and even a third demographic dividend. We focus here on the contribution of the size of the labour force (between 15 and 64 years of age) relative to dependants (children and the elderly) as part of the first dividend. A window of opportunity opens when the ratio of the working-age population to dependants is equal to or surpasses 1.7.
Given Mauritania’s current stage in the demographic transition, increased access to modern contraception will have a noticeable impact on the country’s total fertility rate, which was estimated at 4.6 children per fertile woman in 2019. In the Demographic scenario, fertility rates will decline more quickly than on the Current Path. By 2043, the average fertility rate will drop to 2.9 births per woman compared to 3.2 on the Current Path. A lower average fertility rate would slow down population growth and translate into a smaller population by 2043: 7.8 million instead of 8 million people.
The interventions in the Demographic scenario let Mauritania benefit from a greater demographic dividend than on the Current Path.
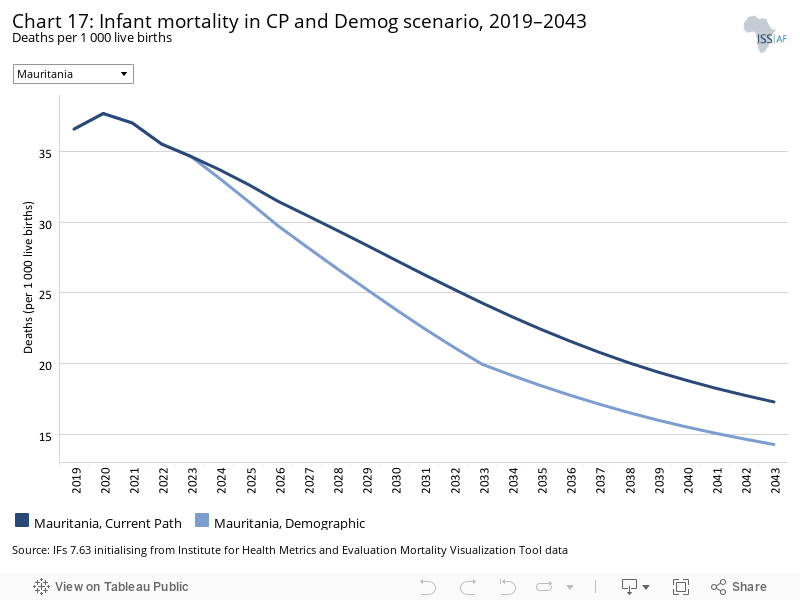
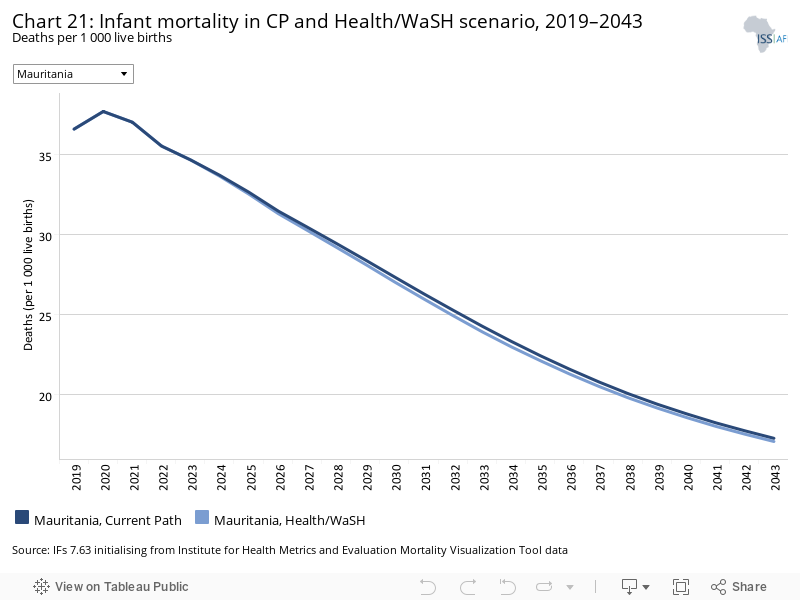
The infant mortality rate is the number of infant deaths per 1 000 live births and is an important marker of the overall quality of the health system in a country.
At 36.6 infant deaths per 1 000 live births, infant mortality in Mauritania is the highest in North Africa, followed by Algeria, Morocco and Egypt. However, it is significantly below the average for the group of African lower middle-income economies which is 46.6 deaths per 1 000 live births. Infant mortality in Mauritania has improved greatly since 1990 when it stood at 69.9 deaths per 1 000 live births. The Demographic scenario will reduce infant mortality rates in Mauritania to 14.3 deaths per 1 000 live births by 2043 compared to 17.1 deaths in the Current Path forecast.
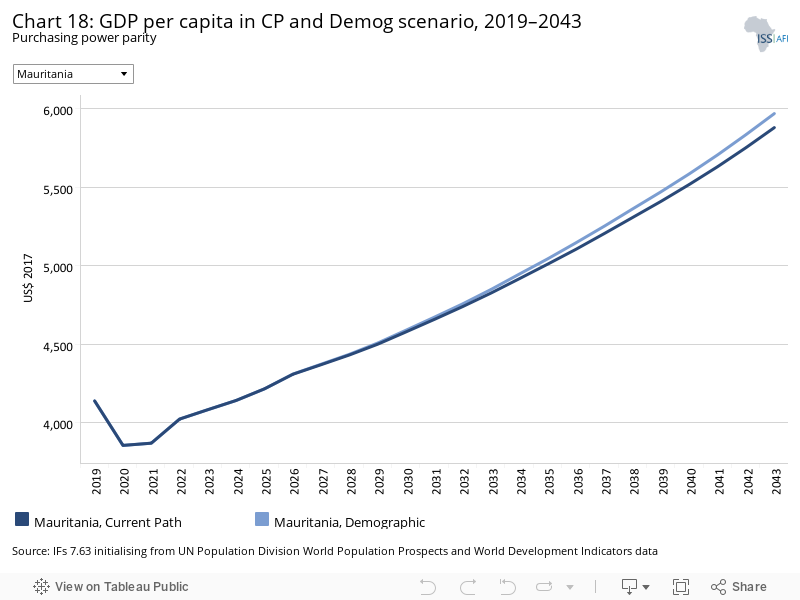
In the Demographic scenario, Mauritania’s GDP per capita is expected to increase from US$4 138 in 2019 to US$5 969 compared to US$5 879 on the Current Path.
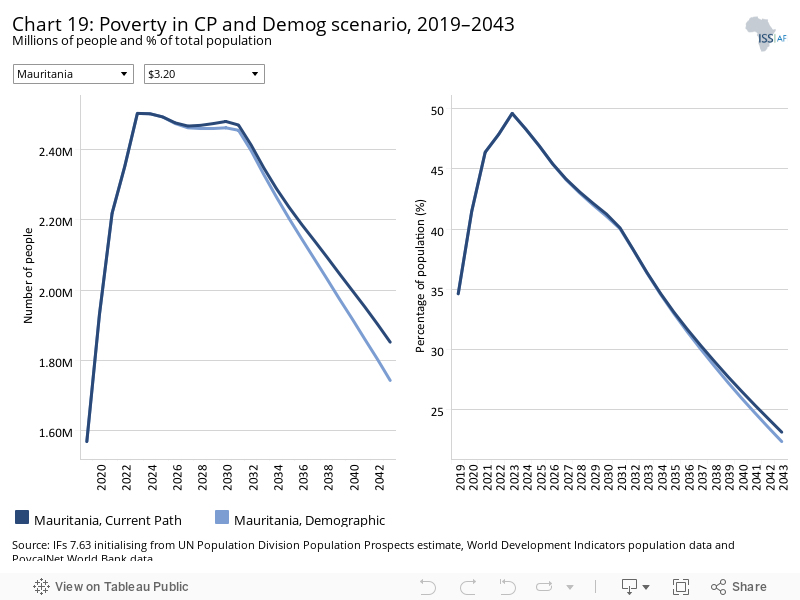
Compared to the Current Path forecast, the Demographic scenario will reduce the share of the population living in extreme poverty (using US$3.20) from 34.6% in 2019 to 22.4% in 2043 compared to 23.2% on the Current Path. In absolute terms, the number of poor people would still rise, but slower population growth means that instead of 1.85 million people living in poverty in the Demographic scenario, it would be 1.46 million people.
This section presents reasonable but ambitious improvements in the Health/WaSH scenario, which include reductions in the mortality rate associated with both communicable diseases (e.g. AIDS, diarrhoea, malaria and respiratory infections) and non-communicable diseases (NCDs) (e.g. diabetes), as well as improvements in access to safe water and better sanitation. The acronym WaSH stands for water, sanitation and hygiene.
The intervention is explained here in the thematic part of the website.
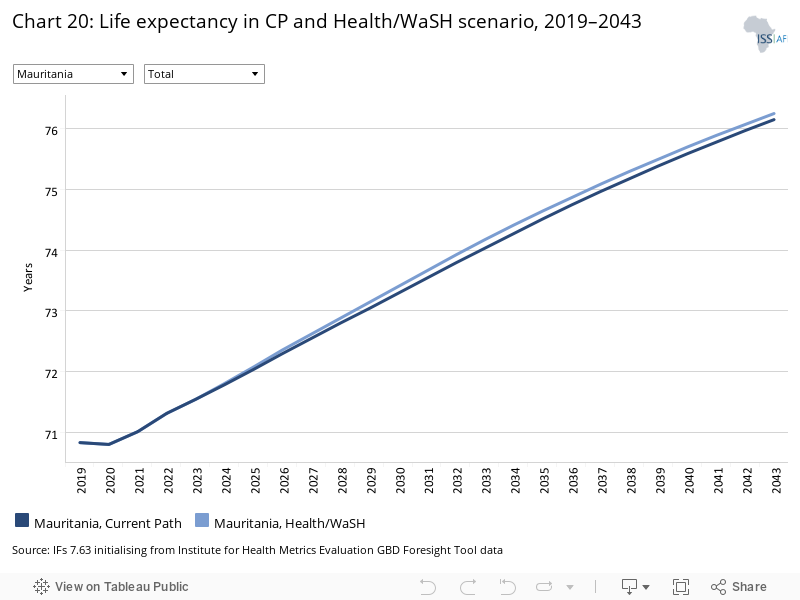
In 2019, average life expectancy for Mauritanians was 70.8 years, ranking last in North Africa. On the Current Path, life expectancy will increase to 73.1 in 2043. In the Health/WaSH scenario, average life expectancy is expected to increase to 74.1 years. This is exactly in line with the average life expectancy for Africa’s lower middle-income economies in the Health/WaSH scenario which is forecast to be 74.1 years by 2043.
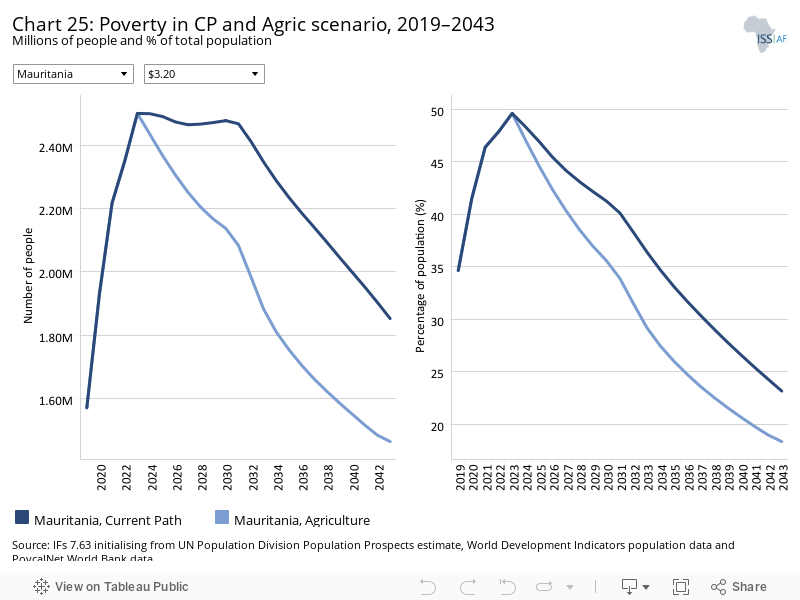
The Agriculture scenario represents reasonable but ambitious increases in yields per hectare (reflecting better management and seed and fertiliser technology), increased land under irrigation and reduced loss and waste. Where appropriate, it includes an increase in calorie consumption, reflecting the prioritisation of food self-sufficiency above food exports as a desirable policy objective.
The intervention is explained here in the thematic part of the website.
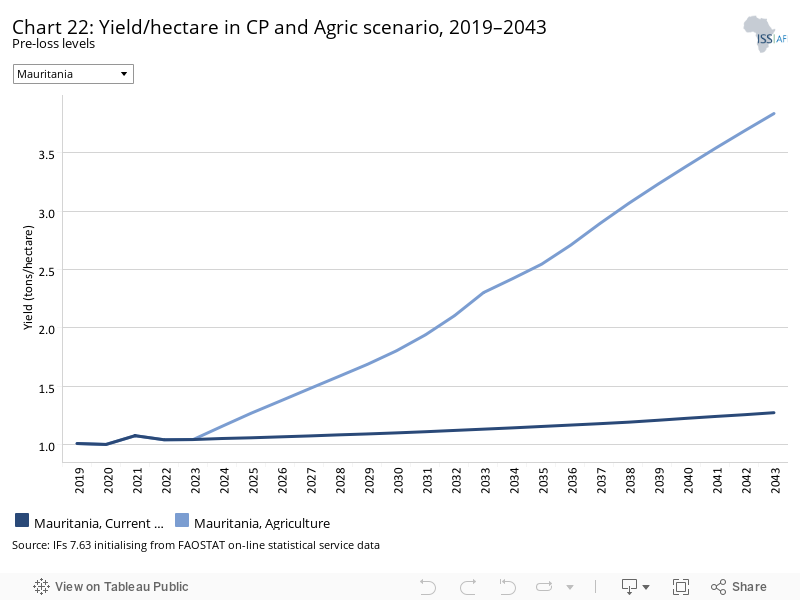
The data on yield per hectare (in metric tons) is for crops but does not distinguish between different categories of crops.
In 2019, yields in Mauritania stood at 1 metric ton per hectare, which is low compared to the average of 5.1 metric tons per hectare of the average for Africa’s lower middle-income peer group and an average of 6.5 metric tons per hectare for North Africa as a region. In the Current Path forecast, yields in Mauritania will increase very modestly to 1.3 tons by 2043 — an increase of 30%. In the Agriculture scenario though, they will increase by 280% over the same time period and amount to 3.8 metric tons per hectare. The result is that instead of producing 2.2 million metric tons of crops in 2043, Mauritania would produce 3.3 million metric tons, which is 45% more.
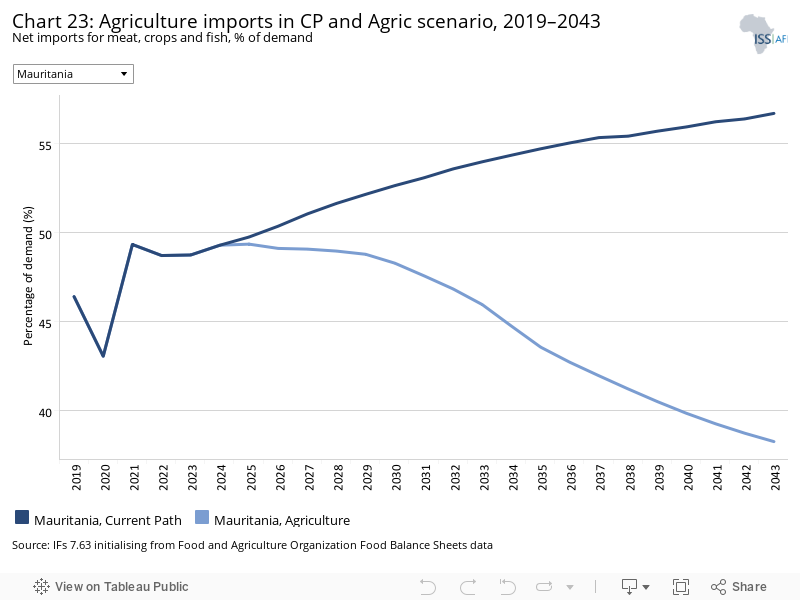
In 2019, total agricultural demand in Mauritania exceeded production by 1.2 million metric tons. That gap is forecast to become larger, reaching 2.9 million metric tons by 2043 meaning that demand will be growing much faster than production.
In 2019, net agricultural imports accounted for just over 46.4% of agricultural demand. On the Current Path, import dependence is set to increase by more than 10 percentage points as imports are expected to account for 56.7% of demand by 2043. The Agriculture scenario will not reverse this rather extreme situation but improve it. By 2043, import dependence will stand at 38.2% of agricultural demand. The country will produce 64.6 million metric tons of crops, meat and fish, and therefore exceed the expected demand of 50 million metric tons.
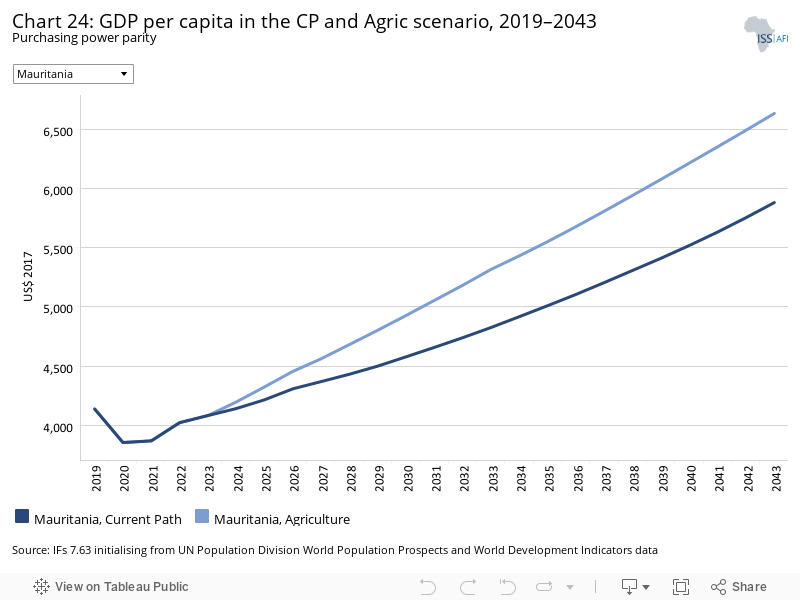
The Agriculture scenario will increase the GDP per capita from US$4 138 to US$6 632 by 2043, US$753 more than on the Current Path. In fact, the interventions in the Agriculture scenario are the ones that imply the greatest boost for GDP per capita among the sectoral interventions. However, Mauritania’s GDP per capita will be significantly lower than the average of its lower middle-income peers in Africa, which is expected to be US$9 582 in the Agriculture scenario.
The positive impact of the interventions in the Agriculture scenario on poverty is significant: by 2043, only 18.3% of Mauritania’s population will be living in extreme poverty compared to 23.2% in the Current Path forecast. The interventions in the Agriculture scenario imply that by 2043, 1.46 million Mauritanians will live in poverty rather than 1.85 million as projected on the Current Path. Mauritania outperforms its lower middle-income peer group. In the Agriculture scenario, 33.5% of the population is expected to live below the poverty line by 2043. However, Mauritania remains the poorest country in North Africa, followed by Egypt and at great distance Tunisia and Algeria.
The Education scenario represents reasonable but ambitious improved intake, transition and graduation rates from primary to tertiary levels and better quality of education. It also models substantive progress towards gender parity at all levels, additional vocational training at secondary school level and increases in the share of science and engineering graduates.
The intervention is explained here in the thematic part of the website.
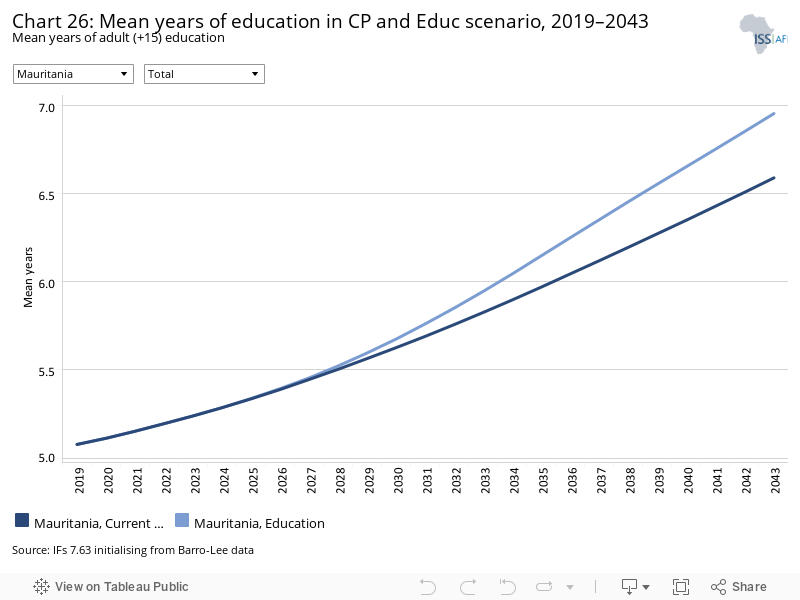
In the Education scenario, the mean years of education increases from 5.1 years in 2019 to 7 years in 2043. This represents an improvement of 0.4 years compared to the Current Path forecast of 6.6 years. Mauritania performs significantly worse than its income peer group with an average mean of 7.2 years of education in 2019 that could increase to 8.8 years by 2043 in the Education scenario. The country also ranks last within North Africa, followed by Morocco.
Girls are disadvantaged in accessing education in Mauritania. In 2019, the mean years of education for the female population was 4.4 years compared to 5.7 years for males. The interventions in the Education scenario would somewhat reduce the gender gap. Females could reach 6.6 mean years of education by 2043 versus 7.3 years for males compared to 7 and 6.2 years, respectively, on the Current Path.
Despite progress in Mauritania’s education sector, several challenges persist. Those include low quality basic education, low access to and quality of secondary education, low transition rates to secondary school, in particular for girls, and the lack of qualified teachers in secondary schools.
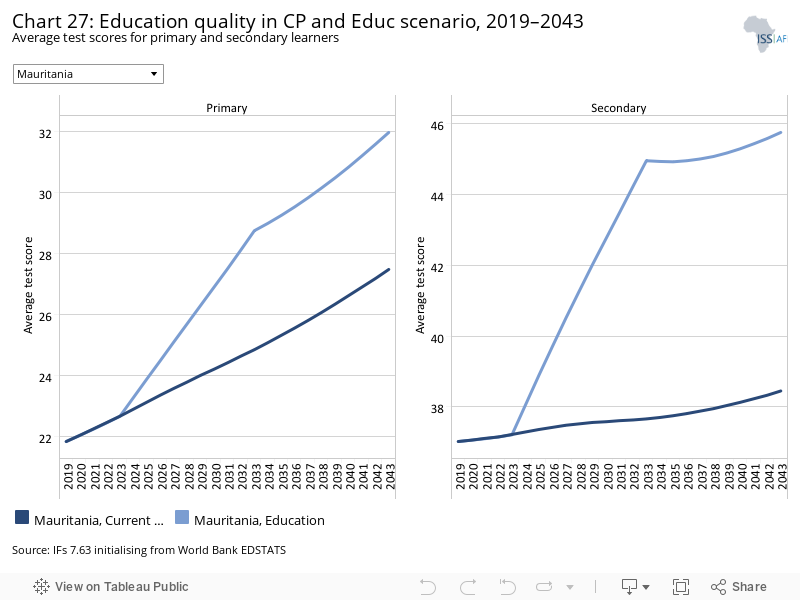
Mauritania’s primary test score in 2019 was 21.8 and therefore much lower than average for Africa’s low middle-income countries which was 33.6. On the Current Path, Mauritania will reach a score of 27.5 by 2043 compared to the average score of 35.3 for its peer group. The Education scenario will accelerate progress improving average test scores for primary learners to 32 in 2043.
The average test score for secondary learners in Mauritania was 37, somewhat below the average of 41.7 for its income peer group. It will increase to 38.5 on the Current Path and to 45.8 in the Education scenario.
Mauritania’s GDP per capita will increase to US$5 879 in the Current Path forecast compared to US$6 047 in the Education scenario — a gain of US$168.
The Manufacturing/Transfers scenario represents reasonable but ambitious manufacturing growth through greater investment in the economy, investments in research and development, and promotion of the export of manufactured goods. It is accompanied by an increase in welfare transfers (social grants) to moderate the initial increases in inequality that are typically associated with a manufacturing transition. To this end, the scenario improves tax administration and increases government revenues.
The intervention is explained here in the thematic part of the website.
Chart 30 should be read with Chart 8 that presents a stacked area graph on the contribution to GDP and size, in billion US$, of the Current Path economy for each of the sectors.
In the Manufacturing/Transfers scenario, the service sector will experience the largest gain in terms of its relative contribution to GDP. Its contribution is expected to increase by 0.52 percentage points in 2043. The service sector is followed by the manufacturing sector that will see its relative contribution to GDP increase by 0.07 percentage points in 2043. The increased importance of the service sector is most prevalent between 2034 and 2036.
The value of the service sector is forecast to increase by US$0.6 billion in the Manufacturing/Transfers scenario compared to the Current Path forecast. The Manufacturing/Transfers scenario will increase the contribution from the manufacturing sector by US$0.1 billion in 2043 compared to the Current Path forecast. The contribution of the agriculture sector to GDP is set to drop by 0.23 percentage points. Its value is expected to remain steady.
In the Manufacturing/Transfers scenario, government to household welfare transfers will increase more than fivefold over the coming two decades from US$0.6 billion in 2019 to US$3.1 billion in 2043. On the Current Path, government to household transfers will grow at a slower rate reaching US$1.8 billion in 2043. On both trajectories, Mauritania’s level of government to household transfers is significantly lower than the average for its African income peer group which stood at US$5 billion in 2019 and will reach US$12.7 billion versus US$18.6 billion in the Manufacturing/Transfers scenario and the Current Path forecast, respectively.
Mauritania’s GDP per capita will increase by US$160 in the Manufacturing/Transfers scenario and reach US$6 047 compared to US$5 876 on the Current Path in 2043.
The Manufacturing/Transfers scenario will reduce the share of Mauritanians living below the poverty line from 34.6% in 2019 to 20.6% in 2043 compared to 23.2% in the Current Path forecast. This represents a 2.6 percentage point improvement that will translate to 200 000 people escaping poverty in 2043 in the Manufacturing/Transfers scenario.
The Leapfrogging scenario represents a reasonable but ambitious adoption of and investment in renewable energy technologies, resulting in better access to electricity in urban and rural areas. The scenario includes accelerated access to mobile and fixed broadband and the adoption of modern technology that improves government efficiency and allows for the more rapid formalisation of the informal sector.
The intervention is explained here in the thematic part of the website.
Fixed broadband includes cable modem Internet connections, DSL Internet connections of at least 256 KB/s, fibre and other fixed broadband technology connections (such as satellite broadband Internet, ethernet local area networks, fixed-wireless access, wireless local area networks, WiMAX, etc.).
Fixed broadband access positively impacts economic growth, enabling communities to interact and share information, and spur on innovation as people and businesses connect to other Internet users across the world. Increasing Internet access through fixed broadband access has driven economic growth in the various parts of the world, as detailed in the Leapfrogging scenario.
Mauritania, like most African lower middle-income countries, had a very low fixed broadband rate of 2.6 subscriptions per 100 people in 2019. In the Leapfrogging scenario, fixed broadband is set to increase more than nineteen-fold to 50 subscriptions per 100 people by 2043, though still a very low number. On the Current Path, the subscription rate will increase to only 32.2 subscriptions per 100 people.
Mobile broadband refers to wireless Internet access delivered through cellular towers to computers and other digital devices.
As the Leapfrogging theme explains, the advantage of cellular Internet access is the low cost compared to fixed broadband access, allowing more people to benefit from Internet access. Not only does mobile phone usage spur innovation through increased communication and exposure to multiple sources of information, but it also enables people to document instances of election tampering or police abuse, which would previously have been very difficult.
In 2019, Mauritania had a mobile broadband subscription rate of 41.7 subscriptions per 100 people, a rate that is somewhat lower than the average of 49.1 subscriptions per 100 people for Africa’s lower middle-income economies. Mauritania ranks 13th within its peer group.
Mobile broadband in Mauritania will increase rapidly and reach 129 subscriptions per 100 persons by 2031 on the Current Path versus 130.6 subscriptions in the Leapfrogging scenario forecast. The difference between the Leapfrogging scenario and the Current Path forecast is greatest between 20254 and 2030. Thereafter, subscriptions increase more slowly as the saturation effect sets in, reaching 152 subscriptions per 100 people by 2043. In other words, mobile broadband subscriptions will increase either way but the Leapfrogging scenario accelerates this development by a couple of years.
In 2019, 1.9 million people in Mauritania had access to electricity which was equivalent to an access rate of 42.7%. In the Leapfrogging scenario, 80.5% of the population is expected to have access to electricity by 2043 compared to 72.3% in the Current Path. The urban–rural divide is significant in Mauritania, and the interventions in the Leapfrogging scenario will reduce the gap from a 70 percentage point difference to a 33.4 percentage point difference between the urban and the rural access rate.
In the Leapfrogging scenario, Mauritania’s GDP per capita will increase from US$4 138 in 2019 to US$6 145 compared to US$5 879 on the Current Path — a difference of US$266. In the Leapfrogging scenario, Africa’s lower middle-income economies will on average have a GDP per capita of US$9 619 by 2043, which is 57% higher than Mauritania’s.
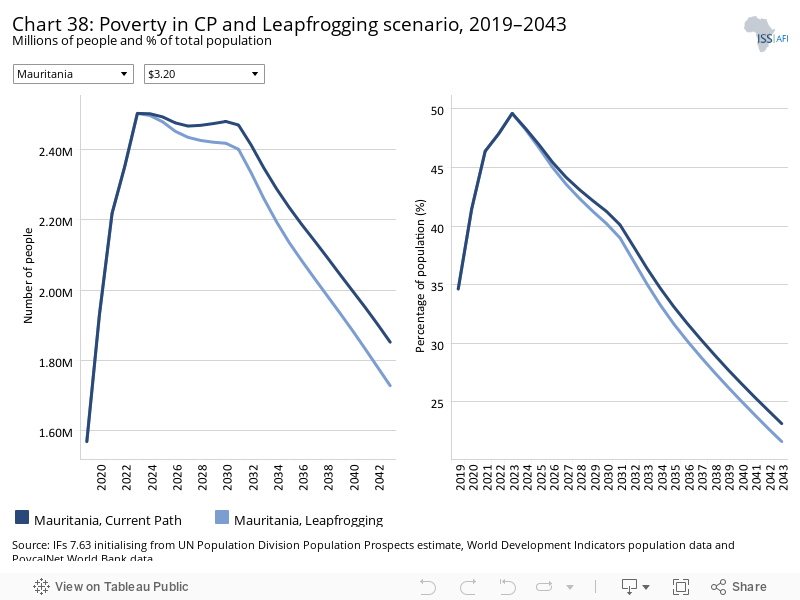
The interventions in the Leapfrogging scenario are projected to benefit poverty reduction efforts in Mauritania. The share of the population living below the US$3.20 poverty line will drop by 13 percentage points from 34.6% in 2019 to 21.6% by 2043 compared to 23.2% on the Current Path trajectory. When assessing absolute numbers, the Leapfrogging scenario will reduce the number of people living in poverty to 1.73 million versus the projected 1.85 million in the Current Path forecast. The average poverty rate for Mauritania’s lower middle-income peer group in the Leapfrogging scenario is 36%.
The Free Trade scenario represents the impact of the full implementation of the African Continental Free Trade Area (AfCFTA) by 2034 through increases in exports, improved productivity and increased trade and economic freedom.
The intervention is explained here in the thematic part of the website.
The trade balance is the difference between the value of a country's exports and its imports. A country that imports more goods and services than it exports in terms of value has a trade deficit, while a country that exports more goods and services than it imports has a trade surplus.
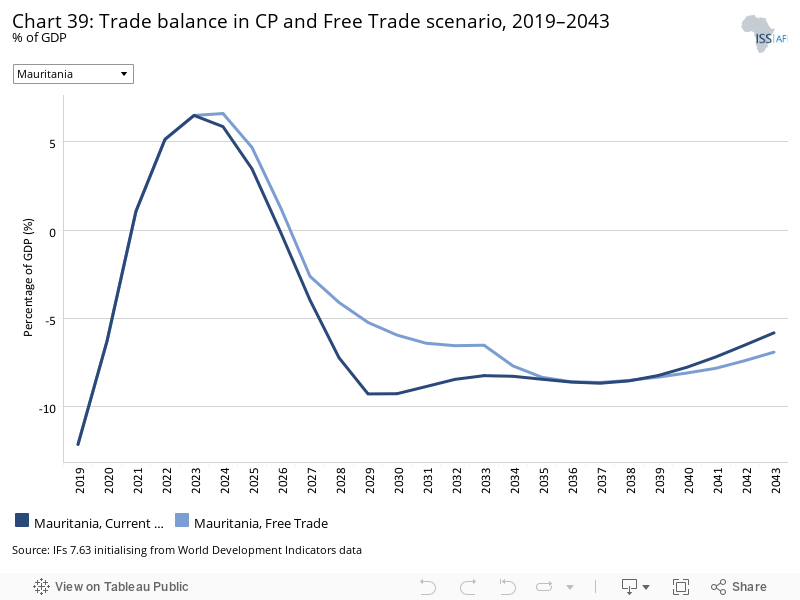
In 2019, Mauritania’s major trading partner countries for exports were China, Spain, Japan, Russia and Italy, and for imports they were the UAE, Spain, China, Belgium and France. Mauritania imports more than it exports and hence has a negative trade balance. The country’s 2019 trade deficit stood at −12.1% of GDP. In the Free Trade scenario, that deficit will reduce significantly until 2030 when it will stand at −5.9% of GDP. Thereafter, the deficit begins to grow again reaching −6.9% of GDP in 2043. In the Current Path forecast, the path is similar although the trade deficit is forecast to be smaller in the medium term and higher in the longer term reaching −5.8% of GDP by 2043.
The implementation of the AfCFTA in the Free Trade scenario reduces the short-term trade deficit for Mauritania versus the Current Path forecast. However, between 2039 and 2043, the trade deficit will be lower on the Current Path than in the Free Trade scenario.
The GDP per capita is projected to increase to US$5 879 on the Current Path versus US$6 396 in the Free Trade scenario — a gain of US$517. The Free Trade scenario interventions result in the second greatest boost to Mauritania’s GDP per capita among the sectoral interventions after the Agriculture scenario. The average GDP per capita for Africa’s lower middle-income peer group will reach US$10 050 in the Free Trade scenario.
Trade openness will reduce poverty in the long term after initially increasing it due to the redistributive effects of trade. Most African countries export primary commodities and low-tech manufacturing products, and therefore a continental free trade agreement (AfCFTA) that reduces tariffs and non-tariff barriers across Africa will increase competition among countries in primary commodities and low-tech manufacturing exports. Countries with inefficient, high-cost manufacturing sectors might be displaced as the AfCFTA is implemented, thereby pushing up poverty rates. In the long term, as the economy adjusts and produces and exports its comparatively advantaged (lower relative cost) goods and services, poverty rates will decline.
In the Free Trade scenario, poverty in Mauritania will decrease more rapidly. By 2043, 20% of the population will live in poverty in the Free Trade scenario compared to 23.2% in the Current Path forecast. The 3.2 percentage point difference translates to 250 000 Mauritanians who will escape poverty as a result of the interventions in the Free Trade scenario.
The Financial Flows scenario represents a reasonable but ambitious increase in worker remittances and aid flows to poor countries, and an increase in the stock of foreign direct investment (FDI) and additional portfolio investment inflows to middle-income countries. We also reduced outward financial flows to emulate a reduction in illicit financial outflows.
The intervention is explained here in the thematic part of the website.
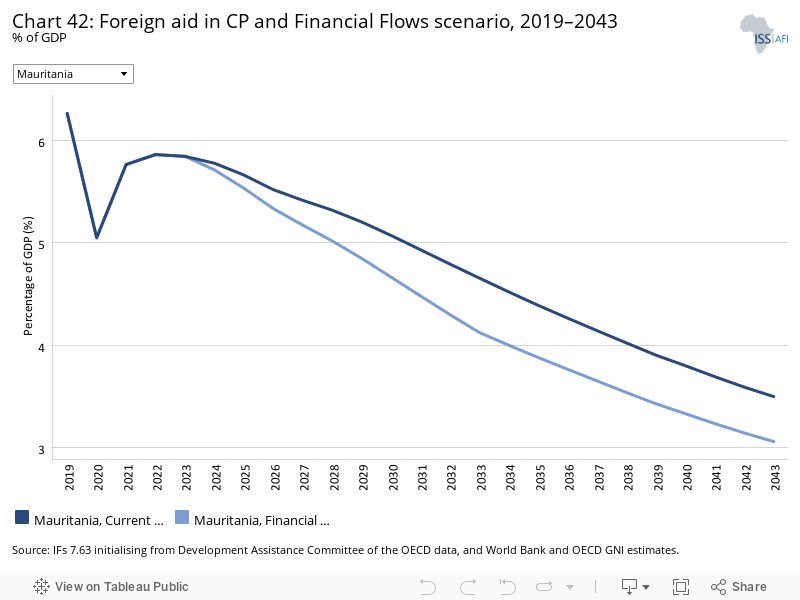
Compared to the average for Africa’s lower middle-income countries of 1.67%, foreign aid accounted for a much higher share of GDP in Mauritania at 6.26% in 2019. In fact, the country ranks fifth out of 23 lower middle-income economies on the continent in terms of aid receipts as a percentage of GDP. In both the Current Path forecast and the Financial Flows scenario, the contribution of foreign aid to GDP is projected to fall to 3.5% of GDP on the Current Path and to 3.1% in the Financial Flows scenario.
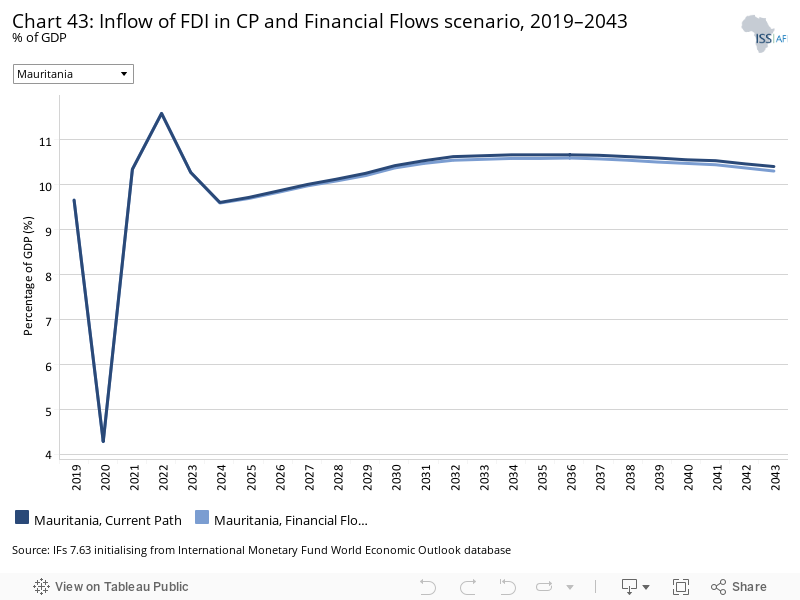
FDI flows to Mauritania accounted for 9.6% of GDP in 2019. The impact of the COVID-19 pandemic on FDI flows manifested in the sharp drop to 4.3% in 2020. In the Financial Flows scenario, FDI as a share of GDP is projected to recover and even surpass pre-pandemic levels. By 2043, FDI flows are expected to account for 10.3% of Mauritania’s GDP. However, on the Current Path, inflows are expected to be slightly higher accounting for 10.4% of GDP. In Africa’s lower middle-income economies, FDI is set to account for 4% in the Financial Flows scenario and for 3.5% on the Current Path.
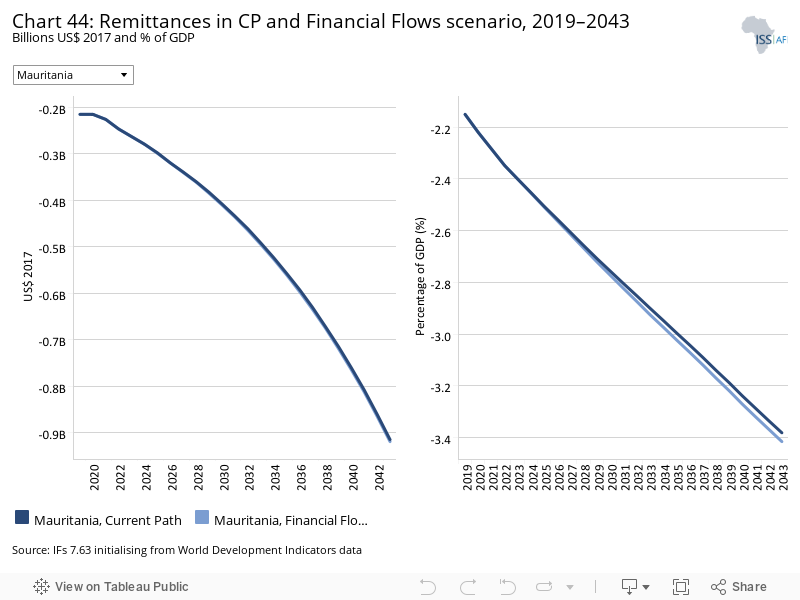
In 2019, remittance inflows to Mauritania accounted for −2.2% of GDP which means that outflows surpassed inflows and that Mauritania is a net sender of remittances. In both the Current Path forecast and the Financial Flows scenario, remittances will drop to −3.4% of GDP. However, in absolute terms, remittances will increase from US$7.1 billion in 2019 to US$8.8 billion by 2043, respectively — US$0.8 billion more than in the Current Path forecast.
The group of Africa’s lower middle-income economies shows the same trend. On average, the absolute volume of remittances will increase, but their relative contributions to GDP will decrease from about 2.6% in 2019 to 2% in 2043 in the Current Path forecast and 2.3% in 2043 in the Financial Flows scenario.
In the Financial Flows scenario, Mauritania’s GDP per capita will increase to US$5 858. This represents a gain of US$21 compared to the US$5 879 in the Current Path forecast.
The interventions in the Financial Flows scenario will increase the share of Mauritanians living in extreme poverty to 23.6% by 2043 compared to 23.2% in the Current Path forecast. This translates to about 40 000 more people who will live in poverty in the Financial Flows scenario by 2043 compared to the Current Path forecast.
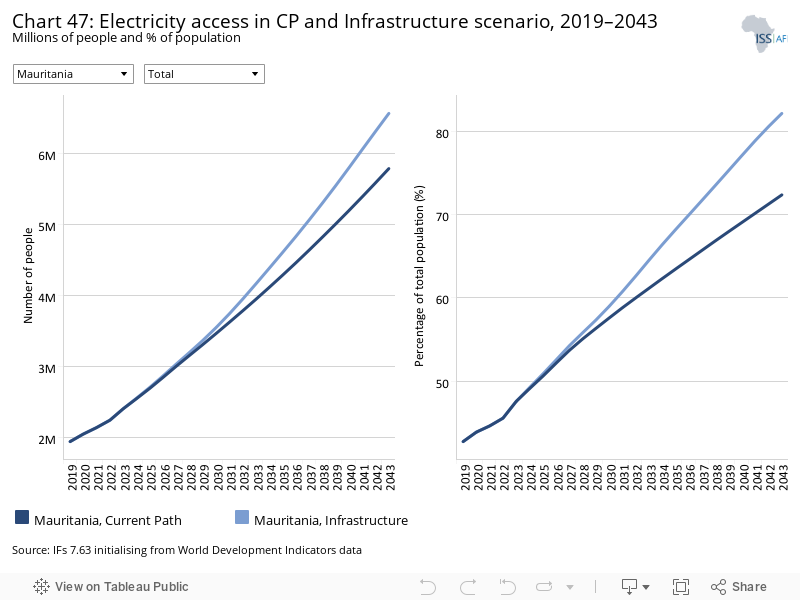
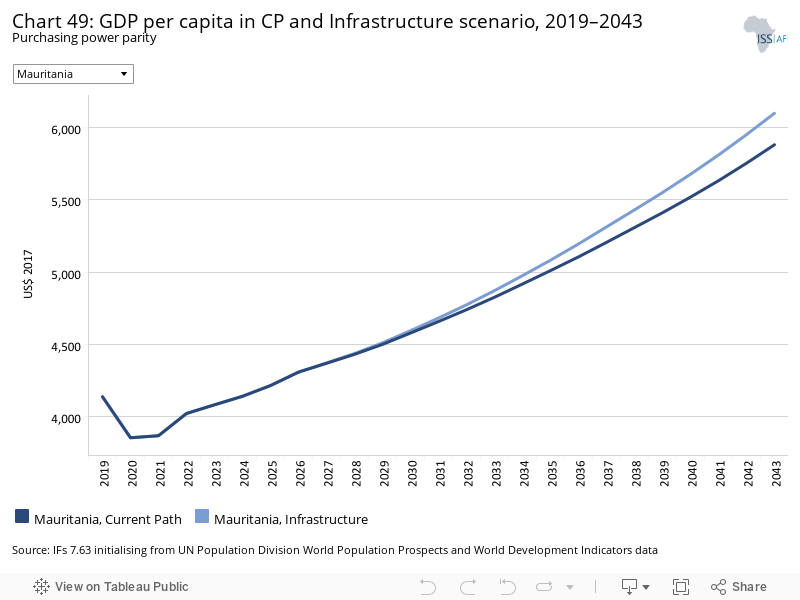
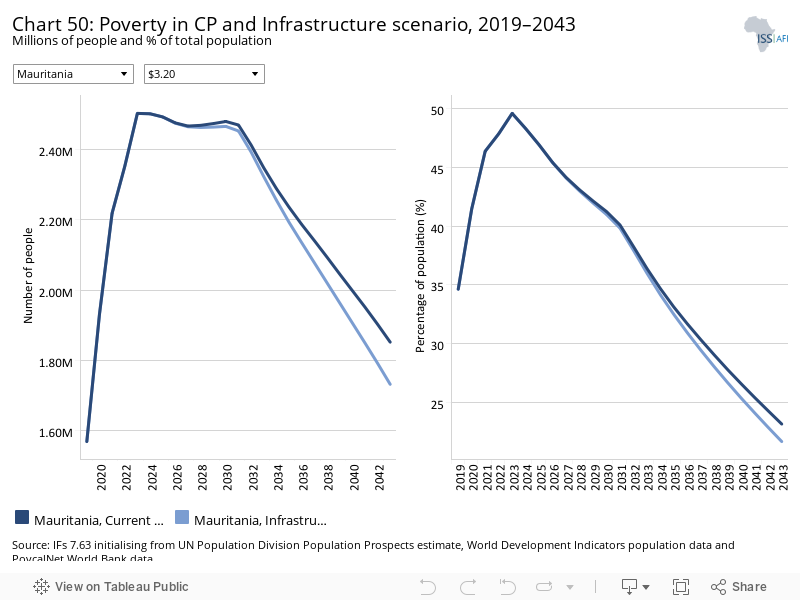
The Infrastructure scenario represents a reasonable but ambitious increase in infrastructure spending across Africa, focusing on basic infrastructure (roads, water, sanitation, electricity access and ICT) in low-income countries and increasing emphasis on advanced infrastructure (such as ports, airports, railway and electricity generation) in higher-income countries.
Note that health and sanitation infrastructure is included as part of the Health/WaSH scenario and that ICT infrastructure and more rapid uptake of renewables are part of the Leapfrogging scenario. The interventions there push directly on outcomes, whereas those modelled in this scenario increase infrastructure spending, indirectly boosting other forms of infrastructure, including those supporting health, sanitation and ICT.
The intervention is explained here in the thematic part of the website.
In 2019, 1.9 million people in Mauritania had access to electricity, equivalent to 42.7% of the population. In urban areas, electricity access is much higher than in rural areas: 75.1% versus 5.1%. With the Infrastructure scenario, overall, 82.1% of the population are expected to have access to electricity by 2043 compared to 72.3% on the Current Path. The rural–urban divide will reduce significantly with near universal electricity access in urban areas (91.8%) and 61.3% access rate in rural parts of Mauritania.
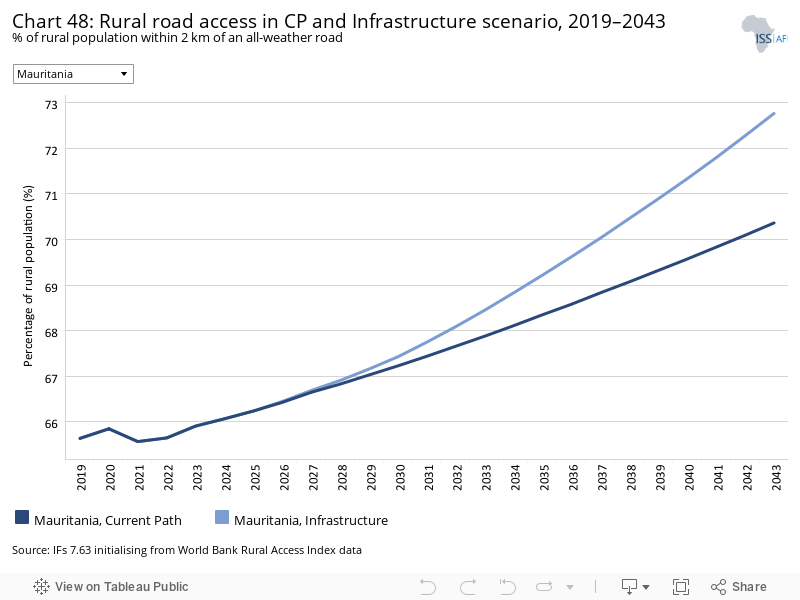
Indicator 9.1.1 in the Sustainable Development Goals refers to the proportion of the rural population who live within 2 km of an all-season road and is captured in the Rural Access Index.
Investments in rural road infrastructure are associated with positive socio-economic impacts, such as increased rural incomes and poverty reduction, improving maternal health as well as paediatric health and increased agricultural productivity. In 2019, 65.6% of Mauritania’s rural population had access to an all-weather road. This is 4.2 percentage points above the average access rate for Africa’s lower middle-income economies at 61.4% even if 10.2 percentage points below the average for North Africa as a region.
The Infrastructure scenario will accelerate improvements in rural road access in Mauritania. By 2043, 72.8% of the rural population will have access to an all-weather road compared to 70.4% in the Current Path forecast.
Improvements in the Infrastructure scenario will increase the GDP per capita from US$4 138 in 2019 to US$6 097 in 2043 — US$218 above the Current Path forecast. By 2043, the average GDP per capita for the group of lower middle-income economies will be US$7 335 in the Infrastructure scenario.
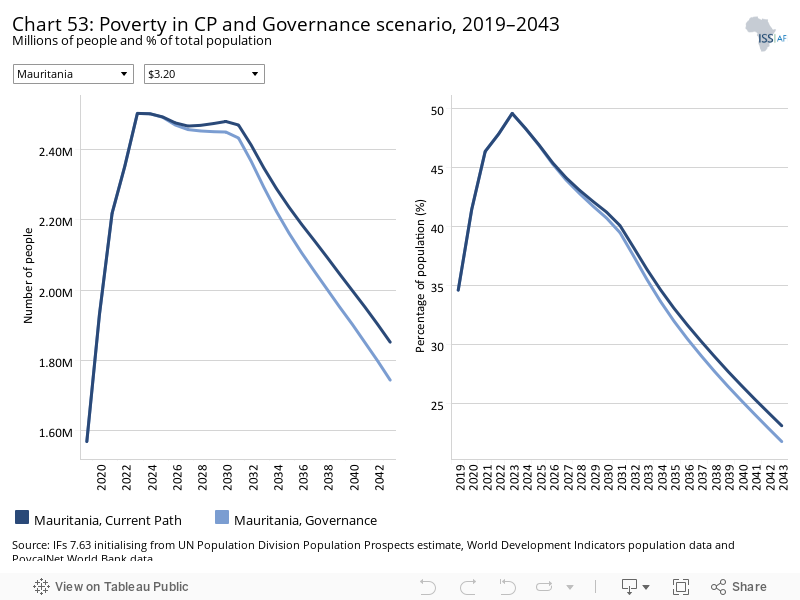
The Governance scenario represents a reasonable but ambitious improvement in accountability and reduces corruption, and hence improves the quality of service delivery by government.
The intervention is explained here in the thematic part of the website.
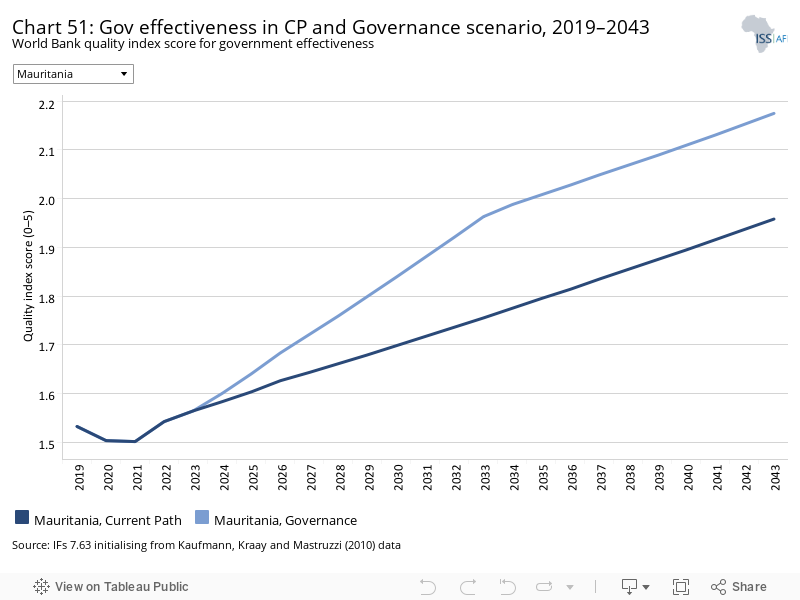
As defined by the World Bank, government effectiveness ‘captures perceptions of the quality of public services, the quality of the civil service and the degree of its independence from political pressures, the quality of policy formulation and implementation, and the credibility of the government’s commitment to such policies’.
Chart 51 presents the impact of the interventions in the Governance scenario on government effectiveness.
In 2019, Mauritania scored 1.53 on the government effectiveness index. This is below the average of its income peer group on the continent as well as North Africa’s average, both with a score of 1.9. Mauritania ranks 19th among the group of 23 lower middle-income economies. In the Governance scenario, Mauritania’s government effectiveness quality score will improve to 2.18 by 2043 compared to 1.96 on the Current Path.
The GDP per capita will increase to US$6 077 in 2043 in the Governance scenario compared to US$5 879 on the Current Path.
In the Governance scenario, Mauritania will reduce the share of the population living below the poverty line to 21.8% by 2043 compared to 23.3% in the Current Path forecast. The interventions in the Governance scenario will also reduce the number of Mauritanians living in poverty to 1.74 million in 2043 compared to 1.85 million on the Current Path.
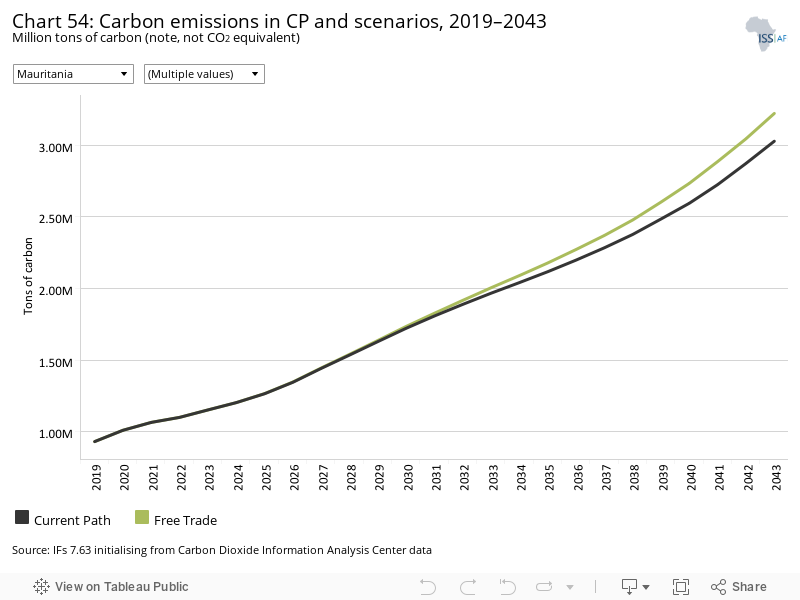
This section presents projections for carbon emissions in the Current Path for Mauritania and the 11 scenarios. Note that IFs uses carbon equivalents rather than CO2 equivalents.
Mauritania’s carbon emissions in the Combined Agenda 2063 scenario, which combines all the sectoral scenarios, are outlined in Chart 60.
Among the sectoral interventions, the Agriculture scenario will release the most carbon emissions, resulting in total emissions of 3.32 million tons compared to 3.03 million tons in the Current Path forecast. The Agriculture scenario is followed by the Free Trade and the Stability scenarios which would lead to carbon emissions of 3.23 million and 3.15 million tons, respectively, by 2043. The Infrastructure scenario is forecast to produce carbon emissions of 3.11 million tons compared to the Current Path figure of 3.03 million tons.
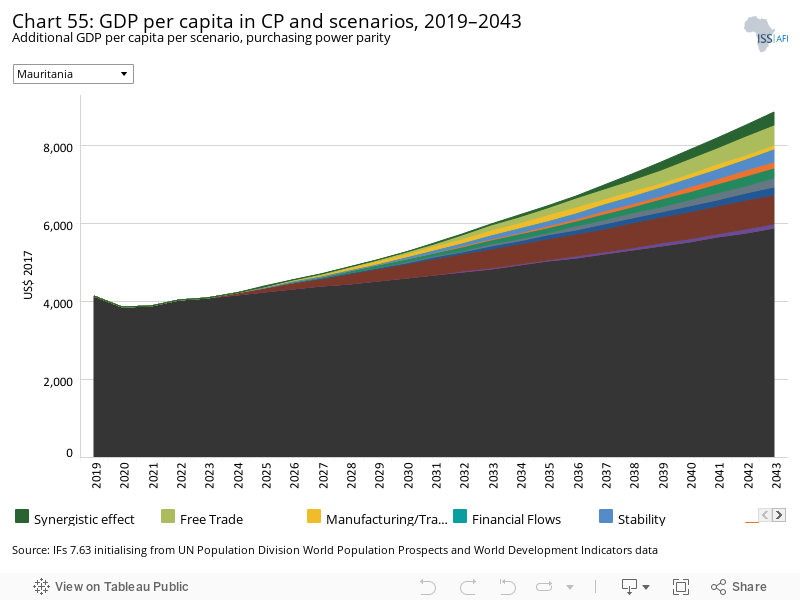
The Combined Agenda 2063 scenario consists of the combination of all 11 sectoral scenarios presented above, namely the Stability, Demographic, Health/WaSH, Agriculture, Education, Manufacturing/Transfers, Leapfrogging, Free Trade, Financial Flows, Infrastructure and Governance scenarios. The cumulative impact of better education, health, infrastructure, etc. means that countries get an additional benefit in the integrated IFs forecasting platform that we refer to as the synergistic effect. Chart 55 presents the contribution of each of these 12 components to GDP per capita in the Combined Agenda 2063 scenario as a stacked area graph.
The Combined Agenda 2063 scenario will increase Mauritania’s GDP per capita by an additional US$2 929 above the Current Path forecast in 2043. Among the sectoral interventions, the Agriculture scenario will have the greatest positive impact on the GDP per capita, with an increase of US$752 in 2043. The second and third largest impacts on the GDP per capita will be achieved in the Free Trade and Stability scenarios, with additions to the GDP per capita of US$517 and US$313, respectively. On the other end of the spectrum, the Demographic scenario will only add US$89 to Mauritania’s GDP per capita by 2043.
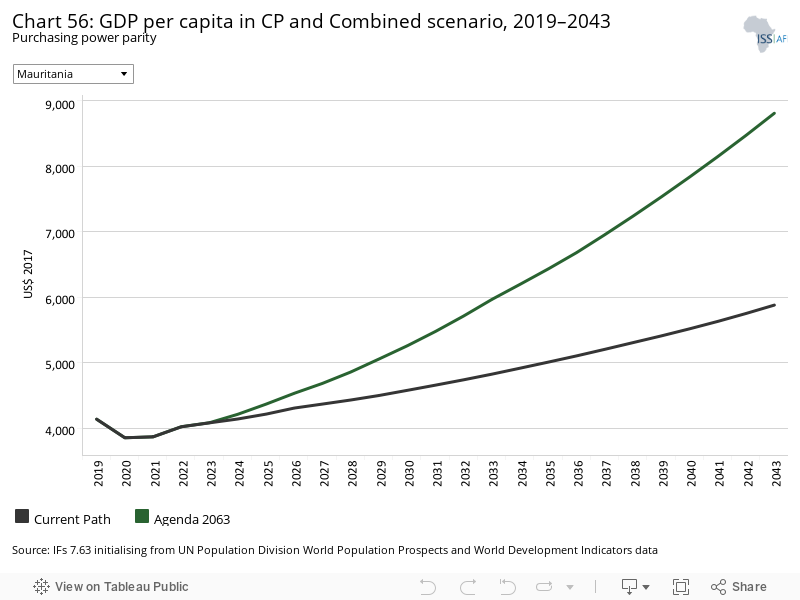
Whereas Chart 55 presents a stacked area graph on the contribution of each scenario to GDP per capita as well as the additional benefit or synergistic effect, Chart 56 presents only the GDP per capita in the Current Path forecast and the Combined Agenda 2063 scenario.
In the Combined Agenda 2063 scenario, by 2043 Mauritania’s GDP per capita is expected to be US$8 808, which is almost 50%, or US$2 929, higher than on the Current Path (US$5 879). The average GDP per capita of its lower middle-income peer group is set to be US$14 170 in that scenario.
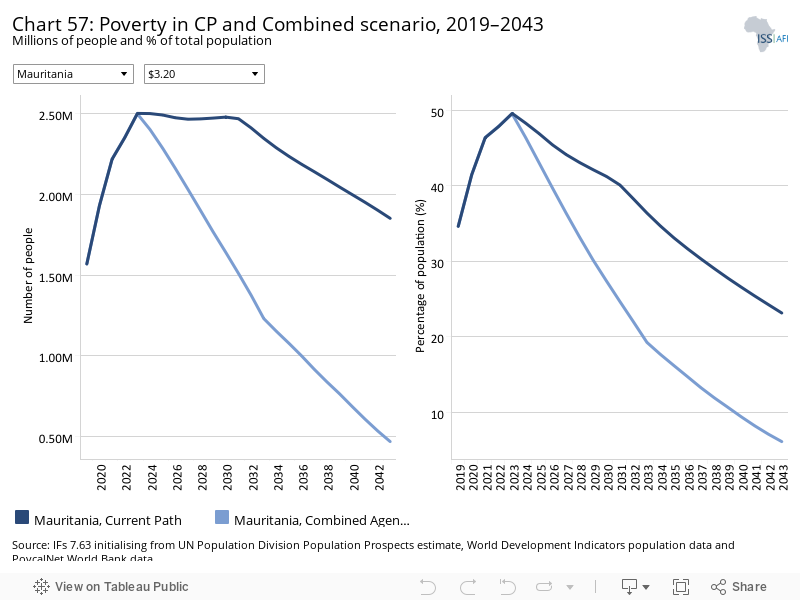
Extreme poverty in Mauritania will almost be eradicated in the Combined Agenda 2063 scenario. By 2043, only 6.1% of the population will live below the US$3.20 extreme poverty line, which translates to 470 000 people. In the Current Path forecast, 23.2% of Mauritanians, or 1.85 million people, will live in extreme poverty.
See Chart 8 to view the Current Path forecast of the sectoral composition of the economy.
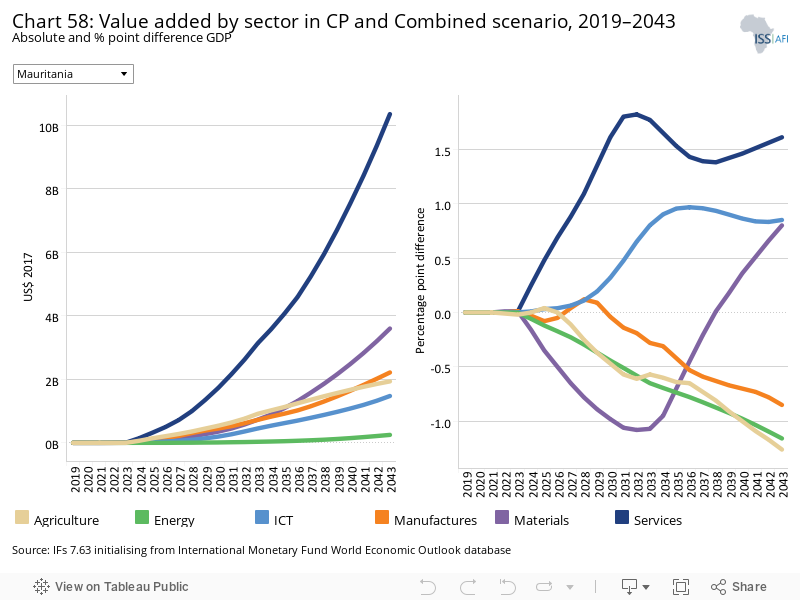
In the Combined Agenda 2063 scenario, only three sectors experience an increase in their contribution to Mauritania’s GDP compared to the Current Path: the share of the service sector rises by 1.6 percentage points, the share of the ICT sector by 0.9, and the share of the materials sector by 0.8 percentage points compared to the Current Path forecast. This will translate into an increase in GDP of US$10.4 billion attributable to the service sector, and US$1.5 billion and US$3.6 billion attributable to ICT and materials sectors, respectively.
The remaining sectors will lose importance in terms of their contribution to GDP, chief among them the agriculture sector, which loses 1.3 percentage points compared to the Current Path forecast. In absolute terms, however, all sectors will grow. The third largest increase is seen in the manufacturing sector, which will contribute an additional US$2.2 billion to the economy in the Combined Agenda 2063 scenario.
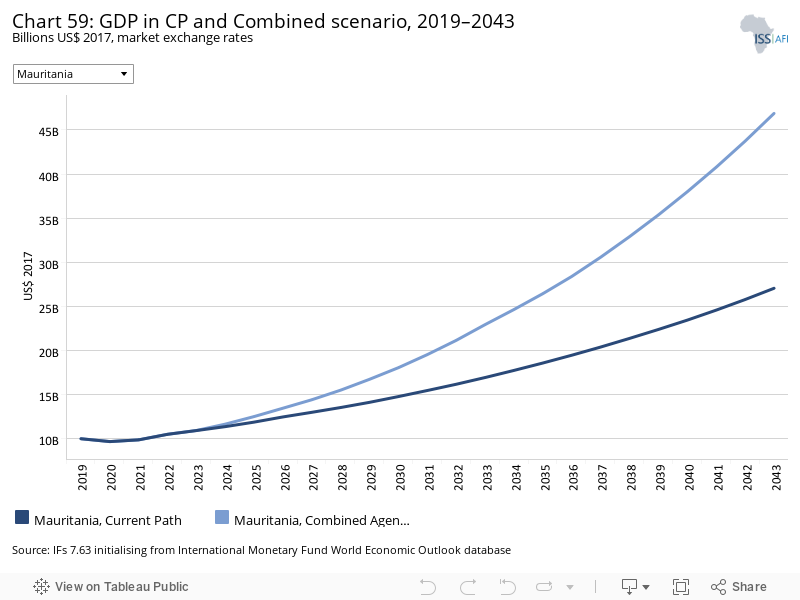
Mauritania’s GDP will grow substantially to US$46.9 billion by 2043, compared to US$27.1 billion in the Current Path forecast. In other words, in the Combined Agenda 2063 scenario, by 2043 Mauritania’s economy will be close to five times its current size (4.7 times) and more than 70% larger than on the Current Path.
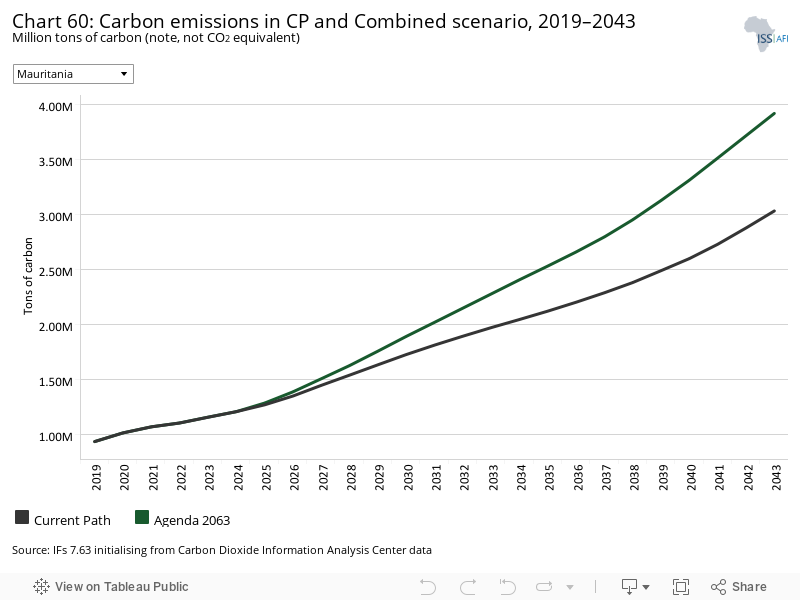
In 2019, Mauritania’s carbon emissions stood at 0.93 million tons. In the Combined Agenda 2063 scenario, and due to economic growth and increased energy demand, carbon emissions will increase more than fourfold to 3.9 million tons by 2043. As Mauritania’s economy grows, the difference in projected carbon emissions between the Combined Agenda 2063 scenario and the Current Path forecast is about 0.9 million tons.
Page information
Contact at AFI team is Mustapha Jobarteh
This entry was last updated on 14 August 2025 using IFs v7.63.
Donors and sponsors


Reuse our work
- All visualizations, data, and text produced by African Futures are completely open access under the Creative Commons BY license. You have the permission to use, distribute, and reproduce these in any medium, provided the source and authors are credited.
- The data produced by third parties and made available by African Futures is subject to the license terms from the original third-party authors. We will always indicate the original source of the data in our documentation, so you should always check the license of any such third-party data before use and redistribution.
- All of our charts can be embedded in any site.
Cite this research
Mustapha Jobarteh (2025) Mauritania. Published online at futures.issafrica.org. Retrieved from https://futures.issafrica.org/geographic/countries/mauritania/ [Online Resource] Updated 14 August 2025.