 Madagascar
Feedback welcome
Our aim is to use the best data to inform our analysis. See our Technical page for information on the IFs forecasting platform. We appreciate your help and references for improvements via our feedback form.
In this entry, we first describe the Current Path (CP) forecast for Madagascar as it is expected to unfold to 2043, the end of the third ten-year implementation plan of the African Union’s Agenda 2063 long-term vision for Africa. The Current Path in the International Futures (IFs) forecasting model initialises from country-level data that is drawn from a range of data providers. We prioritise data from national sources.
The Current Path forecast is divided into summaries on demographics, economics, poverty, health/WaSH and climate change/energy. A second section then presents a single positive scenario for potential improvements in stability, demographics, health/WaSH, agriculture, education, manufacturing/transfers, leapfrogging, free trade, financial flows, infrastructure, governance and the impact of various scenarios on carbon emissions. With the individual impact of these sectors and dimensions having been considered, a final section presents the impact of the Combined Agenda 2063 scenario.
We generally review the impact of each scenario and the Combined Agenda 2063 scenario on gross domestic product (GDP) per person and extreme poverty except for Health/WaSH that uses life expectancy and infant mortality.
The information is presented graphically and supported by brief interpretive text.
All US$ numbers are in 2017 values.
Summary
- Current Path forecast
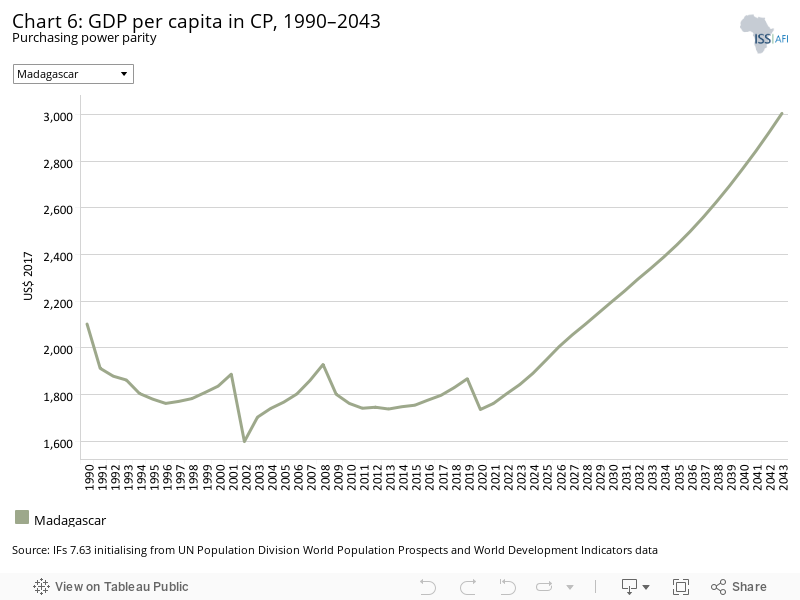
- Madagascar is the world’s second largest island country and has a population of 26.8 million people. With GDP per capita (PPP) of US$1 867 in 2019, Madagascar is classified as one of the world’s least developed countries that consistently ranks at the bottom of the United Nations Human Development Index. Poverty is widespread, and the country faces multiple development challenges. Madagascar’s life expectancy is relatively low at 63.1 years; this reflects a high disease burden as well as low access levels to safe water and sanitation infrastructure. Jump to forecast: Current Path
- Madagascar is projected to continue recording fast population growth with its population increasing by close to 70%, reaching 45.1 million people in 2043 — a result of only slowly decreasing fertility rates combined with increases in life expectancy. The country continues on its path of greater urbanisation with more than half of its population living in cities and towns by 2043. Jump to Demographics: Current Path
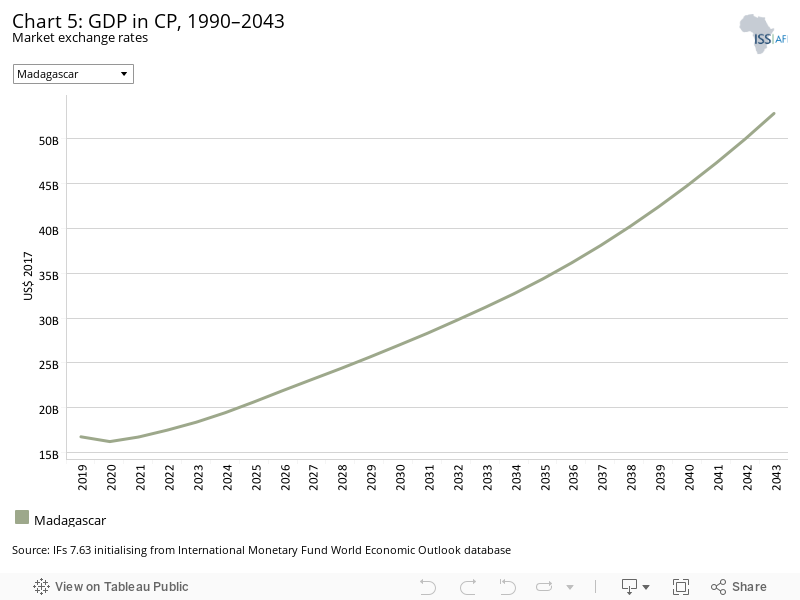
- In the Current Path forecast, Madagascar is expected to record steady economic growth and increase its GDP (MER) more than sixfold to US$52.8 billion in 2043, as well as a significant increase its GDP per capita from US$1 867 in 2019 to US$3 004 by 2043, but still fail to approximately match the average for Africa’s low-income countries at US$3 790. Jump to Economics: Current Path
- The poverty rate in Madagascar is projected to decrease by more than 6 percentage points from 73.2% in 2019 to 66.6% in 2043, despite an additional 10 million people living below the US$1.90 poverty line by 2043 due to population growth outpacing economic growth. Jump to Poverty: Current Path
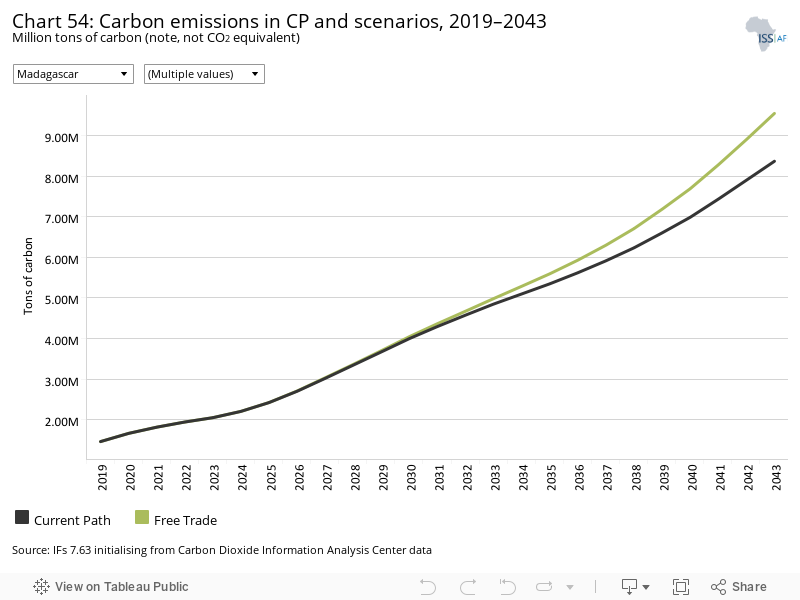
- Madagascar’s carbon emissions stood at 1.5 million tons of carbon in 2019. They are forecast to increase almost sevenfold to 8.4 million tons of carbon by 2043. Jump to Carbon emissions/Energy: Current Path
- Sectoral scenarios
- The Stability scenario has the potential to accelerate poverty reduction and reduce the share of the population living below the US$1.90 line by 3.2 percentage points to 63.4%. Jump to Stability scenario
- The interventions in the Demographic scenario will lower Madagascar’s total fertility rate from 4.1 births per woman in 2019 to 2.1 births in 2043 — 0.9 births lower than in the Current Path forecast. Jump to Demographic scenario
- The Health/WaSH scenario will increase life expectancy in Madagascar from 63.1 years in 2019 to 68.4 years in 2043 — a gain of 0.8 years compared to the Current Path forecast. Jump to Health/WaSH scenario
- The Agriculture scenario will translate into the second largest increase in GDP per capita of all the scenarios as it raises Madagascar’s GDP per capita from US$3 004 in the Current Path forecast to US$3 384 in 2043. Jump to Agriculture scenario
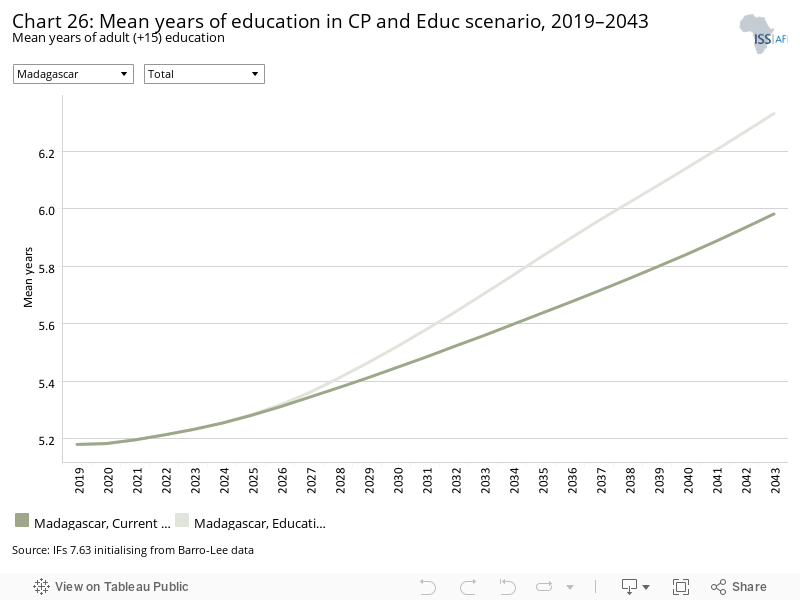
- The Education scenario will raise Madagascar’s mean years of education from 5.2 in 2019 to 6.3 years by 2043 — 0.3 years higher than in the Current Path forecast. Jump to Education scenario
- In the Manufacturing/Transfers scenario, the service sector will experience a 1.3 percentage point gain in terms of contribution to GDP by 2043 compared to the Current Path forecast. Jump to Manufacturing/Transfers scenario
- The Leapfrogging scenario will push the electricity access rate to 69.4% by 2043 compared to 53.9% in the Current Path forecast. Jump to Leapfrogging scenario
- In the Free Trade scenario, GDP per capita is expected to increase from US$1 867 in 2019 to US$3 493 by 2043, US$489 more than in the Current Path forecast. Jump to Free Trade scenario
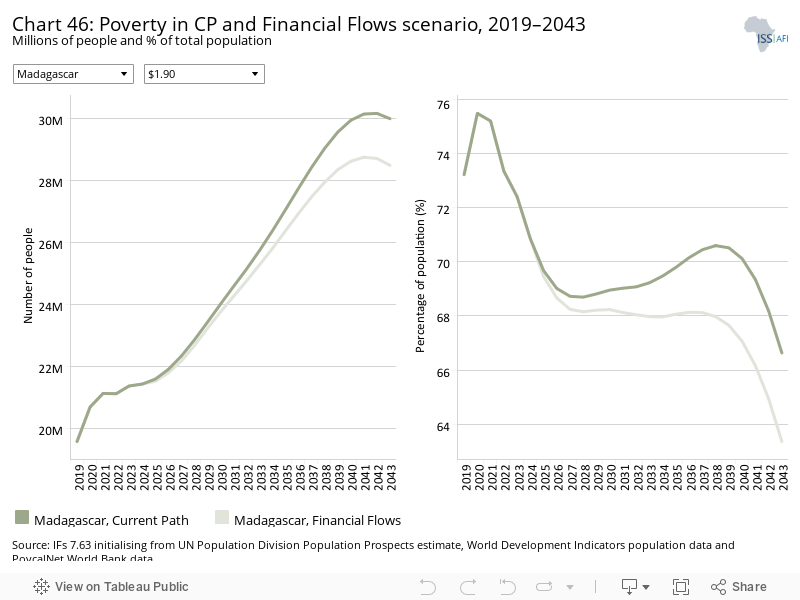
- In the Financial Flows scenario, FDI inflows are set to account for 6.9% of GDP as opposed to 6.1% in the Current Path forecast. Jump to Financial Flows scenario
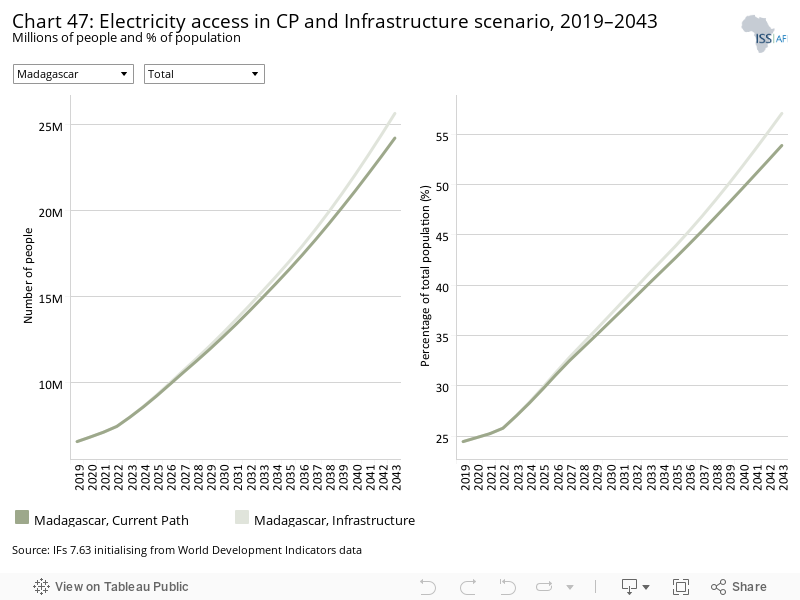
- The Infrastructure scenario will improve the electricity access rate from 25.3% in 2019 to 57.1% in 2043 compared to 53.9% in the Current Path forecast. Jump to Infrastructure scenario
- In the Governance scenario, the share of the population living below the US$1.90 poverty line will be reduced to 64.3% by 2043 compared to 66.6% in the Current Path forecast. Jump to Governance scenario
- Madagascar’s carbon emissions are projected to increase the most in the Leapfrogging and the Free Trade scenarios by 2043, resulting in additional emissions of close to 10 million tons each. Jump to Impact of scenarios on carbon emissions
- Combined Agenda 2063 scenario
- Carbon emissions will increase almost tenfold from 1.5 million tons in 2019 to 14.5 million tons by 2043 in the Combined Agenda 2063 scenario. The scenario will significantly increase Madagascar’s GDP per capita, which could reach US$6 369 by 2043, more than 50% higher than in the Current Path forecast. Madagascar will move closer to eliminating extreme poverty by 2043: 17.9% of the population, 7.27 million people, are expected to live below the US$1.90 poverty line versus 66.6%, 30 million people, in the Current Path forecast. In the Combined Agenda 2063 scenario, Madagascar’s economy will be valued at US$140.8 billion by 2043, about 2.6 times as larger than in the Current Path forecast. Jump to Combined Agenda 2063 scenario
All charts for Madagascar
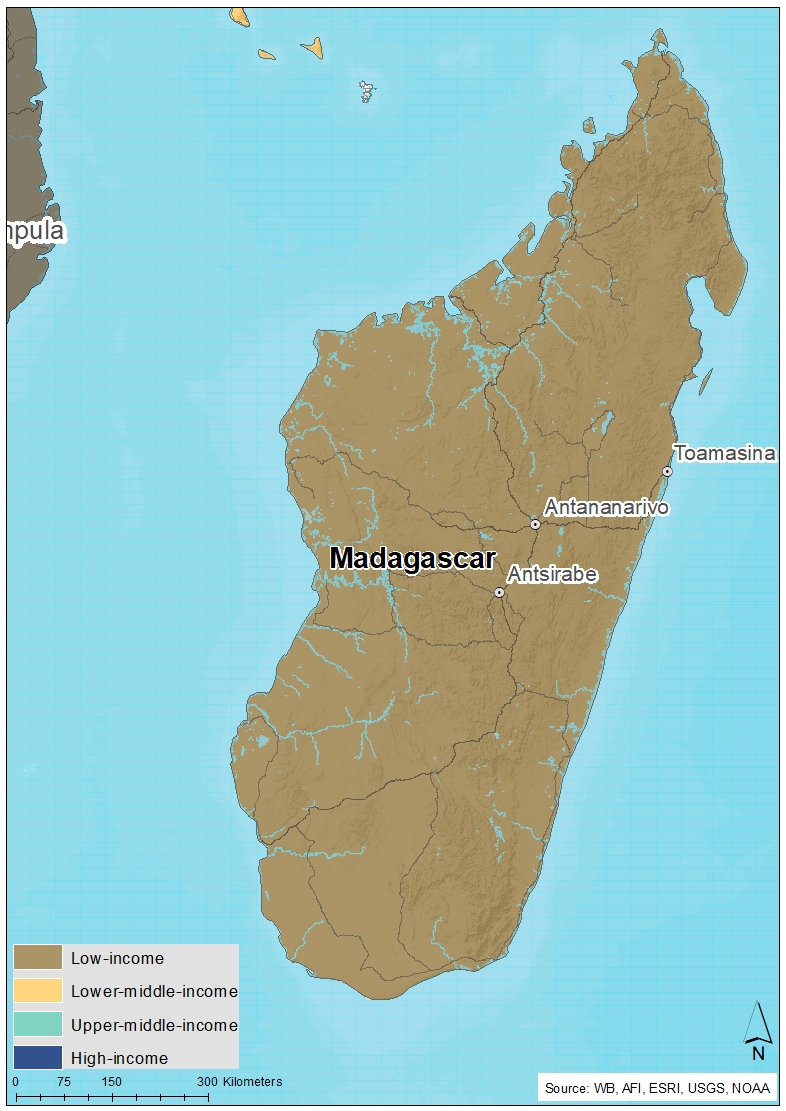
- Chart 1: Political map of Madagascar
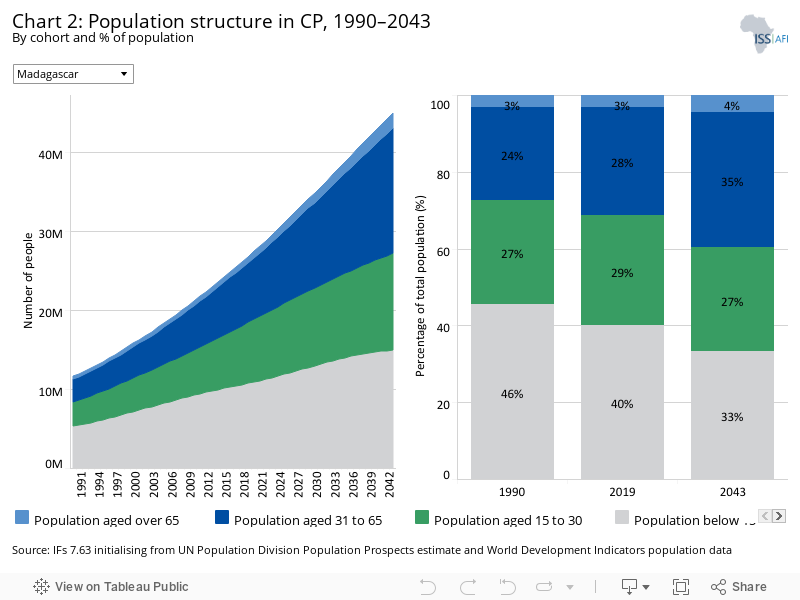
- Chart 2: Population structure in CP, 1990–2043
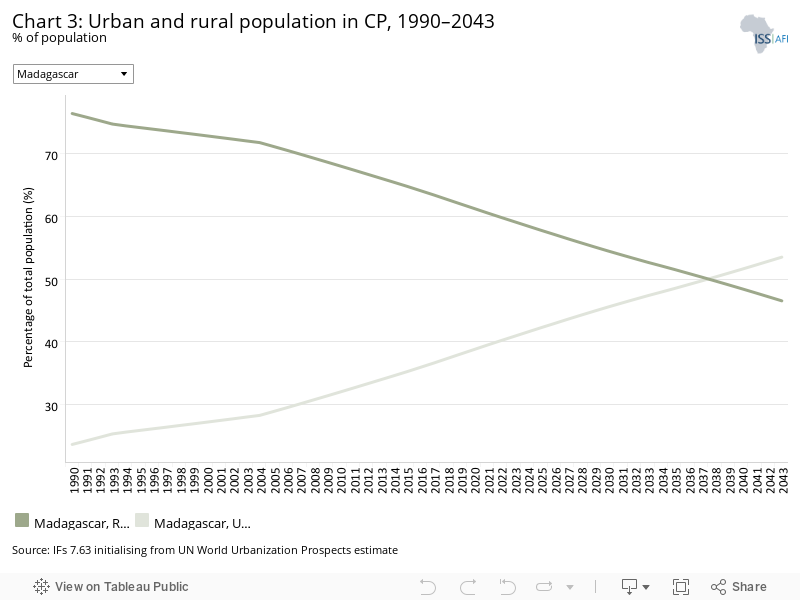
- Chart 3: Urban and rural population in CP, 1990–2043
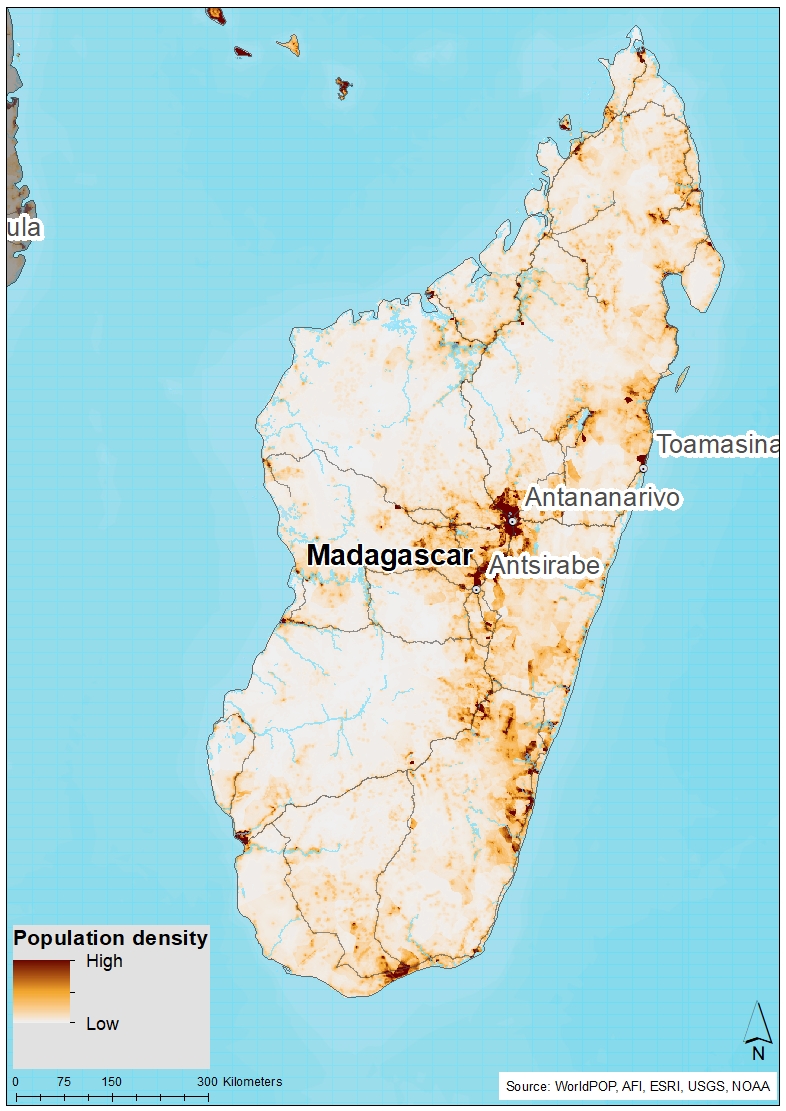
- Chart 4: Population density map for 2019
- Chart 5: GDP in CP, 1990–2043
- Chart 6: GDP per capita in CP, 1990–2043
- Chart 7: Informal sector value in CP, 2015–2043
- Chart 8: Value added by sector in CP, 2015–2043
- Chart 9: Agriculture production/demand in CP, 1990–2043
- Chart 10: Poverty in CP, 2015–2043
- Chart 11: Energy production by type in CP, 1990–2043
- Chart 12: Carbon emissions in CP, 1990–2043
- Chart 13: Governance security in CP and Stability scenario, 2019–2043
- Chart 14: GDP per capita in CP and Stability scenario, 2019–2043
- Chart 15: Poverty in CP and Stability scenario, 2019–2043
- Chart 16: Demographic dividend in CP and Demog scenario, 2019–2043
- Chart 17: Infant mortality in CP and Demog scenario, 2019–2043
- Chart 18: GDP per capita in CP and Demog scenario, 2019–2043
- Chart 19: Poverty in CP and Demog scenario, 2019–2043
- Chart 20: Life expectancy in CP and Health/WaSH scenario, 2019–2043
- Chart 21: Infant mortality in CP and Health/WaSH scenario, 2019–2043
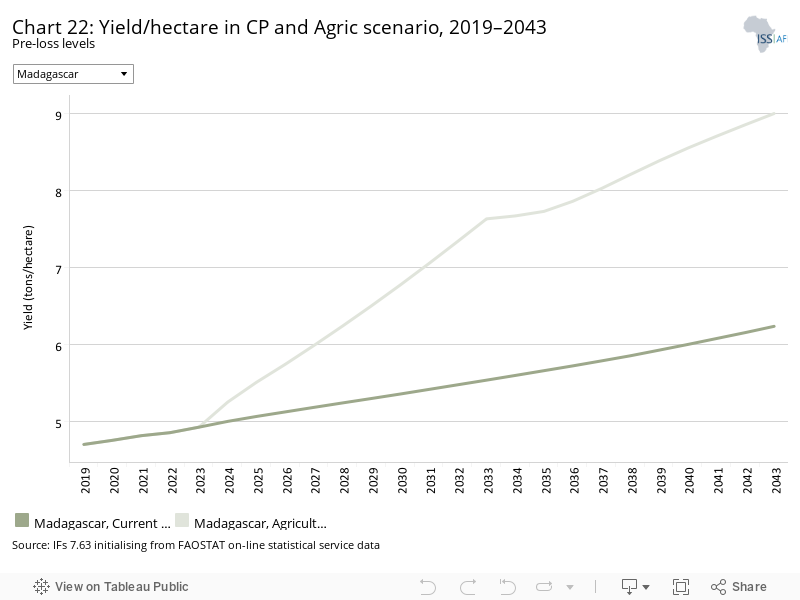
- Chart 22: Yield/hectare in CP and Agric scenario, 2019–2043
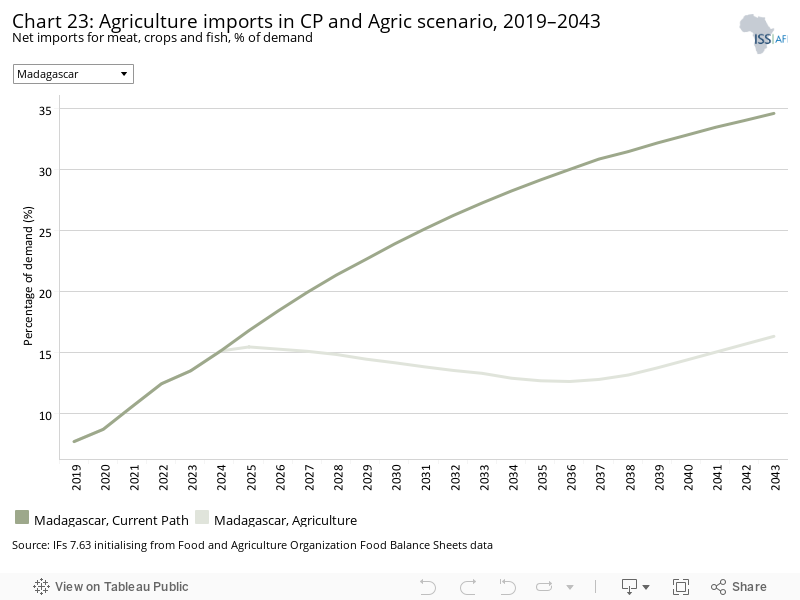
- Chart 23: Agriculture imports in CP and Agric scenario, 2019–2043
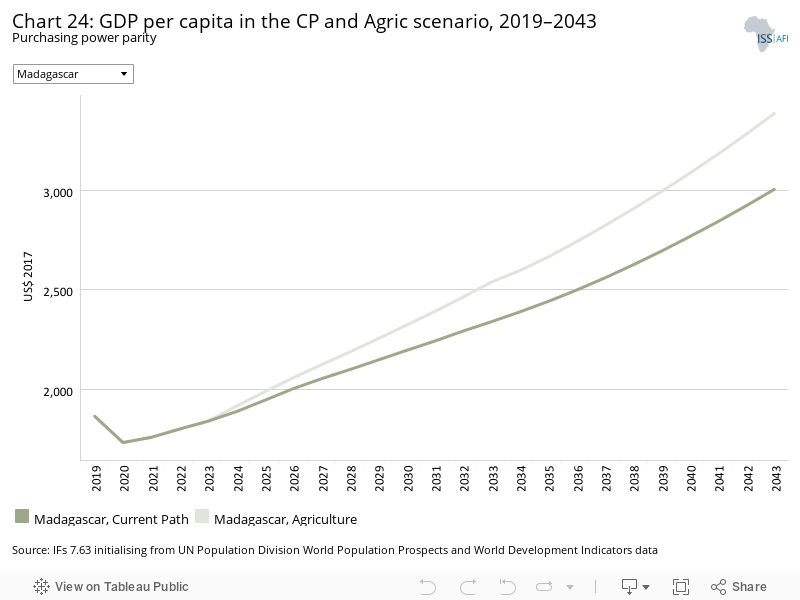
- Chart 24: GDP per capita in the CP and Agric scenario, 2019–2043
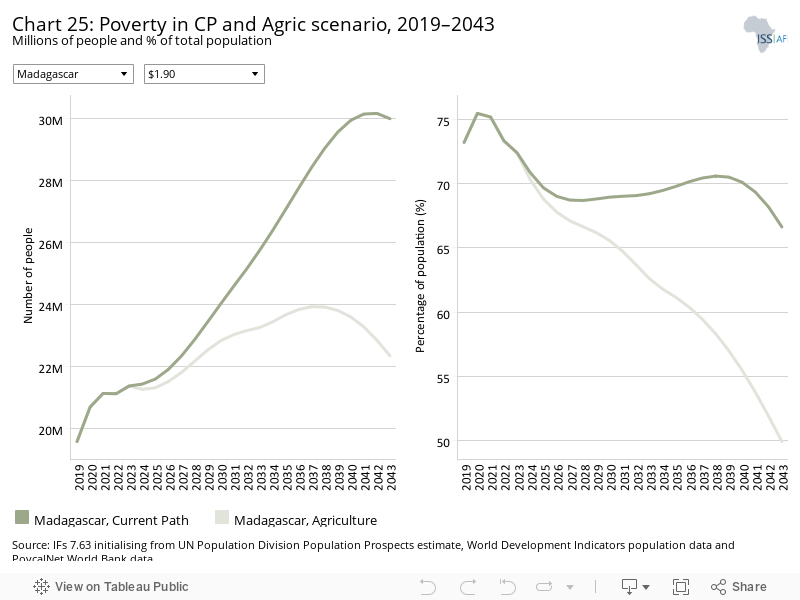
- Chart 25: Poverty in CP and Agric scenario, 2019–2043
- Chart 26: Mean years of education in CP and Educ scenario, 2019–2043
- Chart 27: Education quality in CP and Educ scenario, 2019–2043
- Chart 28: GDP per capita in CP and Educ scenario, 2019–2043
- Chart 29: Poverty in CP and Educ scenario, 2019–2043
- Chart 30: Value added by sector in CP and Manufac/Transfers scenario, 2019–2043
- Chart 31: Gov welfare transfers in CP and Manufac/Transfers scenario, 2019–2043
- Chart 32: GDP per capita in CP and Manufac/Transfers scenario, 2019–2043
- Chart 33: Poverty in CP and Manufac/Transfers scenario, 2019–2043
- Chart 34: Fixed broadband access in CP and Leapfrogging scenario, 2019–2043
- Chart 35: Mobile broadband access in CP and Leapfrogging scenario, 2019–2043
- Chart 36: Electricity access in CP and Leapfrogging scenario, 2019–2043
- Chart 37: GDP per capita in CP and Leapfrogging scenario, 2019–2043
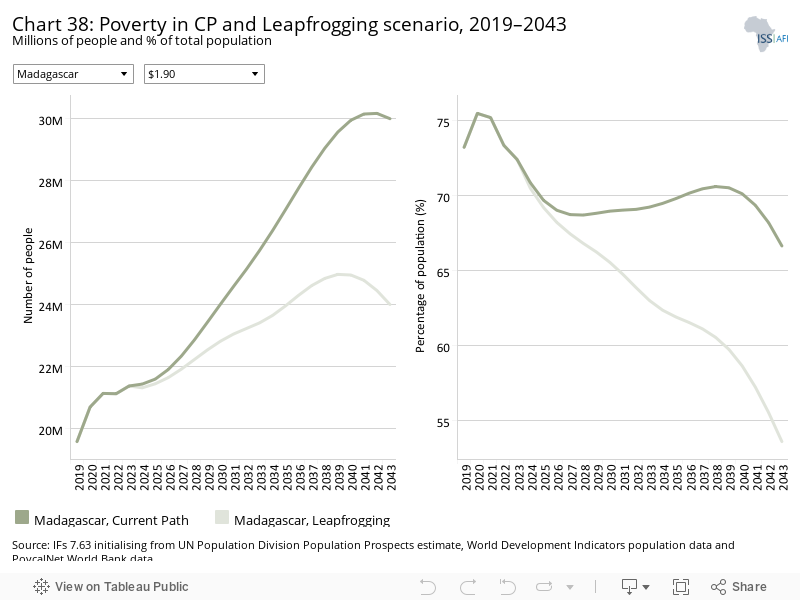
- Chart 38: Poverty in CP and Leapfrogging scenario, 2019–2043
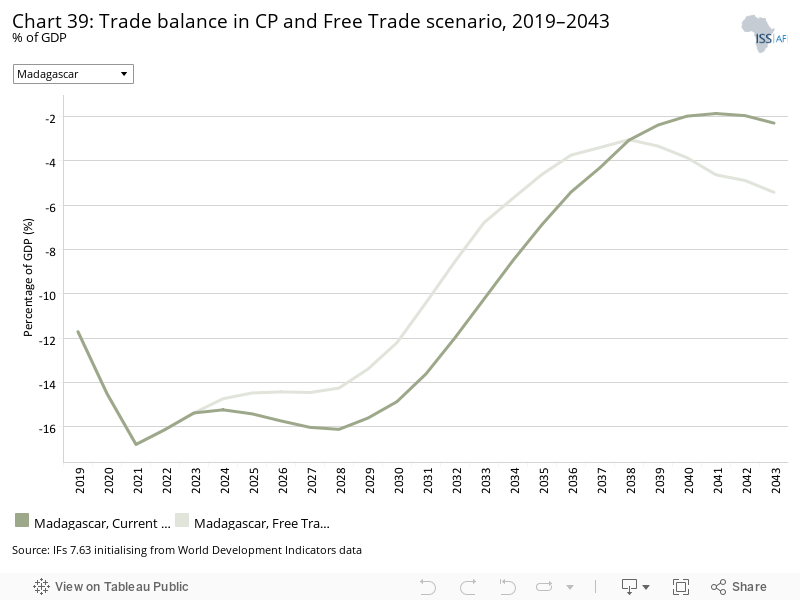
- Chart 39: Trade balance in CP and Free Trade scenario, 2019–2043
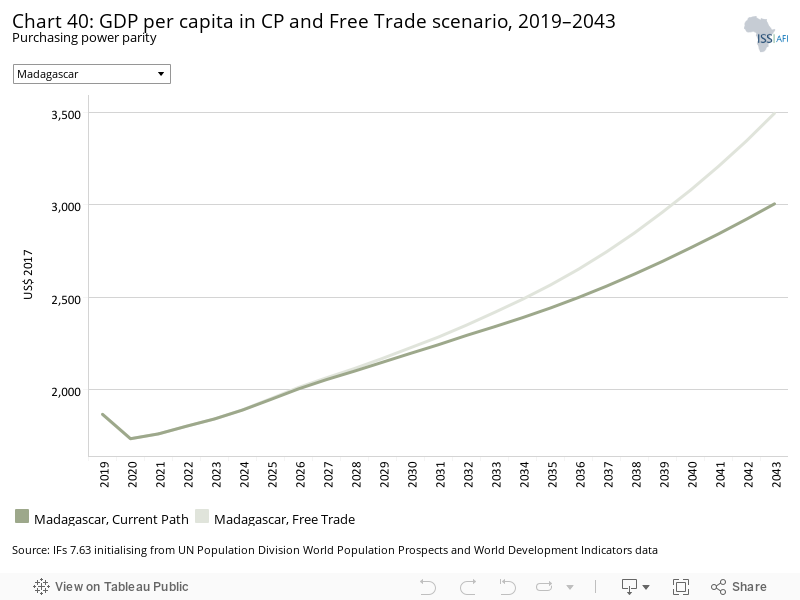
- Chart 40: GDP per capita in CP and Free Trade scenario, 2019–2043
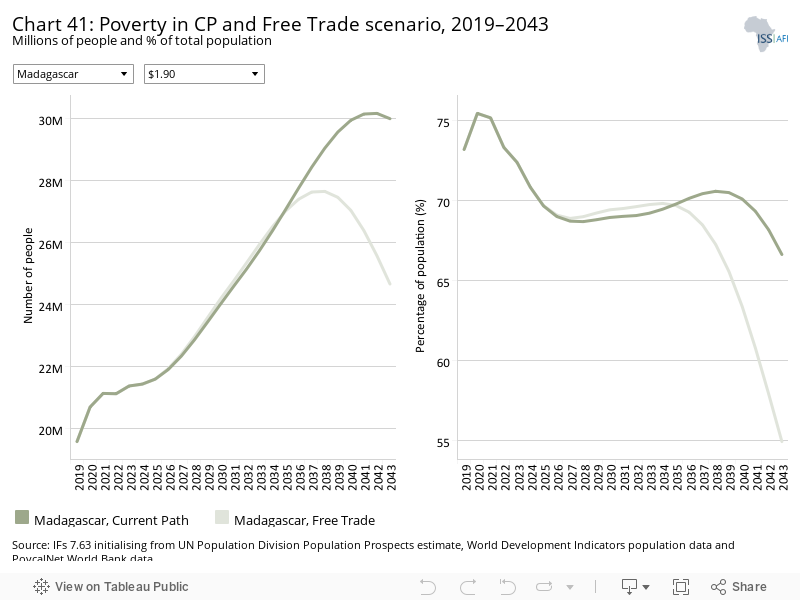
- Chart 41: Poverty in CP and Free Trade scenario, 2019–2043
- Chart 42: Foreign aid in CP and Financial Flows scenario, 2019–2043
- Chart 43: Inflow of FDI in CP and Financial Flows scenario, 2019–2043
- Chart 44: Remittances in CP and Financial Flows scenario, 2019–2043
- Chart 45: GDP per capita in CP and Financial Flows scenario, 2019–2043
- Chart 46: Poverty in CP and Financial Flows scenario, 2019–2043
- Chart 47: Electricity access in CP and Infrastructure scenario, 2019–2043
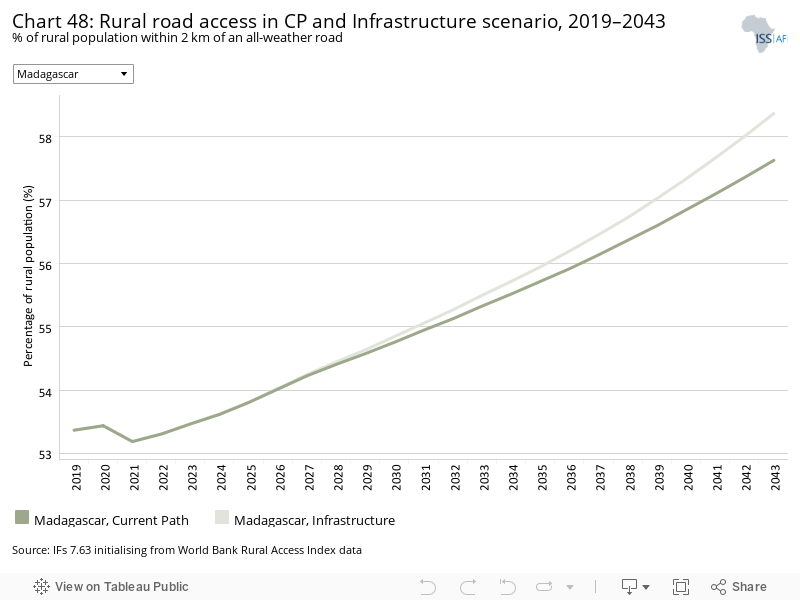
- Chart 48: Rural road access in CP and Infrastructure scenario, 2019–2043
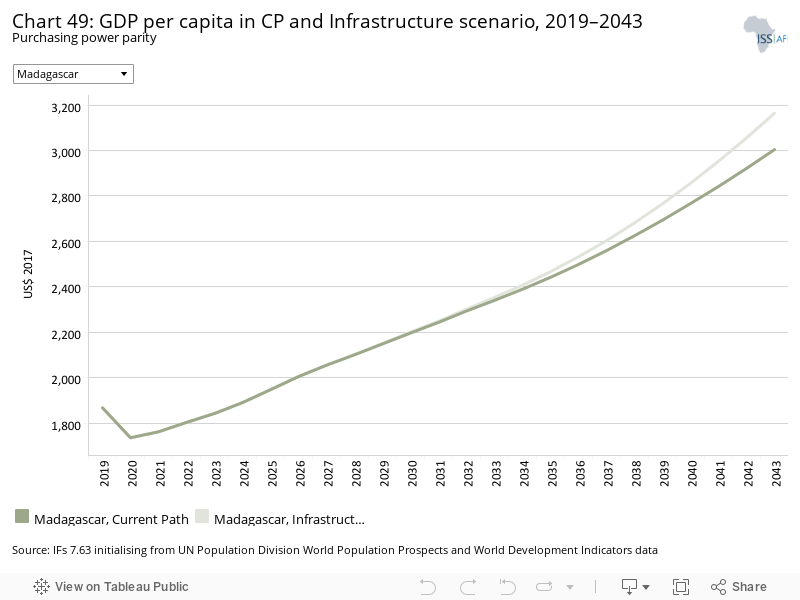
- Chart 49: GDP per capita in CP and Infrastructure scenario, 2019–2043
- Chart 50: Poverty in CP and Infrastructure scenario, 2019–2043
- Chart 51: Gov effectiveness in CP and Governance scenario, 2019–2043
- Chart 52: GDP per capita in CP and Governance scenario, 2019–2043
- Chart 53: Poverty in CP and Governance scenario, 2019–2043
- Chart 54: Carbon emissions in CP and scenarios, 2019–2043
- Chart 55: GDP per capita in CP and scenarios, 2019–2043
- Chart 56: GDP per capita in CP and Combined scenario, 2019–2043
- Chart 57: Poverty in CP and Combined scenario, 2019–2043
- Chart 58: Value added by sector in CP and Combined scenario, 2019–2043
- Chart 59: GDP in CP and Combined scenario, 2019–2043
- Chart 60: Carbon emissions in CP and Combined scenario, 2019–2043

This page provides an overview of the key characteristics of Madagascar along its likely (or Current Path) development trajectory. The Current Path forecast from the International Futures forecasting (IFs) platform is a dynamic scenario that imitates the continuation of current policies and environmental conditions. The Current Path is therefore in congruence with historical patterns and produces a series of dynamic forecasts endogenised in relationships across crucial global systems. We use 2019 as a standard reference year and the forecasts generally extend to 2043 to coincide with the end of the third ten-year implementation plan of the African Union’s Agenda 2063 long-term development vision.
The Republic of Madagascar is an island country in the Indian Ocean, approximately 400 km off the coast of East Africa across the Mozambique Channel. At 592 800 km2, Madagascar is the world's second largest island country after Indonesia. The nation consists of the main island of Madagascar and multiple smaller peripheral islands. Neighbouring islands include the French territory of Réunion and the country of Mauritius to the east, as well as Comoros and the French territory of Mayotte to the north-west. The nearest mainland state is Mozambique, located to the west.
From the early 19th century, most of the island was united and ruled as the Kingdom of Madagascar. The monarchy ended in 1897 when the French colonised the island. Madagascar gained independence in 1960, and since 1992 it has officially been governed as a constitutional democracy. In 2019, Madagascar had a population of about 26.8 million people. Its capital and largest city is Antananarivo. The country’s economy is based primarily on tourism, textiles, agriculture and mining.
Madagascar is a member of the United Nations, the African Union (AU), the Southern African Development Community (SADC), and the Organisation Internationale de la Francophonie.
Madagascar has a young and fast-growing population. Coming from a baseline of about 6.3 million people in 1990, by 2019 its population had increased more than fourfold to 26.8 million people. Over the coming two decades, it will grow significantly and reach 45.1 million people by 2043. Population growth in Madagascar is driven by natural population growth, meaning births are outstripping deaths. Madagascar’s population is also young, with 40% being under 15 years old in 2019. The country’s median age of 19.5 years lies above the average median age of 17.9 years for Africa’s low-income economies. On the Current Path, Madagascar’s demographic structure is expected to change slowly but steadily. By 2043, only 33% of the population is forecast to be under 15 years old.
In 2019, average total fertility stood at 4.1 births per woman, below the average of 5 for Madagascar’s low-income peer group. By 2043, the country’s fertility rate is expected to drop to 3 births per woman. As a consequence, the median age is projected to increase to 23.6 years — the third highest among Africa’s 23 low-income economies after Rwanda and Sudan.
By 2043, the country’s working-age population is expected to account for about 62.3% of the population compared to 57% in 2019. Indeed, the ratio of people of working age relative to the dependent population is improving but not fast enough. On the Current Path, Madagascar is expected to reach the peak of its demographic dividend only in 2065 (from 1.3 in 2019 to 2.1 in 2065).
Madagascar is more urbanised than the average African low-income economy. Island economies are typically more urbanised than their non-island counterparts in similar income categories. In 2019, only 38% of Madagascar’s population lived in urban areas and 62% lived in rural areas. Africa’s low-income countries had a rural-urban split of 69% versus 31% in 2019. On the Current Path, Madagascar is becoming more urbanised with 53.5% of the population living in urban areas by 2043 and 46.5% living in rural areas. The anticipated ratio for Africa’s low-income economies is 40.7% urban versus 59% rural by 2043.
Madagascar’s population density is 0.46 people per hectare, making it the 135th most densely populated country in the world. The population is unevenly distributed with the west coast being sparsely populated and the centre and the east coast being more densely populated.
Antananarivo is Madagascar’s capital and by far the island’s largest city with an estimated population of 1.4 million people. The cities of Toamasina, Antsirabe and Mahajanga have between 200 000 and 300 000 inhabitants.
Between 1990 and 2019, Madagascar’s GDP more than doubled from US$8.1 billion in 1990 to US$16.8 billion in 2019. The country ranks eighth out of 23 African low-income economies, with Sudan and Ethiopia being the lead economies. In 2043, Madagascar’s GDP is forecast to be US$52.8 billion, more than three times as large as in 2019. The economy will expand, but with projected average annual growth rates under 5% over the coming two decades, combined with historically high levels of inequality, such expansion is insufficient to allow for meaningful progress in human development.
According to the African Development Bank, ‘Madagascar’s economy has experienced little structural transformation since 2000 and remains mostly based on services, with a poorly developed industrial sector that generates little value added’. The agriculture sector is dominated by subsistence farming, and even though the agriculture sector has seen little to no reforms over the past 15 years, it is the most important source of employment, accounting for close to 80% of the country’s workforce.
The country’s varied climate allows for the cultivation of tropical crops such as rice, cassava, beans and bananas. Rice accounts for the largest share of total crop acreage. Other valuable export-oriented agricultural products include cloves, vanilla, cacao, sugar, pepper and coffee.
Although many of the charts in the sectoral scenarios also include GDP per capita, this overview is an essential point of departure for interpreting the general economic outlook of Madagascar.
In 2019, Madagascar’s GDP per capita ranked tenth out of 23 for Africa’s low-income economies, at a value of US$1 867. In the Current Path forecast, the country’s per capita income is expected to increase to US$3 004 per capita by 2043, falling to 14th within its low-income peer group. In fact, Madagascar’s GDP per capita is expected to fall below the average of its low-income peer group of US$3 790 by 2043.
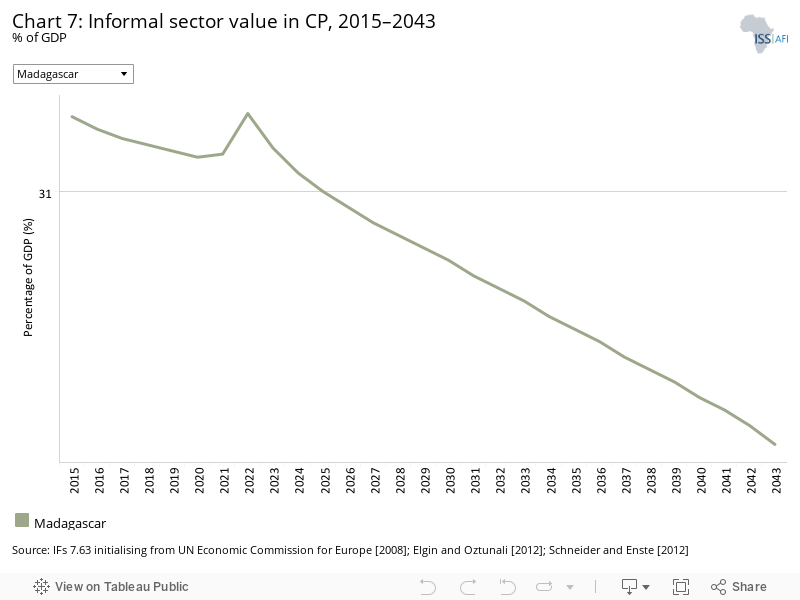
In 2019, Madagascar’s informal sector accounted for approximately 31.1% of GDP, in line with the average share of 30.1% in Africa’s low-income economies. The informal sector is a burden on the formal economy because of low contributions to tax revenues and the subsequent negative impact on expenditure on public utilities. By 2043, Madagascar’s informal sector is forecast to account for 30.2%, a marginal decrease that likely reflects limited improvements in overall state capacity, including for taxation.
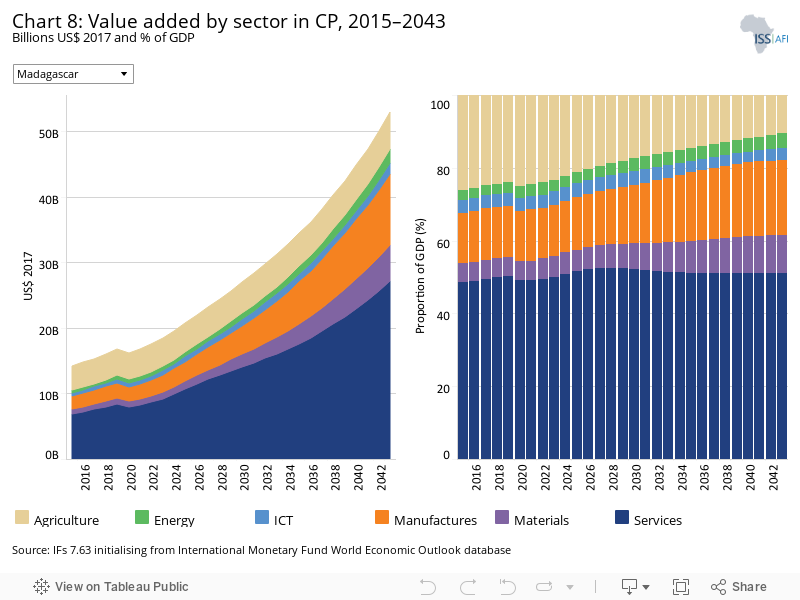
The IFs platform uses data from the Global Trade and Analysis Project (GTAP) to classify economic activity into six sectors: agriculture, energy, materials (including mining), manufacturing, services and information and communication technologies (ICT). Most other sources use a threefold distinction between only agriculture, industry and services with the result that data may differ.
In 2019, Madagascar’s service sector accounted for half of the country’s GDP (50.2%), followed by agriculture which represented about 23.9% and manufacturing at 14.1%. In the Current Path forecast, the service sector is expected to remain the most important contributor to Madagascar’s GDP. Its share is set to grow to 51.2% by 2043. At the same time, the contribution of the agriculture sector is forecast to drop to 5.5%. Manufacturing, on the other hand, is forecast to increase by more than 8 percentage points to 10.8% in 2043.
Madagascar’s expected trajectory roughly mirrors that of its low-income peer group, with services continuing to represent the largest share of GDP, followed by agriculture, whose contribution will decline, and manufacturing, which will experience growth.
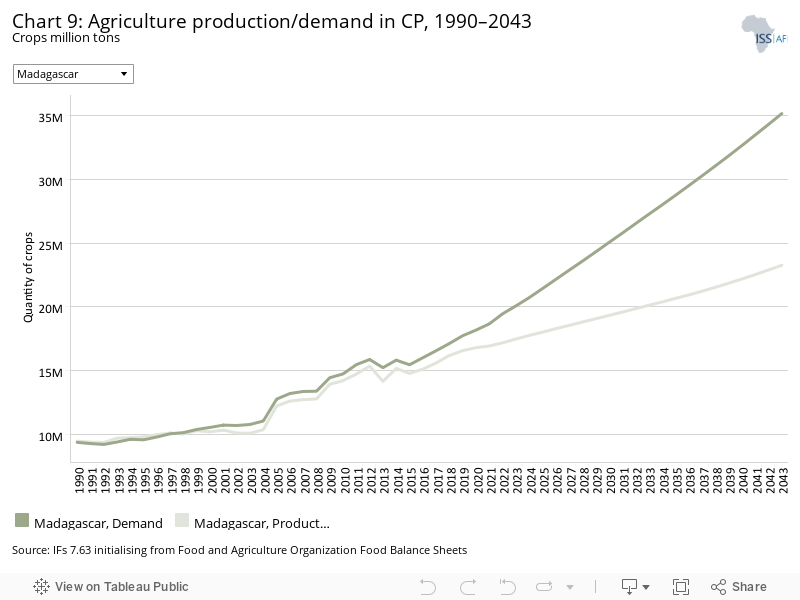
The data on agricultural production and demand in the IFs forecasting platform initialises from data provided on food balances by the Food and Agriculture Organization (FAO). IFs contains data on numerous types of agriculture but aggregates its forecast into crops, meat and fish, presented in million metric tons. Chart 9 shows agricultural production and demand as a total of all three categories.
In 2019, Madagascar’s agricultural production amounted to 16.6 million tons, while agricultural demand stood at 17.7 million tons. This gap is projected to widen by 2043 with Madagascar expected to increase its output to 23.3 million tons and demand almost doubling to 35.2 million tons. In other words, agricultural production does not meet demand and this situation will worsen in the Current Path forecast with the gap increasing more than tenfold from 1.2 million tons in 2019 to 12 million tons in 2043.
Fast population growth is rapidly fuelling agricultural demand. In combination with low productivity as well as environmental degradation and high exposure to climate change-related risks, Madagascar is at risk of food insecurity. In mid-2021, a severe drought in southern Madagascar caused hundreds of thousands of people to suffer from food insecurity or famine.
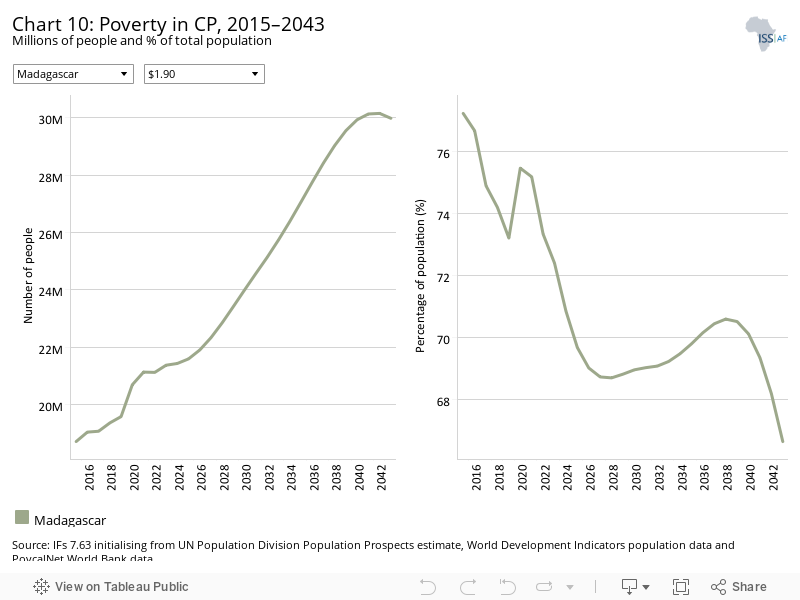
There are numerous methodologies for and approaches to defining poverty. We measure income poverty and use GDP per capita as a proxy. In 2015, the World Bank adopted the measure of US$1.90 per person per day (in 2011 international prices), also used to measure progress towards the achievement of Sustainable Development Goal (SDG) 1 of eradicating extreme poverty. To account for extreme poverty in richer countries occurring at slightly higher levels of income than in poor countries, the World Bank introduced three additional poverty lines in 2017:
- US$3.20 for lower middle-income countries
- US$5.50 for upper middle-income countries
- US$22.70 for high-income countries.
As a low-income country, Madagascar uses the US$1.90 benchmark to define extreme poverty. The country’s poverty burden is high, with the country having Africa’s fifth highest poverty rate in 2019, at 73.2%, which corresponds to 19.5 million people. Madagascar’s poverty rate is significantly higher than the average for Africa’s low-income economies on the continent at 47.8%.
On the Current Path, the number of people living in extreme poverty in Madagascar will increase to 30 million people by 2043. The country’s poverty rate, however, is projected to decline to 66.6% by then. In 2019, Madagascar had the fourth highest poverty rate among Africa’s low-income economies, after South Sudan, Burundi and the Central African Republic. Unlike Madagascar, those three countries experience high levels of violent conflict. In Madagascar, incipient economic development has repeatedly been interrupted by political instability. This was the case in 2002 and in 2009.
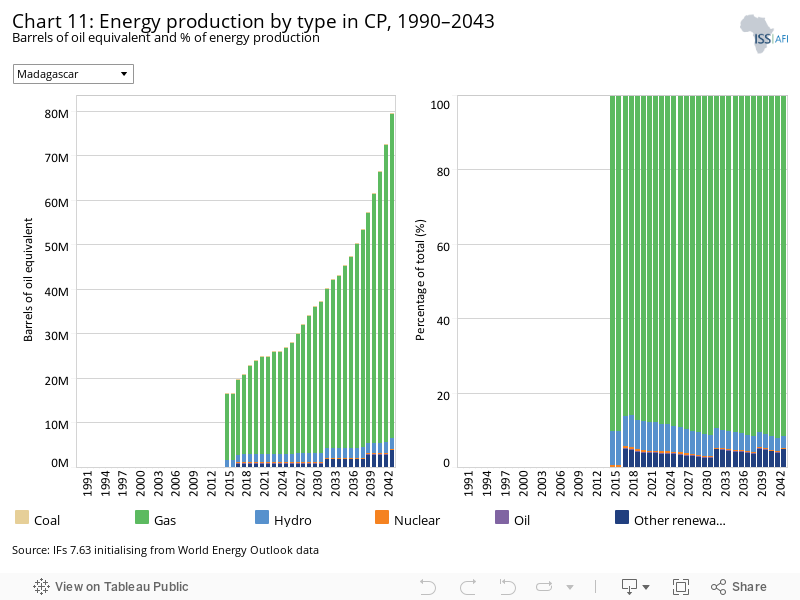
The IFs platform forecasts six types of energy, namely oil, gas, coal, hydro, nuclear and other renewables. To allow comparisons between different types of energy, the data is converted into billion barrels of oil equivalent (BBOE). The energy contained in a barrel of oil is approximately 5.8 million British thermal units (MBTUs) or 1 700 kilowatt-hours (kWh) of energy.
In 2019, Madagascar’s total energy production equated to 23 million barrels of oil equivalent. By 2043, it is estimated to triple to 80 million barrels of oil equivalent. The country’s current energy mix is heavily reliant on gas which accounted for close to 80% of total energy production in 2019. Gas was followed by hydropower at 8% and other renewables at 4%.
In the Current Path forecast, gas is forecast to become even more dominant and will account for 92% of energy production by 2043. Hydropower is set to drop in relevance accounting for only 3%, while other renewables’ importance is expected to marginally grow, reaching 5% of total energy production by 2043. Madagascar’s gas production is expected to reach 73 million barrels of oil equivalent by 2043, up from 20 million barrels in 2019. The anticipated share of other renewables in Madagascar’s energy production profile does not come close to the average of 39% that is expected for Africa’s low-income economies by 2043.
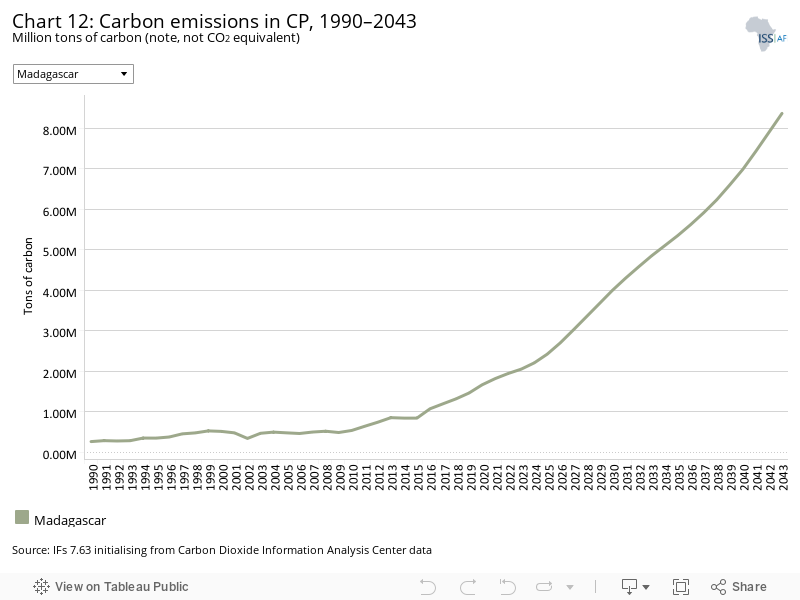
Carbon is released in many ways, but the three most important contributors to greenhouse gases are carbon dioxide (CO2), carbon monoxide (CO) and methane (CH4). Since each has a different molecular weight, IFs uses carbon. Many other sites and calculations use CO2 equivalent.
Madagascar’s carbon emissions stood at 1.5 million tons of carbon in 2019. They are forecast to increase almost sevenfold to 8.4 million tons of carbon by 2043. The increase is mainly attributable to the rise in economic activity that the country will experience over the forecast horizon, as highlighted in Chart 5.
Sectoral Scenarios for Madagascar
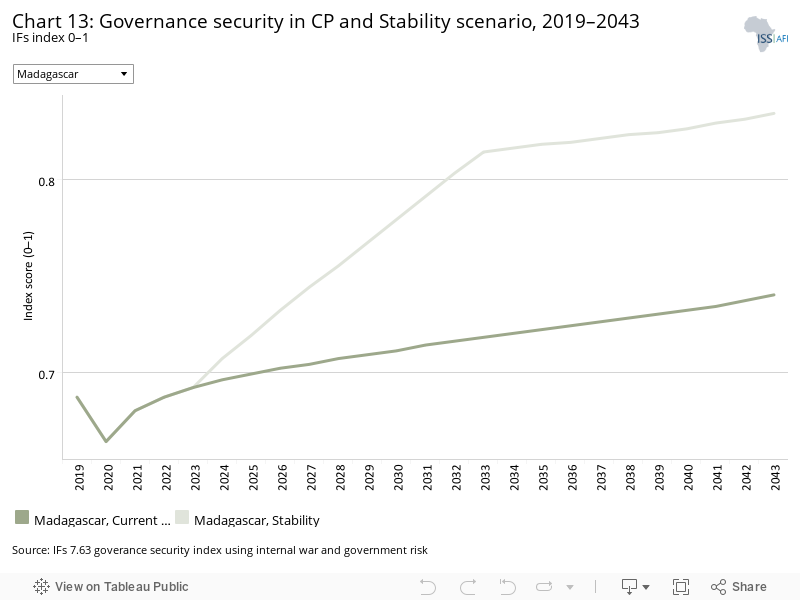
Download to pdfThe Stability scenario represents reasonable but ambitious reductions in the risk of regime instability and lower levels of internal conflict. Stability is generally a prerequisite for other aspects of development and this would encourage inflows of foreign direct investment (FDI) and improve business confidence. Better governance through the accountability that follows substantive democracy is modelled separately.
The intervention is explained here in the thematic part of the website.
In 2019, Madagascar scored 0.69 on the governance security index — slightly higher than the average score of 0.64 for its low-income peer group. With a score of 0.76, Rwanda is the group’s best performer. In the Stability scenario, governance security in Madagascar is projected to improve to a score of 0.84 by 2043 compared to 0.74 in the Current Path forecast. By then, its income peer group on the continent is projected to score 0.96 on average versus 0.71 on the Current Path.
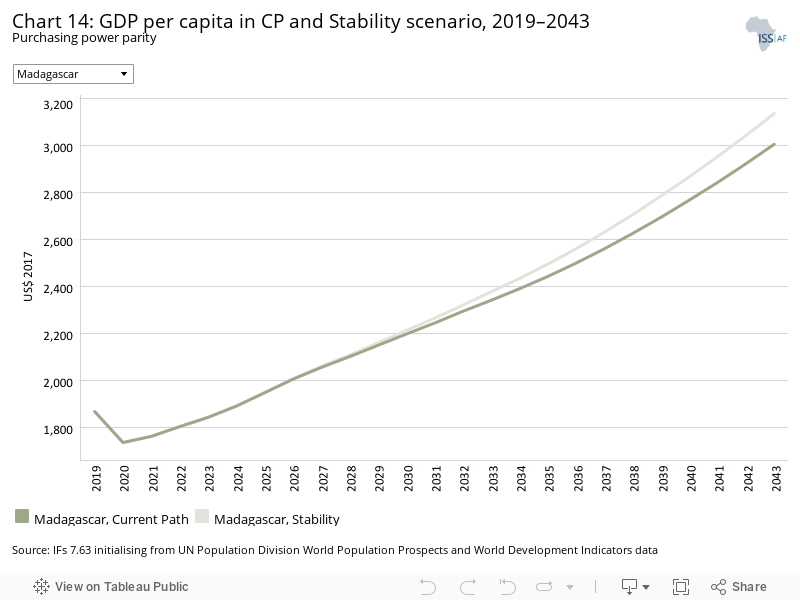
In 2019, Madagascar’s GDP per capita was US$1 972. The Stability scenario will lead to a higher GDP per capita of US$3 135 by 2043 compared to the Current Path forecast of US$3 004. However, Madagascar’s GDP per capita is projected to lag behind the average of the African low-income group, whose GDP per capita will be US$3 790 in 2043 in the Current Path forecast.
The Stability scenario will reduce the number of people living in extreme poverty by 1.5 million people compared to the Current Path forecast, reducing the absolute number from 28.5 million people to 30 million people by 2043.
In the Stability scenario, Madagascar’s poverty rate could drop from 73.2% in 2019 to 63.4% in 2043 compared to 66.6% in the Current Path forecast. In other words, Madagascar could speed up its poverty reduction efforts, even if not by a great margin.
This section presents the impact of a Demographic scenario that aims to hasten and increase the demographic dividend through reasonable but ambitious reductions in the communicable-disease burden for children under five, the maternal mortality ratio and increased access to modern contraception.
The intervention is explained here in the thematic part of the website.
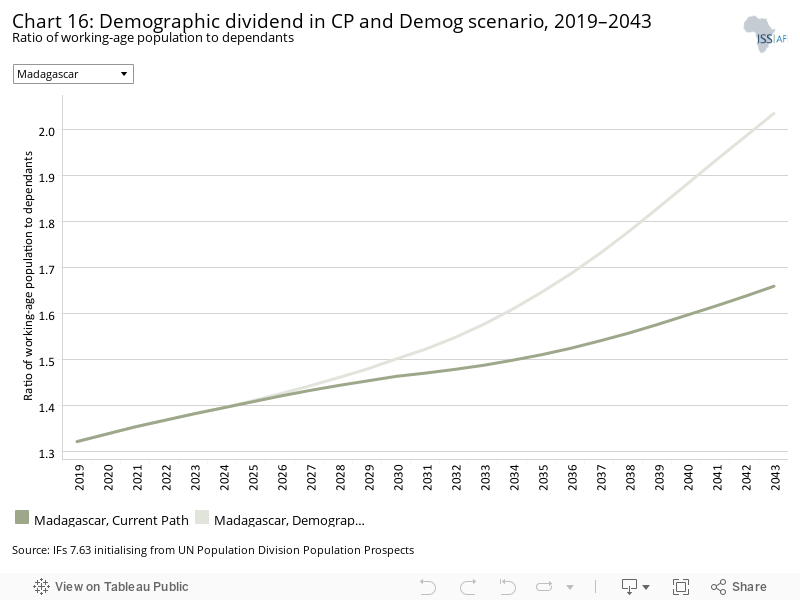
Demographers typically differentiate between a first, second and even a third demographic dividend. We focus here on the contribution of the size of the labour force (between 15 and 64 years of age) relative to dependants (children and the elderly) as part of the first dividend. A window of opportunity opens when the ratio of the working-age population to dependants is equal to or surpasses 1.7.
Increasing access to modern contraception will bring down Madagascar’s total fertility rate more quickly than on the Current Path: from 4.1 births per woman in 2019 to 2.1 in 2043, as opposed to 3 births on the Current Path. A lower total fertility rate would slow down Madagascar’s population growth and bring about a somewhat faster change in the population age structure. The latter will result in a more favourable ratio between people of working age and dependants, especially children. In the Demographic scenario, Madagascar has the potential to accelerate its demographic transition by increasing the ratio of workers to dependants from 1.3 in 2019 to 2 in 2043, compared to 1.7 on the Current Path. This means that Madagascar could arrive at the ‘demographic sweet spot’ about seven years earlier than on the Current Path and overtake many of its African low-income peers. The average African low-income country would on average get there by 2042 (from 1.5 in 2019 to 1.7 in 2043).
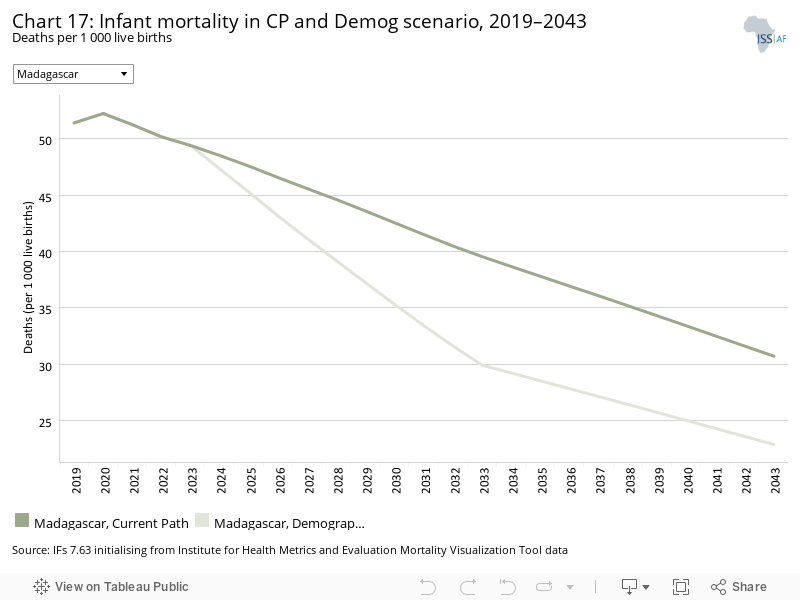
The infant mortality rate is the number of infant deaths per 1 000 live births and is an important marker of the overall quality of the health system in a country.
At 51.4 infant deaths per 1 000 live births, infant mortality in Madagascar is high, although it has improved greatly since 1990 when it stood at a rate of 89.9. Yet, Madagascar is outperformed by its African low-income peer group with an average of 48.5 infant deaths per 1 000 live births. The Demographic scenario could reduce the country’s infant mortality rate to 22.9 deaths per 1 000 live births by 2043 compared to 32.2 deaths in the Current Path forecast. In the same scenario, the average for low-income countries in Africa would fall to 16.9 by 2043.
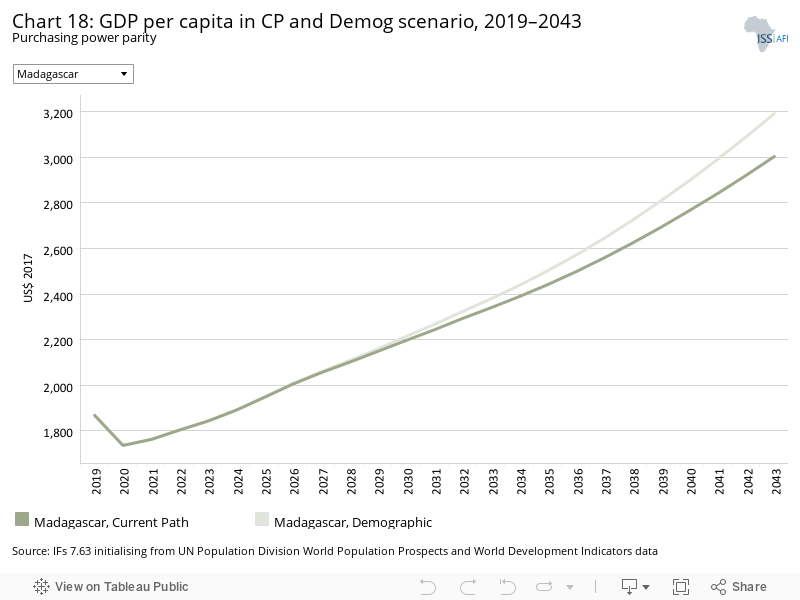
In 2019, Madagascar’s GDP per capita was US$1 867. By 2043, the Demographic scenario could push it to US$3 193 compared to US$3 004 on the Current Path. Regardless, the gap between Madagascar’s GDP per capita and the expected average GDP per capita of its low-income peer group is set to remain in place. These countries are expected to have an average GDP per capita of US$3 790 in 2043 in the Current Path forecast.
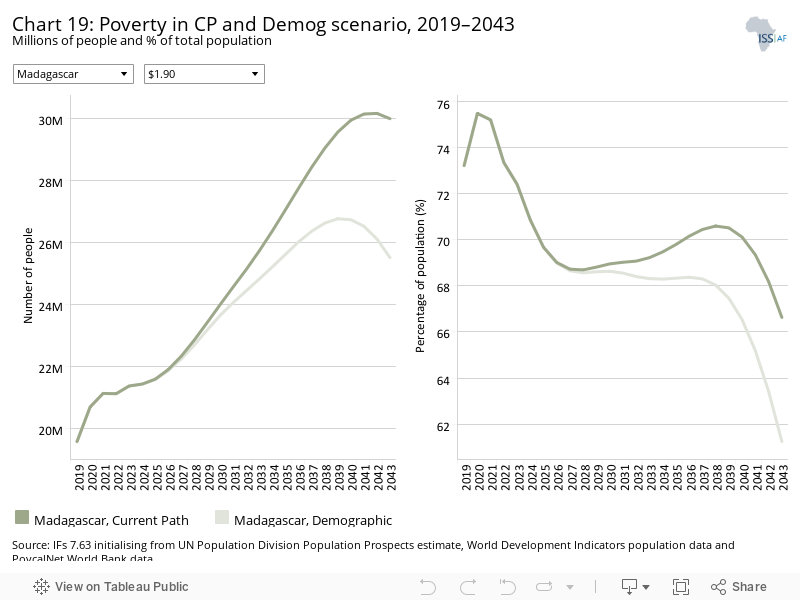
Compared to the Current Path forecast, the Demographic scenario could reduce the number of people living in extreme poverty by 4.5 million in 2043. An expected total of 25.5 million people or 63.4% of the population would be living below the poverty line by 2043 compared to 66.6% in the Current Path forecast. Madagascar will continue to perform significantly below the average of its low-income peers. On average, the group of Africa’s low-income economies is projected to have a poverty rate of 25.2% in the Current Path forecast.
This section presents reasonable but ambitious improvements in the Health/WaSH scenario, which include reductions in the mortality rate associated with both communicable diseases (e.g. AIDS, diarrhoea, malaria and respiratory infections) and non-communicable diseases (NCDs) (e.g. diabetes), as well as improvements in access to safe water and better sanitation. The acronym WaSH stands for water, sanitation and hygiene.
The intervention is explained here in the thematic part of the website.
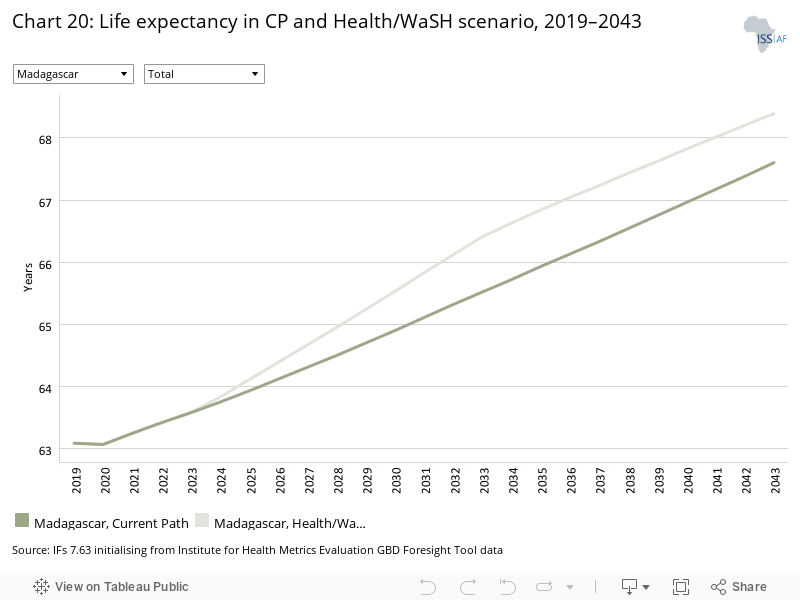
In 2019, Madagascar’s average life expectancy was 63.1 years, the tenth highest among its low-income peer economies on the continent. With a death rate of 3.8 deaths per 1 000 people, Madagascar’s communicable-disease burden is significantly lower than the average rate of its income peer group, which stands at 8.1 deaths per 1 000 people. Madagascar is relatively more advanced in the epidemiological transition with communicable diseases accounting for almost as many deaths as infectious diseases.
On the Current Path forecast, the average citizen of Madagascar can expect to add about 4.5 years to their life expectancy and live to 67.6 years by 2043, slightly less than the expected average of 70.8 years for Africa’s low-income economies. The Health/WaSH scenario has the potential to increase life expectancy from 63.1 years in 2019 to 68.4 years in 2043 — 0.8 years higher than in the Current Path forecast. Madagascar will perform below Africa’s low-income economies average life expectancy, which will increase to 70.9 years in the Current Path forecast and to 71.4 years in the Health/WaSH scenario by 2043.
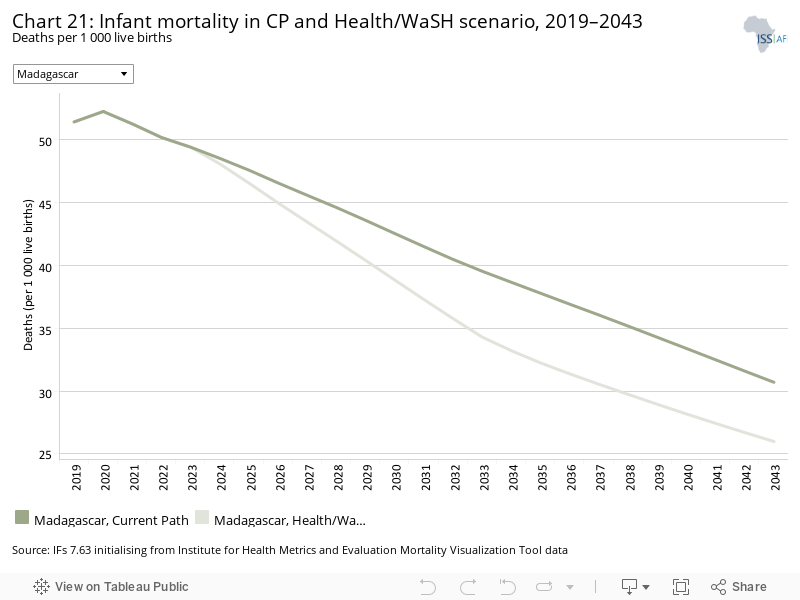
The Health/WaSH scenario would have a positive impact on Madagascar’s infant mortality rate. The rate will drop from 51.4 in 2019 to 26 deaths per live births in 2043 compared to an expected rate of 32.2 in the Current Path forecast. Madagascar performs worse than the average low-income economy in Africa, which is expected to record an infant mortality rate of 21.3 deaths per 1 000 live births by 2043 in the Current Path forecast and 18.9 in the Health/WaSH scenario.
The Agriculture scenario represents reasonable but ambitious increases in yields per hectare (reflecting better management and seed and fertiliser technology), increased land under irrigation and reduced loss and waste. Where appropriate, it includes an increase in calorie consumption, reflecting the prioritisation of food self-sufficiency above food exports as a desirable policy objective.
The intervention is explained here in the thematic part of the website.
The data on yield per hectare (in metric tons) is for crops but does not distinguish between different categories of crops.
In 2019, crop yields in Madagascar stood at 4.7 metric tons per hectare which is above the average of 2.7 metric tons per hectare for its low-income peer group on the continent. According to the Current Path forecast, by 2043 yields in Madagascar will increase to 6.2 metric tons per hectare — an increase of about 32%. In the Agriculture scenario, on the other hand, yields could increase by more than 90% over the same time period and amount to 9 metric tons per hectare by 2043.
In 2019, net agricultural imports accounted for 7.7% of the country’s demand. In the Current Path forecast, agricultural demand is increasingly outpacing production which will lead to greater import dependence. By 2043, net agricultural imports are expected to account for 34.6% of agricultural demand. The Agriculture scenario has the potential to increase production and reduce import dependence to meet the rapid increase in demand fuelled by population growth. In 2043, imports would account for 16.3% of demand — 18.3 percentage points less than in the Current Path forecast.
The Agriculture scenario is expected to push Madagascar’s GDP per capita to US$3 384 by 2043 compared to the Current Path forecast of US$3 004. Despite this boost, Madagascar’s GDP per capita is not projected to match the average GDP per capita of its low-income peer economies, which is set to reach US$3 790 in the Current Path forecast.
The impact of the interventions in the Agriculture scenario on poverty in Madagascar is sizable. The scenario significantly reduces the share of the population living below the poverty line compared to the Current Path forecast: by 2043, 50% instead of 66.6% of the population will be extremely poor. The Agriculture scenario has the potential to prevent 7.6 million people falling into poverty by 2043, with 22.4 million people being extremely poor compared to 30 million in the Current Path forecast.
The Education scenario represents reasonable but ambitious improved intake, transition and graduation rates from primary to tertiary levels and better quality of education. It also models substantive progress towards gender parity at all levels, additional vocational training at secondary school level and increases in the share of science and engineering graduates.
The intervention is explained here in the thematic part of the website.
With a mean of 5.2 years of education among the adult population in 2019, Madagascar’s educational outcomes are above the average for Africa’s low-income economies, which is 4.4 years. With a mean of 5.1 years, female education slightly lags behind male education with a mean of 5.3 years. The Education scenario has the potential to increase Madagascar’s mean years of education by one year to 6.3 years by 2043. This represents an improvement of 0.3 years compared to the Current Path forecast of 6 years in 2043. Female education outcomes could overtake those of males (6.5 versus 6.2 mean years of education respectively). Globally, Madagascar has the 22nd worst educational performance measured in mean years of education, and the 20th worst in sub-Saharan Africa.
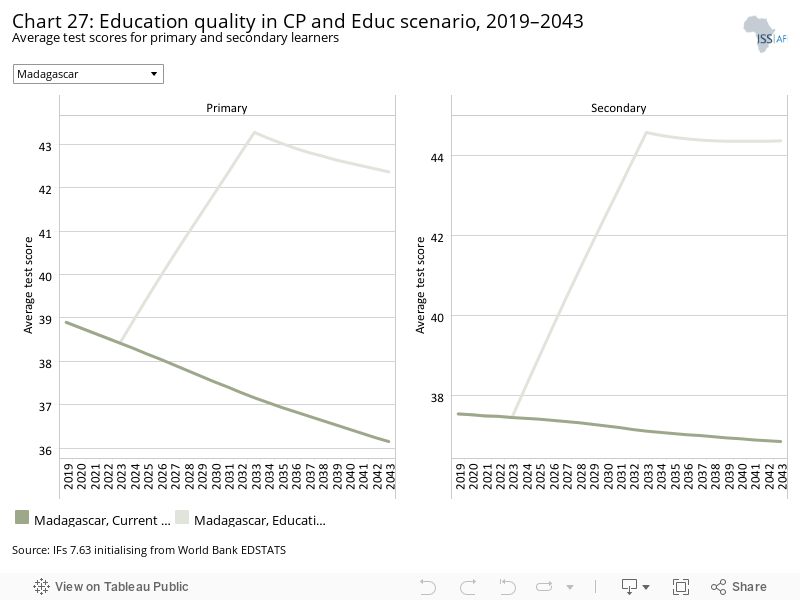
In 2019, Madagascar’s primary test score was 38.9. According to the Current Path forecast, it will decline to 36.2 in 2043. The Education scenario is expected to improve the country’s average test scores for primary learners to 42.4 by 2043 — an increase of 6.2 percentage points compared to the Current Path forecast for 2043.
In the Education scenario, the test score at the secondary level could increase by 6.9 percentage points from 37.5 in 2019 to 44.4 in 2043 versus 36.8 on the Current Path.
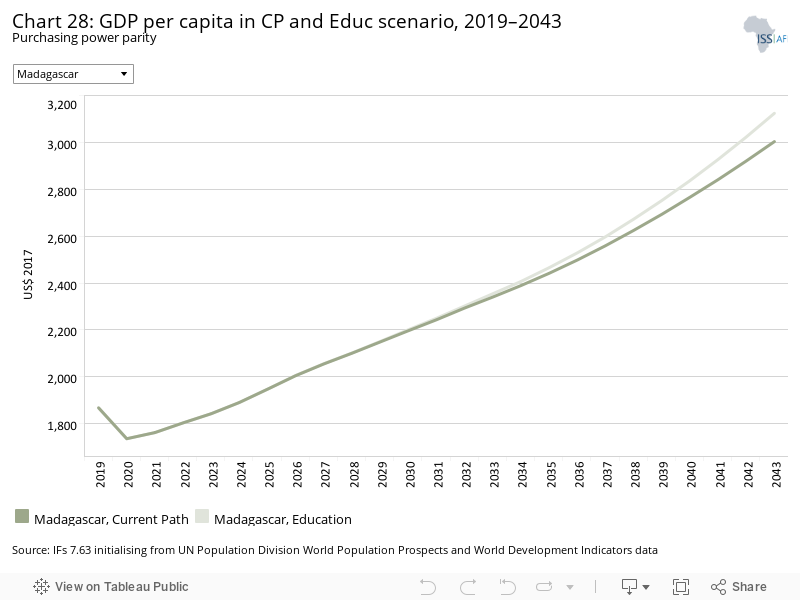
Madagascar’s GDP per capita will increase to US$3 004 on the Current Path versus US$3 125 in the Education scenario — a difference of US$121. The country’s GDP per capita is forecast to continue to lag behind the average GDP per capita for Africa’s low-income economies. In the Education scenario, the latter is projected to have an average GDP per capita of US$3 923 by 2043.
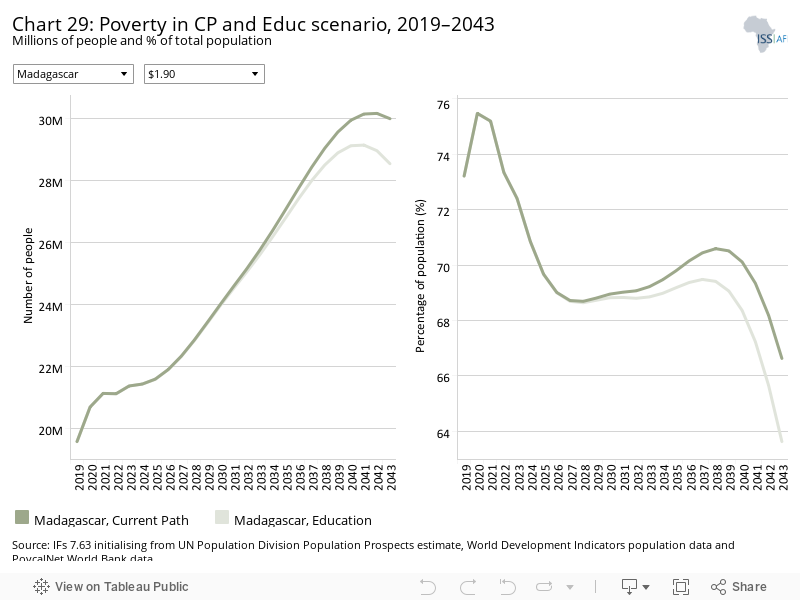
In the Education scenario, 63.6% of Madagascar’s population will live in extreme poverty by 2043, down from 73.2% in 2019 and compared to 66.6% in the Current Path forecast. This translates to a projected total of 28.5 million poor people in 2043 compared to 30 million in the Current Path forecast — a reduction of 1.5 million people.
The Manufacturing/Transfers scenario represents reasonable but ambitious manufacturing growth through greater investment in the economy, investments in research and development, and promotion of the export of manufactured goods. It is accompanied by an increase in welfare transfers (social grants) to moderate the initial increases in inequality that are typically associated with a manufacturing transition. To this end, the scenario improves tax administration and increases government revenues.
The intervention is explained here in the thematic part of the website.
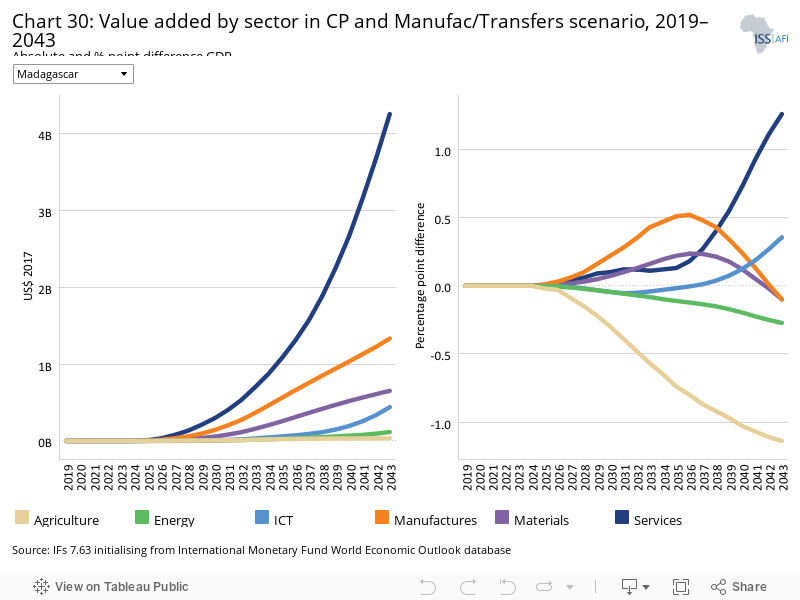
Chart 30 should be read with Chart 8 that presents a stacked area graph on the contribution to GDP and size, in billion US$, of the Current Path economy for each of the sectors.
In the Manufacturing/Transfers scenario, the service sector will by far experience the largest gain in terms of its relative contribution to GDP. Its contribution is expected to increase by 1.3 percentage points in 2043. The service sector is followed by the ICT sector that is projected to see its relative contribution to GDP increase by 0.4 percentage points in 2043. The manufacturing and materials sectors see gains in the medium term, but their relative contributions decrease again towards the end of the time horizon. Manufacturing peaks in 2035 when it is expected to add 0.5 percentage points in terms of its relative contribution to GDP, compared to the Current Path forecast. The contribution of materials peaks in 2037 when it adds 0.3 percentage points in terms of the sector’s relative contribution to GDP.
In absolute terms, the value of the service sector is forecast to increase by US$4.3 billion in the Manufacturing/Transfers scenario compared to the Current Path forecast. The Manufacturing/Transfers scenario has the potential for the manufacturing sector to contribute an additional US$4.3 billion to the economy by 2043 compared to the Current Path forecast. Materials is expected to contribute an additional US$0.7 billion in this scenario, followed by ICT at US$0.4 billion.
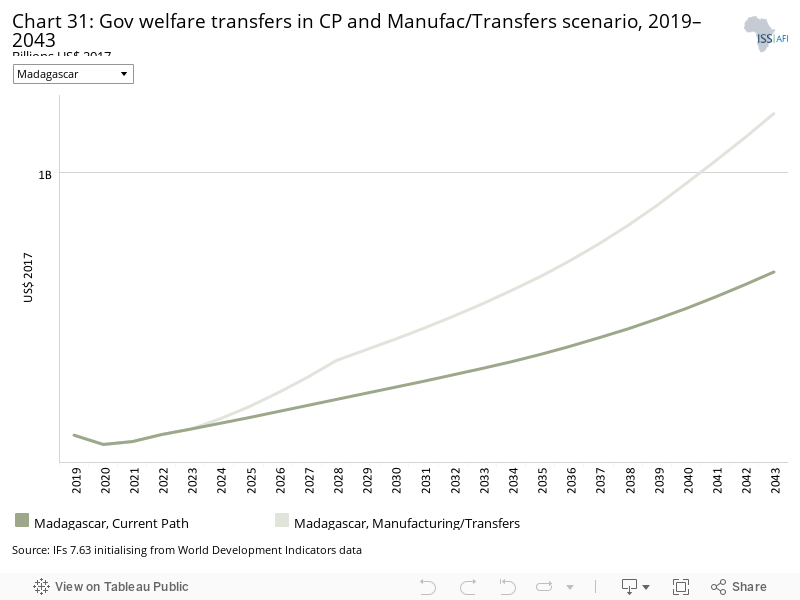
In the Manufacturing/Transfers scenario, government to household welfare transfers will increase from US$0.1 billion in 2019 to US$1.2 billion in 2043, compared to US$0.66 billion in the Current Path forecast. In other words, welfare transfers double on the Current Path.
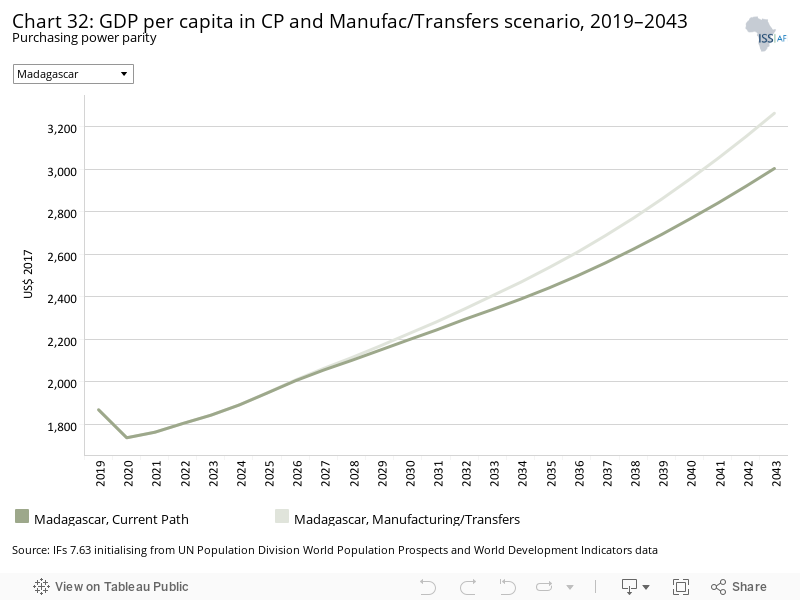
Madagascar’s GDP per capita is expected to grow to US$3 265 in the Manufacturing/Transfers scenario compared to US$3 004 in the Current Path forecast. The increase would narrow the gap to Africa’s low-income economies.
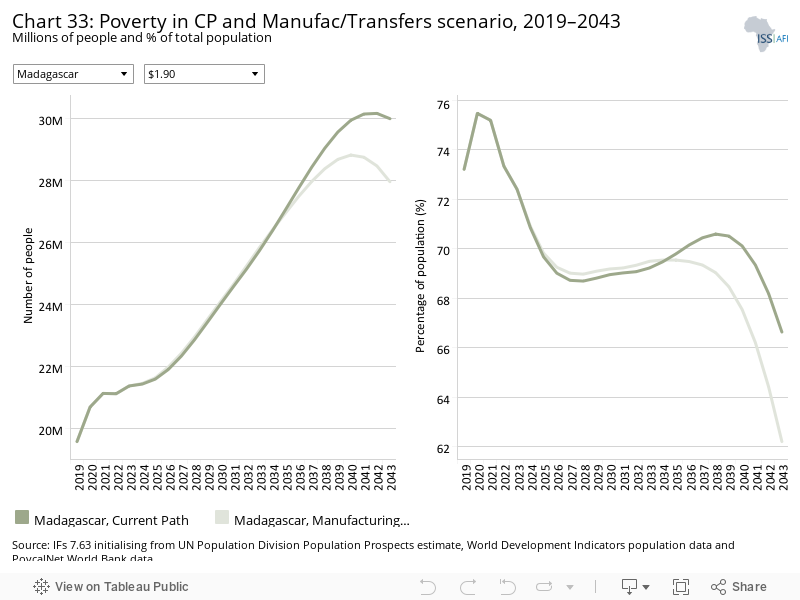
The Manufacturing/Transfers scenario has the potential to reduce the share of the population living in extreme poverty from 73.2% in 2019 to 62.2% in 2043 compared to 66.6% in the Current Path forecast. This is a 4.4 percentage point improvement that would translate to about 2 million fewer people living in poverty in 2043 via the interventions in the scenario.
The Leapfrogging scenario represents a reasonable but ambitious adoption of and investment in renewable energy technologies, resulting in better access to electricity in urban and rural areas. The scenario includes accelerated access to mobile and fixed broadband and the adoption of modern technology that improves government efficiency and allows for the more rapid formalisation of the informal sector.
The intervention is explained here in the thematic part of the website.
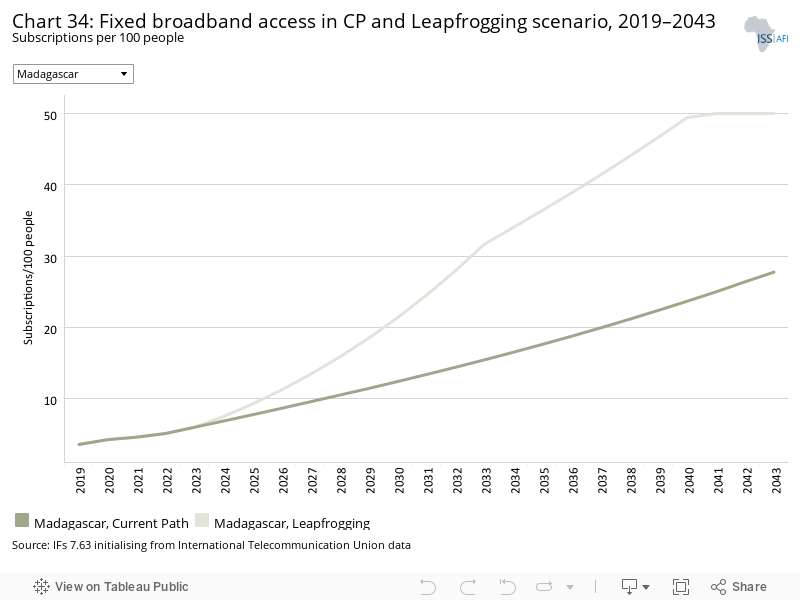
Fixed broadband includes cable modem Internet connections, DSL Internet connections of at least 256 KB/s, fibre and other fixed broadband technology connections (such as satellite broadband Internet, ethernet local area networks, fixed-wireless access, wireless local area networks, WiMAX, etc.).
Fixed broadband access positively impacts economic growth, enabling communities to interact and share information, and spur on innovation as people and businesses connect to other Internet users across the world. Increasing Internet access through fixed broadband access has driven economic growth in the various parts of the world, as detailed in the Leapfrogging scenario.
In 2019, Madagascar, like most African low-income economies, had a low fixed broadband rate of 3.6 subscriptions per 100 people. In the Leapfrogging scenario, by 2043, fixed broadband is set to increase to 50 subscriptions per 100 people compared to 27.8 on the Current Path. In fact, that rate is forecast to be achieved by 2041 already. On fixed broadband subscriptions, Madagascar performs above average compared to its income peer group on the continent. Africa’s low-income economies recorded an average of 2.3 subscriptions in 2019, a rate that by 2043 could increase to 48.3 in the Leapfrogging scenario or to 28.9 in the Current Path forecast.
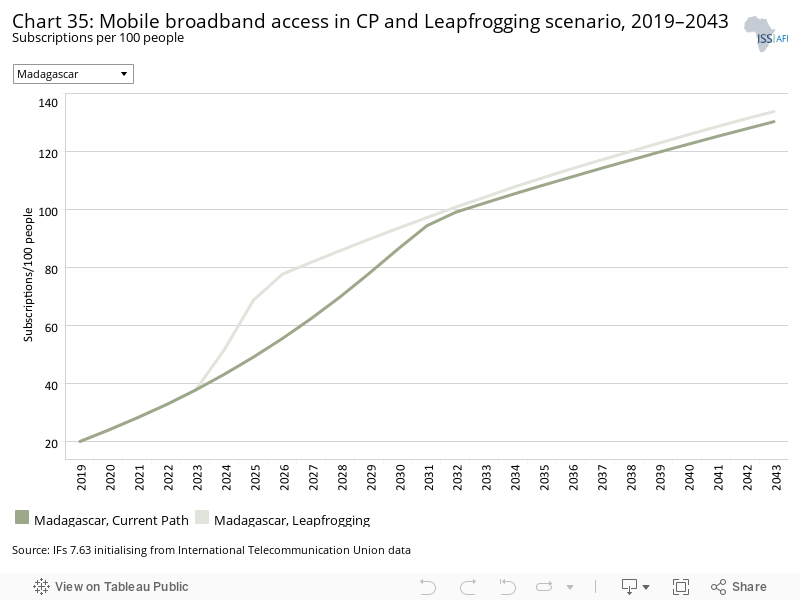
Mobile broadband refers to wireless Internet access delivered through cellular towers to computers and other digital devices.
As the Leapfrogging theme explains, the advantage of cellular Internet access is the low cost compared to fixed broadband access, allowing more people to benefit from Internet access. Not only does mobile phone usage spur on innovation through increased communication and exposure to multiple sources of information, but it also enables people to document instances of election tampering or police abuse, which would previously have been very difficult to do.
In 2019, Madagascar had 19.9 mobile broadband subscriptions per 100 people, a rate that is lower than the group average of 22.9 subscriptions per 100 people for Africa’s low-income economies.
The Leapfrogging scenario has the potential to push mobile broadband subscriptions in Madagascar to 134 subscriptions per 100 people by 2043. However, even in the Current Path forecast the country is expected to arrive at 130.4 subscriptions by 2043. The greatest benefit of the interventions of the Leapfrogging scenario plays out in the medium term between 2023 and 2031 when projected subscriptions are indeed tangibly higher than in the Current Path forecast. In other words, mobile broadband subscriptions in Madagascar are expected to increase rapidly either way but more quickly in the Leapfrogging scenario.
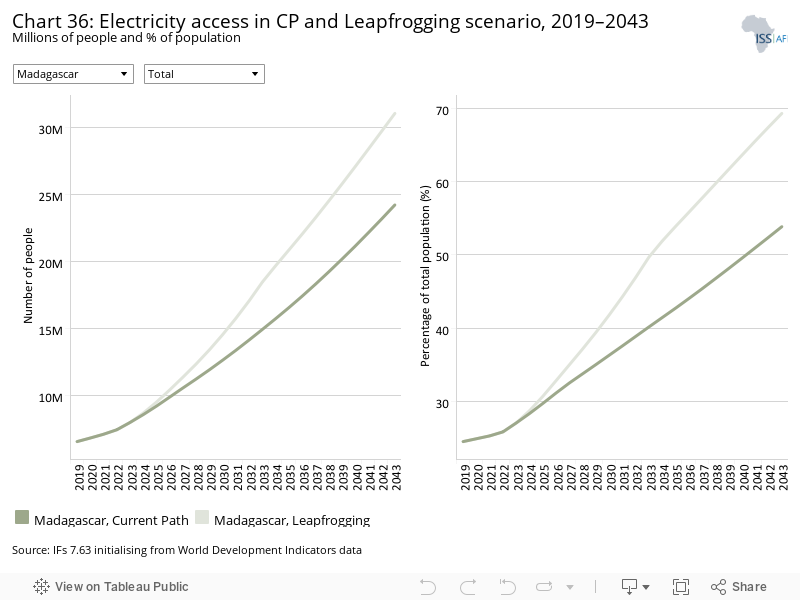
Access to electricity remains a key challenge for Madagascar. In 2019, only 24.5% of the population had access to electricity. The average African low-income country had an average access rate of 32.2% — a difference of almost 8 percentage points. In the Current Path forecast, 53.9% of the population will have access to electricity in 2043. In the Leapfrogging scenario, access to electricity is projected to expand faster, giving 69.4% of the population access by 2043. On average, Madagascar’s low-income peers will have an access level of 75.1% in the Leapfrogging scenario.
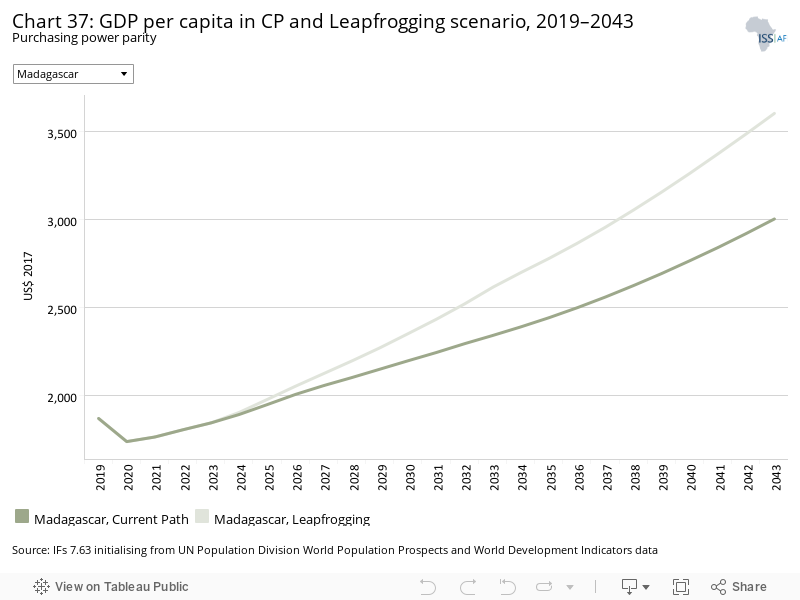
In the Leapfrogging scenario, Madagascar’s GDP per capita is expected to experience a larger increase than in the Current Path forecast: from US$1 867 in 2019 to US$3 606 by 2043, compared to US$3 004 in the Current Path forecast. In the Leapfrogging scenario, Madagascar’s GDP per capita will still be below the expected average for Africa’s low-income economies at US$4 130 by 2043.
The interventions in the Leapfrogging scenario are projected to benefit poverty reduction efforts in Madagascar. The poverty rate could drop from 73.2% to 53.6% by 2043 compared to 66.6% in the Current Path forecast trajectory, a gain of more than 13 percentage points. When assessing absolute numbers, the Leapfrogging scenario reduces the number of people living in poverty to 24 million versus 30 million in the Current Path forecast. In other words, 6 million people would escape poverty in the Leapfrogging scenario.
The Free Trade scenario represents the impact of the full implementation of the African Continental Free Trade Area (AfCFTA) by 2034 through increases in exports, improved productivity and increased trade and economic freedom.
The intervention is explained here in the thematic part of the website.
The trade balance is the difference between the value of a country's exports and its imports. A country that imports more goods and services than it exports in terms of value has a trade deficit, while a country that exports more goods and services than it imports has a trade surplus.
In 2019, Madagascar had a trade deficit that accounted for 11.7% of GDP. In the Free Trade scenario, the country’s trade balance is set to improve with the deficit accounting for 3.1% of GDP by 2038 before it starts growing again to reach 5.4% by 2043 compared to 2.3% on the Current Path. Essentially, in any case, Madagascar is expected to have a trade deficit by 2043, but in the Free Trade scenario the deficit would be higher than on the Current Path.
However, the implementation of the AfCFTA in the Free Trade scenario would improve the short- and medium-term trade deficit for Madagascar compared to the Current Path forecast. Furthermore, the scenario increases Madagascar’s total exports for 2043 from US$23.3 billion in the Current Path forecast to US$35.6 billion in the Free Trade scenario. The implementation of the AfCFTA will also increase total trade to and from the country, as exports plus imports rise from US$46.1 billion in 2019 to US$73.1 billion by 2043.
In the Free Trade scenario, Madagascar’s GDP per capita is expected to experience a larger increase than in the Current Path forecast: from US$1 867 in 2019 to US$3 493 by 2043 compared to US$3 004. Madagascar’s projected future GDP per capita will still be lower than the projected average for Africa’s low-income economies at US$4 255 by 2043 in the Free Trade scenario.
Trade openness will reduce poverty in the long term after initially increasing it due to the redistributive effects of trade. Most African countries export primary commodities and low-tech manufacturing products, and therefore a continental free trade agreement (AfCFTA) that reduces tariffs and non-tariff barriers across Africa will increase competition among countries in primary commodities and low-tech manufacturing exports. Countries with inefficient, high-cost manufacturing sectors might be displaced as the AfCFTA is implemented, thereby pushing up poverty rates. In the long term, as the economy adjusts and produces and exports its comparatively advantaged (lower relative cost) goods and services, poverty rates will decline.
In the Free Trade scenario, extreme poverty in Madagascar is expected to decrease more rapidly than in the Current Path forecast. By 2043, 55% of the population will live in extreme poverty in the Free Trade scenario compared to 66.6% in the Current Path forecast. The 11.6 percentage point difference translates into 5.3 million people who will escape poverty in the Free Trade scenario. However, in that scenario, the average poverty level in Africa’s low-income economies is projected to be 20.3% by 2043.
The Financial Flows scenario represents a reasonable but ambitious increase in worker remittances and aid flows to poor countries, and an increase in the stock of foreign direct investment (FDI) and additional portfolio investment inflows to middle-income countries. We also reduced outward financial flows to emulate a reduction in illicit financial outflows.
The intervention is explained here in the thematic part of the website.
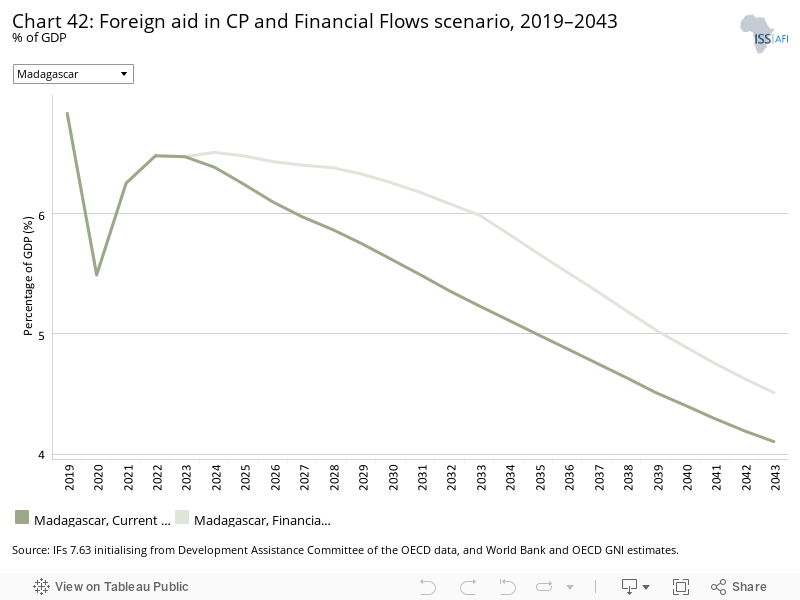
At 6.8% of GDP in 2019, foreign aid played a slightly less important role for Madagascar’s GDP than for the average low-income economy on the continent where aid accounted for 8.6%. In both the Current Path forecast and the Financial Flows scenario, the contribution of foreign aid to the economy is projected to become less significant by 2043, dropping to 4.5% of GDP in the Financial Flows scenario and to 4.1% on the Current Path. In absolute terms, foreign aid will grow in importance: in the Current Path forecast, aid will rise from US$1.1 billion in 2019 to US$2.2 billion by 2043, while in the Financial Flows scenario foreign aid will increase to US$2.4 billion. In Africa’s low-income economies, aid will account for on average 3.8% of GDP in the Current Path forecast and 8.2% in the Financial Flows scenario.
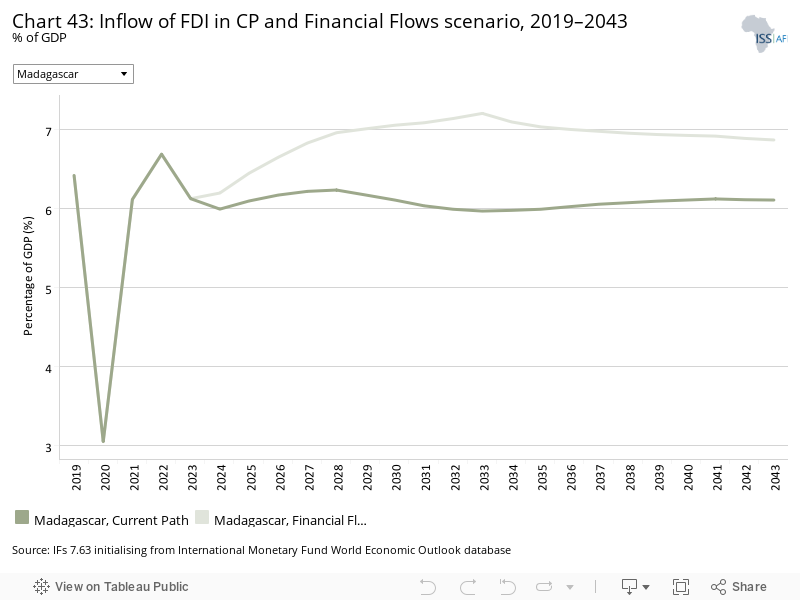
FDI flows to Madagascar accounted for almost 6.4% of GDP in 2019 versus 4.3% for the group of Africa’s low-income economies. The impact of the COVID-19 pandemic on FDI flows pushed FDI inflows down to 3.1% in 2020. In the Financial Flows scenario, FDI as a share of GDP is projected to recover and surpass pre-pandemic levels so that by 2043 FDI flows will account for 6.9% of Madagascar’s GDP compared to 6.1% in the Current Path forecast. In Africa’s low-income economies, FDI is expected to account for 5.2% of GDP in the Financial Flows scenario and 4.7% in the Current Path forecast.
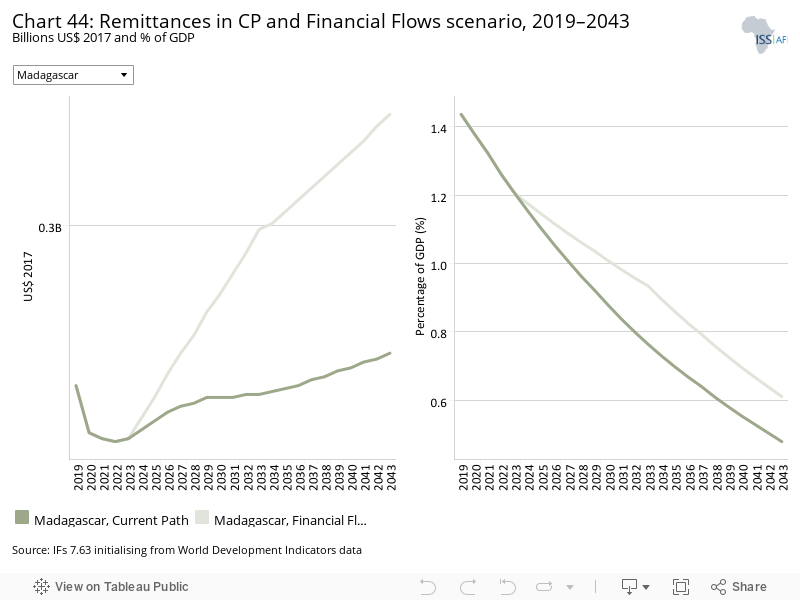
In 2019, remittances accounted for 1.4% of Madagascar’s GDP. In the Current Path forecast, this figure will drop by more than 0.9 percentage points to 0.5% by 2043. In the Financial Flows scenario, remittances are expected to account for 0.6% of the country’s GDP by 2043. In absolute terms, remittances would amount to US$0.3 billion in both the Current Path forecast and the Financial Flows scenario by 2043, up from US$0.2 billion in 2019.
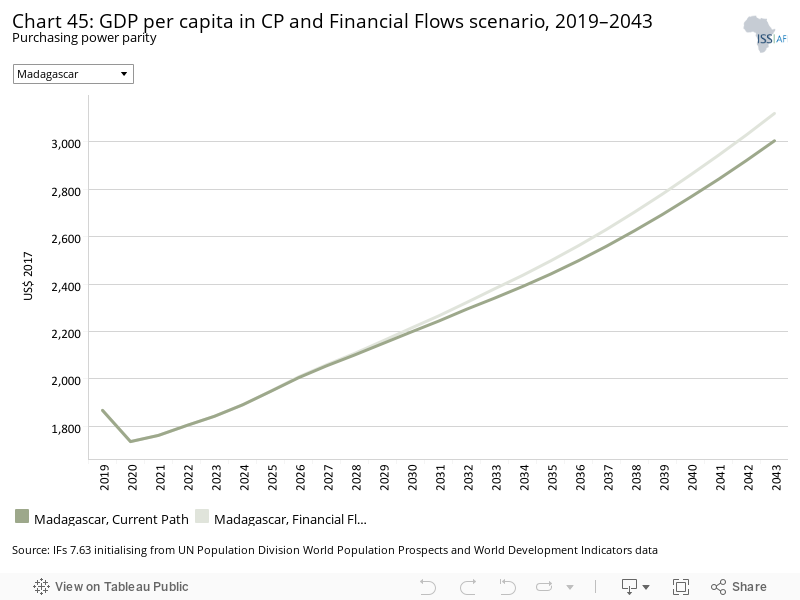
In the Financial Flows scenario, Madagascar’s GDP per capita is expected to experience a larger increase than in the Current Path forecast — the difference being US$116 by 2043. In the Financial Flows scenario, at US$3 120, Madagascar’s future GDP per capita is still projected to be significantly lower than the expected average for Africa’s low-income economies at US$4 130 by 2043.
The interventions in the Financial Flows scenario have the potential to modestly reduce the share of Madagascar’s population living in extreme poverty to 63.4% by 2043 compared to 66.6% in the Current Path forecast. This means that 28.5 million instead of 30 million people will live below the poverty line by 2043.
The Infrastructure scenario represents a reasonable but ambitious increase in infrastructure spending across Africa, focusing on basic infrastructure (roads, water, sanitation, electricity access and ICT) in low-income countries and increasing emphasis on advanced infrastructure (such as ports, airports, railway and electricity generation) in higher-income countries.
Note that health and sanitation infrastructure is included as part of the Health/WaSH scenario and that ICT infrastructure and more rapid uptake of renewables are part of the Leapfrogging scenario. The interventions there push directly on outcomes, whereas those modelled in this scenario increase infrastructure spending, indirectly boosting other forms of infrastructure, including those supporting health, sanitation and ICT.
The intervention is explained here in the thematic part of the website.
In 2019, only 6.6 million people in Madagascar had access to electricity, accounting for about 24.5% of the population. In urban areas, access rates were almost seven times as high, reaching 60%. The interventions in the Infrastructure scenario will increase Madagascar’s overall electricity access rate to 57.1% by 2043 compared to 53.9% in the Current Path forecast. This means that about 1.4 million more people could benefit from access to electricity by 2043.
Rural areas would benefit more from the interventions in the Infrastructure scenario than urban areas because they are coming from a much lower baseline. Access rates in rural areas would increase from 3.4% to 31.3% by 2043 compared to 27.5% in the Current Path forecast. In urban areas, the Infrastructure scenario accounts for an additional improvement of 2.6 percentage points pushing the expected access rate to 80.1% by 2043.
Indicator 9.1.1 in the Sustainable Development Goals refers to the proportion of the rural population who live within 2 km of an all-season road and is captured in the Rural Access Index.
Investments in rural road infrastructure are associated with positive socio-economic impacts, such as increased rural incomes and poverty reduction, improving maternal health as well as paediatric health and increasing agricultural productivity. In 2019, 53.4% of Madagascar’s rural population had access to an all-weather road within a distance of 2 km. This is more than 10 percentage points above the average access rate of its low-income peer group which stood at 43% in 2019. The relatively high baseline explains the more modest impact of the Infrastructure scenario on rural road access. By 2043, it is projected that 58.4% of Madagascar’s rural population will have access to an all-weather road within a distance of 2 km compared to 57.6% in the Current Path forecast.
Improvements included in the Infrastructure scenario will push GDP per capita from US$1 867 in 2019 to US$3 164 in 2043, US$160 above the Current Path forecast. Despite the expected increases in both scenarios, Madagascar’s GDP per capita is forecast to remain below the average of its low-income peer group on the continent. By 2043, the latter is expected to reach US$3 949 in the Infrastructure scenario.
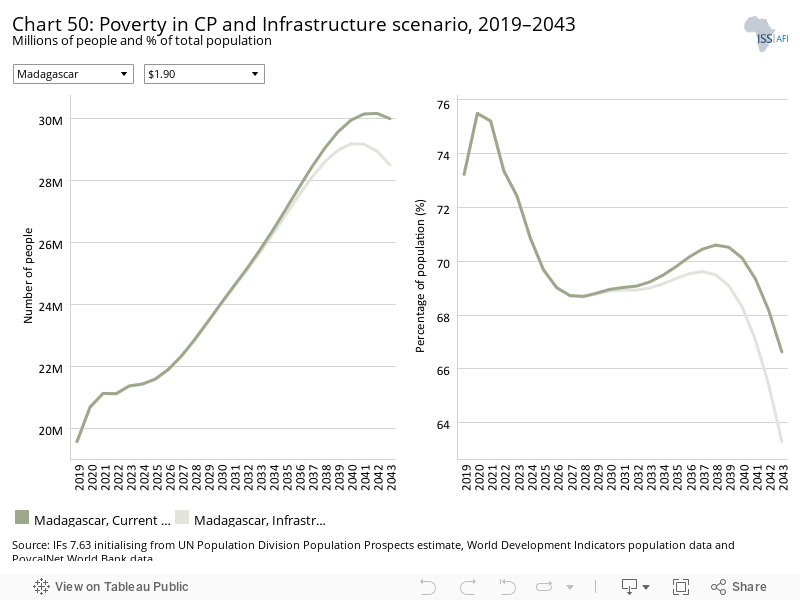
In the Infrastructure scenario, the share of Malagasy living in extreme poverty is expected to drop from 73.2% in 2019 to 63.3% in 2043. This is an improvement of about 3.3 percentage points relative to the Current Path forecast of 66.6% for 2043. It means that 1.5 million people could escape poverty over the coming two decades due to the interventions in the Infrastructure scenario.
The Governance scenario represents a reasonable but ambitious improvement in accountability and reduces corruption, and hence improves the quality of service delivery by government.
The intervention is explained here in the thematic part of the website.
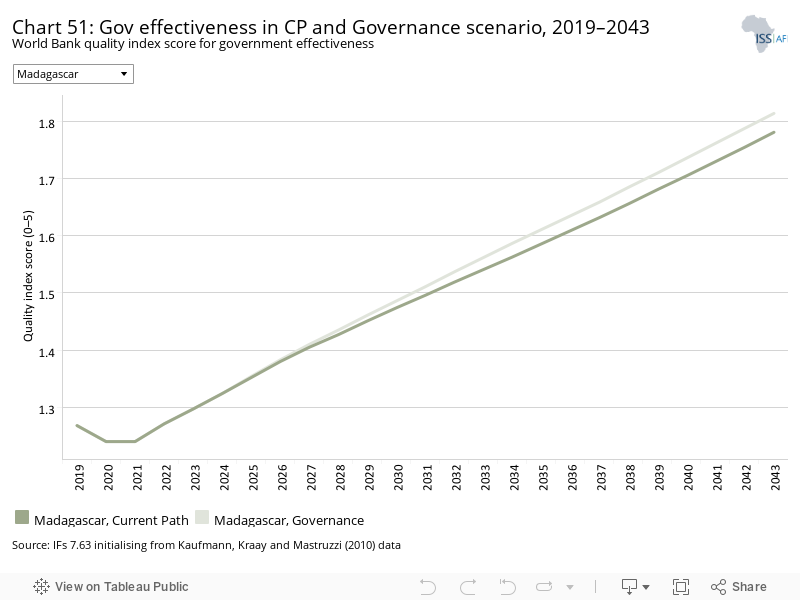
As defined by the World Bank, government effectiveness ‘captures perceptions of the quality of public services, the quality of the civil service and the degree of its independence from political pressures, the quality of policy formulation and implementation, and the credibility of the government’s commitment to such policies’.
Chart 51 presents the impact of the interventions in the Governance scenario on government effectiveness.
In 2019, Madagascar ranked 14th for government effectiveness within its low-income peer group of 23 countries with Rwanda as the group’s frontrunner. Madagascar’s score of 1.3 lies slightly below the average group score of 1.4. In the Current Path forecast and the Governance scenario, Madagascar’s government effectiveness quality score is projected to improve to 1.7 and 1.8, respectively, by 2043. Africa’s low-income economies could reach an average score of 2 in the Governance scenario compared to 1.9 in the Current Path forecast.
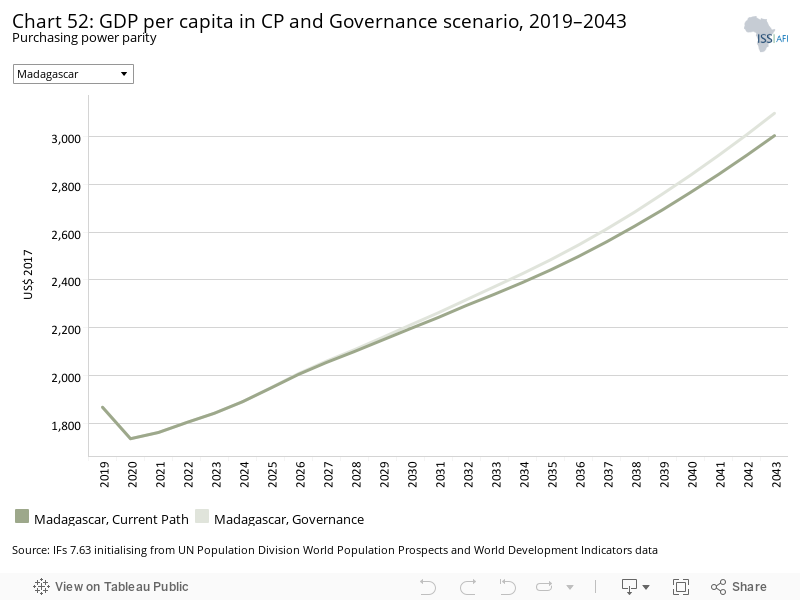
In the Current Path forecast, GDP per capita is expected to increase to US$3 004 while the Governance scenario will increase GDP per capita to US$3 098 by 2043. In any case, Madagascar is expected to lag behind the average GDP per capita for Africa’s low-income economies, which is projected to be US$3 790 in the Current Path forecast and US$3 917 in the scenario by 2043.
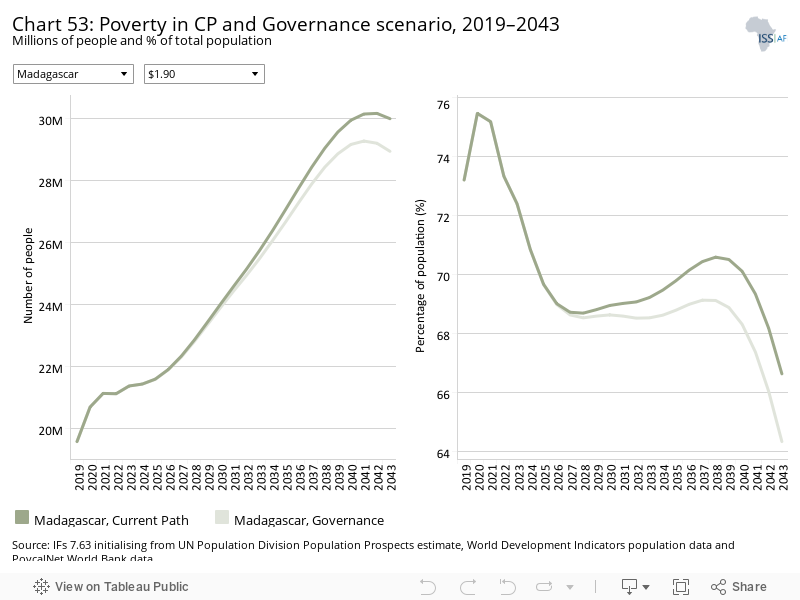
In the Governance scenario, Madagascar could reduce the share of the population living below the poverty line to 64.3% by 2043 compared to 66.6% in the Current Path forecast. The interventions in the Governance scenario could prevent about 1 million people in Madagascar from living in extreme poverty by 2043.
This section presents projections for carbon emissions in the Current Path for Madagascar and the 11 scenarios. Note that IFs uses carbon equivalents rather than CO2 equivalents.
Madagascar’s carbon emissions are projected to increase the most in the Leapfrogging and the Free Trade scenarios by 2043, resulting in additional emissions of close to 10 million tons each.
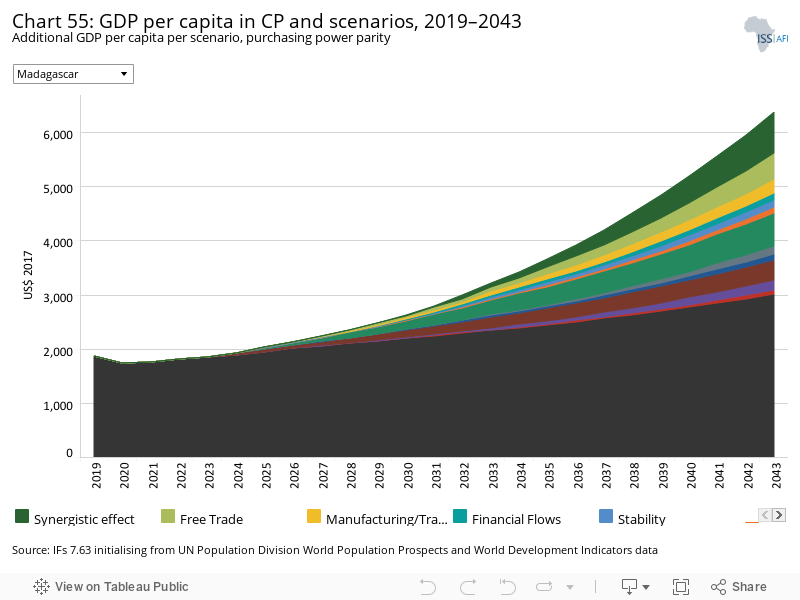
The Combined Agenda 2063 scenario consists of the combination of all 11 sectoral scenarios presented above, namely the Stability, Demographic, Health/WaSH, Agriculture, Education, Manufacturing/Transfers, Leapfrogging, Free Trade, Financial Flows, Infrastructure and Governance scenarios. The cumulative impact of better education, health, infrastructure, etc. means that countries get an additional benefit in the integrated IFs forecasting platform that we refer to as the synergistic effect. Chart 55 presents the contribution of each of these 12 components to GDP per capita in the Combined Agenda 2063 scenario as a stacked area graph.
The Combined Agenda 2063 scenario could increase Madagascar’s GDP per capita by an additional US$748.8 by 2043 compared to the Current Path forecast. Among the sectoral interventions, the Leapfrogging scenario is projected to have the greatest impact on GDP per capita, leading to an increase of US$601.7 by 2043. The second and third largest impacts on GDP per capita could be achieved in the Free Trade and the Agriculture scenarios: additions to GDP per capita will be US$489.4 and US$380.4, respectively. The interventions in the Manufacturing/Transfers scenario would account for an increase of US$260.5 and those in the Financial Flows scenario could imply an increase of US$115.5. The Education, Stability, Demographic, Infrastructure and Health/WaSH scenarios would have smaller impacts on GDP per capita.
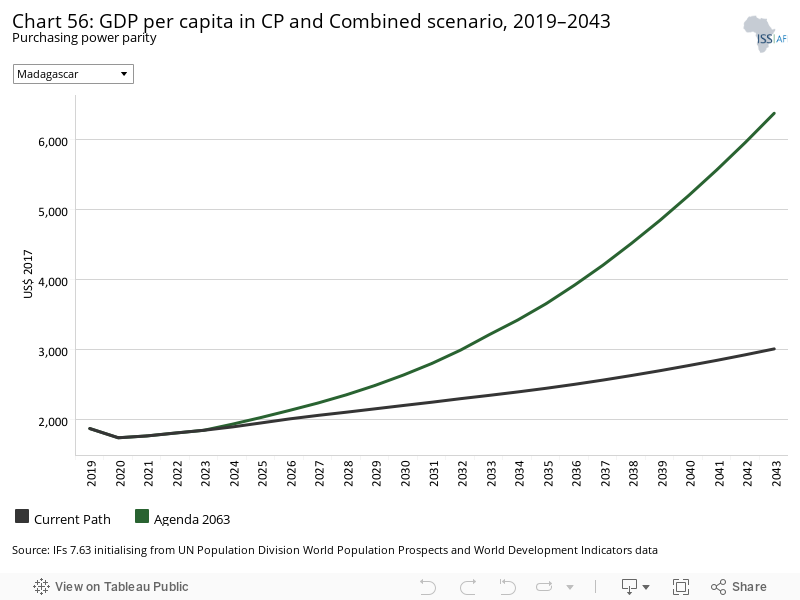
Whereas Chart 55 presents a stacked area graph on the contribution of each scenario to GDP per capita as well as the additional benefit or synergistic effect, Chart 56 presents only the GDP per capita in the Current Path forecast and the Combined Agenda 2063 scenario.
In the Combined Agenda 2063 scenario, Madagascar’s GDP per capita could increase by an additional US$3 365 and reach US$6 369 by 2043. In the Current Path, the country’s GDP per capita increases to US$3 004 — more than 50% lower than in the Combined Agenda 2063 scenario.
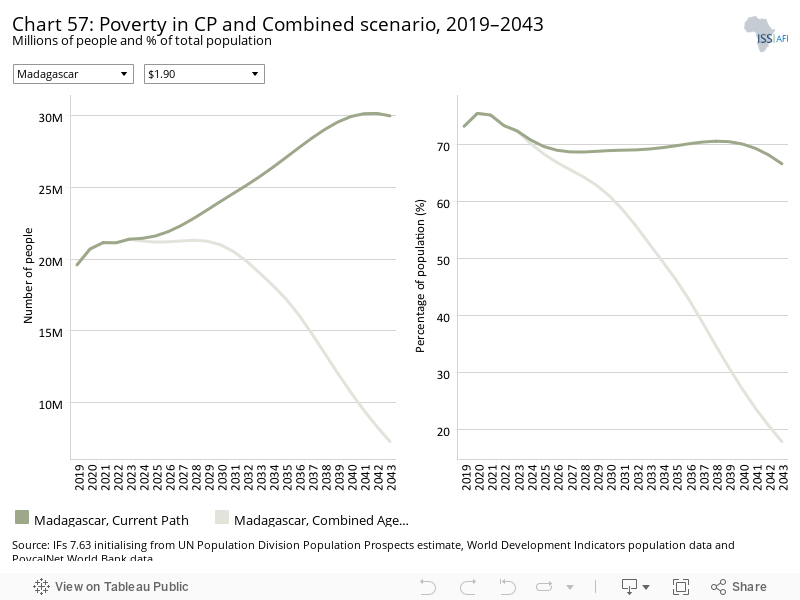
In the Combined Agenda 2063 scenario, Madagascar can get closer to eliminating extreme poverty. By 2043, 17.9% of the population is expected to live below the poverty line which translates to 7.3 million fewer people living in extreme poverty. In comparison, in the Current Path forecast, 66.6% of the population (30 million people) is projected to live in poverty by 2043.
See Chart 8 to view the Current Path forecast of the sectoral composition of the economy.
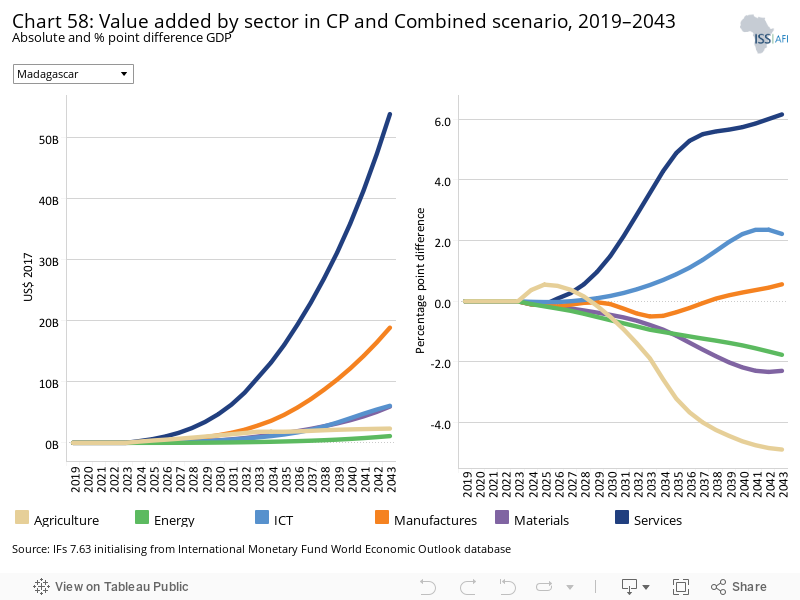
The evolution of the various sectors in terms of their relative contribution to GDP does not follow a linear trajectory. In the Combined Agenda 2063 scenario and looking at 2043, the service sector will experience the greatest increase in terms of its relative contribution to Madagascar’s GDP compared to the Current Path forecast — an additional 6.2 percentage points by 2043. This translates to an increase in GDP of US$53.8 billion attributable to services alone. The service sector is followed by the ICT sector which sees an increase of 2.2 percentage points in terms of its contribution to GDP translating into an additional US$6.1 billion coming from that sector. In absolute terms, however, the manufacturing sector is set to contribute more than ICT, with an additional US$18.8 billion which is equivalent to an increase of 0.6 percentage points. The energy, materials and agriculture sectors are all set to become relatively less important for Madagascar’s economy. Agriculture, in particular, is forecast to lose 4.9 percentage points in terms of its contribution to GDP. In absolute terms, however, the sector is expected to contribute an additional US$2 billion to the country’s GDP in the Combined Agenda 2063 scenario by 2043.
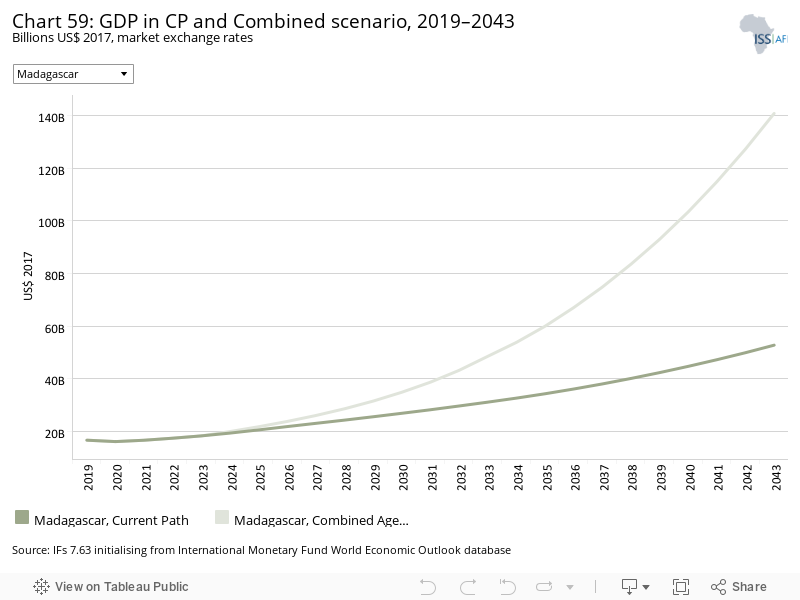
In the Combined Agenda 2063 scenario, Madagascar’s GDP is forecast to expand more than eightfold from US$16.8 billion in 2019 to US$140.8 billion by 2043. In other words, in the Combined Agenda 2063 scenario the country’s GDP would essentially be 2.6 times as large as on the Current Path forecast by 2043 (US$52.8 million).
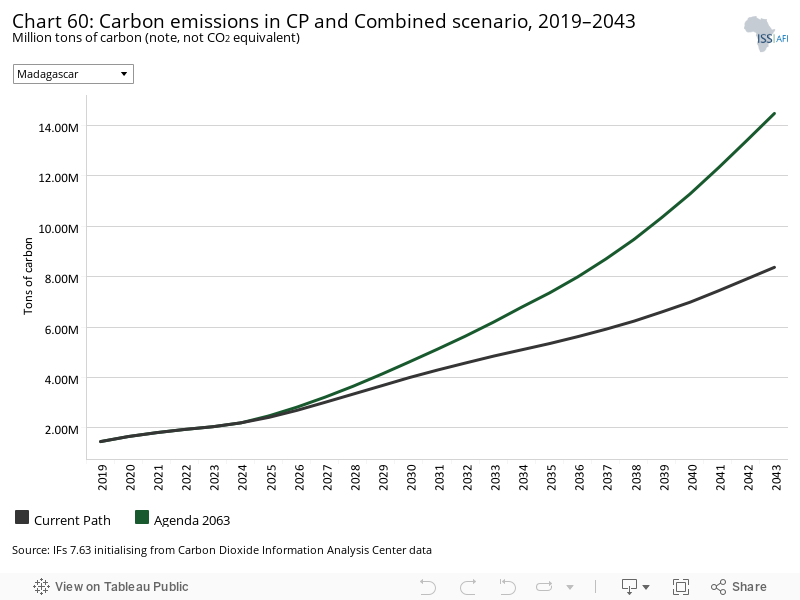
In 2019, Madagascar’s carbon emissions stood at 1.5 million tons. In the Combined Agenda 2063 scenario, which leads to higher economic growth and increased energy demand, carbon emissions are expected to rise almost tenfold to 14.5 million tons by 2043. The difference in projected carbon emissions between the Combined Agenda 2063 scenario and the Current Path forecast is 6.1 million tons.
Page information
Contact at AFI team is Du Toit McLachlan
This entry was last updated on 14 August 2025 using IFs v7.63.
Donors and sponsors


Reuse our work
- All visualizations, data, and text produced by African Futures are completely open access under the Creative Commons BY license. You have the permission to use, distribute, and reproduce these in any medium, provided the source and authors are credited.
- The data produced by third parties and made available by African Futures is subject to the license terms from the original third-party authors. We will always indicate the original source of the data in our documentation, so you should always check the license of any such third-party data before use and redistribution.
- All of our charts can be embedded in any site.
Cite this research
Du Toit McLachlan (2025) Madagascar. Published online at futures.issafrica.org. Retrieved from https://futures.issafrica.org/geographic/countries/madagascar/ [Online Resource] Updated 14 August 2025.