 Libya
Libya
Feedback welcome
Our aim is to use the best data to inform our analysis. See our Technical page for information on the IFs forecasting platform. We appreciate your help and references for improvements via our feedback form.
In this entry, we first describe the Current Path forecast for Libya as it is expected to unfold to 2043, the end of the third ten-year implementation plan of the African Union’s Agenda 2063 long-term vision for Africa. The Current Path in the International Futures (IFs) forecasting model initialises from country-level data that is drawn from a range of data providers. We prioritise data from national sources.
The Current Path forecast is divided into summaries on demographics, economics, poverty, health/WaSH and climate change/energy. A second section then presents a single positive scenario for potential improvements in stability, demographics, health/WaSH, agriculture, education, manufacturing/transfers, leapfrogging, free trade, financial flows, infrastructure, governance and the impact of various scenarios on carbon emissions. With the individual impact of these sectors and dimensions having been considered, a final section presents the impact of the Combined Agenda 2063 scenario.
We generally review the impact of each scenario and the Combined Agenda 2063 scenario on gross domestic product (GDP) per person and extreme poverty except for Health/WaSH that uses life expectancy and infant mortality.
The information is presented graphically and supported by brief interpretive text.
All US$ numbers are in 2017 values.
Summary
- Current Path forecast
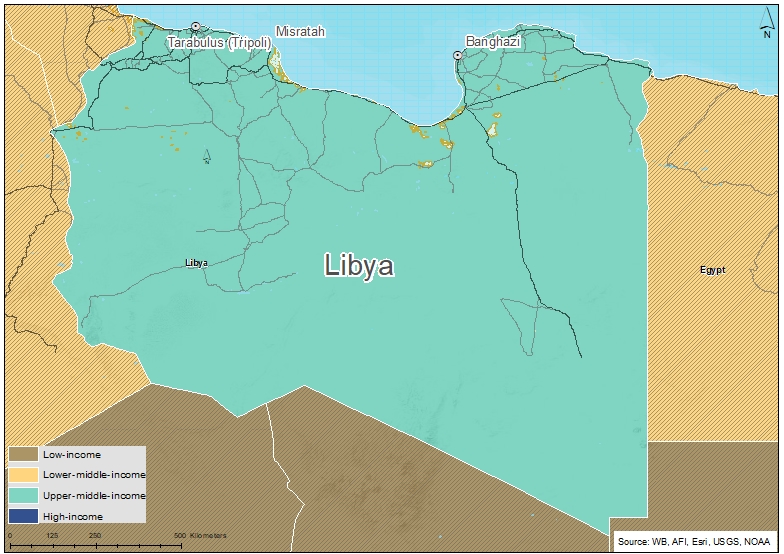
- Libya is one of seven upper middle-income countries in Africa, a member of the Arab Maghreb Union (AMU), the Common Market for Eastern and Southern Africa (COMESA) and the Community of Sahel-Saharan States (CEN-SAD). Jump to forecast: Current Path
- Libya’s population cohort structure is rapidly changing with a smaller youth cohort, larger working-age and growing elderly population, increasing in size from 6.8 million in 2019, of which 82% live in urban areas, to 7.5 million in 2043. Jump to Demographics: Current Path
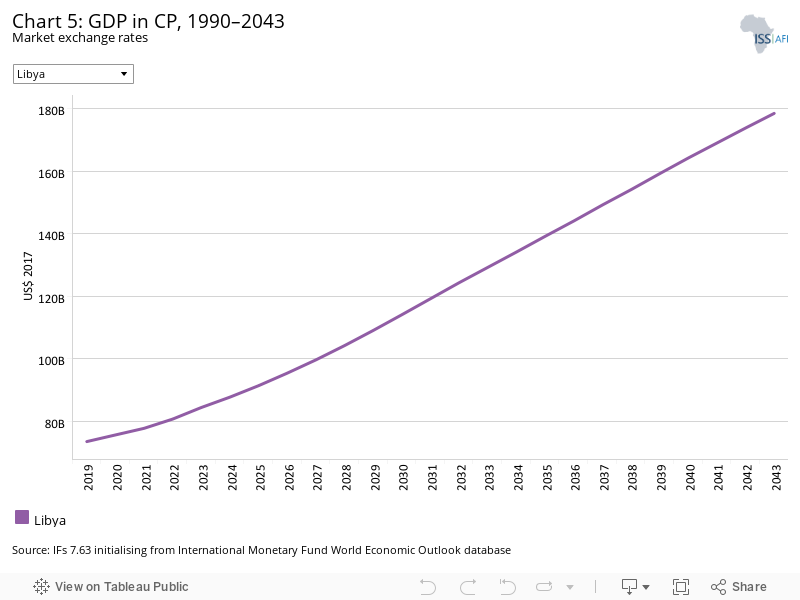
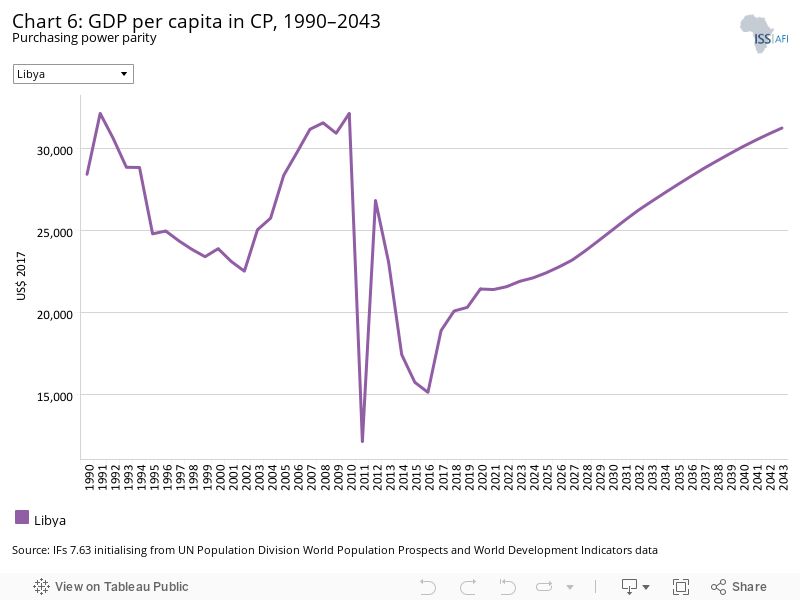
- Libya has one of Africa’s largest economies with an estimated GDP increasing from US$73.4 billion in 2019 to US$178.4 billion in 2043. However, the economy is dominated by a large public sector and Libya gets over 95% of its export earnings from the petroleum sector. Income from oil and gas has allowed the country to invest in the provision of health, education and other social services. GDP per capita in Libya will increase from US$20 296 in 2019 to US$31 250 in 2043. Jump to Economics: Current Path
- Libya eliminated extreme poverty (using US$1.90) but, using US$5.50 for upper middle-income countries, 20.12% of Libya’s population lived in extreme poverty in 2019, declining to 369 000 (4.9%) in 2043 in the Current Path forecast. Jump to Poverty: Current Path
- Due to its large oil and gas activities, Libya was the fifth largest carbon emitter in Africa, releasing 25 million tons of carbon, forecast to increase to 32 million tons in 2043. Jump to Carbon emissions/Energy: Current Path
- Sectoral scenarios
- The transition from an authoritarian regime to stable democracy in Libya has stalled. Instability in Libya during the Arab Spring was partly facilitated by the existence of a large, well-educated and connected youth bulge with no potential for upward political, economic or social mobility. Jump to Stability scenario
- Libya entered a potential demographic dividend in 2001 and will remain in this window of opportunity beyond 2043, implying that, with the right policies, it has the potential for rapid economic growth. Jump to Demographic scenario
- With access to improved water and sanitation infrastructure at 100%, Libya has some of the highest rates of basic infrastructure provision in Africa. The Health/WaSH scenario will raise life expectancy rate from 75.8 years in 2019 to 79.7 in 2043. Jump to Health/WaSH scenario
- A very small portion of Libya’s land area is suitable for crop cultivation and grazing. A comparatively large proportion of Libyans are engaged in some form of agriculture production as small producers but food insecurity is on the rise. In the Agriculture scenario, production increases by almost 3% to 10.3 million tons in 2043. Jump to Agriculture scenario
- The mean years of education in Libya in 2019 was the seventh highest in Africa and will increase to 10.8 years in 2043, with females’ levels significantly higher than that of males. Because Libya already does very well in this regard, the Education scenario has a marginal impact. Jump to Education scenario
- The Manufacturing/Transfers scenario increases the contribution of manufactures by 0.2% (US$1.02 billion) in 2043 and services by 0.1%. In the Manufacturing/Transfers scenario, GDP per capita increases by US$295 above the Current Path forecast for that year. Jump to Manufacturing/Transfers scenario
- Because Libya’s ICT sector is already large by comparative standards, the Leapfrogging scenario has a limited impact on further growth, increasing the size of the sector by only 0.2 percentage points of GDP in 2043. A large portion of Libya’s telecom infrastructure has been damaged and disrupted, however, and is not captured in the associated forecasts. Jump to Leapfrogging scenario
- The Maghreb has the lowest intra-regional trade of any trade block globally at around 5% of total trade. In the Free Trade scenario, Libya’s trade deficit bottoms out at 10.42% of GDP in 2036 and recovers to a surplus of 2.66% in 2043. Jump to Free Trade scenario
- With much of its population in urban areas, the portion of the rural population within 2 km from an all-weather road increases to 96.9% in 2043 and to 100% in the Infrastructure scenario. Jump to Infrastructure scenario
- There has been a steady decline in government effectiveness in Libya in recent years with the rate declining from 1.7 in 2004 to 0.6 in 2016 (the last year of the data within IFs). The Current Path forecast is that Libya will, by 2043, rank 34th on government effectiveness in Africa. In the Governance scenario, government effectiveness improves by more than 4% above the Current Path forecast in 2043. Jump to Governance scenario
- Due to its large oil and gas sector, Libya was the fifth largest carbon emitter in Africa in 2019, releasing 25 million tons of carbon, set to increase to 32 million tons in 2043. Jump to Impact of scenarios on carbon emissions
- Combined Agenda 2063 scenario
- The Free Trade scenario results in the largest increase in GDP per capita in 2043. Compared to the Current Path forecast, the Combined Agenda 2063 scenario raises GDP per capita by 14% and results in 120 000 fewer people living in extreme poverty by 2043. In that year, the size of the economy will be 19% larger compared to the Current Path forecast. Jump to Combined Agenda 2063 scenario
All charts for Libya
- Chart 1: Political map of Libya
- Chart 2: Population structure in CP, 1990–2043
- Chart 3: Urban and rural population in CP, 1990–2043
- Chart 4: Population density map for 2019
- Chart 5: GDP in CP, 1990–2043
- Chart 6: GDP per capita in CP, 1990–2043
- Chart 7: Informal sector value in CP, 2015–2043
- Chart 8: Value added by sector in CP, 2015–2043
- Chart 9: Agriculture production/demand in CP, 1990–2043
- Chart 10: Poverty in CP, 2015–2043
- Chart 11: Energy production by type in CP, 1990–2043
- Chart 12: Carbon emissions in CP, 1990–2043
- Chart 13: Governance security in CP and Stability scenario, 2019–2043
- Chart 14: GDP per capita in CP and Stability scenario, 2019–2043
- Chart 15: Poverty in CP and Stability scenario, 2019–2043
- Chart 16: Demographic dividend in CP and Demog scenario, 2019–2043
- Chart 17: Infant mortality in CP and Demog scenario, 2019–2043
- Chart 18: GDP per capita in CP and Demog scenario, 2019–2043
- Chart 19: Poverty in CP and Demog scenario, 2019–2043
- Chart 20: Life expectancy in CP and Health/WaSH scenario, 2019–2043
- Chart 21: Infant mortality in CP and Health/WaSH scenario, 2019–2043
- Chart 22: Yield/hectare in CP and Agric scenario, 2019–2043
- Chart 23: Agriculture imports in CP and Agric scenario, 2019–2043
- Chart 24: GDP per capita in the CP and Agric scenario, 2019–2043
- Chart 25: Poverty in CP and Agric scenario, 2019–2043
- Chart 26: Mean years of education in CP and Educ scenario, 2019–2043
- Chart 27: Education quality in CP and Educ scenario, 2019–2043
- Chart 28: GDP per capita in CP and Educ scenario, 2019–2043
- Chart 29: Poverty in CP and Educ scenario, 2019–2043
- Chart 30: Value added by sector in CP and Manufac/Transfers scenario, 2019–2043
- Chart 31: Gov welfare transfers in CP and Manufac/Transfers scenario, 2019–2043
- Chart 32: GDP per capita in CP and Manufac/Transfers scenario, 2019–2043
- Chart 33: Poverty in CP and Manufac/Transfers scenario, 2019–2043
- Chart 34: Fixed broadband access in CP and Leapfrogging scenario, 2019–2043
- Chart 35: Mobile broadband access in CP and Leapfrogging scenario, 2019–2043
- Chart 36: Electricity access in CP and Leapfrogging scenario, 2019–2043
- Chart 37: GDP per capita in CP and Leapfrogging scenario, 2019–2043
- Chart 38: Poverty in CP and Leapfrogging scenario, 2019–2043
- Chart 39: Trade balance in CP and Free Trade scenario, 2019–2043
- Chart 40: GDP per capita in CP and Free Trade scenario, 2019–2043
- Chart 41: Poverty in CP and Free Trade scenario, 2019–2043
- Chart 42: Foreign aid in CP and Financial Flows scenario, 2019–2043
- Chart 43: Inflow of FDI in CP and Financial Flows scenario, 2019–2043
- Chart 44: Remittances in CP and Financial Flows scenario, 2019–2043
- Chart 45: GDP per capita in CP and Financial Flows scenario, 2019–2043
- Chart 46: Poverty in CP and Financial Flows scenario, 2019–2043
- Chart 47: Electricity access in CP and Infrastructure scenario, 2019–2043
- Chart 48: Rural road access in CP and Infrastructure scenario, 2019–2043
- Chart 49: GDP per capita in CP and Infrastructure scenario, 2019–2043
- Chart 50: Poverty in CP and Infrastructure scenario, 2019–2043
- Chart 51: Gov effectiveness in CP and Governance scenario, 2019–2043
- Chart 52: GDP per capita in CP and Governance scenario, 2019–2043
- Chart 53: Poverty in CP and Governance scenario, 2019–2043
- Chart 54: Carbon emissions in CP and scenarios, 2019–2043
- Chart 55: GDP per capita in CP and scenarios, 2019–2043
- Chart 56: GDP per capita in CP and Combined scenario, 2019–2043
- Chart 57: Poverty in CP and Combined scenario, 2019–2043
- Chart 58: Value added by sector in CP and Combined scenario, 2019–2043
- Chart 59: GDP in CP and Combined scenario, 2019–2043
- Chart 60: Carbon emissions in CP and Combined scenario, 2019–2043

This page provides an overview of the key characteristics of Libya along its likely (or Current Path) development trajectory. The Current Path forecast from the International Futures forecasting (IFs) platform is a dynamic scenario that imitates the continuation of current policies and environmental conditions. The Current Path is therefore in congruence with historical patterns and produces a series of dynamic forecasts endogenised in relationships across crucial global systems. We use 2019 as a standard reference year and the forecasts generally extend to 2043 to coincide with the end of the third ten-year implementation plan of the African Union’s Agenda 2063 long-term development vision.
As a result of the ongoing conflict in Libya, the data and forecasts for Libya that follow often diverge from other sources and should be considered provisional.
Libya is part of the Maghreb region in North Africa, a member of the Arab Maghreb Union (AMU) and the Common Market for Eastern and Southern Africa (COMESA). In 1998, the former president Muammar Gaddafi, established the Community of Sahel-Saharan States (CEN-SAD) that became the most recent among the eight regional economic communities recognised by the African Union, with its secretariat located in Tripoli. Together with Algeria, Angola, the Republic of the Congo, Equatorial Guinea, Gabon and Nigeria, Libya is one of seven African members of the Organization of Petroleum Exporting Countries (OPEC) that includes Saudi Arabia and others.
Libya is bordered by the Mediterranean Sea to the north, Egypt to the east, Sudan to the south-east, Chad to the south, Niger to the south-west, Algeria to the west and Tunisia to the north-west. Its climate is dominated by the hot and arid Sahara desert but moderated along the coast by the Mediterranean Sea.
Libya gained independence as a kingdom in 1951 under King Idris I, who was eventually overthrown during a bloodless coup in 1969 by Colonel Muammar Gaddafi. Gaddafi ruled for 42 subsequent years during which Libya’s previously close relations with the West were replaced by a strong pan-Arab orientation and irregular engagements with the rest of Africa. Gaddafi was overthrown in August 2011 as the Arab Spring washed over much of North Africa and killed by rebel forces shortly thereafter. The country has been unstable since.
Parliamentary elections in 2012 and an agreement to form a national unity government in 2015 have not been able to halt growing insecurity. The country’s descent into a civil war destabilised large parts of the Sahel through the spread of arms and fighters. In September 2011, the United Nations Support Mission for Libya (UNSMIL) was established to support the country’s transitional authorities in their efforts to bring stability to the country. It has seen its mandate extended annually ever since. Authority was transferred to a General National Congress but, by 2014, two rival authorities claimed to govern Libya, each backed by a number of African and non-African countries. An eventual October 2020 ceasefire agreement was followed by the establishment of a Government of National Unity several months later but national elections, originally scheduled for December 2021, have been repeatedly postponed.
Libya is classified as one of Africa’s seven upper middle-income countries — a classification it is likely to lose once the civil war ends given the extent of destruction that has occurred since 2011 and normal data collection is able to resume.
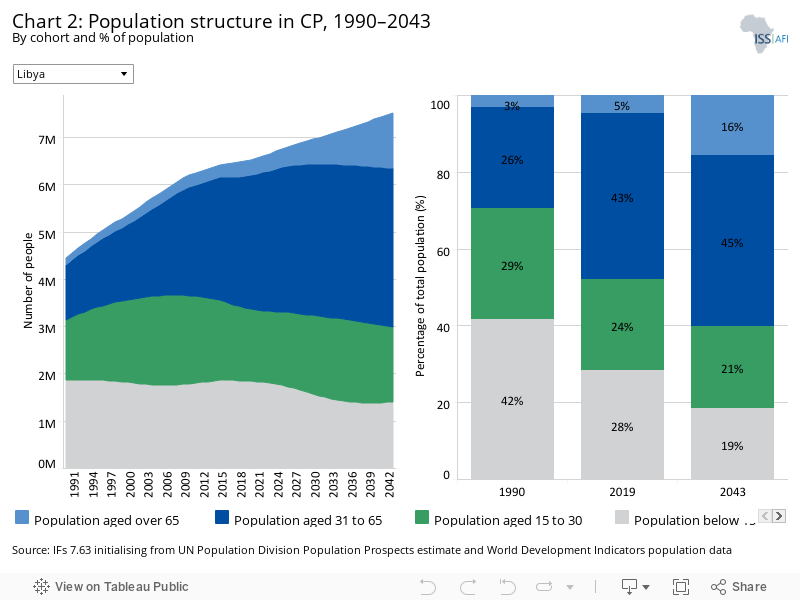
In 2019, Libya’s population was 6.5 million, expected to increase to 7.5 million by 2043. The median age in Libya was 28.6 years in 2019, expected to increase to almost 37 years in 2043. In Africa, only Morocco, Tunisia, Seychelles and Mauritius had a higher median age in 2019. Total fertility rates in Libya have come down very rapidly since the mid-1970s to below 2.2 in 2019, therefore close to the replacement rate of 2.1 births per woman. By 2030, fertility rates in Libya will be at 1.9 births per woman and will probably level off at that rate. As a result, Libya’s population cohort structure is rapidly changing with a declining portion of its population below 15 years of age (from 28% in 2019 to 19% in 2043), a growing potential labour force (15 to 64 years of age) that will peak in 2033 before starting to decline, and a growing elderly population. Libya’s population aged 65 and older was 4.8% in 2019 and by 2043 will increase more than threefold to 16%, implying significant increases in health costs given the prevalence of more expensive non-communicable diseases in its larger elderly population.
Finally, recent years have seen the number of migrants, refugees and internally displaced persons within Libya increase as a result of the internal conflict.
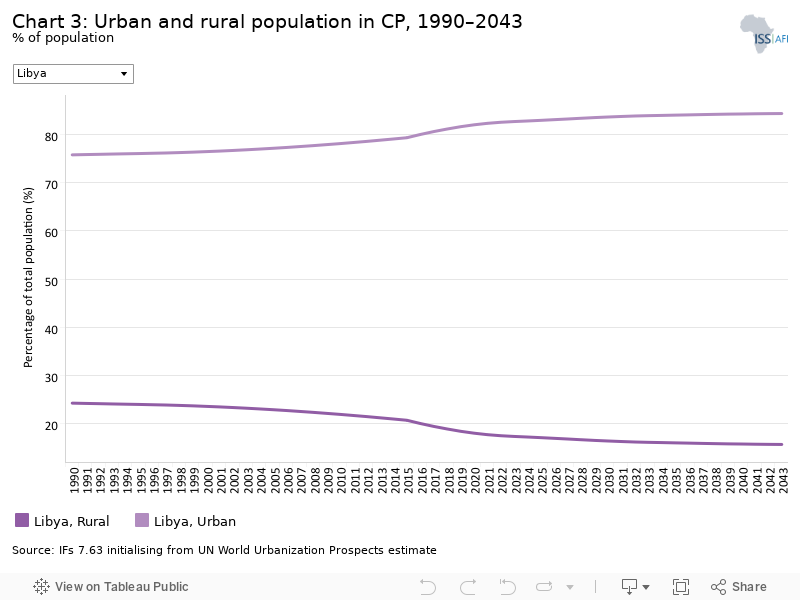
Because of its generally arid climate, Libya has Africa’s second highest portion of its population in urban areas at 82% (representing 5.3 million people) and is close to saturation level. Only Gabon was more urbanised in 2019. Future urban growth will therefore consist of the natural increase in Libya’s existing large urban population with little rural–urban migration. By 2043, more than 84% of Libya’s population (4.9 million people) will be urban. The high level of urbanisation in the country has contributed to its low fertility rates: Libya has the third lowest fertility rate in Africa.
Tripoli is the largest city with more than a million inhabitants, followed by Benghazi and Misrata — all located on the Mediterranean coastline, with its more temperate climate.
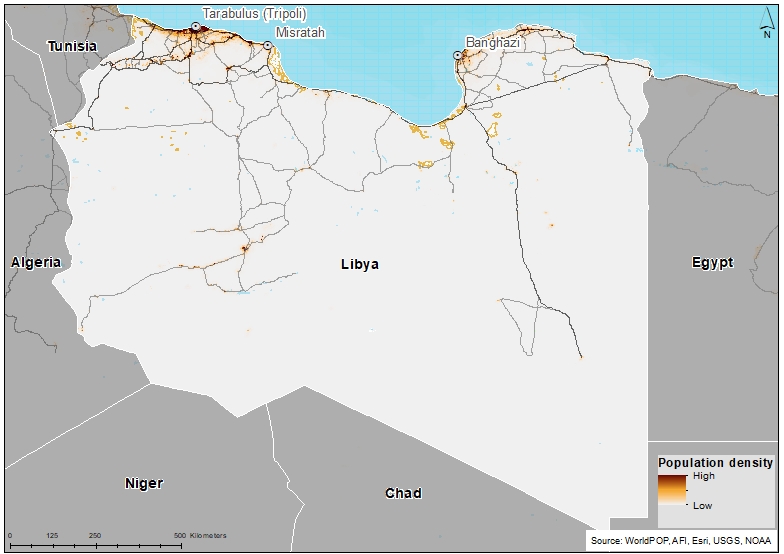
Given its relatively small population and large land area, Libya is sparsely populated, with almost half of its population of 6.5 million people living in the capital city Tripoli. With 0.37 people per hectare in Libya in 2019, only Namibia has a lower population density in Africa. Globally, Libya has the fifth lowest population density.
Because of the ongoing conflict in Libya, the data and forecasts presented on this page should be considered provisional.
The size of Libya’s economy is inextricably linked to the oil price, given its dependence on oil exports and its size has fluctuated accordingly. Following the discovery of large oil reserves in 1959, Libya’s economy has grown exponentially and peaked in nominal size with the global oil crisis in 1973, again after 1979 and then shortly before 1990, and then stagnating thereafter. Since the price of crude oil has generally increased steadily from its low level in 1998, the country’s economy has grown in commensurate size thereafter. In 1990, Libya had the fifth largest economy in Africa. Even in 2019 it was considered to have the seventh largest economy in Africa at US$73.4 billion.
Libya’s formal economy is dominated by the public sector with a very small private sector, estimated at only about 5% of GDP. Reflected in its observer status with the World Trade Organization and lack of a trade agreement with the neighbouring European Union (EU), Libya’s trade relations and integration with the regional and global economies are limited.
Income from oil meant that Libya was able to maintain large trade surpluses. Oil exports have plummeted in recent years as the civil war took its toll although production is now recovering. The African Development Bank, for example, believes that Libya’s real GDP shrunk by 60.3% in 2020 largely due to a blockade of major oil fields for most of the year.
Historically, Libya gets over 95% of its export earnings and 60% of its GDP from the petroleum sector and has been able to invest significant resources in the provision of health, education and other social services to the extent that it boasts some of Africa’s highest scores on various indices of well-being such as rates of infant mortality, years of education and life expectancy.
In the Current Path forecast, Libya’s economy will increase to US$178.4 billion in size in 2043, at which point it will be the 13th largest economy in Africa (with one of Africa’s smallest populations) as it is overtaken in size by other African countries with much more rapidly growing populations. In 2043, Libya will have the 13th largest economy in Africa.
Libya’s state-funded ICT sector, estimated to contribute 11% to GDP in 2015, 12.6% in 2019, and increasing to 14.7% of GDP in 2043 in the Current Path forecast, is among the largest in Africa (other data sources have it as smaller). However, a large portion of its telecom infrastructure was damaged and disrupted during and after the 2011 conflicts and is not captured in the associated forecasts. The numbers within IFs would imply that its ICT sector contributes more than double the average for upper middle-income Africa and, indeed, for the upper middle-income group globally. Various studies have found that high levels of Internet access facilitated popular mobilisation during the events known as the Arab Spring that culminated in the overthrow and death of Ghaddafi in 2011. The sector is, however, fragmented and the forecast does not capture the damage inflicted during the Arab Spring events.
Libya has the largest oil reserves in Africa, larger even than those of Nigeria, implying that stability could unlock significant revenues that would last for several decades. Its gas reserves are the fourth largest in the continent, behind only Algeria, Nigeria and Egypt.
Although many of the charts in the sectoral scenarios also include GDP per capita, this overview is an essential point of departure for interpreting the general economic outlook of Libya.
Given the lack of economic diversification, Libya’s GDP per capita inevitably tracks its incomes from oil and gas. In 1991, Libya boasted Africa’s highest GDP per capita but lost ground thereafter, eventually to only recover to its 1991 peak in 2010, shortly before the Arab Spring during which incomes fell by more than half. Recovery started in 2019, only to fall back as the peace agreement (and oil exports) faltered.
The most recent data in IFs is for 2019 and presents GDP per capita at US$20 296 making Libya the third highest GDP per capita in Africa and above the estimated average of US$14 235 for upper middle-income countries in Africa in the same year. Other sources, such as the World Bank, estimate its GDP per capita for that year at much lower levels, with large year-on-year changes, implying that the forecasts presented here should be treated with care. Libya’s large oil reserves would indicate significant potential to rapidly grow, however.
Leaving recent annual fluctuations aside, in the Current Path forecast, GDP per capita in Libya will increase to US$31 250 in 2043, then ranked third highest in Africa, bested only by Equatorial Guinea and Seychelles. The estimated GDP per capita for Libya in 2043 will also be 76% higher than its income peers on the continent.
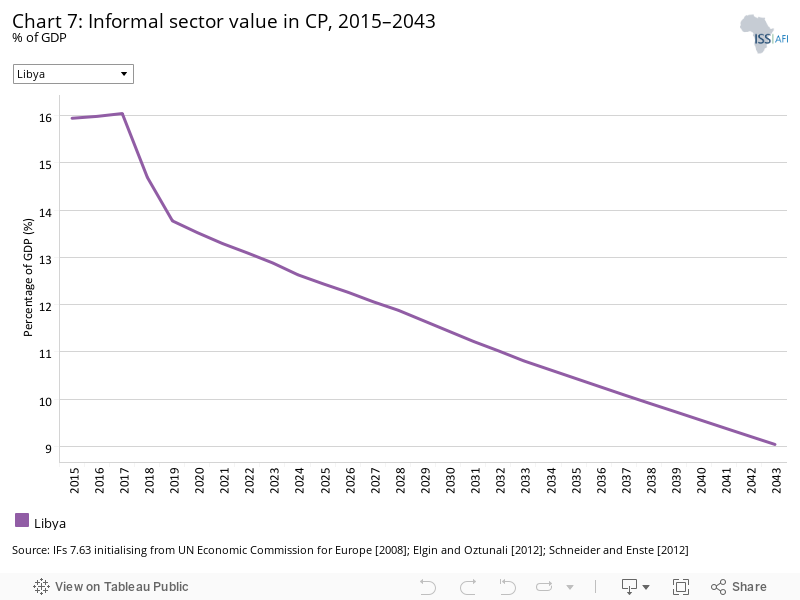
IFs estimates the size of the informal sector in Libya at 14% of GDP (equivalent to US$10.1 billion) in 2019, roughly equivalent to the average for upper middle-income countries in Africa. On the Current Path, the informal sector is projected to decline to 9% (US$16.1 billion) in 2043, 62% lower than the average for its income peers in Africa. Among Africa’s seven upper middle-income countries, only South Africa and Mauritius had smaller informal sectors in 2019, although Africa’s upper middle-economies all tend to have a larger informal sector than the global average for this income group (average difference is about 6 percentage points lower). The civil war will have resulted in a substantial increase in the size of Libya’s informal and illicit sectors.
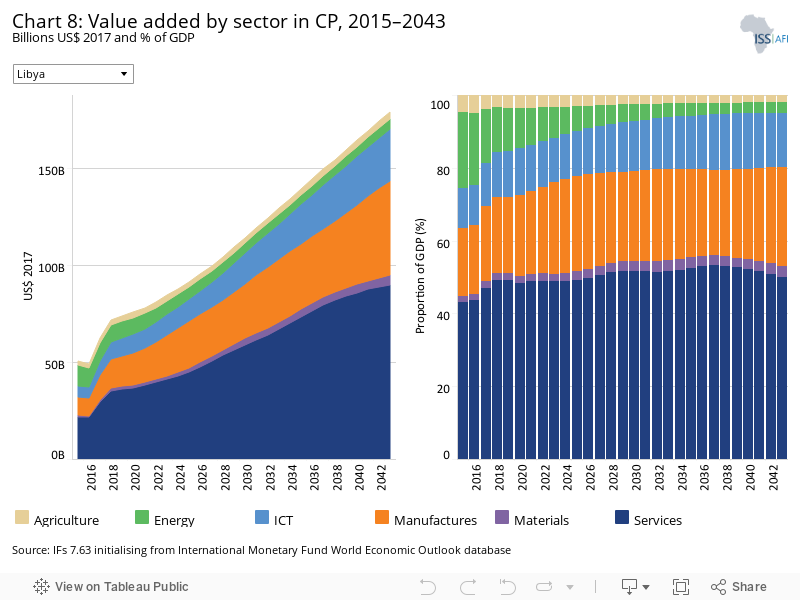
The IFs platform uses data from the Global Trade and Analysis Project (GTAP) to classify economic activity into six sectors: agriculture, energy, materials (including mining), manufactures, service and information and communication technologies (ICT). Most other sources use a threefold distinction between only agriculture, industry and services with the result that data may differ
Like most other African countries, the Libyan economy is dominated by the service sector at 49.2% (or US$36.1 billion) of GDP in 2019 (although some 8 percentage points below the average for upper middle-income Africa). Libya’s manufacturing sector, at 21% in 2019 (US$15.4 billion), is comparable in its contribution to GDP with the average for upper middle-income Africa. Its ICT sector at 12.6% (US$9.24 billion) is almost double the average for upper middle-income countries, while the materials sector is half the average at 2% (US$1.4 billion) in 2019. The Current Path forecast is that the service sector maintains its large contribution (50%, equivalent to US$89.4 billion), a modest increase in the contribution from manufactures (to 27.3% or US$48.8 billion) and a decline in agriculture (to 1.9% or US$3.3 billion) in 2043. The largest shift, within IFs, is in the energy sector (at almost 21% in 2015 and just below 12% in 2019 or US$8.6 billion) that declines to 3% of GDP (or US$5.3 billion) in 2043. This is because IFs initialised its forecast from 2015, at which point oil production was very low. The materials sector grows modestly to almost 3% of GDP by 2043 (US$5.2 billion) and ICT to almost 15% (US$26.5 billion). The agriculture sector is forecast to decline from 4.7% in 2015 to 3.6% in 2019 and 1.9% (US$3.3 billion) in 2043.
Libya’s formal economy is dominated by the public sector with a very small private sector and limited competition.
Compared to the averages for upper middle-income Africa, the contribution from Libya’s energy, agriculture and ICT sectors is large; its service sector is small, as is the contribution from materials. Libya has a particularly large ICT sector, even by global comparative standards.
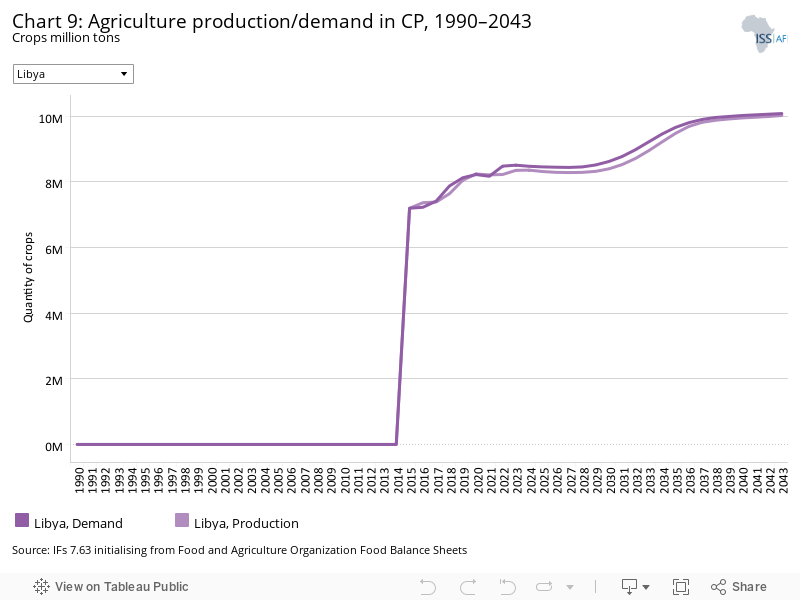
The data on agricultural production and demand in the IFs forecasting platform initialises from data provided on food balances by the Food and Agriculture Organization (FAO). IFs contains data on numerous types of agriculture but aggregates its forecast into crops, meat and fish, presented in million metric tons. Chart 9 shows agricultural production and demand as a total of all three categories.
Only 1% (or 2 million hectares) of Libya’s land area is suitable for crop cultivation and 7.5% for grazing. With around 263 000 hectares under irrigation, agriculture contributed around 3.5% to GDP (or US$2.6 billion) in 2019. No historical data is available for agricultural production in Libya. The IFs pre-processor estimates 2019 production and demand at over 8 million metric tons and that the country imported around 296 000 tons of agricultural products. By 2043, production and demand will increase to 10 million tons.
According to the FAO, crop and livestock production are a significant source of food security for many Libyan households, which tend to be small producers, with the result that a comparatively large proportion of Libyans (22%) are engaged in some form of agriculture production.
The ongoing civil conflict, the COVID-19 pandemic and the devaluation of the Libyan dinar have increased food insecurity in Libya over the last decade.
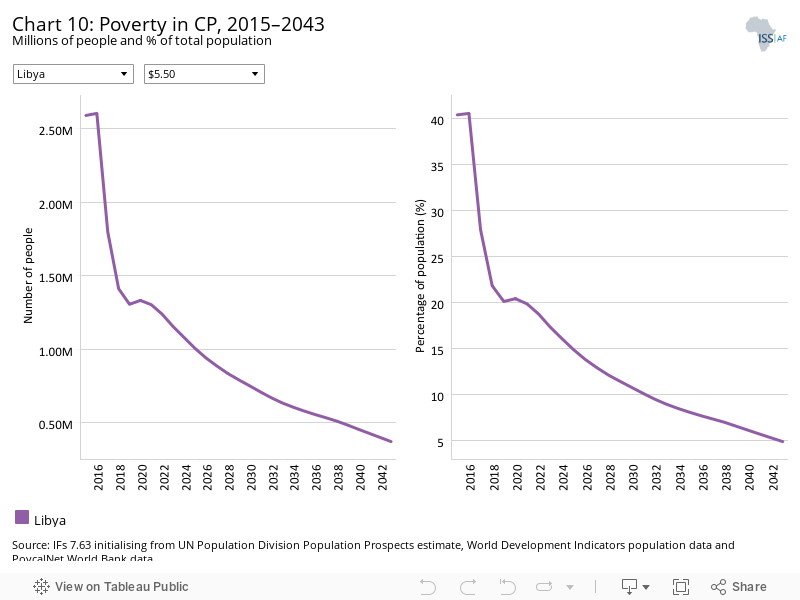
There are numerous methodologies for and approaches to defining poverty. We measure income poverty and use GDP per capita as a proxy. In 2015, the World Bank adopted the measure of US$1.90 per person per day (in 2011 international prices), also used to measure progress towards the achievement of Sustainable Development Goal (SDG) 1 of eradicating extreme poverty. To account for extreme poverty in richer countries occurring at slightly higher levels of income than in poor countries, the World Bank introduced three additional poverty lines in 2017:
- US$3.20 for lower middle-income countries
- US$5.50 for upper middle-income countries
- US$22.70 for high-income countries.
Together with other countries in North Africa, Libya met the goal of eliminating extreme poverty (using US$1.90) in 2018. However, using US$5.50 for upper middle-income countries, 1.3 million Libyans (20.12%) lived in extreme poverty in 2019; this number will decline to 369 000 (4.9%) in 2043 in the Current Path forecast.
The ongoing conflict will have an impact on these rates and numbers. Throughout the forecast period, the proportion of extreme poverty in Libya was lower than the average for upper middle-income countries in Africa with the poverty gap widening from 26.1 percentage points in 2019 to 34.8 percentage points in 2043.
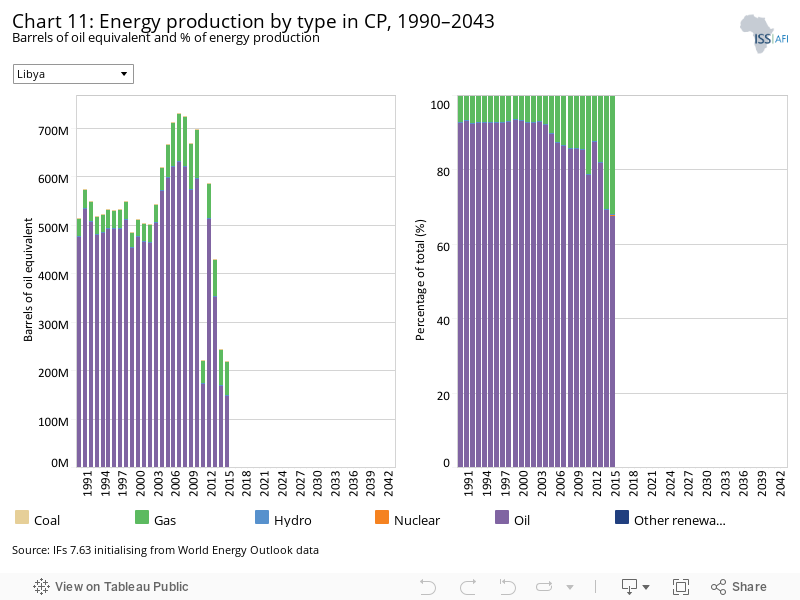
The IFs platform forecasts six types of energy, namely oil, gas, coal, hydro, nuclear and other renewables. To allow comparisons between different types of energy, the data is converted into billion barrels of oil equivalent (BBOE). The energy contained in a barrel of oil is approximately 5.8 million British thermal units (MBTUs) or 1 700 kilowatt-hours (kWh) of energy.
In 2010, before the Arab Spring, Libya produced 596 million barrels of oil and 101 million barrels of gas (in oil equivalent). Production tumbled to 173 million barrels in 2011 and see-sawed thereafter to an all-time low in 2015, the last point of data on oil production within the IFs system. At that point, Libya produced 148 million tons of oil. Other sources of energy production within IFs are marginal. The International Energy Agency records a strong recovery in oil production in 2019 and indicates that gas production has remained largely unaffected by the ongoing conflict.
In 2013, the Libyan government launched the Renewable Energy Strategic Plan 2013–2025, which aims to achieve a 7% wind and solar contribution to the electric energy mix by 2020 and 10% by 2025.
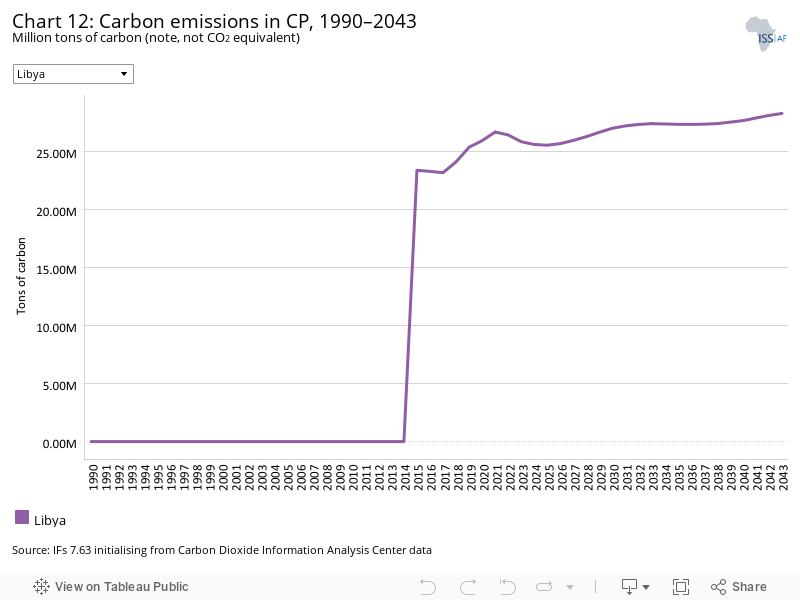
Carbon is released in many ways, but the three most important contributors to greenhouse gases are carbon dioxide (CO2), carbon monoxide (CO) and methane (CH4). Since each has a different molecular weight, IFs uses carbon. Many other sites and calculations use CO2 equivalent.
Due to its large oil and gas activities, the estimate within IFs is that Libya was the fifth largest carbon emitter in Africa, releasing 25 million tons of carbon, forecast to increase to 28.3 million tons in 2043, at which point it will be the tenth largest carbon emitter on the continent. Given the lack of clarity on oil and gas production in recent years, the carbon emissions forecast is speculative.
Sectoral Scenarios for Libya
Download to pdfThe Stability scenario represents reasonable but ambitious reductions in risk of regime instability and lower levels of internal conflict. Stability is generally a prerequisite for other aspects of development and this would encourage inflows of foreign direct investment (FDI) and improve business confidence. Better governance through the accountability that follows substantive democracy is modelled separately.
The intervention is explained here in the thematic part of the website.
Libya has been trapped in recurring cycles of violence since 2011 with the overthrow and death of Muammar Gaddafi. The associated developments are not reflected within IFs and Chart 13 is therefore not populated.
The transition from a stable authoritarian regime to stable democracy in Libya remains stalled, as vast areas are under the control of opposing armed groups. The events of 2011/12 were, in turn, the result of various structural factors, including a large youth bulge and lack of social, political and economic freedom. Almost half of Libya’s adult population (15 years and older) was in the age bracket 15 to 29 years of age, constituting a large youth bulge, which is often associated with instability, particularly if it is well educated and without sufficient job opportunities. At 9 years of adult education, Libyans have the seventh highest mean years of education in Africa while levels of economic freedom (or opportunity) is among the lowest (50th out of 54 countries, using the Fraser Institute’s index of economic freedom). The result is a country where opportunity is generally stymied, dominated by a large public sector that crowds out private competition while having some of the largest ICT sectors as a per cent of GDP in Africa. Access to the Internet therefore allowed for the rapid mobilisation of Libyans during the Arab Spring.
The demographic picture is now rapidly changing with Libya’s youth bulge declining from 33% in 2019 to 26% in 2043. In Africa, only Algeria, Tunisia, Mauritius and Seychelles had a smaller youth bulge in 2019, but the other impediments to unlock opportunity such as an open and competitive economy, capable institutions and government capacity are unavailable during the current recurring bouts of armed violence and political instability.
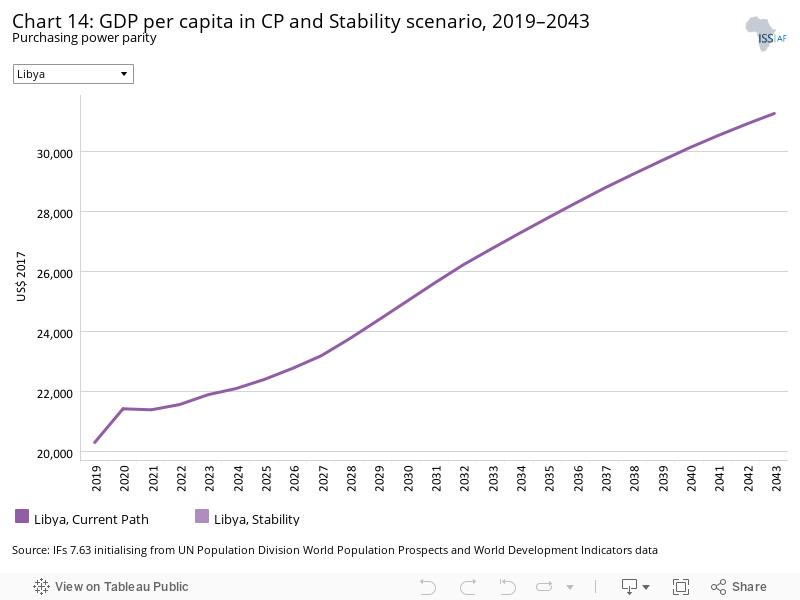
Since the start of conflict in 2011, estimates of GDP per capita for Libya have gyrated wildly from year to year and the data varies between agencies. The last data in IFs is for 2019, at which point Libya had the third highest GDP per capita in Africa at US$20 296. According to the World Bank, GDP per capita plunged in 2020. The data on GDP per capita presented in this chart is only for the Current Path forecast and should be treated with caution.
In the Current Path forecast, GDP per capita in Libya will increase to US$31 250 in 2043 — still ranked as the third highest in Africa, bested only by Equatorial Guinea and Seychelles. The projected GDP per capita in 2043 will be 76% greater than the average for upper middle-income African countries.
There is no Stability scenario for Libya and Chart 14 only presents the Current Path forecast.
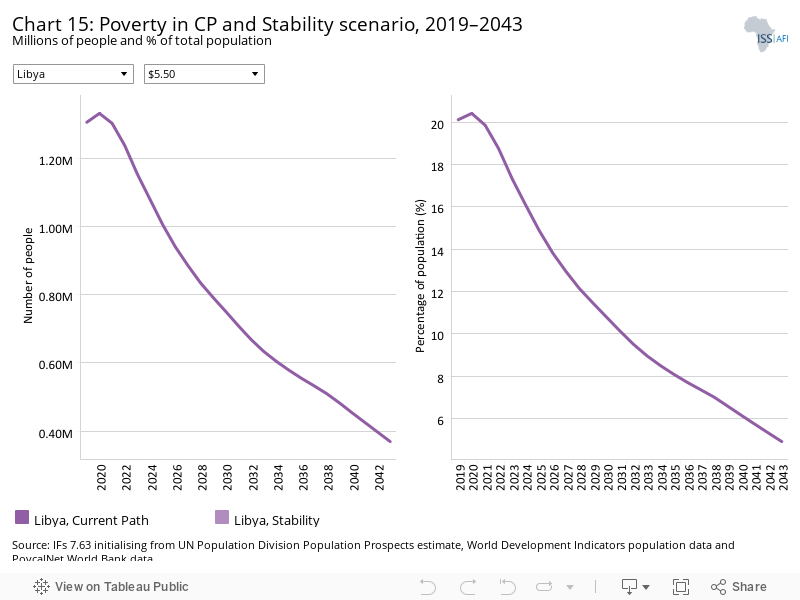
Together with other countries in North Africa, Libya met the goal of eliminating extreme poverty (using US$1.90) in 2018. However, using US$5.50 for upper middle-income countries, 1.3 million Libyans (20.12%) lived in extreme poverty in 2019; this number will decline to 369 000 (4.9%) in 2043 in the Current Path forecast. This forecast likely underestimates the impact of recent levels of instability. Throughout the forecast period, the proportion of Libyans living in extreme poverty was lower than the average for upper middle-income countries in Africa with the poverty gap widening from 26.1 percentage points in 2019 to 34.8 percentage points in 2043.
There is no Stability scenario for Libya and Chart 15 only presents the Current Path forecast.
This section presents the impact of a Demographic scenario that aims to hasten and increase the demographic dividend through reasonable but ambitious reductions in the communicable-disease burden for children under five, the maternal mortality ratio and increased access to modern contraception.
The intervention is explained here in the thematic part of the website.
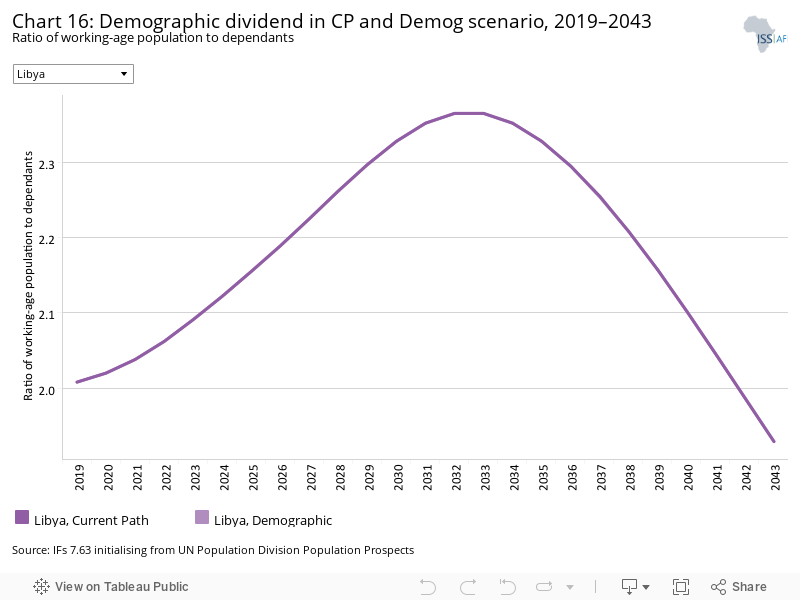
Demographers typically differentiate between a first, second and even a third demographic dividend. We focus here on the contribution of the size of the labour force (between 15 and 64 years of age) relative to dependants (children and the elderly) as part of the first dividend. A window of opportunity opens when the ratio of the working-age population to dependants is equal to or surpasses 1.7.
Libya entered a potential demographic dividend in 2001 and will remain in this window of opportunity beyond 2043, implying that, with the right policies and education, it has the potential for rapid economic growth. In 2019, the ratio of working-age persons to dependants was 2:1, below only Mauritius and Seychelles and above the average of 1.85:1 for upper middle-income African countries in the same year. The ratio means that 66.8% of Libya’s population was then of working age (15 to 64 years). In the Current Path forecast, Libya will reach a peak demographic dividend in around 2033 when the ratio will get to 2.4:1, which is higher than the forecast for most other African states. Thereafter, the ratio of working-age persons to dependants will slowly decline to just below 1.9:1 by 2043, slightly below the average for its income peers in Africa. It is, however, likely that the years of conflict will increase rates of total fertility that will impact upon its demographic profile.
As the country is already experiencing a demographic dividend, the Demographic scenario has a marginal impact on Libya.
The infant mortality rate is the number of infant deaths per 1 000 live births and is an important marker of the overall quality of the health system in a country.
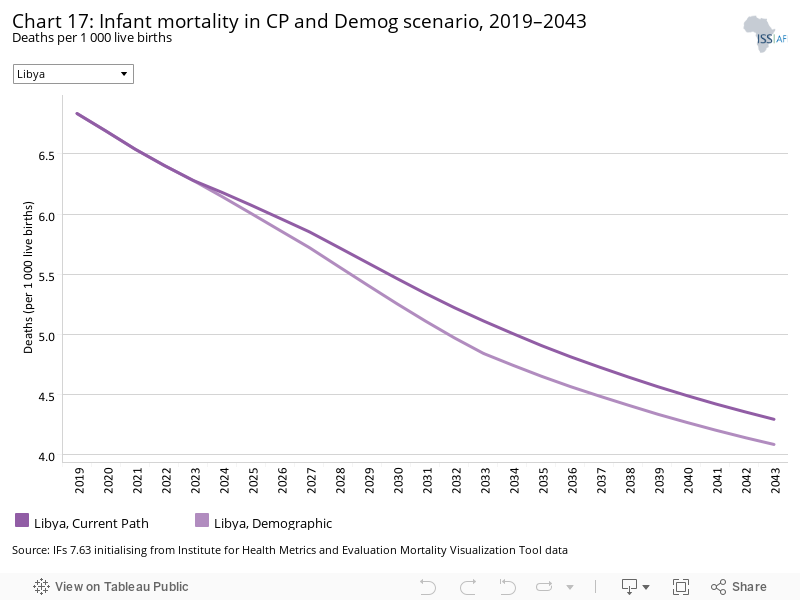
Investments in basic sanitation and healthcare since the discovery of oil means that Libya has among the lowest rates of infant mortality in Africa. In the year prior to the Arab Spring, in 2010, it was at 10.6 deaths per 1 000 live births, but then jumped to more than 16 in 2011. The IFs forecast is that infant mortality rates declined thereafter to 6.8 per 1 000 live births in 2019, but that number probably underestimates the impact of the ongoing conflict, with the forecast reaching 4.4 deaths in 2043.
At these low levels of mortality, the Demographic scenario has little impact and, in 2043, the difference between the Demographic scenario and the Current Path forecast is 0.2 fewer deaths per 1 000 live births. The projected infant mortality rate for Libya in both the Current Path forecast and in the Demographic scenario is significantly below the average for upper middle-income countries throughout the forecasting period.
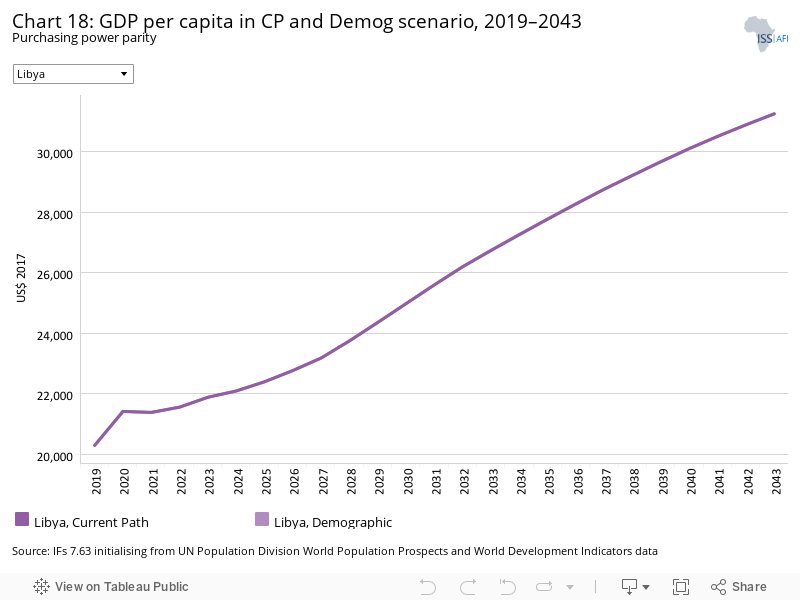
Since the start of conflict in 2011, estimates of GDP per capita for Libya have gyrated wildly from year to year and between data providers. The last data in IFs is for 2019, at which point Libya had the third highest GDP per capita in Africa at US$20 296. According to the World Bank, GDP per capita plunged in 2020, and therefore the number presented in this chart needs to be treated with care. In the Demographic scenario, GDP per capita in Libya will increase to US$31 261 in 2043, slightly above the Current Path forecast of US$31 250. Libya’s GDP per capita in the Demographic scenario will still be ranked as the third highest in Africa, bested only by Equatorial Guinea and Seychelles and 76% higher than the average for its income peers in Africa.
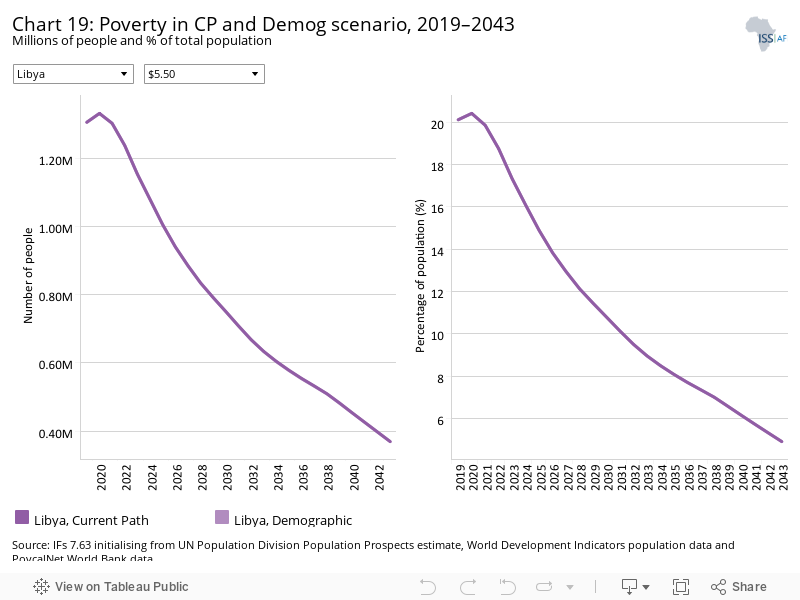
Together with other countries in North Africa, Libya met the goal of eliminating extreme poverty (using US$1.90) in 2018. However, using US$5.50 for upper middle-income countries, 1.3 million Libyans (20.12%) lived in extreme poverty in 2019; this number will decline to 369 000 (4.9%) in 2043 in the Current Path forecast. This forecast likely underestimates the impact of recent levels of instability.
Because Libya has a positive demographic profile with low levels of infant and maternal mortality, the Demographic scenario has no impact on extreme poverty.
This section presents reasonable but ambitious improvements in the Health/WaSH scenario, which include reductions in the mortality rate associated with both communicable diseases (e.g. AIDS, diarrhoea, malaria and respiratory infections) and non-communicable diseases (NCDs) (e.g. diabetes), as well as improvements in access to safe water and better sanitation. The acronym WaSH stands for water, sanitation and hygiene.
The intervention is explained here in the thematic part of the website.
Libya has some of the highest rates of basic infrastructure provision in Africa. In 2019, access to improved water and sanitation infrastructure, for example, was at 100%, while connections to wastewater collection was at 82%.
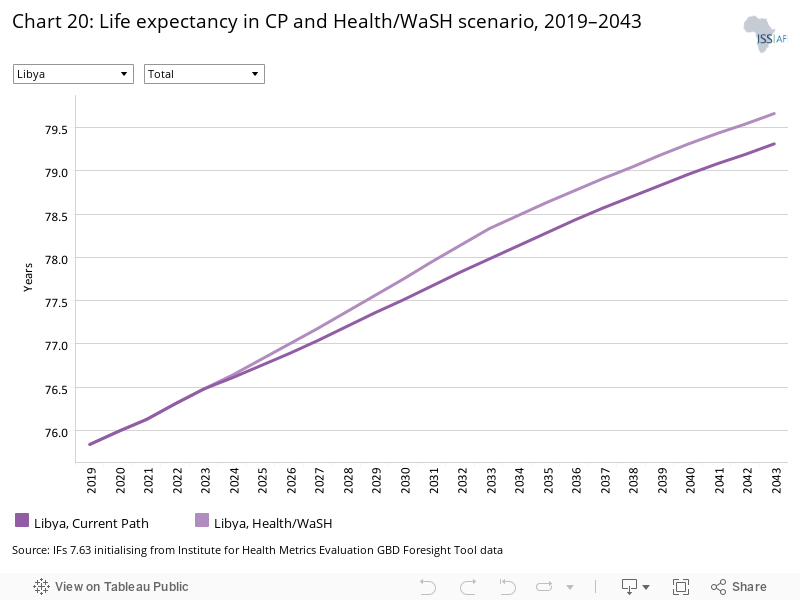
Just before the Arab Spring, life expectancy in Libya was more than 76 years but declined thereafter, although the IFs forecast is that it has recently recovered back to that level, and life expectancy is forecast to increase from 75.8 years in 2019 to 79.3 years in 2043. That would mean that life expectancy in Libya would then be third highest in Africa, behind only Tunisia and Algeria. The Health/WaSH scenario therefore has only a limited impact on life expectancy, with an improvement of 0.35 years by 2043.
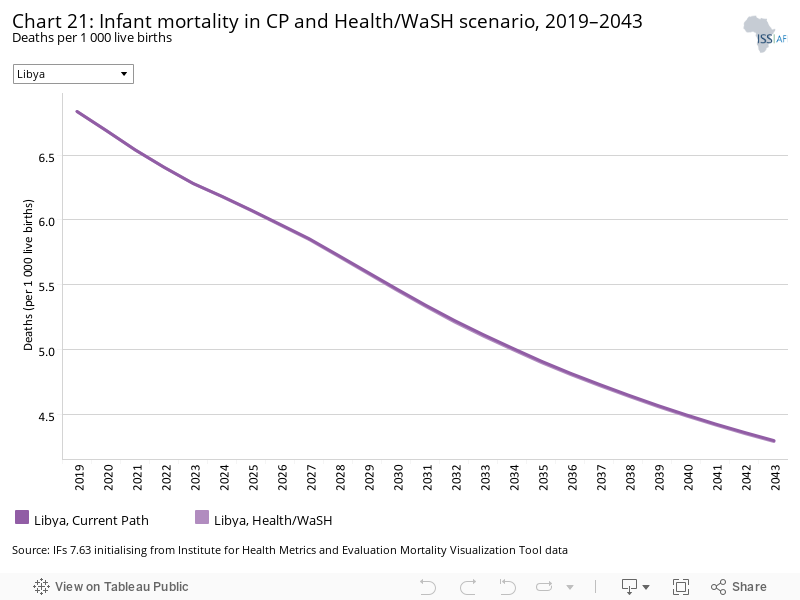
Investments in WaSH infrastructure and healthcare since the discovery of oil means that Libya has among the lowest rates of infant mortality in Africa. In 2010, the rate was at 10.6 deaths per 1 000 live births, although, with the subsequent disruptions associated with the Arab Spring that rate jumped to more than 16 deaths in 2011. The IFs forecast is that infant mortality rates declined thereafter, to 6.8 deaths in 2019, but that rate probably underestimates the impact of the ongoing conflict, with the forecast improving to 4.4 deaths in 2043. The IFs forecast is that Libya had the lowest rate of infant deaths per 1 000 live births in Africa from 2018. At these low levels of mortality, the Health/WaSH scenario has no impact.
The Agriculture scenario represents reasonable but ambitious increases in yields per hectare (reflecting better management and seed and fertiliser technology), increased land under irrigation and reduced loss and waste. Where appropriate, it includes an increase in calorie consumption, reflecting the prioritisation of food self-sufficiency above food exports as a desirable policy objective.
The intervention is explained here in the thematic part of the website.
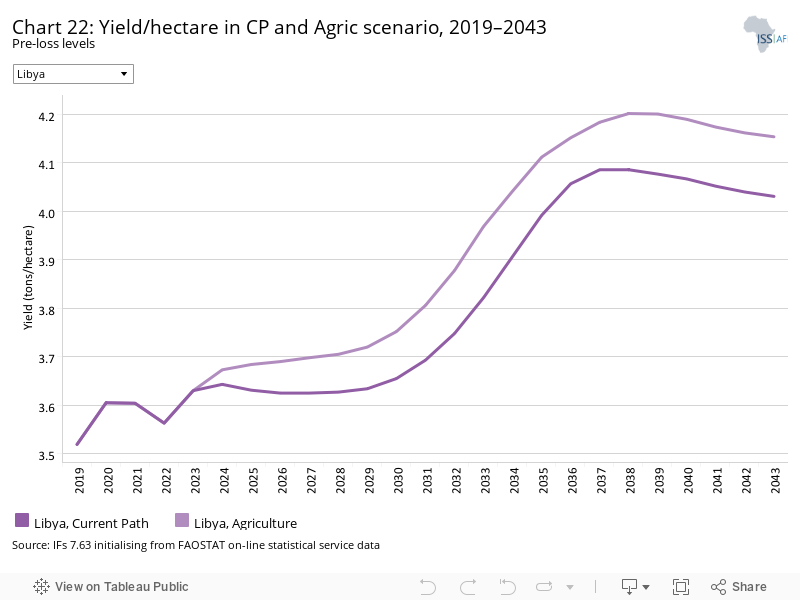
The data on yield per hectare (in metric tons) is for crops but does not distinguish between different categories of crops.
Only 1% (or 2 million hectares) of Libya’s land area is suitable for crop cultivation and 7.5% for grazing. With around 263 000 hectares of land under irrigation, agriculture contributed around 3.5% to GDP (or US$2.6 billion) in 2019 — although other data sources set it lower at around 1.3% of GDP. No historical data is available for agricultural production in Libya and the IFs pre-processor estimates 2019 production and demand at 8 million metric tons each, and that the country imported around 296 000 tons of agricultural products. By 2043, production and demand will increase to 10 million tons. According to the Global Agricultural Information Network, Libya imports around US$3 billion foodstuffs annually.
According to the FAO, crop and livestock production are a significant source of food security for many Libyan households, which tend to be small producers, with the result that a comparatively large proportion of Libyans (22%) are engaged in some form of agriculture production.
In 2019, crop yields per hectare in Libya was 3.5 tons, increasing to 4 tons by 2043 on the Current Path. In the Agriculture scenario, yields increase by 3% and will still be lower than the average of 4.7 tons for upper middle-income countries in Africa.
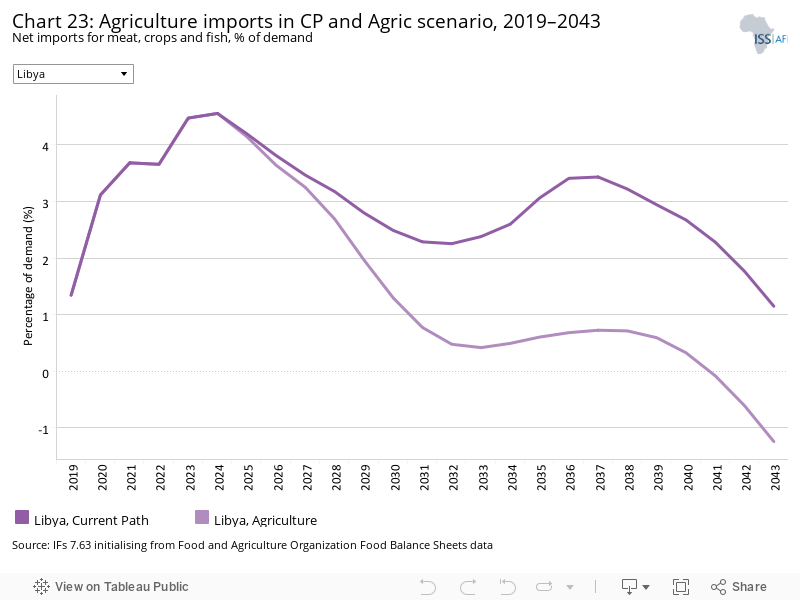
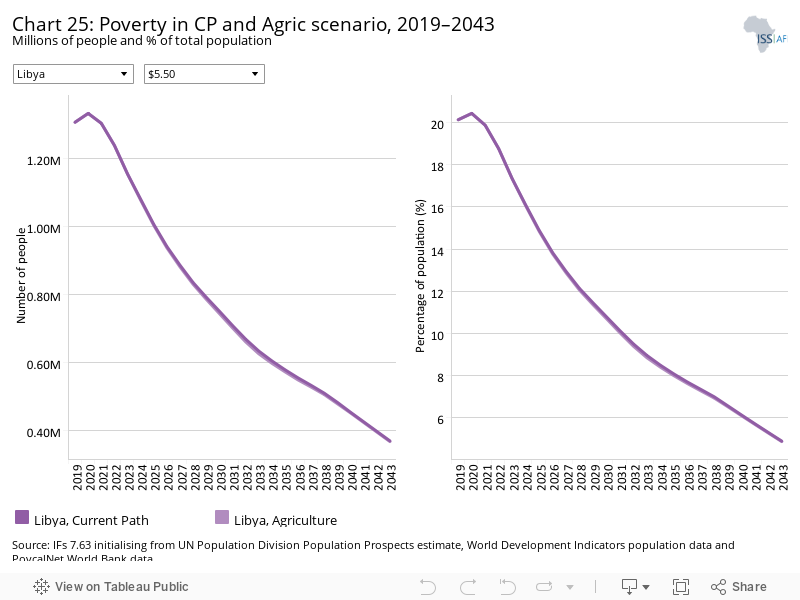
In 2019, Libya produced 8 million metric tons of agricultural products (combining crops, meat and fish). This amount was insufficient to meet domestic consumption leading to net import of agricultural products of 1.35% of demand. On the Current Path, it is expected to increase to 10 million metric tons in 2043 (1.15% net agriculture imports as a per cent of agriculture demand). In the Agriculture scenario, production increases by almost 3% to 10.3 million tons in 2043 making Libya a net exporter equivalent to 1.24% of agriculture demand. By contrast, the average for upper middle-income Africa is for agriculture imports equivalent to 20.7% of demand.
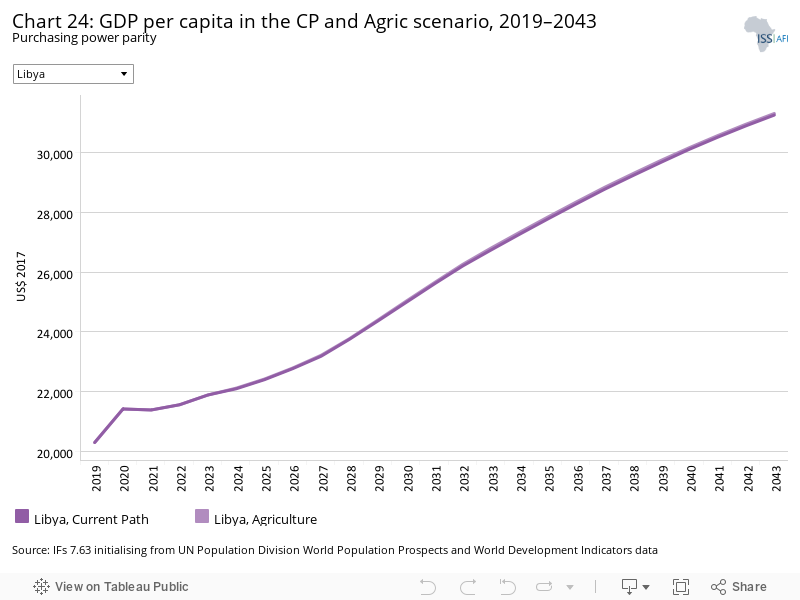
Since the start of conflict in 2011, estimates of GDP per capita for Libya have gyrated wildly from year to year and between agencies. The last data in IFs is for 2019, at which point Libya had the third highest GDP per capita in Africa at US$20 296. According to the World Bank, GDP per capita plunged in 2020, and therefore the numbers presented in this chart need to be treated with extreme caution. In the Current Path forecast, GDP per capita in Libya will increase to US$31 250 in 2043 — still ranked as the third highest in Africa, bested only by Equatorial Guinea and Seychelles. In the Agriculture scenario, GDP per capita gets to US$31 305 in 2043, an increase of US$55 above the Current Path forecast for that year and over two-thirds higher than the average for upper middle-income countries in Africa.
Together with other countries in North Africa, Libya met the goal of eliminating extreme poverty (using US$1.90) in 2018. However, using US$5.50 for upper middle-income countries, 1.3 million Libyans (20.12%) lived in extreme poverty in 2019; this number will decline to 369 000 (4.9%) in 2043 in the Current Path forecast, far lower than the projected average of 39.7% for upper middle-income countries in Africa in the same year. The Agriculture scenario has no significant impact on extreme poverty in Libya partly due to the unavailability of historical data on important indicators such as agricultural production. This forecast likely underestimates the impact of recent levels of instability.
The Education scenario represents reasonable but ambitious improved intake, transition and graduation rates from primary to tertiary levels and better quality of education. It also models substantive progress towards gender parity at all levels, additional vocational training at secondary school level and increases in the share of science and engineering graduates.
The intervention is explained here in the thematic part of the website.
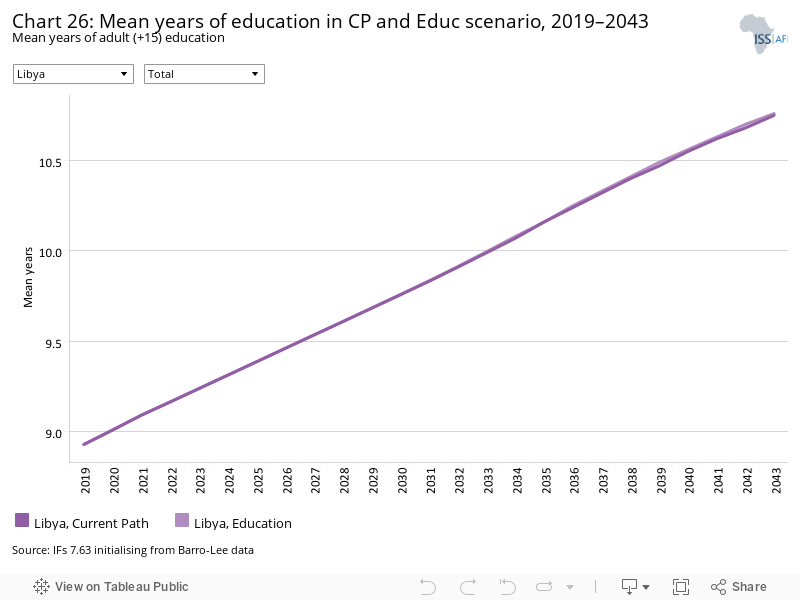
In 2019, the mean years of education in Libya was 8.9 years. Although it is below the average of 9.8 years for its income peer group in Africa, it is the seventh best in Africa and significantly higher than the world average. In the Current Path forecast, mean years of adult education will increase to 10.8 years in 2043, the third highest in Africa. On average, females had more than 2 years more education than men in 2019. By 2043, the gap will have declined to 1.5 years. Because Libya already does very well in this regard, the Education scenario only has a marginal impact on mean years of adult education.
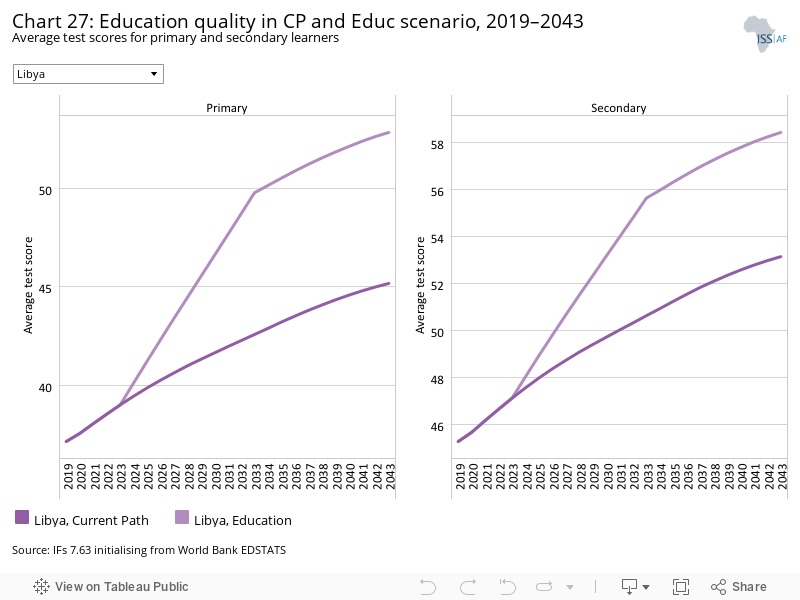
Although Libya does very well in mean years of adult education (seventh best in Africa in 2019), the quality of education lags. In primary test scores, Libya ranked ninth in Africa in 2019 but fourth highest on secondary test scores. Average test score for primary learners improves from 37.2 in 2019 to 45.2 in 2043 on the Current Path, lower than the projected 52.8 in the Education scenario. Likewise, the Current Path forecast increases average test scores for secondary school learners from 45.3 in 2019 to 53.1 by 2043. The Education scenario results in raised average test scores, about 10% above the Current Path.
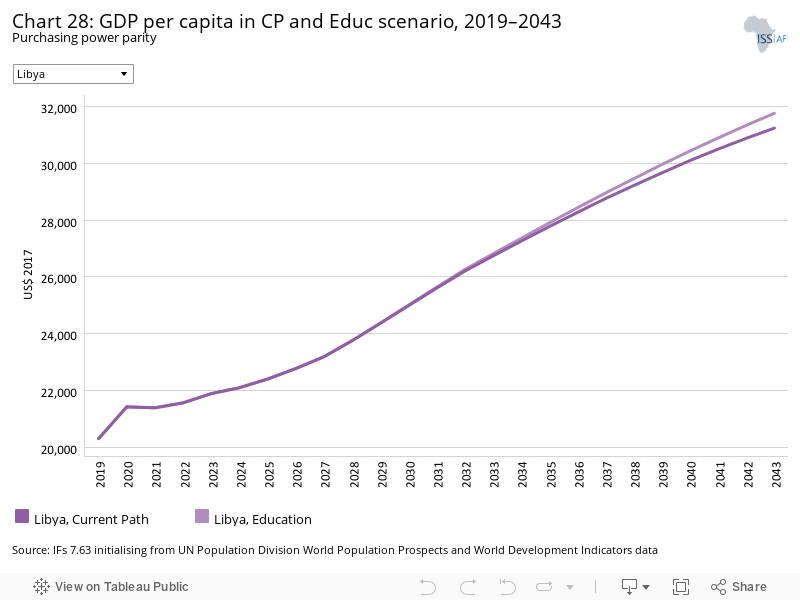
Since the start of conflict in 2011, estimates of GDP per capita for Libya have gyrated wildly from year to year and between different data providers. The last data in IFs is for 2019, at which point Libya had the third highest GDP per capita in Africa at US$20 296. According to the World Bank, GDP per capita plunged in 2020, and therefore the numbers presented in this chart need to be treated with caution. In the Current Path forecast, GDP per capita in Libya will increase to US$31 250 in 2043 — still ranked as the third highest in Africa, bested only by Equatorial Guinea and Seychelles. In the Education scenario, GDP per capita increases by US$524 above the Current Path to US$31 774 in 2043.
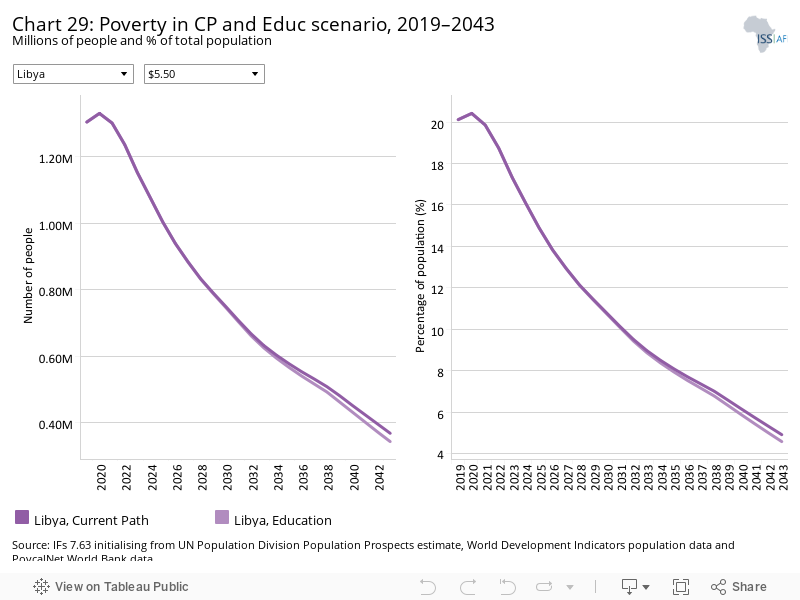
Together with other countries in North Africa, Libya met the goal of eliminating extreme poverty (using US$1.90) in 2018. However, using US$5.50 for upper middle-income countries, 1.3 million Libyans (20.12%) lived in extreme poverty in 2019; this number will decline to 369 000 (4.9%) in 2043 in the Current Path forecast. This forecast likely underestimates the impact of recent levels of instability.
As Libya already does well in both the quantity and quality of education provided, the impact of the Education scenario on extreme poverty is a marginal decline to 4.57% (344 000 people) using US$5.50.
The Manufacturing/Transfers scenario represents reasonable but ambitious manufacturing growth through greater investment in the economy, investments in research and development, and promotion of the export of manufactured goods. It is accompanied by an increase in welfare transfers (social grants) to moderate the initial increases in inequality that are typically associated with a manufacturing transition. To this end, the scenario improves tax administration and increases government revenues.
The intervention is explained here in the thematic part of the website.
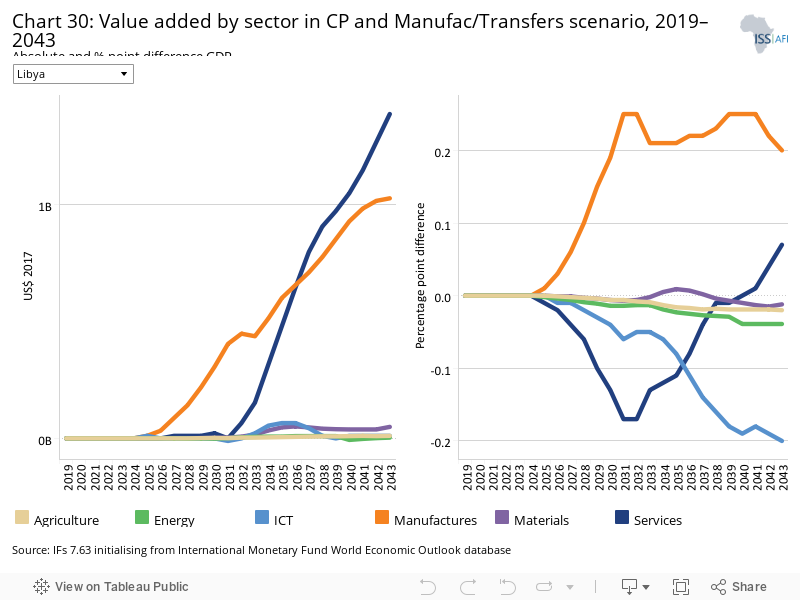
Chart 30 should be read with Chart 8 that presents a stacked area graph on the contribution to GDP and size, in billion US$, of the Current Path economy for each of the sectors.
Because of the ongoing conflict in Libya, the data and forecasts diverge from other sources and should be considered provisional.
Similar to most other African countries, the Libyan economy is dominated by the service sector which, in 2019, accounted for 49% of GDP, followed by the manufacturing sector at 21%, ICT sector at 12.6%, energy sector at 11.8%, agriculture sector at 3.4% and materials sector at 2%. The Current Path forecast is for the service sector to maintain its large contribution (50%) in 2043, a modest increase in the contribution from the manufacturing sector (to 27.3%) and further decline in the agriculture sector (to 1.9%). The largest shift, within IFs, is in the energy sector that declines to 3% of GDP in 2043 — likely because the IFs forecast for oil production initialises from 2015 data, a year during which production was particularly low.
Libya’s manufacturing sector consists of a large oil and a much smaller non-oil component. According to Nations Encyclopedia, the non-oil manufacturing industries are ‘small, lightly capitalised, and devoted primarily to the processing of local agricultural products (tanning, canning fruits and vegetables, milling flour, and processing olive oil), and to textiles, building materials, and basic consumer items. Handicraft products include carpets and rugs, silver jewellery, textiles, glassware, and leather goods.’
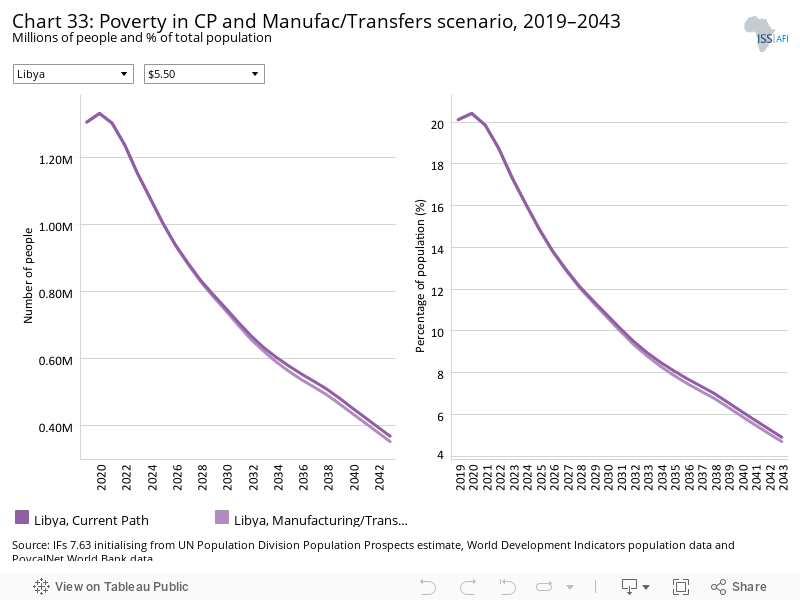
The Manufacturing/Transfers scenario increases the contribution of manufactures by 0.2% above the Current Path in 2043 and services by 0.1%. The other sectors, agriculture, energy, materials and ICT, all decline in contribution to GDP, but all sectors are larger in 2043 in the Manufacturing/Transfers scenario compared to the Current Path forecast. The service sector, for example, is US$1.38 billion larger and manufacturing US$1.02 billion. Increases for other sectors are marginal.
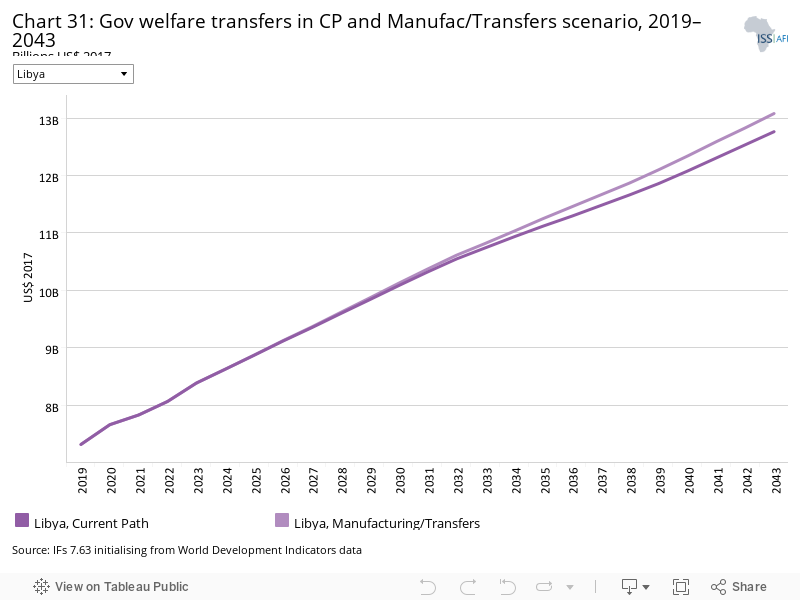
Government welfare transfers in 2019 were US$7.31 billion and increases to US$12.76 billion in 2043 in the Current Path forecast. In the Manufacturing/Transfers scenario, it is US$13.08 billion, an increase of slightly more than 2% above the Current Path forecast.
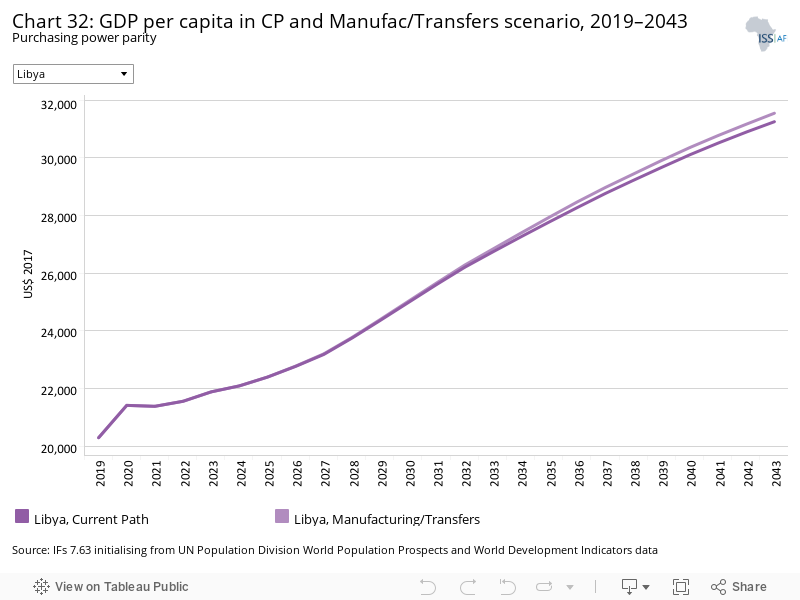
Since the start of conflict in 2011, estimates of GDP per capita for Libya have gyrated wildly from year to year and between data providers. The last data in IFs is for 2019, at which point Libya had the third highest GDP per capita in Africa at US$20 296. According to the World Bank, GDP per capita plunged in 2020, and therefore the number presented in this chart is provisional.
In the Current Path forecast, GDP per capita in Libya will increase to US$31 250 in 2043 — still ranked as the third highest in Africa, bested only by Equatorial Guinea and Seychelles. In the Manufacturing/Transfers scenario, GDP per capita climbs to US$31 545 by 2043, an increase of US$295 and far above the average of US$17 734 for upper middle-income countries in Africa.
Together with other countries in North Africa, Libya met the goal of eliminating extreme poverty (using US$1.90) in 2018. However, using US$5.50 for upper middle-income countries, 1.3 million Libyans (20.12%) lived in extreme poverty in 2019; this number will decline to 369 000 (4.9%) in 2043 in the Current Path forecast. This forecast likely underestimates the impact of recent levels of instability. In the Manufacturing/Transfers scenario, extreme poverty declines marginally to 353 000 (4.7%) which will be 35 percentage points lower than the average for its income peers on the continent.
The Leapfrogging scenario represents a reasonable but ambitious adoption of and investment in renewable energy technologies, resulting in better access to electricity in urban and rural areas. The scenario includes accelerated access to mobile and fixed broadband and the adoption of modern technology that improves government efficiency and allows for the more rapid formalisation of the informal sector.
The intervention is explained here in the thematic part of the website.
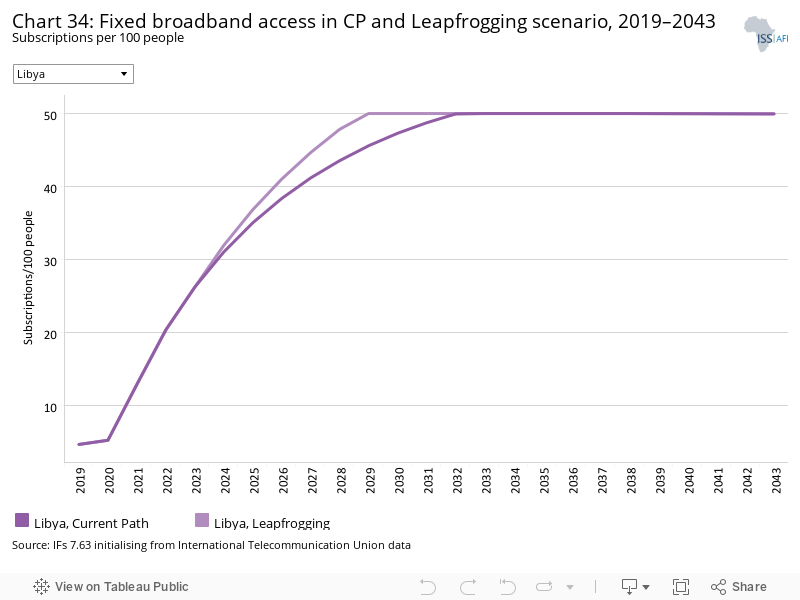
Fixed broadband includes cable modem Internet connections, DSL Internet connections of at least 256 KB/s, fibre and other fixed broadband technology connections (such as satellite broadband Internet, ethernet local area networks, fixed-wireless access, wireless local area networks, WiMAX, etc.).
In 2019, fixed broadband subscriptions in Libya were at 4.7 per 100 persons, the tenth highest in Africa and slightly above the average of 4.4 per 100 persons for upper middle-income countries in Africa. However, much of the infrastructure has been damaged in the ongoing civil war. In the Current Path forecast, it is set to reach saturation levels of 50 per 100 persons in 2032 (at which point it will be ranked first in Africa) and three years earlier in the Leapfrogging scenario and remain so thereafter.
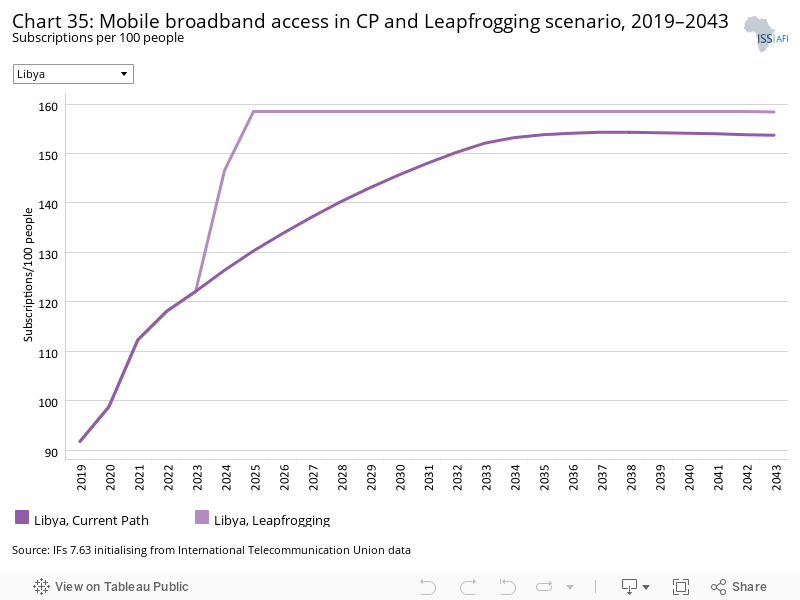
Mobile broadband refers to wireless Internet access delivered through cellular towers to computers and other digital devices.
The disruption of Libya’s mobile network after 2011 is not reflected in Chart 35, which presents mobile broadband subscriptions per 100 persons on the Current Path and in the Leapfrogging scenario. According to the research company BuddeComm, ‘much of the telecom infrastructure was destroyed or stolen following the 2011 disturbances, including about a quarter of the country’s mobile tower sites reconstruction efforts were stymied by political and military disturbances which affected much of the country.’ In 2019, mobile broadband subscriptions in Libya were at 92 per 100 persons, getting to saturation rates of 150 in 2032. In the Leapfrogging scenario, Libya gets to 150 subscriptions seven years earlier, in 2025. By 2043, the Leapfrogging scenario will raise mobile subscriptions to 158 per 100 persons, which is above the Current Path projections of 154 per 100 persons.
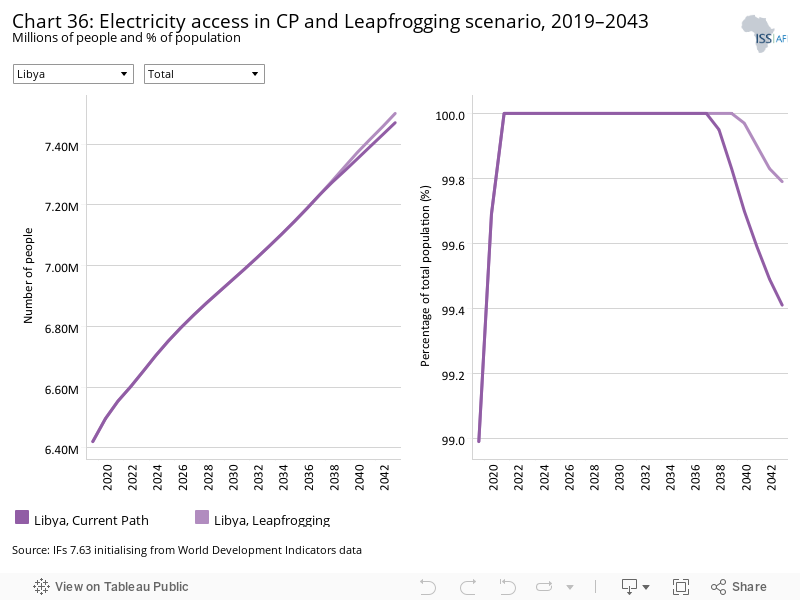
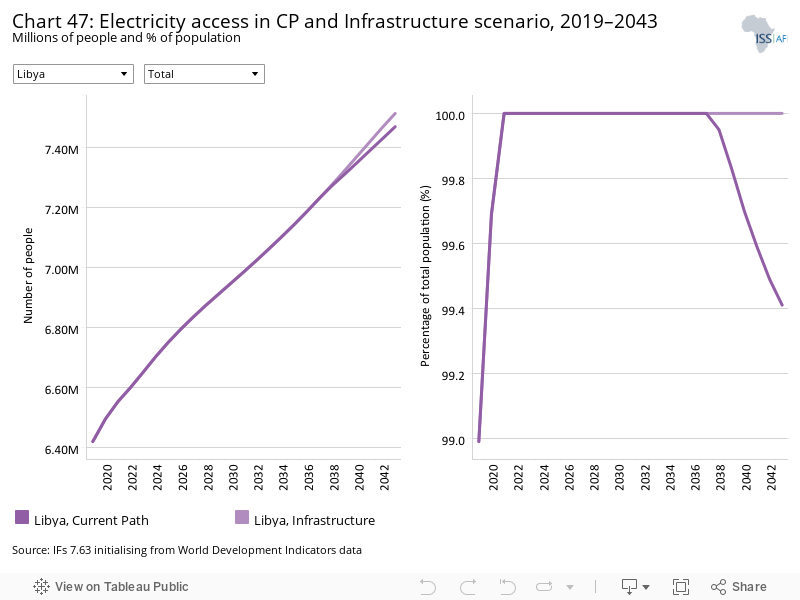
Libya has provided electricity access to all of its population, urban and rural, for several decades and the Leapfrogging scenario therefore has no impact on access rates.
Since the start of conflict in 2011, estimates of GDP per capita for Libya have gyrated wildly from year to year and between agencies. The last data in IFs is for 2019, at which point Libya had the third highest GDP per capita in Africa at US$20 296. According to the World Bank, GDP per capita plunged in 2020, and therefore the number presented in this chart must be considered to be provisional.
Because its ICT sector is already large by comparative standards, the Leapfrogging scenario has a limited impact on further growth in Libya, increasing the size of the sector by only 0.2 percentage points of GDP in 2043.
In the Current Path forecast, GDP per capita in Libya will increase to US$31 250 in 2043 — still ranked as the third highest in Africa, bested only by Equatorial Guinea and Seychelles. In the Leapfrogging scenario, GDP per capita will increase to US$31 719 in 2043, 1.5% higher than the Current Path forecast and far above the average of US$17 734 for upper middle-income African countries.
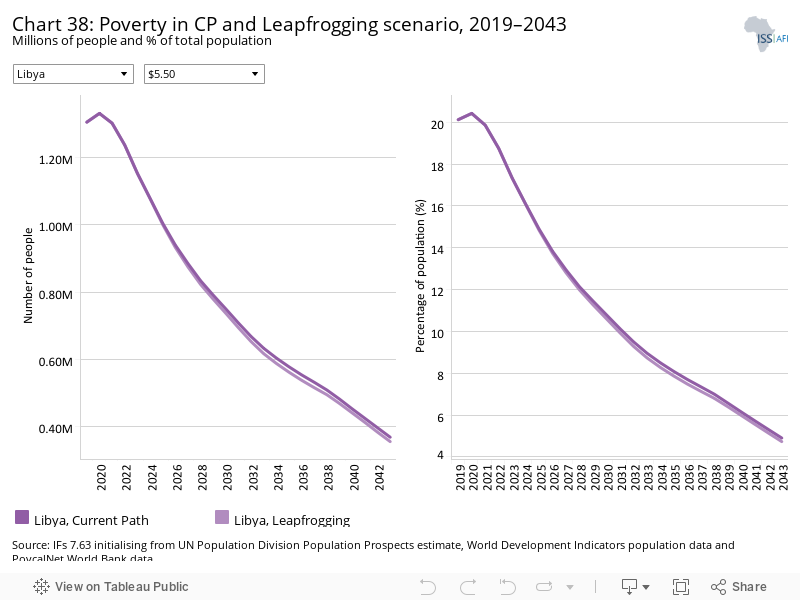
Together with other countries in North Africa, Libya met the goal of eliminating extreme poverty (using US$1.90) in 2018. However, using US$5.50 for upper middle-income countries, 1.3 million Libyans (20.12%) lived in extreme poverty in 2019; this number will decline to 369 000 (4.9%) in 2043 in the Current Path forecast. This forecast likely underestimates the impact of recent levels of instability.
In the Leapfrogging scenario, the number of people living below US$5.50 declines marginally to 356 000 (4.73% of the population) in 2043 — far below the average of 39.7% for upper middle-income countries in Africa.
The Free Trade scenario represents the impact of the full implementation of the African Continental Free Trade Area (AfCFTA) by 2034 through increases in exports, improved productivity and increased trade and economic freedom.
The intervention is explained here in the thematic part of the website.
The trade balance is the difference between the value of a country's exports and its imports. A country that imports more goods and services than it exports in terms of value has a trade deficit, while a country that exports more goods and services than it imports has a trade surplus.
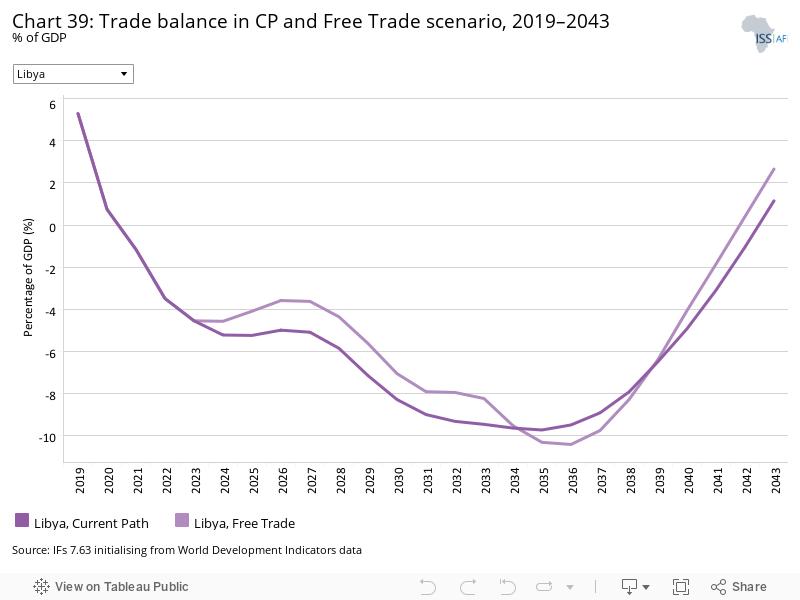
The Maghreb is the least economically integrated bloc in the world with a share of intra-regional trade of only around 5% of total trade.
Because of its oil largesse, Libya has been able to run a consistent trade surplus for many years. In 2019, it was at 5.29% of GDP, and will decline to −9.72% of GDP in 2035 before recovering to 1.15% of GDP in 2043. Libya is not integrated into global value chains, reflected in its status as an observer, and not a member, of the World Trade Organization (WTO). Its accession negotiations started in 2004 but have stalled. Libya also does not have an Association Agreement with the EU, in spite of its proximity to Europe. The EU and Libya started negotiations for a Framework Agreement on trade in 2008, but they were suspended in 2011 due to the events around the Arab Spring.
In the Free Trade scenario, Libya’s trade deficit bottoms out at −10.42% of GDP in 2036 and recovers to a surplus of 2.66% in 2043.
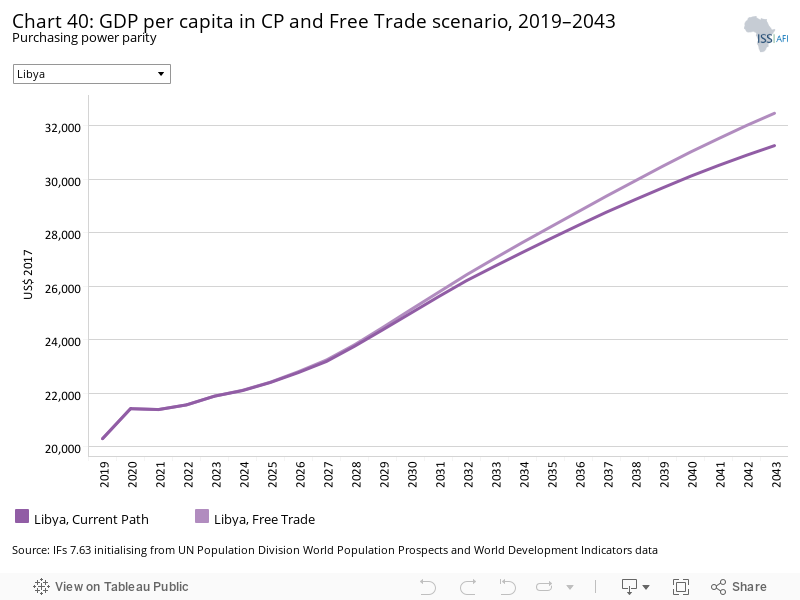
Since the start of conflict in 2011, estimates of GDP per capita for Libya have gyrated wildly from year to year and between agencies. The last data in IFs is for 2019, at which point Libya had the third highest GDP per capita in Africa at US$20 296. According to the World Bank, GDP per capita plunged in 2020, and therefore the number presented in this chart needs to be treated with extreme caution.
In the Current Path forecast, GDP per capita in Libya will increase to US$31 250 in 2043 — still ranked as the third highest in Africa, bested only by Equatorial Guinea and Seychelles. In the Free Trade scenario, GDP per capita reaches US$32 460 in 2043, 4% above the Current Path forecast for that year and 83% higher than the average for upper middle-income countries in Africa.
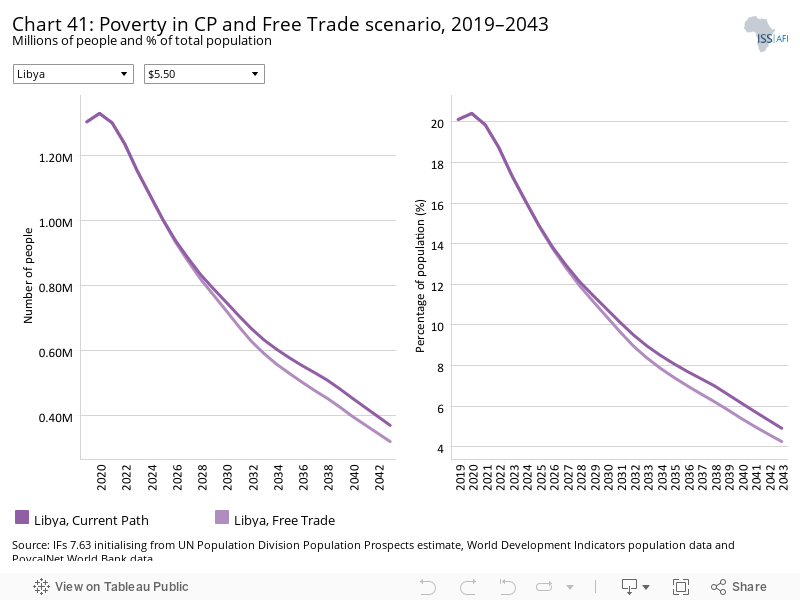
Together with other countries in North Africa, Libya met the goal of eliminating extreme poverty (using US$1.90) in 2018. However, using US$5.50 for upper middle-income countries, 1.3 million Libyans (20.12%) lived in extreme poverty in 2019; this number will decline to 369 000 (4.9%) in 2043 in the Current Path forecast. This forecast likely underestimates the impact of recent levels of instability.
The Free Trade scenario reduces extreme poverty in Libya to 4.3% of the population, equivalent to 50 000 fewer people, in 2043, compared to the Current Path. The extreme poverty rate in the Free Trade scenario will also be 35.4 percentage points below the average for upper middle-income countries in Africa.
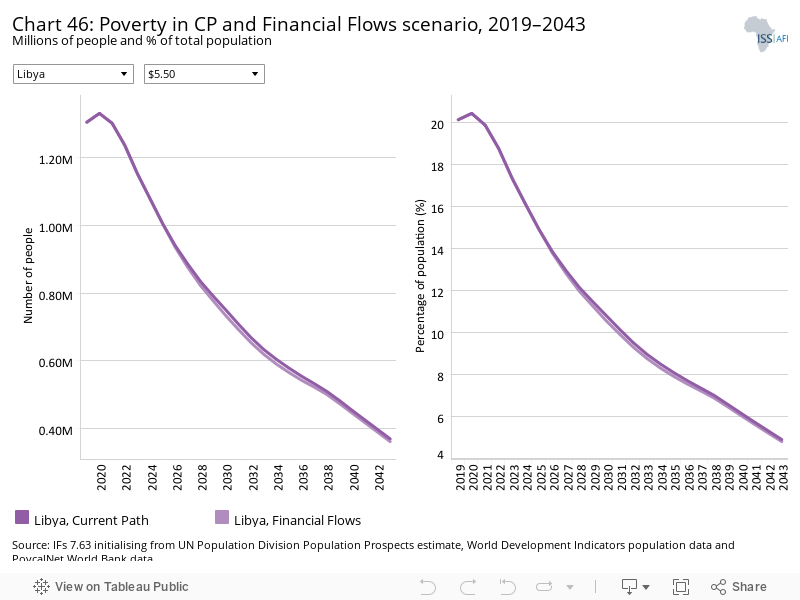
The Financial Flows scenario represents a reasonable but ambitious increase in worker remittances and aid flows to poor countries, and an increase in the stock of foreign direct investment (FDI) and additional portfolio investment inflows to middle-income countries. We also reduced outward financial flows to emulate a reduction in illicit financial outflows.
The intervention is explained here in the thematic part of the website.
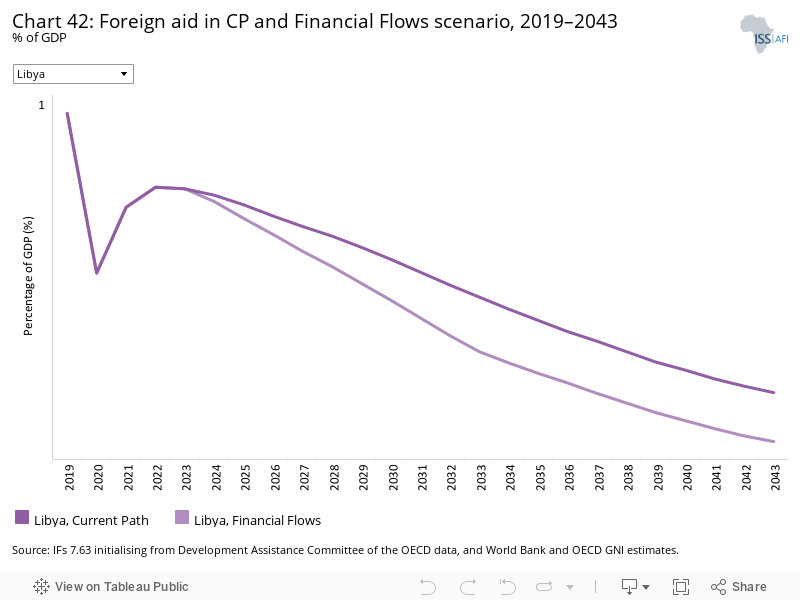
Libya’s status as an oil-rich, upper middle-income country, its anti-Western stance and support of radical and terrorist groupings under the 42-year leadership of Muamar Ghaddafi meant that it received little aid from Western donors. In 2019, foreign aid represented 0.82% of GDP (US$603 million) and the IFs Current Path forecast is that it will decline to 0.47% of GDP (US$844 million) in 2043. In the Financial Flows scenario, aid declines to 0.412% of GDP (US$748 million) and is replaced by larger inflows of FDI (see Chart 43). The IFs forecast is that aid to Libya declines more slowly than for other upper middle-income countries in Africa
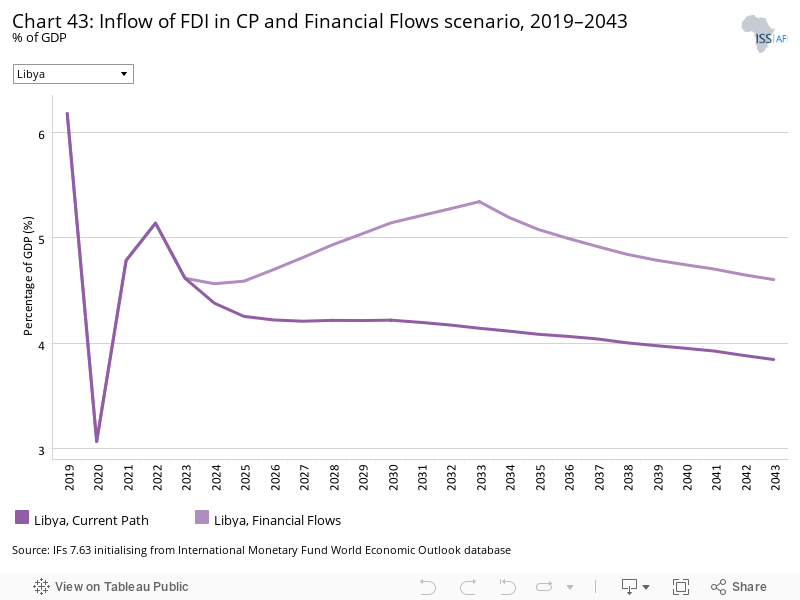
According to the African Economic Outlook, ‘The main impediments to the expansion of the private sector and the flow of FDI are the lack of transparency in the regulations, the level of bureaucracy required to be endured to start up a business and the country’s weak legal system.’ The result is that FDI inflows to Libya were almost exclusively oriented towards its hydrocarbon sector.
In 2019, FDI inflows to Libya amounted to 6.18% of GDP (US$4.54 billion), which is above the average of 2.3% of GDP for upper middle-income African countries. It plummeted in 2020, and recovered to 4.78% (US$3.72 billion) in 2021. In the Current Path forecast, FDI to Libya will amount to 3.84% in 2043 (US$6.86 billion). In the Financial Flows scenario, FDI increases by almost 22% to 4.6% of GDP (US$8.36 billion), still higher than the projected average of 3.2% for upper middle-income countries in Africa.
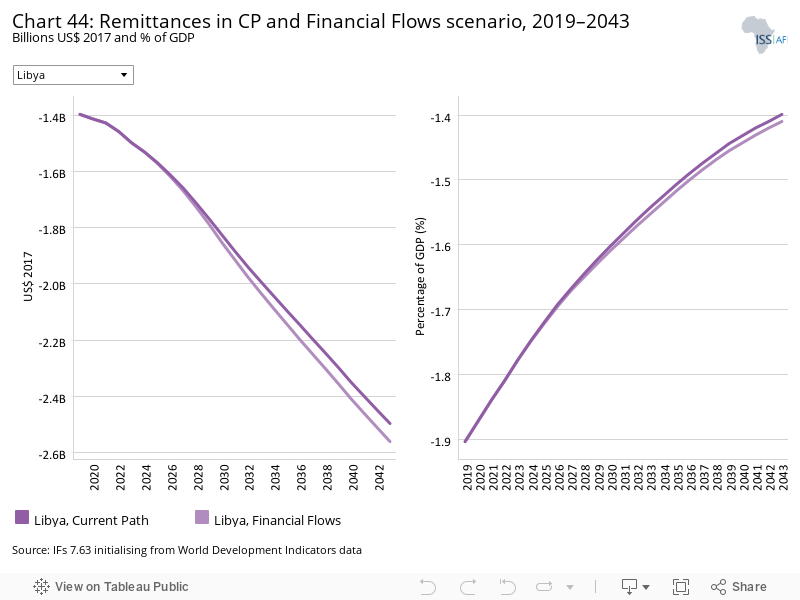
Data for remittances in Libya is poor, but generally the country experiences a net outflow of remittances given its high levels of GDP per capita and large number of migrants within its borders. Within IFs remittance outflows came to −1.9% of GDP in 2019 (US$1.4 billion) and will be −1.4% of GDP (US$2.5 billion) in the 2043 Current Path forecast, with a small increase to −1.41% of GDP (US$2.56 billion) in the Financial Flows scenario.
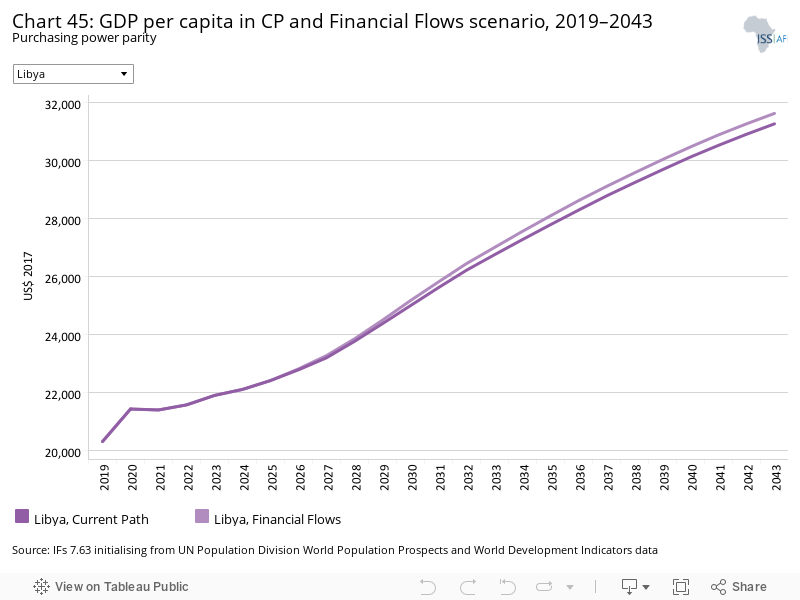
Since the start of conflict in 2011, estimates of GDP per capita for Libya have gyrated wildly from year to year and between agencies. The last data in IFs is for 2019, at which point Libya still had the third highest GDP per capita in Africa at US$20 296. According to the World Bank, GDP per capita plunged in 2020, and therefore the number presented in this chart must be considered to be provisional.
In the Current Path forecast, GDP per capita in Libya will increase to US$31 250 in 2043 — still ranked as the third highest in Africa, bested only by Equatorial Guinea and Seychelles. In the Financial Flows scenario, GDP per capita will increase to US$31 610, 1.2% above the Current Path forecast and 78% more than the average for upper middle-income countries in Africa.
Trade openness will reduce poverty in the long term after initially increasing it due to the redistributive effects of trade. Most African countries export primary commodities and low-tech manufacturing products, and therefore a continental free trade agreement (AfCFTA) that reduces tariffs and non-tariff barriers across Africa will increase competition among countries in primary commodities and low-tech manufacturing exports. Countries with inefficient, high-cost manufacturing sectors might be displaced as the AfCFTA is implemented, thereby pushing up poverty rates. In the long term, as the economy adjusts and produces and exports its comparatively advantaged (lower relative cost) goods and services, poverty rates will decline.
Together with other countries in North Africa, Libya met the goal of eliminating extreme poverty (using US$1.90) in 2018. However, using US$5.50 for upper middle-income countries, 1.3 million Libyans (20.12%) lived in extreme poverty in 2019; this number will decline to 369 000 (4.9%) in 2043 in the Current Path forecast. This forecast likely underestimates the impact of recent levels of instability.
In the Financial Flows scenario, extreme poverty rate in Libya will be reduced to 4.8% of the population, translating into 10 000 fewer poor people than the Current Path — more than eight times lower than the average for upper middle-income countries in Africa.
The Infrastructure scenario represents a reasonable but ambitious increase in infrastructure spending across Africa, focusing on basic infrastructure (roads, water, sanitation, electricity access and ICT) in low-income countries and increasing emphasis on advanced infrastructure (such as ports, airports, railway and electricity generation) in higher-income countries.
Note that health and sanitation infrastructure is included as part of the Health/WaSH scenario and that ICT infrastructure and more rapid uptake of renewables are part of the Leapfrogging scenario. The interventions there push directly on outcomes, whereas those modelled in this scenario increase infrastructure spending, indirectly boosting other forms of infrastructure, including that supporting health, sanitation and ICT.
The intervention is explained here in the thematic part of the website..
Libya has provided electricity access to all of its population, urban and rural, for several decades, and the Infrastructure scenario has no impact on electricity access.
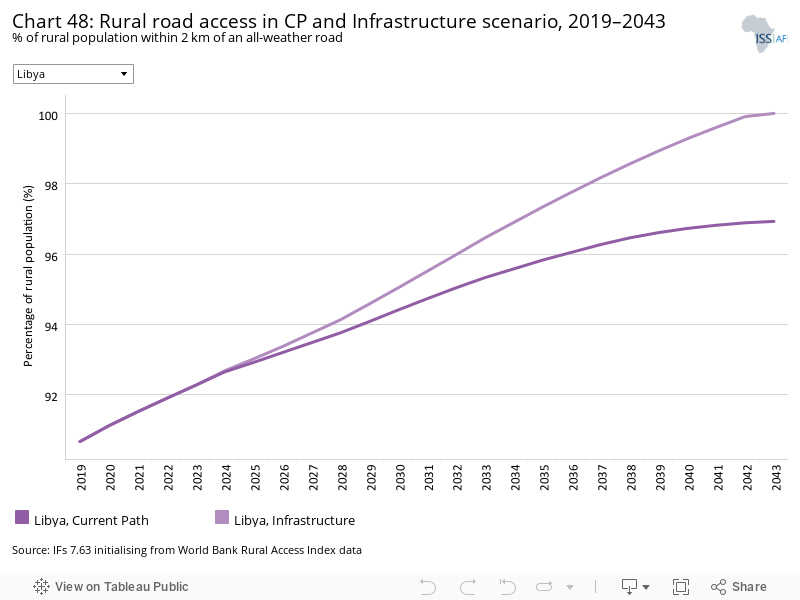
Indicator 9.1.1 in the Sustainable Development Goals refers to the proportion of the rural population who live within 2 km of an all-season road and is captured in the Rural Access Index.
Because of its generally arid climate, Libya has Africa’s second highest portion of its population in urban areas at 82% (representing 5.3 million people) and is close to saturation level. By 2043, more than 84% of Libya’s population will be urban (4.9 million people). Hence, in 2019, 90.7% of Libya’s rural population lived within 2 km of an all-season road and access rates were the third highest in Africa and 7.2 percentage points above the average for upper middle-income countries in Africa.
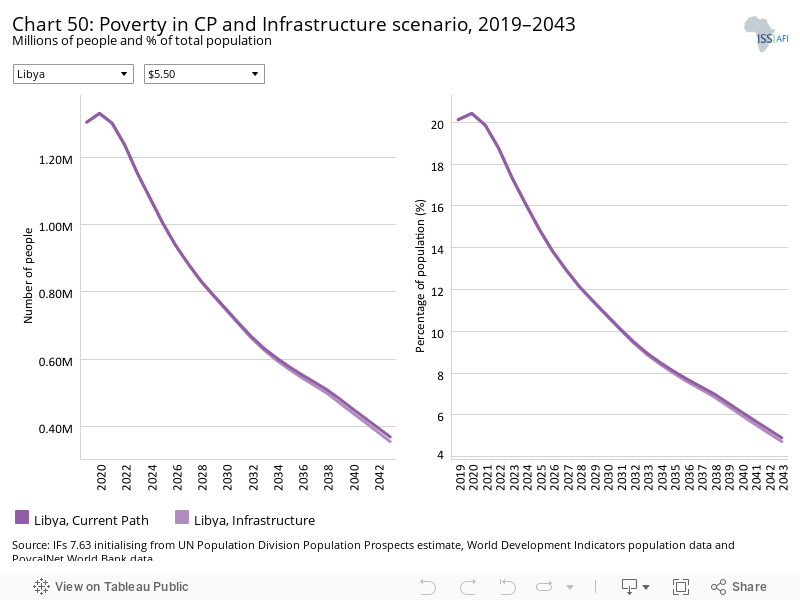
In the Current Path forecast, the portion of the rural population within 2 km from an all-weather road increases to 96.9% in 2043 and to 100% in the Infrastructure scenario.
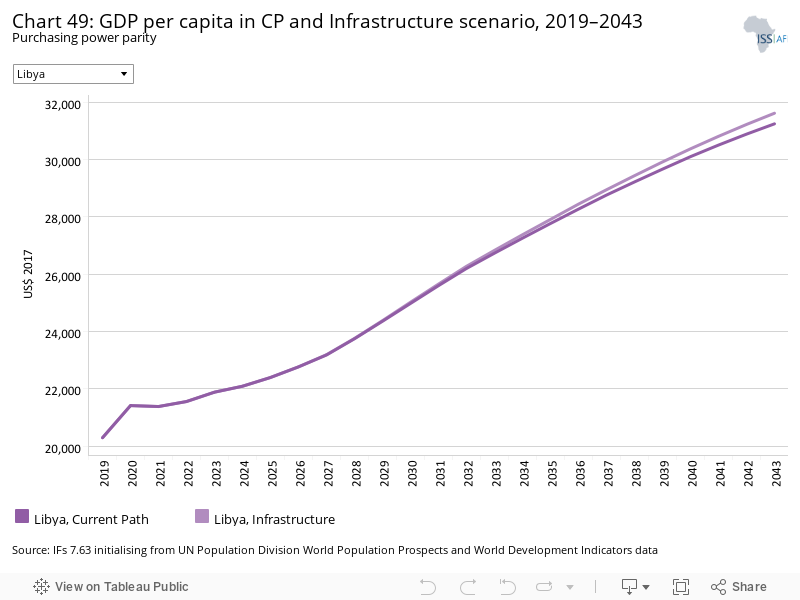
Since the start of conflict in 2011, estimates of GDP per capita for Libya have gyrated wildly from year to year and between data providers. The last data in IFs is for 2019, at which point Libya had the third highest GDP per capita in Africa at US$20 296. According to the World Bank, GDP per capita plunged in 2020, and therefore the number presented in this chart must be treated with extreme caution.
In the Current Path forecast, GDP per capita in Libya will increase to US$31 250 in 2043 — still ranked as the third highest in Africa, bested only by Equatorial Guinea and Seychelles. The Infrastructure scenario will raise GDP per capita to US$31 621 which will be US$371 more than the Current Path and 78% more than the average for upper middle-income African countries.
Together with other countries in North Africa, Libya met the goal of eliminating extreme poverty (using US$1.90) in 2018. However, using US$5.50 for upper middle-income countries, 1.3 million Libyans (20.12%) lived in extreme poverty in 2019; this number will decline to 369 000 (4.9%) in 2043 in the Current Path forecast. This forecast likely underestimates the impact of recent levels of instability.
In the Infrastructure scenario, extreme poverty rate in Libya will be reduced to 4.7% of the population, comparable to 10 000 fewer poor people than the Current Path and over eight times lower than the average for upper middle-income countries in Africa.
The Governance scenario represents a reasonable but ambitious improvement in accountability and reduces corruption, and hence improves the quality of service delivery by government.
The intervention is explained here in the thematic part of the website.
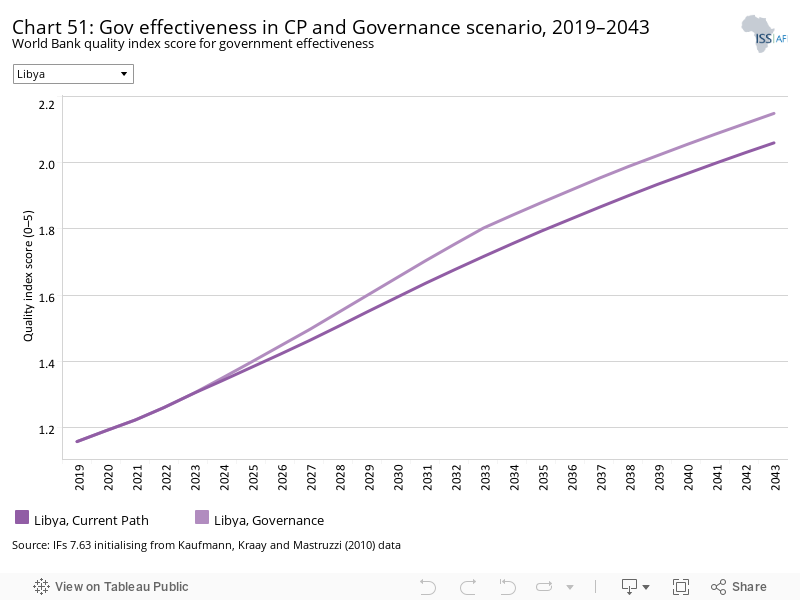
As defined by the World Bank, government effectiveness ‘captures perceptions of the quality of public services, the quality of the civil service and the degree of its independence from political pressures, the quality of policy formulation and implementation, and the credibility of the government’s commitment to such policies’.
Chart 51 presents the impact of the interventions in the Governance scenario on government effectiveness.
Libya has been without a national government since 2011 when Muamar Gaddafi was overthrown and killed shortly as the Arab Spring washed over much of North Africa. The country has been unstable since.
Parliamentary elections in 2012 and an agreement to form a national unity government in 2015 have not been able to halt growing insecurity and Libya’s descent into a civil war destabilised large parts of the Sahel through the spread of arms and fighters. By 2014, two rival authorities claimed to govern Libya, each backed by a number of African and non-African countries. An October 2020 ceasefire agreement was followed by the establishment of a Government of National Unity several months later but national elections, originally scheduled for December 2021, have been repeatedly postponed. Instead, various factions control parts of the country and have been engaged in extensive armed conflict that has involved thousands of mercenaries from outside the country as well as the provision of weaponry.
The transition from an authoritarian regime to stable democracy has stalled and Libya is trapped in instability — technically with a hybrid (or anocratic) regime type but more practically with vast areas under the control of opposing armed groups.
Recent years have therefore seen a steady decline in government effectiveness in Libya with the rate declining from 1.7 in 2004 to 0.6 in 2016, also the last year of the data within IFs. The Current Path forecast is that Libya will regain its 2004 score of 1.7 in 2032 and, by 2043, will rank 34th in government effectiveness in Africa. The Governance scenario will improve government effectiveness by more than 4% above the Current Path forecast of 2.06 in 2043. Throughout the forecast period, Libya’s score on the government effectiveness index remains below the average for the upper middle-income countries in Africa.
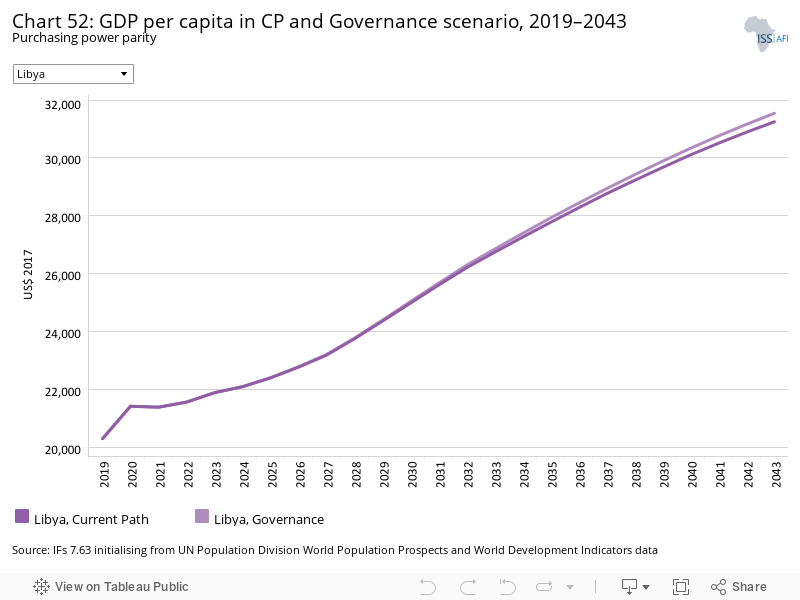
Since the start of conflict in 2011, estimates of GDP per capita for Libya have gyrated wildly from year to year and between agencies. The last data in IFs is for 2019, at which point Libya had the third highest GDP per capita in Africa at US$20 296. According to the World Bank, GDP per capita plunged in 2020, and therefore the number presented in this chart needs to be treated with caution.
In the Current Path forecast, GDP per capita in Libya will increase to US$31 250 in 2043 — still ranked as the third highest in Africa, bested only by Equatorial Guinea and Seychelles. In the Governance scenario, GDP per capita increases above the Current Path projections to US$31 545 in 2043, though it is likely an underestimation of the effect of improved governance on incomes.
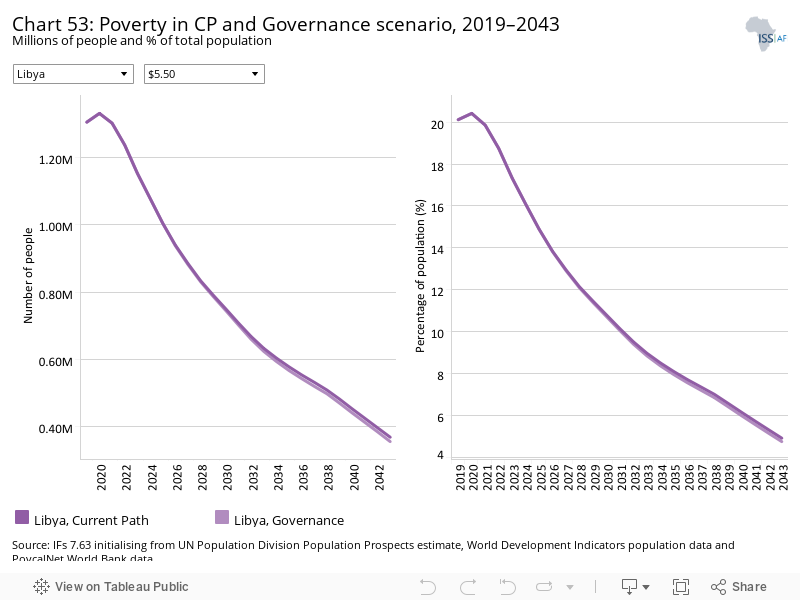
Together with other countries in North Africa, Libya met the goal of eliminating extreme poverty (using US$1.90) in 2018. However, using US$5.50 for upper middle-income countries, 1.3 million Libyans (20.12%) lived in extreme poverty in 2019; this number will decline to 369 000 (4.9%) in 2043 in the Current Path forecast. This forecast likely underestimates the impact of recent levels of instability.
In the Governance scenario, 4.7% of Libya’s population will live below the US$5.50 extreme poverty line, equivalent to 356 000 people, in 2043. This will be below the average extreme poverty rate of 39.7% for upper middle-income countries in Africa.
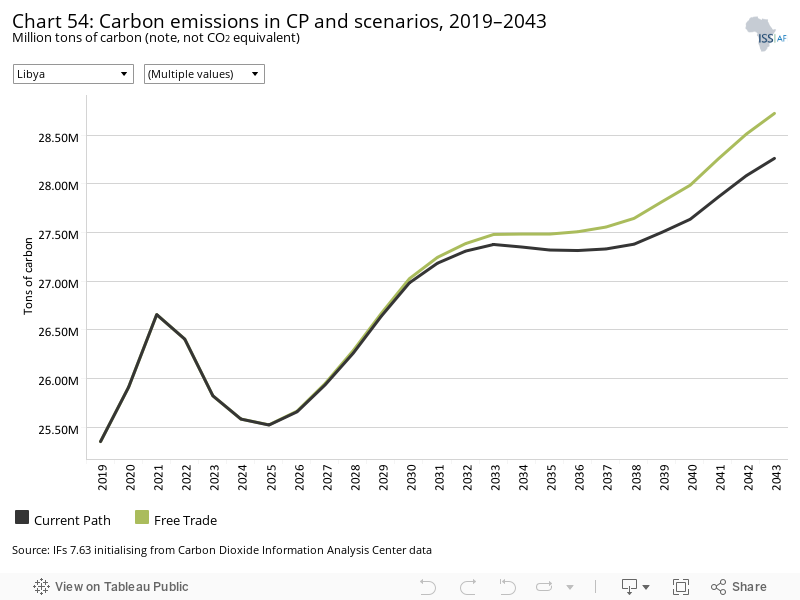
This section presents projections for carbon emissions in the Current Path for Libya and the 11 scenarios. Note that IFs uses carbon equivalents rather than CO2 equivalents.
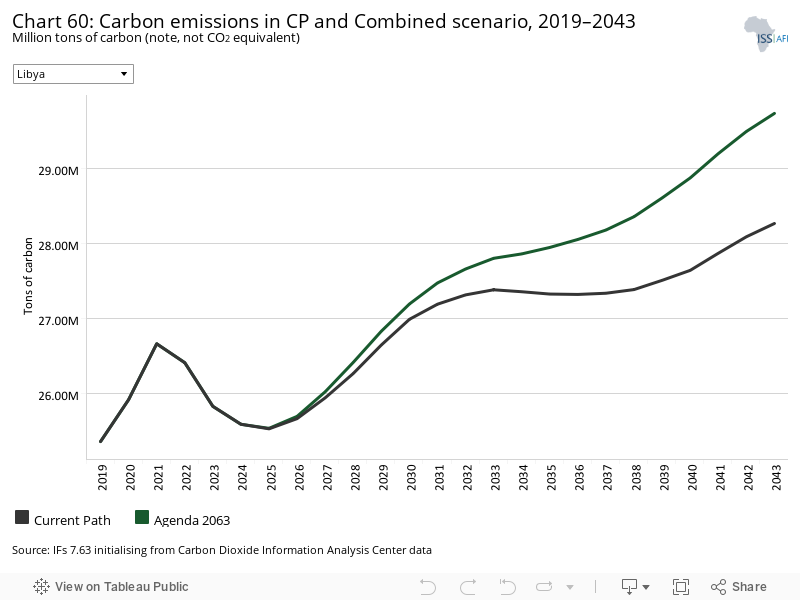
Due to its large oil and gas activities, the estimate within IFs is that Libya was the fifth largest carbon emitter in Africa in 2019, releasing 25 million tons of carbon, and is forecast to increase to 28.3 million tons in 2043 in the Current Path forecast. At that point, Libya will be the eighth largest carbon emitter on the continent. Ignoring the Stability scenario for the purposes of this analysis, of the remaining ten scenarios, the Free Trade scenario releases the most carbon in 2043. It is also the scenario that results in the largest GDP. The Health/WaSH will be the least carbon intensive scenario by 2043.
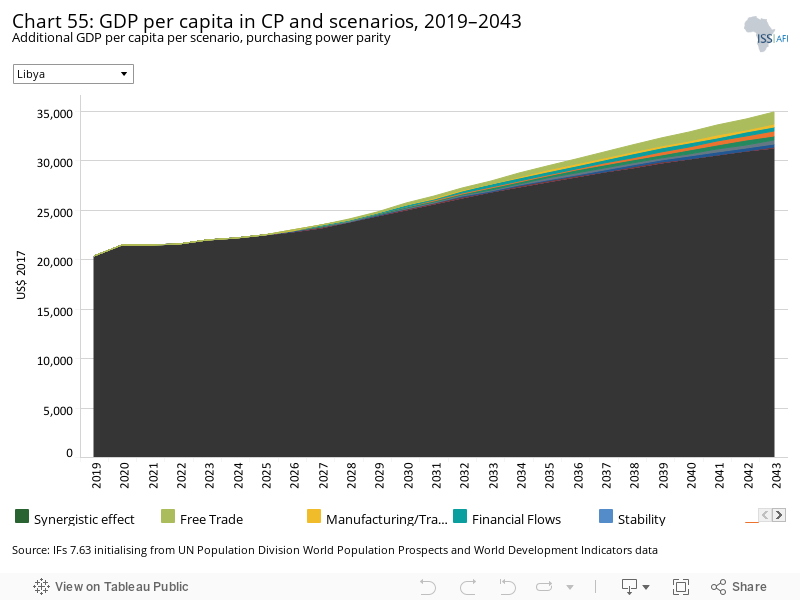
The Combined Agenda 2063 scenario consists of the combination of all 11 sectoral scenarios presented above, namely the Stability, Demographic, Health/WaSH, Agriculture, Education, Manufacturing/Transfers, Leapfrogging, Free Trade, Financial Flows, Infrastructure and Governance scenarios. The cumulative impact of better education, health, infrastructure, etc. means that countries get an additional benefit in the integrated IFs forecasting platform that we refer to as the synergistic effect. Chart 55 presents the contribution of each of these 12 components to GDP per capita in the Combined Agenda 2063 scenario as a stacked area graph.
Because of the ongoing conflict in Libya, the data and forecasts that follow often diverge from other sources and should be considered provisional.
According to the African Economic Outlook, ‘Significant reform programmes, enhanced ability to mobilise external resources and diversification of the economy could — if conditions allow — release growth potential and produce important economic changes for Libya.’ Elsewhere, the report notes that ‘Any new coalition government should immediately focus on the efficiency of the Libyan hydrocarbon sector being more efficient so as to attract the private sector and FDI. There is also a need to diversify the private sector over the long term, which will require the development of creative approaches to support micro and small and medium enterprises (MSMEs). The government needs to focus on job creation to tackle the high level of unemployment, estimated at 19.2%, that is the result of overconcentration in the hydrocarbon sector. In its current condition, the oil industry is not able to absorb excess labour, which leads to rising unemployment and increased informal economic activities.’
The Free Trade scenario results in the largest increase in GDP per capita in 2043 followed by the Education and Leapfrogging scenarios, respectively. The Demographic and Health/WaSH scenarios have the smallest impact on GDP per capita. In the long term, improvement in trade liberalisation together with improvement in education and ICT have the greatest potential to enhance economic growth and development in Libya. Note that a Stability scenario is not included.
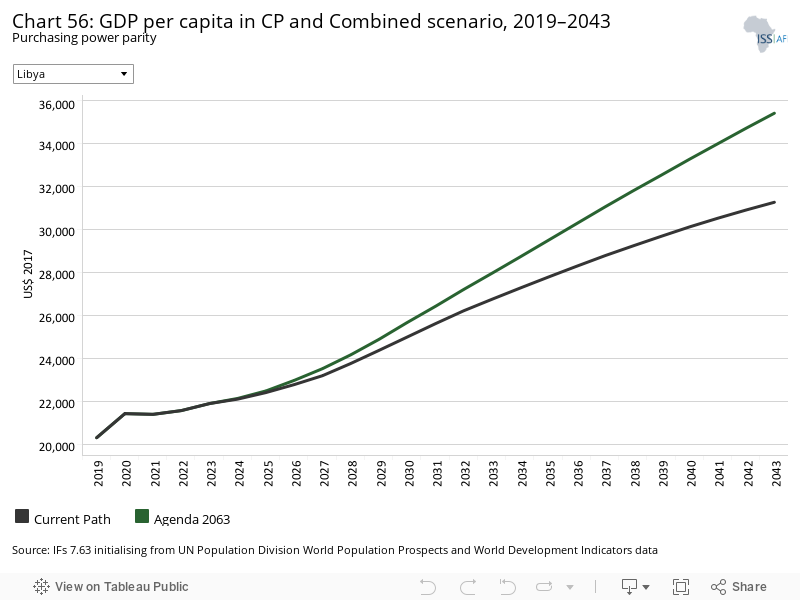
Whereas Chart 55 presents a stacked area graph on the contribution of each scenario to GDP per capita as well as the additional benefit or synergistic effect, Chart 56 presents only the GDP per capita in the Current Path forecast and the Combined Agenda 2063 scenario.
Since the start of conflict in 2011, estimates of GDP per capita for Libya have gyrated wildly from year to year and between agencies. The last data in IFs is for 2019, at which point Libya had the third highest GDP per capita in Africa at US$20 296. According to the World Bank, GDP per capita plunged in 2020. In the Current Path forecast, GDP per capita in Libya will increase to US$31 250 in 2043 — still ranked as the third highest in Africa, bested only by Equatorial Guinea and Seychelles. In the Combined Agenda 2063 scenario, GDP per capita reaches US$35 392 in 2043, more than 14% higher than the Current Path forecast for that year, and almost twice the average of US$35 468 for upper middle-income African countries. The Combined Agenda 2063 shows that a range of policies is needed to ensure economic growth and development in Libya. The forecast excludes the impact of a Stability scenario.
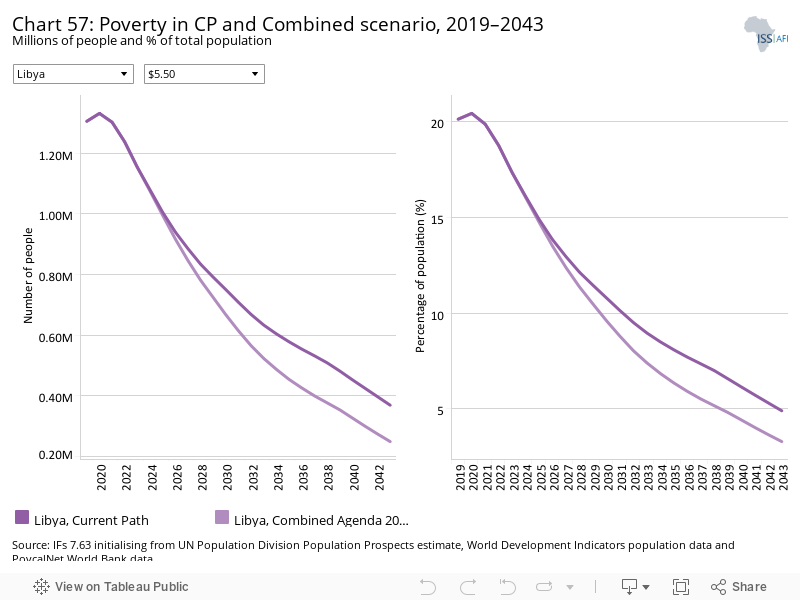
Together with other countries in North Africa, Libya met the goal of eliminating extreme poverty (using US$1.90) in 2018. However, using US$5.50 for upper middle-income countries, 1.3 million Libyans (20.12%) lived in extreme poverty in 2019; this number will decline to 369 000 (4.9%) in 2043 in the Current Path forecast.
In the Combined Agenda 2063 scenario, the number of extremely poor people declines to 248 700 (3.3%) in 2043, 36.4 percentage points less than the average for upper middle-income countries in Africa. It means that the Combined Agenda 2063 scenario could lift over 120 000 people out of extreme poverty in Libya. The scenario shows that a policy push across sectors in Libya could positively impact poverty reduction in the country. This forecast excludes the impact of a Stability scenario.
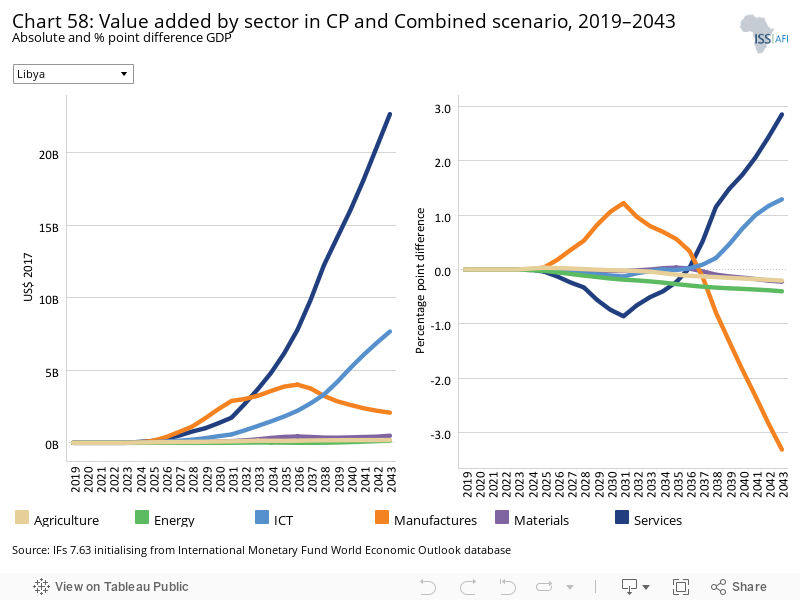
See Chart 8 to view the Current Path forecast of the sectoral composition of the economy.
Because of the growth in the Combined Agenda 2063 scenario, all sectors are larger in absolute size in 2043 compared to the Current Path forecast. The Combined Agenda 2063 results in a service sector that is 2.9% (or US$22.7 billion) larger in 2043 and an ICT sector that is 1.3% (or US$7.7 billion) larger compared to the Current Path. The contributions from other sectors to GDP in 2043 are all lower, with manufacturing at 3.3% smaller (an increase of only US$2.1 billion), energy 0.4% smaller (an increase of only US$140 million), and materials and agriculture each at 0.2% smaller. Note that the Combined Agenda 2063 scenario does not include a Stability scenario.
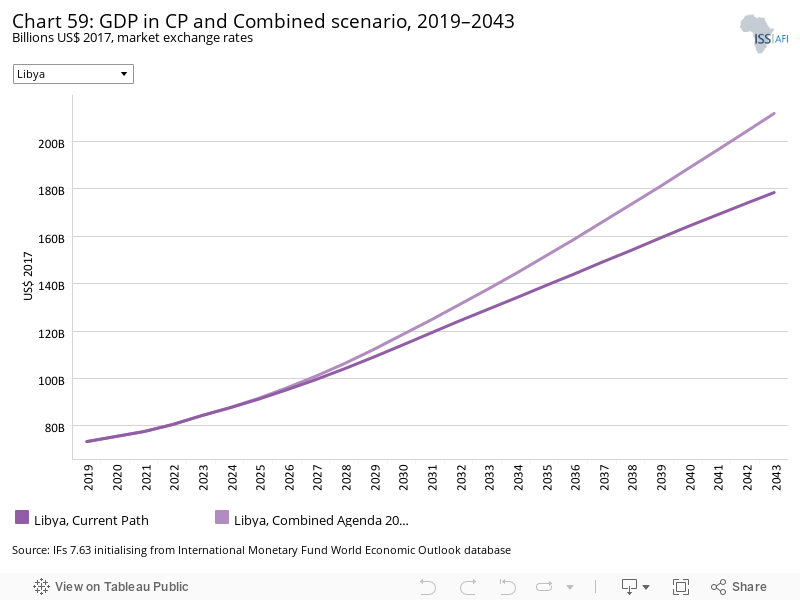
In the Current Path forecast, Libya’s economy will increase to US$178.4 billion in 2043, at which point it will be the 13th largest economy in Africa (with one of Africa’s smallest populations) as it is overtaken in size by other African countries with much more rapidly growing populations. In the Combined Agenda 2063 scenario, the Libyan economy will be US$211.8 billion in size in 2043, which is almost 19% above the Current Path forecast for that year. Note that the Combined Agenda 2063 scenario does not include a Stability scenario.
Page information
Contact at AFI team is Jakkie Cilliers
This entry was last updated on 14 August 2025 using IFs v7.63.
Donors and sponsors


Reuse our work
- All visualizations, data, and text produced by African Futures are completely open access under the Creative Commons BY license. You have the permission to use, distribute, and reproduce these in any medium, provided the source and authors are credited.
- The data produced by third parties and made available by African Futures is subject to the license terms from the original third-party authors. We will always indicate the original source of the data in our documentation, so you should always check the license of any such third-party data before use and redistribution.
- All of our charts can be embedded in any site.
Cite this research
Jakkie Cilliers (2025) Libya. Published online at futures.issafrica.org. Retrieved from https://futures.issafrica.org/geographic/countries/libya/ [Online Resource] Updated 14 August 2025.