 Kenya
Kenya
Feedback welcome
Our aim is to use the best data to inform our analysis. See our Technical page for information on the IFs forecasting platform. We appreciate your help and references for improvements via our feedback form.
This report examines Kenya's current and projected future development. It presents eight sectoral scenarios to forecast progress by 2043, including demographic, economic and infrastructure-related outcomes. The country grapples with challenges such as corruption, infrastructure deficits and rising public debt yet has a resilient and diversified economy, especially through geothermal production. The analysis also considers the implications of the Agenda 2063 goals, aiming to offer insights into policy actions that could enhance Kenya's developmental trajectory and guide it towards a more prosperous future.
For more information about the International Futures modelling platform that we use for the development of the various scenarios, please see About this Site.
Executive Summary
We begin this page with an introductory assessment of Kenya’s context looking at the current population distribution and structure, climate and topography. We also provide an overview of the national development plan.
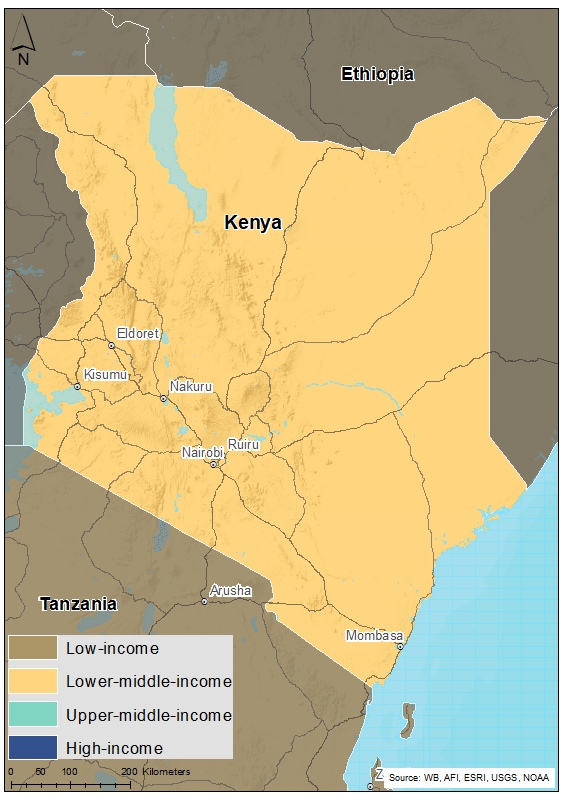
- Kenya, a lower-middle-income country in East Africa, bordered by South Sudan to the north-west, Ethiopia to the north, Somalia to the east, Uganda to the west, Tanzania to the south, and the Indian Ocean to the south-east. As a member of the Intergovernmental Authority on Development (IGAD), the East African Community (EAC) and the Common Market for Eastern and Southern Africa (COMESA), Kenya is a critical commercial hub on the continent.
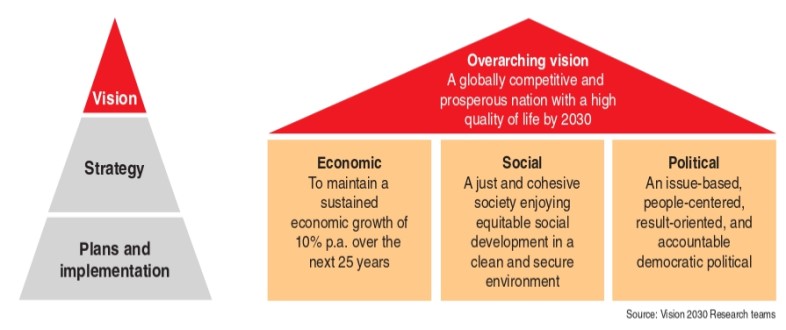
- The country is currently implementing its Vision 2030 launched in 2008 as the long-term development blueprint for the country. It aims to transform Kenya into ‘a newly industrializing, middle-income country providing a high quality of life to all its citizens by 2030 with a GDP growth rate of 10% per annum starting in 2012.
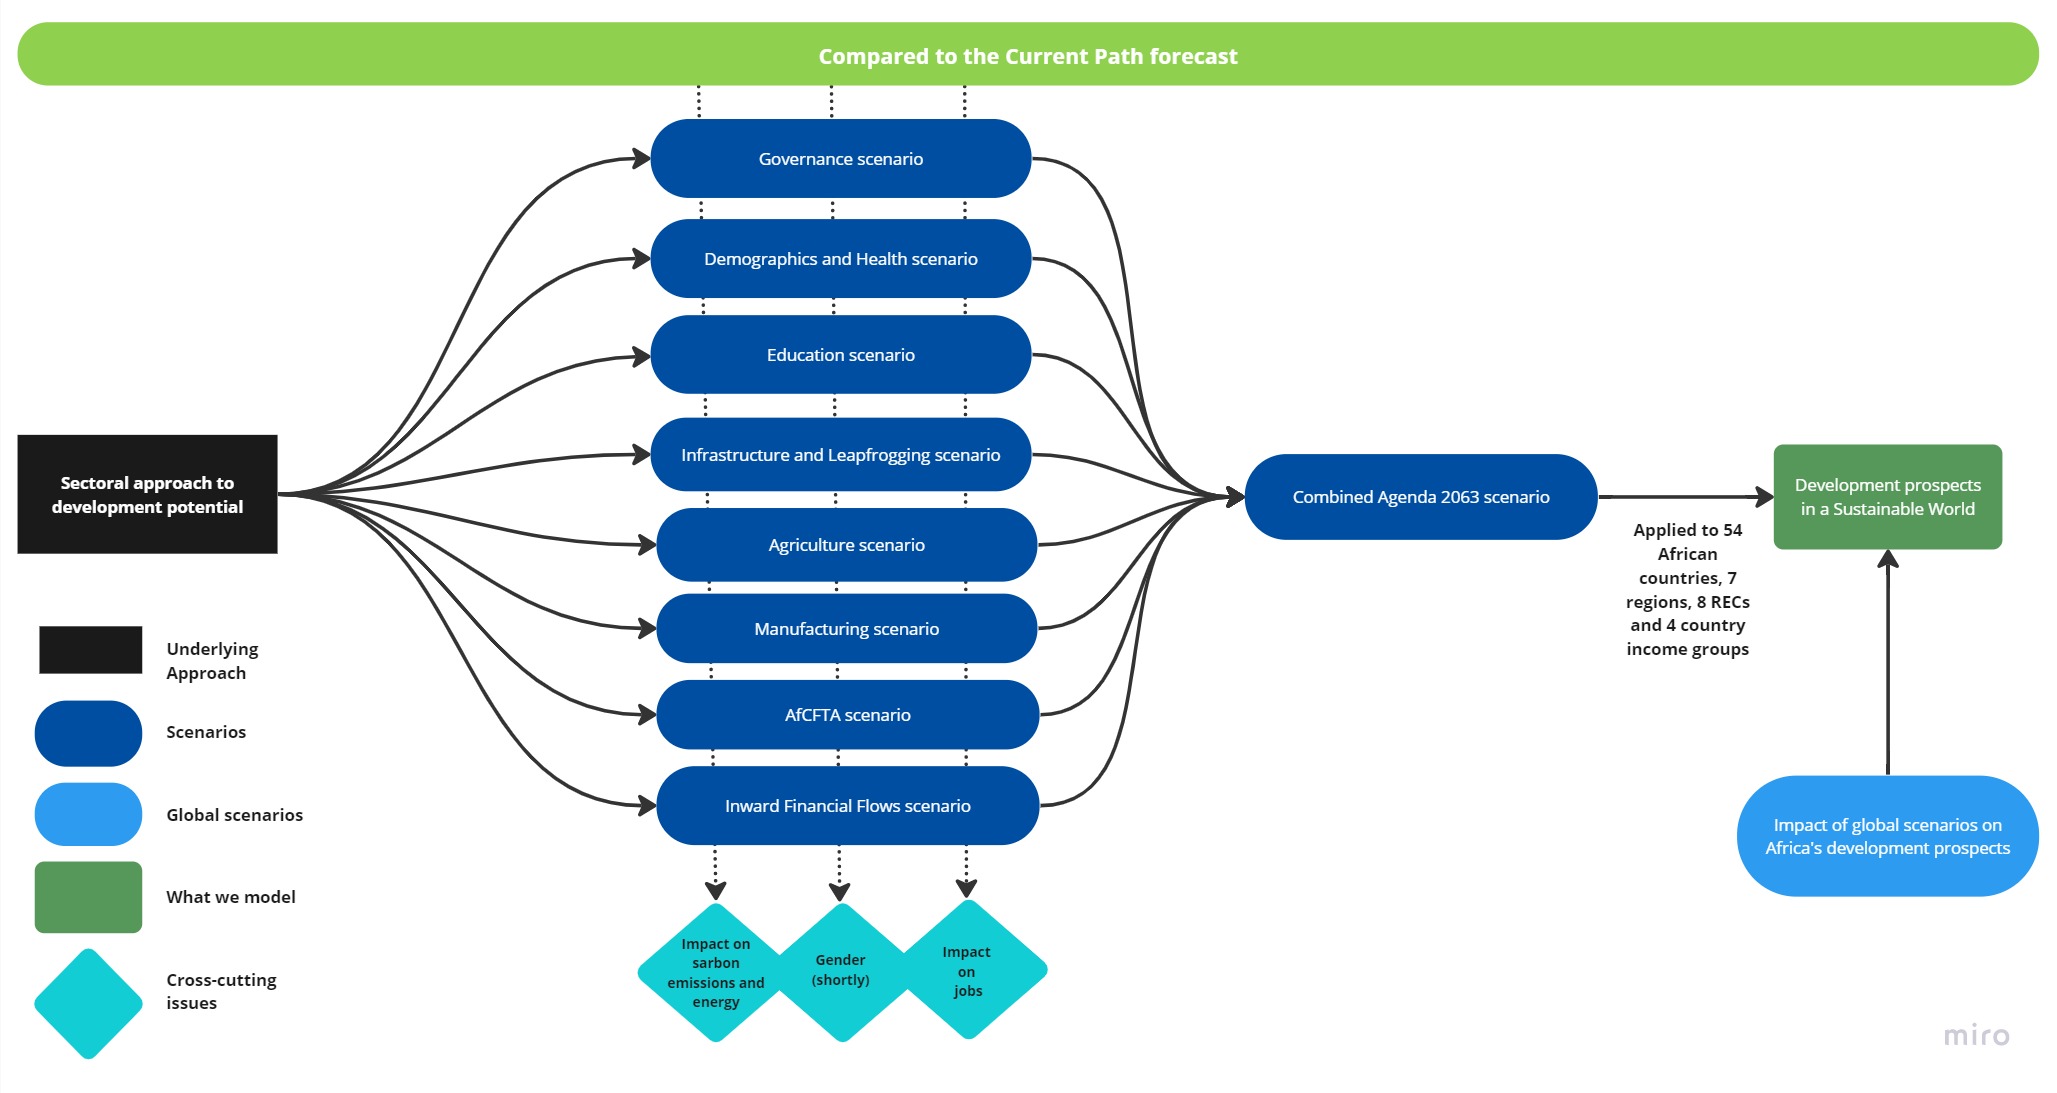
This section is followed by an analysis of the Current Path forecast for Kenya which informs the country’s likely current development trajectory to 2043. It is based on current geopolitical trends and assumes that no major shocks would occur in a ‘business as usual’ future. This section further compares progress on the Current Path with eight sectoral scenarios. These are Demographics and Health; Agriculture; Education; Manufacturing; the African Continental Free Trade Area (AfCFTA); Large Infrastructure and Leapfrogging; Financial Flows; and Governance. Each scenario is benchmarked to present an ambitious but reasonable aspiration in that sector.
- By 2043, the ratio of the working-age population to dependants will be 2.35 to 1 in the Demographics and Health scenario, 20% higher than the Current Path. The Demographics and Health scenario will reduce Kenya’s infant mortality rate to 9.3 deaths per 1 000 live births by 2043 and increase life expectancy to 77.1 years by 2043.
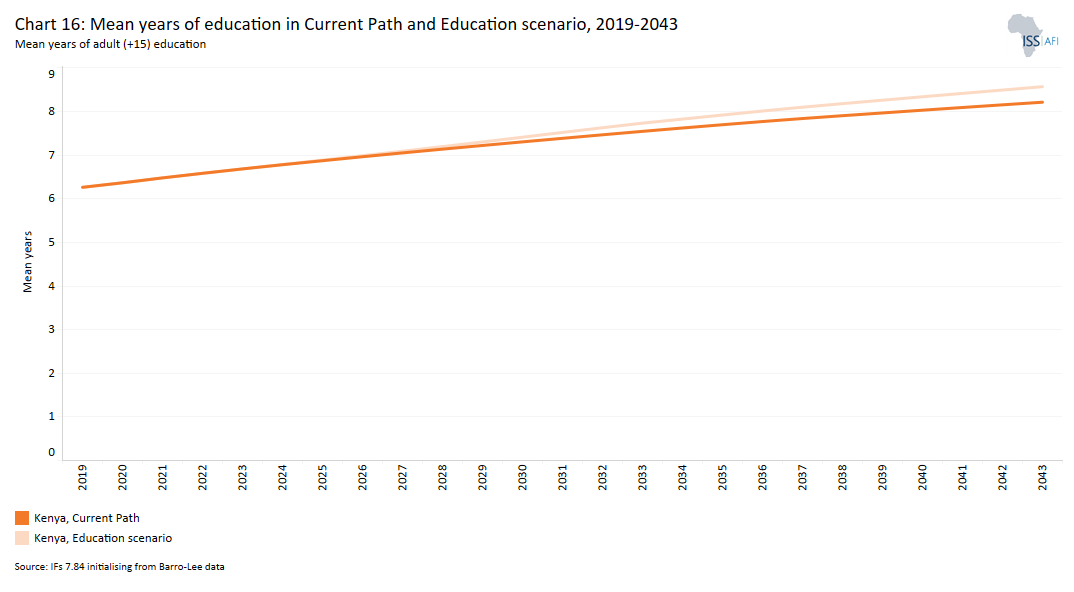
- In the Education scenario, the mean years of adult education will rise to 8.6 by 2043, which will be equal to the average for lower-middle-income countries in Africa and 0.4 years more than on the Current Path. The Education scenario will increase average test scores for primary and secondary learners by 10.3% and 7.5% respectively above the Current Path.
- Based on the Large Infrastructure and Leapfrogging scenario, 96.5% of the population will have access to electricity by 2043, compared with 82.7% of the population in the Current Path. By 2043, only 23.6% of households will use traditional cookstoves in this scenario compared with 35% in the Current Path, whilst 75.1% of households will use modern stoves in this scenario compared with 63.2% in the Current Path.
- In the Agriculture scenario, yield per hectare will increase by 60% above the Current Path to reach 6.7 metric tons by 2043. The scenario further reduces import dependency, such that by 2043 to 24.2% of total agricultural demand instead of the 35% in the Current Path.
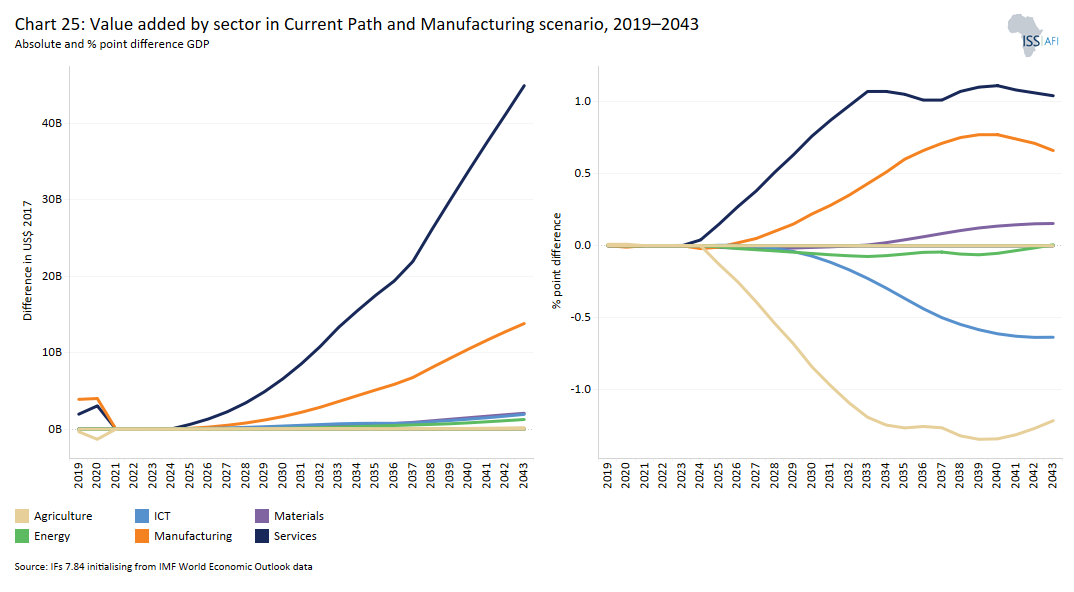
- In the Manufacturing scenario, the manufacturing sector will contribute an additional US$30.9 billion to GDP in 2043, which will be equivalent to 10 percentage points above the Current Path.
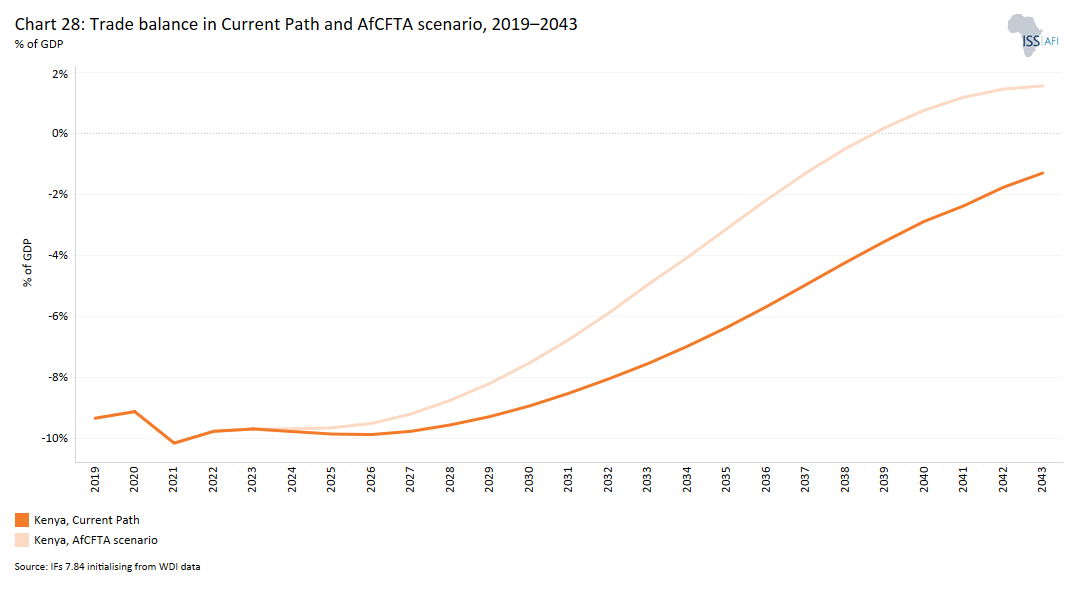
- By 2043, Kenya’s trade deficit in the Current Path will constitute about 1.3% of GDP, whereas in the same year, the AfCFTA scenario will reverse this situation leading to a surplus of 1.6% of GDP.
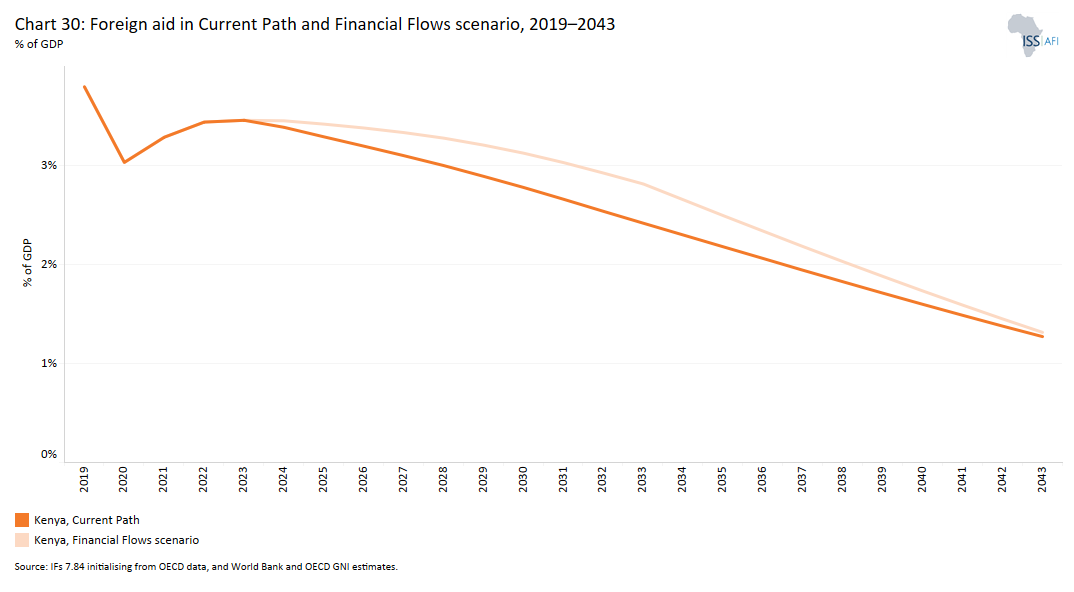
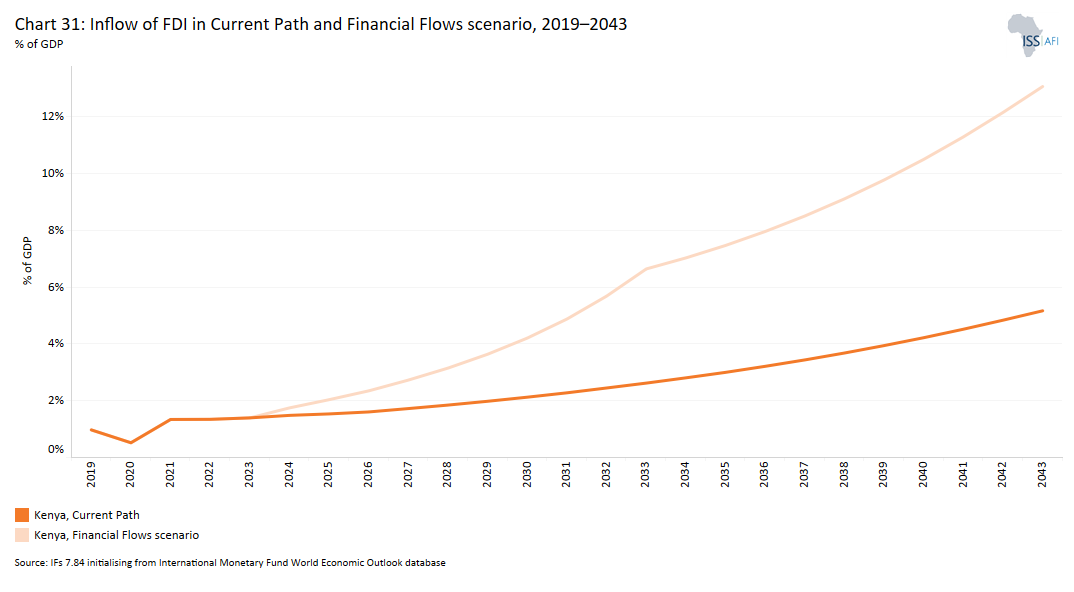
- By 2043, FDI as a percentage of GDP will increase from 1.34% to 4.7% of GDP in the Financial Flows scenario above the projected 2% on the Current Path. Total aid will amount to 1.31% of GDP in the Financial Flows scenario and to 1.27% in the Current Path.
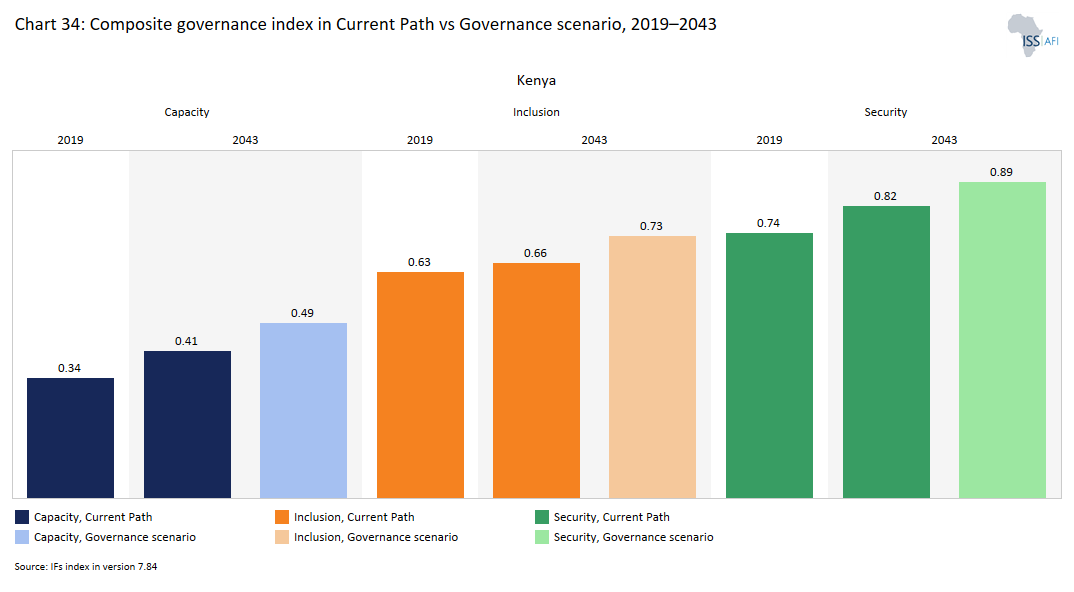
- In the Governance scenario, Kenya's security index score of 0.89 will be 9% above the Current Path by 2043. The scenario will also improve Kenya’s governance inclusion score by 11.4% above the Current Path to reach 0.73 in 2043. Governance capacity will also improve in the scenario by 15% above the Current Path to 0.49 by 2043.
The third section compares the impact of each of the eight sectoral scenarios on key indicators (economy, poverty and inequality, carbon emissions). It then proceeds with a Combined Agenda 2063 scenario analysis (the sum effect of all eight scenarios).
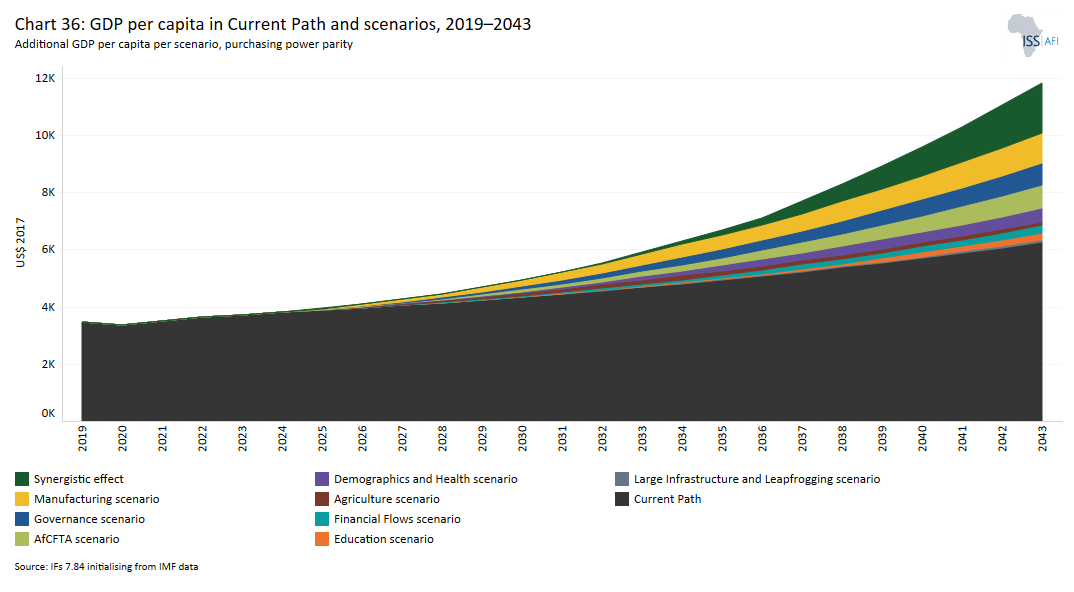
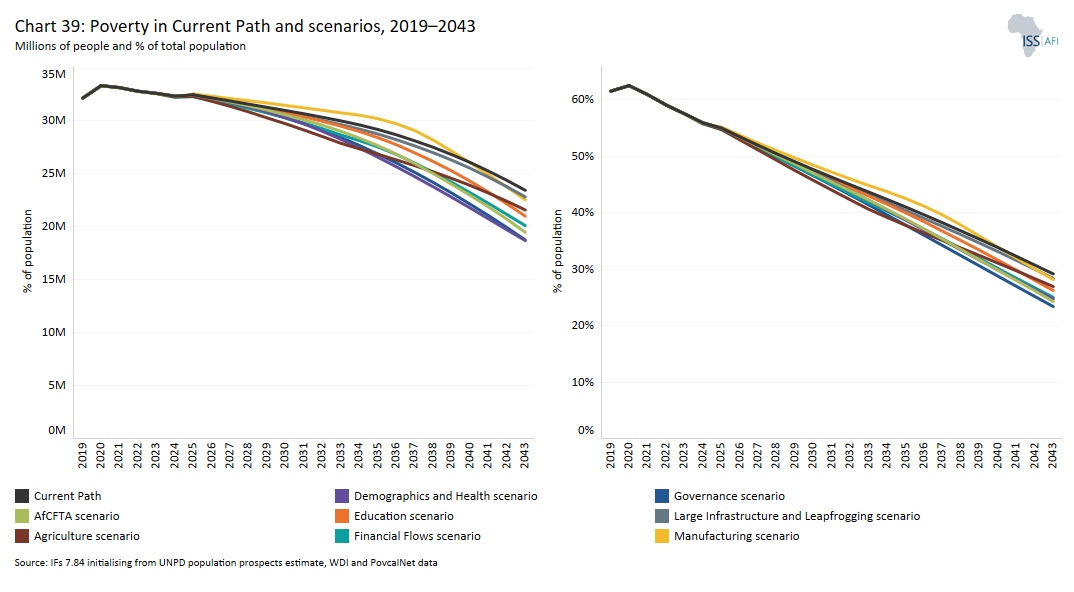
- The scenario with the greatest impact on GDP per capita by 2043 is the AfCFTA scenario, followed by the Government and the Demographics and Health scenarios. Likewise, the Governance scenario has the greatest potential to reduce extreme poverty in Kenya followed by the Demographics and Health and the Education scenarios.
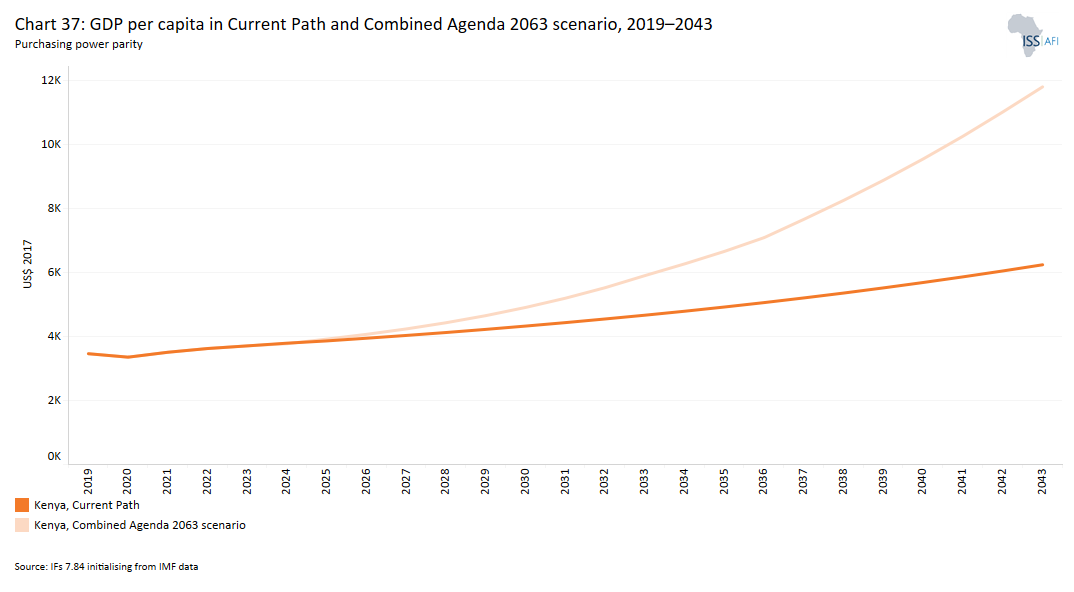
- GDP will rise to US$576.2 billion in the Combined scenario, an increase of 123.1% compared with the Current Path. Kenya’s GDP per capita will increase to US$11 982 by 2043 in the Combined scenario, a 92% improvement over the Current Path.
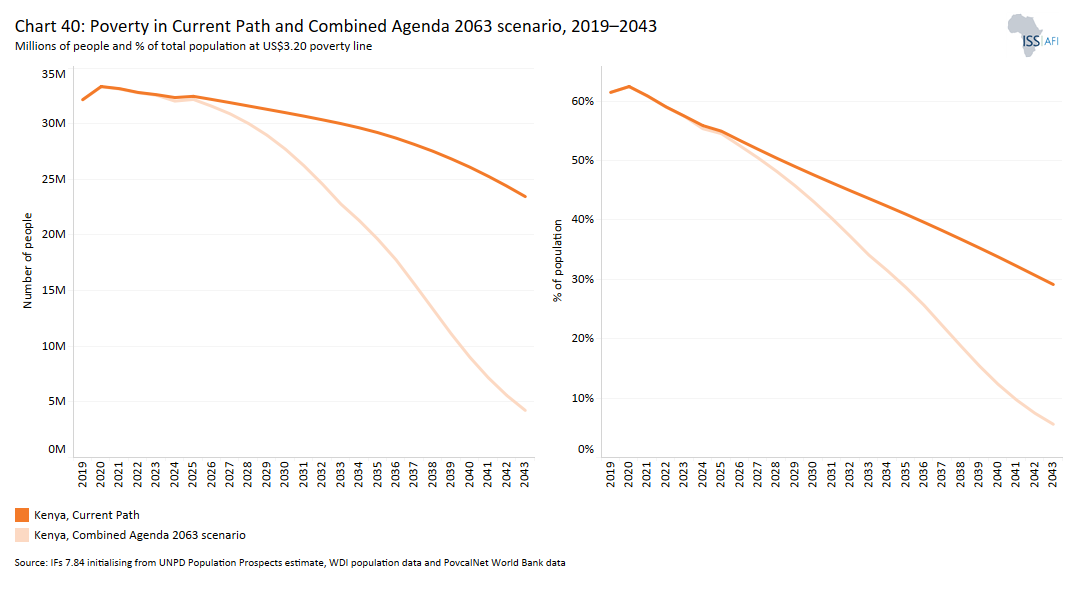
- By 2043, the Combined scenario can lead to 18.6 million fewer poor people in Kenya equivalent to a 22.9 percentage points decline compared with the Current Path. This will result in only 4.9 million people living below the poverty line of US$3.20, constituting 6.2% of the population.
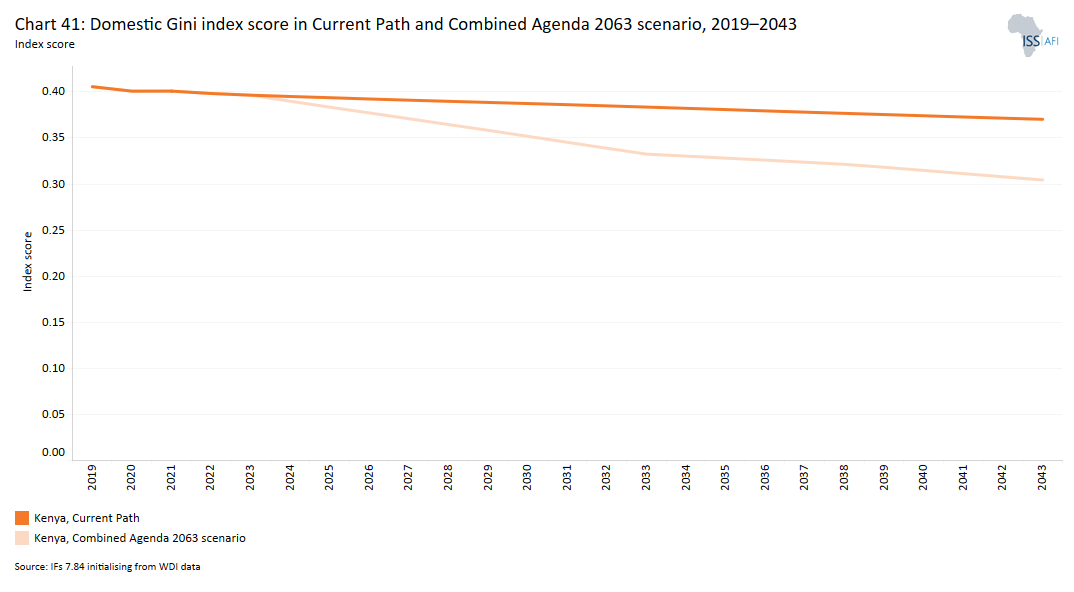
- In the Combined scenario, inequality in Kenya will reduce more rapidly, reaching 0.31 by 2043, a 16.6% reduction relative to the Current Path.
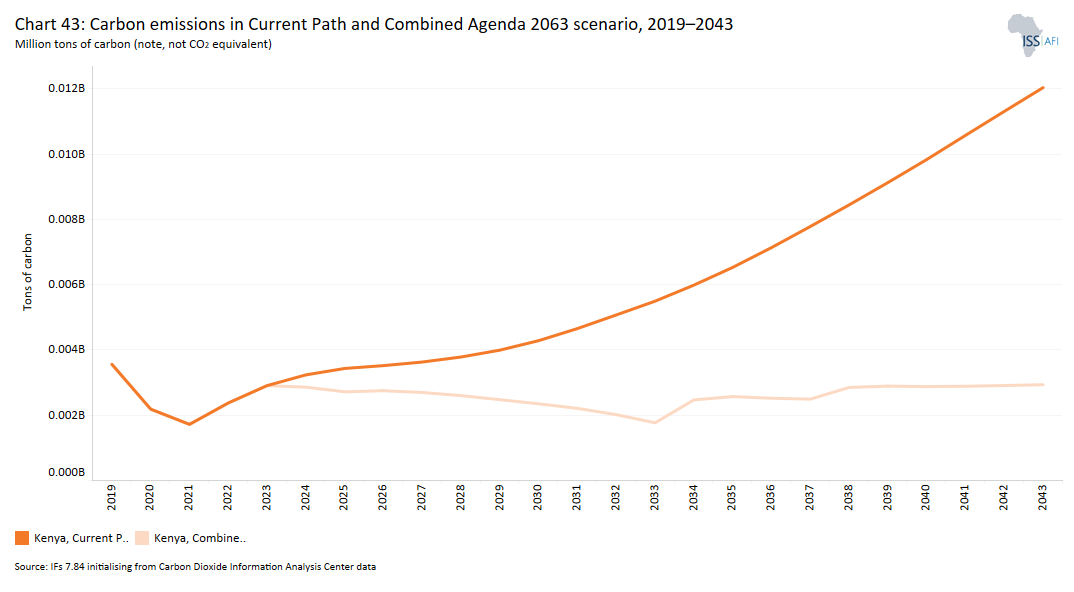
- In the Combined scenario, Kenya’s total carbon emissions of 1.9 million tons will be equal to almost six times less than what is estimated in the Current Path.
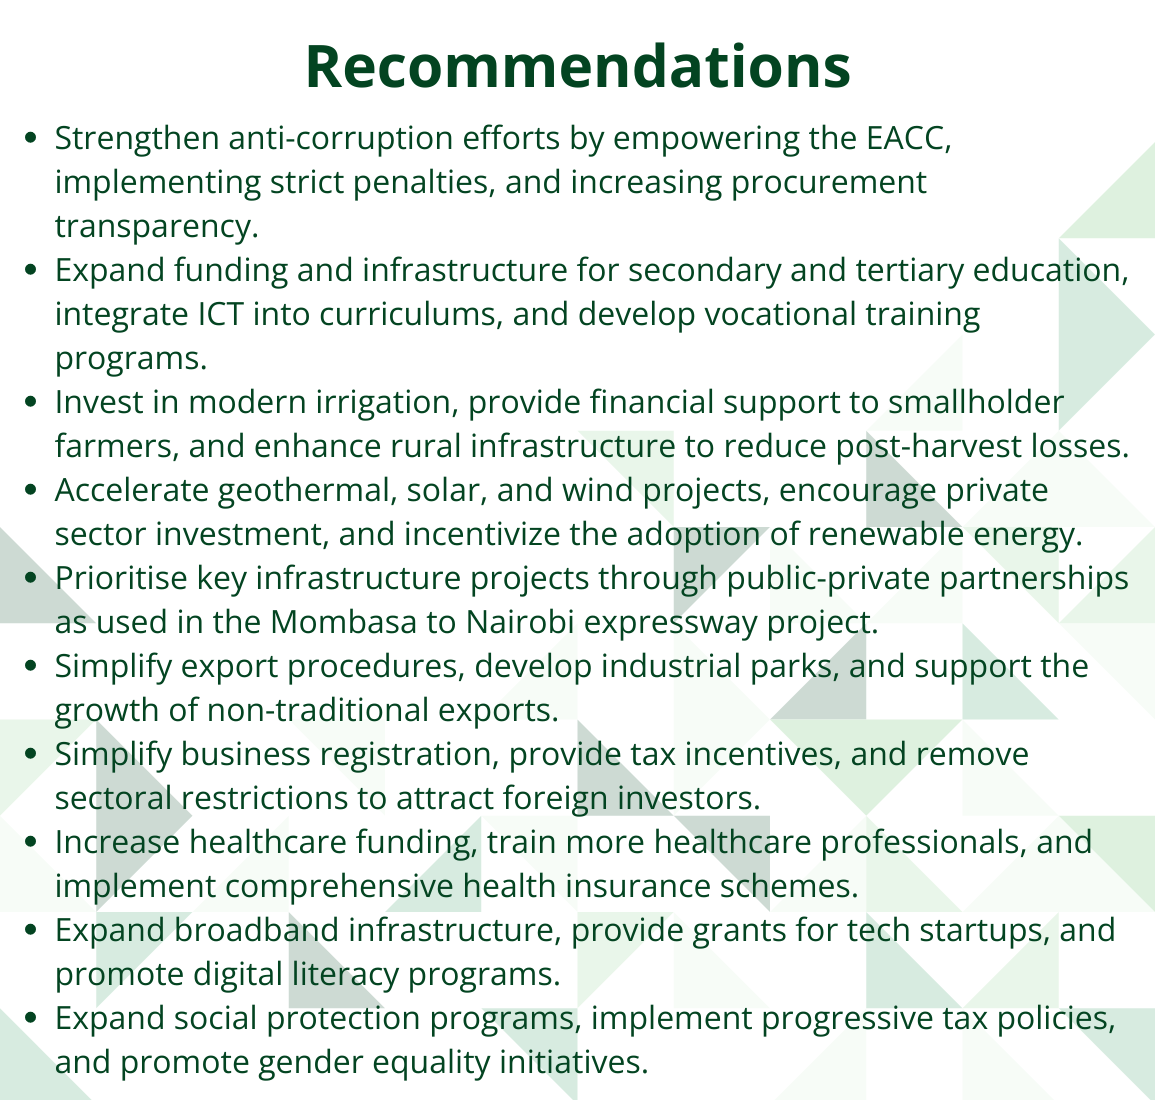
We end this page with a summarising conclusion offering key recommendations for decision-making. Kenya's strategic emphasis on economic reform, infrastructure development and renewable energy positions it well for future growth. However, addressing the underlying issues of poverty, inequality and governance is essential for ensuring that the benefits of growth are broadly shared.
All charts for Kenya Development Futures
- Chart 1: Political map of Kenya
- Chart 2: Population distribution map of Kenya
- Chart 3: Thematic overview of Kenya national development plan
- Chart 4: Diagram of Current Path and sectoral scenarios
- Chart 5: Population structure in Current Path, 1990–2043
- Chart 6: Population distribution map, 2022
- Chart 7: Urban and rural population in Current Path, 1990–2043
- Chart 8: Demographic and Health scenario diagram
- Chart 9: Demographic dividend in Current Path and Demographics and Health scenario, 2019–2043
- Chart 10: Infant mortality in Current Path and Demographics and Health scenario, 2019 –2043
- Chart 11: Life expectancy in Current Path and Demographics and Health scenario, 2019–2043
- Chart 12: Definitions in education
- Chart 13: Gross enrolment in Current Path, 2019 and 2043
- Chart 14: Gross completion rates in Current Path, 2019 and 2043
- Chart 15: Education scenario diagram
- Chart 16: Mean years of education in Current Path and Education scenario, 2019–2043
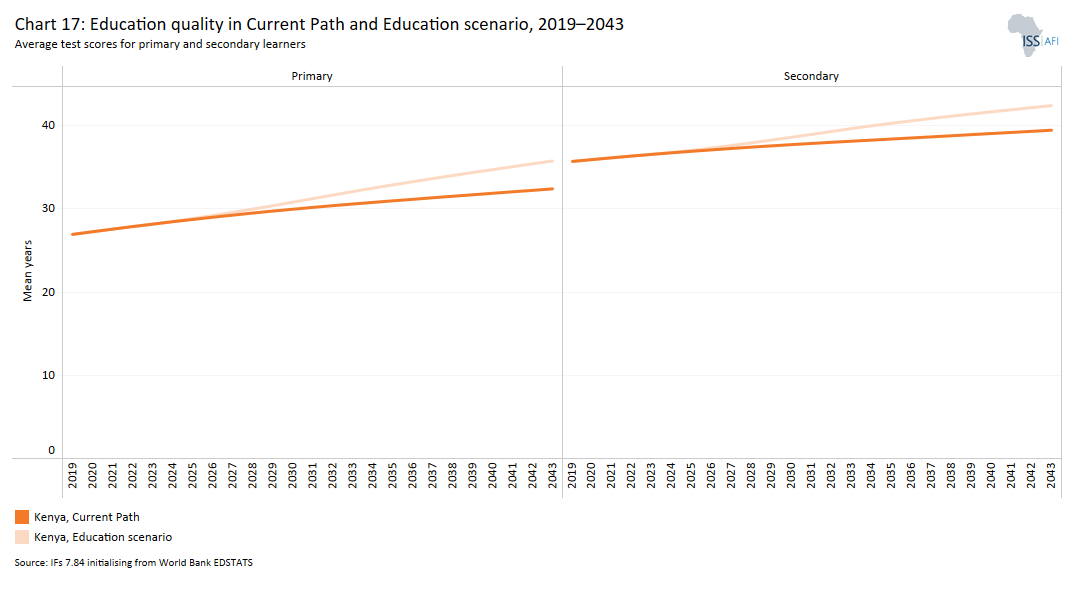
- Chart 17: Education quality in Current Path and Education scenario, 2019–2043
- Chart 18: Infrastructure and Leapfrogging scenario diagram
- Chart 19: Electricity access in Current Path and Infra/Leapfrogging scenario, 2019–2043
- Chart 20: Cook stove usage by type Current Path and Infra/Leapfrogging scenario, 2019 and 2043
- Chart 21: Broadband access in Current Path and Infra/Leapfrogging scenario, 2019–2043
- Chart 22: Agriculture scenario diagram
- Chart 23: Agriculture production/demand in Current Path and Agriculture scenario, 1990–2043
- Chart 24: Manufacturing scenario diagram
- Chart 25: Value added by sector in Current Path and Manufacturing scenario, 2019–2043
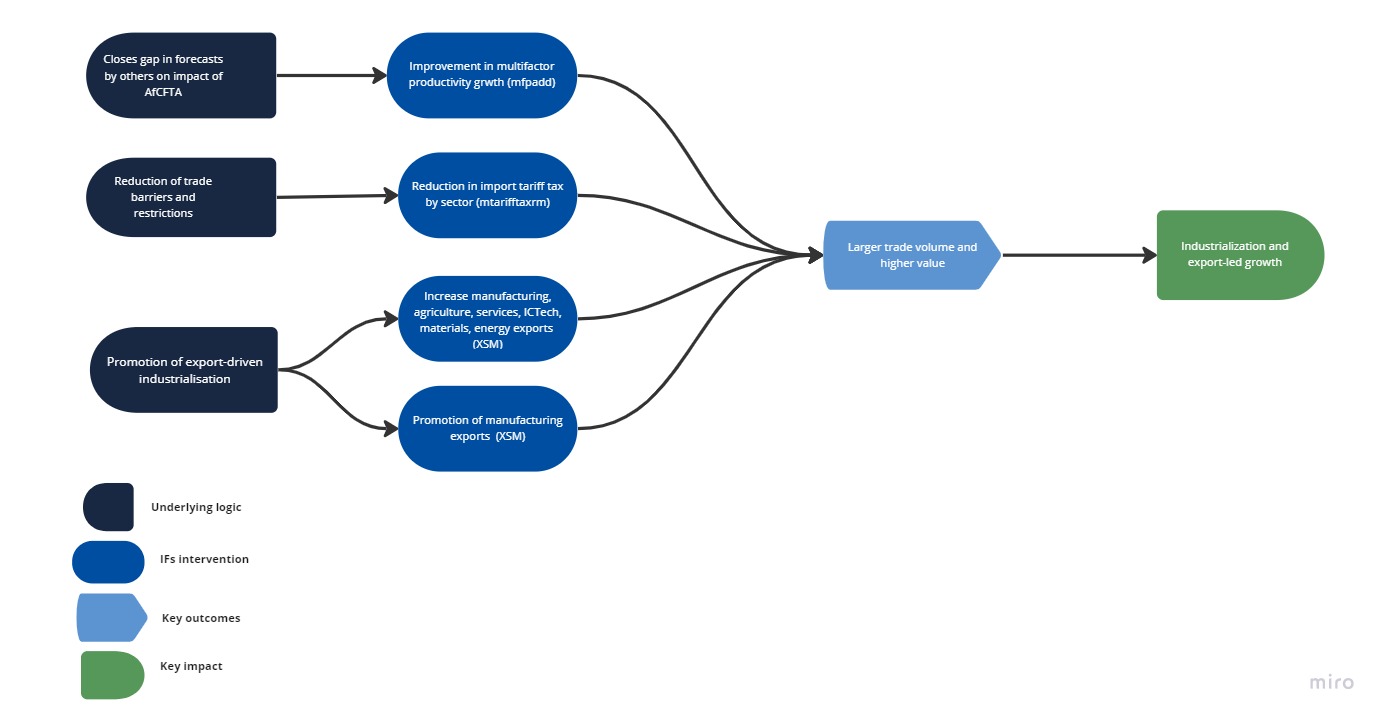
- Chart 26: AfCFTA scenario diagram
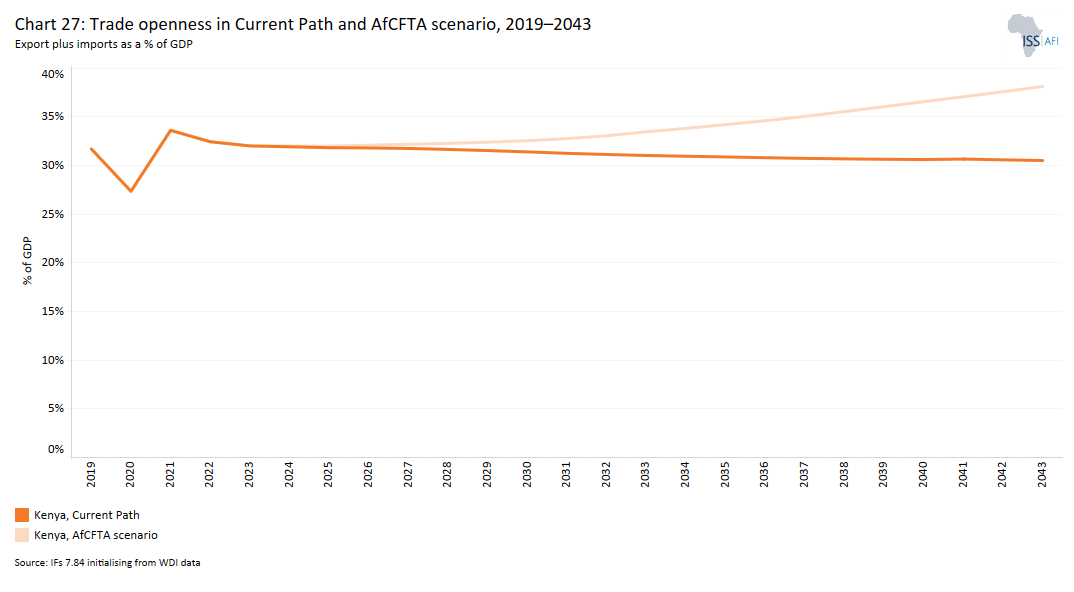
- Chart 27: Trade openness in Current Path and AfCFTA scenario, 2019–2043
- Chart 28: Trade balance in Current Path and AfCFTA scenario, 2019–2043
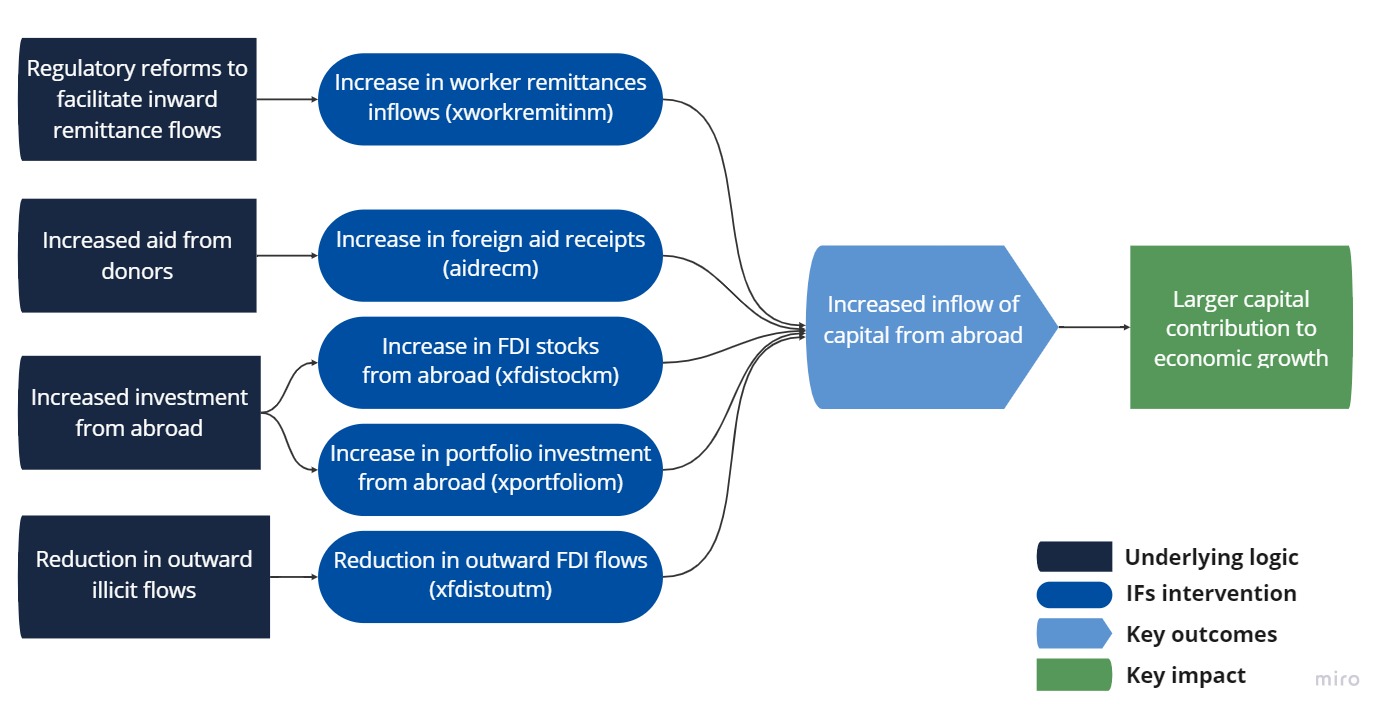
- Chart 29: Financial Flows scenario diagram
- Chart 30: Foreign aid in Current Path and Financial Flows scenario, 2019–2043
- Chart 31: Inflow of FDI in Current Path and Financial Flows scenario, 2019–2043
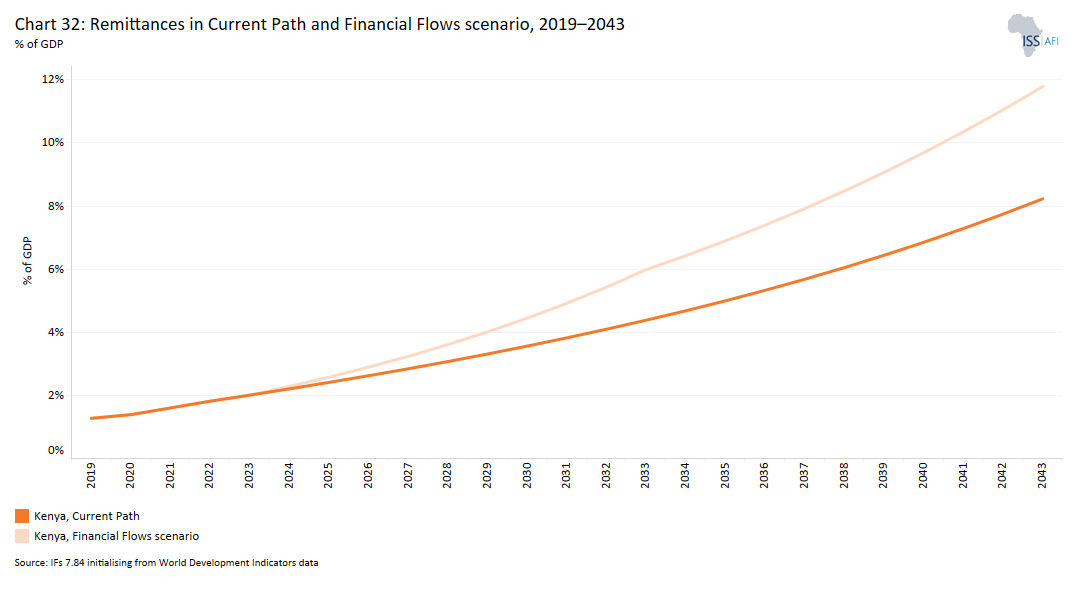
- Chart 32: Remittances in Current Path and Financial Flows scenario, 2019–2043
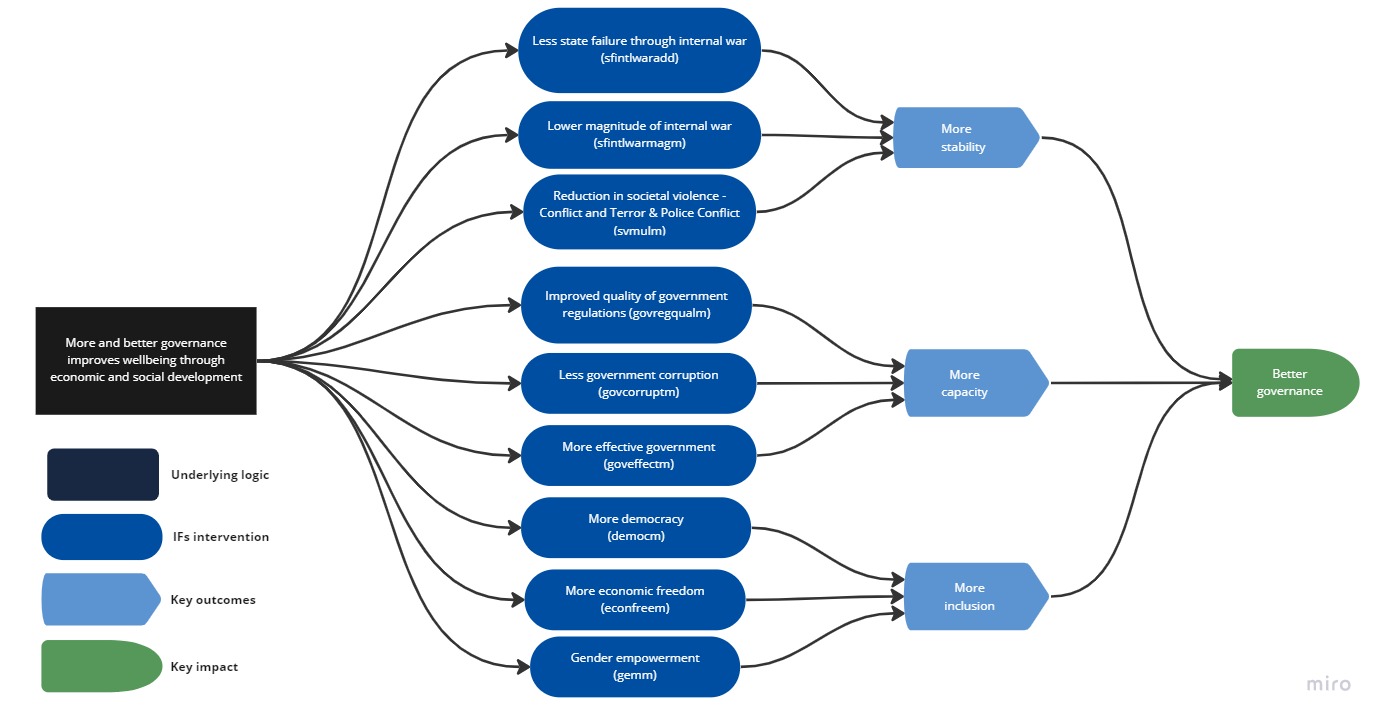
- Chart 33: Governance scenario diagram
- Chart 34: Composite governance index in Current Path vs Governance scenario, 2019-2043
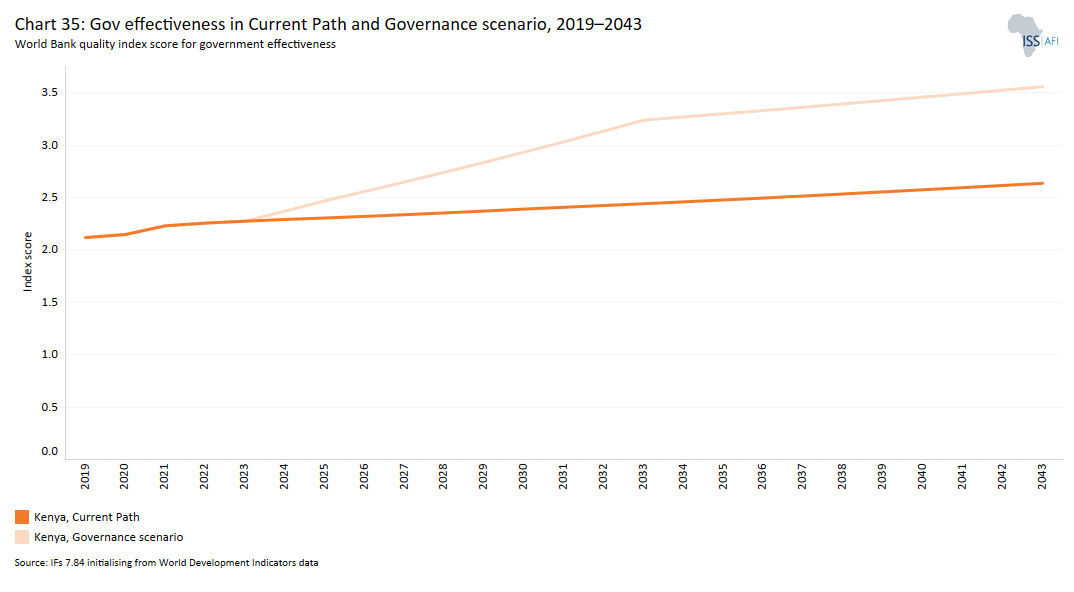
- Chart 35: Gov effectiveness in CP and Governance scenario, 2019–2043
- Chart 36: GDP per capita in Current Path and scenarios, 2019–2043
- Chart 37: GDP per capita in Current Path and Combined Agenda 2063 scenario, 2019–2043
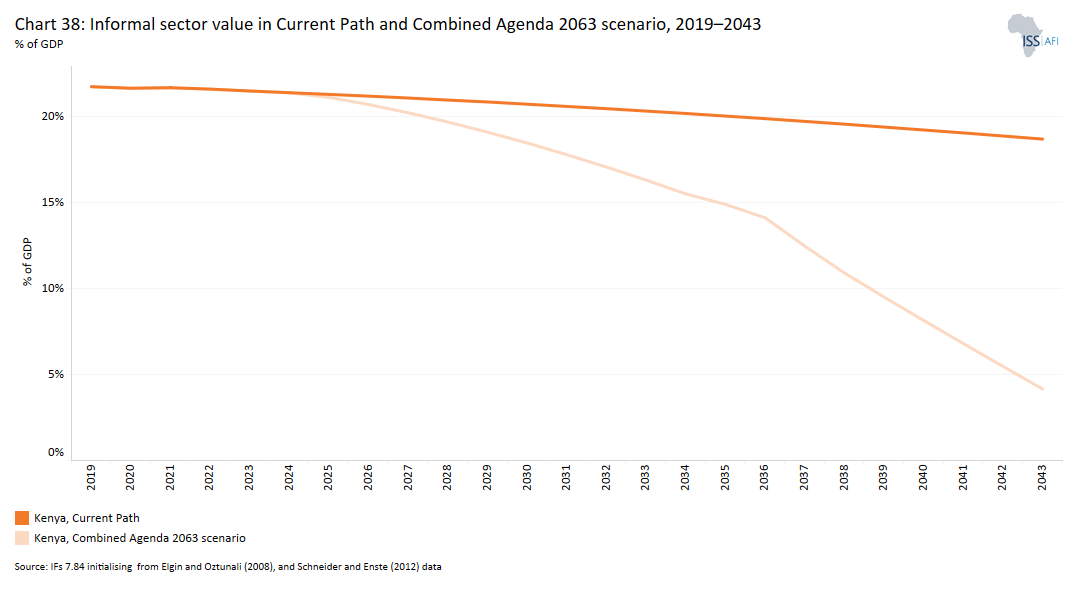
- Chart 38: Informal sector value in Current Path and Combined Agenda 2063 scenario, 2019–2043
- Chart 39: Poverty in Current Path and scenarios, 2019–2043
- Chart 40: Poverty in Current Path and Combined Agenda 2063 scenario, 2019–2043
- Chart 41: Domestic Gini index score in Current Path and Combined Agenda 2063 scenario, 2019–2043
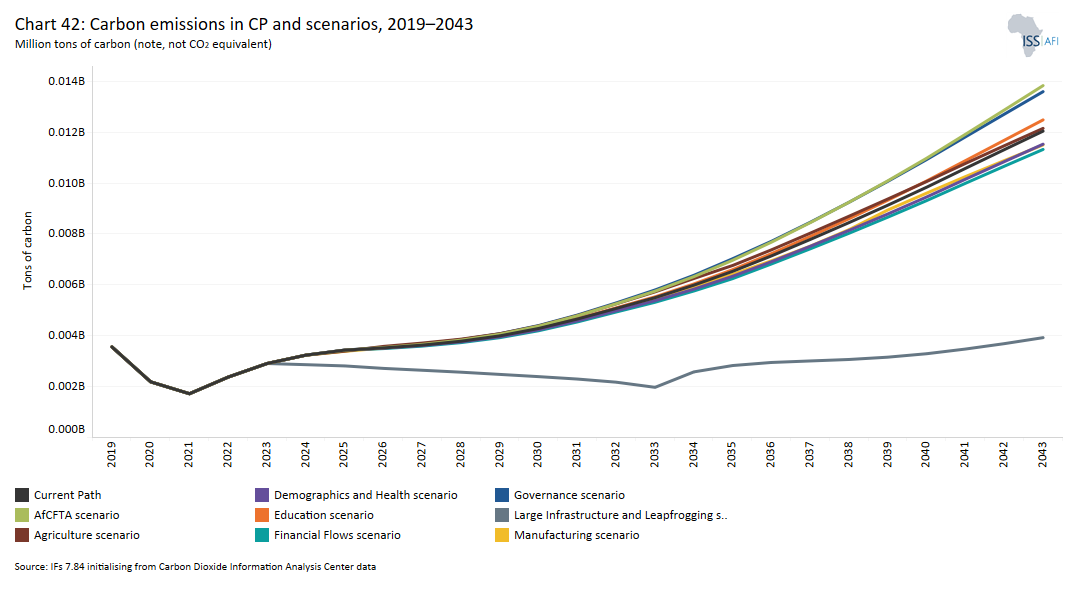
- Chart 42: Carbon emissions in Current Path and scenarios, 2019–2043
- Chart 43: Carbon emissions in Current Path and Combined scenario, 2019–2043
-
Chart 44: Recommendations
Chart 44: Recommendations
Kenya: Background
Download to pdfKenya, a lower middle-income country in East Africa, is bordered by South Sudan to the north-west, Ethiopia to the north, Somalia to the east, Uganda to the west, Tanzania to the south, and the Indian Ocean to the south-east. As a member of the Intergovernmental Authority on Development (IGAD), the East African Community (EAC) and the Common Market for Eastern and Southern Africa (COMESA), Kenya is a critical commercial hub on the continent. Its economy is the largest in East Africa and the third largest in sub-Saharan Africa.
Kenya gained independence in 1963 and became a republic a year later with Jomo Kenyatta becoming the first president after his release from detention. In 1966, an opposition party, the Kenya People’s Union (KPU), was formed, but it was banned shortly after and its leaders were arrested. This made the country a de facto one-party state, legally confirmed as such by the national assembly in June 1982. In 1991, the Parliament of Kenya annulled the one-party constitutional provision which paved the way for multiparty elections and democracy. Consequently, the country transitioned to a multiparty political system in 1992, with elections held every five years. From then, Kenya was relatively peaceful and stable, until the political crises in 2007/08 after former president Mwai Kibaki was declared the winner of the disputed presidential election. This led to reforms with the promulgation of the 2010 constitution that established a bicameral legislature, devolved the country’s executive government and instituted a tenured judiciary and the Independent Electoral and Boundaries Commission (IEBC).
The country covers an area of 580 367 km2 and had a population of about 47.6 million in 2019. Its geography and climate vary widely, including cold, snow-capped mountaintops, vast forests with abundant wildlife, fertile agricultural regions and temperate climates in the western and Rift Valley counties, and arid and semi-arid areas that are less fertile. Administratively, Kenya is divided into 47 semi-autonomous counties that are headed by governors. The capital of Kenya, and its largest city, is Nairobi, but there are also other significant and large cities, such as Mombasa (the oldest city and original capital), Kisumu City and Nakuru city. The official languages of the country are English and Swahili, although there are a number of ethnicities, each with their own language.
Kenya has titanium, gold, and coal deposits as well as copper, niobium, manganese, oil and gas reserves. It also holds other natural and mineral resources such as zinc, soda ash, salt, limestone, gemstones, gypsum, fluorspar, diatomite, thermal and wind power. The country produces agricultural commodities such as maize, tea, coffee, rice, wheat, sugar, livestock, cut flowers and vegetables. Resultantly, its principal exports include tea, cut flowers, refined petroleum, vegetables and coffee.
The Kenya Vision 2030 launched in 2008 is the long-term development blueprint for the country. It is an aspirational development plan aimed at transforming Kenya into ‘a newly industrializing, middle-income country providing a high quality of life to all its citizens by the 2030.’ Prior to the adoption of Vision 2030, the country pursued the Economic Recovery Strategy for Wealth and Employment Creation that was credited with increasing GDP growth from 0.6% in 2002 to about 7.1% in 2007.
![]()
Vision 2030 is anchored on three main pillars: economic, social and political. The economic pillar is to improve the prosperity of all Kenyans through an economic development programme that will achieve an average GDP growth rate of 10% per annum starting in 2012. The social pillar seeks to attain a ‘just and cohesive society with social equity in a clean and secure environment,’ while the political pillar endeavours to ‘realize a democratic political system founded on issue-based politics that respects the rule of law and protects the rights and freedoms of every individual in Kenyan society.’
Each of the three pillars is made up of several sectors with a number of ‘flagship projects’ underpinning them. The economic pillar focuses on structural transformation of the economy and infrastructure development. The social pillar focuses on increasing access to basic social services including education, health, and water and sanitation facilities with emphasis on marginalised and vulnerable groups such as women and the youth. The political pillar focuses on the public sector which has already led to the promulgation of a new constitution. The Medium Term Plans (MTPs) outlined detailed plans for each sector under each pillar for five years. Vision 2030 further recognises reforms in eight key strategic sectors expected to ‘form the foundation of society for socio-political and economic growth.’ These include macroeconomic stability; infrastructure; energy; science, technology and innovation; land reform; human resources development; security; and public sector reforms.
The Vision 2030 is linked to the Millennium Development Goals (MDGs) and the Sustainable Development Goals (SDGs). It is also aligned with the African Union’s Agenda 2063 framework. The Vision 2030 is to be implemented in phases through successive five-year MTPs. The first MTP (MTP1) was implemented from 2008 to 2012, the second (MTP2) from 2013 to 2017, and the third (MTP3) from 2018 to 2022. Under the first two MTPs, the country made significant progress in growing the economy and reducing extreme poverty. Between 2010 and 2019, the economy grew at an average of 5%. Likewise, according to the 2015/16 Kenya Integrated Household Budget Survey, poverty levels (at US$1.90) declined from 46% in 2005 to 36.1% in 2015. The country moved from 129th position in 2013 to 61st position in 2019 on the World Bank Ease of Doing Business report. However, despite this progress, the economy still faces a number of challenges.
The MTP3 was launched in December 2017 by then President Uhuru Kenyatta and is based on the ‘the Big 4 Agenda’, which seeks to prioritise interventions in manufacturing, food and nutrition security, and health and affordable housing. It seeks to build on the progress of the MTP1 and the MPT2 by achieving an economic growth rate of 7% at the end of the implementation period. According to the MTP3, critical challenges facing the country include overreliance on rainfall for agriculture, low manufacturing and export growth, persistent trade and balance of payment deficit, low investment, high unemployment rates, high cost of doing business, high energy cost, increasing cost of living, and high food prices. The World Bank also identifies the key development challenges of the country that include high levels of poverty and inequality, weak private sector investment, corruption, climate change, and susceptibility to internal and external shocks.
Like all other economies, the COVID-19 pandemic greatly affected the Kenyan economy. In 2020, the economy shrunk by 0.3% from the 5% growth rate it recorded in the previous year. With declining revenue and increased government expenditure, total public debt grew from 59.5% of GDP in 2019 to 65.8% in 2020 with a fiscal deficit of 7.9%. This put the country at the risk of debt distress with rising debt servicing costs. The current account deficit also widened to 5.2% of GDP in 2021 due to the rising trade deficit and is expected to deteriorate further as a result of higher food and fuel import bills. Likewise, a rising inflation rate, due to the Ukraine–Russian war, has resulted in skyrocketing prices for crude oil and other essential imports to Kenya. Nonetheless, the economy has shown signs of recovery with an estimated growth rate of 7.5% in 2022 and forecasted growth of 6.5% for 2023 and 6.9% in 2024. With the resumption of the IMF-supported fiscal consolidation and debt management programme, the fiscal deficit is expected to reduce in the coming years.
Kenya: Sectoral analysis
Download to pdf- Scenarios diagram
- Demographics and Health: Current Path vs scenario
- Education: Current Path vs scenario
- Infrastructure/Leapfrogging: Current Path vs scenario
- Agriculture: Current Path vs scenario
- Manufacturing: Current Path vs scenario
- Free Trade: Current Path vs scenario
- External Financial Flows: Current Path vs scenario
- Governance and Stability: Current Path vs scenario
This section provides an overview of the key characteristics of Kenya along its likely (or Current Path) development trajectory and the impact of a single positive scenario in eight separate sectors.
The Current Path forecast from the International Futures forecasting (IFs) platform is a dynamic scenario that imitates the continuation of current policies and environmental conditions. The Current Path is, therefore in congruence with historical patterns and produces a series of dynamic forecasts endogenised in relationships across crucial global systems.
The eight sectoral scenarios are on: Governance and Stability, Demographics and Health, Education, Infrastructure/Leapfrogging (consisting of the impact of renewables, ICT and the more rapid formalisation of the informal sector), Agriculture, Manufacturing, Free Trade (the implementation of the African Continental Free Trade Area), and External Financial Flows (consisting of aid, foreign direct investment, remittances and a proxy on illicit financial flows). The interventions in each scenario are benchmarked to present an ambitious but reasonable aspiration for countries at similar levels of development.
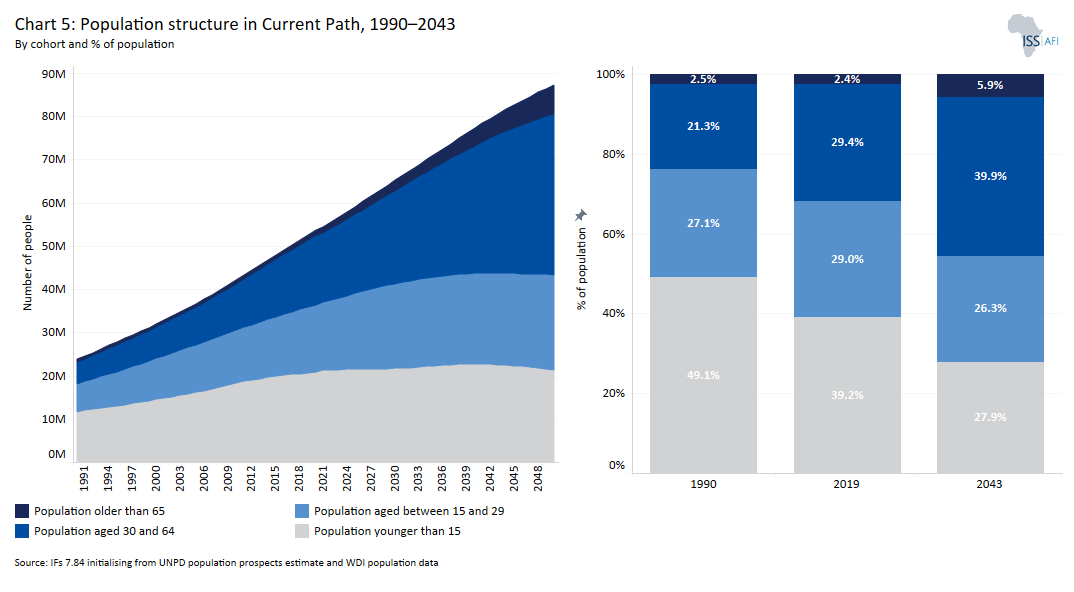
Kenya’s population more than doubled between 1989 and 2019, increasing from 21.4 million people to 47.6 million in 2019 with an inter censual growth rate averaging 2.2%. In 2019, Kenya was the third most populous country in East Africa and the seventh most populous in Africa. On the Current Path, the population of the country is projected to rise to 65.1 million in 2030 and to 80.5 million by 2043, equivalent to an increase of 53%. Although Kenya’s population growth rate declined from 3.4% per annum in 1990 to 2.0% in 2019 and is set to decline to 1.3% by 2043, population growth is still rapid because of the country’s youthful population. In 2019, 39.2% of Kenya’s population was below the age of 15 years, 58.4% in the age group 15–64 years (working-age group) and 2.4% for the age group 65 years and older. Compared with 1990, the structure of Kenya’s population has not fundamentally changed over the past three decades.
Kenya’s youth bulge (the portion of its adult population below 29 years of age) stood at about 48% — a fall from 53% in 1990 and slightly higher than the average for Africa at 46.5%. The median age for Kenya in 2019 was 19.3 years — an increase from 15.5 years recorded in 1990 and almost equal to Africa’s median of 19.7 years. Clearly, this reveals the youthful nature of Kenya’s population. The large youth bulge will continue to pose challenges to Kenya's development. In 2016, the unemployment rate of people between 15 and 24 years was five times the national rate, with an annual influx of an estimated 800 000 people into the labour market. Kenya’s large youthful population, combined with significant rates of unemployment, could be a catalyst for potential instability in the country.
By 2043, the median age is expected to increase to 27.6 years, and the youth bulge will decline to 32.4%. Consequently, the proportion of people under the age of 15 will decline to 28% while the share of the working population and the population aged 65 and older increase to 66.2% and 6%, respectively, by 2043. This will be made possible by the expected decline in fertility emanating from urbanisation, better education and increased access to improved contraceptives over the forecast period, among other measures. Access to modern contraceptives by women of child-bearing age is expected to increase from 62.2% in 2019 to 70.4% in 2030, meaning that the country will miss the SDG target 3.7.1 of ensuring universal access to modern family planning methods by women of reproductive age.
Family planning injections are the commonly used method of contraception among Kenyan women. In 2021, over 2.4 million women used the family planning injections, followed by implant insertion which was used by over 800 000 women in the same year. Other commonly used methods of contraception include combined oral contraceptive pills, intrauterine contraceptive device insertion, progestin-only pills, sterilisation bilateral tubal ligation, and sterilisation vasectomy. By 2043, access to contraceptives by women of child-bearing age will rise to 81.4%. As a result, Kenya’s total fertility rate will fall more rapidly than the average for lower middle-income countries in Africa, from 3.4 births per woman in 2019 to 2.2 by 2043.
With a total land area of approximately 580 367 km², Kenya was the sixth most densely populated country in East Africa and the 18th most densely populated country in Africa in 2019. Its estimated population density of 0.92 people per hectare in 2019 was higher than the average for Africa, at 0.44 people per hectare, and East Africa, at 0.62 people per hectare.
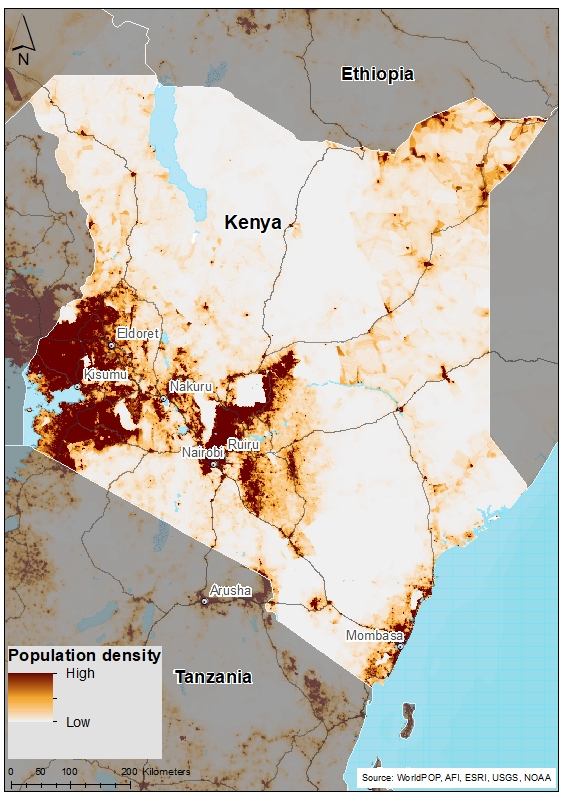
The capital, Nairobi, is the largest city in the country, with an estimated population of about 3 million people. The county of Nairobi has a population density of 4 515 people/km2, followed by Mombasa (4 292 people/km2) as most migrants move to settle in the Nairobi and Mombasa centres. For instance, in 2019, 48.4% of recent migrants moved to Nairobi and 12.5% moved to Mombasa. In contrast, the county of Marsabit which is the least densely populated has a population of only approximately 290 000 people.
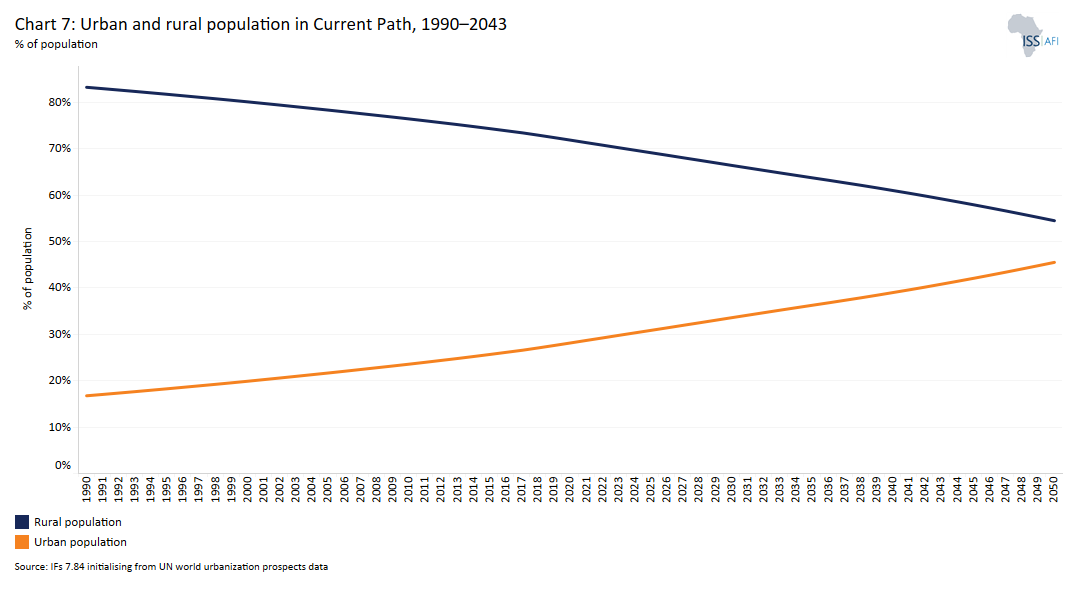
The population of Kenya is predominantly rural. In 1990, 19.8 million Kenyans, constituting 83.3% of the total population, lived in rural areas. By 2019, this figure had declined to about 72.4%, equivalent to 38.1 million people, far above the average of 57.1% for Africa in the same year. Consequently, the urban population stood at 27.6% in 2019, making Kenya the 10th least urbanised country in Africa and the sixth least urbanised country out of the 12 countries in the Horn of Africa/East Africa. It means that Kenya has experienced a slower rate of urbanisation than most African countries. The country is still struggling to keep pace with its urbanisation rate as there are high rates of informality in urban areas. For instance, about 250 000 people live in Kibera, a densely populated slum in the capital Nairobi.
Even by 2043, the country will not achieve rural–urban parity, with 59.2% of its population expected to still be living in rural areas. Urbanisation is, however, speeding up and the urban population is expected to reach 40.8% in 2043. By then, Kenya will be the 15th least urbanised country in Africa having overtaken Mauritius, Sudan, Lesotho and Comoros. This expected rapid urbanisation will place significant pressure on housing, social amenities and service delivery in the urban centres. Some of the drivers of urbanisation in Kenya include the pursuit of employment and social amenities, which are more readily available in urban areas.
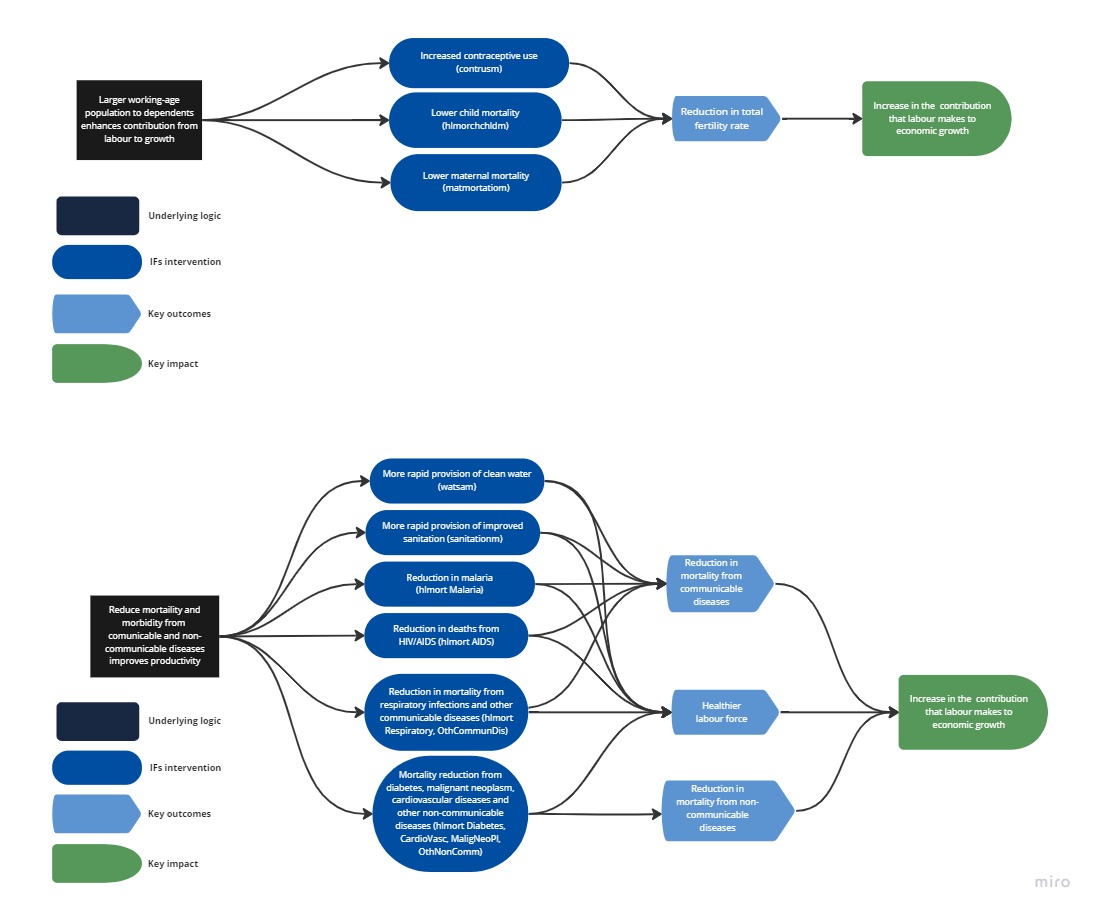
The Demographic and Health scenario consists of reasonable but ambitious reductions in the communicable and non-communicable-diseases mortality, the disease burden for children under five, and the maternal mortality ratio. The scenario also provides for increased access to modern contraception, as well as improvements in access to safe water and better sanitation. The effect on this scenario is an improvement in important health outcomes such as infant mortality and life expectancy as well as the demographic dividend in Kenya.
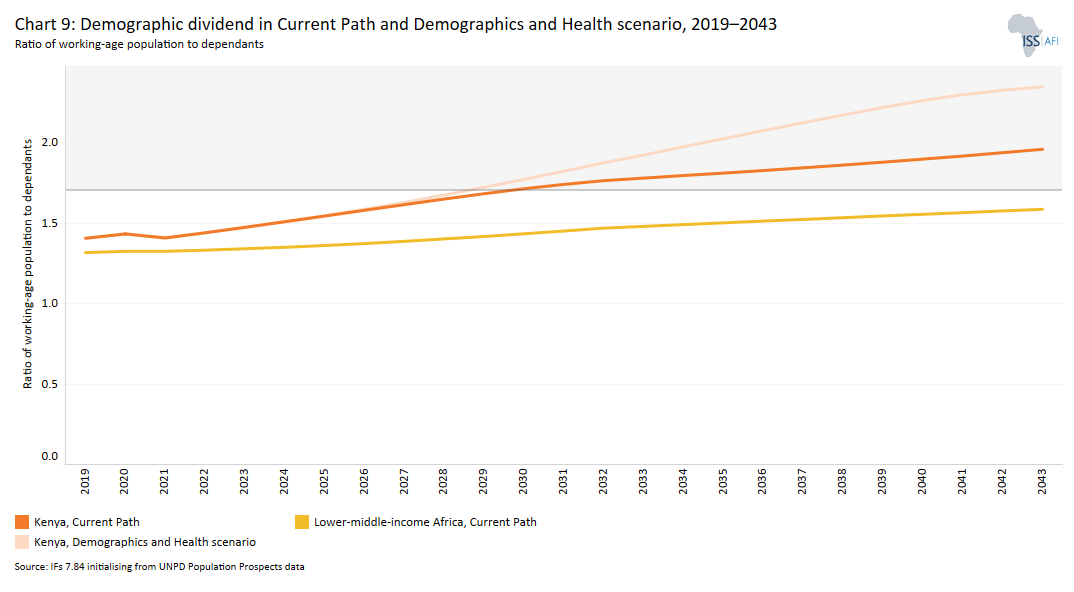
Demographers typically differentiate between a first, second and even a third demographic dividend. Given Kenya’s youthful population structure, the study focuses on the first dividend. There are different ways to conceptualise the first demographic dividend. For example, studies have shown that a promising demographic window occurs when less than 30% of the population falls within the age of 0 to 14 years (children) while those 65 years and older (elderly people) make up less than 15%. Alternatively, a demographic dividend arises when a country attains an average median age of between 26 and 41 years. The study uses the ratio of working-age persons to dependants, i.e. the size of the labour force (between 15 and 64 years of age) relative to dependants (children and the elderly).
A window of opportunity opens when the ratio of the working-age population to dependants is at least 1.7 to 1, meaning that there are 1.7 working people for every dependent person. When there are fewer dependants to take care of, resources made available for investment in both physical and human capital formation, and eventually female labour force participation increases. Studies have shown that about one-third of economic growth during the East Asia economic ‘miracle’ can be attributed to the large worker bulge and a relatively small number of dependants. However, growth in the working-age population relative to dependants does not automatically translate into rapid economic growth unless the labour force acquires the needed skills and is absorbed by the labour market. Without sufficient education and employment generation to successfully harness their productive power, the growing labour force (especially in urban areas) could increasingly become frustrated with the lack of job opportunities leading to social tension and even the emergence of civil instability.
In 2019, the ratio of the working-age population to dependants in Kenya was 1.4 to 1, which means that, on average, there were only 1.4 persons of working age (15–64 years of age) for every dependant in Kenya. This is low but higher than the average of 1.32 to 1 for lower middle-income countries in Africa. In the Current Path forecast, Kenya will achieve the minimum ratio of 1.7 to 1 for a demographic dividend by 2030, the end of its Vision 2030, after which it enters a potential period of higher economic growth given its larger labour force relative to dependent children and elderly people. By 2043, the ratio of the working-age population to dependants is projected to be 2 to 1 on the Current Path. Kenya should achieve its peak demographic dividend in around 2058.
In the Health and Demographic scenario, Kenya will achieve the minimum ratio of 1.7 working-age persons to 1 dependant for a demographic dividend by 2029, after which it enters a potential period of higher economic growth given its larger labour force relative to dependants. By 2043, the ratio of the working-age population to dependants is projected to be 2.35 to 1 in the Health and Demographic scenario. This will be 20% higher than the Current Path forecast and 48% more than the projected Current Path average of 1.59 for lower middle-income countries in Africa.
The Kenya Vision 2030 aims to offer equitable, affordable and quality healthcare of the highest standards to all citizens. One of the initiatives under the Universal Health Coverage, as part of the Big 4 Agenda in the MTP3, is to implement programmes that will lead to increased health insurance coverage and increased access to quality but affordable healthcare services. The priorities of the MTP3 of achieving universal healthcare are supported by the Kenya Health Policy 2014–2030 and are also aligned to the attainment of SDG goal 3 on ensuring healthy lives and promoting well-being for all citizens. However, challenges such as corruption, shortages of essential medical equipment and medications, and healthcare worker strikes continue to plague healthcare delivery in the country.
Expenditure by the Kenyan government on healthcare as a percentage of GDP of 5.3% is above the average for lower middle-income African countries. Substantial allocations from international donors are included. The government’s health expenditure increased by 55% from 2012/13 to 2015/16, and the national health budget increased by 67% from 2012/13 to 2016/17. The total national government expenditure on health totalled KSh 94.5 billion (about US$945 million) and in 2020/21 financial year and increase by 16.6% to KSh 110.2 billion (US$110.2 million) in the 2021/22 financial year mainly driven by the 50.2% growth in development expenditure on health services.
This huge investment in the health sector has impacted positively on the country’s health infrastructure and outcomes. There are different levels of health infrastructure in Kenya. In 2021, the basic infrastructure facilities (level 2), consisting of dispensaries, medical clinics and stand-alone clinics, constituted 77.4% of all health facilities. Level 3 facilities, also comprising medical centres, health centres and nursing homes, accounted for 16% of all health facilities, while hospitals, which are level 4 (primary care hospitals), level 5 (secondary care hospital) and level 6 (referral hospitals) facilities, accounted for the remaining facilities. Between 2005 and 2012, the country constructed over 1 500 healthcare facilities and increased the number of clinics from 6 200 to about 8 500. The national average healthcare facility density increased from 1.9 healthcare facilities per 10 000 people in 2013 to 2.2 health facilities per 10 000 people in 2016. Also, the introduction of free maternal care in public healthcare facilities reduced maternal mortality rates by 26% from 2013 to 2017 and increased hospital birth deliveries from 43% to 62%.
IFs uses the International Classification of Disease (ICD) to differentiate between three broad categories of diseases: communicable, non-communicable and injuries, as well as 15 subcategories of mortality and morbidity. Vision 2030 seeks to eliminate deaths from communicable diseases in Kenya, to reduce the prevalence of non-communicable diseases, to reduce exposure to health risk factors, and to strengthen collaboration with health sector providers. Between 2003 and 2019, deaths from communicable diseases declined from 227 400 to 139 000 per year. Non-communicable diseases caused about 100 000 deaths in 2019, while deaths from injuries stood at 21 000. Despite the rapid decline in the communicable disease burden, it is still the leading cause of death in Kenya and will remain so until 2024. With the rising cases of non-communicable diseases such as heart diseases, diabetes, cancer and hypertension in the country, from 2025 onwards non-communicable diseases will become the leading cause of death in Kenya such that by 2043, deaths from non-communicable diseases will be 258 300, while deaths from communicable diseases will drop drastically to 75 700. The transition to deaths from non-communicable diseases as the main cause of mortality will inevitably increase health sector costs as they are more expensive to treat.
Using the other 15 subcategories, death from other communicable diseases (e.g. Ebola virus disease and dengue fever) constitute the highest cause of death averaging 52 000 deaths in 2019. This was followed by deaths as a result of AIDS (43 000), of which mainly the youth and adolescents are infected, cardiovascular related diseases (28 000), other non-communicable diseases (24 000) and malaria (5 000). The reduction in deaths as a result of malaria is due to the interventions that the government has put in place over the years to prevent malaria prevalence and mortality. For instance, from 2013 to 2016, government provision of long-lasting treated mosquito nets increased from 1.7 million nets to 7.3 million. Similarly, the proportion of pregnant women and children sleeping under mosquito nets increased from 36% in 2010 to 58% in 2015, and children sleeping under mosquito nets increased from 39% to 56% in the same period. By 2043, cardiovascular disease is expected to be the leading cause of death in the country, followed by AIDS and malaria.
Access to improved, safe, treated water, such as piped water, is an important means of preventing the spread of communicable diseases. Since 1980, Kenya has battled 16 cholera outbreaks that have affected an estimated 81 000 people with the most recent cases occurring in 2016, 2017 and 2019. As a result, the country has made efforts to ensure access to safe water for all citizens. In 2019, 36.8 million Kenyans (65.5% of the population) had access to safe water. More than a third (34.2%) of the households relied on piped water as a source of drinking water. Out of this, about half constituted access to piped water supply in the country. By 2043, it is projected that access to improved water will increase to about 82% of which piped water will constitute almost 60% connections. Over 58.6% of Kenyans (30.7 million people) had access to improved sanitation in 2019, while the share of the population with access to shared sanitation amounted to 34.1%. The percentage of the population with improved access to sanitation is estimated to rise to 75.2% by 2043.
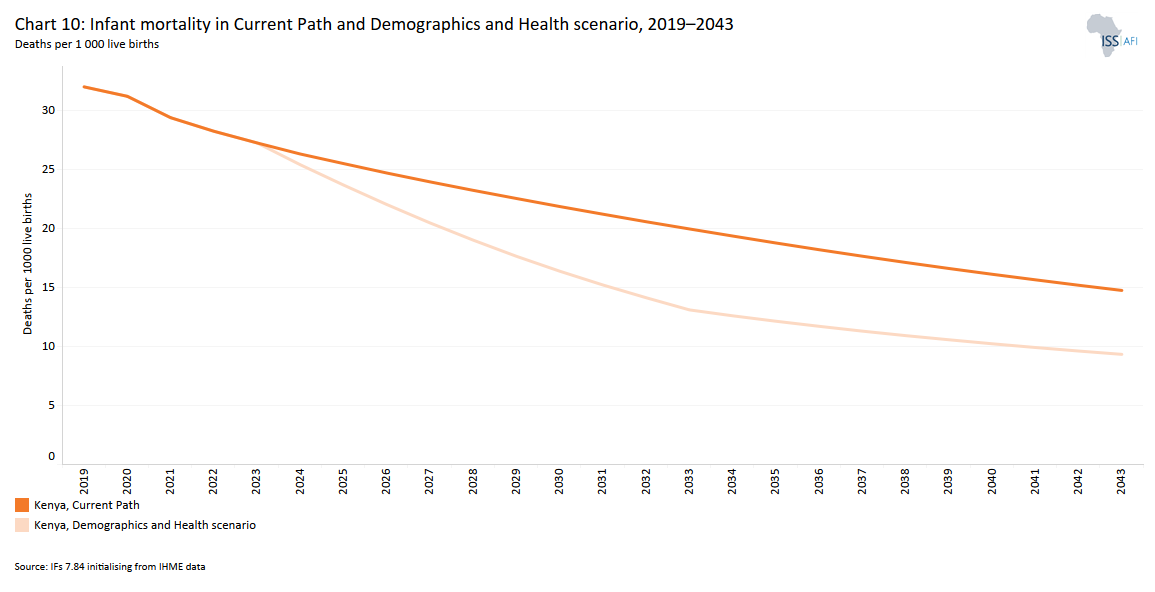
The infant mortality rate is the number of infant deaths per 1 000 live births and is an important marker of the overall quality of the health system of a country. According to the Kenya Demographic Health Survey of 2014, the infant mortality rate declined from 52 deaths per 1 000 live births in 2008 to 39 deaths per 1 000 live births in 2014. In 2019, the infant mortality rate in Kenya was 35.5 deaths per 1 000 live births, a decline from the almost 65 deaths per 1 000 live births in 1990. This was 40% lower than the average of 43.4 deaths for lower middle-income countries in Africa. It was also below the averages for Africa and East Africa estimated at 40.5 deaths per 1 000 live births and 44.7 deaths per 1 000 live births, respectively. Pneumonia, malaria, diarrhoea and undernutrition are leading causes of child mortality in Kenya.
Migori county recorded the highest infant mortality with 67.2 deaths per 1 000 live births, followed by Homa Bay with 57.5 deaths per 1 000 live births. The county with the lowest infant mortality rate is Laikipia with 17.3 deaths per 1 000 live births, followed by Tharaka-Nithi with 18.5 deaths per 1 000 live births. On the Current Path, the infant mortality rate is expected to decline further, reaching 21.9 deaths per 1 000 live births by 2030 and 14.8 deaths per 1 000 live births by 2043.
In addition, the Health and Demographic scenario will reduce Kenya’s infant mortality rate to 16.4 deaths per 1 000 live births in 2030 and to 9.3 deaths per 1 000 live births by 2043. It means that Kenya will achieve the SDG target of 12 deaths per 1 000 live births by 2035 in this scenario. This is about six fewer deaths per 1 000 live births than in Kenya’s Current Path forecast and 21 fewer deaths than the Current Path average for lower middle-income countries in Africa.
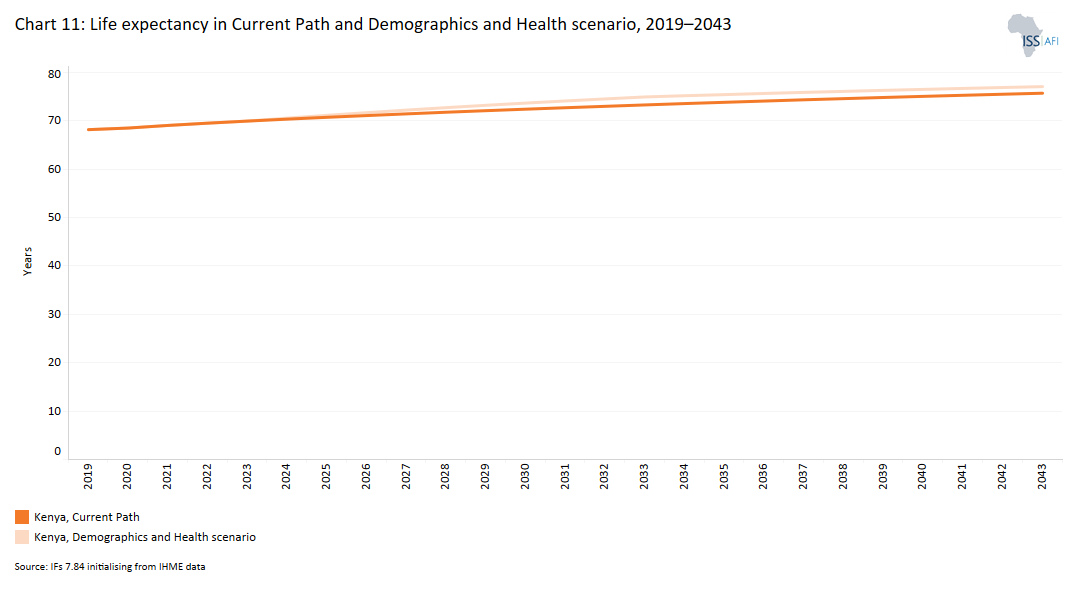
Life expectancy measures the average lifespan of individuals in a country. In 2019, the average life expectancy at birth in Kenya was 63.6 years, which was about 2.4 years higher than the average for Africa and a year higher than the average for its income peers in Africa. Women in Kenya generally have 5.9-year longer life expectancy (66.5 years) than men (60.6 years). This relatively higher life expectancy can be explained by the country’s success in reducing deaths due to communicable diseases. There are, however, variances at the county level. The lowest life expectancy at birth for males was recorded in Homa Bay and Migori at 50.5 years, while Tana River county recorded the lowest life expectancy for females at 58.6 years. Nyeri county recorded the highest life expectancies for both males and females at 66.4 years and 75.8 years, respectively.
On the Current Path, life expectancy will increase to 72.4 years by 2030 and to 75.7 years by 2043, which will both be higher than Africa’s average and the average for lower middle-income African countries. Women will continue to have a higher life expectancy than men by 2043. By then, life expectancy for women will be about 6 years higher than for men
In the Health and Demographic scenario, life expectancy will increase to 77.1 years by 2043, which will be 1.5 years higher than the country’s Current Path forecast and about four years higher compared with the Current Path average of 73.1 years for lower middle-income African countries. In both the Current Path forecast and the Health and Demographic scenario, women will continue to have a higher life expectancy than men by 2043. By then, life expectancy for women will be 5.8 years more than for men.
Education is one of the main sectors under the social pillar of Vision 2030. The education sector comprises basic education, vocational and technical training, post-training and skills development, and university education subsectors. According to the MTP3, the main priorities of the education sector are making the right to free and compulsory basic education a reality, advancing post-basic education, improving the quality and relevance of education, incorporating information and communication technologies (ICT) into teaching and learning, and increasing education financing.
For over 30 years, Kenya’s education system followed the 8-4-4 learning model comprising eight years of primary education, followed by four years of secondary education and an additional four years of tertiary education. In 2018, Kenya moved to the 2-6-6-3 learning model (two years of pre-primary, six years of primary, six years of secondary and three years of tertiary education). Free universal basic education was instituted in 2003 and, subsequently, free secondary education was introduced in 2008. In addition, various efforts have been made to improve education infrastructure in Kenya. The number of primary schools increased from 28 026 in 2013 to 35 442 in 2017. Likewise, the number of secondary schools also grew from 7 834 to 10 655 in the same year.
The total number of schools at the basic level stood at 89 747 in 2021, an increase of 1.4% from 2020. Out of this, 46 671 were pre-primary schools, 32 594 were primary schools and 10 482 were secondary schools. In addition, there were 2 396 technical and vocational education and training (TVET) institutions, consisting of 1 244 vocational training institutions, 1 140 technical and vocational colleges and 12 national polytechnics. There were a total of 65 universities in 2021, comprising 33 private universities and 32 public universities. The government continues to invest in education in order to improve educational outcomes. For instance, total education sector expenditure for the 2020/21 financial year stood at KSh 472.4 billion (about US$472.4 million) and is expected to increase by 2.9% for the 2021/22 financial year.
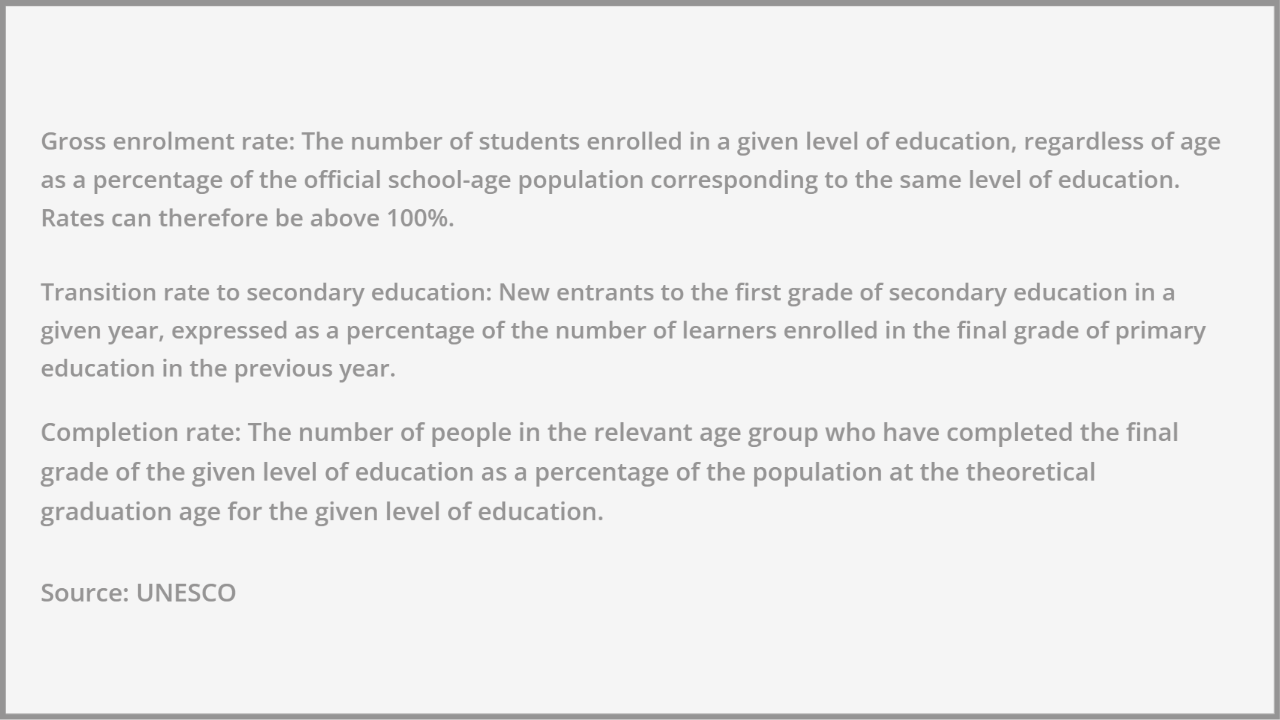
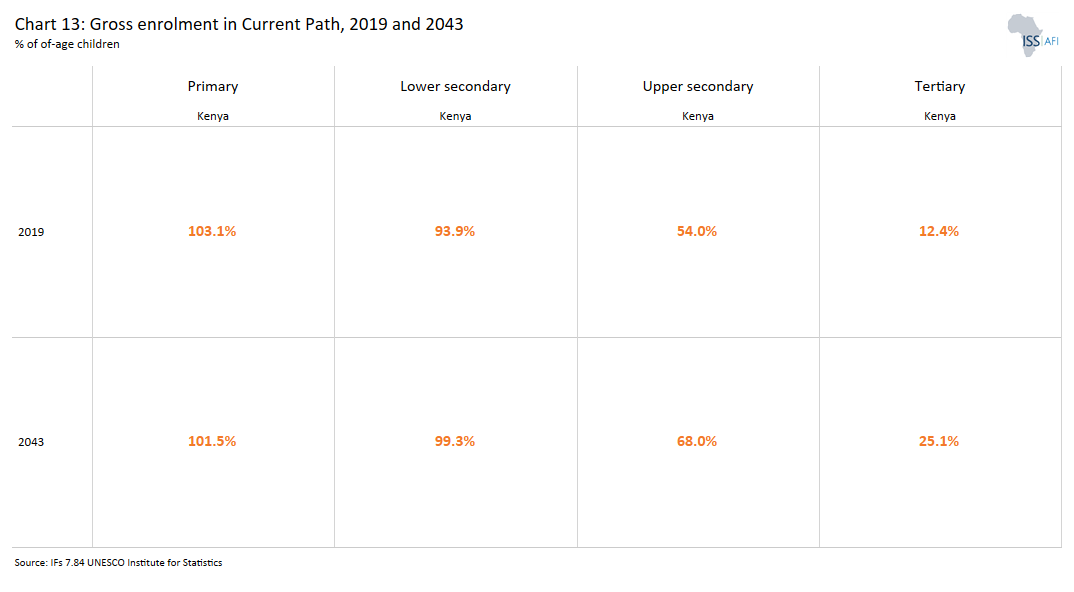
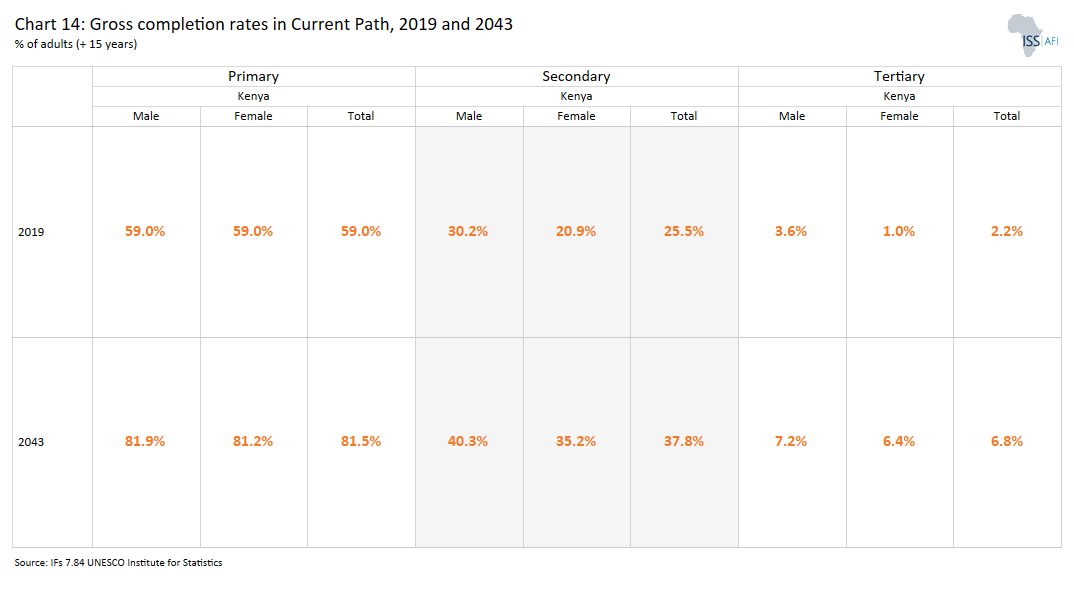
The huge investments in the education sector over the years have resulted in improved access to primary and secondary education. For instance, enrolment increased by 1.3 million learners after the introduction of free basic education in 2008. In 2019, the gross enrolment rate for primary school learners was 103% and net primary enrolment stood at 80.4%. This is an improvement from 93.2% and 63.7%, respectively, recorded in 2000. Both gross and net primary enrolment for females are slightly higher than for males. On the Current Path, while gross primary enrolment is set to slightly decline reaching 101.5% in 2043, net enrolment will increase to 93.6% in the same period. The primary completion rate stood at almost 99.4% in 2019 meaning that the overwhelming majority of learners enrolled in primary school in Kenya successfully completed the last year of primary education. On the Current Path, the primary completion rate is expected to rise to 101.5% by 2043.
Gross secondary school enrolment rose from 38.8% in 2000 to 68% in 2019 and net secondary school enrolment increased from 33.4% to 50.3% in the same period. By 2043, gross and net secondary enrolment rates are expected to increase to 76.8% and 68.9%, respectively. While the primary completion rate is very high in Kenya, the secondary completion rate stood at just 25.5% in 2019, up from 10.3% recorded in 2000. By 2043, it is expected that only 38% of the Kenyan population will have attained secondary education.
Despite the significant strides made in primary and secondary enrolment, the education sector in Kenya is still confronted by a number of challenges, especially at higher levels. Challenges such as inadequate funding, a shortage of teaching and learning materials, an insufficient number of teachers, inadequate educational infrastructure and low teacher remuneration still need to be addressed. As of 2019, gross tertiary enrolment was 12.4%, a huge improvement on the paltry 2.7% in 2000. Gross tertiary enrolment is projected to reach 25% by 2043. Even with this, only about 7.5% of Kenyans had graduated from a tertiary institution with at least a first degree in 2019. Merely 10.6% of these constituted graduates with a science and engineering background, which is considered key to the future of work. To increase enrolment in higher education, especially for science and technology, the government has been sponsoring students to the universities and TVET institutions. In 2021, the number of students sponsored by the government in this regard increased by 21.9% to 265 095 students. Out of these, 48.3% were students placed in the universities to read various degree programmes and the remaining placed in various TVET institutions to read diploma, certificate and artisan courses.
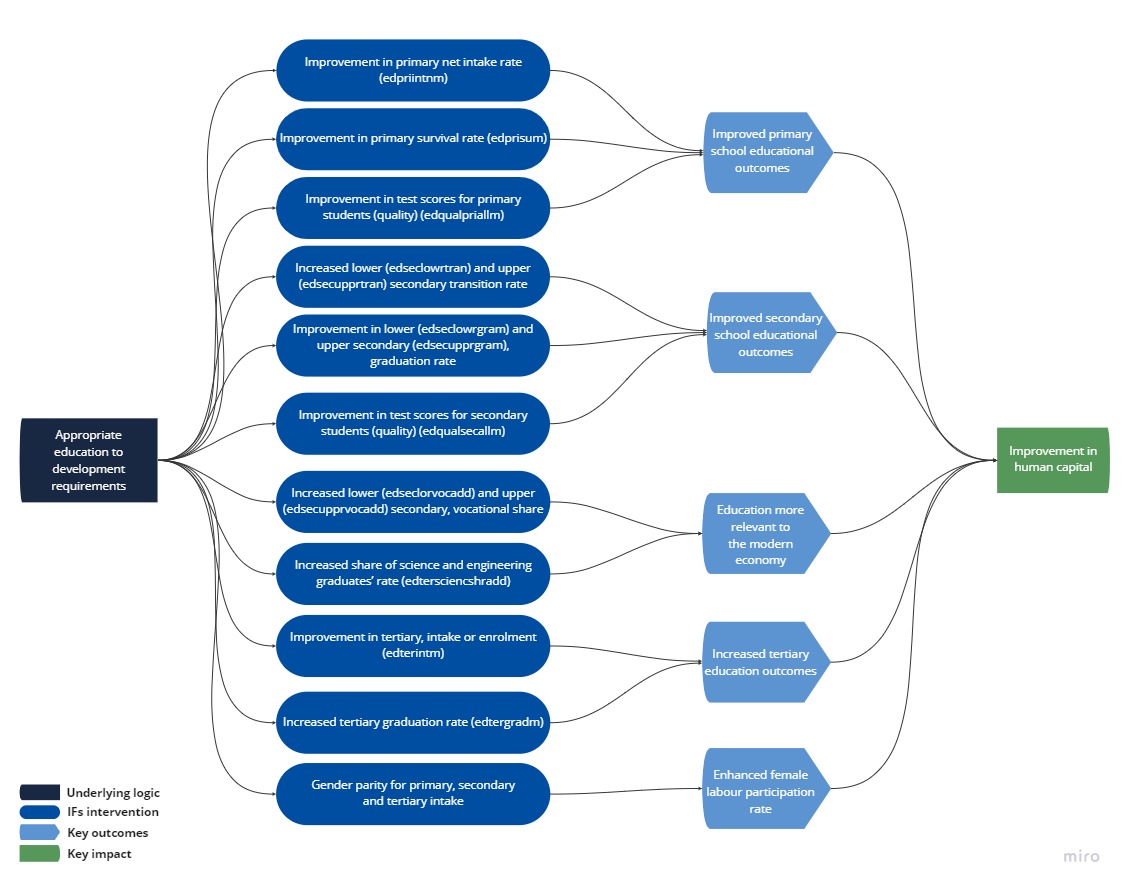
The Education scenario represents reasonable but ambitious improvements in the intake, transition and graduation rates from primary to tertiary levels of schooling and increases in the quality of education. It also models substantive progress towards gender parity at all levels, additional vocational training at secondary school level, and increases the number of science and engineering graduates.
In 2019, the mean years of adult education in Kenya was estimated to be 6.3 years, which was a year lower than the average of 7.3 for lower middle-income countries on the continent. In terms of gender parity, the mean years of education for males was 6.8, one year more than for females. However, this gap is lower than the average of 1.3 years for lower middle-income countries in Africa, meaning that Kenya has performed relatively better at closing the gender gap. In the Education scenario, the mean years of adult education will rise to 8.6 by 2043, which will be equal to the average for lower middle-income countries in Africa and 0.4 years more than on the Current Path forecast. By 2043, males are expected to have 0.7 more years of education than females in both the Current Path forecast and the Education scenario. This will be on par with the gap between males and females in lower middle-income African countries by then.
While access to education is important, the quality of education determines the human capital formation of the country. Quality education is usually measured by the student’s ability to pass their test. A critical contributor to student performance is the number and quality of teachers available. In 2021, there were 220 744 teachers in public primary schools, of which 83.5% were certificate holders, 8.4% had diploma qualifications, 7.9% had bachelor’s degrees and 0.2% had either master’s or doctorate degree qualifications. Primary education quality in Kenya was above the average for lower middle-income Africa and it is set to improve considerably. The average test score for primary learners in Kenya in 2019 was 34.3, slightly higher than the average of 33.1 for lower middle-income countries in Africa. On average, females in Kenya have a slightly higher primary test score than their male counterparts. The Education scenario will increase average test scores for primary learners to 47.4 in 2043 so that by then, the average will be 24.3% above the Current Path forecast. In addition, the quality of primary education in the Education scenario will be 33.6% higher than the Current Path average for lower middle-income African countries.
At secondary level, there were 120 279 teachers in public secondary schools and teacher training colleges in 2021. An overwhelming 96.6% of the teachers at the public secondary schools and teacher training colleges had bachelor’s degrees and 1.4% had either master’s or doctorate degrees. The remaining either held diploma qualifications or a Post Graduate Diploma in Education. The average secondary test score in Kenya was about 40.9, slightly below the average for its income peers on the continent at 41.4. There is no significant difference between the test scores of males and females. By 2043, the average test scores for secondary learners in the Education scenario will improve by 15% relative to the Current Path forecast and will be 21% higher than the Current Path average for lower middle-income countries in Africa.
Modern infrastructure can improve productivity, augment healthy lifestyles, boost educational outcomes and facilitate government effectiveness. Infrastructure development is positioned as a key enabler in the Vision 2030 strategy. Indeed, the MTP2 emphasises the need to enhance efficiency and competitiveness of the economy through investment in infrastructure.[1Republic of Kenya, Second Medium Term Plan 2013–2017: Transforming Kenya: Pathway to devolution, socio-economic development, equity and national unity, 2013] Physical infrastructure, such as roads and railways, is a critical driver of economic growth and an important component of development. It facilitates the movement of people, goods and services, promotes inter and intra-country trade and serves as an enabler of social service provision such as education and health.
The Kenyan government continues to make efforts to improve the road network in the country. A key achievement listed by the Kenyan government under the MTP2 was the construction or rehabilitation of 3 250 km of road from 2013 to 2017. In 2020/21, total national government expenditure on roads amounted to KSh 195.3 billion (US$195.3 million). Out of this, trunk[2A major road used for long distance connecting at least two cities, airports or ports. ] and primary roads expenditure accounted for 39%, and secondary and minor roads expenditure constituted 21.8% of total expenditure. The remaining amount was spent on miscellaneous roads and maintenance and repairs.
As a result, there are several ongoing road construction projects at various stages of completion. Key among them include Kenol–Sagana, Lokitaung Junction–Kalobeyei River, Kalobeyei River–Nadapal/Nakodok, Mau Mau Road Lot2 Murang’a, Mombasa–Kwa Jomvu Road, and Sagana–Marua. The government has also resorted to public–private partnership agreements to build more road networks. Through the public–private partnership arrangement, important roads such as the 108.4 km-Nairobi Expressway have been constructed at a total cost of KSh 72.8 billion (US$72.8 million). Other roads constructed under public–private partnership arrangement in the period include the upgrade of the Nairobi Eastern Bypass and the construction of the Makupa Causeway Bridge. Notwithstanding this progress, Kenya is still lagging behind in regard to the quality and reach of its road network.
In 2019, the total length of roads in Kenya was estimated to be 173 300 km of which only 13 440 km, or 7.8%, were paved. The length of paved international trunk roads in 2021 totalled 54 000 km, while paved national trunk roads totalled 56 000 km. At the same time, the length of super highways and primary paved roads in the country were 157 km and 75 000 km, respectively. On the Current Path, by 2043 the total road network in Kenya will increase to 221 227 km, of which 47.3% will be paved. The SDG Indicator 9.1.1 refers to the proportion of the rural population who live within 2 km of an all-season road and is captured in the Rural Access Index. In 2019, the proportion of Kenyans who lived within 2 km of an all-weather road was 63.8% compared with the 67.3% average for lower middle-income countries in Africa. Access to rural areas is essential for improving integration and interaction between rural and urban economies, which is important for spurring local economic development.
The R2000 and the R10000 programmes initiative serve as a means to improve and upgrade road networks in the country using local resources that are technically and economically feasible. Through these programmes, the national government, in partnership with county governments and other stakeholders, has developed rural roads across the counties. For instance, in 2021, a total of 2 712.5 km of roads were constructed under these programmes. Indeed, with the exception of Mombasa, Lamu and Nairobi City, all counties in the country had ongoing roads constructed under the R2000 and R1000 programmes between 2020 and 2021. By 2043, the proportion of the rural population with access to an all-weather road will improve slightly to 68.8%, which will be below the average of 73.6% for lower middle-income countries in Africa.
Kenya relies heavily on renewable energy for producing electricity, although total production is quite small. In 2015, it was estimated that geothermal and hydro energies constituted 46% and 39% of electricity production, respectively. The remaining energy sources were biofuels, oil and wind. By 2021, electricity generation from renewable sources accounted for 90% of all electricity in Kenya. The principal renewable energy source was geothermal generation, which accounted for 40.6%, followed by hydro generation at about 30% and wind generation at 16%. The remaining 10% was sourced from thermal sources, which is the only non-renewable electricity generation source in the country.
Total installed capacity for electricity in 2021 stood at 2 989.6 MW — a rise from 2 836.7 MW in 2020. The increased capacity was as a result of a rise in solar and hydro capacity. Similarly, total electricity generation increased by 7% in 2021 due to a 67.3% rise in thermal generation. The addition of the Kipeto Wind Power Project also increased wind electricity generation. Likewise, the addition of the Selenkei, Cedate and Malindi power plants to the grid also increased solar generation in 2021. There are still efforts to increase generation capacity with the expected completion of the Olkaria I Unit 6 geothermal power plant in 2022 and an additional six solar, geothermal and wind power plants from 2026 to 2030. Total domestic demand for electricity stood at 9 565.4 GWh in 2021, accounting for 98% of total electricity supplied. The growth in demand was as a result of a rise in demand for electric street lighting and rural electrification as well as demand for domestic and small commercial usage. Demand for domestic and small commercial usage accounted for 42.7% of total domestic demand, while commercial and industrial usage constituted 49.4% of domestic demand.
Aside from physical infrastructure, technological advancement is essential for economic growth. Technology improves productivity, and reduces transaction costs and bottlenecks associated with doing business. The ICT sector in Kenya boomed during the COVID-19 pandemic, just like in all other countries. As a result of the disruption in global supply chains emanating from COVID-19 pandemic restrictions, businesses and consumers resorted to online channels for commercial and recreational purposes. Resultantly, the value of output of the ICT sector grew by 6.9% in 2021 with a total of 420 licenced Internet service providers in Kenya. The country is more prepared than most in Africa to support and sustain e-commerce activity, ranking fourth in 2020 in UNCTAD’s B2C E-commerce Index, which measures an economy’s preparedness to support online shopping. However, an area of concern, which hampers online trade in the country, is Internet access, a metric the country ranked 18th on the continent for in 2019.
Kenya is generally recognised as a leader in mobile telephony, but its progress in fixed lines has lagged, negatively affecting Internet access as a result. In 2021, fixed telephone capacity stood at 121 000 while fixed total connections was 14 800 in 2021 consisting of 13 626 wireline connections and 1 174 wireless connections. Total wireless Internet subscriptions stood at 45.7 million while total fixed wired Internet subscriptions were estimated to be 672 700 in 2021.
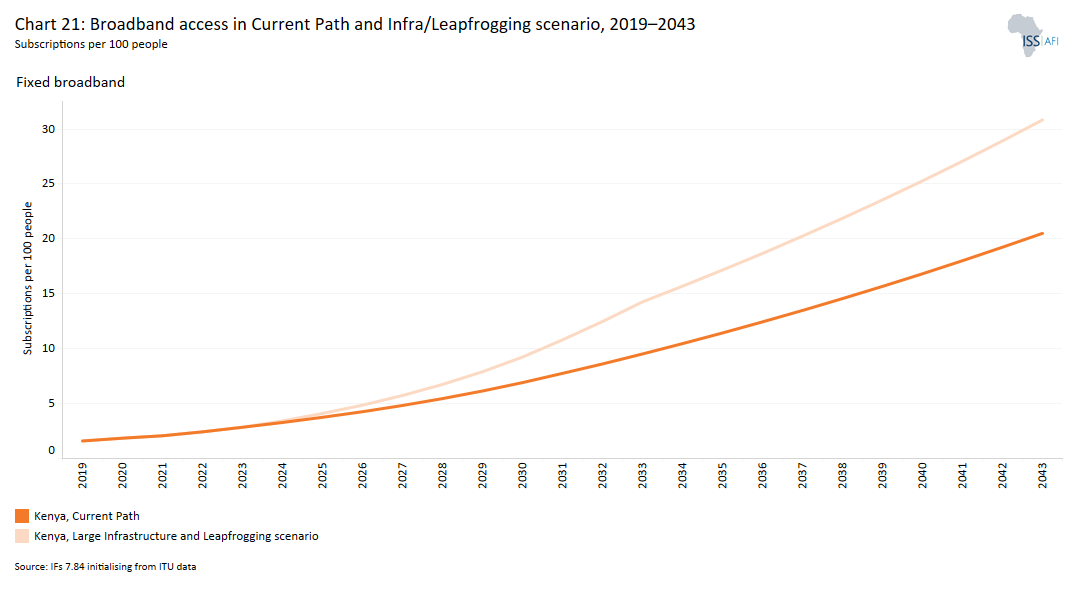
In 2019, the total number of fixed[3Fixed broadband includes cable modem Internet connections, DSL Internet connections of at least 256 KB/s, fibre and other fixed broadband technology connections (such as satellite broadband Internet, ethernet local area networks, fixed-wireless access, wireless local area networks, WiMAX, etc.)] broadband subscriptions in Kenya was estimated at about 1.6 per 100 people. This was lower than the average of 3.3 for lower middle-income countries in Africa on the Current Path. Fibre to the home (FttH) is the largest share of total fixed broadband subscriptions accounting for 61% of subscriptions followed by cable modem subscriptions at 28.8%. Fibre to the office (FttO), copper line and other fixed broadband subscriptions constitute the remaining 10%. Despite being low, subscription to fixed broadband is growing. In 2021, total fixed wired broadband recorded 673 178 subscriptions, which was mainly driven by 20.7% growth in FttH subscriptions and 11.8% growth in FttO subscriptions. In the Current Path forecast, fixed broadband subscriptions will rise to 20.5 per 100 people by 2043.
Notwithstanding the low subscription to fixed broadband rates, mobile broadband subscription in Kenya is high. Mobile subscriptions rose by 6% to 65.1 million in 2021, while the number of mobile money subscribers also grew 8.5% to 35.2 million. In addition, total volume of mobile money transfer increased by 31.7% totalling KSh 6.9 trillion (US$6.9 billion) in 2021, and the value of commerce transaction amounted to KSh 15.3 trillion (US$15.3 billion) representing a growth of 63.2% from 2020. Mobile broadband refers to wireless Internet access delivered through cellular towers to computers and other digital devices. Mobile telephone capacity totalled 96 million in 2021 — a decline from the 96.7 million it recorded in previous year. Within the same year, the government increased the spectrum of international mobile telecommunications to 560 MHz in 2021 from the 360 MHz in 2020.
In 2019, Kenya had a mobile broadband subscription rate of 51.1 per 100 people, which was greater than the average of 49.1 for lower middle-income countries on the continent. Higher bandwidth capacity enables networks to handle surges and new patterns in Internet traffic. In 2021, bandwidth capacity in Kenya grew by 34.6% to 10.9 million Mbps. This consists of 20.2% increase in undersea bandwidth utilisation to 4.8 million Mbps, although satellite bandwidth slightly declined to 4.8 million Mbps.
The Kenya Vision 2030 underscores the importance of the informal sector in creating employment and driving the growth and productivity of the country. The informal sector in Kenya consists of semi-regulated, small-scale activities that mainly rely on low-level technology and are typically semi-organised. However, the ease of entry and exit makes it an easy platform for employment generation. The country’s first MTP (MTP1, 2008–2012), under the Vision 2030, identified low productivity, limited technological transfer, inadequate market access, information asymmetry and poor health and occupational safety measures as factors characterising the activities of the informal economy.
The majority of informal sector workers are engaged in wholesale and retail trade, and the hotel and restaurant industry. Over 80% of all jobs are created in the informal sector, and about 41% of youth employment occurs in this sector. For instance, in 2021, a total of about 15.3 million people were employed in the informal sector, equivalent to over 80% of all employment in the country, and a rise from 13.5 million in 2017. Out of this, rural inhabitants accounted for 59% of people employed in the sector. In addition, the sector created 753 800 jobs (an increase of 5.5% compared with 2020), representing 81.4% of all jobs created outside small-scale agriculture and pastoralist activities in the same year.
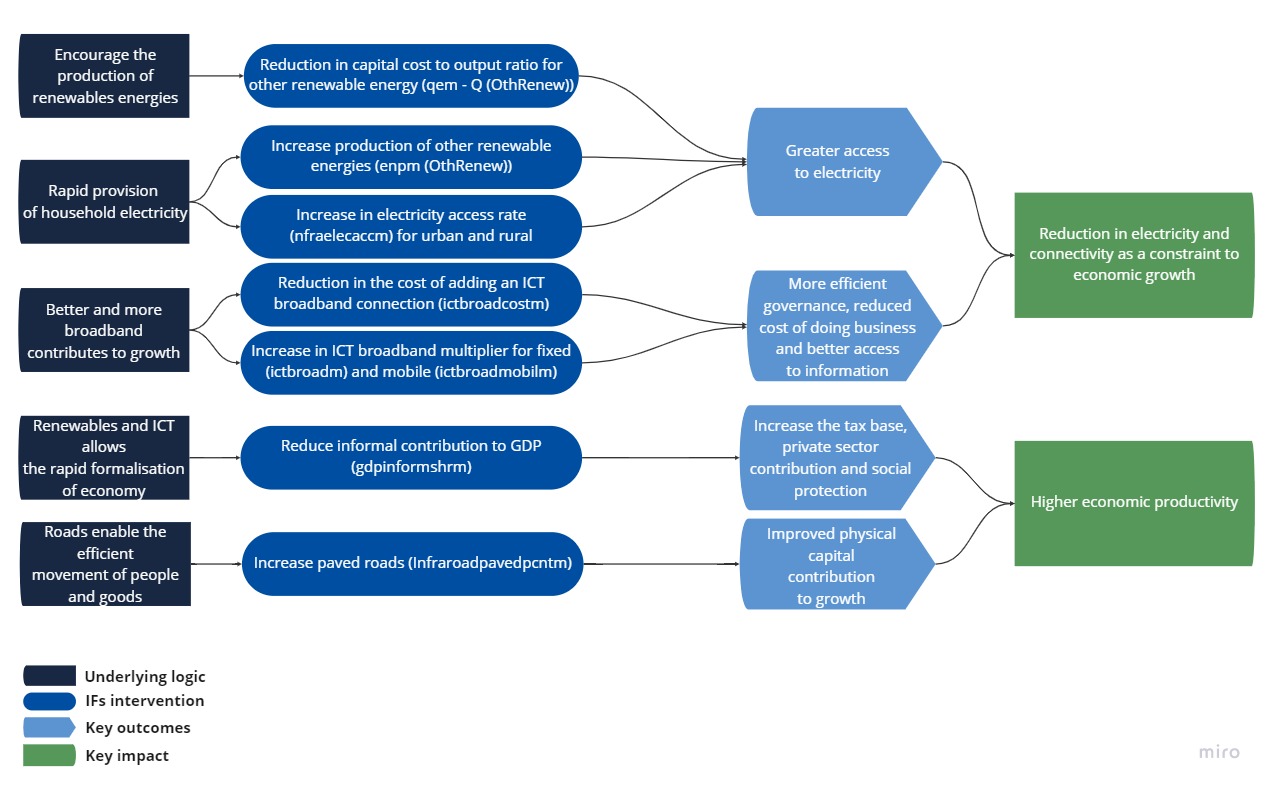
From the foregoing discussion, it is clear that road infrastructure, particularly paved roads, is low in Kenya. Also, despite its huge renewable energy potential, Kenya has not been able to increase electricity access to all citizens, especially in rural areas. Further, while the country has performed extremely well in ensuring access to mobile broadband, access to fixed broadband is lagging. Finally, Kenya has a huge informal sector that if formalised can increase GDP, government revenue and productivity. With these challenges in mind, the Infrastructure scenario addresses the need for improved road networks, increasing the amount of road which is paved in Kenya. Additionally, the scenario models a reasonable but ambitious increase in the adoption of and investment in renewable energy technologies, resulting in better access to electricity in urban and rural areas. The scenario includes accelerated access to broadband, especially fixed, and the adoption of modern technology that improves government efficiency and allows for the more rapid formalisation of the informal sector.
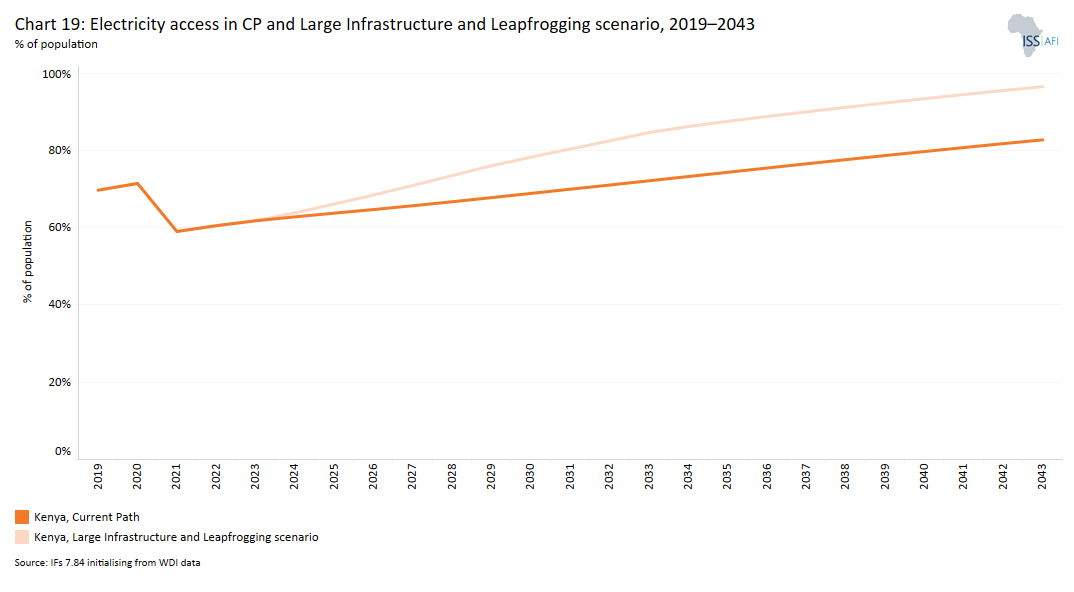
In 2019, 34.3 million people (69.7% of the Kenyan population) had access to electricity. This was above the average of 66.3% for lower middle-income countries in Africa. In contrast to 90.8% of urban residents, only 61.7% of rural dwellers had access to electricity in 2019, depicting a location disparity in favour of urban areas. The rural electrification programme, aimed at rural electricity access, increased the number of customers connected to about 410 000 between 2020 and 2021. On the Current Path, access to electricity is projected to reach 82.7% of the population by 2043. The disparity in electricity access in favour of urban residents will continue as 93% of urban residents will have access to electricity compared with 75.8% of rural residents by 2043.
Based on the Infrastructure scenario, it is expected that 96.5% of the population will have access to electricity by 2043, compared with 82.7% of the population in the Current Path forecast. The proportion of people with access to electricity in the Infrastructure scenario in 2043 will be higher than the average of 81.7% for lower middle-income countries in Africa on the Current Path. By 2043, 98.5% of urban residents will have access to electricity in the Infrastructure scenario, compared with 93% in the Current Path forecast. The proportion of people in rural areas with access to electricity will rise sharply to 95.6% in the Infrastructure scenario, compared with 75.8% in the Current Path forecast. It means that the Infrastructure scenario has the potential to markedly close the electricity access gap between urban and rural inhabitants.
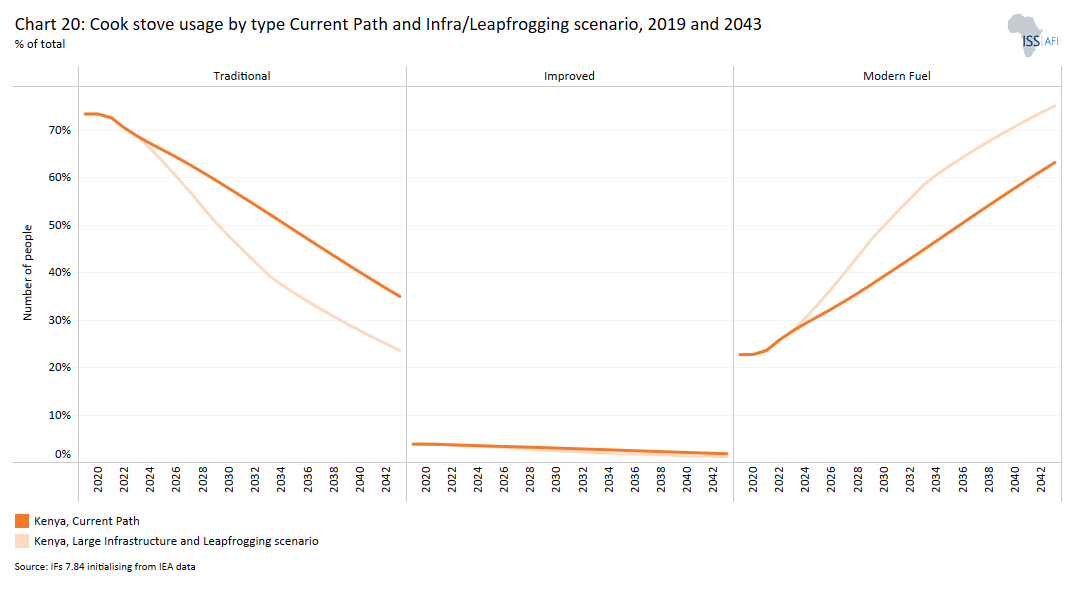
As access to electricity in urban and rural areas increases, more households switch from traditional cooking stoves, such as wood-burning stoves and coal stoves, to improved and modern fuel stoves, such as electric and gas cookers. The IFs model distinguishes between three types of cooking stoves: traditional, improved and modern. In 2019, 73.4% of households in Kenya used traditional stoves for cooking while 3.9% used improved cooking stoves. The proportion of households that used modern stoves for cooking stood at 22.7%.
Based on these findings, it is clear that about three-quarters of all households in Kenya still rely on traditional stoves for cooking, thereby contributing to pollution and carbon emissions, and negatively impacting the health of these households. This is expected given the large proportion of Kenyans who live in rural areas where the use of traditional stoves is prevalent. By 2043, the composition of cooking stove usage in Kenya will reverse such that only 23.6% of households will use traditional stoves in the Infrastructure scenario compared with 35% in the Current Path forecast. Consequently, the proportion of households that are expected to use modern stoves for cooking will constitute 75.1% of households in the Infrastructure scenario compared with 63.2% in the Current Path forecast by 2043.
In 2019, fixed broadband subscriptions in Kenya was estimated at about 1.6 per 100 people. In the Current Path forecast, this will rise to 20.5 per 100 people by 2043. The Infrastructure scenario will lead to a much larger increase in fixed broadband, so that, by 2043, subscriptions will likely be at 30.8 per 100 people. This will be higher than the average of 20.5 subscriptions per 100 people on the Current Path. The number of subscriptions by 2043 in this scenario will also be greater than the average of 28 per 100 people for lower middle-income African countries.
In 2019, Kenya’s mobile broadband subscriptions equaled 51.1 per 100 people, which was higher than lower middle-income Africa’s average of 49.1 in the Current Path. Because Kenya is already performing well in terms of access to mobile broadband, with the Current Path forecast reaching 153 subscriptions by 2043, the Infrastructure scenario has only a marginal impact. Both the Current Path forecast and the Infrastructure scenario get to 153 subscriptions per 100 people by 2043, which is higher than the average of 144.7 for Africa’s lower middle-income countries.
Agriculture forms an integral part of the Kenyan economy, serving as a source of livelihood for about 40% of the population in general and 70% of rural inhabitants. The sector also accounts for 65% of the country’s total export earnings. Total agricultural land stood at 28 million hectares in 2019, constituting over 48% of the total land in the country. In 2021, the performance of the agriculture sector declined due to a decline in crops, particularly maize and coffee production, as well as livestock production. This could be attributed to unfavourable weather conditions that occurred in some parts of the country together with leaf rust infestation, increase in the cost of farm inputs, and increased switch in coffee land farming for real estate purposes. Some of the more important agricultural commodities produced in Kenya include corn, tea, coffee, rice, wheat, sugar, livestock, cut flowers and vegetables.
The data on agricultural production and demand in the IFs forecasting platform initialises from data provided on food balances by the Food and Agriculture Organization (FAO). IFs contains data on numerous types of agriculture but aggregates its forecast into crops, meat and fish, presented in million metric tons.
Total agriculture production in 1990 stood at 16.9 million metric tons. Of this, 13.5 million metric tons were crops, 3.2 million metric tons meat production, with the remaining constituting fish production. Total agricultural production in 1990 exceeded domestic demand by 310 000 metric tons, meaning that the country had a surplus of agricultural commodities and was technically food sufficient. However, since then, domestic demand has outgrown production, and by 2019, agricultural demand exceeded domestic production by 2.9 million metric tons, despite production increasing to 31 million metric tons. Of this, crop production constituted 78.2%, meat production 21.3%, and fish production constituted the rest of the total of production. The majority of the demand is for crops, constituting 81.5% of total demand (27.6 million tons). The remaining demand is mainly for meat (6.8 million tons), and the smallest demand is for fish (170 000 tons).
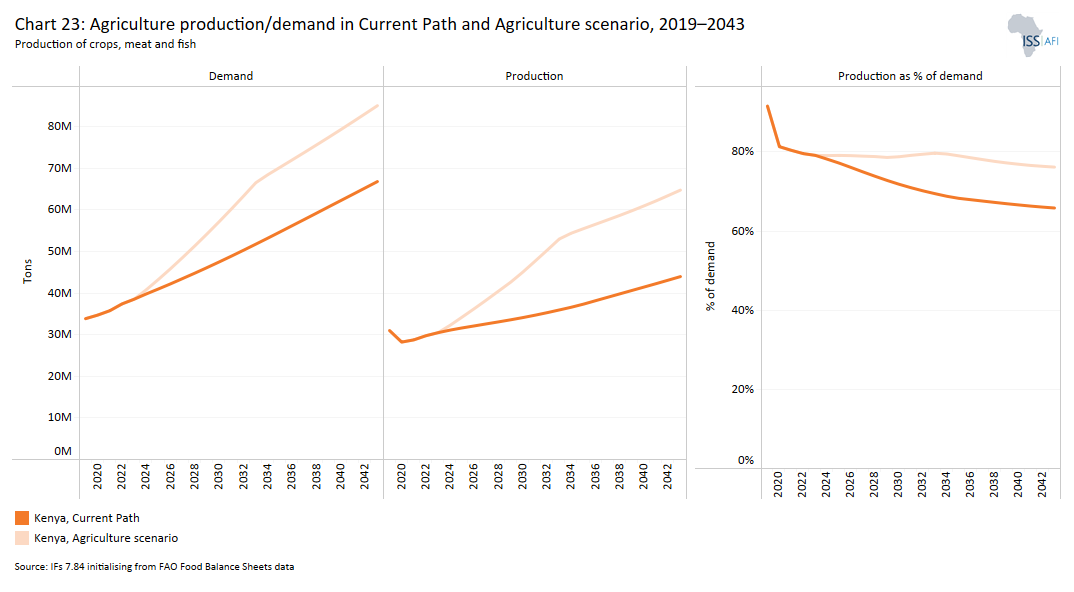
Despite the projected increase in domestic production to reach 44 million metric tons in 2043, it will not be enough to meet domestic demand of 66.8 million metric tons. As a result, agricultural demand will surpass domestic production by 22.8 million metric tons. This means that Kenya faces the risk of food shortages in the future if drastic measures are not adopted to revamp the agriculture sector to increase domestic production.
Increased food insecurity in the country, according to a 2018 UNICEF report, has been the result of severe drought conditions. Over the past four decades, Kenya has battled 74 devastating natural disasters of which 54 were floods and 14 were droughts. In addition, most of the regional climate models show a potential increase in the severity of rainfall in East Africa making the country even more susceptible to floods in the future. This will impact negatively on the 70% rural population that base their livelihoods on the agriculture sector.
The data on yields per hectare (in metric tons) is for crops, but it does not distinguish between different categories of crops. The average crop yield per hectare was 4.2 metric tons in 2019, which was below the average of 5 metric tons per hectare for lower middle-income countries in Africa, indicating that Kenya has not been able to adopt modern farming practices effectively like its income peers to improve yields. On the Current Path, yield per hectare will rise to 4.2 tons which will still be below the average for lower middle-income African countries.
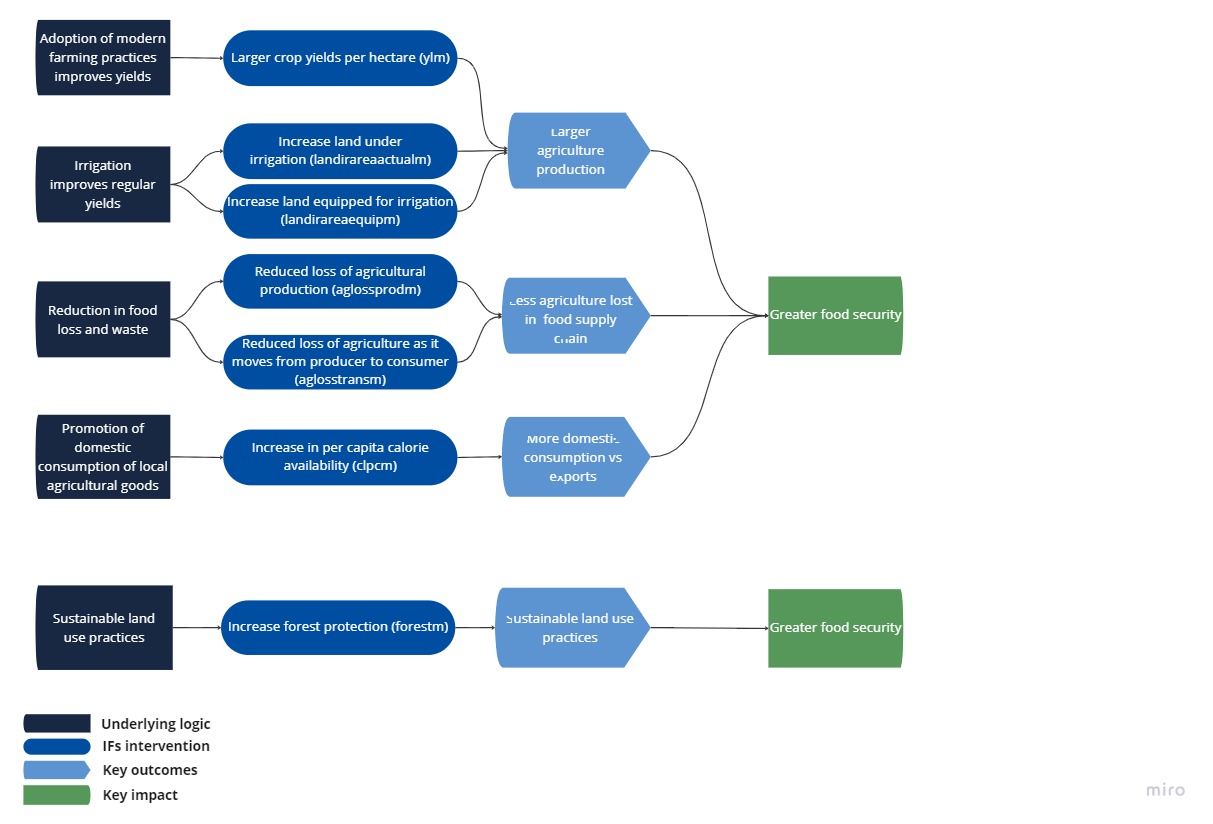
The Current Path analysis has shown that agricultural production in Kenya is low and unable to meet domestic demand. This is partly attributable to low yield per hectare due to the inability of farmers to adopt modern and efficient technology for farming. Other challenges facing the sector in Kenya include a poor infrastructure network in the rural areas, poor climatic conditions and the overreliance on maize as the staple food crop. In addition to this, land ownership issues are affecting agricultural productivity in the country. Many smallholder farmers do not have title deeds to their land due to the high cost associated with registering land and acquiring titles. As a result, the Agriculture scenario represents reasonable but ambitious increases in yields per hectare (reflecting better management and seed and fertiliser technology), increased land under irrigation, and reduced loss and waste. It includes an increase in calorie consumption, reflecting the prioritisation of food self-sufficiency above food exports as a desirable policy objective.
In the Agriculture scenario, yield per hectare will increase faster, such that by 2043, it will reach 6.7 metric tons — 2.5 metric tons per hectare higher, or a 60% improvement, compared with the projections of the Current Path. By then, average yield per hectare in Kenya will be slightly above the average of 6.4 metric tons for lower middle-income countries in Africa. Due to the high yields expected in the Agriculture scenario, total agricultural production will rise to 64.8 million tons in this scenario — 20.8 million tons, or 47.3%, more than the Current Path forecast by 2043. Annual crop production in Kenya will increase to 45.9 million tons in the Agriculture scenario by 2043. This will be 17 million tons, or 59%, higher than the Current Path forecast for that year. Meat production will increase to 18.6 million tons from 2019 to 2043 in the scenario, representing a 25.8% increase above the Current Path forecast.
With total agriculture demand outgrowing domestic production, Kenya will have to resort to importation to meet the excess demand for agricultural commodities. In 2019, Kenya’s net agricultural imports were 18.5% of agricultural demand, which exceeded the average of 12.2% for lower middle-income countries in Africa. Fish imports stood at 13.8% of total demand and meat imports stood at 3.1% of total demand. Importing crop food appears to be the highest in Kenya valued at 22.2% of total demand in 2019. Although the country exports agricultural commodities such as tea, coffee, cut flowers and vegetables, it also imports large amounts of wheat, palm oil, sugar and rice to make up for the shortages in domestic production. For instance, in 2020, the country imported about 1.9 million tonnes of wheat.
In the Current Path forecast, net agricultural imports will increase to 35% of total agriculture demand by 2043, signalling growing national food insecurity, which is also due to changes in dietary preferences. The Agriculture scenario mitigates this situation, such that by 2043, import dependency is projected to reach 24.2%. Although this is quite high, it will be below the projected Current Path average of 33.3% for lower middle-income countries in Africa. By 2043, the importation of crops will constitute 30.5% of agriculture demand in the scenario compared with 45% in the Current Path. However, the importation of meat will increase in the scenario to reach 1.3% of total demand compared with the 1% on the Current Path in 2043. Likewise, importation of fish will increase in the Agriculture scenario reaching 50.7% of total demand compared with the 35.4% expected to occur on the Current Path.
The manufacturing sector is historically a key job creator, and output and export promotion sector, and it allows for the structural transformation of economies towards higher productivity, with spillover effects to other sectors. The sector is key in achieving economic development due to its backward and forward linkages with other sectors such as the agriculture sector and the service sector. In 2021, manufacturing subsectors like non-metallic mineral products (such as cement), leather and related products, dairy products, motor vehicles, trailers and semi-trailers, and sugar and meat products witnessed a growth in their performance. In contrast, the performance of subsectors such as prepared and preserved fruits and vegetables, animal and vegetable fats and oils, furniture, and pharmaceutical products declined in 2021.
The IFs platform uses data from the Global Trade and Analysis Project (GTAP) to classify economic activity into six sectors: agriculture, energy, materials (including mining), manufacturing, services, and ICT.
By 2019, the three largest contributors to GDP in Kenya were the service, agriculture and manufacturing sectors. The service sector contributed US$39.4 billion, equivalent to 58.5% of GDP. The agriculture sector, which is currently the second largest contributor to GDP, contributed US$13.9 billion, equivalent to about 20.7% of GDP. The manufacturing sector contributed US$8.6 billion, representing 12.3% of GDP in 2019, while the ICT sector contributed US$3.3 billion, constituting 4.8% of GDP. The contributions of the energy and materials sectors in 2019 were marginal and valued at US$1 billion and US$1.7 billion, respectively.
On the Current Path, the service sector is expected to almost quadruple in size to US$153.5 billion by 2043, which corresponds to 64.8% of GDP. By 2043, the manufacturing sector will overtake the agriculture sector as the second largest contributor and contribute about 12 percentage points more than agriculture to the economy. This will correspond to contributions of US$43.2 billion and US$15.1 billion for the manufacturing and agriculture sectors, respectively. The growth in the share of the manufacturing sector relative to the agriculture sector is associated with structural transformation of an economy which can lead to job creation. The Big Four, under the MTP3, identified textiles, agro-processing, leather, construction materials, oil and mining, iron and steel, and ICT as its priority sectors to grow manufacturing in Kenya.
At the initial stages of manufacturing, unskilled labourers are usually negatively affected. This is typically compensated for with welfare transfers especially to unskilled labour in the short term. As the economy shifts towards aggressive manufacturing, businesses begin to move from labour-intensive manufacturing towards capital intensive. Ultimately, labour, particularly unskilled labour, is displaced by capital, which may worsen poverty and inequality. Welfare losses are usually compensated for with social grants such as welfare transfers to compensate for the loss in income. These transfers should ease the disruption and displacement of labour caused by a transition towards aggressive manufacturing in the economy.
There are various welfare transfers in Kenya that are aimed at poor and vulnerable households. The government provides social assistance under three main schemes: cash transfers to orphans and vulnerable children, persons with severe disabilities, and older persons, and hunger-stricken households targeted at four counties in Northern Kenya. In 2020/21, KSh 7.1 billion (US$7.1 million) was disbursed under the Cash Transfers for Orphans and Vulnerable Children Programme to 293 665 households; KSh 814.8 million (US$814 800) disbursed through the Cash Transfers for Persons with Severe Disabilities Programme to 33 948 households, and KSh 18.3 billion (US$18.3 million) disbursed under the Hunger and Safety Net Programme to 763 553 households.
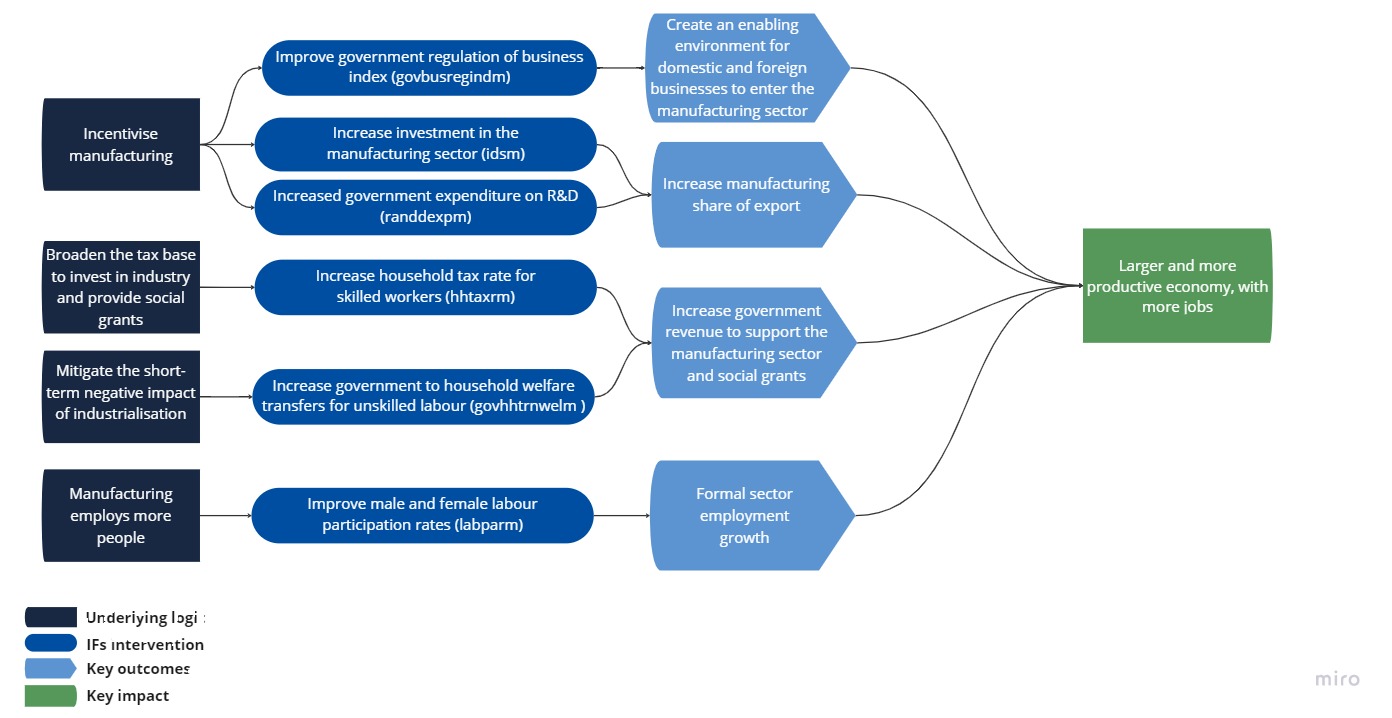
With weak manufacturing growth in Kenya, the Manufacturing scenario models robust manufacturing growth through greater investments in research and development, investment in the manufacturing sector, and promotion of the export of manufactured goods. It is also accompanied by an increase in welfare transfers (social grants) to moderate increases in inequality that are often associated with the initial stages of industrialisation due to an initial consumption crunch caused by a reallocation of resources to push the manufacturing sector.
In the Manufacturing scenario, the manufacturing sector is projected to contribute an additional US$31 billion to GDP in 2043, which will be equivalent to 9.9 percentage points above the Current Path forecast. However, the contribution of the service sector to GDP in this scenario is projected to decline by US$10.5 billion by 2043 compared with the Current Path forecast. This translates to an 8.3 percentage point reduction as a percentage of GDP compared with the Current Path forecast. The ICT sector is set to contribute US$1.6 billion less to GDP by 2043, which equates to a 1 percentage point decrease as a percentage of GDP over the Current Path forecast. The contribution of the agriculture sector to GDP will decline by 0.45 percentage points below the Current Path forecast in this scenario, translating into an absolute reduction of US$40 million by 2043.
Regarding welfare transfers, the total welfare transfers to Kenyan households amounted to US$6.7 billion in 2019. The Manufacturing scenario will almost quintuple welfare transfers in Kenya to US$34.7 billion by 2043, constituting an increase of about 418% between 2019 and 2043. This exceeds the projected US$28.9 billion in the Current Path forecast, meaning that the Manufacturing scenario leads to an additional US$5.8 billion (or 20% more) in government welfare transfers relative to the Current Path forecast by 2043.
The benefit of trade is to enable countries to specialise in the production of commodities they have a comparative advantage in and export them while importing those that are relatively costly to produce or unavailable in their home countries. Trade also opens up factors of production to be distributed in a more efficient manner and increases the total factor productivity of firms through competition and increased knowledge transfers.
One of the goals of Kenya’s Vision 2030 is to achieve an export sector that constitutes 29% of GDP by 2022. In 2019, the value of Kenya’s exports stood at US$7.9 billion, equivalent to 11.7% of GDP, which was below the average of 22.1% of GDP for lower middle-income countries in Africa. According to the Kenya National Bureau of Statistics, the value of principal domestic exports stood at KSh 666.7 billion (US$666.7 million) in 2021 — a rise of 17.5% compared with its 2020 figure. This growth was driven by a rise in earnings from horticultural products, articles of apparel and clothing accessories, animal and vegetable oils, titanium ores and concentrates, and iron and steel. However, the quantities of tea, coffee, iron and steel exported all declined. The majority of Kenya’s exports are destined for other African countries, particularly in the East African economic bloc, which accounted for 54% of all Kenya’s to other African countries in 2021.
Uganda remains the biggest recipient of Kenya’s exports of cement clinkers, palm oil, flat-rolled products of iron and non-alloy steel and re-exports of machine tools for drilling, boring, sinking, milling, threading or tapping, among other things. Kenya also exports to other African countries such as Tanzania, Rwanda, South Sudan, Egypt, Somalia and the Democratic Republic of the Congo. On the global scene, Kenya’s largest export destinations are Europe (the EU) and Asia. To this end Kenya is proceeding with the finalisation of the EU-Kenya Economic Partnership Agreement (EPA) to boost trade in goods and create new economic opportunities for the country. The agreement will provide duty-free, quota-free EU market access to all exports from Kenya (except arms) once it enters into force, as well as partial and gradual opening of the Kenyan market to imports from the EU. Kenya exports significant portions of commodities such as cut flowers, avocados, and pharmaceutical plants to the EU. Exports to Asia, particularly to China and India, include titanium ores and concentrate, dried leguminous vegetables and tea. The country also exports macadamia nuts and articles of apparel and clothing accessories to the United States (US). On the Current Path, total exports will equal 12.5% of GDP in 2030 and 14.6% of GDP, equivalent to US$34.6 billion, in 2043. Despite the growth in the export of Kenya on the Current Path, it will still lag behind the Current Path average of 23.5% for lower middle-income African countries
In terms of imports, Kenya’s total imports stood at US$14.2 billion, equivalent to 21.1% of GDP, which was below the 28% average for lower middle-income countries in Africa in 2019. Import expenditure increased from KSh 1 643.6 billion (US$1 643.6 million) in 2020 to KSh 2 151.2 billion in 2021. This was mainly attributable to the growth in the importation of commodities such as petroleum products, iron and steel, animal and vegetable fats and oils, wheat, rice, maize, industrial machinery, and road motor vehicles. For instance, petroleum expenditure alone stood at KSh 335.3 billion in 2021 due to the rise in the price of crude oil on the international market. However, quantities of imported cement clinkers, wheat flour, animal and vegetable fats and oils, chemical fertilisers, insecticides and fungicides all fell.
By far, the majority of Kenya’s imports come from Asia (China and India), accounting for 65.7% of its total import bill in 2021. Imports from China alone represent 20.5% of total import value in 2021. The country imports goods like motor spirit premium, gas oil and other refined petroleum products, crude palm oil, iron and steel, and assorted machinery and equipment from Asia. Kenya imports petroleum products, bridges and chemical products from the EU, particularly from the Netherlands, Germany, Italy, Belgium, Spain and Poland. It also imports alcoholic beverages, motor vehicles, and paper and paperboard from the UK. In addition to the imports from Asia and Europe, the country imports liquefied butanes, aircraft equipment and parts, and medicinal and pharmaceutical products from the US. Closer to home, Kenya imports commodities such as maize, rice, sugar and milk from EAC countries including Uganda and Tanzania. On the Current Path, total import value will rise to US$37.6 billion, representing 15.9% of GDP, by 2043. At this value, Kenya’s import value will be lower than the 28% projected for its income peers on the continent.
Thus, although Kenya’s economy is open to trade, its trade with other African countries is limited compared with China, the EU and the US. As such, as the country has ratified the African Continental Free Trade Area (AfCFTA) agreement, the AfCFTA scenario represents the impact of the full implementation of the AfCFTA by 2043 through increases in exports, improved productivity, increased trade and reduced tariffs.
Trade openness measures the extent to which a country is engaged in the global trading system. This is calculated using the sum of the total exports and the total imports over the total GDP. A higher ratio depicts higher influence of trade on domestic activities while a lower ratio represents a country that trades less in the global system. In 2019, the sum of Kenya’s exports and imports amounted to 31.7% of GDP compared with the average of 49.9% for lower middle-income countries in Africa. It means that on average, Kenya’s economy is less open to trade compared with its peers on the continent. In the AfCFTA scenario, the sum of Kenya’s exports and imports as a percentage of GDP will reach 38.1% by 2043. This will be about 8 percentage points above the Current Path meaning that Kenya is expected to trade more under the AfCFTA. However, Kenya’s trade openness ratio will still be below the average of 51.6% of GDP for its income peers on the continent.
Trade balance is the difference between the value of a country's exports and its imports. A country that imports more goods and services than it exports in terms of value has a trade deficit, while a country that exports more goods and services than it imports has a trade surplus. While Kenya imports large volumes of mostly finished or processed goods, most of its exports, which are low, are raw materials, with little or no value addition occurring within the country. This results in low export revenues, and the country therefore operates a trade deficit.
Kenya’s trade deficit in 2019 represented 9.3% of GDP, which was higher than the average of 5.9% for lower middle-income African countries on the Current Path. Throughout the forecast period, the AfCFTA scenario leads to a faster improvement in Kenya’s trade balance than the Current Path forecast. By 2043, Kenya’s trade deficit in the Current Path will constitute about 1.3% of GDP, whereas in the same year, the AfCFTA scenario will reverse this situation leading to a surplus of 1.6% of GDP. These figures suggest that Kenya stands to benefit substantially from trade liberalisation through the full implementation of the AfCFTA, and it underscores the importance of implementing additional measures to improve competitiveness, particularly in growing the country’s manufacturing sector.
Historically, foreign direct investment (FDI) inflows to Kenya have been low. Between 1990 and 2019, FDI inflows ranged from 0.1% of GDP to 3% of GDP. The total amount of FDI received by Kenya in 2019 was equivalent to 1.34% of GDP, which was almost on par with the average for lower middle-income African countries. In an attempt to attract more FDI into the country, the Kenyan government has embarked on a number of reforms aimed at improving its regulatory environment and the ease of doing business. The country recently passed the Tax Laws Amendment (2018) and the Finance Act (2019) which introduced the iTax platform to facilitate tax payment. The cost of construction permits has also been reduced, the process for registering a micro-, small- or medium business has been simplified, and a ‘one-stop’ border post system has been implemented to expedite the movement of goods across borders.
The result is that Kenya improved its ranking from 61st in 2019 to 56th in 2020, according to the World Bank’s Ease of Doing Business report. However, various restrictions for foreign investment and complete foreign ownership remain in areas such as aviation, insurance, telecommunications, financial institutions, mining, engineering and architecture, which continue to hinder the inflow of FDI. On the Current Path, FDI inflows are expected to marginally rise to 2% below the Current Path average of 3.5% for lower middle-income countries on the continent by 2043.
Foreign aid to Kenya has generally been higher than its income peers in Africa. In 1990, the total aid received by Kenya constituted 14.4% of GDP compared with 5.7% received by lower middle-income African countries in the same period. By 2019, the country received US$2.6 billion of foreign aid (equivalent to 3.8% of GDP). This was significantly higher than the average of 1.6% for lower middle-income countries in Africa. Most of the aid to Kenya is channelled into the health sector. In addition, initiatives such as security, peace building and conflict management have all received support. For example, between 2010 and 2018, Kenya received more than US$700 million in aid from the US to strengthen its counterterrorism activities. On the Current Path, aid is projected to decline to constitute 1.27% of GDP. However, even at the rate, it will still be higher than the average for its peers in Africa.
Remittances in Kenya are also low compared with its income peers in Africa. In 2019, Kenya received US$1.2 billion in remittances, which constituted 1.7% of GDP. This was lower than the average of 4.1% for lower middle-income African countries. It could mean that there are fewer Kenyan migrants than its income peers or Kenyan migrants sent relatively lower remittances home than other lower middle-income countries. On the Current Path, this is expected to increase to US$7.5 billion (3.2% of GDP), exceeding the 1.5% of GDP average projected for lower middle-income countries. Thus, based on the Current Path analysis, Kenya has lower FDI inflows compared with its peers on the continent. Although foreign aid in Kenya has historically been higher than that of its peers, it is declining and needs to improve and so do remittances. As such, the Financial Flows scenario represents a reasonable but ambitious increase in worker remittances and aid flows to poor countries, increases in the stock of FDI and additional portfolio investment inflows as well as a decline in outward financial flows that emulates a reduction in illicit financial outflows.
In the Financial Flows scenario, total aid received by Kenya is projected to increase to US$3.6 billion from its 2019 value of US$2.8 billion — higher than the Current Path (US$3.3 billion). Nonetheless, aid as a percentage of GDP will decline as the Kenyan economy continues to grow. This is expected since a higher GDP in the scenario means the ratio will decline. Also, the higher GDP in the scenario, signalling growth, means that donors will switch from aid to trade as the global convention. By 2043, total aid will amount to 1.31% of GDP in the Financial Flows scenario and to 1.27% in the Current Path forecast. This will be above the projected 0.63% average lower middle-income countries in Africa on the Current Path.
The Financial Flows scenario will contribute to attracting higher FDI inflows. By 2043, FDI as a percentage of GDP will increase from 1.34% to 4.7% of GDP in the Financial Flows scenario. This will be above the projected 2% on the Current Path forecast for that year and the Current Path average of 3.5% for lower middle-income countries on the continent.
Regarding remittances, by 2043 total remittances in the Financial Flows scenario will come to US$11.8 billion, constituting 4.3% of GDP. This will be higher than the US$8.2 billion (3.2% of GDP) projected in the Current Path forecast. The projections in both the Current Path and the Financial Flows scenarios will be higher than the average (1.5% of GDP) for lower middle-income countries on the Current Path forecast by 2043.
Stability and better governance through effectiveness and accountability are generally prerequisites for other aspects of development as they ensure efficient allocation and distribution of state resources and encourage inflows of FDI. Measuring governance is difficult, however. To emulate the sequential evolution of governance over time, IFs draws upon the establishment of nation states in the Westphalian tradition that first created a security community (through internal oppression and war with others), built capacity (largely through the collection of taxes and the establishment of a coercive social contract) and then, in time, became more inclusive and eventually, democratic. Traditionally, these transitions occurred sequentially with progress in one dimension providing a basis for the next.
The process of externally imposed state formation during colonialism in Africa did not follow this process with the result that many African countries do not comprise a security community (with competing sources of authority such as traditional and ethnic leadership and distant and ungoverned borderlands) and have limited capacity (and often rely on aid to bolster that), yet they are required to democratise without the fundamentals of sufficient security and capacity being in place. Different to the sequential evolution of stability, capacity and inclusion elsewhere, the imposed post-colonial states require Africa to pursue these three transitions in parallel and in a very different global context. The subsequent composite ‘governance triangle’ in IFs comprises three main indices: a governance security index using internal war and government risk; a governance capacity index using revenue and a measure of corruption/transparency; and a governance inclusiveness index using the Polity IV measure of democracy and the United Nations Development Programme (UNDP) measure of gender empowerment.
In terms of security, Kenya is performing well on the governance security index compared with its peers on the continent. Its score of 0.74 for 2019 was slightly above the average of 0.72 for lower middle-income countries in Africa. The country transitioned from a de jure one-party state in 1982 to a liberal multiparty political system in 1992, with elections held every five years, the most recent of which were in August 2022. Since the transition, Kenya has been relatively peaceful and stable until political crises in 2007/08 erupted after the disputed 2007 presidential election. The main opposition made allegations of vote-rigging and refused to concede defeat, which eventually led to widespread violence, the displacement of about 600 000 people, and the deaths of about 1 100 citizens.
The post-election violence period led to constitutional reforms that culminated in the promulgation of a new constitution in 2010. The new constitution created 47 counties as part of an effort to increase decentralisation and devolve power in the country. The county form of government came into effect in 2013, moving the country away from the centralised form of governance that had been in place since independence. Since the reforms, the country has been stable, except for the threat of terrorism from militants linked to al-Shabaab and elections which continue to be accompanied by varying levels of violence.
In terms of governance inclusion, Kenya’s score in 2019 of 0.63 was about 32% higher than its African income group average of 0.48, reflecting the extent to which Kenya is more inclusive than other countries at similar levels of education and income. By international standards, inclusive gender representation requires at least 30% female representation at all levels of governance. Kenya has performed relatively well in this regard although it is lacking in some areas. At the executive level of government, more than 30% of cabinet secretaries (33.3%), chief administrative secretaries (32.3%), diplomatic corps (32.1%), CEOs of constitutional commissions and independent offices (46.7%) are female. However, positions such as county governors and deputies as well as county commissioners and deputies all fall below the acceptable 30% threshold representation. In the legislative arm of government, 32.8% of senators are female compared with 21.8% of female members of parliament. Also, 33.6% of the members of the county assembly are female. Kenya has met the 30% threshold at all levels of the judiciary. Currently, women constitute 43% of supreme court judges, half of appeal court judges, 44% of high court judges and 53% of judges from the magistrate court.
Despite performing well on the security and inclusion index, Kenya is lagging behind in terms of governance capacity. In 2019, Kenya scored 0.34 on the capacity index, slightly behind its income peers on the continent at 0.35. A more practical way to further illustrate Kenya’s government capacity gap is to consider the effective tax rate in Kenya, which is significantly lower than the average of its peers globally. A similar picture is evident when comparing government revenue as a percentage of GDP where Kenya has a smaller revenue base than the average for its global peers.
The country’s performance in governance capacity is affected by its poor ranking on corruption, having ranked among the five worst lower middle-income countries in Africa in this aspect. In 2019/20 alone, 2 221 corruption-related cases were received for investigation by the Ethics and Anti-Corruption Commission, while 448 reports were forwarded to other public institutions for appropriate action to be taken. In the 2019/20 period, the Ethics and Anti-Corruption Commission traced an astronomical KSh 25.3 billion (US$25.3 million) of public assets that were involved in corruption-related cases, recovered KSh 12.1 billion (US$12.1 million) and averted the loss of assets worth KSh 10 billion (US$10 million).
Thus, while Kenya appears to be doing well regarding security and inclusion, its progress in capacity is lagging behind its income peers on the continent. Nonetheless, there is more room for improvement on all governance indexes. Hence, to improve on governance and stability in Kenya, the study improves democracy score using a multiplier on the Polity IV democracy index, improves gender empowerment using the Gender Empowerment Measure, reduces corruption (using the index from Transparency International), and reduces the risk of interstate conflict and levels of internal conflict from the Political Instability Task Force.
These are expected to impact positively on capital contributions to growth, meaning that more government revenues can be allocated to the provision of health, education and other services even as levels of economic growth accelerate. The scenario further proceeds on the assumption that democratisation, currently under pressure as a result of the economic impact of the COVID-19 pandemic, will regain its momentum as incomes, urbanisation and education levels all improve.
Ultimately, the Governance scenario improves governance in Kenya across various indexes. In the Governance and scenario, Kenya's governance index score of 0.88 is projected to be 9% above the Current Path forecast by 2043 and 16% above the Current Path average for lower middle-income Africa in the same year.
Regarding inclusion, the Governance scenario will improve Kenya’s score by 11.4% above the Current Path forecast to reach 0.73 in 2043. At this rate, Kenya’s score will be 44% higher than the average for lower middle-income countries in Africa, reflecting the progress that the country has made in this dimension. However, without commensurate increases in capacity, the possibility of increased corruption will remain. Governance capacity is also expected to improve in the Governance scenario, with its score increasing to 0.49 by 2043, representing a 19.5% improvement above the Current Path forecast and the average for its income peers on the continent at 0.41 in 2043.
Another important measure of governance is government effectiveness, defined by the World Bank as a measure which ‘captures perceptions of the quality of public services, the quality of the civil service and the degree of its independence from political pressures, the quality of policy formulation and implementation, and the credibility of the government’s commitment to such policies.’ Kenya does well on the World Bank government effectiveness index, achieving a score of 2.1 (out of 5) on the index in 2019, which was the fifth highest score among the lower middle-income countries in Africa. In the Governance scenario, government effectiveness will improve by about 38.5% above the Current Path forecast. By 2043, Kenya’s score will be 50% higher than the average for lower middle-income countries in Africa.
Impact of sectoral scenarios on key indicators
Download to pdfThis section firstly explores the Kenyan economy and its unique characteristics, then examines the impact of the individual sectoral scenarios and the Combined Agenda 2063 scenario’s impact on two key variables. The Combined Agenda 2063 scenario is a combination of all eight sectoral scenarios presented above, namely the Health and Demographics, Education, Infrastructure, Agriculture, Manufacturing, Free Trade, Financial Flows, and Governance and Stability scenarios.
Kenya has the largest and most diverse economy in East Africa. Its GDP measured in market exchange rates (MER) almost tripled between 1990 and 2019, growing from US$26.5 billion to US$73 billion. In this period, the average annual GDP growth rate was about 3.5%. The government instituted economic reform and liberalisation activities in 1993, such as removing exchange rate and price controls, privatising state-owned enterprises and adopting conservative fiscal and monetary policies. These measures resulted in average annual growth above 4% from 1994 to 1996. However, the economy slowed down from 1997, partly owing to adverse weather conditions and the inability of the government to meet its commitment to governance reforms required by the International Monetary Fund (IMF), which led to IMF lending facilities and a US$90 million structural adjustment credit facility from the World Bank being suspended for three years. The government subsequently undertook reforms such as establishing the Kenyan Ethics and Anti-Corruption Commission, which led to the IMF and World Bank support and programmes being restored.
Growth improved from 0.6% in 2002 to about 6.1% in 2006, mainly owing to reforms under the Economic Recovery Strategy for Wealth and Employment Creation programme that increased government revenue and reduced national debts, releasing more funds for development projects. However, post-election violence in 2008 further slowed down the economy, which was already affected by the global financial crisis of 2007/08 and earlier droughts. The economic pillar of Vision 2030 seeks to improve the prosperity of all Kenyans through an economic development programme that will achieve an average GDP growth rate of 10% per annum starting in 2012. It focuses on structural transformation of the economy and infrastructure development. Under the first two MTPs, the country made significant progress in growing the economy. Between 2010 and 2019, the economy grew at an average of 5% per annum. The MTP3 seeks to build on the progress made by achieving an economic growth rate of 7% per annum at the end of the implementation period.
Despite the progress in transforming the economy, it is confronted with a number of challenges including overreliance on rainfall for agriculture, low manufacturing and export growth, persistent trade and balance of payment deficit, low investment rates, high unemployment rates, high costs of doing business, high energy cost, increasing cost of living, and high food prices. These problems have been worsened by the COVID-19 pandemic. In 2020, the economy shrunk by 0.3% after achieving a 5% growth rate in 2019. Nonetheless, the economy has shown signs of recovery and grew by 6.7% in 2021.
On the Current Path, the country’s GDP is expected to reach US$124.3 billion in 2030 and US$258.3 billion in 2043, constituting an increase of 254% from its 2019 figure. Among the sectoral scenarios, the Free Trade scenario will add most to GDP, contributing about US$51.1 billion above the Current Path. This is followed by the Governance and Stability and the Infrastructure scenarios, which are projected to contribute US$47.8 billion and US$19.1 billion, respectively. GDP is projected to rise to US$576.3 billion in the Combined Agenda 2063 scenario, representing an increase of 685% from 2019 to 2043. This will exceed the Current Path forecast of US$258.3 billion, meaning that the Combined Agenda 2063 scenario will increase the size of the economy by an additional US$318 billion by 2043 —an increase of 123.1% compared with the Current Path forecast.
While GDP measures the size of the economy, GDP per capita is generally used to measure the standard of living. It is the most widely used and accepted index used to compare welfare among countries. The study uses GDP per capita measured in purchasing power parity (PPP) for this analysis. From 1990 to 2019, Kenya's GDP per capita increased by US$694, from US$2 806 to US$3 500, equivalent to an increase of 25%. This reflects the average growth in GDP of about 3.5% over the period, which exceeded population growth of about 2.8% in the same period. Despite the growth, Kenya’s GDP per capita has grown more slowly than the average for lower middle-income countries in Africa, which increased from US$4 444 in 1990 to US$6 630 in 2019. As a result, the gap between the two is widening. Whereas the GDP per capita of Kenya was 63% of the average for lower middle-income Africa in 1990, it fell to 52% in 2019. With the projected increase in GDP and reduction in population growth, GDP per capita is set to reach US$6249 on the Current Path by 2043, although this will be 42.5% lower than the average of US$8 902 for lower middle-income countries in Africa.
The scenario with the greatest impact on GDP per capita by 2043 is the Free Trade scenario, followed by the Government and Stability and Health and Demographic scenarios. In the Free Trade scenario, Kenya’s GDP per capita will increase to US$7 070 by 2043, which represents an increase of US$821 (or 13.1%) compared with the projections on the Current Path in 2043. This indicates that Kenya has considerable potential to increase GDP if it takes advantage of the full implementation of the AfCFTA. Trade between African countries has the benefit of increasing Kenya’s exports, as it provides access to a much larger market and so can improve the country’s manufacturing sector. This will lead to more rapid economic growth and increased employment in key sectors.
In the Governance and Stability scenario, GDP per capita is projected to rise to US$7 021 by 2043, representing a 12% increase over the Current Path forecast for that year. It means that the Governance and Stability scenario can raise GDP per capita in Kenya by an additional US$772 by 2043. Regime stability and good governance in the form of adherence to the rule of law, reduced corruption and improved transparency and accountability lead to more rapid economic growth. In the Health and Demographic scenario, Kenya’s GDP per capita is projected to increase to US$6 713 by 2043, which is US$464 (or 7.4%) above the projected value of US$6 249 in the Current Path forecast in the same year. The gain is associated with the expected decline in the fertility rate, which will cause a reduction in population growth and an increase in the ratio of working-age persons to dependants, resulting in a demographic dividend. Together with the anticipated economic growth, the dividend increases GDP per capita, suggesting that these three sectors should be supported to unlock more rapid economic growth in the long term.
In contrast, the External Financial Flows scenario, which will increase Kenya’s GDP per capita to US$6 535 by 2043, will have a marginal impact on GDP per capita — an improvement of US$286 (or 4.6%) above the Current Path forecast. Although remittances, aid and FDI inflows are positively associated with economic growth, their impact largely depends on the behaviour of households and firms. The Agriculture scenario has an even smaller impact: the scenario will increase GDP per capita to US$6 370, US$121 (or 1.9%) more than the country’s Current Path forecast by 2043. The marginal impact of the Agriculture scenario on GDP per capita reflects the declining share of agriculture’s contribution to GDP expected to occur over the period.
Kenya’s GDP per capita is estimated to increase to US$10 950 by 2043 in the Combined Agenda 2063 scenario. This will be US$5 217 higher than the projection of US$5 733 on the Current Path forecast meaning that the Combined Agenda 2063 scenario could improve GDP per capita by an additional 91% by 2043. The projected GDP per capita in this scenario will be US$2 783 (or 25.4%) more than the Current Path forecast average for lower middle-income countries in Africa by 2043. The massive growth projected in the Combined Agenda 2063 scenario is due to the intersectoral impact of the policy interventions underpinning the various scenarios, which are necessary for achieving sustainable economic growth in Kenya.
In 2019, the size of Kenya’s informal sector amounted to US$14.6 billion, equivalent to 21.8% of GDP. At this rate, the size of Kenya's informal sector is below the average for lower middle-income countries in Africa at 29.5%. Thus, in terms of formalisation of the economy, Kenya is performing better than the average for its income peers on the continent, despite facing some challenges. On the Current Path, the size of the informal economy will increase to US$44.3 billion by 2043, although its contribution to GDP will decline to 18.7% by then. In the Combined Agenda 2063 scenario, the size of the informal economy will decline to US$5.3 billion, representing just 1% of GDP, in 2043. It means that the Combined Agenda 2063 scenario, with the expected technological advancement, has the potential to reduce the informal economy in Kenya by US$39 billion, which can boost government tax revenue.
This section examines the impact of the individual sectoral scenarios and the Combined Agenda 2063 scenario’s impact on poverty and inequality. The Combined Agenda 2063 scenario is a combination of all eight sectoral scenarios presented above, namely the Health and Demographics, Education, Infrastructure, Agriculture, Manufacturing, Free Trade, Financial Flows, and Governance and Stability scenarios.
There are numerous methodologies of and approaches to defining poverty. The study measures income poverty and uses GDP per capita as a proxy. In 2015, the World Bank adopted the measure of US$1.90 per person per day (in 2011 international prices), also used to measure progress towards the achievement of Sustainable Development Goal 1 of eradicating extreme poverty. To account for extreme poverty in richer countries occurring at slightly higher levels of income than in poor countries, the World Bank introduced three additional poverty lines in 2017: US$3.20 for lower middle-income countries; US$5.50 for upper middle-income countries; US$22.70 for high-income countries. According to the 2015/16 Kenya Integrated Household Budget Survey, poverty levels (at US$1.90) declined from 46% in 2005 to 36.1% in 2015.
As a lower middle-income country, Kenya therefore uses the US$3.20 benchmark for extreme poverty. In 2019, 32.2 million Kenyans lived below this threshold, equivalent to 61.5% of the population, a 10.9 percentage points below the average for lower middle-income countries. The high levels of poverty in the country have often been attributed to widespread corruption such as bribery, fraud and tribal favouritism within the government. Corruption tilts decisions and diverts scarce resources that could be used for improving social services. On the Current Path, the number of people living in poverty in Kenya is expected to stand at 23.5 million, constituting 29.1% of the population, by 2043. This corresponds to a decrease of 32.4 percentage points in the extreme poverty rate over 24 years. By this time, the poverty rate in Kenya will be lower than the average for its income peers such that the country’s poverty rate will be 9.1 percentage points lower than the projected average of 38.3% for lower middle-income countries in Africa.
The Governance and Stability scenario has the greatest potential to reduce extreme poverty in Kenya, in terms of a reduction in the poverty rate. Kenya, like most African countries, has weak state institutions and ineffective governments that have been slow to transform the country. In the Governance and Stability scenario, the number of poor people is projected to decline to 18.8 million (equivalent to 23.4% of the population), compared with the Current Path forecast for 2043 of 23.4 million people (29.1%). It means that improved governance in the form of greater transparency and accountability has the potential for 4.7 million fewer people to be living in extreme poverty by 2043. This confirms existing studies that poverty in Kenya can be attributed to the enduring corruption in the country. Certainly, better governance and greater stability ensures that public resources are utilised in an efficient manner to address the needs of the people instead of being diverted into individual pockets will impact poverty reduction significantly.
The Free Trade scenario has the second largest impact on poverty reduction in Kenya. In the scenario, 19.5 million people are expected to be living in extreme poverty by 2043, constituting 24.2% of the population. This will be 4.9 percentage points lower than the Current Path forecast, equivalent to a reduction of about 4 million people. Trade openness will reduce poverty in the long term after initially increasing it due to the redistributive effects of trade. Most African countries export primary commodities and low-tech manufacturing products, and therefore a continental free trade agreement that reduces tariffs and non-tariff barriers across Africa will increase competition among countries with primary commodities and low-tech manufacturing exports. Countries with inefficient, high-cost manufacturing sectors might be displaced as the AfCFTA is implemented, thereby increasing poverty rates. In the long term, as the economy adjusts and it produces and exports its comparatively advantaged (lower relative cost) goods and services, poverty rates will decline.
In the Demographics and Health scenario, by 2043 the number of Kenyans living in extreme poverty is projected to decline to 18.7 million people, equivalent to 24.7% of the population, making it the scenario with the third largest impact on poverty reduction. This means that the Health and Demographic scenario will reduce extreme poverty in the country by an additional 4.8 million people (or 4.5 percentage points below the Current Path forecast) over the forecast period. The reduction in extreme poverty in this scenario follows from the decline in the fertility rate and Kenya’s smaller population compared with its Current Path forecast.
In contrast, the Agriculture scenario has a much smaller impact on poverty reduction compared to these scenarios. In this scenario, by 2043 Kenya’s poor population is forecast to reduce to 21.6 million people (26.9% of the population). This is a decline of 2.2 percentage points from the Current Path forecast for the same year. Despite Kenya’s population being predominantly rural and with over 70% of the rural population depending on the agriculture sector for their livelihoods. As the economy undergoes structural transformation, the relevance of agriculture diminishes over time and so does its impact on poverty reduction as more people leave the sector for other sectors. In addition, numerous challenges, such as unfavourable climatic conditions, small number of land titles, and high cost of input confronting the sector, act as disincentive to farmers, hence the minimal impact of the Agriculture scenario on reducing extreme poverty in Kenya.
In the Combined Agenda 2063 scenario, both the number and proportion of poor people in Kenya will significantly decline. By 2043, about 4.9 million people in the country (6.2% of the population) will be living in extreme poverty. This means that, compared with the Current Path forecast, 18.6 million more people could be lifted out of poverty by 2043 in this scenario. This is equivalent to a decline of 23 percentage points compared with the Current Path forecast for 2043. In addition, the projected proportion of poor people in Kenya in the Combined Agenda 2063 scenario is 31.8 percentage points lower than the average (38.2%) for lower middle-income African countries by 2043.
The benefits of economic growth may not be evenly distributed in a country due to inequality. High levels of inequality have many negative effects including a breakdown of social structure and cohesion which can result in instability. While Kenya has pursued aggressive growth over the years, it has not been accompanied by the appropriate transfers and redistribution of wealth to guarantee the dividends of inclusive growth. Inefficient tax administration and collection facilitate the evasion, avoidance and exemption of taxes by wealthy corporations and individuals. This, coupled with high levels of corruption and cultural practices in the country, has contributed to widening the gap of economic inequality.
The Gini coefficient is the standard measure of the level of inequality in a country. A higher score depicts greater inequality while a lower score shows a more equal country. Historically, Kenya has had high levels of inequality despite improvements over the period. According to Oxfam International, 0.1% of Kenya’s population own and control more wealth than the remaining 99.9% of the population. Similarly, the 10% richest people in Kenya earn about 23 times more than the poorest 10%. There is also a large gender disparity in Kenya regarding economic empowerment. Over 96% of rural women in Kenya work on farms, yet only 6% of them hold land titles.
In 1992, Kenya’s Gini coefficient was 0.58 compared with the score of 0.47 for the average lower middle-income countries in Africa. By 2019, Kenya’s Gini coefficient had improved to 0.41 and is expected to improve further reaching 0.37 by 2043 on the Current Path. This makes Kenya the 15th most unequal country among the 23 lower middle-income countries in Africa and 36th in Africa. The scenario that has the potential to reduce inequality the most in Kenya is the Manufacturing scenario followed by the Education and Financial Flows scenarios. Conversely, the Infrastructure and the Health and Demographic scenarios are those with the least impact on inequality. To achieve a more just and equal society in Kenya, authorities must focus on welfare transfers that target the poorest people of the population. In the Combined Agenda 2063 scenario, inequality in Kenya is projected to reduce more rapidly, reaching 0.31 by 2043, which means that the Combined Agenda 2063 scenario has the potential to reduce inequality in Kenya by 16.2% relative to the Current Path forecast.
The IFs platform forecasts six types of energy, namely oil, gas, coal, hydropower, nuclear and other renewables. To allow comparisons between different types of energy, the data is converted into billion barrels of oil equivalent. The energy contained in a barrel of oil is approximately 5.8 million British thermal units (MBtus) or 1 700 kilowatt-hours (kWh) of energy. Kenya relies greatly on renewable sources for its energy production. According to the International Renewable Energy Association, Kenya is the leading producer of geothermal energy in Africa and the fourth globally. In 2021, the country discovered oil in the tertiary basin and Sunbird-1 well which is expected to increase oil production. Gas discoveries were made in the offshore Lamu Basin, Anza Basin and Mbawa-1 well and the Sunbird-1 well. There are plans for further oil explorations under the integrated field development plan with the potential to discover 10 new fields.
In 1990, Kenya produced 2 million barrels of oil equivalent (BOE) of hydro and other renewable energies, which represented 43% and 57% of total energy production, respectively. By 2019, the production of other renewables had grown significantly to 47 million BOE, constituting 94.3% of total energy production. The remaining 5% was mainly sourced from the production of hydropower, which was equivalent to 3 million BOE, with negligible production of gas, coal, oil and nuclear power. Other renewable energy sources used in Kenya include geothermal, wind, solar, tidal and bioenergy. On the Current Path, it is projected that by 2043, the production of other renewable energies will constitute about 98% of total energy production (188 million BOE). This will be complemented by a projected 4 million BOE of hydropower produced in the same year.
Energy production that is non-renewable in nature results in rising carbon emissions, necessitating a strong focus on making energy production more sustainable while still prioritising economic growth. Carbon is released in many ways, but the three most important contributors to greenhouse gases are carbon dioxide (CO2), carbon monoxide (CO) and methane (CH4), with the latter having the biggest negative impact. Each has a different molecular weight. IFs uses carbon rather than CO2 equivalent.
Carbon emissions in Kenya are relatively low, partly because the country has made a conscious effort at reducing its carbon emissions. In 2019, opposition from local communities and civil society resulted in the Kenyan courts cancelling the environmental licence for the planned 1 050 MW Lamu Coal Power Station on the shoreline of Manda Bay, close to Lamu Old Town, a UNESCO World Heritage site. The following year, the Industrial and Commercial Bank of China announced that it had withdrawn plans to finance the US$2 billion coal-fired power plant, a first in Kenya and closely linked to the Lamu Port–South Sudan–Ethiopia Transport (LAPSSET) Corridor mega-infrastructure project.
In 1990, Kenya released about 2 million tons of carbon and by 2019 the amount had doubled to about 4 million tons, reflecting the extent of electricity production from hydro and other renewable sources instead of fossil fuels. Even at this low rate in 2019, Kenya’s carbon emissions make it the 14th largest emitter of carbon in Africa indicating the low levels of emissions on the continent. The agriculture sector is the leading source of carbon emissions, contributing about 62.8% of total emissions. It is followed by the energy, industrial processes and waste sectors, which contribute 31.2%, 4.6% and 1.4% of total emissions in the country, respectively.
On the Current Path, carbon emissions are projected to triple to 12 million tons by 2043 relative to the 2019 figures. By then, Kenya will be the 18th largest emitter of carbon on the continent, mainly due to the country’s reliance on hydropower and other renewable energy sources. The advantage is clear, given that Kenya had the 10th largest economy in Africa in 2019 and is expected to have the ninth largest by 2043. The country releases little carbon compared with other African countries with similar levels of economic activity.
Due to the significant use of renewable energy in Kenya, future increases in emissions in the sectoral scenarios are modest and, in some cases, even below the Current Path forecast (e.g. in the Infrastructure scenario, where additional electricity generation is from renewables). By 2043, Kenya’s carbon emissions will increase most (to 13.8 million tons) in the Free Trade scenario, which also results in the largest economic growth. Emissions will be below the 2043 Current Path forecast in the Financial Flows, Infrastructure and Leapfrogging, and Demographics and Health scenarios. Indeed, in the Infrastructure scenario, emissions will still equate to 3.9 million tons of carbon by 2043.
In the Combined Agenda 2063 scenario, Kenya’s total carbon emissions of 2 million tons will be equal to almost six times less than what is estimated in the Current Path forecast. It means that achieving sustainable economic development while reducing the environmental cost in Kenya is possible, and the country can benefit greatly from its huge potential for producing renewable energy. For instance, with its large geothermal reserves, Kenya can increase its current installed capacity at least eight times. As such, Kenya must push to fully transition to renewable energies to unlock greater economic growth in a sustainable manner.
Kenya is a pivotal economic powerhouse in East Africa, driven by its ambitious Vision 2030, which aims to transform it into a newly industrialised, middle-income country. The economy, the largest in East Africa, has nearly tripled in size from 1990 to 2019 due to strategic economic reforms, infrastructure development and a diversified economic base.
Significant challenges include corruption, rapid population growth, infrastructure deficits, human capital bottlenecks and rising public debt, hindering the achievement of SDGs and Vision 2030. Despite these challenges, Kenya's economy has shown resilience with a potential 685% GDP increase by 2043 under the Combined scenario. Implementing the eight sectoral interventions can raise GDP per capita to US$10 950 by 2043, making Kenya an upper-middle-income country and reducing extreme poverty from 64.6% in 2019 to 6.4% by 2043. This development can be environmentally sustainable if Kenya fully transitions to renewable energies.
Policymakers in Kenya should:
- Strengthen anti-corruption efforts by empowering the EACC, implementing stricter penalties, and increasing transparency in procurement.
- Expand funding and infrastructure for secondary and tertiary education, integrate ICT into curriculums, and develop vocational training programs.
- Invest in modern irrigation, provide financial support to smallholder farmers, and enhance rural infrastructure to reduce post-harvest losses.
- Accelerate the development of geothermal, solar, and wind projects, encourage private sector investment, and incentivize the adoption of renewable energy.
- Prioritise key infrastructure projects through public-private partnerships as used in the Mombasa to Nairobi expressway project.
- Simplify export procedures, develop industrial parks, and support the growth of non-traditional exports.
- Simplify business registration, provide tax incentives, and remove sectoral restrictions to attract foreign investors.
- Increase healthcare funding, train more healthcare professionals, and implement comprehensive health insurance schemes.
- Expand broadband infrastructure, provide grants for tech startups, and promote digital literacy programs.
- Expand social protection programs, implement progressive tax policies, and promote gender equality initiatives.
Kenya's strategic emphasis on economic reform, infrastructure development and renewable energy positions it well for future growth. However, addressing the underlying issues of poverty, inequality and governance is essential for ensuring that the benefits of growth are broadly shared. With Kenya realising its Vision 2030 and further focusing on governance, education, agriculture and trade, it can become a model of economic progress and social equity in Africa.
Endnotes
Republic of Kenya, Second Medium Term Plan 2013–2017: Transforming Kenya: Pathway to devolution, socio-economic development, equity and national unity, 2013
A major road used for long distance connecting at least two cities, airports or ports.
Fixed broadband includes cable modem Internet connections, DSL Internet connections of at least 256 KB/s, fibre and other fixed broadband technology connections (such as satellite broadband Internet, ethernet local area networks, fixed-wireless access, wireless local area networks, WiMAX, etc.)
Page information
Contact at AFI team is Enoch Randy Aikins
This entry was last updated on 31 May 2026 using IFs v7.84.
Donors and sponsors


Reuse our work
- All visualizations, data, and text produced by African Futures are completely open access under the Creative Commons BY license. You have the permission to use, distribute, and reproduce these in any medium, provided the source and authors are credited.
- The data produced by third parties and made available by African Futures is subject to the license terms from the original third-party authors. We will always indicate the original source of the data in our documentation, so you should always check the license of any such third-party data before use and redistribution.
- All of our charts can be embedded in any site.
Cite this research
Enoch Randy Aikins (2026) Kenya Development Futures. Published online at futures.issafrica.org. Retrieved from https://futures.issafrica.org/geographic/countries/kenya/ [Online Resource] Updated 31 May 2026.