 Guinea-Bissau
Feedback welcome
Our aim is to use the best data to inform our analysis. See our Technical page for information on the IFs forecasting platform. We appreciate your help and references for improvements via our feedback form.
Please note: This country report was developed using African Futures’ previous analytical framework, which organised the assessment across 11 sectoral scenarios. We have since updated and streamlined the analytical architecture to 8 sectoral scenarios. While the two frameworks remain broadly aligned, the current structure improves consistency, comparability and integration across themes and geographic studies. This page will therefore be updated to the current framework in due course. Read more about our analytical framework on the Technical Page.
In this entry, we first describe the Current Path forecast for Guinea-Bissau as it is expected to unfold to 2043, the end of the third ten-year implementation plan of the African Union’s Agenda 2063 long-term vision for Africa. The Current Path in the International Futures (IFs) forecasting model initialises from country-level data that is drawn from a range of data providers. We prioritise data from national sources.
The Current Path forecast is divided into summaries on demographics, economics, poverty, health/WaSH and climate change/energy. A second section then presents a single positive scenario for potential improvements in stability, demographics, health/WaSH, agriculture, education, manufacturing/transfers, leapfrogging, free trade, financial flows, infrastructure, governance and the impact of various scenarios on carbon emissions. With the individual impact of these sectors and dimensions having been considered, a final section presents the impact of the Combined Agenda 2063 scenario.
We generally review the impact of each scenario and the Combined Agenda 2063 scenario on gross domestic product (GDP) per person and extreme poverty except for Health/WaSH that uses life expectancy and infant mortality.
The information is presented graphically and supported by brief interpretive text.
All US$ numbers are in 2017 values.
Executive Summary
- Current Path forecast
- Guinea-Bissau is a small low-income country in West Africa with a population of about 1.9 million. Plagued by a history of political instability and insecurity which has hampered its economic growth, Guinea-Bissau’s economy is slowly indicating an upward trend as some level of stability is returning to the nation. Life expectancy for the average Bissau-Guinean was 59.3 years as of 2019. As one of the poorest countries in Africa and in the world, Guinea-Bissau is largely aid dependent. The GDP per capita in 2019 stood at US$1 776, and two-thirds of the Bissau-Guinean population (63.9%) lived below the benchmark poverty line of US$1.90 for low-income countries as of 2019. Jump to forecast: Current Path
- In the Current Path forecast, Guinea-Bissau increases its population from an estimated 1.9 million people in 2019 to 3.2 million people in 2043. The country gains rural–urban parity by 2036, such that by 2043, 53% of the population will reside in urban areas while 47% live in rural areas. Jump to Demographics: Current Path
- Guinea-Bissau experiences quadruple growth in GDP, reaching US$7.3 billion, and an increase in GDP per capita to US$3 967 in 2043, though this will be lower than the average for its income peer group. The country reduces its level of informality, with a decrease in the size of the informal sector’s contribution to GDP, from 35% in 2019 to 28.4% in 2043. The greatest contribution to GDP is from the service sector (49.5%), followed by the manufacturing sector (26.8%), relegating the agriculture sector to the third largest contributor to GDP (11.3%) in 2043. Jump to Economy: Current Path
- In the Current Path forecast, the country continues to struggle with poverty with 1.4 million people (43.5% of the population) living below the poverty line of US$1.90 per day in 2043. Jump to Poverty: Current Path
- Gas will continue to be the dominant energy type (76.9%) while hydro and nuclear energy production decline over the period in the Current Path forecast. The production of solar and wind energies will however increase. Guinea-Bissau increases its carbon emissions to 0.8 million tons in 2043. Jump to Carbon emissions/Energy: Current Path
- Sectoral Scenarios
- The Stability scenario will improve Guinea-Bissau’s score on the governance security index to 0.86 in 2043 and simultaneously increase the GDP per capita to US$4 137, reducing the number of people living below the poverty line to 41.6% of the population. Jump to Stability scenario
- Guinea-Bissau will reach the demographic dividend by 2041 in the Demographic scenario as the population is managed through a reduction of fertility rates to 2.5 births per woman. Infant mortality rates will fall drastically to 15.4 deaths per 1 000 births. Jump to Demographic scenario
- The Health/WaSH scenario will increase life expectancy to 67.7 years by 2043 as 96.7% of the population gains access to safe water and sanitation. Infant mortality will fall to 17.7 deaths per 1 000 births by 2043. Jump to Health/WaSH scenario
- Guinea-Bissau will increase its yield per hectare to 6.6 metric tons in the Agriculture scenario, become a net exporter of agricultural products by 2043 and gain an additional US$889 in GDP per capita. More importantly, the country reduces the number of poor people living below the poverty line of US$1.90 to 28.7%. Jump to Agriculture scenario
- The Education scenario will result in a higher GDP per capita of US$4 095 by 2043, although the resulting number of poor people in Guinea-Bissau will decline only marginally. Jump to Education scenario
- In the Manufacturing/Transfers scenario, government welfare transfers to households will increase to US$0.32 billion in 2043, and the GDP per capita will increase to US$4 169. Jump to Manufacturing/Transfers scenario
- The Leapfrogging scenario will increase mobile broadband subscriptions per 100 people from 21.4 in 2019 to 152.9 in 2043 and enable access to electricity to 70.3% of the population, although the rural–urban disparity in access to electricity will remain notable. Jump to Leapfrogging scenario
- There will be an increase in the GDP per capita to US$4 346 by 2043 and a reduction in the proportion of poor people in Guinea-Bissau to 39.8% of the population in the Free Trade scenario. Jump to Free Trade scenario
- The Financial Flows scenario will result in a significant reduction in the contribution of foreign aid to Guinea-Bissau’s GDP in 2043 (from 12.7% in 2019 to 7% in 2043) even as the economy expands. Jump to Financial Flows scenario
- The Infrastructure scenario will increase the percentage of the rural population living within 2 km of all-weather roads to 62.8% by 2043 and improve the GDP per capita to US$ 4 088. Jump to Infrastructure scenario
- The Bissau-Guinean government effectiveness score will improve to 1.87 in the Governance scenario and the GDP per capita will increase to US$4 059 in 2043. Jump to Governance scenario
- While Guinea-Bissau’s carbon emissions are projected to increase in all the scenarios, the Demographic scenario will have the least impact on carbon emissions whereas the Agriculture scenario will result in 0.9 million tons of carbon by 2043. Jump to Impact of scenarios on carbon emissions
- Combined Agenda 2063 scenario
- In the Combined Agenda 2063 scenario, Guinea-Bissau sees an increase in the GDP per capita by US$3 900 in 2043 as a result of the synergistic effect of all the scenarios, although the Agriculture scenario has the greatest potential to increase GDP per capita. The scenario projects the growth of the economy to US$16.4 billion in 2043, compared to projections of US$7.3 billion in the Current Path forecast. Jump to Combined Agenda 2063 scenario
- The number of people living below the poverty line is decreased to 450 000 people (14.9% of the population) in the Combined Agenda 2063 scenario. Jump to Combined Agenda 2063 scenario
All charts for Guinea-Bissau Development Futures
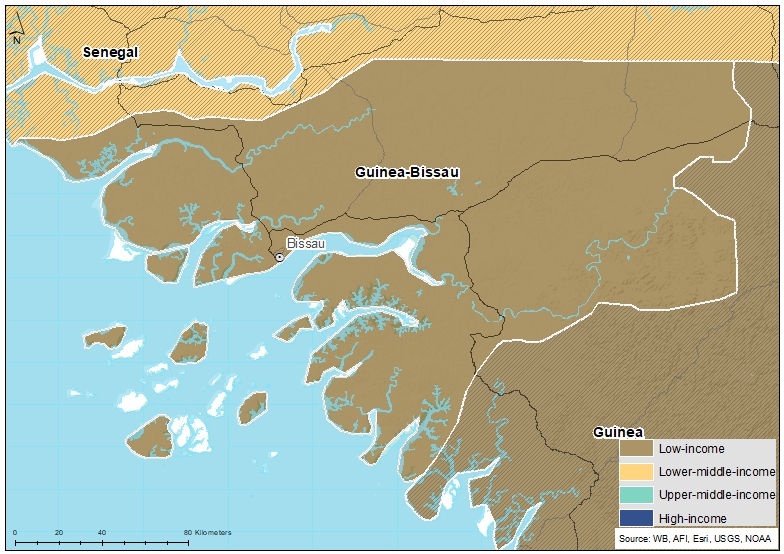
- Chart 1: Political map of Guinea-Bissau
- Chart 2: Population structure in CP, 1990–2043
- Chart 3: Urban and rural population in CP, 1990–2043
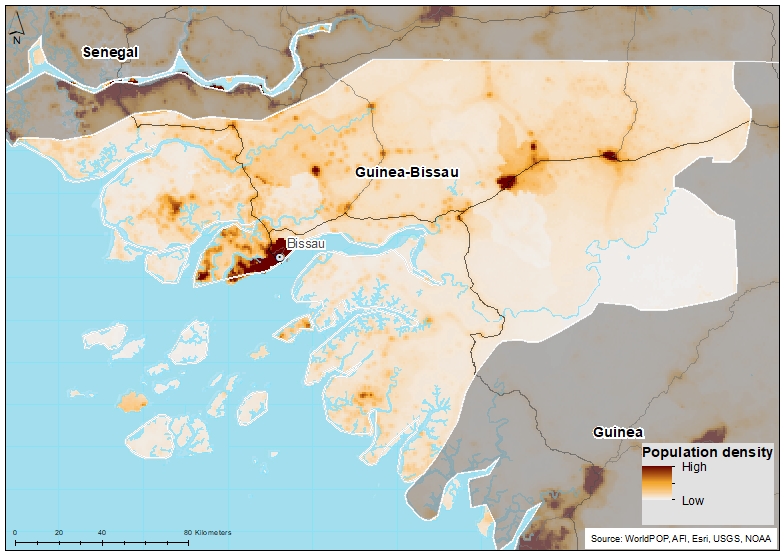
- Chart 4: Population density map for 2019
- Chart 5: GDP in CP, 1990–2043
- Chart 6: GDP per capita in CP, 1990–2043
- Chart 7: Informal sector value in CP, 2015–2043
- Chart 8: Value added by sector in CP, 2015–2043
- Chart 9: Agriculture production/demand in CP, 1990–2043
- Chart 10: Poverty in CP, 2015–2043
- Chart 11: Energy production by type in CP, 1990–2043
- Chart 12: Carbon emissions in CP, 1990–2043
- Chart 13: Governance security in CP and Stability scenario, 2019–2043
- Chart 14: GDP per capita in CP and Stability scenario, 2019–2043
- Chart 15: Poverty in CP and Stability scenario, 2019–2043
- Chart 16: Demographic dividend in CP and Demog scenario, 2019–2043
- Chart 17: Infant mortality in CP and Demog scenario, 2019–2043
- Chart 18: GDP per capita in CP and Demog scenario, 2019–2043
- Chart 19: Poverty in CP and Demog scenario, 2019–2043
- Chart 20: Life expectancy in CP and Health/WaSH scenario, 2019–2043
- Chart 21: Infant mortality in CP and Health/WaSH scenario, 2019–2043
- Chart 22: Yield/hectare in CP and Agric scenario, 2019–2043
- Chart 23: Agriculture imports in CP and Agric scenario, 2019–2043
- Chart 24: GDP per capita in the CP and Agric scenario, 2019–2043
- Chart 25: Poverty in CP and Agric scenario, 2019–2043
- Chart 26: Mean years of education in CP and Educ scenario, 2019–2043
- Chart 27: Education quality in CP and Educ scenario, 2019–2043
- Chart 28: GDP per capita in CP and Educ scenario, 2019–2043
- Chart 29: Poverty in CP and Educ scenario, 2019–2043
- Chart 30: Value added by sector in CP and Manufac/Transfers scenario, 2019–2043
- Chart 31: Gov welfare transfers in CP and Manufac/Transfers scenario, 2019–2043
- Chart 32: GDP per capita in CP and Manufac/Transfers scenario, 2019–2043
- Chart 33: Poverty in CP and Manufac/Transfers scenario, 2019–2043
- Chart 34: Fixed broadband access in CP and Leapfrogging scenario, 2019–2043
- Chart 35: Mobile broadband access in CP and Leapfrogging scenario, 2019–2043
- Chart 36: Electricity access in CP and Leapfrogging scenario, 2019–2043
- Chart 37: GDP per capita in CP and Leapfrogging scenario, 2019–2043
- Chart 38: Poverty in CP and Leapfrogging scenario, 2019–2043
- Chart 39: Trade balance in CP and Free Trade scenario, 2019–2043
- Chart 40: GDP per capita in CP and Free Trade scenario, 2019–2043
- Chart 41: Poverty in CP and Free Trade scenario, 2019–2043
- Chart 42: Foreign aid in CP and Financial Flows scenario, 2019–2043
- Chart 43: Inflow of FDI in CP and Financial Flows scenario, 2019–2043
- Chart 44: Remittances in CP and Financial Flows scenario, 2019–2043
- Chart 45: GDP per capita in CP and Financial Flows scenario, 2019–2043
- Chart 46: Poverty in CP and Financial Flows scenario, 2019–2043
- Chart 47: Electricity access in CP and Infrastructure scenario, 2019–2043
- Chart 48: Rural road access in CP and Infrastructure scenario, 2019–2043
- Chart 49: GDP per capita in CP and Infrastructure scenario, 2019–2043
- Chart 50: Poverty in CP and Infrastructure scenario, 2019–2043
- Chart 51: Gov effectiveness in CP and Governance scenario, 2019–2043
- Chart 52: GDP per capita in CP and Governance scenario, 2019–2043
- Chart 53: Poverty in CP and Governance scenario, 2019–2043
- Chart 54: Carbon emissions in CP and scenarios, 2019–2043
- Chart 55: GDP per capita in CP and scenarios, 2019–2043
- Chart 56: GDP per capita in CP and Combined scenario, 2019–2043
- Chart 57: Poverty in CP and Combined scenario, 2019–2043
- Chart 58: Value added by sector in CP and Combined scenario, 2019–2043
- Chart 59: GDP in CP and Combined scenario, 2019–2043
- Chart 60: Carbon emissions in CP and Combined scenario, 2019–2043


Guinea-Bissau Development Futures: Current Path
Download to pdfThis page provides an overview of the key characteristics of Guinea-Bissau along its likely (or Current Path) development trajectory. The Current Path forecast from the International Futures forecasting (IFs) platform is a dynamic scenario that imitates the continuation of current policies and environmental conditions. The Current Path is therefore in congruence with historical patterns and produces a series of dynamic forecasts endogenised in relationships across crucial global systems. We use 2019 as a standard reference year and the forecasts generally extend to 2043 to coincide with the end of the third ten-year implementation plan of the African Union’s Agenda 2063 long-term development vision.
Guinea-Bissau is one of 23 low-income countries in Africa. It is located in West Africa and bordered by Senegal to the north and Guinea Conakry to the south-east. Not to be confused with the Republic of Guinea, Guinea-Bissau is one of the smallest countries in Africa, covering a total area of 36,125 km2. The estimated population of the country as of 2019 was 1.9 million.
The geography of Guinea-Bissau consists mostly of coastal plains, with the two major ecoregions of Guinean forest-savanna mosaic and Guinean mangroves. The climate, like in most of West Africa, alternates between a rainy season and a dry harmattan season. The nation is also home to the Bijagós Archipelago, which is widely regarded as one of the world’s most beautiful island groups. Listed as a biosphere reserve by UNESCO, the Bijagós Archipelago features abundant marine flora and fauna, including sea turtles and sea hippopotamuses.
Administratively, Guinea-Bissau is divided into eight regions and one autonomous sector, which are in turn subdivided into 37 sectors. The most populous city by far is the capital Bissau in the Bissau region. Guinea-Bissau has the world’s third largest reserves of bauxite, which contribute to over 90% of the nation’s export revenue. The country also produces some agricultural products for export such as cashew nuts, peanuts, palm kernels and sawn lumber.
Guinea-Bissau is the 15th most populous country in West Africa and the 46th most populous in Africa. The country had an estimated population of 1.9 million in 2019, up from 1 million in 1990 —an increase of 97.2% over the past 29 years. On the Current Path, the population of Guinea-Bissau is forecasted to increase to 3.2 million by 2043, representing an approximate increase of 68.6% within the period. The relatively slower rate of population growth reflects the predicted increase in the adoption of improved birth control methods like contraceptives. Guinea-Bissau has a large youthful population with a youth bulge of 48.5% and a median age of 18.7 years as of 2019. The youth bulge, defined as the ratio of the population between the ages of 15 and 29 to the total adult population, will remain above 40% in the Current Path forecast horizon. This raises concerns about youth unemployment in the future. In 2009, the estimated youth unemployment rate was about 30%. The high rate of youth unemployment could instigate uprisings in the country in the future.
In addition, 42.2% of the population is below the age of 15 years and 28% was under the age of 30 years in 2019. The relatively large cohort of children under the age of 15 constrains the materialisation of the demographic dividend. With an expected decline in the fertility rate from 4.6 births per woman in 2019 to 3 births in 2043, the proportion of people below the age of 15 years in Guinea-Bissau is projected to fall to 34.4% over the next 24 years. This signals the likelihood of a larger adult population, increasing the share of people under the age of 64 years from 26.9% in 2019 to 33.6% in 2043. The average life expectancy in Guinea-Bissau was 59.7 years in 2019 and is estimated to increase to 67 years in 2043. The relatively low life expectancy is mainly due to a high disease burden emanating from both communicable and non-communicable diseases. Although communicable diseases are expected to marginally decline over the period, leading to an increase in life expectancy, deaths as a result of non-communicable diseases will impede this progress.
In 1990, the majority of Guinea-Bissau’s population (over 69.2%) resided in rural areas. However, over the past 29 years, the number of people residing in rural areas has steadily declined by 13 percentage points, from 69.2% in 1990 to 56.2% in 2019, suggesting an increase in urbanisation. Although the decade-long civil war (1998–1999), coupled with frequent political instability and insecurity in the capital, led to people fleeing major towns like Bissau, Cacheu and Bolama as they migrated to urban areas in search of greener pastures. This trend is expected to continue such that by 2035, the country will achieve parity in rural–urban settlement. On the Current Path, it is projected that by 2043, about 53% of the Bissau-Guinean population will live in urban areas.
The total land area of Benin is approximately 36 125 km². In 2019, Guinea-Bissau was the 11th most densely populated country in West Africa and 25th most densely populated country in Africa. The population density of Guinea-Bissau was estimated to be about 0.68 people per hectare, which is higher than the average of 0.45 for Africa and 0.65 for West Africa. The majority of the population in Guinea-Bissau lives in small villages and the major towns of the country. The national capital Bissau is the most densely populated city due to its role as the political, economic and cultural centre of the country. This is followed by Bafatá and Gabú as the largest cities respectively. Sparsely populated areas of the country include the savanna regions and the low-lying areas along the coast.
From 1990 to 2019, the GDP of Guinea-Bissau doubled from US$0.8 billion to US$1.6 billion. Traditionally, the Bissau-Guinean economy is a rural economy that is largely dependent on agriculture, particularly cashew nuts; however, the civil war devastated the economy. For instance, it is estimated that the real GDP fell by 28% in 1998 as a result of the conflict. During this period, the international community imposed sanctions on Guinea-Bissau and development partners withdrew aid to the country. This led to a long period of recession, especially in the early 2000s. In addition to the war, factors such as political and institutional instability, the lack of basic energy and transport infrastructure, as well as international oil and economic crises have significantly contributed to the recession. Attempts to revive the economy have included structural reforms implemented in the Poverty Reduction Strategy Paper (PRSP), resulting in some positive gains and economic recovery for the country. Over the next 22 years, Guinea-Bissau’s GDP is estimated to more than quadruple and increase to US$7.3 billion from the current figure. The increase in GDP reflects the economic growth expected to occur within the next 22 years due to the economy moving from being agriculture dominant to more a service-led economy.
Although many of the charts in the sectoral scenarios also include GDP per capita, this overview is an essential point of departure for interpreting the general economic outlook of Guinea-Bissau.
The GDP per capita of Guinea-Bissau has seen a marginal increase over time. The country increased its GDP per capita by 22.5% from US$1 781 in 1990 to US$2 130 in 1997 but saw it sharply decline to US$1 503 in 1998. Afterwards, the GDP per capita for Guinea-Bissau slowly but steadily increased to US$1 776 by 2019. The marginal increase in GDP per capita reflects the relatively high GDP growth compared to population growth over the period. With an expected increase in GDP and decline in fertility rates, it is projected that GDP per capita will rise over the next 22 years, such that by 2043, the GDP per capita will more than double to US$3 967. In 1990, Guinea-Bissau’s GDP per capita was US$648 higher than the average for low-income countries in Africa, suggesting that the country was performing better than its income peer group. However, this trend was reversed from 2012, and it is expected to continue until it reverses again in 2034, so that by 2043, Guinea-Bissau’s GDP per capita will be US$177 lower than the average for low-income countries in Africa.
The size of the informal sector in Guinea-Bissau was equivalent to 35% of GDP in 2019. The informal sector in Guinea-Bissau is very large and employs the majority of the workers in the country, especially those who work in the private sector. In 2009, there were only 75 registered firms in the entire country, and informal activities were the main source of income for many people residing in the capital city of Bissau. The informal sector’s contribution to GDP is, however, expected to decline to 28.4% by 2043, constituting a 6.6 percentage point decrease over the 22-year period. In 2019, the total number of people employed by the informal economy constituted 67.8% of the total labour force. This is also projected to decline so that by 2043 the total number of people employed in the economy will be 52.3% of the labour force. It is therefore not surprising that the level of informality will decline within the same period. Nevertheless, throughout the period under consideration, the size of the informal sector in Guinea-Bissau is higher than the average for low-income African countries suggesting that Guinea-Bissau has performed relatively poorly in formalising its economy compared to other African countries within its income group.
The IFs platform uses data from the Global Trade and Analysis Project (GTAP) to classify economic activity into six sectors: agriculture, energy, materials (including mining), manufactures, services and information and communications technology (ICT). Most other sources use a threefold distinction between only agriculture, industry and services with the result that data may differ.
The three largest contributing sectors to GDP in Guinea-Bissau are agriculture, service and manufacturing, respectively. In 2019, the agriculture sector’s contribution to GDP was about US$0.6 billion (38.3% of GDP). However, the contribution of agriculture is projected to decline over the period so that by 2043 the sector’s contribution to GDP will only be 11.3%. The service sector is currently the second largest contributor to GDP with a total contribution of 38% of GDP. On the Current Path, it is projected that the service sector will increase its contribution to GDP and overtake agriculture as the largest contributor to GDP by 2023. By 2043, the contribution of the service sector to GDP is projected to be 49.5%, which will be 38.2 percentage points higher than the projected contribution of agriculture. Moreover, the manufacturing sector will steadily increase its contribution to GDP from 15.9% in 2019 to 26.8% by 2043, overtaking agriculture as the second largest contributor to GDP in 2035. The growth of the manufacturing sector will be beneficial in creating sustainable jobs in the country, especially for the large youth population. However, the decline in the agriculture sector may indicate challenges for food security in the country.
The data on agricultural production and demand in the IFs forecasting platform initialises from data provided on food balances by the Food and Agriculture Organization (FAO). IFs contains data on numerous types of agriculture but aggregates its forecast into crops, meat and fish, presented in million metric tons. Chart 9 shows agricultural production and demand as a total of all three categories.
The average crop yield for 2019 was 1.9 metric tons per hectare. In 1990, Guinea-Bissau’s demand for agricultural products outstripped domestic production by 0.03 million metric tons; this increased to 0.05 million metric tons in 2019, despite the fact that about 61% of the country’s total labour force is employed in the agriculture sector. The low output of the sector is partly due to the inability of farmers to adopt modern methods of farming and embark on large-scale cultivation. Again, the high dependence on cashew nuts as a cash crop has affected the cultivation of other food crops, such as rice, in the country. There is also declining interest in the agriculture sector, reflected in its dropping share of total employment. Although the yield per hectare for crops is expected to increase from 1.9 metric tons per hectare in 2019 to 2.5 metric tons per hectare in 2043, the gap between demand and production will widen. By 2043, demand will outstrip domestic production by about 0.78 million metric tons, representing a 1 200% increase over the period. This raises serious concerns about food security in the country within the next 22 years.
There are numerous methodologies for and approaches to defining poverty. We measure income poverty and use GDP per capita as a proxy. In 2015, the World Bank adopted the measure of US$1.90 per person per day (in 2011 international prices), also used to measure progress towards the achievement of Sustainable Development Goal 1 of eradicating extreme poverty. To account for extreme poverty in richer countries occurring at slightly higher levels of income than in poor countries, the World Bank introduced three additional poverty lines in 2017:
- US$3.20 for lower middle-income countries
- US$5.50 for upper middle-income countries
- US$22.70 for high-income countries.
As a low-income country, Guinea-Bissau uses the US$1.90 per person per day benchmark. The country is one of the poorest in Africa and the world, with two out of every three Bissau-Guinean citizens estimated to be multidimensionally poor. Poverty is more widespread outside the capital city of Bissau and affects women and children more than men. As of 2019, there were still over 1.2 million people, constituting 63.9% of the population, living on less than US$1.90 per day. The absolute number of poor people in Guinea-Bissau is projected to rise to 1.4 million in 2043. However, the proportion of poor people is estimated to decline by 20.4 percentage points to 43.5% in 2043. This relatively high percentage of poor people can be attributed to the expected growth in population that will outpace development progress in the country. To address this, the National Poverty Reduction Strategy Paper II (PRSP) was prepared by Guinea-Bissau in 2011 for implementation from 2011 to 2015, and it was meant to achieve economic growth and reduce the high levels of poverty in the country. Throughout the period under consideration, the proportion of poor people in Guinea-Bissau is higher than the average for low-income countries in Africa. By 2043, it is estimated that the extreme poverty rate in Guinea-Bissau will be 18.3 percentage points above the projected average for low-income countries in Africa.
The IFs platform forecasts six types of energy, namely oil, gas, coal, hydro, nuclear and other renewables. To allow comparisons between different types of energy, the data is converted into billion barrels of oil equivalent (BBOE). The energy contained in a barrel of oil is approximately 5.8 million British thermal units (MBTUs) or 1 700 kilowatt-hours (kWh) of energy.
The most widely produced energy source in Guinea-Bissau is gas, followed by hydro and nuclear. In 2019, the total amount of gas produced in the country was 1 million BOE, constituting 90.9% of the total energy production. Although the total amount of gas produced is projected to quadruple to 4 million BOE in 2043, its share of total production will decline to 76.9%. Hydro production constituted 9.1% of total energy production in 2019 but is projected to decline to about 2% in 2043. Likewise, nuclear power, which in 2019 constituted about 8.3% of total production, is projected to decline to about 2% by 2043. The country will, however, begin the production of other renewable energies, such as solar and wind, so that these will constitute about 19.2% of total energy production in 2043.
Carbon is released in many ways, but the three most important contributors to greenhouse gases are carbon dioxide (CO2), carbon monoxide (CO) and methane (CH4). Since each has a different molecular weight, IFs uses carbon. Many other sites and calculations use CO2 equivalent.
Guinea-Bissau has very low levels of carbon emissions with an almost zero-emission rate. This negligible level of carbon emissions can be attributed to minimal industrial activity in the country. Regardless, carbon emissions increased steadily from 1990 to 2019. On the Current Path, carbon emissions are forecast to increase to 1 million tons by 2043.
Sectoral Scenarios for Guinea-Bissau Development Futures
Download to pdfThe Stability scenario represents reasonable but ambitious reductions in risk of regime instability and lower levels of internal conflict. Stability is generally a prerequisite for other aspects of development and this would encourage inflows of foreign direct investment (FDI) and improve business confidence. Better governance through the accountability that follows substantive democracy is modelled separately.
The intervention is explained here in the thematic part of the website.
This scenario generally signifies increased political stability, reduced internal conflict, high FDI inflows, improved and accountable governance, and low levels of corruption in the country. Guinea-Bissau has had a history of civil war and political instability, with four successful coups d'état and about 17 coup attempts. The terms of office of all previous democratically elected presidents in the country were truncated by coups d'état and instability. From 2004 to 2009, the average term spent in office by successive governments did not exceed six months. The 2014 election, which was described by observers as the fairest and freest in the history of Guinea-Bissau, ushered the country into a new era of democratic stability, leading to the election of President José Mário Vaz. So far, he has been the only president who has been able to serve his full term of office as guaranteed and mandated by the constitution. However, during his five-year tenure, he worked with as many as seven prime ministers. The 2019 presidential election that led to the election of Umaro Sissoco Embaló resulted in another spate of political crises and instability. At the beginning of 2020, there were two competing governments due to conflict between the president and the National Assembly led by the prime minister under military control. While the situation has been brought under control somewhat, there are still fears of instability in the country. As a part of waves of coups d’état in West Africa, a faction of the Bissau-Guinean military attempted a foiled coup d’état of president Umaro Sissoco Embaló on the 1st of February 2022.
In 2019, Guinea-Bissau’s score on the governance security index was 0.66, which was higher than the average of 0.64 for low-income countries in Africa. In the Stability scenario, the score on the governance security index is projected to rise to 0.82 by 2043, which is 0.1 point above the Current Path forecast of 0.72 in the same year. Interestingly, Guinea-Bissau will have a higher level of governance security compared to the average for low-income countries in Africa which is estimated to be 0.71 by 2043 in both the Current Path forecast and the Stability scenario.
In 2019, the GDP per capita for Guinea-Bissau was US$1 776, which was US$116 more than the average for low-income countries in Africa. In the Stability scenario, the GDP per capita is projected to increase to US$4 137 by 2043. This will be US$170 more than the Current Path forecast and US$347 above the average for low-income countries in Africa. From 2020 to 2032, the GDP per capita for Guinea-Bissau was less than the average for low-income African countries. Regime stability and a peaceful environment inspire investor confidence and attract FDI into the country, with a positive effect on economic growth. By implementing the Stability scenario, Guinea-Bissau has the potential to increase its GDP per capita.
As Guinea-Bissau is a low-income country, it uses the global benchmark of US$1.90 per day as the poverty line. In 2019, 1.2 million Bissau-Guineans (about 63.9% of the population) were living on less than US$1.90 per day. Although the number of poor people will rise marginally from 1.2 million people in 2019 to 1.3 million people in 2043 in the Stability scenario, the scenario will reduce the number of people living below the poverty line to 41.6% by 2043 — 1.8 percentage points below the Current Path forecast. This still means that the materialisation of the Stability scenario could lead to 60 000 fewer poor people in 2043 than in the Current Path forecast. Throughout the period, the proportion of poor people in Guinea-Bissau was higher than the average for low-income African countries.
This section presents the impact of a Demographic scenario that aims to hasten and increase the demographic dividend through reasonable but ambitious reductions in the communicable-disease burden for children under five, the maternal mortality ratio and increased access to modern contraception.
The intervention is explained here in the thematic part of the website.
Demographers typically differentiate between a first, second and even a third demographic dividend. We focus here on the contribution of the size of the labour force (between 15 and 64 years of age) relative to dependants (children and the elderly) as part of the first dividend. A window of opportunity opens when the ratio of the working-age population to dependants is equal to or surpasses 1.7.
In 2019, the ratio of working-age persons to dependants was 1.22:1, meaning that there were 1.22 working-age persons for each dependant in the country. This is greater than the average of 1.16 for low-income countries in Africa. Generally, the demographic dividend materialises when the country reaches a minimum ratio of 1.7 working age persons for each dependant. While the country will not reach its demographic dividend by 2043 in the Current Path forecast, Guinea-Bissau is expected to reach this minimum ratio by 2040 in the Demographic scenario. This is two years earlier than the average for low-income countries in Africa, and the situation continues to improve thereafter. The materialisation of the demographic dividend in the Demographic scenario can be explained by increased access to modern contraceptives which will lead to a decline in fertility rates. In the Demographic scenario, fertility rates are expected to decline to 2.5 births per woman in 2043, compared to 3 births per woman in the Current Path forecast within the same period.
The infant mortality rate is the number of infant deaths per 1 000 live births and is an important marker of the overall quality of the health system in a country.
The infant mortality rate in Guinea-Bissau in 2019 was 48.4 deaths per 1 000 live births. This figure is comparable to the average of 48.5 deaths for low-income countries in Africa. By 2043, however, the Demographic scenario will lead to a decline in infant mortality to 15.4 deaths per 1 000 live births, which is 4.3 deaths fewer than the Current Path forecast and 1.5 deaths lower than the average for low-income countries in Africa.
In 2019, the GDP per capita for Guinea-Bissau was US$1 776, which was US$116 higher than the average for low-income African countries. By 2043, in the Demographic scenario, the GDP per capita will increase to US$4 070, which is US$103 more than the projected US$3 967 in the Current Path forecast in the same year. This will also be higher than the US$3 790 average for low-income countries in Africa. The additional increase in the GDP per capita as a result of the Demographic scenario can partly be attributed to the reduction in population growth as a result of the decline in fertility rates emanating from improved access to contraceptives. It can also be attributed to economic growth arising from the materialisation of the demographic dividend.
As noted earlier, the number of people in Guinea-Bissau living below the poverty line of US$1.90 per day in 2019 was 1.2 million. In the Demographic scenario, this number will steadily rise to 1.3 million in 2043, which will be 100 000 fewer than in the Current Path forecast. Similarly, the proportion of the poor population will be reduced to 42% in the Demographic scenario, which is about 1.5 percentage points lower than the Current Path forecast but 16.8 percentage points higher than the average for low-income countries in Africa in 2043. The decline in both the number and portion of poor people in the Demographic scenario reflects the decline in the population as a result of modern contraceptive use which reduces fertility rates. The reduction of the size of the cohort of children under the age of 15 also allows households and the government to invest more in each child in terms of education and health, with positive implications for human capital formation and poverty reduction.
This section presents reasonable but ambitious improvements in the Health/WaSH scenario, which include reductions in the mortality rate associated with both communicable diseases (e.g. AIDS, diarrhoea, malaria and respiratory infections) and non-communicable diseases (NCDs) (e.g. diabetes), as well as improvements in access to safe water and better sanitation. The acronym WaSH stands for water, sanitation and hygiene.
The intervention is explained here in the thematic part of the website.
The life expectancy at birth for the average Bissau-Guinean was 59.7 years in 2019, which was below the average of 63.8 years for low-income countries in Africa. On average, females have a higher life expectancy at birth (62.1 years) than males (57.1 years). In the Health/WaSH scenario, life expectancy is estimated to increase to 67.7 by 2043, which is an increase of eight months more the Current Path forecast of 67 and just under four years below the average for low-income African countries. This increased life expectancy in the country can be attributed to the expected improvement in access to safe water (nearly 100% of population) and sanitation, as well as a reduction in mortality from communicable diseases. However, deaths from non-communicable diseases continue to be a problem. Females will continue to have a higher life expectancy than males with a difference of over four years by 2043.
The infant mortality rate per 1 000 live births in 2019 was 48.4 comparable to the average for low-income countries in Africa.. By 2043, infant mortality per 1 000 live births in the country will be 17.7 in the Health/WaSH scenario and 19.7 in the Current Path forecast. The fall in infant mortality is due to reduced prevalence of communicable and non-communicable diseases, especially neonatal sepsis, among children under five.
The Agriculture scenario represents reasonable but ambitious increases in yields per hectare (reflecting better management and seed and fertiliser technology), increased land under irrigation and reduced loss and waste. Where appropriate, it includes an increase in calorie consumption, reflecting the prioritisation of food self-sufficiency above food exports as a desirable policy objective.
The intervention is explained here in the thematic part of the website.
The data on yield per hectare (in metric tons) is for crops but does not distinguish between different categories of crops.
In 2019, the average yield per hectare for crops was 1.9 metric tons per hectare, which was below the average of 2.7 metric tons per hectare for low-income countries in Africa. In the Current Path forecast, this is projected to increase to 2.5 metric tons per hectare by 2043. In the Agriculture scenario, however, the average yield will be 6.6 metric tons per hectare. This means that if the country is able to adopt modern methods of farming including the use of fertiliser and improved seeds, there will be a resulting increase of an extra 4.1 metric tons per hectare in 2043 compared to the Current Path forecast. Although Guinea-Bissau’s yield per hectare is consistently lower than the average for low-income African countries, from 2041, the trend will be reversed such that by 2043, Guinea-Bissau’s yield per hectare will be 0.7 metric tons per hectare more than the average for low-income countries in Africa.
In 2019, the net agricultural import of Guinea-Bissau was 4.6% of agricultural demand, which was below the average for low-income countries in Africa. Import dependence is a common problem in most African economies. Agriculture employs about 75%–80% of the rural workforce, and although about 45% of the total land in the country is fertile for agricultural purposes, the country is still unable to produce enough to meet domestic consumption. Generally, food security is a problem in the country, with about 11% of households in Guinea-Bissau identified as food insecure. Common challenges with the agriculture sector in Guinea-Bissau include land tenure problems, inaccessibility to and limited market opportunities, as well as climate change. The Current Path forecast is that import dependence will grow to 34.9% of total demand. The situation is reversed in 2033 in the Agriculture scenario, such that by 2043, the country will be a net exporter of agricultural products with a balance of 26.8% of total agricultural demand. This balance will be higher than the average for low-income countries by about 26 percentage points, suggesting that there is tremendous potential that is yet to be tapped in terms of agriculture production in Guinea-Bissau. Therefore, if agricultural policies that increase yield per hectare and reduce loss and waste are implemented, the country will be able to move from being food import dependent to being a net exporter of agricultural products from 2033.
The Agriculture scenario is expected to lead to an increase in the GDP per capita over the years. As a result of the Agriculture scenario, by 2043 the GDP per capita will increase from US$1 776 in 2019 to US$4 856, constituting about a 173% increase over the period. These estimates are greater than the projections in the Current Path forecast as, by 2043, the additional gains from GDP per capita as a result of the Agriculture scenario will be US$889. In this scenario, Guinea-Bissau’s GDP per capita will still remain above average for low-income countries in Africa. Indeed, the gap in GDP per capita between Guinea-Bissau and its income peer group is projected to positively widen in the Agriculture scenario.
Implementing good agricultural policies that result in increased yield per hectare and reduction in waste appear to have a significant impact on poverty reduction in the country. In the Current Path forecast, 1.4 million people (43.5% of the population) are projected to be extremely poor by 2043. However, in the Agriculture scenario, the number of people below the poverty line of US$1.90 will be reduced to 900 000, constituting 28.7% of the population. This means that 500 000 additional Bissau-Guineans can be lifted out of extreme poverty by focusing primarily on agricultural growth. This is expected given that agriculture is the backbone of the Bissau-Guinean economy and the majority of the poor population in Guinea-Bissau are employed in the agriculture sector. Throughout the period under consideration, in the Agriculture scenario, the proportion of people living in extreme poverty in Guinea-Bissau will be higher than the average of low-income countries in Africa, although the gap closes. By 2043, the poverty rate in Guinea-Bissau in the Agriculture scenario will be 3.5 percentage points higher than the average for low-income countries in Africa.
The Education scenario represents reasonable but ambitious improved intake, transition and graduation rates from primary to tertiary levels and better quality of education. It also models substantive progress towards gender parity at all levels, additional vocational training at secondary school level and increases in the share of science and engineering graduates.
The intervention is explained here in the thematic part of the website.
Shortages of teachers — especially in rural areas — poorly trained teachers, overcrowded schools, inadequate educational facilities and infrastructure, and a lack of adequate teaching and learning materials are common challenges facing the education system in Guinea-Bissau. In 2019, Guinea-Bissau’s mean years of education was 5.5 years, which was above the average of 4.4 for low-income countries on the continent. This was probably due to the implementation of compulsory free primary education for all children between 7 and 14 years. In terms of gender, the mean years of education for males is 6.9, which is 2.6 years more than the female average of 4.3. This means that on average, men are more likely to attain higher education than women. The higher rate of repetition among girls has been a key factor in accounting for the high rate of school drop-outs among girls. This gap in favour of men for mean years of education in Guinea-Bissau is higher than the average of 1.3 years for low-income countries in Africa. By 2043, in the Education scenario, it is expected that the mean years of education will rise to 7.3 years, which will be 0.3 years more than the Current Path estimates and 0.7 years more than the average for low-income countries in Africa. Also, based on the Education scenario forecast, the gender gap regarding mean years of education will reduce by 1 year by 2043, while the gender gap closes by 0.5 years for the average low-income country in Africa within the same period.
The average test score for primary learners in Guinea-Bissau for 2019 was 27%, which was lower than the average of 27.7% for low-income countries in Africa, signifying a relatively poorer performance in this regard. The Education scenario will increase the average test score for primary learners to 36.5% by 2043, compared to the Current Path forecast estimate of 31.3%. Also, the Education scenario for 2043 will result in scores which are 0.9 percentage points higher than the continental average for low-income countries.
In 2019, the average secondary learner test score for Guinea-Bissau was 37.8%, which was above the average of 35.8% for low-income African countries. This suggests that Guinea-Bissau performs relatively better at secondary level than at primary level. By 2043, the average test scores for secondary learners is projected to rise to 49.4%, which is higher than the Current Path forecast of 41.8% and the average of 37.8% for low-income countries in Africa.
By 2043, the GDP per capita as a result of the Education scenario is estimated to be US$128 more than the projected amount of US$3 967 in the Current Path forecast. However, this will still be US$172 less than the average of US$3 923 for low-income countries in Africa. Investment in education takes time to yield results as it would take more than a decade for a child enrolled in primary school today to make a meaningful contribution to the economy. Therefore, although education may be the surest intervention for poverty eradication, it is not the quickest way to reduce poverty levels. Investment in primary and secondary education, though a prerequisite for human capital development, in many instances, is in effect an investment in literacy, which falls short of human capital development. Human capital development, which is a fundamental determinant of output growth, is usually embodied in years of tertiary education.
By 2043, in the Education scenario, there will be 1.35 million poor people (41.7% of the population). This means that the Education scenario will contribute to reducing the number of poor people in Guinea-Bissau by 60 000 in 2043 compared to the Current Path forecast. This is not too surprising given the powerful effect of education on poverty levels in Guinea-Bissau: household heads with higher educational attainment are more likely to have lower levels of poverty compared to household heads with lower educational attainment. The proportion of poor people in Guinea-Bissau based on the Education scenario will however still be 16.5 percentage points higher than the average for low-income countries in Africa.
The Manufacturing/Transfers scenario represents reasonable but ambitious manufacturing growth through greater investment in the economy, investments in research and development, and promotion of the export of manufactured goods. It is accompanied by an increase in welfare transfers (social grants) to moderate the initial increases in inequality that are typically associated with a manufacturing transition. To this end, the scenario improves tax administration and increases government revenues.
The intervention is explained here in the thematic part of the website.
Chart 30 should be read with Chart 8 that presents a stacked area graph on the contribution to GDP and size, in billion US$, of the Current Path economy for each of the sectors.
In the Manufacturing/Transfers scenario, the service sector will be the largest contributor to GDP with an absolute contribution of US$0.32 billion more by 2043 compared to the Current Path forecast. This corresponds to a rate of contribution of 0.54% percentage points. The manufacturing sector, which is the second largest contributor, is projected to contribute an additional US$0.16 billion to GDP by 2043, although its rate of contribution declines from 0.37% in 2035 to 0.14% difference to GDP based on the Manufacturing/Transfers scenario. The third largest contributor to GDP in Guinea-Bissau will be ICT with a contribution of US$0.06 billion, corresponding to a 0.18 percentage point difference. It is significant to note that the rate of the contribution of agriculture to GDP based on the difference between the Manufacturing/Transfers scenario and the Current Path forecast declines significantly over the period from -0.05 percentage points in 2026 to -0.72 percentage points in 2043.
The Guinea-Bissau government’s welfare transfers to households are significantly low. In 2019, total welfare transfers to households were US$0.02 billion (about 1.9% of GDP), which is below the average of 2.2% of GDP for low-income countries in Africa. This is projected to increase to US$0.32 billion by 2043 in the Manufacturing/Transfers scenario, constituting almost 5.3% of GDP, which is far more than the US$0.18 billion estimated for 2043 in the Current Path forecast. This suggests that the Manufacturing/Transfers scenario can lead to an improvement in government welfare transfers by an additional US$0.14 billion compared to the Current Path in 2043. However, the gap between Guinea-Bissau and its income group peers in terms of government welfare transfers as a per cent of GDP is expected to widen from 0.3 percentage points in 2019 to 1.7 percentage points in 2043 in this scenario.
By 2043, it is estimated that the GDP per capita in the Manufacturing/Transfers scenario will rise to US$4 169, which is US$379 more than projections in the Current Path forecast. The GDP per capita for Guinea-Bissau by 2043 in the Manufacturing/Transfers scenario will also be above the average of US$4 005 for low-income countries in Africa.
During the period under consideration, the absolute number of poor people is projected to increase although the percentage of poor people is expected to decline. Compared to the Current Path forecast, the Manufacturing/Transfers scenario leads to a much quicker decline in poverty. The total number of poor people is projected to increase to 1.3 million (40.7% of the population) in 2043 in the Manufacturing/Transfers scenario. An estimated 90 000 people (about 2.7% of the population) can be lifted above the poverty line of US$1.90 as a result of the Manufacturing/Transfers scenario. This means that if the country embraces policies such as investment in the economy, research and development and export promotion, the absolute number of poor people will likely be 90 000 fewer than on the Current Path in 2043. Nonetheless, the proportion of poor people in Guinea-Bissau based on the Manufacturing/Transfers scenario in 2043 will be about 15.5 percentage points above the average for low-income countries in Africa.
The Leapfrogging scenario represents a reasonable but ambitious adoption of and investment in renewable energy technologies, resulting in better access to electricity in urban and rural areas. The scenario includes accelerated access to mobile and fixed broadband and the adoption of modern technology that improves government efficiency and allows for the more rapid formalisation of the informal sector.
The intervention is explained here in the thematic part of the website.
Fixed broadband includes cable modem Internet connections, DSL Internet connections of at least 256 KB/s, fibre and other fixed broadband technology connections (such as satellite broadband Internet, ethernet local area networks, fixed-wireless access, wireless local area networks, WiMAX, etc.).
In 2019, the total number of fixed broadband subscriptions in Guinea-Bissau was 4.5 per 100 people — greater than the average of 2.3 for low-income countries in Africa. In the Current Path forecast, fixed broadband subscriptions are expected to rise to 42.8 per 100 people by 2043. The Leapfrogging scenario will lead to a much greater increase in fixed broadband subscriptions compared to the Current Path forecast, with a difference of almost 7.2 subscriptions per 100 people by 2043. In the forecast horizon, fixed broadband subscriptions in Guinea-Bissau are expected to be higher than the average for low-income African countries.
Mobile broadband refers to wireless Internet access delivered through cellular towers to computers and other digital devices.
Guinea-Bissau had 21.4 mobile broadband subscriptions per 100 people in 2019, which was slightly below the average of 22.9 for low-income countries on the continent. Although between 2024 and 2027 mobile broadband subscriptions in the Leapfrogging scenario rise above the Current Path, from 2028, the Leapfrogging scenario and the Current Path forecast converge. By 2043, mobile broadband subscriptions in the Current Path forecast and in the Leapfrogging scenario increase to 152.9 per 100 people, above the average of 137.4 per 100 people for Africa’s low-income countries.
Guinea-Bissau has a low level of access to electricity. The number of Bissau-Guineans who had access to electricity in 2019 was 500 000 people, representing 24.5% of the total population. This is below the average of 32.2% for low-income countries in Africa. The country has a rural–urban disparity in terms of access to electricity. About 44.4% of people in urban centres had access to electricity compared to the paltry 9.2% of those in the rural areas in 2019. In the Leapfrogging scenario, it is projected that by 2043 about 70.3% of Bissau-Guineans (constituting 2.3 million people) will have access to electricity. This is below the projected average for low-income countries in Africa. It is, however, higher than the 56.8% of the population (reflecting 1.8 million people) projected in the Current Path forecast, signifying that the Leapfrogging scenario can provide access to electricity to an additional 500 000 people. In 2043, 83.5% and 76% of urban dwellers in Guinea-Bissau will have access to electricity in the Leapfrogging scenario and in Current Path forecast, respectively. However, in the case of rural dwellers, 55.8% and 35.6% will have access to electricity by 2043 based on the Leapfrogging scenario and the Current Path forecast, respectively.
Guinea-Bissau’s GDP per capita is projected to increase from US$1 776 in 2019 to US$4 297 in 2043 in the Leapfrogging scenario. This represents an increase of US$330 over the Current Path forecast for 2043. It is also higher than the projected average of US$4 130 for low-income countries in Africa.
In the Leapfrogging scenario, the number of poor people in 2043 is projected to be 1.3 million, representing 40.5% of the population. This projection is lower than the 1.4 million people estimated in the Current Path forecast for the same year, which suggests that the number of poor people in the Leapfrogging scenario is about 100 000 fewer than the Current Path forecast in 2043. The number of poor people projected in the Leapfrogging scenario is however still 15.3 percentage points higher than the average for low-income African countries.
The Free Trade scenario represents the impact of the full implementation of the African Continental Free Trade Area (AfCFTA) by 2034 through increases in exports, improved productivity and increased trade and economic freedom.
The intervention is explained here in the thematic part of the website.
The trade balance is the difference between the value of a country's exports and its imports. A country that imports more goods and services than it exports in terms of value has a trade deficit, while a country that exports more goods and services than it imports has a trade surplus.
Guinea-Bissau, like many African economies, is a net importer of goods and services. The major export of Guinea-Bissau is cashews, which accounts for about 85%–90% of total exports. The main imported items are fuel and food items such as rice and wheat flours. In 2019, Guinea-Bissau’s trade deficit represented 11.8% of GDP, which was below the average deficit of 12.9% for low-income African countries. This deficit worsened due to political instability, unreliable rainfall and fluctuations in the price of its principal export. Guinea-Bissau will continue to see deterioration until 2023 with a balance of 19.1%. Afterwards, the country will witness an improvement in its trade balance in both the Current Path forecast and in the Free Trade scenario. The improvement is much quicker in the latter until 2041 when the situation reverses. By 2043, Guinea-Bissau’s trade deficit as a percentage of GDP is projected to be 3.4% in the Free Trade scenario. This is 3.1 percentage points higher than the estimate in the Current Path forecast in the same year, suggesting that in the long term, the Current Path will lead to greater improvement in trade balance than the Free Trade scenario. Between 2020 and 2036, Guinea-Bissau’s trade deficit as a percentage of GDP is higher than the average for low-income African countries. Within the rest of the period, the reverse is the case.
The GDP per capita for Guinea-Bissau is estimated to increase to US$4 346 by 2043 in the Free Trade scenario, which is US$379 more than the projections of the Current Path in 2043. This means that if Guinea-Bissau takes advantage of the AfCFTA to increase trade and productivity, it can achieve an extra US$379 increase in GDP per capita compared to the Current Path forecast in 2043. Notwithstanding, the average GDP per capita of US$4 260 for low-income African countries is US$91 higher than the projected value for Guinea-Bissau in the Free Trade scenario.
By 2043, about 1.3 million people (representing 39.8% of the population) will be living below the poverty line of US$1.90 per day. The AfCFTA has the potential to increase intra-Bissau-Africa trade and boost productivity leading to a 3.7 percentage points lower poverty than the Current Path forecast. That is to say that the Free Trade scenario lifts 120 000 fewer poor people out of extreme poverty than the Current Path by 2043. The proportion of the poor people projected in the Free Trade scenario is still higher than the average for low-income countries in Africa.
The Financial Flows scenario represents a reasonable but ambitious increase in worker remittances and aid flows to poor countries, and an increase in the stock of foreign direct investment (FDI) and additional portfolio investment inflows to middle-income countries. We also reduced outward financial flows to emulate a reduction in illicit financial outflows.
The intervention is explained here in the thematic part of the website.
Generally, the total foreign aid received by Guinea-Bissau has been quite high. The country is a large recipient of aid and relies heavily on aid to support its budget. In 2011, the country was ranked the 20th most aid-dependent country in the world. Foreign aid accounts for about 80% of the country’s total budgetary support. The total foreign aid received by Guinea-Bissau in 2019 was 12.7% of GDP, constituting about US$120.5 million, which was higher than the average of 8.6% for low-income countries in Africa. Although foreign aid to Guinea-Bissau in absolute terms is projected to rise, foreign aid as a percentage of GDP is expected to decline such that by 2043 the total foreign aid received by the country is projected to be 7% of GDP in the Financial Flows scenario and 6.2% of GDP in the Current Path forecast. This suggests that in the Financial Flows scenario, foreign aid as a percentage of GDP is lower than in the Current Path forecast by 0.8 percentage points in 2043. These projections are still higher than the average for a low-income African country. The expected decline in foreign aid can be explained by the anticipated growth and expansion in the future, resulting in a higher GDP that would automatically disqualify the country from certain aid packages. It is also plausible that GDP will outgrow foreign aid in the country.
The total FDI inflow to Guinea-Bissau is quite low. The country was ranked 174th in the 2020 World Bank Report on the ease of doing business. Factors that account for the low level of investment in the country include political instability, poor infrastructural networks, corruption and high energy costs in the country. Guinea-Bissau’s total FDI in 2019 amounted to 2.9% of GDP, which is lower than the average of 4.3% for low-income African countries. By 2043, it is projected that total FDI to the country will be about 3.7% of GDP in the Current Path forecast. In the Financial Flows scenario, FDI is projected to be around 3.9% of GDP in 2043, which will also be below the average of 5.3% for low-income countries on the continent.
In 2019, the total value of remittances that Guinea-Bissau received amounted to US$0.03 billion, which constituted about 1.7% of GDP. This is significantly lower than the average for low-income African countries. The absolute value of remittance is projected to remain steady in the Financial Flows scenario but declines in the Current Path in 2043. Remittances as a percentage of GDP will fall in the Current Path forecast and in the Financial Flows scenario. In the Financial Flows scenario, remittances as a percentage of GDP are projected to fall to 0.45%. Remittances will decline quicker in the Current Path forecast, so that by 2043 total remittances in the country will be about 0.02% of GDP. Due to greater output growth compared to the growth in remittances in the Financial Flows scenarios, the value of remittance increases while its proportion of output falls.
Guinea-Bissau’s GDP per capita is estimated to increase to US$4 041 by 2043 in the Financial Flows scenario. This represents an increase of US$74 over the Current Path projection in the same year. The US$4 041 estimate is higher than the average for low-income countries in Africa, which is projected to be US$3 860 by 2043. The insignificant increase in the GDP per capita in the Financial Flows scenario reflects the minimal FDI inflows due to political instability in Guinea-Bissau.
Trade openness will reduce poverty in the long term after initially increasing it due to the redistributive effects of trade. Most African countries export primary commodities and low-tech manufacturing products, and therefore a continental free trade agreement (AfCFTA) that reduces tariffs and non-tariff barriers across Africa will increase competition among countries in primary commodities and low-tech manufacturing exports. Countries with inefficient, high-cost manufacturing sectors might be displaced as the AfCFTA is implemented, thereby pushing up poverty rates. In the long term, as the economy adjusts and produces and exports its comparatively advantaged (lower relative cost) goods and services, poverty rates will decline.
In the Financial Flows scenario, about 1.4 million people (representing 41.7% of the total population) are projected to live below the poverty line of US$1.90 per day in 2043. This estimate constitutes a reduction of about 60 000 people compared to the Current Path forecast in the same year. It is also higher than the average of 25.2% of the total population for low-income countries in Africa.
The Infrastructure scenario represents a reasonable but ambitious increase in infrastructure spending across Africa, focusing on basic infrastructure (roads, water, sanitation, electricity access and ICT) in low-income countries and increasing emphasis on advanced infrastructure (such as ports, airports, railway and electricity generation) in higher-income countries.
Note that health and sanitation infrastructure is included as part of the Health/WaSH scenario and that ICT infrastructure and more rapid uptake of renewables are part of the Leapfrogging scenario. The interventions there push directly on outcomes, whereas those modelled in this scenario increase infrastructure spending, indirectly boosting other forms of infrastructure, including that supporting health, sanitation and ICT.
The intervention is explained here in the thematic part of the website.
As of 2019, 500 000 people (24.5% of the population) had access to electricity in Guinea-Bissau, and this is expected to increase to 2.2 million people (69% of the population) in 2043 in the Infrastructure scenario. This increase exceeds the projected value of 1.8 million people (56.8% of the population) in the Current Path forecast. In terms of rural–urban dichotomy, by 2043, it is projected that 76% and 80.8% of urban dwellers will have access to electricity in the Current Path forecast and in the Infrastructure scenario, respectively. However, only 55.9% and 35.6% of rural dwellers in the Infrastructure scenario and in the Current Path forecast respectively will have access to electricity in 2043, indicating a disparity in access to electricity between urban and rural dwellers in both the Current Path and in the Infrastructure scenario.
Indicator 9.1.1 in the Sustainable Development Goals refers to the proportion of the rural population who live within 2 km of an all-season road and is captured in the Rural Access Index.
In 2019, 52.3% of all rural dwellers in Guinea-Bissau resided within 2 km of an all-weather road, which was higher than the average of 43% for low-income African countries. In the Infrastructure scenario, this is expected to rise to 62.8% by 2043, higher than the 59.8% of people projected in the Current Path forecast and the average of 53.5% for low-income countries in Africa. Accessible rural roads enable rural dwellers to enjoy amenities from nearby urban areas while allowing urban centres to also benefit from the agricultural products supplied by rural areas more easily. This leads to improvement in socioeconomic development in the life of citizens.
Guinea-Bissau’s GDP per capita is estimated to rise to US$4 088 by 2043 in the Infrastructure scenario. This is US$121 more than the projection in the Current Path forecast in the same year, and above the average of US$3 967 for low-income countries in Africa.
By 2043, the proportion of the poor population is expected to decline from 63.9% in 2019 to 42.4% in 2043 in the Infrastructure scenario. This corresponds to 1.4 million poor people in 2043 who will live below the poverty line. Comparing this with the projections in the Current Path forecast suggests that there will be 35 000 fewer poor people in the Infrastructure scenario than in the Current Path forecast for the same year. This will, however, be higher than the estimated average of 25.2% for low-income countries in Africa.
The Governance scenario represents a reasonable but ambitious improvement in accountability and reduces corruption, and hence improves the quality of service delivery by government.
The intervention is explained here in the thematic part of the website.
As defined by the World Bank, government effectiveness ‘captures perceptions of the quality of public services, the quality of the civil service and the degree of its independence from political pressures, the quality of policy formulation and implementation, and the credibility of the government’s commitment to such policies’.
Chart 51 presents the impact of the interventions in the Governance scenario on government effectiveness.
In 2019, Guinea-Bissau’s score for government effectiveness was 0.99, which was below the average of 1.4 for low-income countries in Africa. In both the Current Path forecast and the Governance scenario, government effectiveness is estimated to increase over the period, although the increase in the scenario is higher than the increase in the Current Path forecast. The projected score for government effectiveness in the Governance scenario by 2043 is 1.87 which is 0.11 more than projected score in the Current Path forecast. However, this score is 0.16 less than the average for low-income countries in Africa.
In the Governance scenario, Guinea-Bissau’s GDP per capita is projected to increase to US$4 059 in 2043, which is US$92 more than the estimates in the Current Path forecast and higher than the average of US$3 917 for low-income countries on the continent in the same year. This suggests that good governance in the form of reducing corruption, improving the quality of service delivery and accountability can lead to an additional US$92 in GDP per capita compared with the Current Path forecast in 2043.
The proportion of people living below the poverty line of US$1.90 is expected to decline to 42.5% in 2043 in the Governance scenario, which is higher than the 25.2% average for low-income African countries. It also corresponds to about 30 000 fewer people than the 1.41 million poor people projected in the Current Path forecast for 2043.
This section presents projections for carbon emissions in the Current Path for Guinea-Bissau and the 11 scenarios. Note that IFs uses carbon equivalents rather than CO2 equivalents.
The total amount of carbon emitted by Guinea-Bissau in 2019 was 0.12 million tons; carbon emissions are projected to increase in all the scenarios to total 1.2 million tons in the Combined Agenda 2063 scenario by 2043. The intervention with the greatest impact on carbon emissions is the Agriculture scenario, which will lead to Guinea-Bissau’s carbon emissions being 0.9 million tons in 2043. This is followed by the Free Trade and Manufacturing/Transfers scenarios with projected carbon emissions of 0.84 million tons and 0.81 million tons, respectively, by 2043. The intervention with the least impact on carbon emissions is the Demographic scenario which results in emissions of 0.76 million tons of carbon.
The Combined Agenda 2063 scenario consists of the combination of all 11 sectoral scenarios presented above, namely the Stability, Demographic, Health/WaSH, Agriculture, Education, Manufacturing/Transfers, Leapfrogging, Free Trade, Financial Flows, Infrastructure and Governance scenarios. The cumulative impact of better education, health, infrastructure, etc. means that countries get an additional benefit in the integrated IFs forecasting platform that we refer to as the synergistic effect. Chart 55 presents the contribution of each of these 12 components to GDP per capita in the Combined Agenda 2063 scenario as a stacked area graph.
The effect of all scenarios on GDP per capita is estimated to be about US$3 900 in 2043. This suggests that in 2043, the additional GDP per capita based on the Combined Agenda 2063 scenario will be US$3 900. The scenario with the greatest impact on GDP per capita by 2043 is the Agriculture scenario followed by the Free Trade scenario, while the scenarios with the least impact on GDP per capita are Health/WaSH and Governance. This suggests that in the long term, the Agriculture and Free Trade scenarios have the greatest potential to improve human and economic development in Guinea-Bissau.
Whereas Chart 55 presents a stacked area graph on the contribution of each scenario to GDP per capita as well as the additional benefit or synergistic effect, Chart 56 presents only the GDP per capita in the Current Path forecast and the Combined Agenda 2063 scenario.
Guinea-Bissau’s GDP per capita is estimated to increase to US$7 867 in 2043 in the Combined Agenda 2063 scenario. This is US$3 900 more than the projection in the Current Path forecast for 2043. Guinea-Bissau’s GDP per capita in the Combined Agenda 2063 scenario will be US$1 365 higher than the average for low-income countries in Africa.
In the Combined Agenda 2063 scenario, the number of poor people will decline such that by 2043, only 450 000 Bissau-Guineans, representing 14.9% of the population, will be living below the poverty line. This means that, compared with the Current Path, an additional 900 000 people can be lifted out of extreme poverty in the Combined Agenda 2063 scenario. The projections for the number of poor people on average for low-income African countries by 2043 is 10.3 percentage points higher than that of Guinea-Bissau in the Combined Agenda 2063 scenario.
See Chart 8 to view the Current Path forecast of the sectoral composition of the economy.
In the Combined Agenda 2063 scenario, the biggest contributors to GDP in the long term are the service, manufacturing and agriculture sectors. By 2043, the service sector will contribute an additional US$4.3 billion, although its share of GDP will be reduced by -1 percentage point. The manufacturing and agriculture sectors will contribute US$2.2 billion and US$1.4 billion respectively; in terms of percentage points, the contribution of manufacturing declines by 1.6 percentage points and the contribution of agriculture increases by 2.3 percentage points.
The estimated GDP (MER) for 2043 in the Combined Agenda 2063 scenario in 2043 will be US$16.4 billion, which is higher than the Current Path estimates of US$7.3 billion. This suggests that compared with the Current Path forecast, the size of the economy will increase by 123% by 2043 in the Combined Agenda 2063 scenario.
The total amount of carbon emitted in 2019 was 0.12 million tons. In the Combined Agenda 2063 scenario, the total carbon emitted is projected to rise to 1.2 million tons by 2043. This is higher than the estimates of 0.78 million in the Current Path forecast for 2043, meaning that the Combined Agenda 2063 scenario leads to much higher levels of carbon emissions than the Current Path.
Page information
Contact at AFI team is Enoch Randy Aikins
This entry was last updated on 31 May 2026 using IFs v7.63.
Donors and sponsors


Reuse our work
- All visualizations, data, and text produced by African Futures are completely open access under the Creative Commons BY license. You have the permission to use, distribute, and reproduce these in any medium, provided the source and authors are credited.
- The data produced by third parties and made available by African Futures is subject to the license terms from the original third-party authors. We will always indicate the original source of the data in our documentation, so you should always check the license of any such third-party data before use and redistribution.
- All of our charts can be embedded in any site.
Cite this research
Enoch Randy Aikins (2026) Guinea-Bissau Development Futures. Published online at futures.issafrica.org. Retrieved from https://futures.issafrica.org/geographic/countries/guinea-bissau/ [Online Resource] Updated 31 May 2026.