 Ghana
Ghana
Feedback welcome
Our aim is to use the best data to inform our analysis. See our About page for information on the IFs forecasting platform. We appreciate your help and references for improvements via our feedback form.
In this entry, we first describe the Current Path forecast for Ghana as it is expected to unfold to 2043, the end of the third ten-year implementation plan of the African Union’s Agenda 2063 long-term vision for Africa. The Current Path in the International Futures (IFs) forecasting model initialises from country-level data that is drawn from a range of data providers. We prioritise data from national sources.
The Current Path forecast is divided into summaries on demographics, economics, poverty, health/WaSH and climate change/energy. A second section then presents a single positive scenario for potential improvements in stability, demographics, health/WaSH, agriculture, education, manufacturing and transfers, leapfrogging, free trade, financial flows, infrastructure, governance and the impact of various scenarios on carbon emissions. With the individual impact of these sectors and dimensions having been considered, a final section presents the impact of the Combined Agenda 2063 scenario.
We generally review the impact of each scenario and the Combined Agenda 2063 scenario on gross domestic product per person and extreme poverty except for Health/WaSH that uses life expectancy and infant mortality.
The information is presented graphically and supported by brief interpretive text.
All US$ numbers are in 2017 values.
Summary
- The Current Path forecast shows that Ghana will:
- become a predominantly urbanised country, such that 67.4% of the population will reside in urban areas while only 32.6% will live in rural areas by 2043. Jump to Demographics: Current Path
- experience an increase in GDP per capita to US$6 751 by 2043. Jump to Economy: Current Path
- experience a slight reduction in the number of poor people, with 12.6 million people living below the poverty line by 2043. Jump to Poverty: Current Path
- experience an overall decrease in carbon emissions to 4 million tons of carbon by 2043. Jump to Carbon emissions/Energy: Current Path
- Sectoral Scenarios
- The Stability scenario has the potential to increase GDP per capita to US$6 910 by 2043, reducing the number of people living below the poverty line to 12.3 million people. Jump to Stability Scenario
- In the Demographic scenario, Ghana’s infant mortality rate can decline to 19.7 by 2043 from 38.6 in 2019, and the demographic dividend can be reached five years earlier than in the Current Path forecast. Jump to Demographic scenario
- The Health/WaSH scenario will increase life expectancy to 73.8 years by 2043, months beyond the Current Path forecast. Jump to Health/Wash scenario
- In the Agriculture scenario, yield per hectare will be 12 metric tons by 2043, almost double the 6.7 metric tons per hectare achieved in 2019. Jump to Agriculture scenario
- The Education scenario will result in a decline of the number of poor people in Ghana to 12.04 million by 2043. Jump to Education scenario
- Under the Manufacturing/Transfers scenario, government welfare transfers to unskilled workers will increase to US$19.4 billion by 2043. Jump to Manufacturing/Transfer scenario
- The Leapfrogging scenario will enable access to electricity to 97.2% of the population compared to 80.1% in 2019. Jump to Leapfrogging scenario
- In the Free Trade scenario, there will be a greater reduction in the number of poor people than the Current Path forecast for 2043, with 11.1 million people living below the poverty line. Jump to Free Trade scenario
- The Financial Flows scenario will increase GDP per capita to US$6 930 by 2043. Jump to Financial Flow scenario
- The Infrastructure scenario will increase the percentage of the rural population living within 2 km of all-weather roads to 73.8% by 2043. Jump to Infrastructure scenario
- The Governance scenario will increase GDP per capita to US$6 930 by 2043. Jump to Governance scenario
- The Leapfrogging scenario has the greatest potential to reduce carbon emissions by 3 million tons by 2043. Jump to Impact of scenarios on carbon emissions
- The Combined Agenda 2063 scenario will result in: Jump link to Combined Agenda 2063 scenario
- a significant increase in GDP per capita to US$9 867 by 2043.
- aggressive growth of the economy to US$291.8 billion by 2043.
- a noticeable reduction in the number of people living below the poverty line to 4.225 million people (9.5% of the population).
- heavy reductions in carbon emissions to 4.1 million tons.
All charts for Ghana
- Chart 1: Political map of Ghana
- Chart 2: Population structure in CP, 1990–2043
- Chart 3: Urban and rural population in CP, 1990–2043
-
Chart 4: Population density map for 2019
Chart 4: Population density map for 2019
- Chart 5: GDP in CP, 1990–2043
- Chart 6: GDP per capita in CP, 1990–2043
- Chart 7: Informal sector value in CP, 2015–2043
- Chart 8: Value added by sector in CP, 2015–2043
- Chart 9: Agriculture production/demand in CP, 1990–2043
- Chart 10: Poverty in CP, 2015–2043
- Chart 11: Energy production by type in CP, 1990–2043
- Chart 12: Carbon emissions in CP, 1990–2043
- Chart 13: Governance security in CP and Stability scenario, 2019–2043
- Chart 14: GDP per capita in CP and Stability scenario, 2019–2043
- Chart 15: Poverty in CP and Stability scenario, 2019–2043
- Chart 16: Demographic dividend in CP and Demog scenario, 2019–2043
- Chart 17: Infant mortality in CP and Demog scenario, 2019–2043
- Chart 18: GDP per capita in CP and Demog scenario, 2019–2043
- Chart 19: Poverty in CP and Demog scenario, 2019–2043
- Chart 20: Life expectancy in CP and Health/WaSH scenario, 2019–2043
- Chart 21: Infant mortality in CP and Health/WaSH scenario, 2019–2043
- Chart 22: Yield/hectare in CP and Agric scenario, 2019–2043
- Chart 23: Agriculture imports in CP and Agric scenario, 2019–2043
- Chart 24: GDP per capita in the CP and Agric scenario, 2019–2043
- Chart 25: Poverty in CP and Agric scenario, 2019–2043
- Chart 26: Mean years of education in CP and Educ scenario, 2019–2043
- Chart 27: Education quality in CP and Educ scenario, 2019–2043
- Chart 28: GDP per capita in CP and Educ scenario, 2019–2043
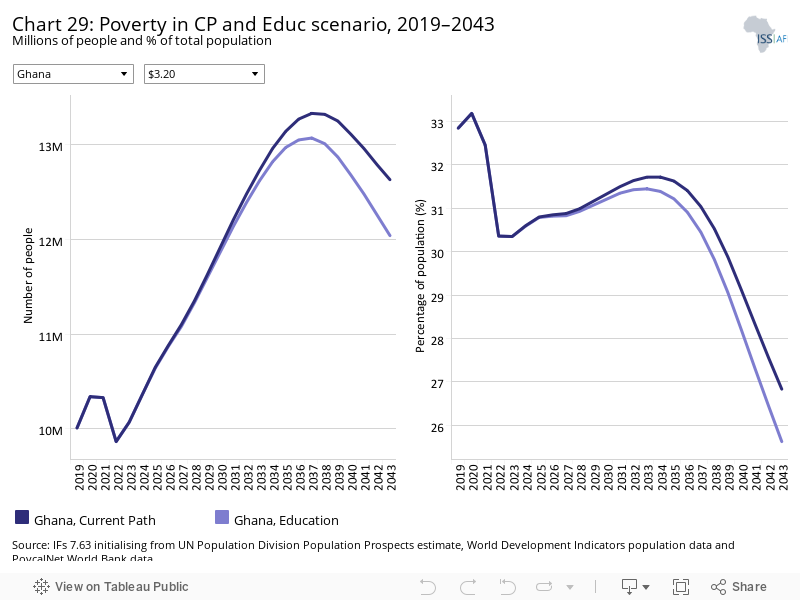
- Chart 29: Poverty in CP and Educ scenario, 2019–2043
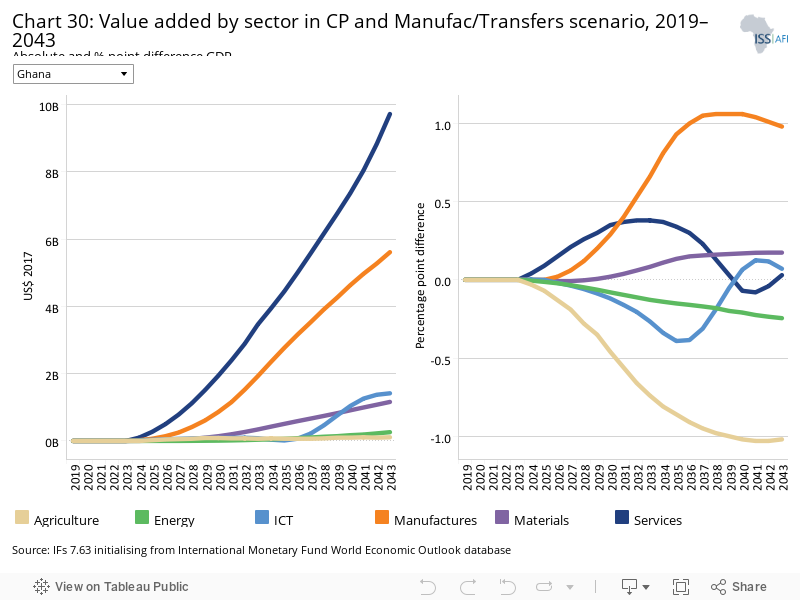
- Chart 30: Value added by sector in CP and Manufac/Transfers scenario, 2019–2043
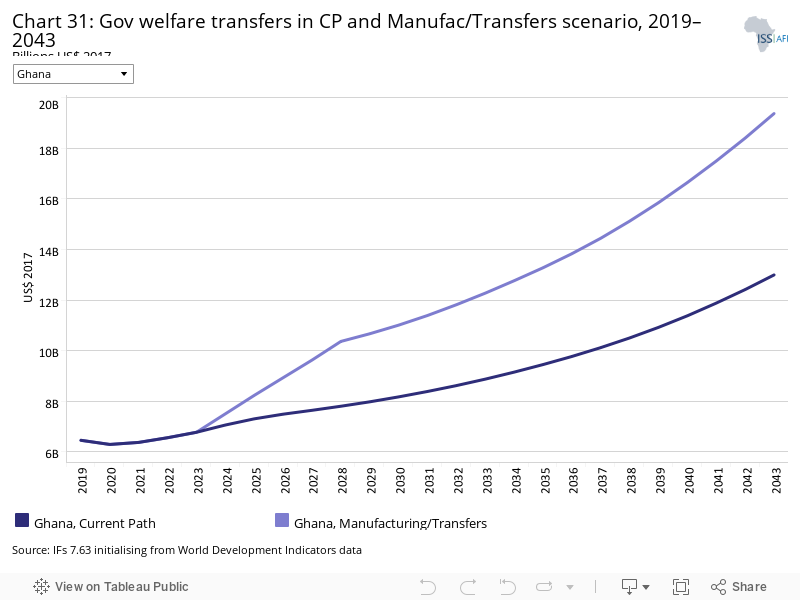
- Chart 31: Gov welfare transfers in CP and Manufac/Transfers scenario, 2019–2043
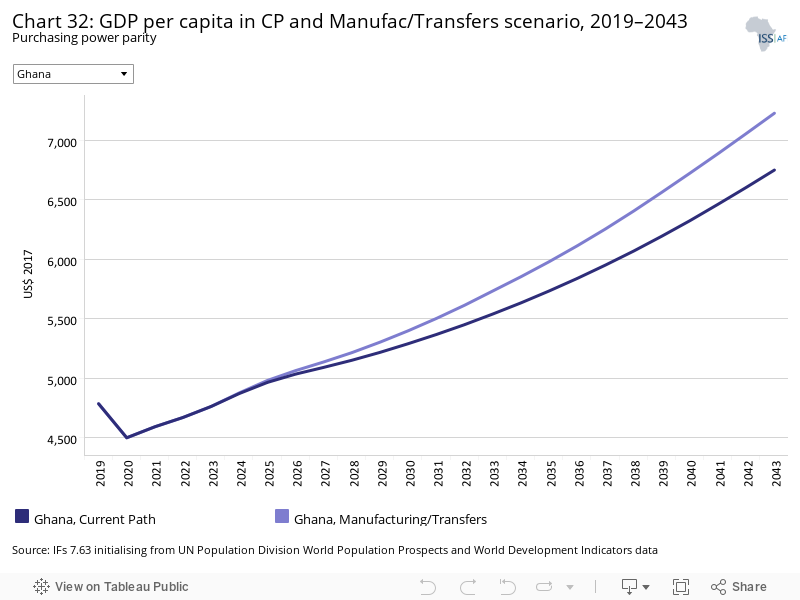
- Chart 32: GDP per capita in CP and Manufac/Transfers scenario, 2019–2043
- Chart 33: Poverty in CP and Manufac/Transfers scenario, 2019–2043
- Chart 34: Fixed broadband access in CP and Leapfrogging scenario, 2019–2043
- Chart 35: Mobile broadband access in CP and Leapfrogging scenario, 2019–2043
- Chart 36: Electricity access in CP and Leapfrogging scenario, 2019–2043
- Chart 37: GDP per capita in CP and Leapfrogging scenario, 2019–2043
- Chart 38: Poverty in CP and Leapfrogging scenario, 2019–2043
- Chart 39: Trade balance in CP and Free Trade scenario, 2019–2043
- Chart 40: GDP per capita in CP and Free Trade scenario, 2019–2043
- Chart 41: Poverty in CP and Free Trade scenario, 2019–2043
- Chart 42: Foreign aid in CP and Financial Flows scenario, 2019–2043
- Chart 43: Inflow of FDI in CP and Financial Flows scenario, 2019–2043
- Chart 44: Remittances in CP and Financial Flows scenario, 2019–2043
- Chart 45: GDP per capita in CP and Financial Flows scenario, 2019–2043
- Chart 46: Poverty in CP and Financial Flows scenario, 2019–2043
- Chart 47: Electricity access in CP and Infrastructure scenario, 2019–2043
- Chart 48: Rural road access in CP and Infrastructure scenario, 2019–2043
- Chart 49: GDP per capita in CP and Infrastructure scenario, 2019–2043
- Chart 50: Poverty in CP and Infrastructure scenario, 2019–2043
- Chart 51: Gov effectiveness in CP and Governance scenario, 2019–2043
- Chart 52: GDP per capita in CP and Governance scenario, 2019–2043
- Chart 53: Poverty in CP and Governance scenario, 2019–2043
- Chart 54: Carbon emissions in CP and scenarios, 2019–2043
- Chart 55: GDP per capita in CP and scenarios, 2019–2043
- Chart 56: GDP per capita in CP and Combined scenario, 2019–2043
- Chart 57: Poverty in CP and Combined scenario, 2019–2043
- Chart 58: Value added by sector in CP and Combined scenario, 2019–2043
- Chart 59: GDP in CP and Combined scenario, 2019–2043
- Chart 60: Carbon emissions in CP and Combined scenario, 2019–2043
This page provides an overview of the key characteristics of [Ghana] along its likely (or Current Path) development trajectory. The Current Path forecast from the International Futures forecasting (IFs) platform is a dynamic scenario that imitates the continuation of current policies and environmental conditions. The Current Path is therefore in congruence with historical patterns and produces a series of dynamic forecasts endogenised in relationships across crucial global systems. We use 2019 as a standard reference year and the forecasts generally extend to 2043 to coincide with the end of the third ten-year implementation plan of the African Union’s Agenda 2063 long-term development vision.
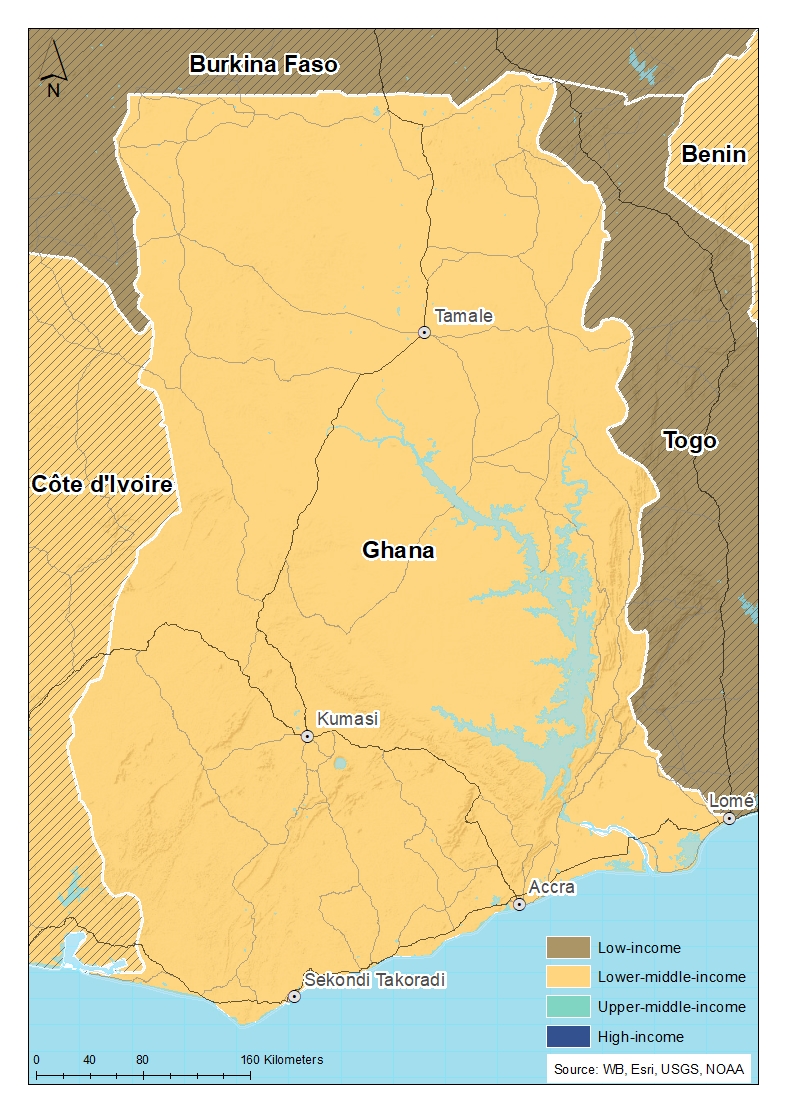
Chart 1 shows the political map of Ghana, one of 23 lower middle-income countries in Africa. Ghana is located in West Africa along the Gulf of Guinea, bordering Burkina Faso in the north, Cote d’Ivoire in the west and Togo in the east, all of which are members of the Economic Community of West African States. The national capital, Accra, is located in the Greater Accra Region of southern Ghana. The country has a total area of 238,535 km² and a tropical climate with two major seasons consisting of a rainy season and a dry season. The country is divided into six ecological zones, namely: Sudan savannah, Guinea savannah, Coastal savannah, forest/savannah transitional zone, deciduous forest zone, and the rain forest zone. Ghana has abundant natural resources such as gold, bauxite, diamonds, timber, manganese and oil, and it is the second largest producer of cocoa in the world. The country is divided into 16 administrative regions, after a 2019 referendum which increased the number from 10 to 16, consisting of 260 districts. The Northern Region is the largest in size, but the Greater Accra Region has the largest population of 5.446 million people, followed by the Ashanti region, with an estimated population of 5.432 million people.
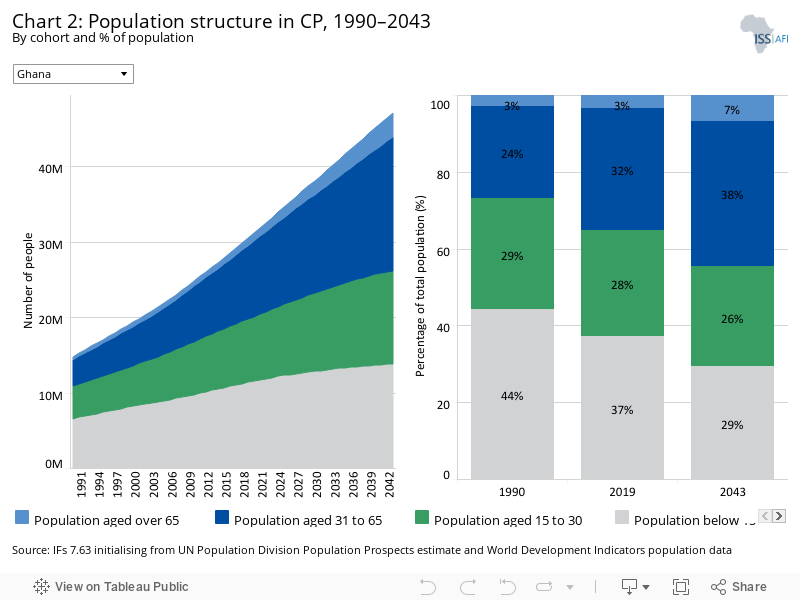
Chart 2 shows the population by cohort based on the Current Path forecast. Ghana is the second most populous country in West Africa after Nigeria and the seventh most populous in Africa, with an estimated population of 30.5 million in 2019, up from 15 million in 1990. It is expected that by 2043, the country’s population will increase to 47 million, representing an approximate increase of 51.1% within the 23-year period. The current median age in Ghana is 21.7 years, indicating that the country has a relatively youthful population. This will increase slightly to 26.6 years by 2043. In addition, 37.2%, 27.6% and 31.9% are currently below 15-, 30- and 65 years of age, respectively. The relatively large cohort of children below the age of 15 constrains the materialisation of the demographic dividend. Within the next 24 years, it is projected that the number of people under 15-, 30- and 45 years of age will constitute 29.3%, 26,3% and 37.6% of total population, signalling the likelihood of a more adult population. This can be attributed to the expected decline in fertility rate from 3.8 births per woman in 2019 to 2.7 births per woman by 2043.
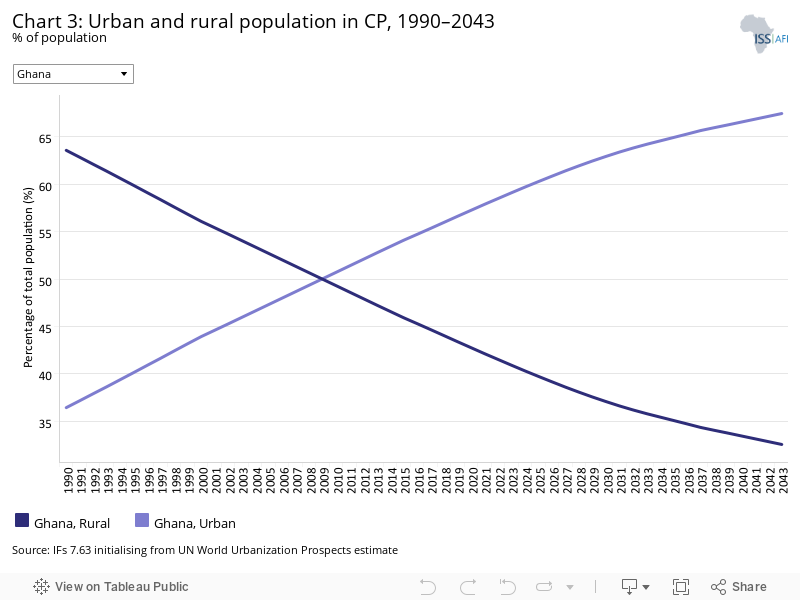
As evident in Chart 3, Ghana has had a history of rapid urbanisation. In 1990, 5.4 million people (representing 36.4% of the population) lived in urban areas. By 2010, the country had almost achieved parity in urban-rural settlement. In 2019, 56.6% of the population resided in urban centres, and this is further expected to rise to about 67.4% by 2043, which suggests that within the next 22 years, only 32.6% of Ghana’s population is expected to live in rural areas. Generally, urbanisation can be sourced either from the development of more towns to the status of urban centres or as a result of rural-urban migration. It is not surprising that the Greater Accra Region is now the most populated region; however, rapid urbanisation can lead to problems such as the development of slums, pressure on social amenities, poor sanitation and large youth unemployment, among other issues, as are evident in the national capital of Accra.
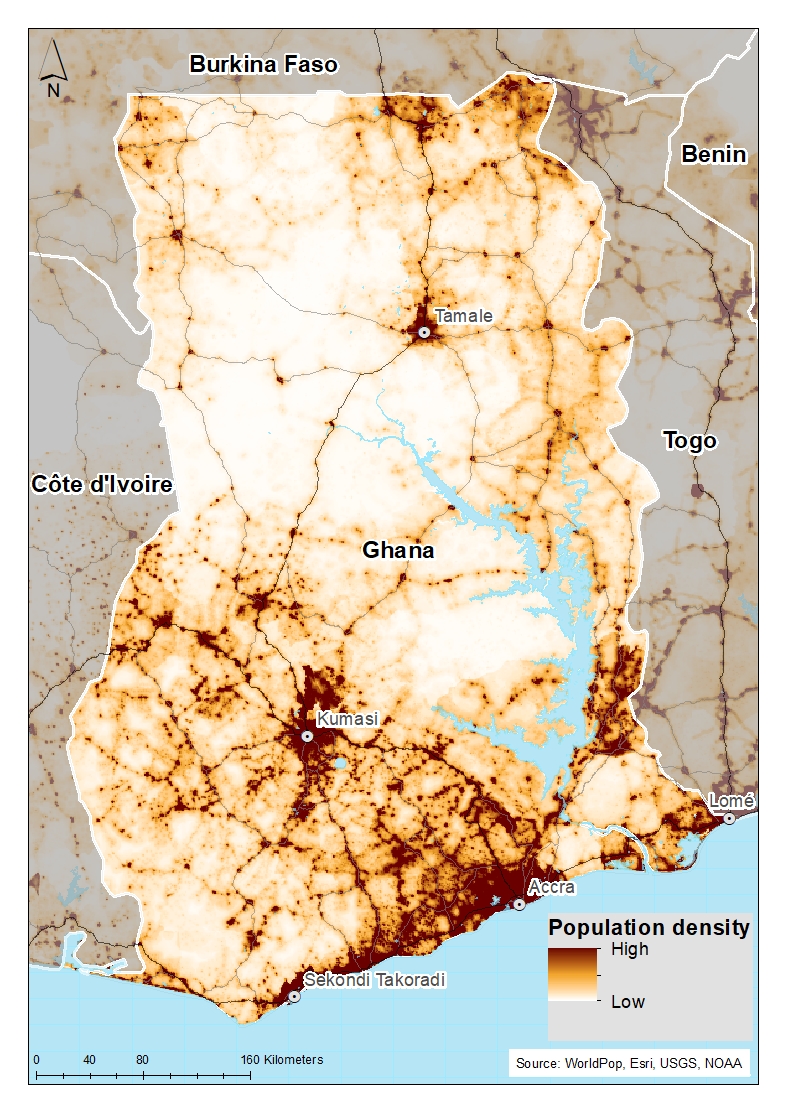
Chart 4 illustrates a map of the population distribution in Ghana. Ghana is the 13th most densely populated country in Africa and the 85th most densely populated in the world, with a population density of 136.6 people per km2. The concentration of Ghana’s population has been around the southern part of the country, mainly the Accra-Kumasi-Takoradi triangle along the south of the Kwahu Plateau. The Greater Accra Region, where the national capital is located, is the most populous region and city, followed by Kumasi in the Ashanti Region. This is mainly due to the economic productivity of the region. Indeed, the south of Kwahu Plateau contains all the country’s mining centres, timber-producing deciduous forests and cocoa-growing lands. The area is also linked to the coast through rail and road networks, thereby important for investment and labour movement. The south is also populated partly due to the influx of refugees from Liberia during the war, and many Togolese people who fled political violence settled along the Volta River Basin. Between 2019 and 2043, the rural population is projected to increase by additional 2.2 million people based on the Current Path forecast.
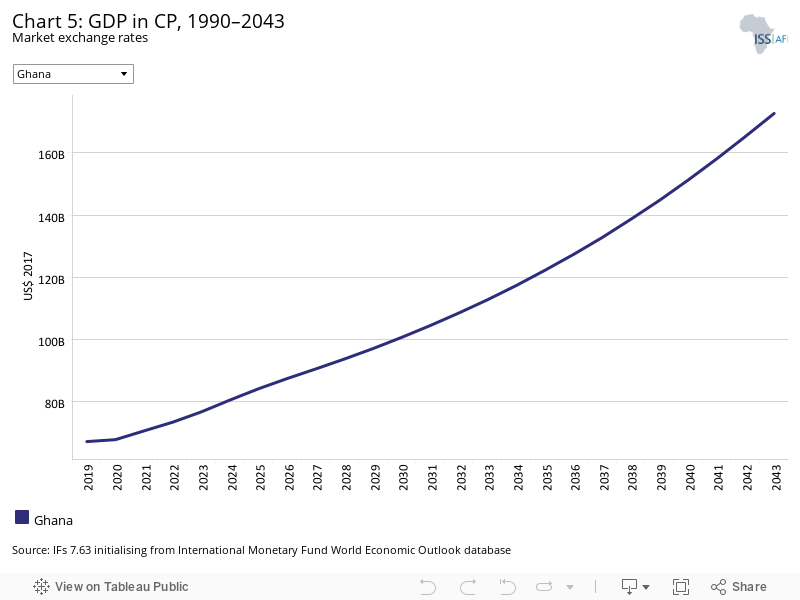
Chart 5 depicts projected gross domestic product (GDP) in the Current Path forecast from 1990 to 2043. Since 1990, the country has nearly quintupled its GDP from US$14.1 billion in 1990 to US$66.9 billion in 2019. From 1993 to 2019, the average growth rate was about 5.6%, which can partly be attributed to the political stability of the Fourth Republic and the liberalisation of the Ghanaian economy. Other factors that can explain this growth are the implementation of various internationally assisted economic reform programmes, such as the poverty reduction strategies, the Highly Indebted Country Initiative, and the various medium-term plans of the country. Over the next 22 years, GDP is estimated to increase to US$172.7 billion by 2043 from its current figure, representing about a 145.3% increment within the period.
Although many of the charts in the sectoral scenarios also include GDP per capita, this overview is an essential point of departure for interpreting the general economic outlook of Ghana.
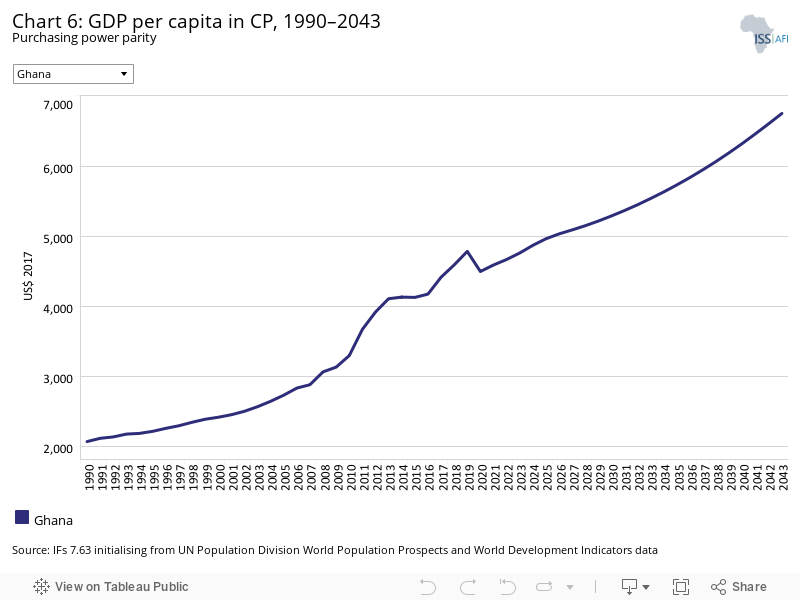
Chart 6 represents GDP per capita (PPP) projections in the Current Path forecast. Over time, GDP per capita has seen a steady increase despite Ghana’s rapid population growth. From 1990 to 2020, the country has more than doubled its GDP per capita from US$2 072 to US$4 784. This is expected, given that the average GDP growth rate of 5.6% exceeds the average population growth rate of 2.5% over the period. By 2043, the average Ghanaian will be worth US$6 751, suggesting that GDP per capita will have tripled from 1990 to 2043. Throughout this period, Ghana’s GDP per capita is consistently below the average for lower middle-income countries on the continent.
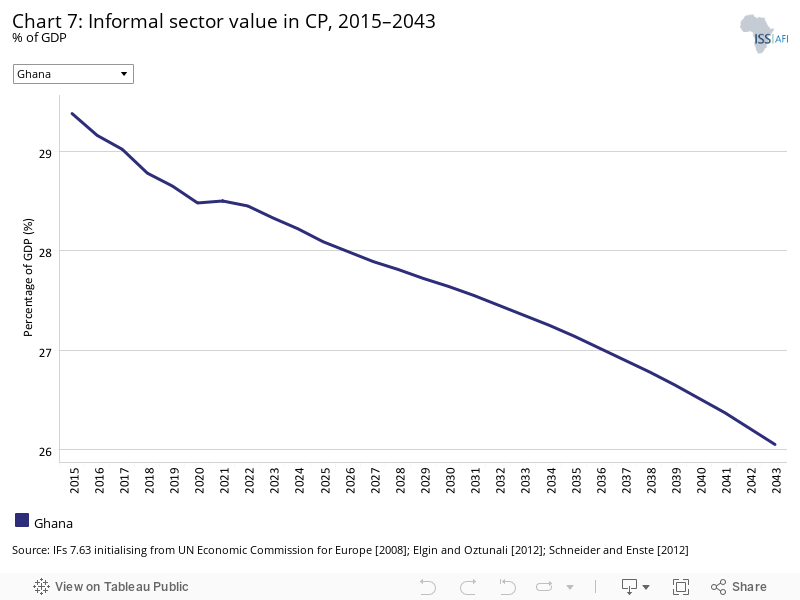
Chart 7 shows projections for the informal sector in the Current Path forecast. Ghana has a large informal sector that is neither taxed nor regulated by the government. The informal sector is usually found within the value chain of commodity distribution. As of 2021, the informal economy represented about 28.5% of the country’s GDP, though this is expected to marginally decline to 26.1% by 2043, suggesting that despite efforts by successive governments to formalise the economy, a lot remains to be done to progress in that regard. Some of these efforts include the digitisation drive of the economy by the incumbent government through various initiatives such as a digital property addressing system, a paperless port system, a mobile payment interoperability platform and the issuance of national ID cards. Unfortunately, this is yet to reflect in the share of the informal sector in the country. The large size of the informal sector also signals a huge potential for increasing government revenue by monitoring and regulating the activities of the sector.
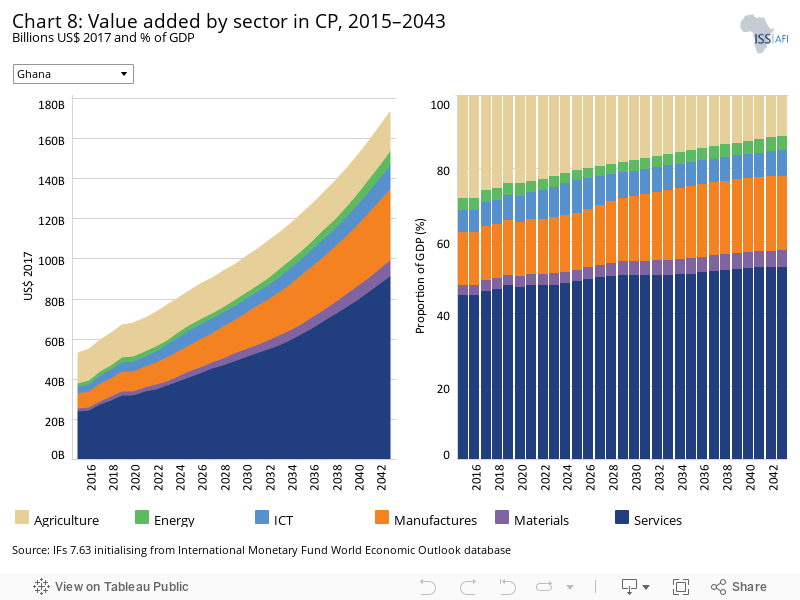
The IFs platform uses data from the Global Trade and Analysis Project (GTAP) to classify economic activity into six sectors: agriculture, energy, materials (including mining), manufactures, services and information and communications technology (ICT).
Chart 8 illustrates the value added by sector both in absolute and proportionate terms in the Current Path forecast. The biggest contributor to Ghana’s GDP in 2020 was the service sector, contributing about US$32 billion, representing 47.4% of GDP—a unsurprising figure given that the service sector employs about half of the total labour force in the country. This is expected to increase to US$91 billion by 2043, representing 52.9% of GDP, implying that by then, more than half of the country’s economic activity will come from the service sector. The agricultural sector is currently the second largest contributor to GDP at 24.3%, constituting US$16 billion in 2020. Manufacturing is the third most significant contributor to GDP at 14.9%. However, it is expected that after 2030, the manufacturing sector will overtake the agricultural sector as the second largest contributor to GDP, so that by 2043, the manufacturing sector will contribute 9.2 percentage points more to GDP than agriculture. While this development is consistent with the structural transformation of an economy, the slow pace of growth of the manufacturing sector, which is key to broader economic transformation and to create decent and sustainable jobs, suggests that the country may still rely quite heavily on agriculture for job creation in coming years.
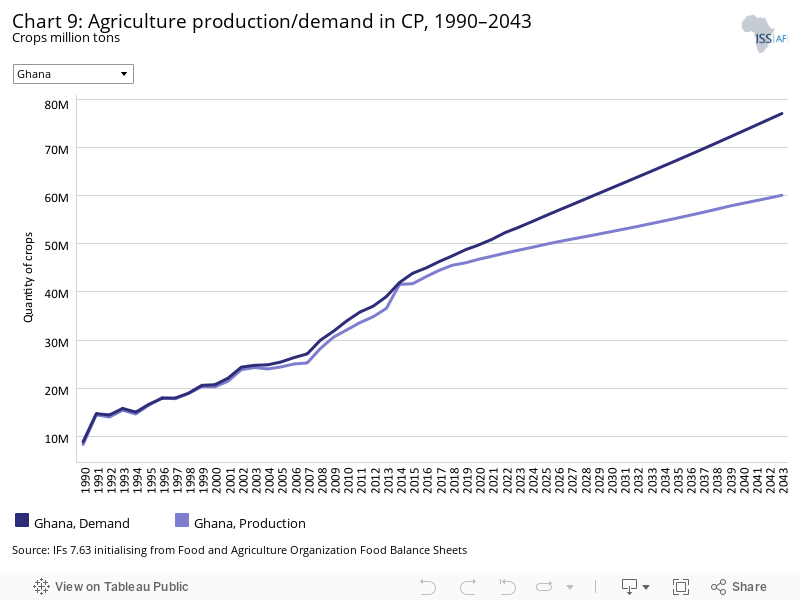
The data on agricultural production and demand in the IFs forecasting platform initializes from data provided on food balances by the Food and Agriculture Organization (FAO). IFs contains data on numerous types of agriculture but aggregates its forecast into crops, meat and fish, presented in million metric tonnes. Chart 9 shows agricultural production and demand as a total of all three categories.
Chart 9 displays estimations for agriculture production and demand in the Current Path forecast. Despite the vast land area and significant proportion of the population employed within the agricultural sector, Ghana continues to be a net importer of food. In 1990, Ghana’s demand for agricultural products outstripped domestic production by 0.56 million metric tons and increased to 2.97 million metric tons in 2020. This can partly be attributed to the declining interest in the agricultural sector reflected in the share of total employment. For instance, between 1991 and 2019, the sector’s share of total employment significantly reduced from 57.1% to 29.8%. Whereas both demand and production are expected to increase over the period, the rate of increase in demand far exceeds that of domestic production. By 2043, demand will outstrip supply by about 17 million metric tons representing a 471% increment over the period. This means that Ghana is yet to take advantage of new agricultural technologies to enhance productivity and to ensure food security.
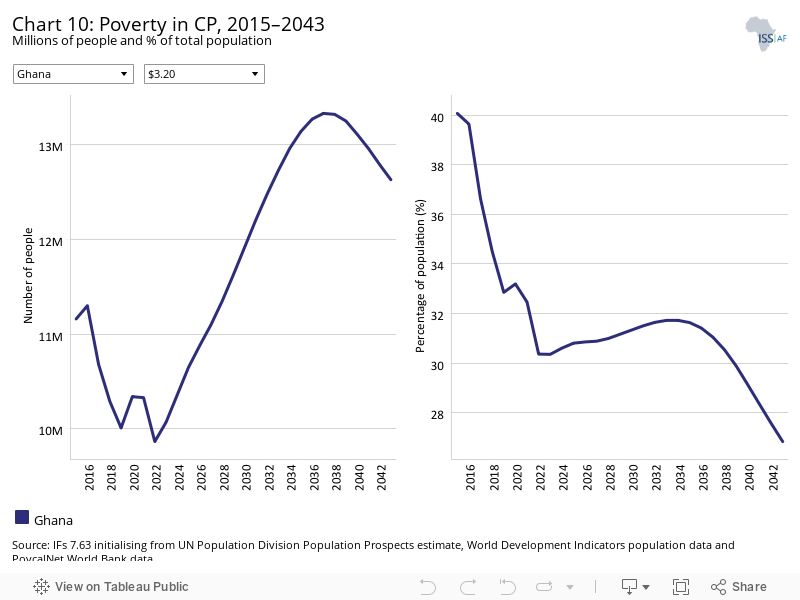
There are numerous methodologies and approaches to defining poverty. We measure income poverty and use GDP per capita as a proxy. In 2015, the World Bank adopted the measure of US$1.90 per person a day (in 2011 international prices), also used to measure progress towards the achievement of Sustainable Development Goal 1 of eradicating extreme poverty. To account for extreme poverty in richer countries occurring at slightly higher levels of income than in poor countries, the World Bank introduced three additional poverty lines in 2017:
- US$3.20 for lower middle-income countries
- US$5.50 for upper middle-income countries
- US$22.70 for high-income countries.
Charts 10 displays the number and the percentage of people living below the poverty line in the Current Path forecast. As a lower middle-income country, Ghana uses the US$3.20 per day benchmark. However, Ghana’s impressive growth rate over the last two decades has not translated into the expected reduction in poverty levels. High poverty levels can partly be attributed to the source of this growth. For instance, oil production, which appears to be driving this growth since 2011, employs an insignificant proportion of the population and only benefits a few. Also, inequality is growing such that poverty is prevalent among people who reside in rural areas and the northern part of the country. As of 2019, there were still over 10 million people (i.e. almost one-third of the population) who lived on less than US$3.20 dollars per day. This is expected to marginally decline to 9.9 million people (30.4%) in 2022 before continuing on an upward trend until 2037, where it will peak with 13.3 million people living on less than US$3.20 per day. By 2043, there will still be 12.6 million people (representing 26.8% of the population) who live on less than US$3.20 per day. This means that, although the proportion of the extremely poor population will reduce by 6.1 percentage points, the total number of poor people in the country will be 2.6 million people greater over the next 23 years (2020–2043).
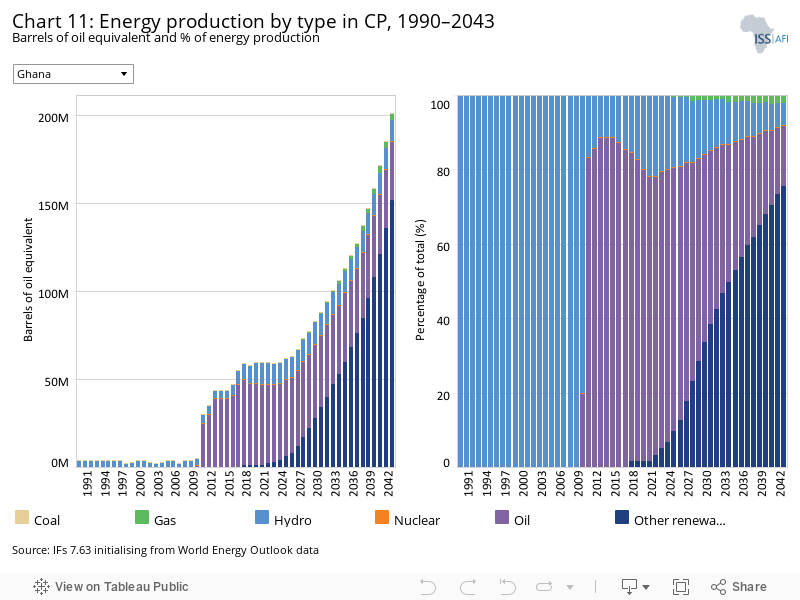
The IFs platform forecasts six types of energy, namely oil, gas, coal, hydro, nuclear and other renewables. To allow comparisons between different types of energy, the data is converted into billion barrels of oil equivalent. The energy contained in a barrel of oil is approximately 5.8 million British thermal units (MBTUs) or 1 700 kilowatt-hours (kWh) of energy.
Chart 11 represents energy production by type in barrels of oil equivalent (BBOE) and percentage of total in the Current Path forecast from 1990 to 2043. Between 1990 and 2009, hydro was the sole energy produced by the country. With Ghana discovering oil in commercial quantities and starting to commercialise production, oil became the second largest energy produced. By 2011, oil had become the dominant energy produced in the country, accounting for 80% of total energy produced in the country, which is equivalent to 0.05 BBOE. It is estimated that by 2043, oil contribution to total energy production will decline to 16.4% of the total energy production, equivalent to 0.03 BBOE. This reflects the depletion of oil deposits in the country over time and the global switch to renewable energy. Other renewable energies, such as solar and wind, are projected to be the dominant energy types produced in the country by 2043, with an estimated quantity of 0.15 BBOE, representing 75.5%.
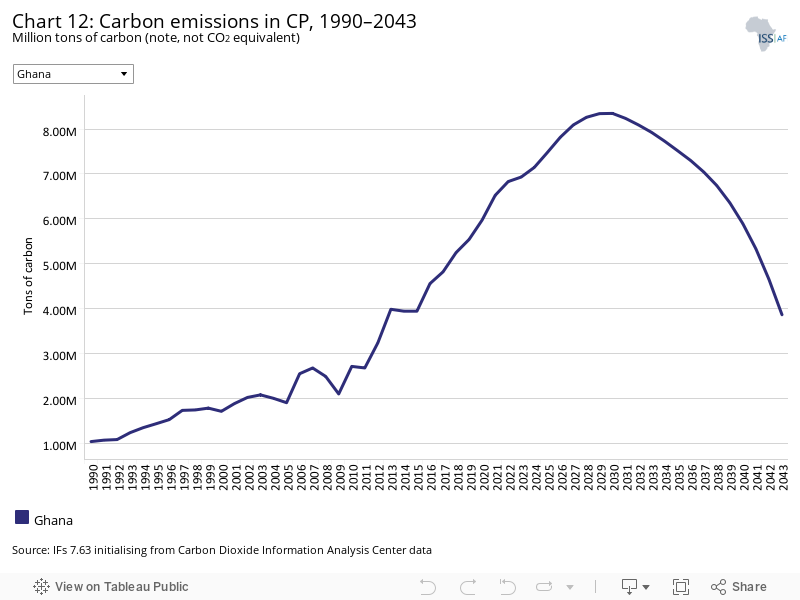
Carbon is released in many ways, but the three most important contributors to greenhouse gases are carbon dioxide (CO2), carbon monoxide (CO) and methane (CH4). Since each has a different molecular weight, IFs uses carbon. Many other sites and calculations use CO2 equivalent.
Chart 12 shows projections of tons of carbon emissions in the Current Path forecast. Ghana has significantly lower levels of carbon emissions compared to other lower middle-income African countries. This may be attributed to the low industrial activity, particularly manufacturing, in the country. However, carbon emissions have increased steadily from 1 million tons of carbon in 1990 to 6 million tons in 2019. The upward trend for carbon emission is forecast to continue until it plateaus at 8 million tons of carbon in 2030. After 2035, carbon emission will assume a downward trend, reducing to 4 million tons of carbon by 2043. The decrease in carbon emissions may partly be as a result of the switch to other renewable sources of energy that emit less carbon in the long-run. Growth in industry and agriculture will, however, impact upon carbon emissions.
Sectoral Scenarios for Ghana
Download to pdfThe Stability scenario represents reasonable but ambitious reductions in risk of regime instability and lower levels of internal conflict. Stability is generally a prerequisite for other aspects of development and this would encourage inflows of foreign direct investment (FDI), amongst others. Better governance through the accountability that follows substantive democracy is modelled separately.
The intervention is explained in here in the thematic part of the website.
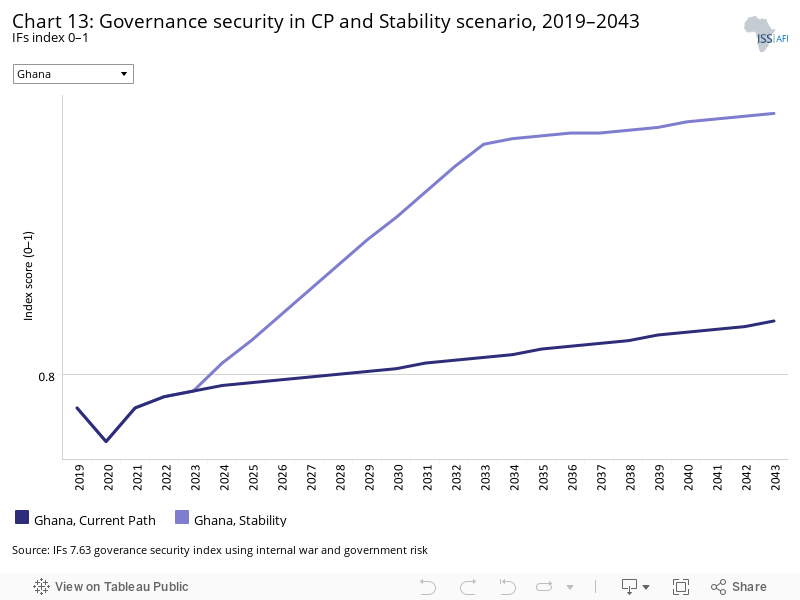
Chart 13 shows the governance security index for Ghana based on the Current Path forecast and the Stability scenario from 2019 to 2043. The scenario generally signifies increased political stability, reduced internal conflict, high FDI inflows, improved accountable governance and low levels of corruption in the country. Ghana’s score on the governance security index for 2019 was 0.79 which is above the average of 0.72 for lower middle-income countries in Africa; this suggests that Ghana has performed better compared to the average for lower middle-income countries in Africa. The country has enjoyed a degree of political stability since returning to multiparty democracy in 1992 and has conducted eight successive and relatively peaceful general elections that have included an alternation of power between the two main political parties in the country. Using the Stability scenario, Ghana’s score on the government security index is projected to rise further to 0.89 by 2043. This will be higher than the projected 0.82 under the Current Path and 0.76 average for lower-middle income African countries.
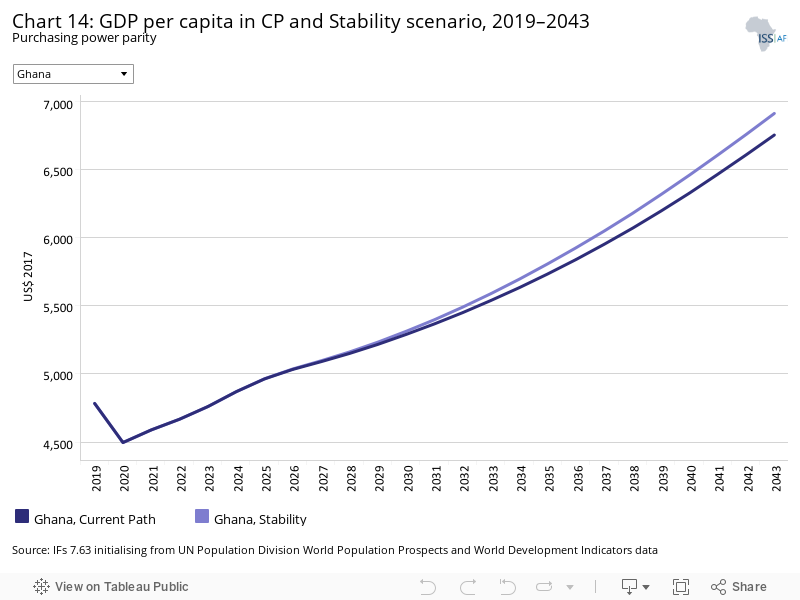
Chart 14 presents GDP per capita at purchasing power parity (PPP) in the Current Path forecast and based on the Stability scenario for Ghana. GDP per capita for Ghana in 2019 is US$4 784, which is US$2 205 less than the average for a lower middle-income country on the continent. In the Stability scenario, GDP per capita will increase to US$6 910 by 2043. This will be US$158 more than in the Current Path forecast and US$2 232 below the average for lower middle-income countries in Africa. Regime stability and a peaceful environment inspire investors’ confidence and attract FDI into the country. It is therefore not surprising that the Stability scenario leads to higher GDP per capita.
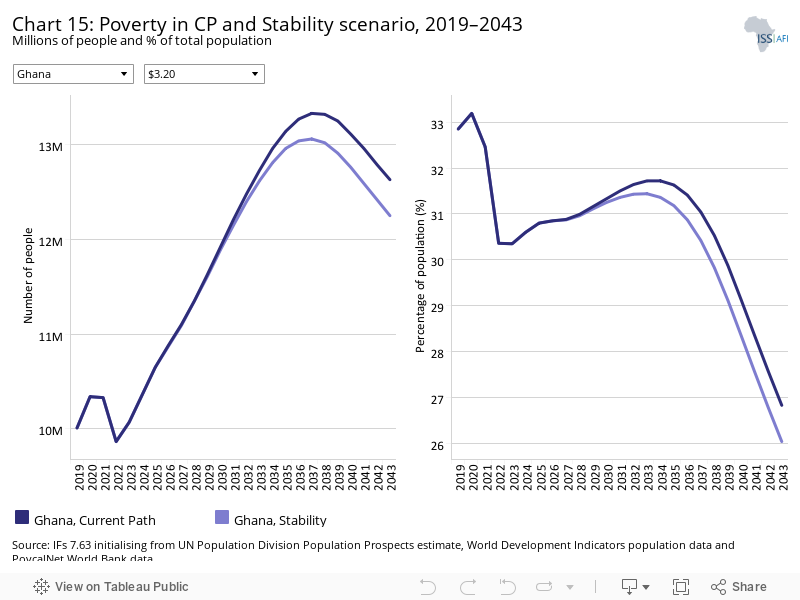
Chart 15 presents the number and portion of people living below the extreme poverty line. As Ghana is a lower middle-income country, it uses the global benchmark of US$3.20 per person per day. In 2019, the number of poor people living on less than US$3.20 was around 10 million, equivalent to 32.9% of the population. The Stability scenario will reduce the number of people living below the poverty line to 12.3 million people by 2043 instead of the 12.6 million (26.8%) in the Current Path forecast. This means that the materialisation of the Stability scenario could lead to 0.28 million fewer poor people than in the Current Path forecast by 2043. Also, the proportion of poor people in Ghana by 2043 will be 12.3 percentage points less than the average for lower middle-income countries in Africa.
This section presents the impact of a demographic scenario that aims to hasten and increase the demographic dividend where relevant through reasonable but ambitious reductions in the communicable-disease burden for children under five, the maternal mortality ratio and increased access to modern contraception.
The intervention is explained in here in the thematic part of the website.
Demographers typically differentiate between a first, second and even a third demographic dividend. We focus here on the first dividend, namely the contribution of the size and quality of the labour force to incomes. It refers to a window of opportunity that opens when the ratio of the working-age population (between 15 and 64 years of age) to dependents (children and the elderly) reaches 1.7.
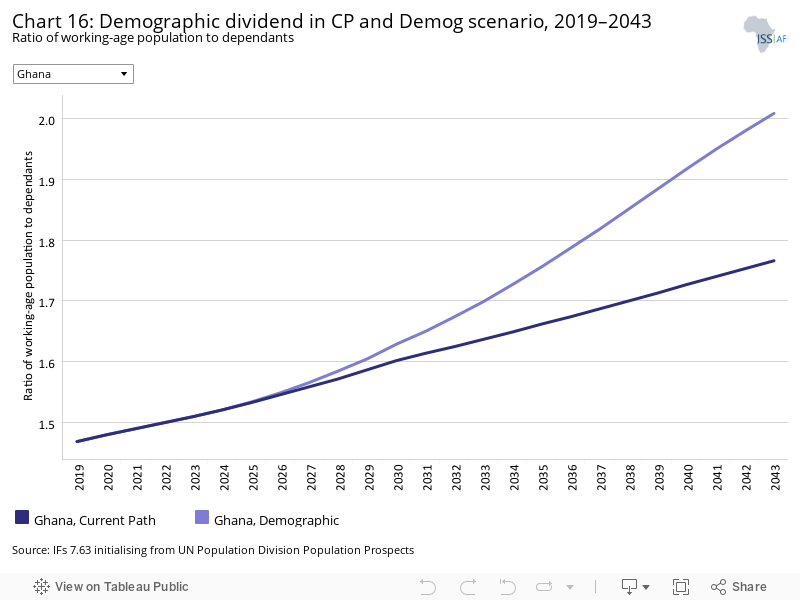
Chart 16 displays the demographic dividend based on the Current Path forecast and the Demographic scenario. The number of the working-age persons relative to the number of elderly people and children in 2019 is 1.47 greater than the average of 1.32 for lower middle-income countries in Africa. This means that, on average, there are about 1.5 people in the working-age group for each dependant in the country. Generally, the demographic dividend materialises when the country reaches a minimum of 1.7 working-age persons for each dependant. In the Demographic scenario, Ghana is expected to reach this minimum ratio by 2033; this is five years earlier than in the Current Path forecast. By 2043, Ghana’s demographic dividend score is projected to be 2.01 which is higher than the Current Path forecast of 1.77 and the average of 1.59 for lower middle-income countries in Africa.
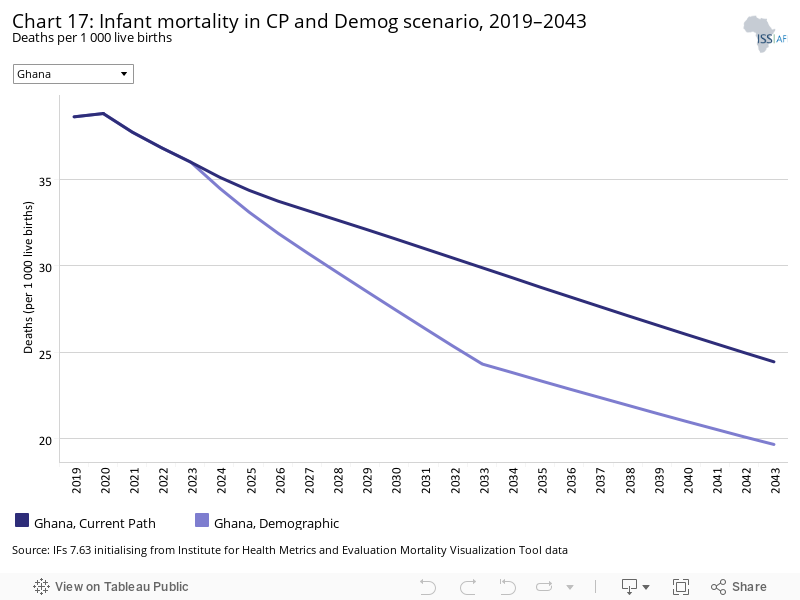
The infant mortality rate is the number of infant deaths per 1 000 live births and is an important marker of the overall quality of the health system in a country.
Chart 17 depicts infant mortality both in the Current Path forecast and in the Demographic scenario. The infant mortality rate in Ghana in 2019 was 38.6, meaning that for every 1 000 infants that were born, about 39 died. By 2043, the Demographic scenario will lead to a decline in infant mortality to 19.7 compared to 24.4 in the Current Path forecast.
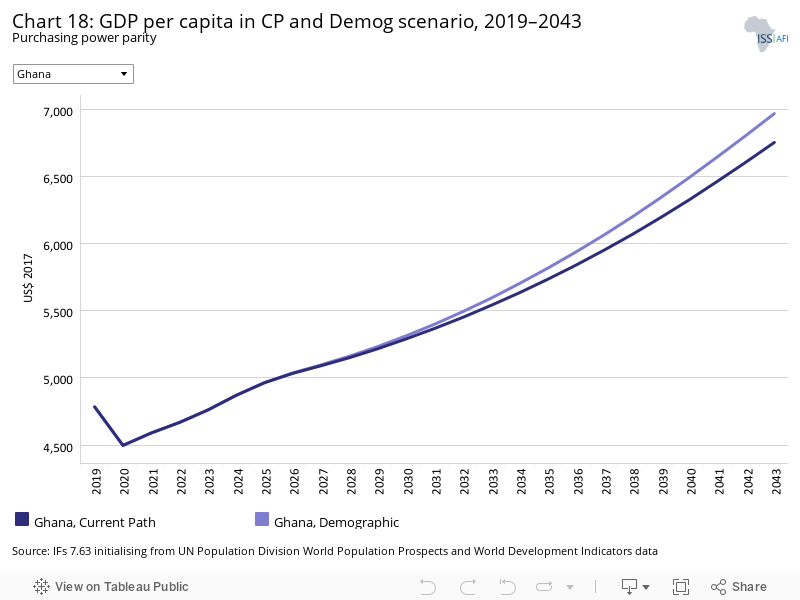
Chart 18 shows GDP per capita (PPP) both in the Current Path forecast and in the Demographic scenario. In 2019, GDP per capita for Ghana was US$4 784, which is US$2 205 less than the average of US$6 989 for lower middle-income African countries. By 2043, it is estimated that, based on the Demographic scenario, GDP per capita will increase to US$7 021, which is US$270 more than the projected US$6 751 in the Current Path forecast in the same year. However, this will still be significantly below the US$9 142 average for lower middle-income countries in Africa.
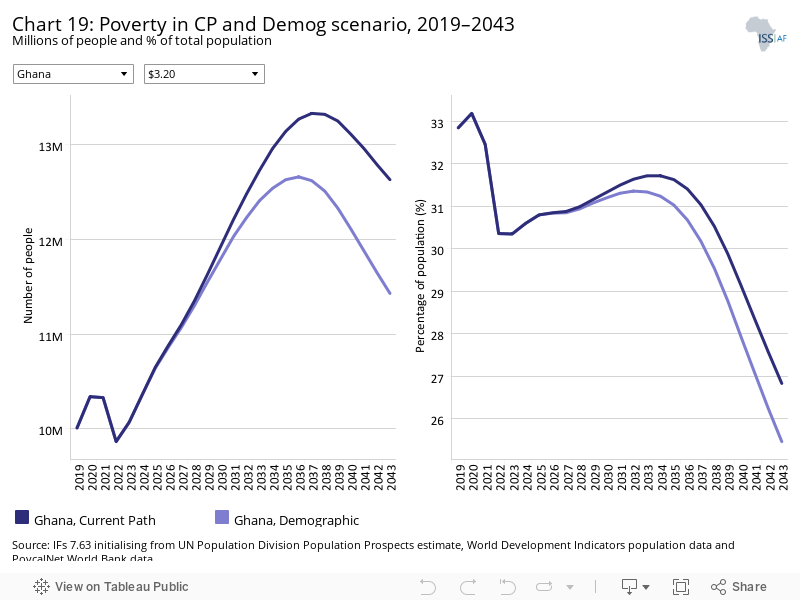
Chart 19 presents the number and portion of people living below the poverty line of US$3.20 both in the Current Path forecast and in the Demographic scenario. As noted earlier, the number of people in Ghana living below the poverty line of US$3.20 in 2019 was 10 million. Based on the Demographic scenario, this number will steadily rise to 12.7 million in 2036 after which it will begin to decline to 11.4 million by 2043. This will be 1.2 million fewer people than in the Current Path forecast, suggesting that if the country implements policies underpinning the Demographic scenario, such as reductions in mortality rates and the communicable-disease burden, it can lift 1.2 million more people above the poverty line. Similarly, the proportion of the poor population can be reduced by about 1.4 percentage points from the 26.8% in the Current Path to the 25.5% in the Demographic scenario by 2043. The proportion of poor people in Ghana by 2043 will be 12.9 percentage points lower than the average for lower middle-income countries in Africa.
This section presents reasonable but ambitious improvements in the Health/WaSH scenario, which include reductions in the mortality rate associated with both communicable diseases (e.g. AIDS, diarrhoea, malaria and respiratory infections) and non-communicable diseases (NCDs) (e.g. diabetes), as well as improvements in access to safe water and better sanitation. The acronym WaSH stands for water, sanitation and hygiene.
The intervention is explained here in the thematic part of the website.
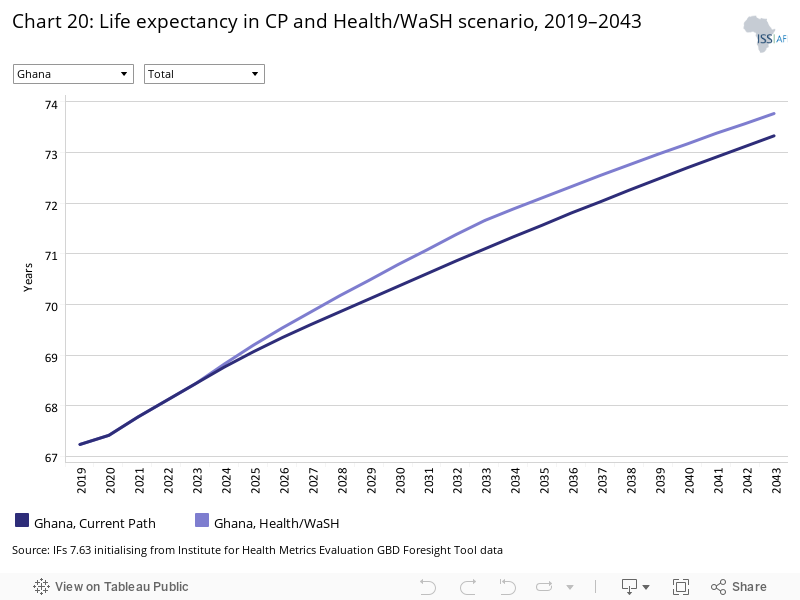
Chart 20 displays the trends in life expectancy by 2043 based on the Current Path forecast and in the Health/WaSH scenario. Increase in life expectancy can be sourced from a reduction in mortality that is caused by communicable and non-communicable diseases. It can also be achieved through improved sanitation and access to safe water. The life expectancy at birth for the average Ghanaian was 67.2 years in 2019, which is slightly below the average of 67.5 of lower middle-income countries in Africa. This relatively higher life expectancy in the country can be attributed to the greatly improved access to safe water (for over 90% of population) and the reduction in mortality from communicable diseases. However, poor sanitation and non-communicable diseases continue to be a problem. On average, females have a slightly higher life expectancy at birth at 68.8 years than males at 65.7. Based on the Health/WaSH scenario, life expectancy is estimated to increase to about 73.8 years by 2043, which is an increase of 6 months above the Current Path forecast of 73.3. However, Ghana will still be below the average of 73.3 for a lower middle-income country on the continent.
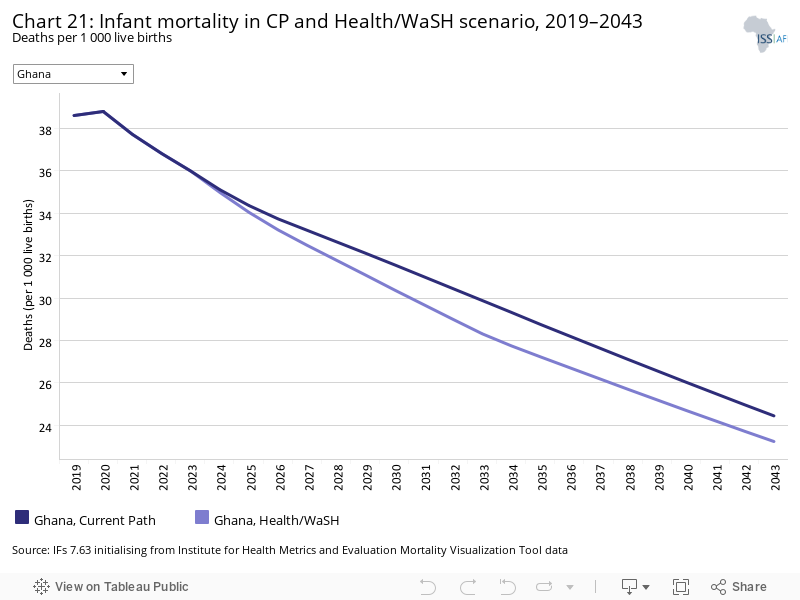
Chart 21 illustrates the decline in infant mortality according to the Current Path forecast and the Health/WaSH scenario from 2019 to 2043. The infant mortality rate per 1 000 live births in 2019 was 38.6 which is lower than the average of 46.4 for lower middle-income countries in Africa. In the Health/WaSH scenario, infant mortality per 1 000 live births in the country will be 23.2 by 2043, which is 1.2 deaths lower compared to the Current Path forecast in the same year.
The Agriculture scenario represents reasonable but ambitious increases in yields per hectare (reflecting better management and seed and fertilizer technology), increased land under irrigation and reduced loss and waste. Where appropriate, it includes an increase in calorie consumption, reflecting the prioritisation of food self-sufficiency above food exports as a desirable policy objective.
The intervention is explained in here in the thematic part of the website.
The data on yields per hectare (in metric tons) is for crops but does not distinguish between different categories of crops.
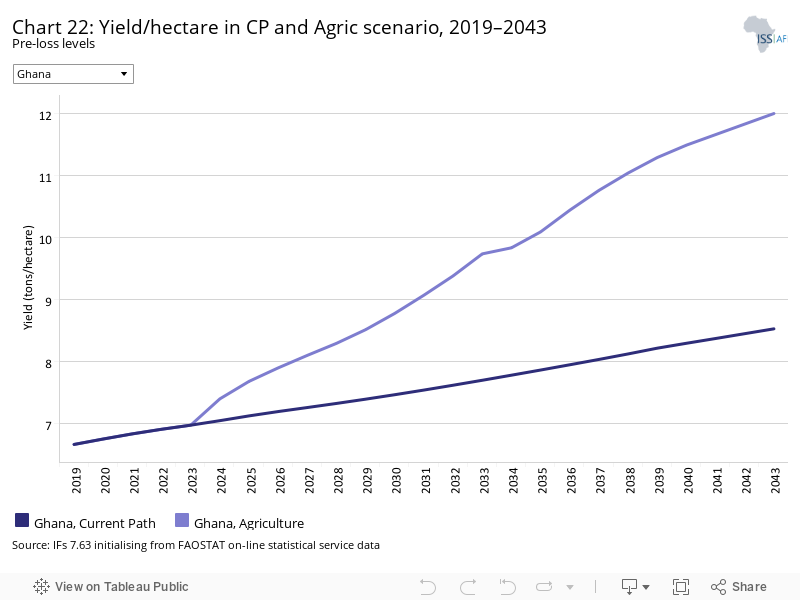
Chart 22 presents the yield per hectare for crops in the Current Path forecast and Agriculture scenario from 2019 to 2043. In 2019, the yield per hectare for crops was 6.7 metric tons per hectare, which is above the average for lower middle-income countries in Africa. This suggests that Ghana is performing relatively better than the average of its peers on the continent in terms of agricultural yield. Based on the Current Path forecast, this is projected to increase to 8.5 metric tons per hectare by 2043. In the Agriculture scenario, yield per hectare will be 12 metric tons. This means that if the country is able to adopt modern methods of farming, including the application of fertilizer and usage of improved seeds, there will be a resulting increase of an additional 3.5 metric tons per hectare compared to the Current Path forecast by 2043. Also, the projected increase in yield per hectare in the Agriculture scenario will be about 6 metric tons per hectare more than the average for lower-middle income countries in Africa.
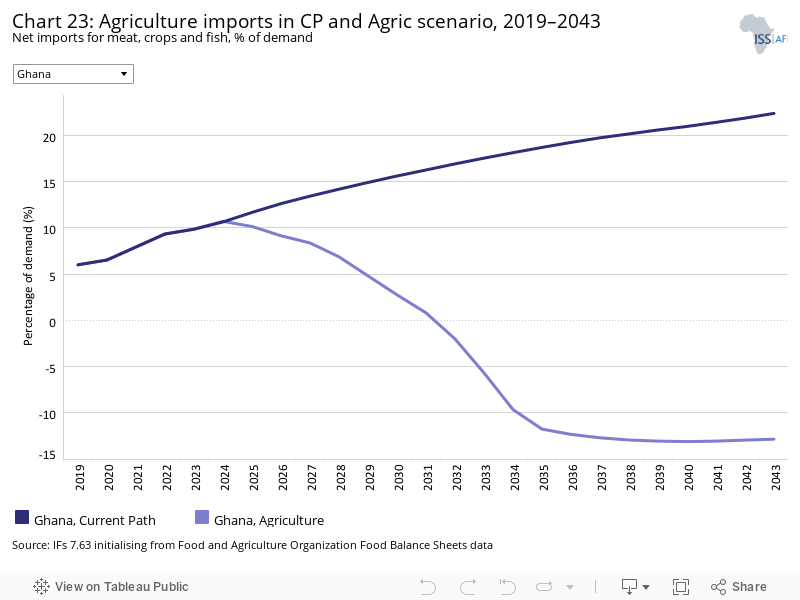
Chart 23 represents net agriculture imports as a percent of agriculture demand in the Current Path forecast and in the Agriculture scenario. In 2019, the net agricultural import was 6% of agricultural demand in the country, which is lower than the average of 13.3 for lower middle-income African countries. One of the structural problems facing the Ghanaian economy is the country’s continued reliance on importation, which is prevalent with agricultural products too. Despite the country’s gift of large cultivable agricultural land in addition to a youthful population, Ghana still imports basic food commodities like rice and sugar, among other foods. Some of the challenges that have impeded the growth of the sector include the complex land tenure system and the lack of access to credit, especially to peasant farmers. Irrigation for all-year agriculture and inadequate storage facilities are still challenges faced by most farmers. Consequently, the country has always had a net positive import dependence as a per cent of total demand. The Current Path forecast is that the proportion of import dependence as a fraction of total demand will grow to 22.7%, which will still be lower than the 83.8% average for lower middle-income countries. The situation is reversed in the Agriculture scenario such that by 2043, the country will be a net exporter of agricultural products with a balance of 12.6% of total agricultural demand. Therefore, if prudent agricultural policies that increase yield per hectare and reduce loss and waste are implemented, the country will be able to move from food import-dependent to a net exporter of agricultural products from 2032.
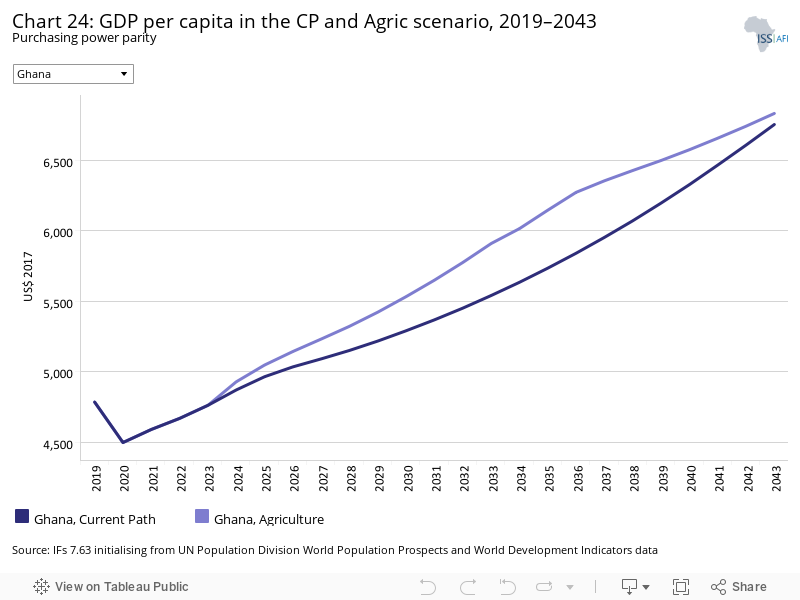
Chart 24 depicts GDP per capita (PPP) in the Current Path forecast and in the Agriculture scenario. The Agriculture scenario is expected to lead to an increase in GDP per capita over the years. By 2043, the Current Path forecast for GDP per capita will be US$6 751 while projections in the Agricultural scenario will be US$6 830. This means that the Agriculture scenario will lead to additional US$70 in GDP per capita. In the Agriculture scenario, Ghana’s GDP per capita will still remain below the average for lower middle-income countries in Africa.
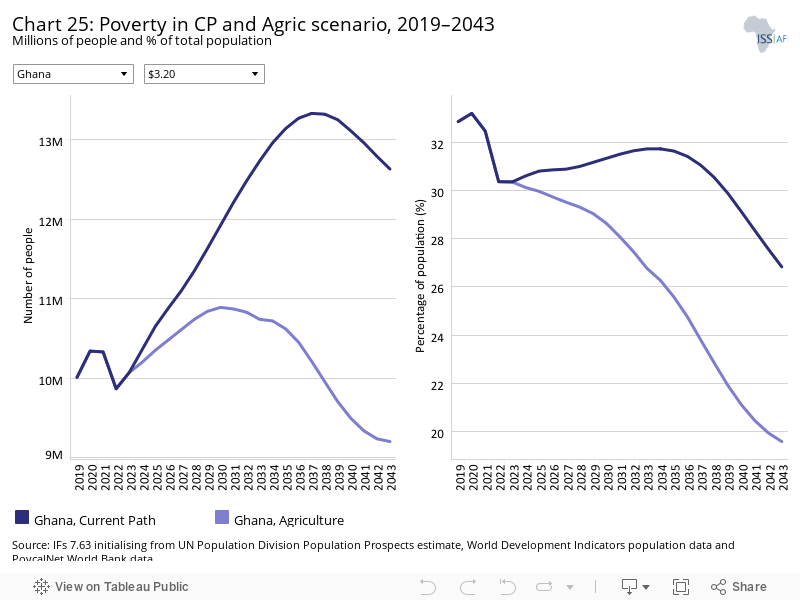
Chart 25 illustrates the number and portion of people below the poverty line of US$3.20 per person per day in the Current Path forecast and in the Agriculture scenario. Implementing good agricultural policies that will result in increased yield per hectare and reduction in waste appear to have a significant impact on poverty reduction in the country. Based on the Current Path forecast, 12.6 million people (representing 26.8% of the population) are projected to be extremely poor by 2043. However, if the country implements policies reflecting the Agriculture scenario, the number of people below the poverty line of US$3.20 per day will be reduced to 9.2 million, constituting 19.6% of the population. This means that 3.4 million additional Ghanaians can be lifted out of extreme poverty by primarily focusing on agricultural growth—this is not surprising since agriculture is the backbone of the Ghanaian economy and many livelihoods depend on this sector. This figure is also far lower than the average of 33.5% for lower middle-income African countries.
The Education scenario represents reasonable but ambitious improved intake, transition and graduation rates from primary to tertiary levels and better quality of education. It also models substantive progress towards gender parity at all levels, additional vocational training at secondary school level and increases in the share of science and engineering graduates.
The intervention is explained here in the thematic part of the website.
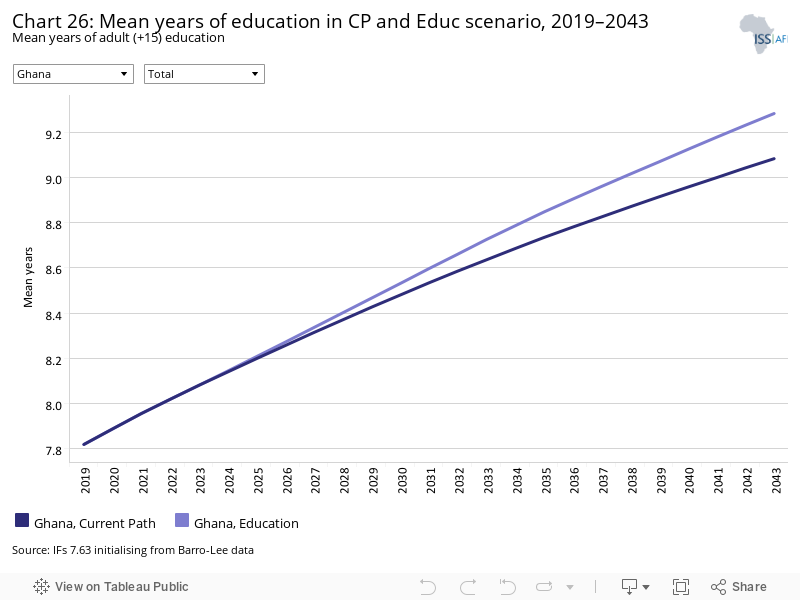
Chart 26 shows the mean years of education in the Current Path forecast and in the Education scenario. Over the years, Ghana's education system has been characterised by low funding reflected in inadequate educational infrastructure and learning materials especially at the basic level where the public schools constitute the majority. There are still communities with no access to modern educational facilities such as school buildings, classroom desks and chairs. In 2019, Ghana’s mean years of education was 7.8, which is above the average of 7.2 for lower middle-income countries on the continent. This may be partly due to the implementation of the free senior high school programme in 2017 by the incumbent government that led to a significant increase in secondary school enrolment. In terms of gender, the mean years of education for males is 8.5, which is 1.3 years more than females average of 7.2. This means that on average, men are more likely to attain higher education than women by 1.3 extra years. By 2043, in the Education scenario, it is expected that the mean years of education will rise to 9.3 years, which will be 0.2 more than in the Current Path estimates and 0.8 more than the average among lower middle-income countries in Africa. Also, based on the Education scenario, the gender gap regarding mean years of education will close by 0.5 years by 2043.
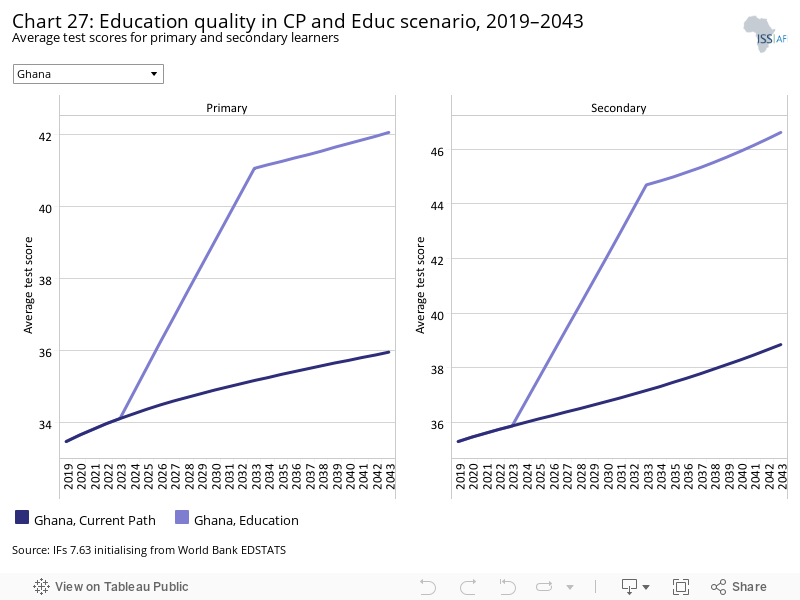
Chart 27 displays the average test scores for primary and secondary learners in the Current Path forecast and in the Education scenario. The average test score for primary learners in Ghana for 2019 was 33.5%, which is marginally lower than the 33.6% for the average lower middle-income country in Africa. The Education scenario will increase the average test scores for primary learners to 42.1%, compared to the Current Path forecast estimates of 36%. Also, the Education scenario for 2043 will result in 6.8 percentage points more than the continental average for lower middle-income countries.
In 2019, the average secondary learner test score for Ghana was 35.3% which was below the average for lower middle-income African countries. By 2043, the average test scores for secondary learners are projected to rise to 46.6%, which are above the Current Path estimates of 38.9% but below the continental average of 41.8% for lower middle-income countries.
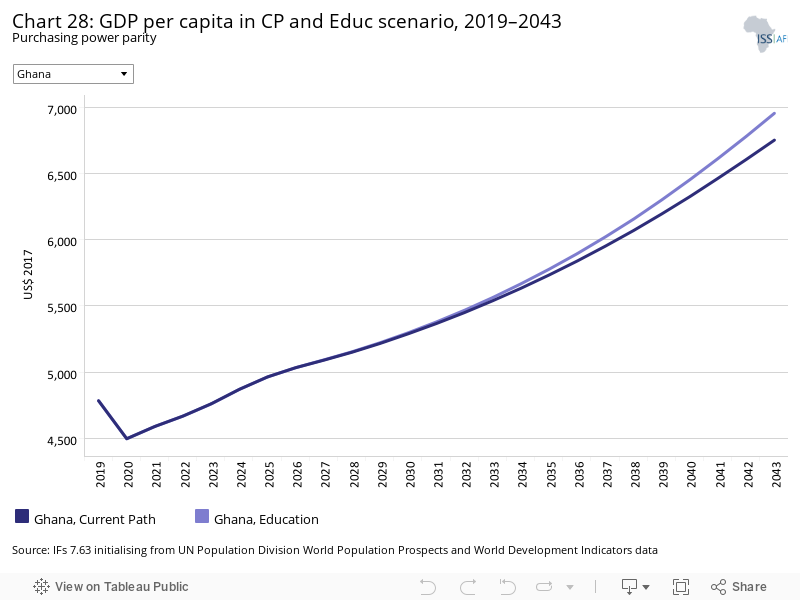
Chart 28 shows GDP per capita in the Current Path forecast and Education scenario from 2019 to 2043. By 2043, the increment in GDP per capita as a result of the Education scenario is estimated to be US$203 more than the projected US$6 751 in the Current Path forecast. This will also be US$2 188 less than the average of US$9 142 for lower middle-income countries in Africa suggesting that the contribution of education to GDP per capita in the long-run may be higher for an average lower middle-income country in Africa than Ghana. Given that Ghana has a relatively higher mean years of education compared to the average lower middle-income African country, it is possible that the relatively lower returns on education may be as a result of diminishing returns. In this case, as more and more of the population is educated, the per unit increase in GDP per capita as a result of education eventually declines.
Chart 29 represents the number and per cent of poor people living below the poverty line of US$3.20 a day. By 2043, in the Education scenario, it is projected that the number of poor people will be 12.04 million, representing 25.6% of the population. This means that the Education scenario will contribute to reducing the number of poor people by 590 000 by 2043 compared to the Current Path forecast. Although education is a powerful tool to reduce poverty, it takes time, often decades, to produce the expected results. The proportion of poor people projected in the Education scenario will be 12.7 percentage points lower than the average for lower middle-income African countries.
The Manufacturing/Transfers scenario represents reasonable but ambitious manufacturing growth through greater investment in the economy, investments in research and development, and promotion of the export of manufactured goods. It is accompanied by an increase in welfare transfers (social grants) to moderate the initial increases in inequality that are typically associated with a manufacturing transition. To this end, the scenario improves tax administration and increases government revenues.
The intervention is explained here in the thematic part of the website.
Chart 30 should be read with Chart 8 that presents a stacked area graph on the contribution to GDP and size, in billion US$, of the Current Path economy for each of the sectors.
Chart 30 illustrates the percentage points and absolute value of difference in contribution to GDP between the Current Path forecast and the Manufacturing/Transfers scenario. Based on the Manufacturing/Transfers scenario, the service sector will be the largest contributor to GDP with an absolute contribution of US$9.72 billion more by 2043, as compared to the Current Path forecast. However, the rate of contribution to GDP by the service sector will decline over time from 0.38 in 2033 to zero by 2043. The manufacturing sector, which is the second largest contributor, is also projected to contribute an additional US$5.61 billion to GDP, representing a 0.98 percentage-point difference to GDP based on the Manufacturing/Transfers scenario. The third contributor to GDP by 2043 will be the ICT sector with a projected value of US$1.42 billion emanating from the Manufacturing/Transfers scenario. Whereas the service sector becoming the leading contributor to GDP in the long-run is expected under an economic cycle, it is significant to Ghana’s industrial sector contribution to GDP and has been low over the years thereby denying the country the needed industrialisation and its associated jobs. Despite the industrial sector overtaking the agricultural sector in 2012 as the second largest contributor to GDP, the underperformance of the manufacturing sector reveals that growth in the industrial sector emanates from other sources, such as construction.
Chart 31 presents the absolute value of government welfare transfers to unskilled workers under both the Current Path forecast and the Manufacturing/Transfers scenario. Government welfare transfers to unskilled workers in 2019 were US$6.5 billion. This is projected to increase to US$19.4 billion by 2043, which is far more than the US$13 billion estimated for 2043 based on the Current Path forecast. This suggests that the Manufacturing/Transfers scenario can lead to an improvement in government welfare transfers by US$7.4 billion. A possible explanation for this finding may be that a boom in the manufacturing sector accompanied by the needed jobs and exports can significantly increase government revenue which will enable the government to also increase its welfare transfers to unskilled transfers.
Chart 32 displays GDP per capita (PPP) both in the Current Path forecast and in the Manufacturing/ Transfers scenario. By 2043, it is estimated that GDP per capita will rise to US$7 230, which is US$480 more than the projection based on the Current Path forecast. Ghana’s GDP per capita by 2043 in the Manufacturing/Transfers scenario will however still be below the continental average of US$9 142 for lower middle-income countries.
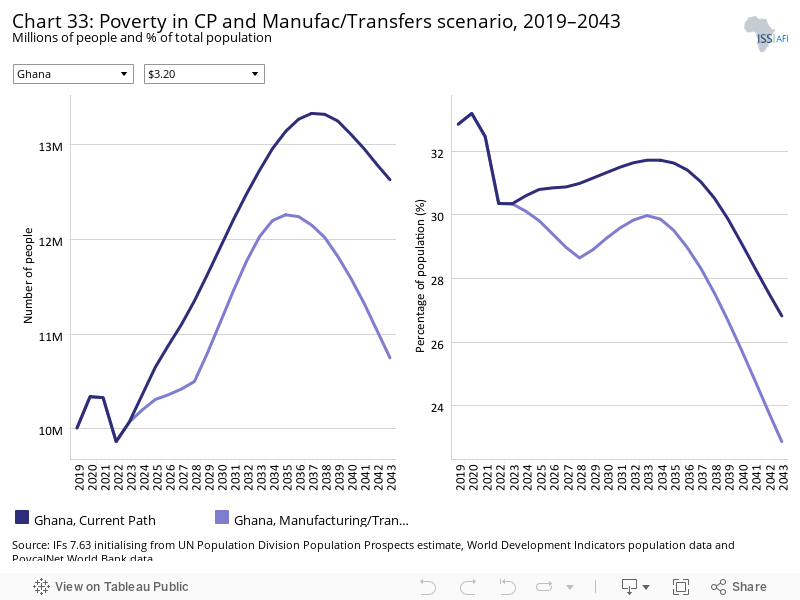
Chart 33 displays the number and portion of people living below the poverty line of US$3.20 per day both in the Current Path forecast and in the Manufacturing/Transfers scenario. By 2043, the estimated number of people who can be moved above the poverty line of US$3.20 as a result of the Manufacturing/Transfers scenario is 1.88 million, constituting about 4% of the population. This means that if the country embarks on policies such as investment in the economy, research and development as well as export promotion, the absolute number of poor people will likely be 1.88 million fewer than in the Current Path forecast by 2043. Furthermore, the proportion of poor people projected in the Manufacturing/Transfer scenario will be 15.4 percentage points lower than the average for lower middle-income African countries.
The Leapfrogging scenario represents reasonable but ambitious adoption of and investment in renewable energy technologies, resulting in better access to electricity in urban and rural areas. The scenario includes accelerated access to mobile and fixed broadband and the adoption of modern technology that improves government efficiency and allows for the more rapid formalisation of the informal sector.
The intervention is explained here in the thematic part of the website.
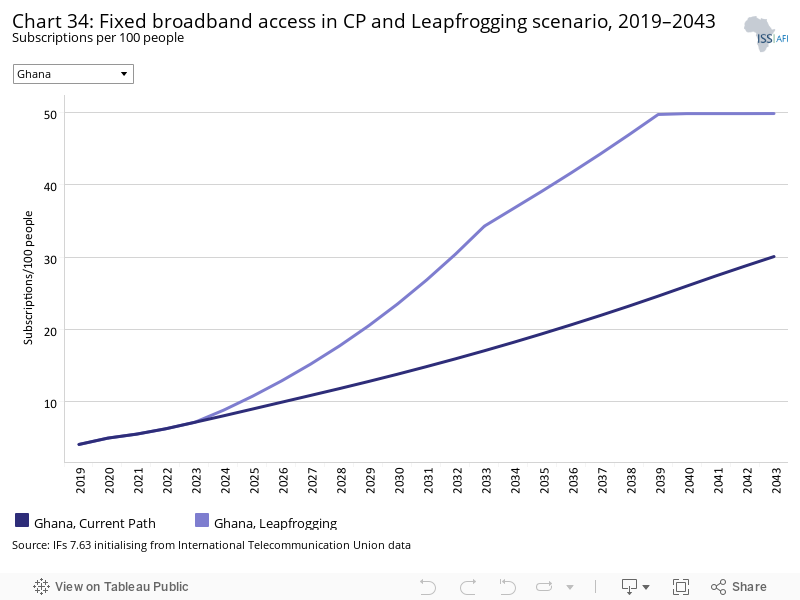
Fixed broadband includes cable modem Internet connections, DSL Internet connections of at least 256 KB/s, fibre and other fixed broadband technology connections (such as satellite broadband Internet, ethernet local area networks, fixed-wireless access, wireless local area networks, WiMAX, etc.).
Chart 34 displays fixed broadband subscriptions per 100 people in the Current Path forecast and in the Leapfrogging scenario. In 2019, the total number of fixed broadband subscriptions was 4 per 100 people, which was slightly above the average for lower middle-income countries in Africa. In the Current Path forecast, fixed broadband subscriptions are expected to rise to 30.1 per 100 people. The Leapfrogging scenario will lead to a greater increase in fixed broadband subscriptions compared to the Current Path forecast, with a difference of almost 20 subscriptions per 100 people by 2043. This means that the additional fixed broadband subscriptions as a result of the Leapfrogging scenario are 20 subscriptions per 100 people by 2043. The projected subscriptions in the Leapfrogging scenario will lead to additional 23.4 subscriptions per 100 people compared to the average of 26.5 for lower middle-income African countries.
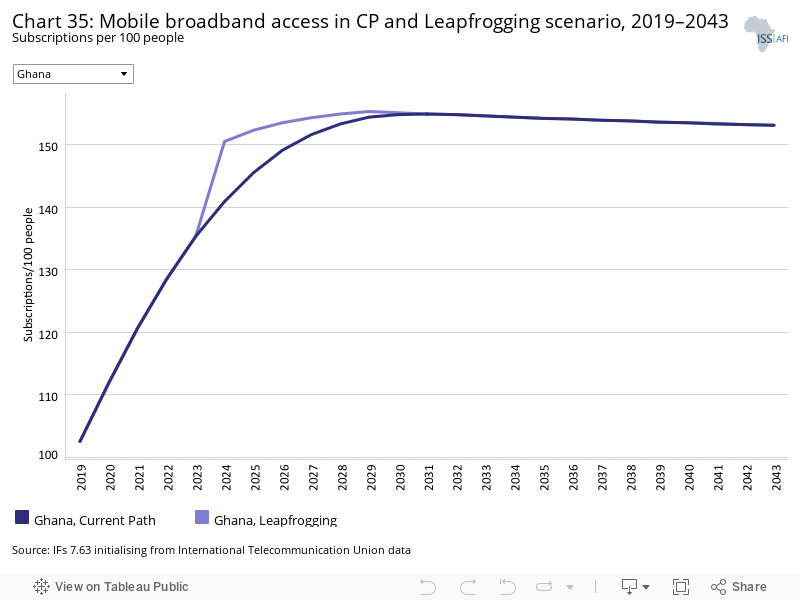
Mobile broadband refers to wireless Internet access delivered through cellular towers to computers and other digital devices.
Chart 35 illustrates mobile broadband subscriptions per 100 people based on the Current Path forecast and the Leapfrogging scenario. Ghana had a mobile broadband subscription of 102.5 per 100 people in 2019, which was more than twice the average for lower middle-income countries on the continent. Although the Leapfrogging scenario initially rises to 150.5 subscriptions per 100 people above the Current Path forecast of 140.9 subscription in 2024, in the long-run, the Leapfrogging scenario and the Current Path forecast converge. By 2043, both the Current Path forecast and the Leapfrogging scenario estimates will increase mobile subscriptions to 153.1 per 100 people, which is above the continental average of 147.6 for lower middle-income countries.
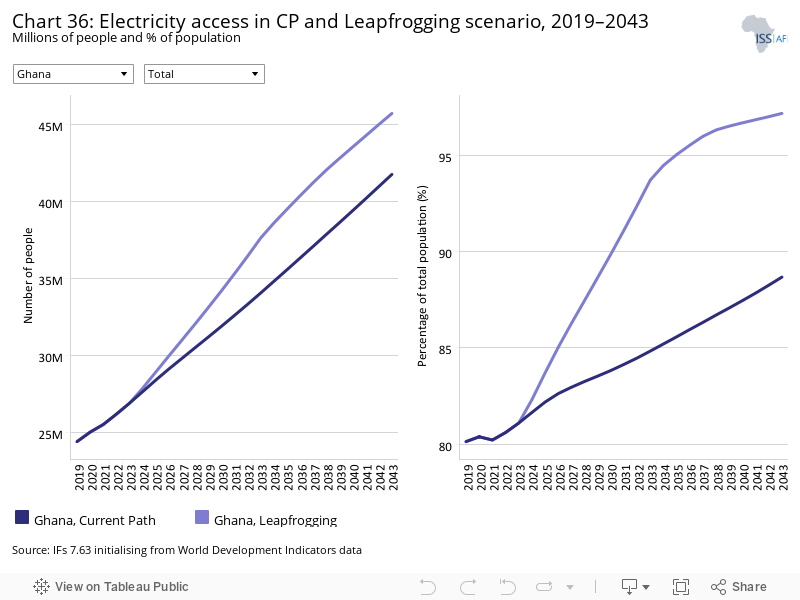
Chart 36 shows the number and proportion of people with access to electricity. The number of Ghanaians who had access to electricity in 2019 was 24.4 million people, representing 80.1% of the total population. In terms of urban-rural distribution, about 90% of people in urban centres had access to electricity, compared to 67.8% of those in the rural areas. Based on the Leapfrogging scenario, it is projected that by 2043, 97.2% of Ghanaians (constituting 45.7 million people) will have access to electricity. This is higher than the 88.7% of people, reflecting 41.7 million, projected in the Current Path forecast, signifying that the Leapfrogging scenario can increase access to electricity to an additional 4 million Ghanaians. Also, Ghana’s 97.2% access to electricity will be higher than the average for lower middle-income countries on the continent, which is estimated to be 90.2%. Interestingly, by 2043, 98.5% of rural dwellers will have access to electricity as compared to 96.6% of urban dwellers.
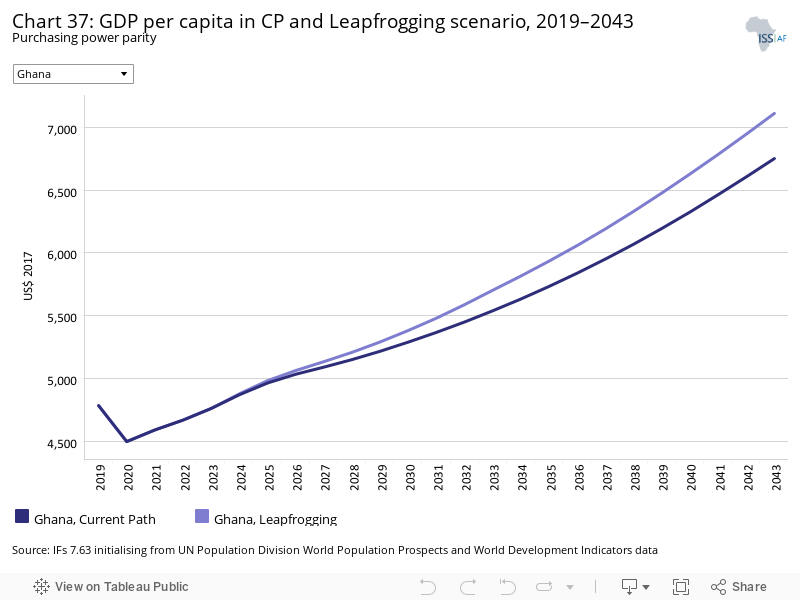
Chart 37 illustrates GDP per capita (PPP) in the Current Path forecast and in the Leapfrogging scenario. Ghana’s GDP per capita is projected to increase from US$4 784 in 2019 to US$7 111 by 2043, based on the Leapfrogging scenario. This represents an increase of US$360 as compared to the Current Path forecast. However, it falls below the average of US$9 142 for lower middle-income countries in Africa.
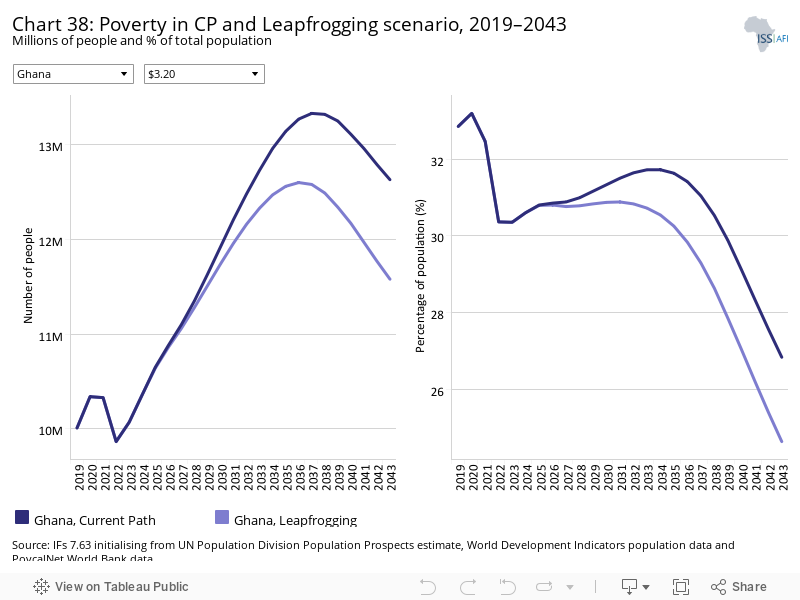
Chart 38 depicts the number and proportion of people living below the poverty line of US$3.20 per day in the Current Path forecast and in the Leapfrogging scenario. Based on the Leapfrogging scenario, the number of poor people by 2043 is projected to be 11.58 million, representing 24.6% of the population. This projection is lower than the 12.63 million estimated in the Current Path forecast in the same year, which suggests that the number of poor people in the Leapfrogging scenario is 1.05 million fewer than in the Current Path forecast by 2043. The proportion of poor people projected in the Leapfrogging scenario will be 13.7 percentage points lower than the average for lower middle-income African countries.
The Free Trade scenario represents the impact of the full implementation of the African Continental Free Trade Area (AfCFTA) by 2034 through increases in exports, improved productivity and increased trade and economic freedom.
The intervention is explained in here in the thematic part of the website.
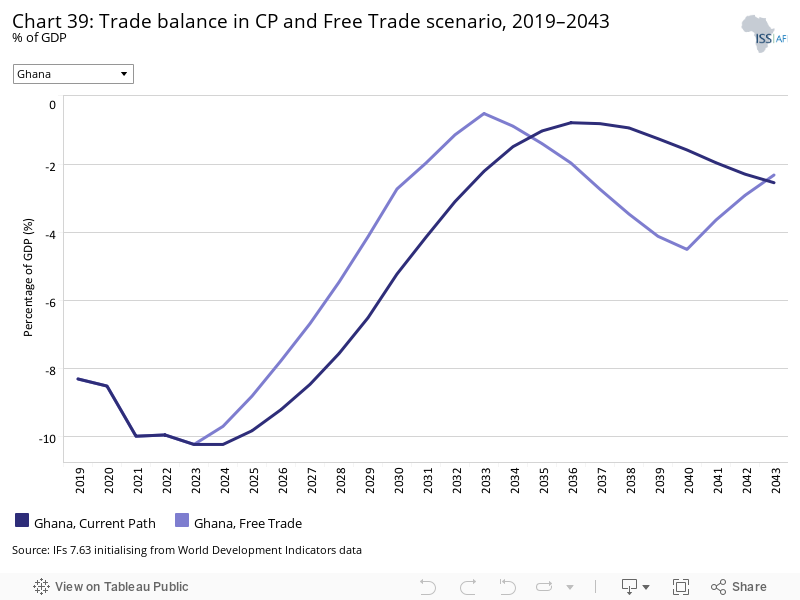
Chart 39 shows the trade balance as a per cent of GDP both in the Current Path forecast and in the Free Trade scenario. In 2019, Ghana’s trade balance as a per cent of GDP was a deficit of 8.3%, which was higher than the average of 6.6% for lower middle-income African countries. This deficit can be explained by the country's inability to add value to its main exports such as cocoa, gold, timber and oil and the over-reliance on imported finished products for domestic consumption. From 2023, Ghana will begin to see an improvement in its trade balance both in the Current Path forecast and in the Free Trade scenario, although the improvement is much quicker in the latter. This upward trend will continue until it reaches a peak of a deficit of 0.52% of GDP in 2033 in the Free Trade scenario, suggesting that if the country takes full advantage of the African Continental Free Trade Area (AfCTA), it can significantly improve its trade balance. However, these gains will begin to decline, so that by 2043, the projected trade deficit will be 2.32% in the Free Trade scenario and 2.6% in the Current Path forecast. The full implementation of the AfCTA can also cause Ghana’s exports to decline in the long-run due to increased competition from neighbouring countries, particularly since most African countries produce similar commodities. This will be below the average for lower middle-income African countries.
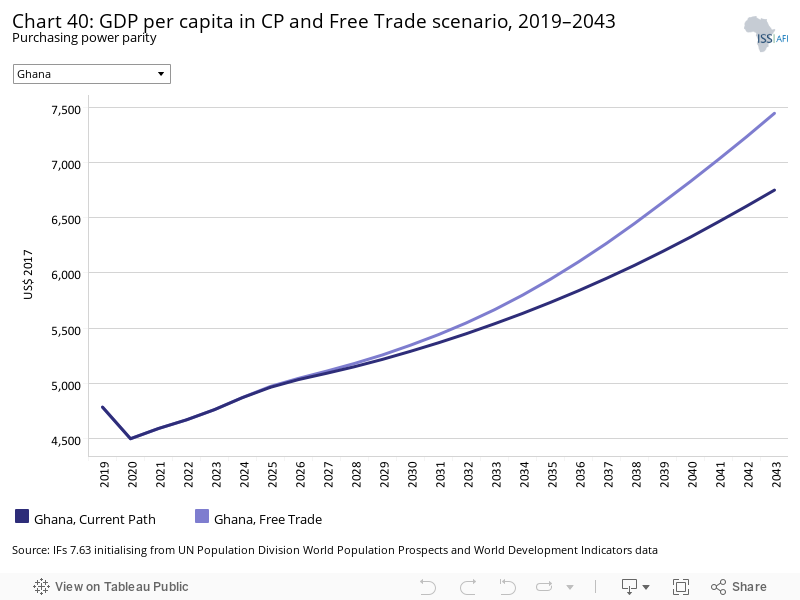
Chart 40 presents GDP per capita in the Current Path forecast and in the Free Trade scenario from 2019 to 2043. GDP per capita for Ghana is estimated to increase to US$7 448 by 2043 in the Free Trade scenario, which is US$697 more than the projections in the Current Path forecast by 2043. This means that if Ghana takes advantage of the AfCTA to increase trade and productivity, it can achieve an extra US$697 increment in GDP per capita by 2043. Nonetheless, the average GDP per capita of US$9 142 for lower middle-income African countries is US$1 694 higher than the projected value for Ghana in the Free Trade scenario.
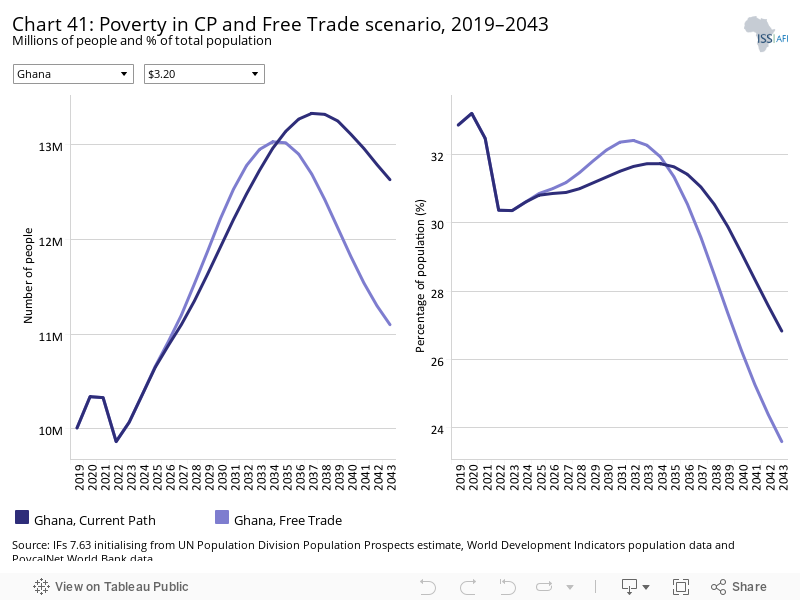
Chart 41 illustrates the number and per cent of poor people in the Current Path forecast and in the Free Trade scenario. In the long run, the Free Trade scenario will lead to a greater reduction in the number of poor people as compared to the Current Path forecast. By 2043, the number of people living below the poverty line of US$3.20 per day will be 11.1 million people, representing 23.6% of the population. This is 3.2 percentage points less than the Current Path forecast, meaning that the Free Trade scenario has 1.53 million fewer poor people than in the Current Path forecast by 2043. The proportion of poor people projected in the Free Trade scenario will be 14.7 percentage points lower than the average for lower middle-income African countries.
The Financial Flows scenario represents a reasonable but ambitious increase in worker remittances and aid flows to poor countries, and an increase in the stock of foreign direct investment (FDI) and additional portfolio investment inflows to middle-income countries. We also reduced outward financial flows to emulate a reduction in illicit financial outflows.
The intervention is explained in here in the thematic part of the website.
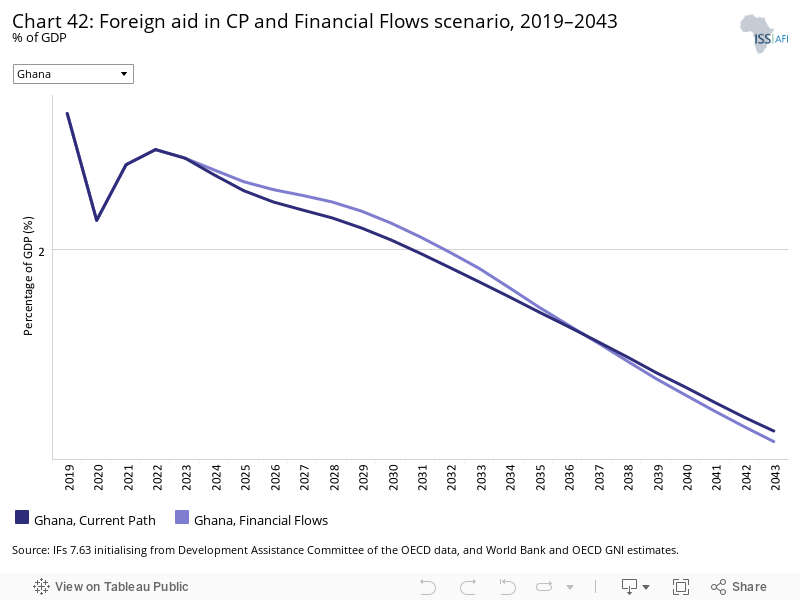
Chart 42 depicts the trends in foreign aid as a percentage of GDP in the Current Path forecast and in the Financial Flows scenario. Generally, the total foreign aid received by Ghana has been quite low since the country attained a lower middle-income status. Subsequently, the main sources of external financing have been through either bilateral and multilateral loans, debt financing and FDI. The total foreign aid received by Ghana in 2019 was 2.6% of GDP, which was above the average of 1.67% for lower middle-income countries on the continent. Foreign aid to Ghana is expected to decline further such that by 2043 the total foreign aid received by the country is projected to be 1.15% in the Financial Flows scenario and 1.19% of GDP in the Current Path forecast. This suggests that in the Financial Flow scenario, foreign aid as a percentage of GDP is lower than in the Current Path forecast but higher than the average of 0.54 for lower middle-income countries in Africa. The decline in foreign aid is expected given the implementation of the Ghana Beyond Aid agenda by the incumbent government.
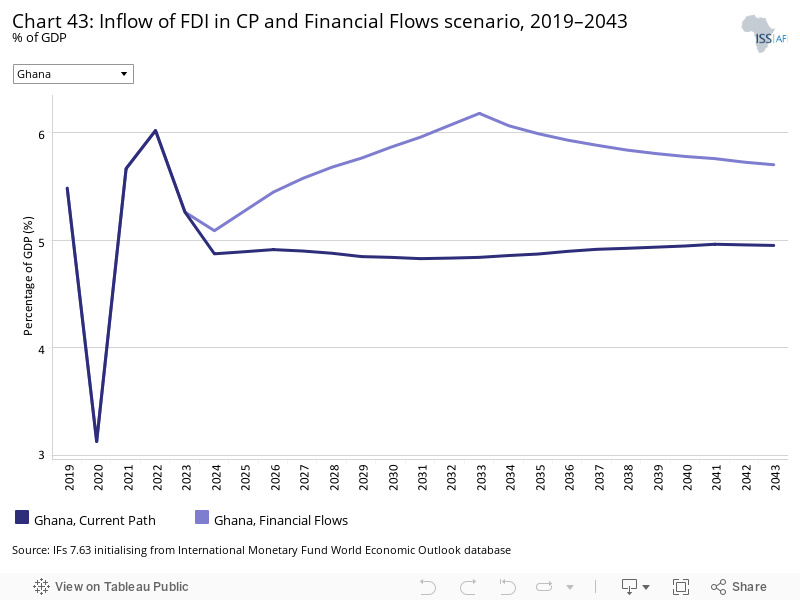
Chart 43 shows FDI as a percentage of GDP in the Current Path forecast and in the Financial Flows scenario. Ghana’s total FDI in 2019 amounted to 5.5% of GDP, which is significantly higher than the average of 2.6% for lower middle-income African countries. Political stability and a peaceful environment under the Fourth Republic make it an attractive destination for long-term foreign investment; therefore, it is not surprising that Ghana attracts more FDI than its peers on the continent. The leading recipients of FDI projects in Ghana are the manufacturing, service and mining sectors. By 2043, it is projected that the total FDI to the country will be about 5% of GDP in the Current Path forecast. The Financial Flows scenario will lead to a higher increase in FDI, projected to be around 5.7% of GDP, which is also above the average of 4.0 for lower middle-income countries on the continent.
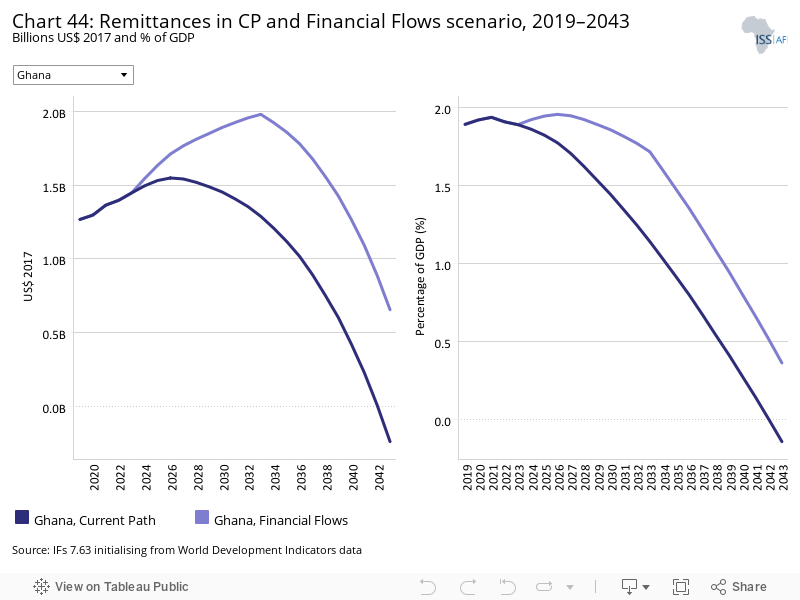
Chart 44 represents the absolute value of remittances and remittances as a proportion of GDP both in the Current Path forecast and in the Financial Flows scenario. In 2019, the total value of remittances that Ghana received amounted to US$1.27 billion, which constituted about 1.9% of GDP. This is below the average of 2.6% of GDP for lower middle-income African countries. In the short-term, in the Financial Flows scenario, remittances will begin to rise until they reach a peak in 2033 of US$1.98 billion, reflecting 1.72% of GDP. However, it assumes a downward trend afterwards, such that by 2043 the total value of remittances will be US$0.66 billion, constituting 0.37% of GDP. Remittances will decline quicker in the Current Path forecast so that by 2043 the total value of remittances in the country will be about US$0.24 billion, representing 0.14% of GDP, which is still below the forecast average of 2.03 for lower middle-income countries in Africa.
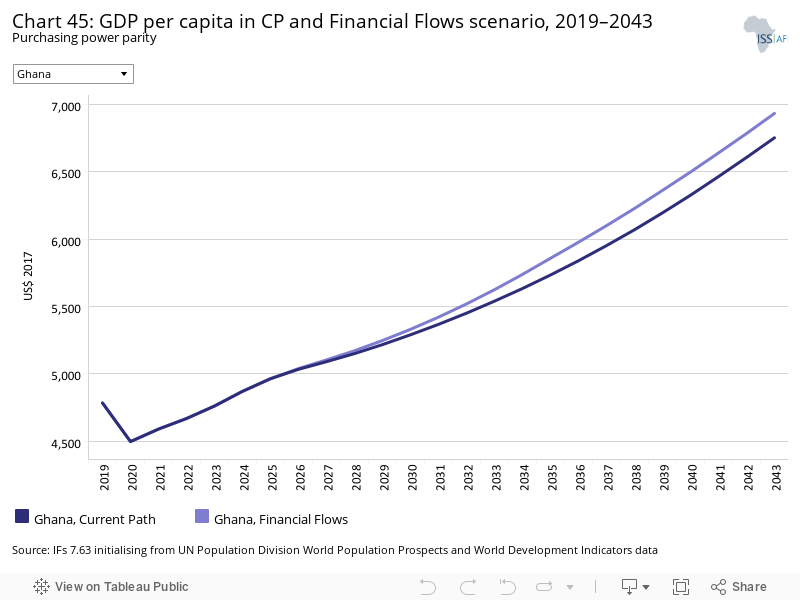
Chart 45 illustrates GDP per capita in the Current Path forecast and in the Financial Flows scenario. Ghana’s GDP per capita is estimated to increase to US$6 932 by 2043 in the Financial Flows scenario. This represents an increase of US$181 compared to the Current Path projection in the same year. The US$6 932 estimate is also far below the average for lower middle-income countries in Africa, which is projected to be US$9 142 in the Financial Flows scenario.
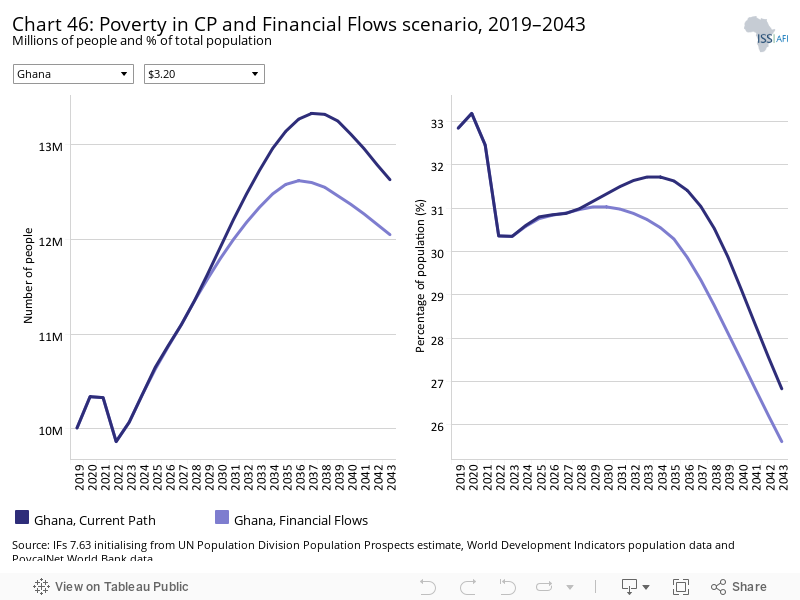
Chart 46 depicts the number and per cent of poor people respectively who are living below the poverty line of US$3.20 per day in the Current Path forecast and in the Financial Flows scenario. Based on the Financial Flows scenario, the total number of people projected to live below the poverty line of US$3.20 will decline to 12.05 million by 2043, representing 25.6% of the total population— lower than the average of 38.3% for lower middle-income African countries. This estimate constitutes a reduction of 0.58 million people compared to the Current Path forecast in the same year.
The Infrastructure scenario represents a reasonable but ambitious increase in infrastructure spending across Africa, focusing on basic infrastructure (roads, water, sanitation, electricity access and ICT) in low-income countries and increasing emphasis on advanced infrastructure (such as ports, airports, railway and electricity generation) in higher-income countries.
Note that health and sanitation infrastructure is included as part of the Health/WaSH scenario and that ICT infrastructure and more rapid uptake of renewables are part of the Leapfrogging scenario. The interventions there push directly on outcomes, whereas those modelled in this scenario increase infrastructure spending, indirectly boosting other forms of infrastructure, including that supporting health, sanitation and ICT.
The intervention is explained in here in the thematic part of the website.
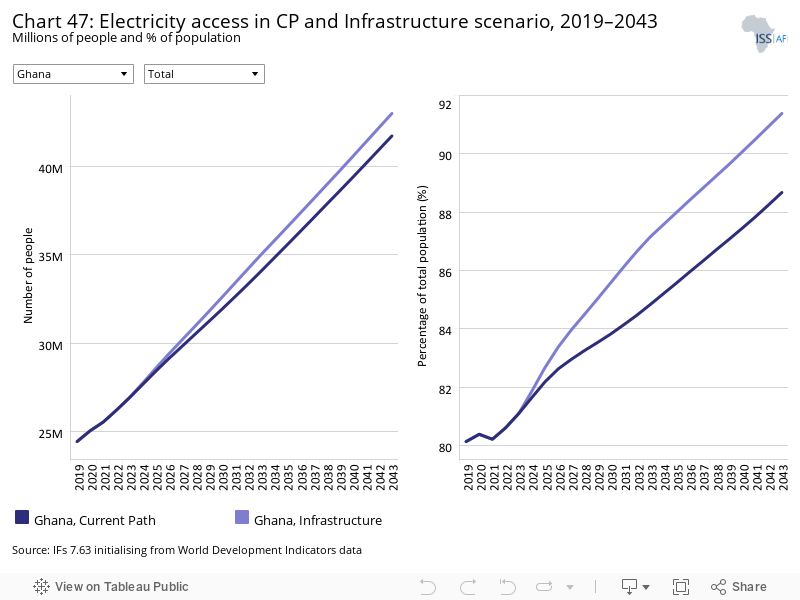
Chart 47 shows the number and proportion of people with access to electricity in the Current Path forecast and in the Infrastructure scenario. The total number of people with access to electricity in Ghana is 24.42 million, representing 80.1% of the population. This is expected to increase to 43.02 million (constituting 91% of the population) by 2043 in the Infrastructure scenario. This increment exceeds the projected value of 41.74 million reflecting 88.7% of the population in the Current Path forecast. In terms of rural-urban dichotomy, the total number of people in urban centres who are estimated to have access to electricity by 2043 will be 30.12 million, which constitutes an overwhelming 94.9% of the urban population. However, only 84.2% of rural dwellers will have access to electricity by 2043, indicating a disparity in access to electricity between urban and rural dwellers in the Infrastructure scenario.
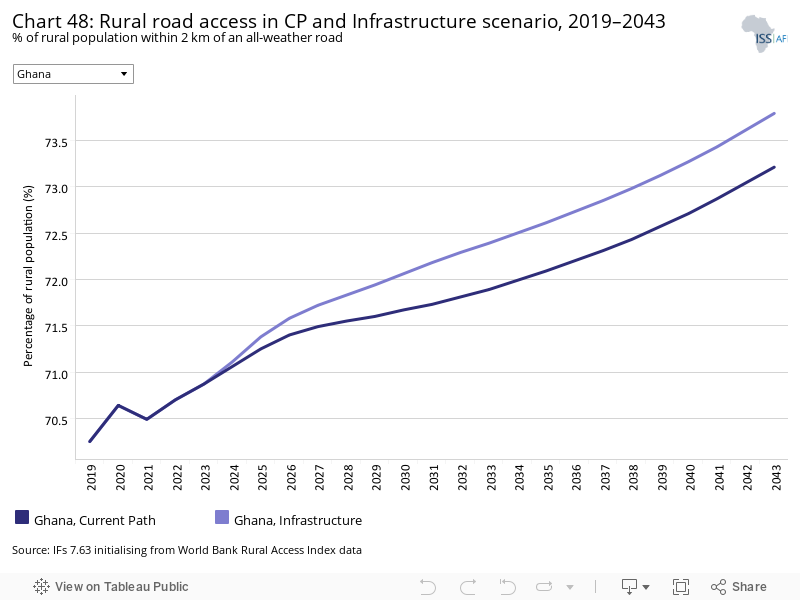
Indicator 9.1.1. in the Sustainable Development Goals refers to the proportion of the rural population who live within 2 km of an all-season road and is captured in the Rural Access Index.
Chart 48 represents the percent of rural population within 2 km of all-weather roads in the Current Path forecast and in the Infrastructure scenario. Accessibility to rural areas is important in spurring the socio-economic development of a country and improving the living standards of rural dwellers. It enables rural dwellers to enjoy amenities from nearby urban areas while allowing urban centres to benefit more easily from the agricultural products supplied by rural areas. In 2019, 70% of all rural dwellers resided within 2 km from all-weather roads; this was higher than the average of 61.4% for lower middle-income countries in Africa. In the Infrastructure scenario, this is expected to rise to 73.8% by 2043, which will be higher than the 73.2% projected in the Current Path forecast and the continental average for lower middle-income countries of 67.8%.
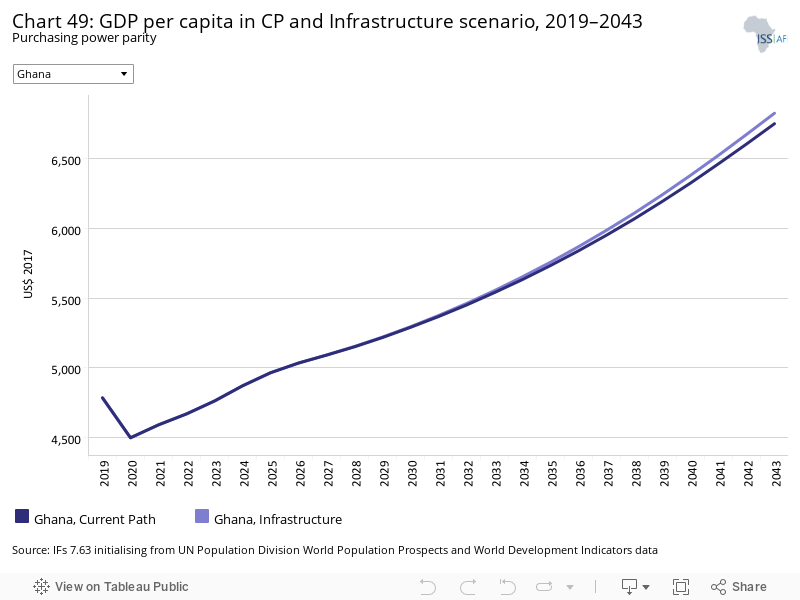
Chart 49 illustrates GDP per capita in the Current Path forecast and in the Infrastructure scenario. Ghana’s GDP per capita is estimated to rise to US$6 827 by 2043 in the Infrastructure scenario. This is US$76 more than the estimated US$6 751 in the Current Path forecast in the same year but below the average of US$9 142 for lower middle-income countries in Africa.
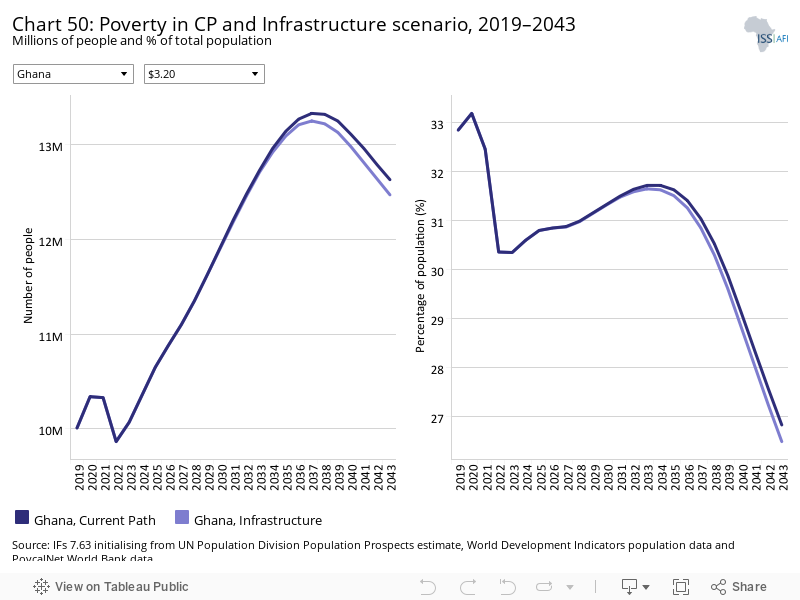
Chart 50 shows the number and per cent of poor people living below the poverty line of US$3.20 per day in the Current Path forecast and in the Infrastructure scenario. By 2043, the proportion of the poor population is expected to decline from 32.9% in 2019 to 26.5% by 2043 in the Infrastructure scenario. This corresponds to 12.47 million poor people by 2043 who will live below the poverty line. Comparing this with the projections in the Current Path forecast suggests that there will be 0.16 million fewer poor people than in the Current Path forecast in the same year and 11.8 percentage points lower than the average for lower middle-income African countries.
The Governance scenario represents a reasonable but ambitious improvement in accountability and reduces corruption, and hence improves the quality of service delivery by government.
The intervention is explained in here in the thematic part of the website.
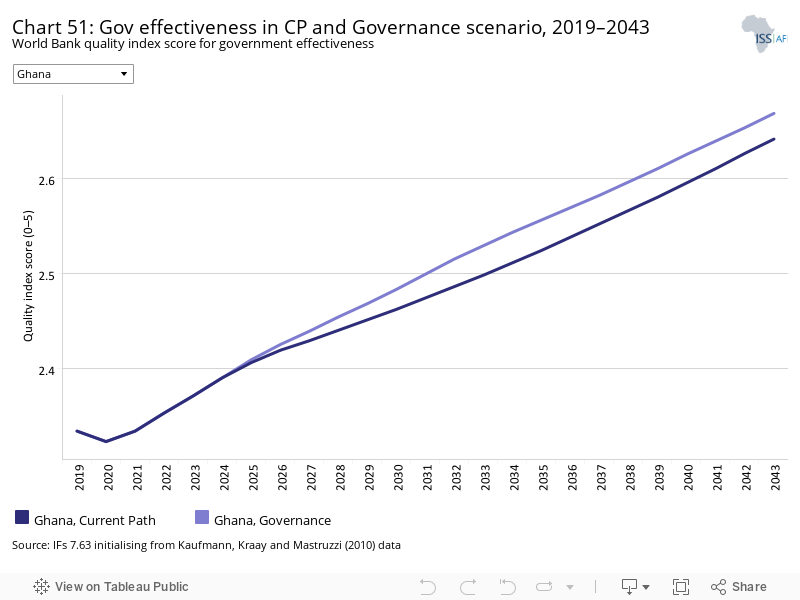
As defined by the World Bank, government effectiveness ‘captures perceptions of the quality of public services, the quality of the civil service and the degree of its independence from political pressures, the quality of policy formulation and implementation, and the credibility of the government’s commitment to such policies’.
Chart 51 depicts the World Bank government effectiveness quality score in the Current Path forecast and in the Governance scenario. In 2019, Ghana’s score for government effectiveness was 2.33, which was above the average of 1.89 for lower middle-income countries in Africa. Despite the peace and stability that Ghana has enjoyed under the Fourth Republic, the quality of governance in the country has not been the best. The civil and public services are still under executive control with frequent political interference. Public service delivery is poor and public sector corruption remains high. In both the Current Path forecast and the Governance scenario, government effectiveness is estimated to increase over the period so that by 2043, the latter is 0.03 higher than the former. The projected score for Ghana will be 0.35 more compared to the average of lower middle-income countries in Africa. This suggests that notwithstanding the shortcomings, Ghana is relatively better in terms of governance on the continent and ranked as the fifth best democracy in Africa.
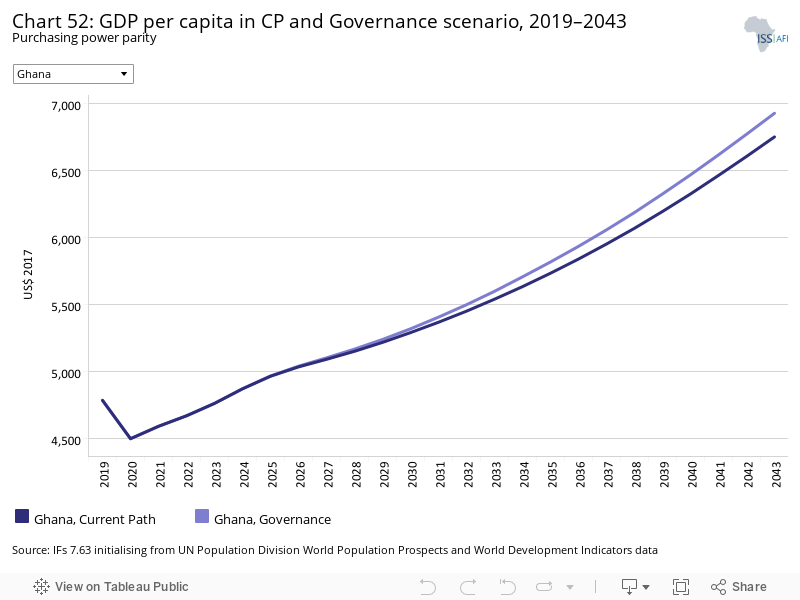
Chart 52 displays GDP per capita in the Current Path forecast and in the Governance scenario. Ghana’s GDP per capita is projected to increase to US$6 928 by 2043 which is US$177 more than the estimates in the Current Path forecast but lower than the average of US$6 928 for lower middle-income countries on the continent in the same year. This suggests that good governance in the form of reducing corruption, improvement in the quality of service delivery and accountability can lead to an additional US$180 in GDP per capita compared to the Current Path forecast by 2043.
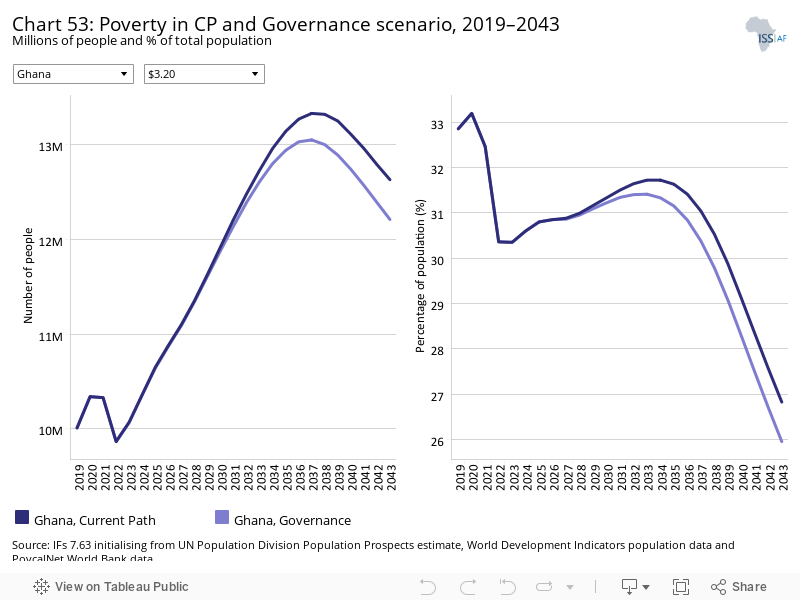
Chart 53 illustrates the number and per cent of poor people in the Current Path forecast and in the Governance scenario. The per cent of people living below the poverty line of US$3.20 is expected to decline to 26.0% by 2043 in the Governance scenario, which corresponds to 12.21 million people lower than the 12.63 million projected in the Current Path forecast. This means that the Governance scenario has 0.42 million fewer poor people than in the Current Path forecast by 2043, and the proportion of poor people projected in the Governance scenario will be 12.4 percentage points lower than the average for lower middle-income African countries.
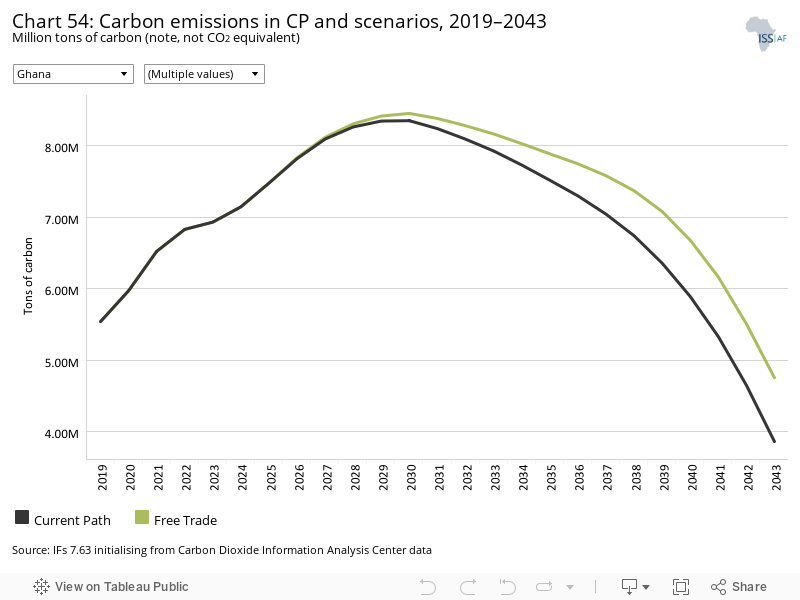
This section presents projections for carbon emissions in the Current Path for [Ghana] and the 11 scenarios. Note that IFs uses carbon equivalents rather than CO2 equivalents.
Chart 54 shows the estimated tons of carbon emission for Ghana in the various scenarios. Ghana’s carbon emissions are projected to decline in all the scenarios although carbon emissions increase in the short-term. The intervention with the greatest reduction on carbon emissions is the Agriculture scenario, which will lead to a decline in Ghana’s carbon emissions by 2.55 million tons of carbon by 2043. This is followed by the Leapfrogging and Demographic scenarios with projected declines in carbon emissions of 2.51 million tons and 1.97 million tons of carbon respectively by 2043. Free Trade and the Manufacturing/Transfer scenarios are the interventions that will lead to the greatest increases in carbon emissions above the Current Path forecast, with projected increases of 0.89 million and 0.5 million tons of carbons respectively by 2043.
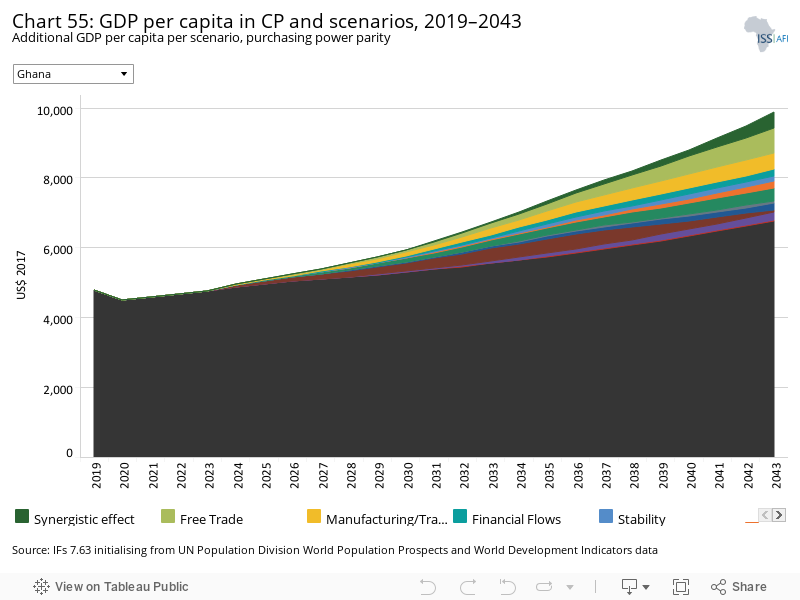
The Combined Agenda 2063 scenario consists of the combination of all 11 sectoral scenarios presented above, namely the Stability, Demographic, Health/WaSH, Agriculture, Education, Manufacturing/Transfers, Leapfrogging, Free Trade, Financial Flows, Infrastructure and Governance scenarios. The cumulative impact of better education, health, infrastructure, etc. means that countries get an additional benefit in the integrated IFs forecasting platform that we refer to as the synergistic effect. Chart 55 presents the contribution of each of these 12 components to GDP per capita in the Combined Agenda 2063 scenario.
Chart 55 displays the synergistic impact of the various scenarios on GDP per capita. The synergistic effect of the Combined Agenda 2063 on GDP per capita is estimated to be about US$458.9 by 2043. The scenario with the greatest impact on GDP per capita by 2043 is the Free Trade scenario followed by the Manufacturing/Transfers scenario, while the scenarios with the least impact on GDP per capita are Agriculture and Governance. This suggests that in the long-run, the trade and manufacturing scenarios have the most potential to improve human and economic development in Ghana.
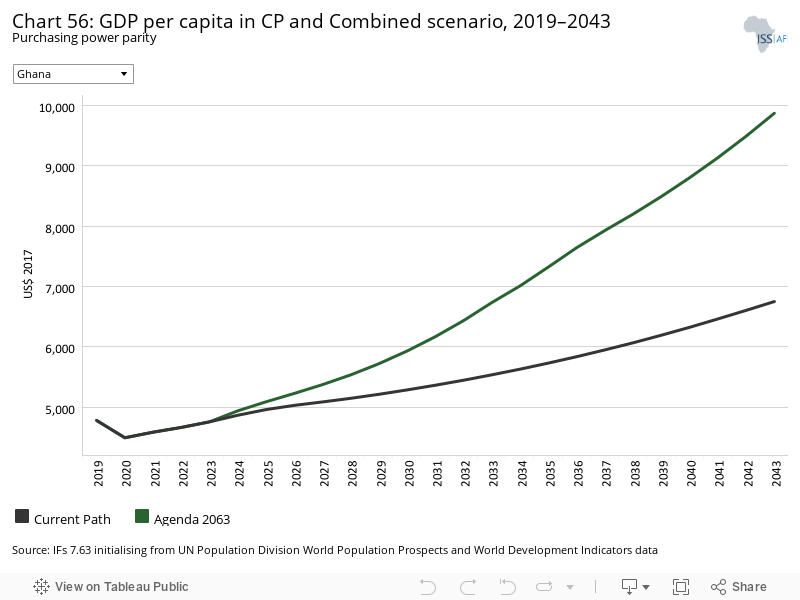
Chart 56 presents a stacked area graph on the contribution of each scenario to GDP per capita as well as the additional benefit or synergistic effect, whereas Chart 56 presents only GDP per capita in the Current Path forecast and the Combined Agenda 2063 scenario.
Chart 56 represents GDP per capita in the Current Path forecast and in the Combined Agenda 2063 scenario. Ghana’s GDP per capita is estimated to increase to US$9 868 by 2043 in the Combined Agenda 2063 scenario. This is US$3 116 more than the projections based on the Current Path forecast, meaning that the Combined Agenda 2063 scenario will lead to an additional US$3 116 in GDP per capita by 2043 compared to the Current Path forecast. Ghana’s GDP per capita in the Combined Agenda 2063 scenario will be US$726 more than the average for lower middle-income countries in Africa by 2063.
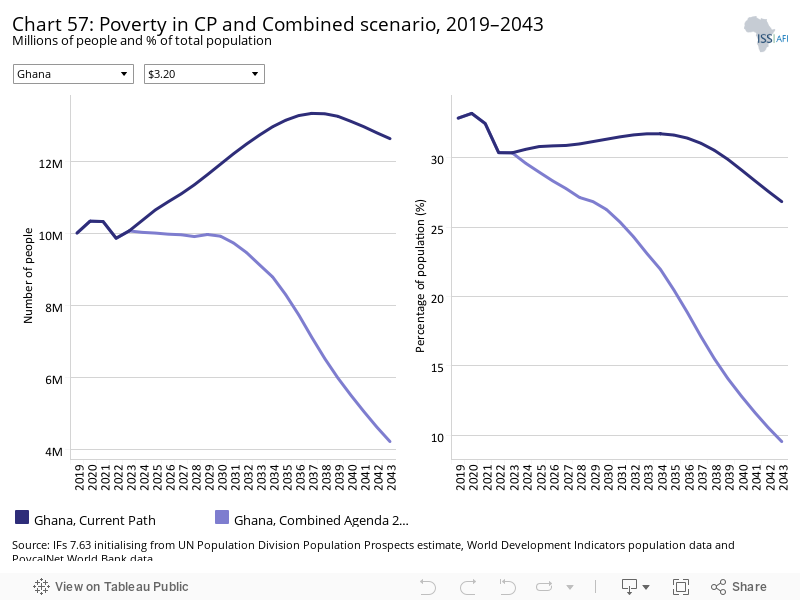
Chart 57 displays the number and portion of people living below the poverty line of US$3.20 per day both in the Current Path forecast and in the Combined Agenda 2063 scenario. In the Combined Agenda 2063 scenario, the number of poor people will significantly decline such that by 2043, only 4.225 million Ghanaians, representing 9.5% of the population, will be below the poverty line. This means that, compared to the Current Path forecast, an additional 8.405 million Ghanaians can be lifted out of extreme poverty in the Combined Agenda 2063 scenario. The proportion of poor people projected in the Combined Agenda 2063 scenario will be 28.8 percentage points lower than the average for lower middle-income African countries.
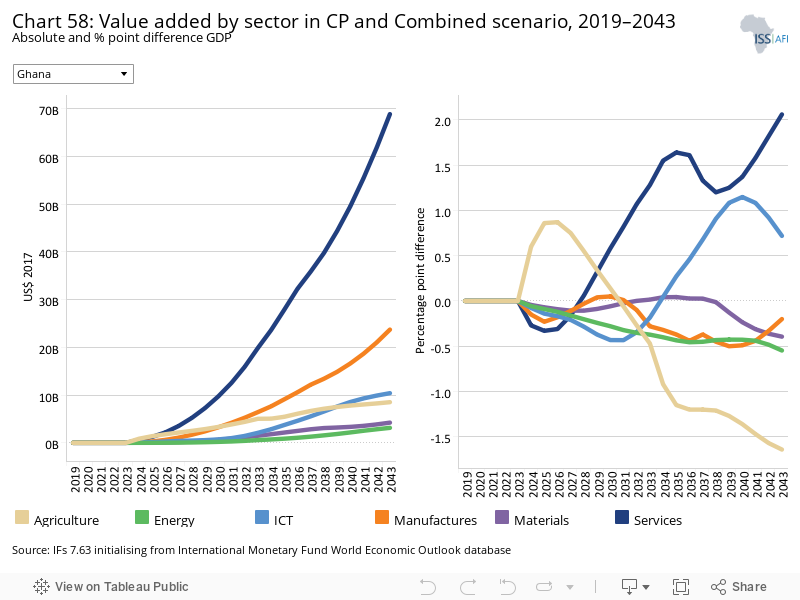
See Chart 8 to view the Current Path forecast of the sectoral composition of the economy.
Chart 58 depicts the percentage-point difference in contributions to GDP and the value differences between the Combined Agenda 2063 scenario and the Current Path forecast. In the Combined Agenda 2063 scenario, the biggest contributors to GDP in the long-run are the service, manufacturing and ICT sectors. By 2043, the service sector will contribute an additional 2 percentage points to GDP, which corresponds to US$68.9 billion. The ICT will contribute an extra 0.7 percentage point, which corresponds to US$11.1 billion, while the manufacturing sector will contribute 0.2 percentage points less, but contributes US$23.8billion more in absolute terms. The contribution of the agriculture sector to GDP will decline as a result of the structural transformation of the economy.
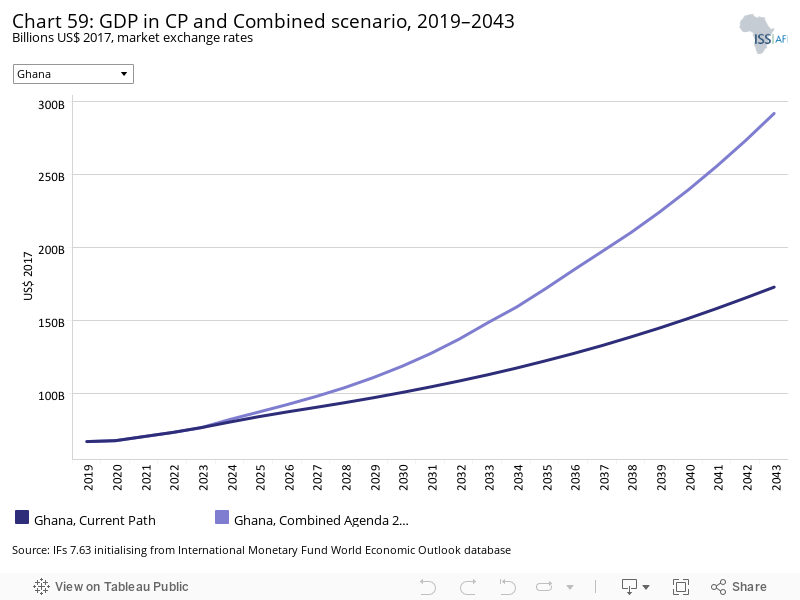
Chart 59 illustrates the projected size of the economy in the Current Path forecast and in the Combined Agenda 2063 scenario. The estimated GDP (MER) for 2043 in the Combined Agenda 2063 scenario by 2043 will be US$291.8 billion, which is higher than the Current Path forecast estimates of US$172.77 billion. This suggests that compared to the Current Path forecast, the size of the economy will increase by US$119 billion or 68.9% in the Combined Agenda 2063 scenario.
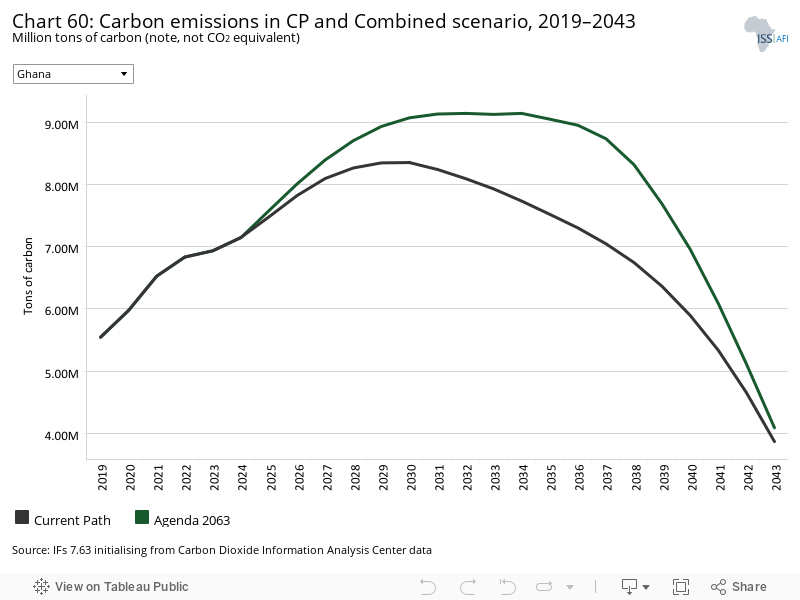
Chart 60 shows tons of carbon emission in the Current Path forecast and the Combined Agenda 2063 scenario. The total amount of carbon emitted in 2019 was 5.54 million tons. In the Combined Agenda 2063 scenario, the total tons of carbon emitted will initially rise to peak at 9.14 million tons in 2034 and then begin to decline, so that by 2043 the total tons of carbon emitted will be 4.1 million. This is higher than the estimate of 3.9 million by 2043 in the Current Path forecast, meaning that the Combined Agenda 2063 scenario leads to much greater carbon emission compared to the Current Path forecast. The expected increase in carbon emission in the Combined Agenda 2063 scenario can partly be attributed to the projected economic growth over the forecast period, particularly in the manufacturing sector.
Page information
Contact at AFI team is Enoch Randy Aikins
This entry was last updated on 30 June 2024 using IFs v7.63.
Donors and sponsors


Reuse our work
- All visualizations, data, and text produced by African Futures are completely open access under the Creative Commons BY license. You have the permission to use, distribute, and reproduce these in any medium, provided the source and authors are credited.
- The data produced by third parties and made available by African Futures is subject to the license terms from the original third-party authors. We will always indicate the original source of the data in our documentation, so you should always check the license of any such third-party data before use and redistribution.
- All of our charts can be embedded in any site.
Cite this research
Enoch Randy Aikins (2024) Ghana. Published online at futures.issafrica.org. Retrieved from https://futures.issafrica.org/geographic/countries/ghana/ [Online Resource] Updated 30 June 2024.